Article

Classification of Droplets of Water-PVP Solutions with Different Viscosity Values Using Artificial Neural Networks

by
Mohamed Azouz Mrad
1,*,
Kristof Csorba
1,
Dorián László Galata
2 and
Zsombor Kristóf Nagy
2
1
Department of Automation and Applied Informatics, Faculty of Electrical Engineering and Informatics, Budapest University of Technology and Economics, Magyar Tudósok krt. 2/Q, 1117 Budapest, Hungary
2
Department of Organic Chemistry and Technology, Faculty of Chemical Technology and Biotechnology, Budapest University of Technology and Economics, Budafoki út 8., F. II., 1111 Budapest, Hungary
*
Author to whom correspondence should be addressed.
Processes 2022, 10(9), 1780; https://doi.org/10.3390/pr10091780
Submission received: 21 July 2022 / Revised: 21 August 2022 / Accepted: 29 August 2022 / Published: 5 September 2022

Abstract

:
When a liquid flows, it has an internal resistance to flow. Viscosity is the property that measures this resistance, which is a fundamental characteristic parameter of liquids. The monitoring of viscosity is essential for quality control in many industrial areas, such as the pharmaceutical, chemical, and energy-related industries. Several instruments measure the viscosity of a liquid, the most used being the capillary viscometers. These instruments are complex, associated with high cost and expensive prices. This represents a challenge in several industries, where accurate viscosity knowledge is essential in designing various industrial equipment and processes. Using image processing and machine learning algorithms is a promising alternative to the current measurement methods. This work aims to extract characteristic information from videos of droplets of different samples using image processing algorithms. An Artificial Neural Network model utilizes the extracted characteristics to classify the droplets in the correct category, which is correlated with the viscosity of the sample. Different solutions samples were created using different ratios of Water and PVP (Polyvinylpyrrolidone) and videos of their droplets were taken and processed. It was found that for water-PVP solutions, the proposed ANN model was able to successfully classify the droplets using the data extracted from the videos with high accuracy. The results imply that the ANN model can recognize the features that affect the viscosity values.

1. Introduction

When a liquid flows, viscosity is the measure of its internal resistance to flow or shear. Viscosity is a fundamental characteristic parameter of liquids, the monitoring of which is essential for quality control in many industrial areas, such as the pharmaceutical, chemical, and energy-related industries [1]. In the pharmaceutical industry, viscosity significantly impacts the ocular drug absorption and dissolution of Indomethacin [2] and nanoparticles’ particle size, drug content, and dissolution profile [3]. Accurate viscosity knowledge is also essential in designing various industrial equipment and chemical processes involving molten salts [4] and in enhanced oil recovery techniques to improve recovery [5].
The measurement of liquids’ viscosity is crucial in the industry. Several instruments can be used to measure it, such as capillary viscometers, orifice viscometers, rotational viscometers, and vibrational and ultrasonic viscometers. The capillary viscometer is the most used because of its low cost and simplicity. The capillary method measures the time for a finite volume of liquid to flow through a narrow bore tube under a given pressure [6]. However, these are invasive methods, with high cost and expensive prices, making them not suitable for measuring the viscosity in a continuous manner that allows in-process monitoring and interventions in case of an error, and a need for a cost-effective and time-effective method is essential. A method that seems convenient for measuring viscosity is the estimation of it using machine learning and image processing algorithms based on the droplet characteristics of the liquid. Many researchers have tried to find correlations between liquid viscosity and liquid droplets. A correlation between extensional viscosity and spray droplet sizes of polymer spray solutions was found by H. Zhu et al., shown in their paper [7]. Gotaas et al. studied the effect of the viscosity on droplet-droplet collision outcomes [8]. Wang et al. showed that the droplet diameter in vertical gas-liquid annular flows increases logarithmically with increasing liquid viscosity, first rapidly and then slowly [9]. Some researchers also focused on applying image processing techniques for measuring liquid viscosity. Kheloufi et al. measured the fall height of the ball in falling ball viscometers by taking video scenes of the ball during its fall and using it to compute viscosity [10]. Santhosh et al. showed that the viscosity could be accurately estimated by using a camera to capture the refracted images of a laser by a tube containing liquid. The images were then processed using thresholding, filtering, and histogram, and an artificial neural network model was used to establish the relationship between these resulted data and the viscosity [11].
Artificial neural networks (ANNs) are very suitable for complex and highly nonlinear problems and have been used widely because of their advantages, such as their high accuracy and time and cost-effectiveness. ANNs were used to estimate the dynamic viscosity of a hybrid nano-lubricant [12], the prediction of Nigerian crude oil viscosity using 32 datasets that include the reservoir temperature, oil and gas gravity, and the solution gas-oil ratio [13]. Esfe et al. showed that an artificial neural network model was able to predict the dynamic viscosity of ferromagnetic nanofluid with high accuracy [14]. Using image processing techniques to extract information from videos of droplets of liquids with different viscosities might provide valuable information about the liquids and, therefore, their viscosities. Using the droplets characteristics extracted from the videos as features to train an Artificial Neural Network model can provide a promising alternative method to monitor the viscosity of liquids continuously.
For this paper, we created different samples of water-PVP (Polyvinylpyrrolidone), varying the water ratio in each sample to achieve samples with different viscosity values. Videos were then taken using a monochrome camera of the droplets dropping from a syringe pump. Our goal was to extract features from the videos of the droplets. An internally developed image processing application was adjusted and used. Many features describing the droplets over time were extracted and studied, and the resulting data was processed. The extracted features were then used as an input for an Artificial Neural Network model in order to classify the droplets into the correct solution sample, which is correlated with the viscosity value of the solution.

2. Materials and Methods

2.1. Materials

Povidone (PVPK30) was supplied by BASF (Ludwigshafen, Germany). A PVP solution was prepared by adding 37.5 g of PVP to 100 mL of water. Distilled water was used, characterized by a resistance of 20 μS/cm

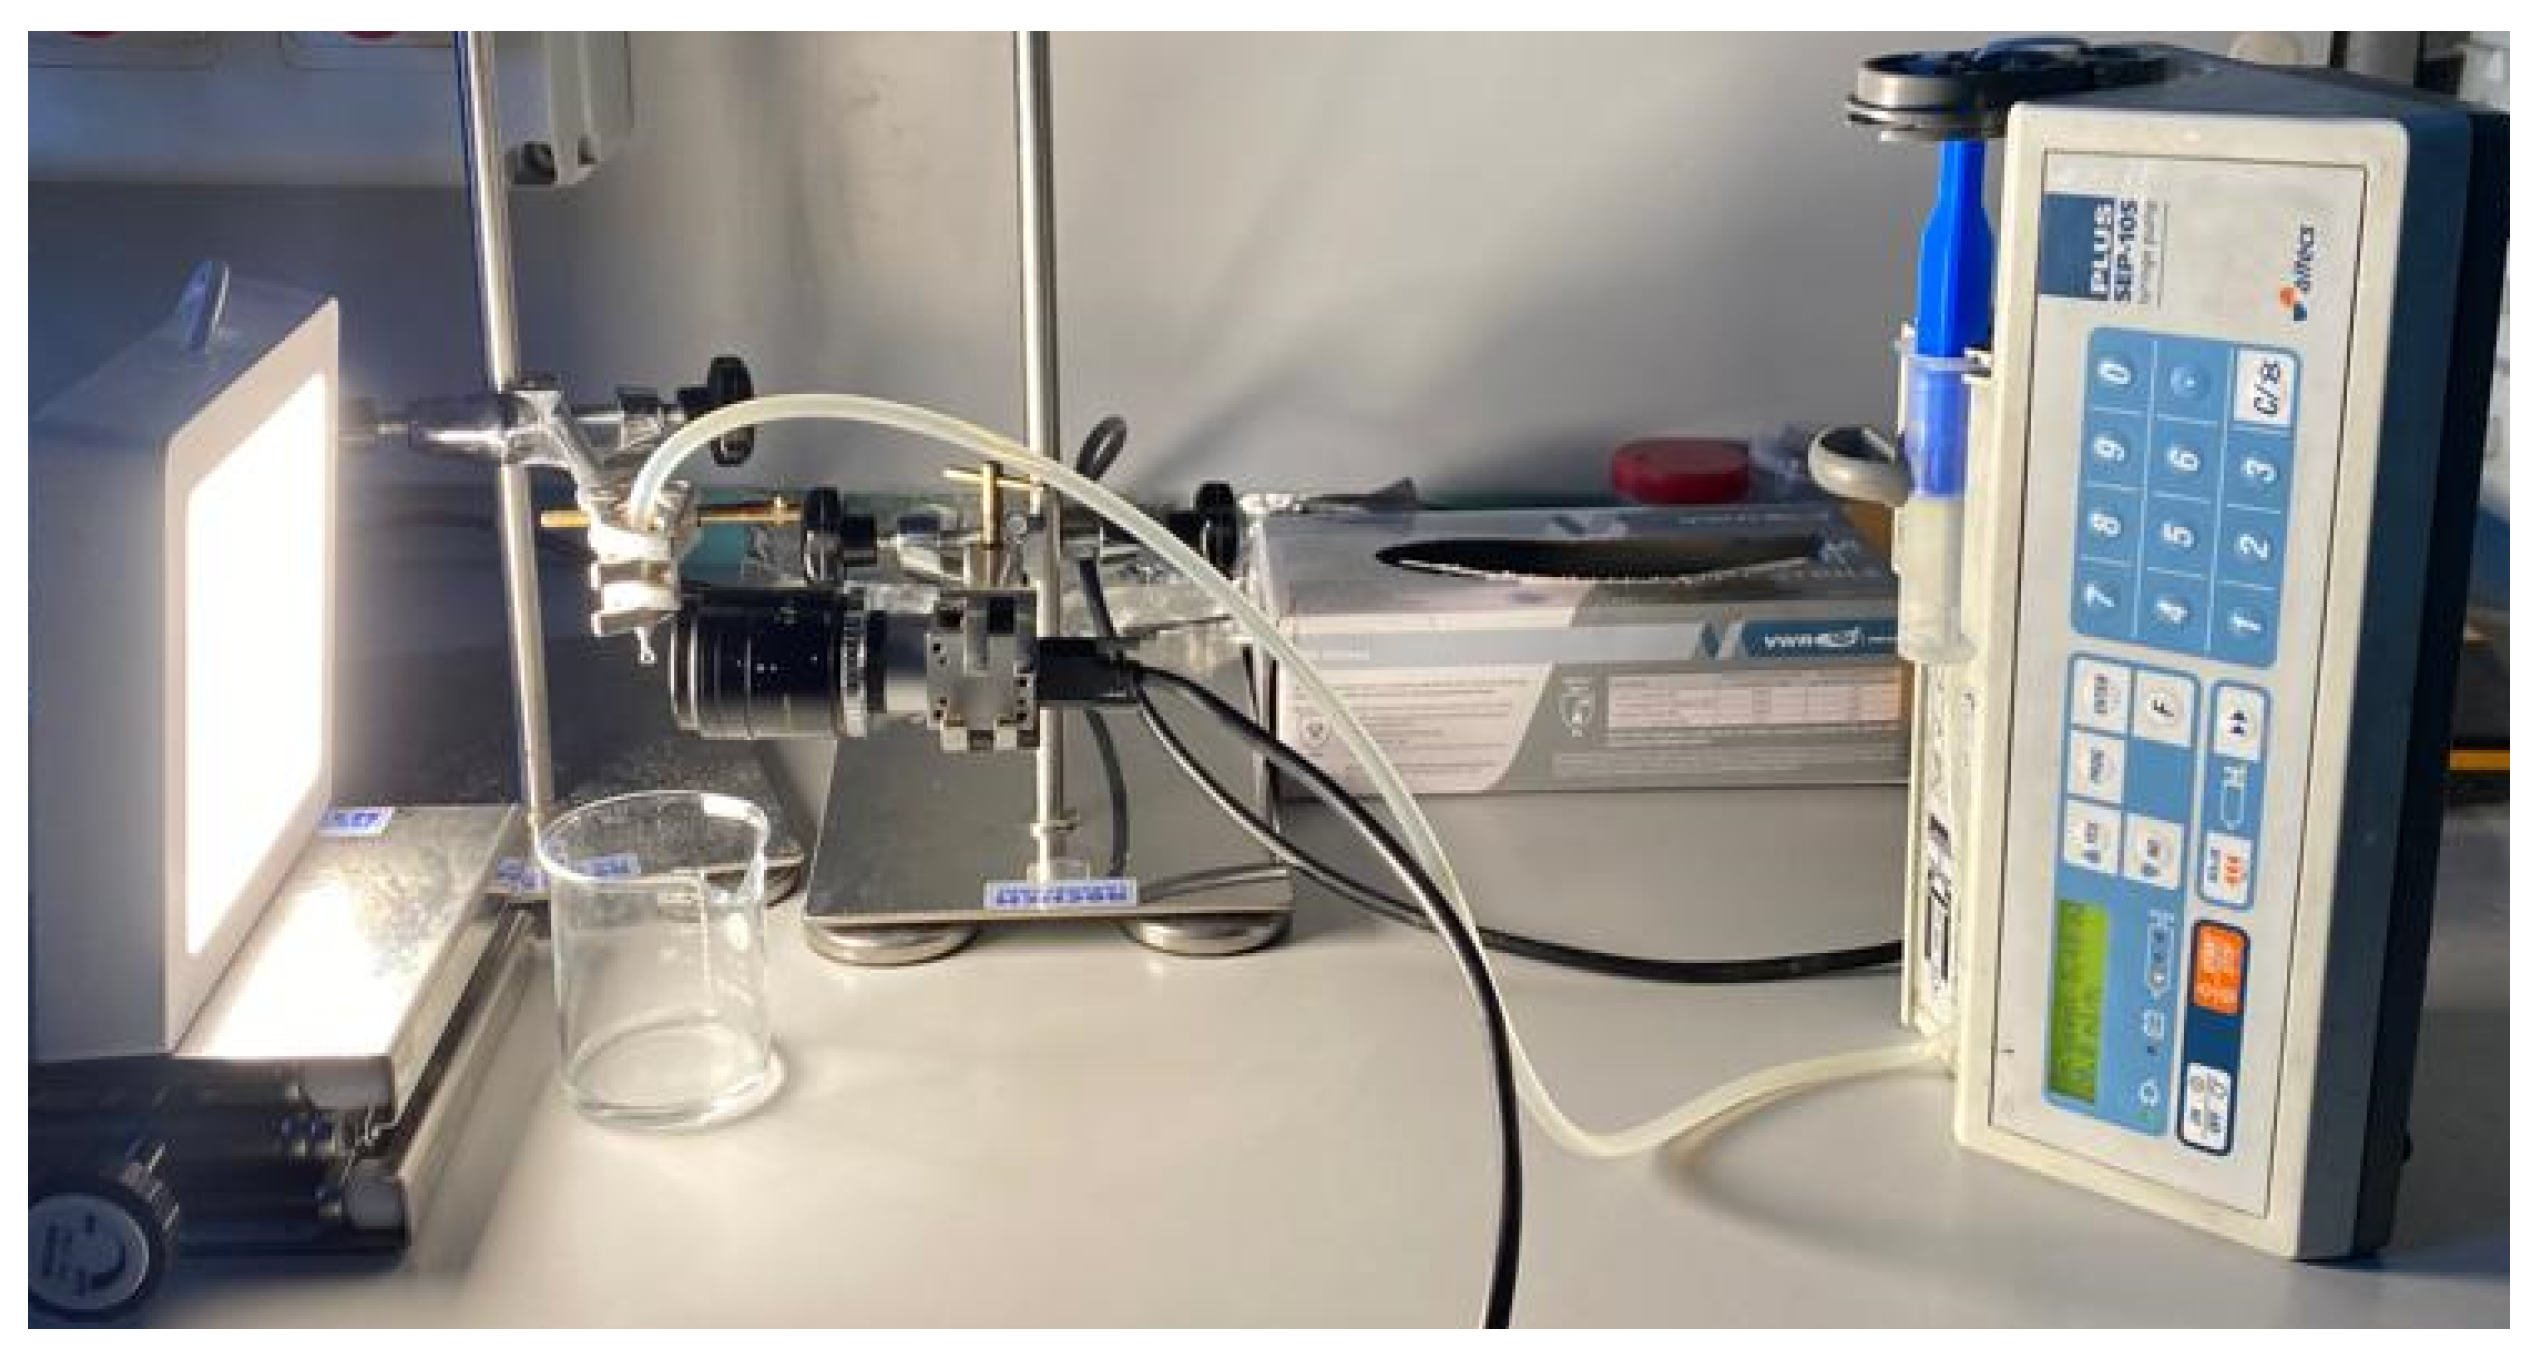
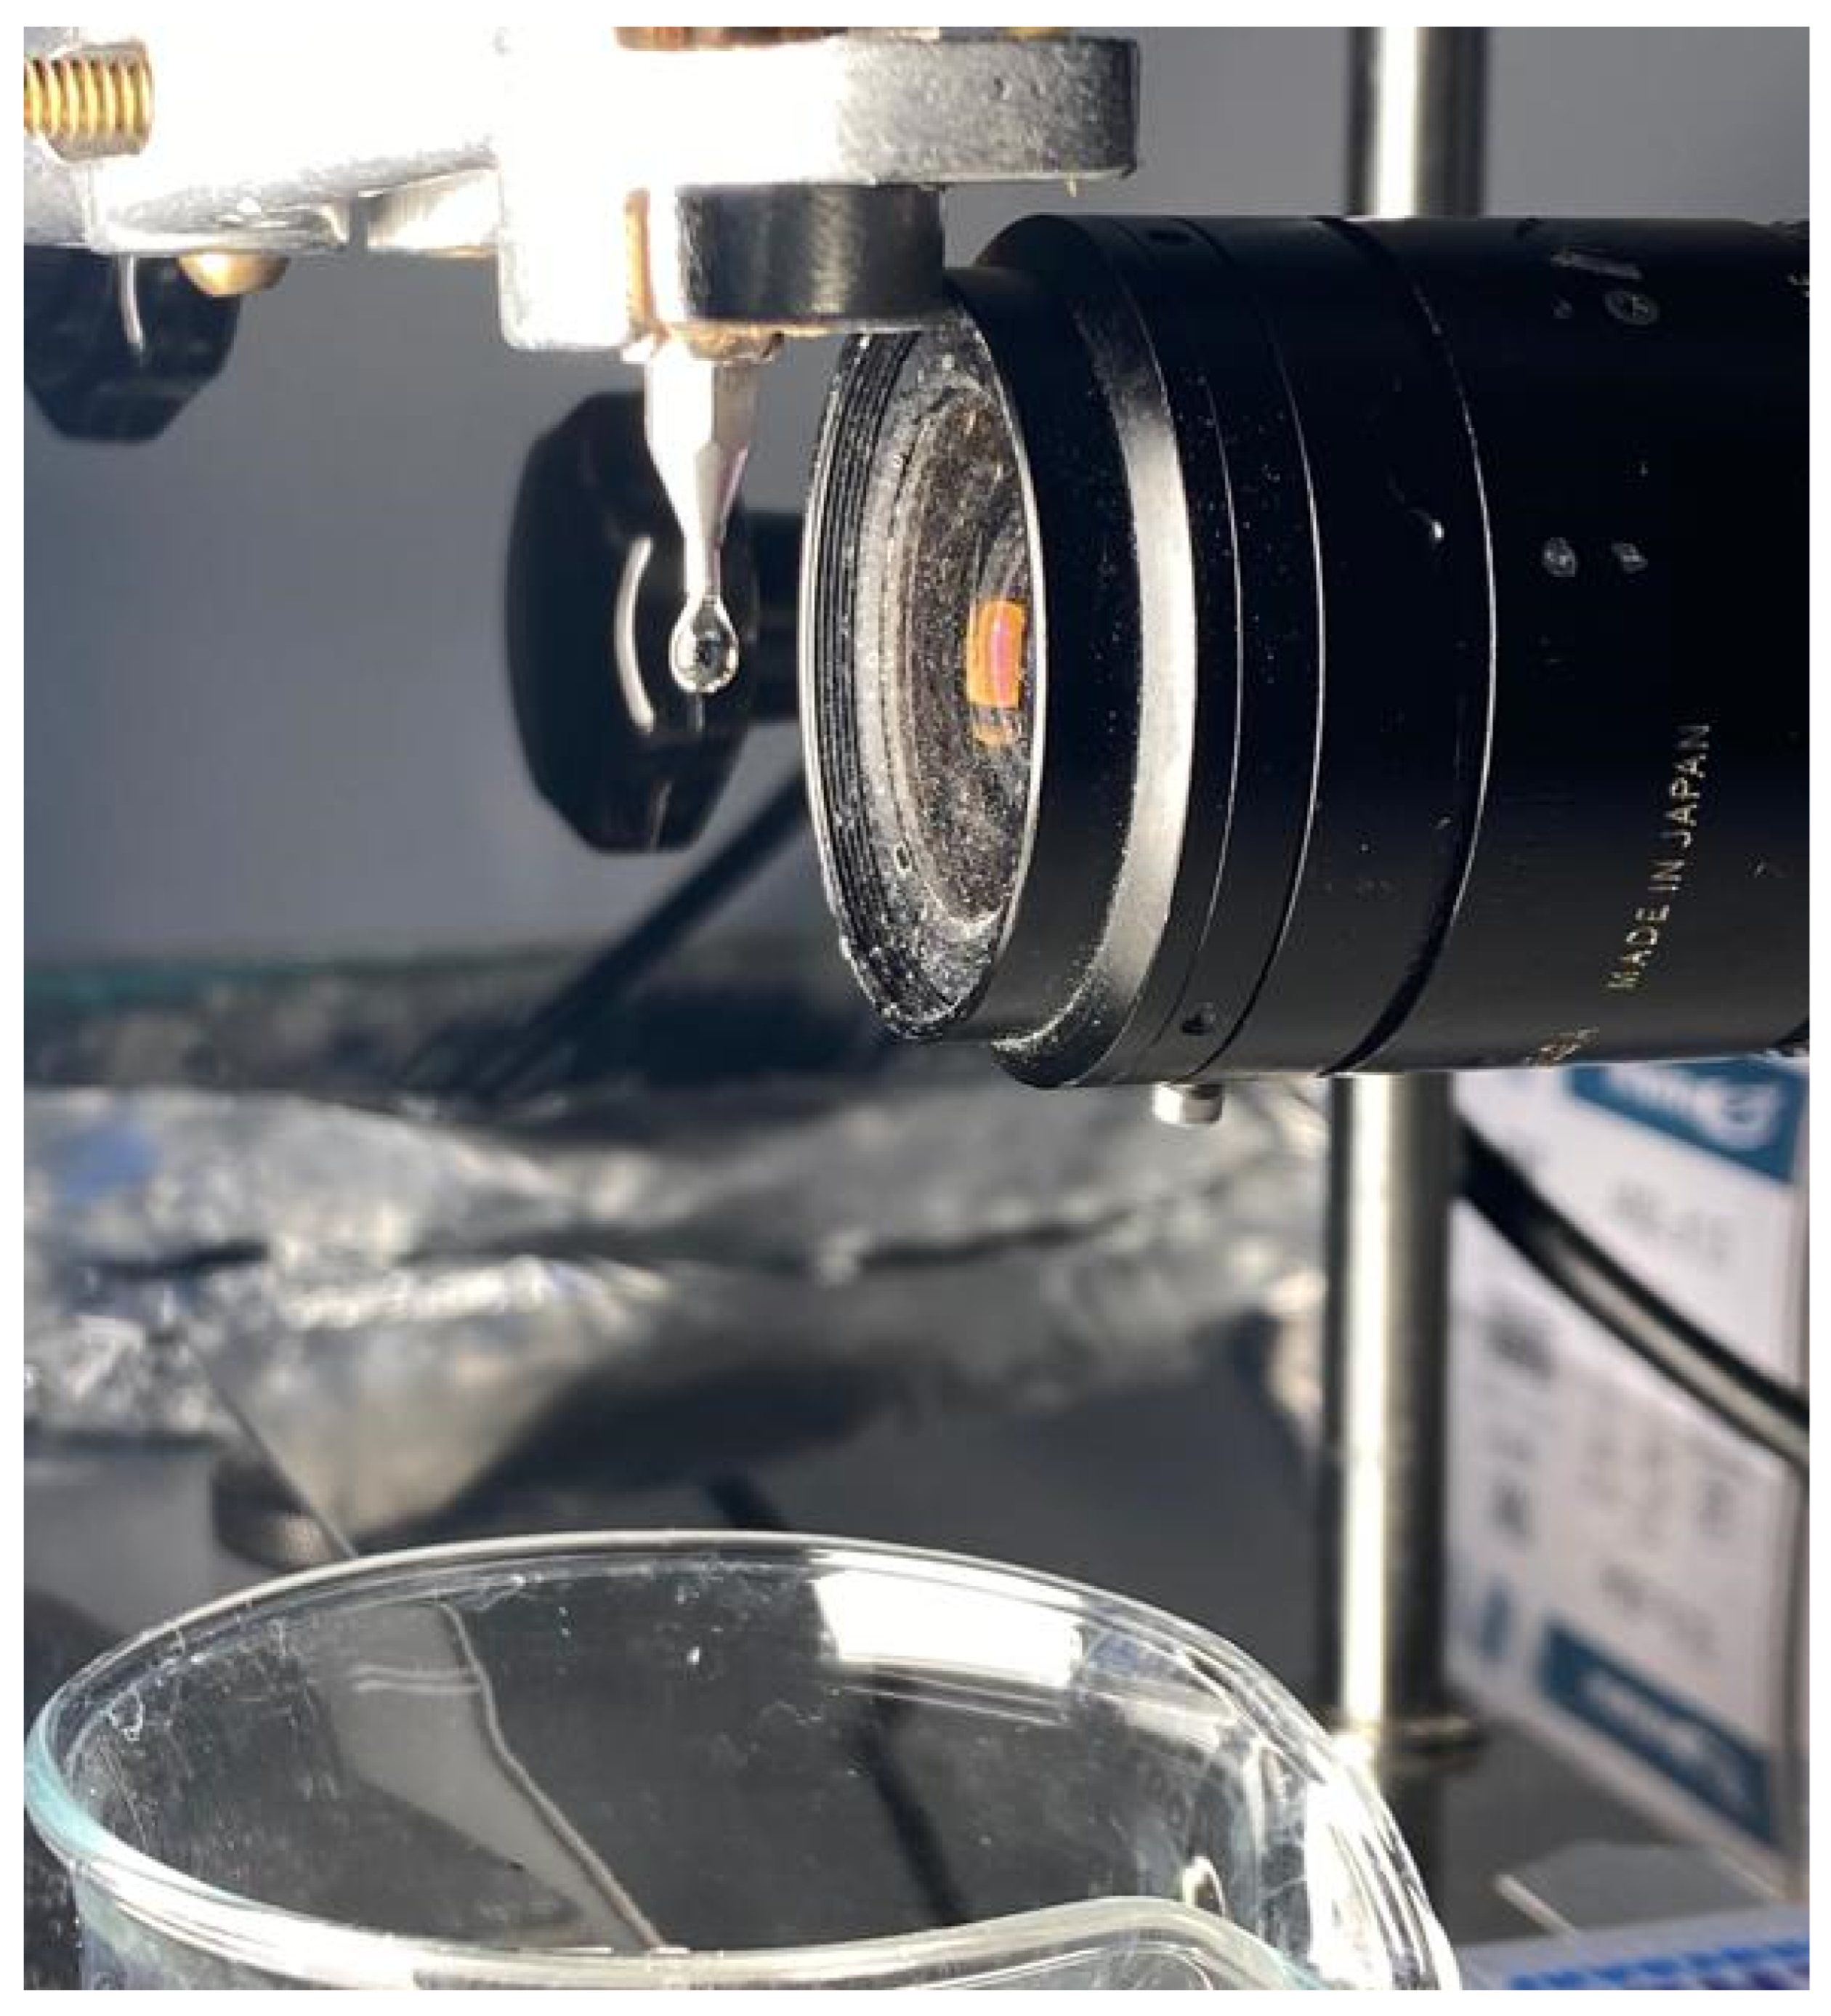
2.2. Measurement Setup

In order to perform the experiment, we used 1-channel syringe pump SEP-10S PLUS, one transparent rubber tube, laboratory dropper, Basler acA720-520um USB 3.0 monochrome camera, Pylon Viewer software, PharmaVision Videometry software, LED white light panel, one lab beaker, and eight different laboratory bottles of 500 mL. The materials and the softwares were provided to us by the Department of Organic Chemistry and Technology at Budapest University of technology and Economics, Faculty of Chemical Technology and Biotechnology.

2.3. Methods

2.3.1. Experimental Design

Eight liquid samples were prepared for the experiment using the PVP solution and water, with the latter being varied each time to obtain solutions with different viscosity values, as shown in Table 1. The experiment consists of taking videos of the droplets from these different samples in their formation process.
During the experiment, the liquid sample was dispensed at a rate of 20 mL per hour by the automatic syringe pump through the transparent rubber tube to a pipette dropper held by a stand in a fixed perpendicular position to the horizontal plane. A lab beaker was positioned just under the pipette dropper to collect the dropped droplets. A monochrome high-quality recording camera was held fixed using another stand near the dropper. Behind the dropper, an LED panel with strong white illumination was positioned to create a transparent, uniform background and reduce the noise in image processing. The camera took videos of the droplet formation process from the moment it showed in the dropper until it dropped into the lab beaker. The videos were monitored using PharmaVision Videometry, an internally developed software. The recorded videos were in black and white, with a width of 720 pixels and a height of 540 pixels at 150 frames per second. The resulting videos were detailed and included the most critical steps of the droplet formation process. The experiment can be seen during setup and test in Figure 1 and Figure 2. The same experiment was repeated for each of the eight samples. It is crucial to keep a few parameters unchanged during the different experiments. The position of the dropper and the camera, and the infusion rate should remain fixed. The syringe must be washed, and the rubber tube must be emptied from any previous liquid to eliminate any residue that can affect the following measurements. This ensures that the results from the image processing are comparable. Therefore any change to the droplets’ characteristics is due exclusively to the viscosity change without any external effect. A total of eight videos were recorded, with each video having a length of 20 min.

2.3.2. Viscosity Measurement

Viscosity of the different samples was measured using Anton Paar DMA 4500 M viscometer. The values were recorded as shown in Table 2. We measured the rolling time of a steel ball of 1.5 mm diameter through the samples in the capillary tube. The temperature during the measurement was 25.00 °C, and the angle of the capillary was −45°.

2.3.3. Image Processing

Image processing aims to help the computer understand the content of an image by processing an input such as a photograph or video frame and providing an output that can be a new image or a set of characteristics of the processed image. In this paper, we used OpenCV, an open-source library of functions that contains a variety of image processing functions, such as image filtering and transformation, object tracking, and feature detection [15]. The Canny algorithm for edges detection was used to detect the droplet edges on the videos [16]. Several characteristics of the droplets were extracted during the image processing:
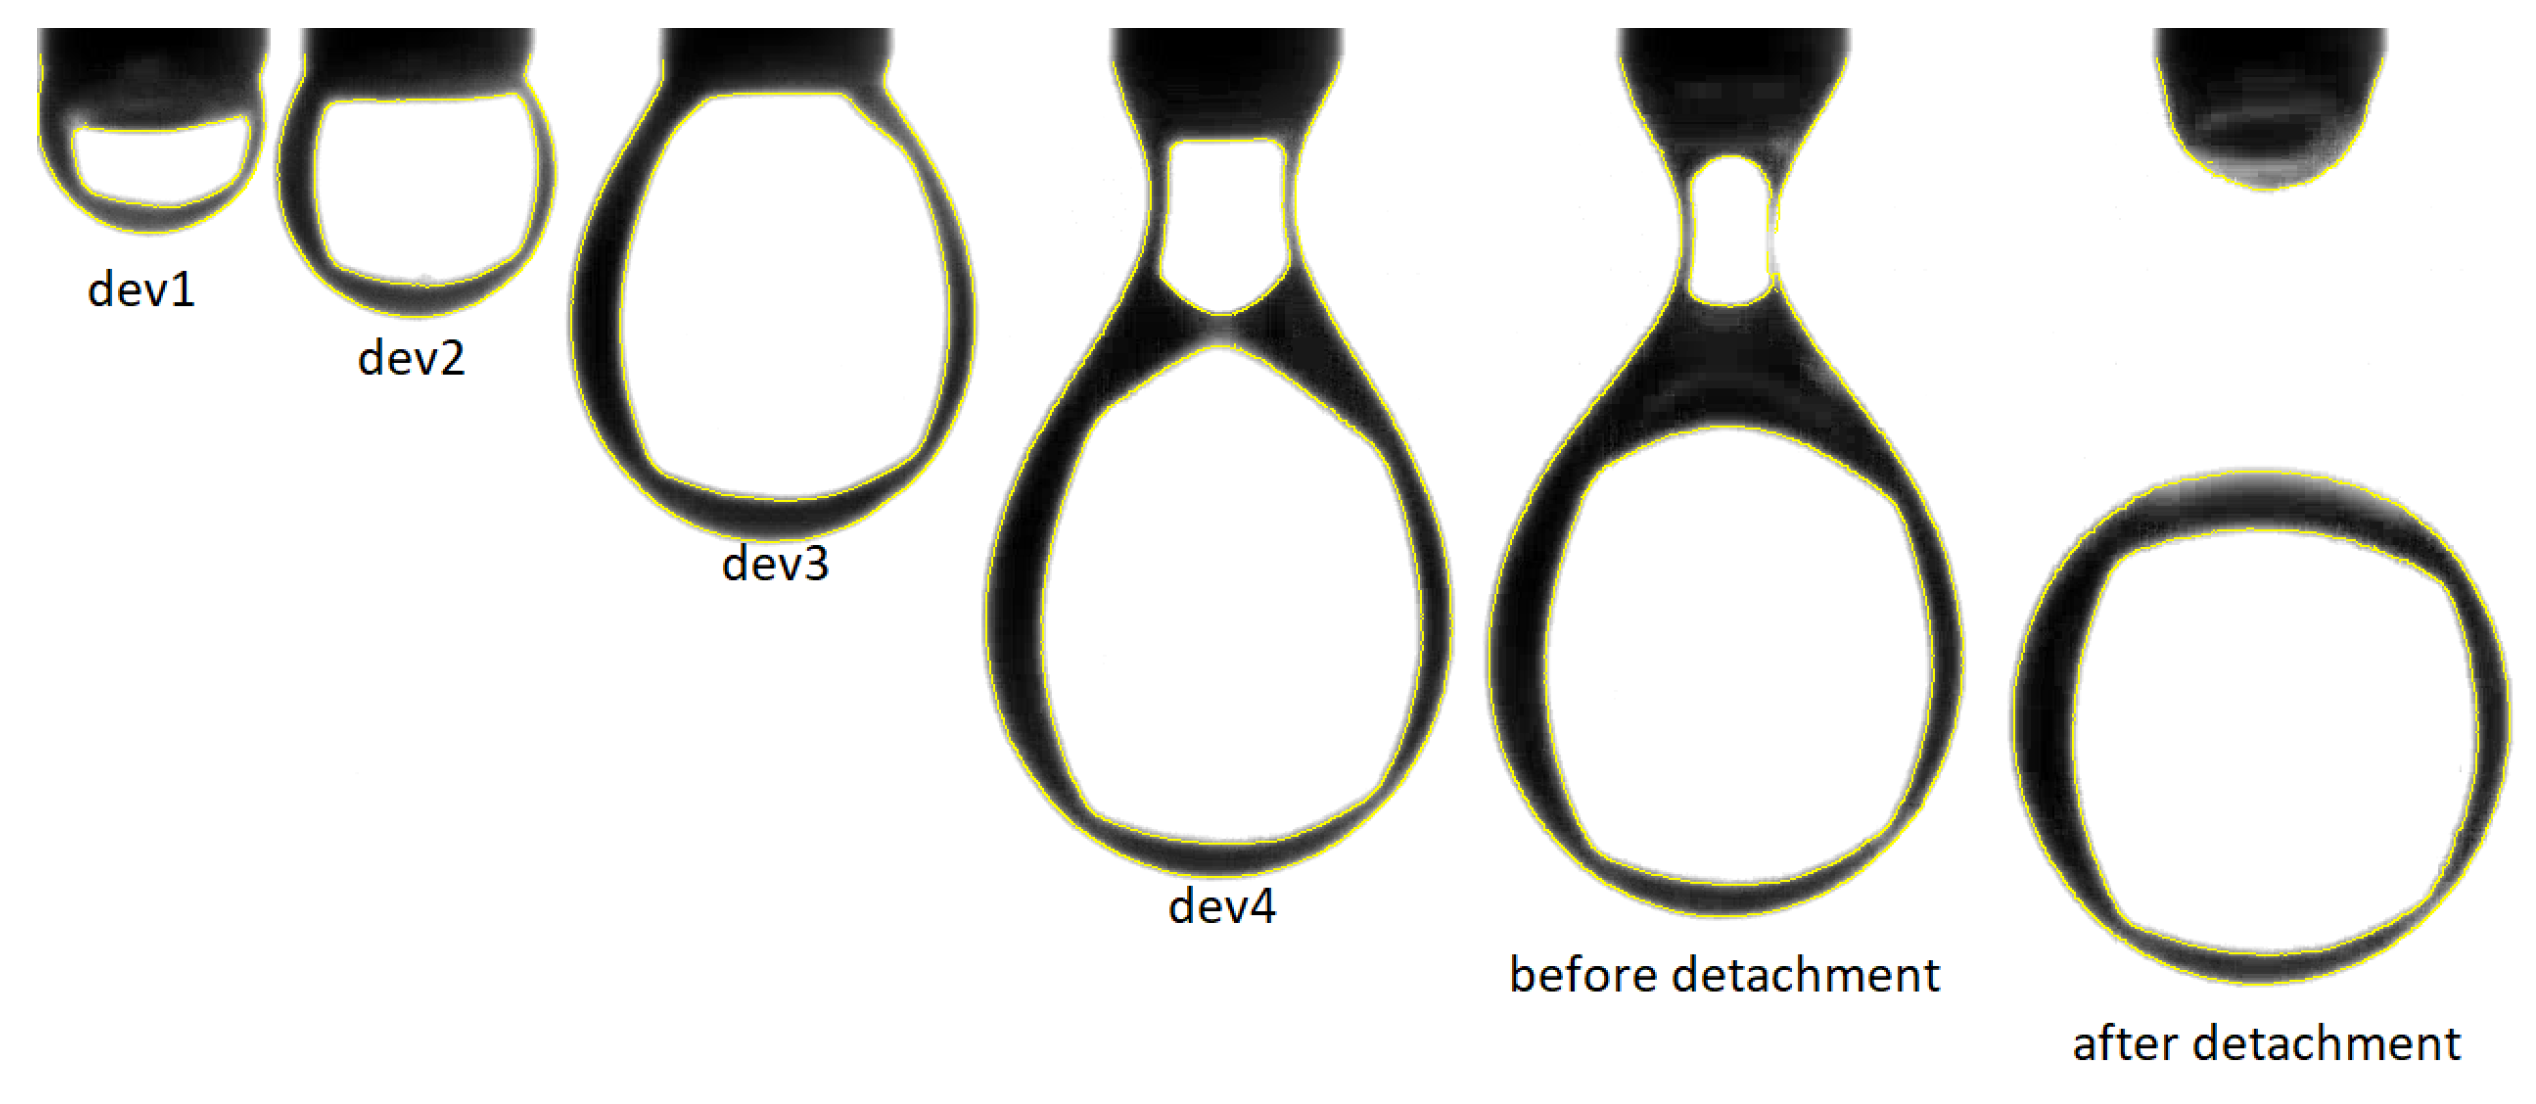
  • State of the droplet: The droplets can be seen in three different states on the videos recorded as shown in Figure 3. Developing state, from the appearance of the droplet until it is completely formed. Before the Detachment state, the droplet is completely formed and in the frame before it detaches from the dropper. After the detachment state, the droplet is not attached to the dropper and falls until it disappears from the video.
  • Time per droplet: The time it takes for the droplet to finish the three different states in seconds.
  • Area of the droplet: The area of the droplet at each frame was extracted in pixels.
  • Perimeter of the droplet: The perimeter of the droplet at each frame was extracted in pixels.
  • Diameter of the droplet: The diameter of the droplet at each frame was extracted in pixels.
  • Length of the droplet: The length of the droplet at each frame was extracted in pixels.
  • Length/Width ratio: The Length/Width ratio was calculated as independent to the camera distance from the droplet.
  • Y max coordinate: Before detachment, this feature reflects the maximum length the droplet reached.
  • X and Y coordinates of Center of mass: Center of mass coordinates of the droplet in pixels.
  • Deltoid Fitting: A deltoid was fitted inside the droplet in a way that its vertices are the lowest and highest point of the droplet and the two sides of the widest part of the droplet.

2.3.4. Data Analysis

The data collected during the image processing was extracted in eight different excel files. Excel and matplotlib were used to visualize and analyze the data to detect and fix missed and wrong values: the first droplet from each file behaved differently from the other droplets. This is clearly due to the time in which the recording started. The first droplet was removed from all the files to eliminate the noise. Another issue was that some of the droplets did not match the normal chronological states: developing, before detachment, after detachment. The rows that are related to such droplets were deleted. The remaining clean data are represented in Table 3.
All the rows from the different files with a droplet state "Before detachment" have been concatenated to form a new matrix D m n , where m = 14 (characteristics of the droplets) and n is the sum of the "Before detachment" rows n = 181 + 233 + 182 + 269 + 283 + 200 + 184 + 295 = 1827 . Matrix D m n has been standardized using the scikit-learn preprocessing method: StandardScaler. StandardScaler fits the data by computing the mean and standard deviation and then centers the data following the equation:
S t d r ( N S ) = ( N S u ) / s
where N S is the non-standardized data, u is the mean of the data to be standardized, and s is the standard deviation [17]. Principal Component Analysis (PCA) was then applied to the standardized matrix D m n to further investigate the data and check if reducing it can be helpful while maintaining the most important information in the data. Taking D m n as an example, PCA work by constructing a symmetric m*m dimensional covariance matrix Σ that stores the pairwise covariances between the different features is calculated as follow:
σ j , k = 1 n i = 1 n ( x j ( i ) μ j ) ( x k ( i ) μ k )
With μ j and μ k , the sample means of features are j and k. The eigenvectors of Σ represent the principal components, while the corresponding eigenvalues define their magnitude. The eigenvalues were sorted by decreasing magnitude to find the eigenpairs that contain most of the variances. Variance explained ratios represent the variances explained by every principal component (eigenvector); it is the fraction of an eigenvalue λ j and the sum of all the eigenvalues. The plot in Figure 4 shows the variance explained ratios and the cumulative sum of explained variances. The plot indicates that the first principal component alone explains 35.82% of the variance in matrix D. Two principal components explain 61.26%. The first five components combined have a cumulative variance of 89.67%. A total of 99.99% of the variance can be explained using 12 principal components. These components are used to create a projection matrix W, which we can use to map D to a lower dimensional PCA subspace D consisting of less features if needed:
D = [ d 1 , d 2 , d 3 , d m ] , d R m D = D W , W R m * v
D = [ d 1 , d 2 , d 3 , d m ] , d R m

2.3.5. Artificial Neural Network

Our goal was to classify the droplets from matrix D into the correct categories where they belong between the eight different files based on the features extracted. An Artificial Neural Network (ANN) model was created for this purpose. The model was created using the Python open-source library Keras, a compact, high-level library for deep learning that can run on top of TensorFlow [18]. The models used the rectified linear unit activation function ReLU on the hidden layers and the softmax activation function on the output layer. The weights on the models were optimized using the Adam optimizer. Since the prediction target is the eight different categories of samples with different viscosities, One-Hot Encoding was used to represent the target categories, as shown in Table 4. CategoricalCrossentropy was the loss function Categorical Crossentropy, which computed the crossentropy loss between the labels and predictions. The number of layers and the number of neurons were optimized based on the prediction accuracy. Regularization term has been varied in order to avoid overfitting. The dataset size was 1827, from which 1018 samples were used for the training (55%), 441 samples were used for validation (25%), and 368 samples were kept for testing (20%). The data used for the training, validating, and testing the model was uniformly selected from the different samples.

3. Results and Discussion

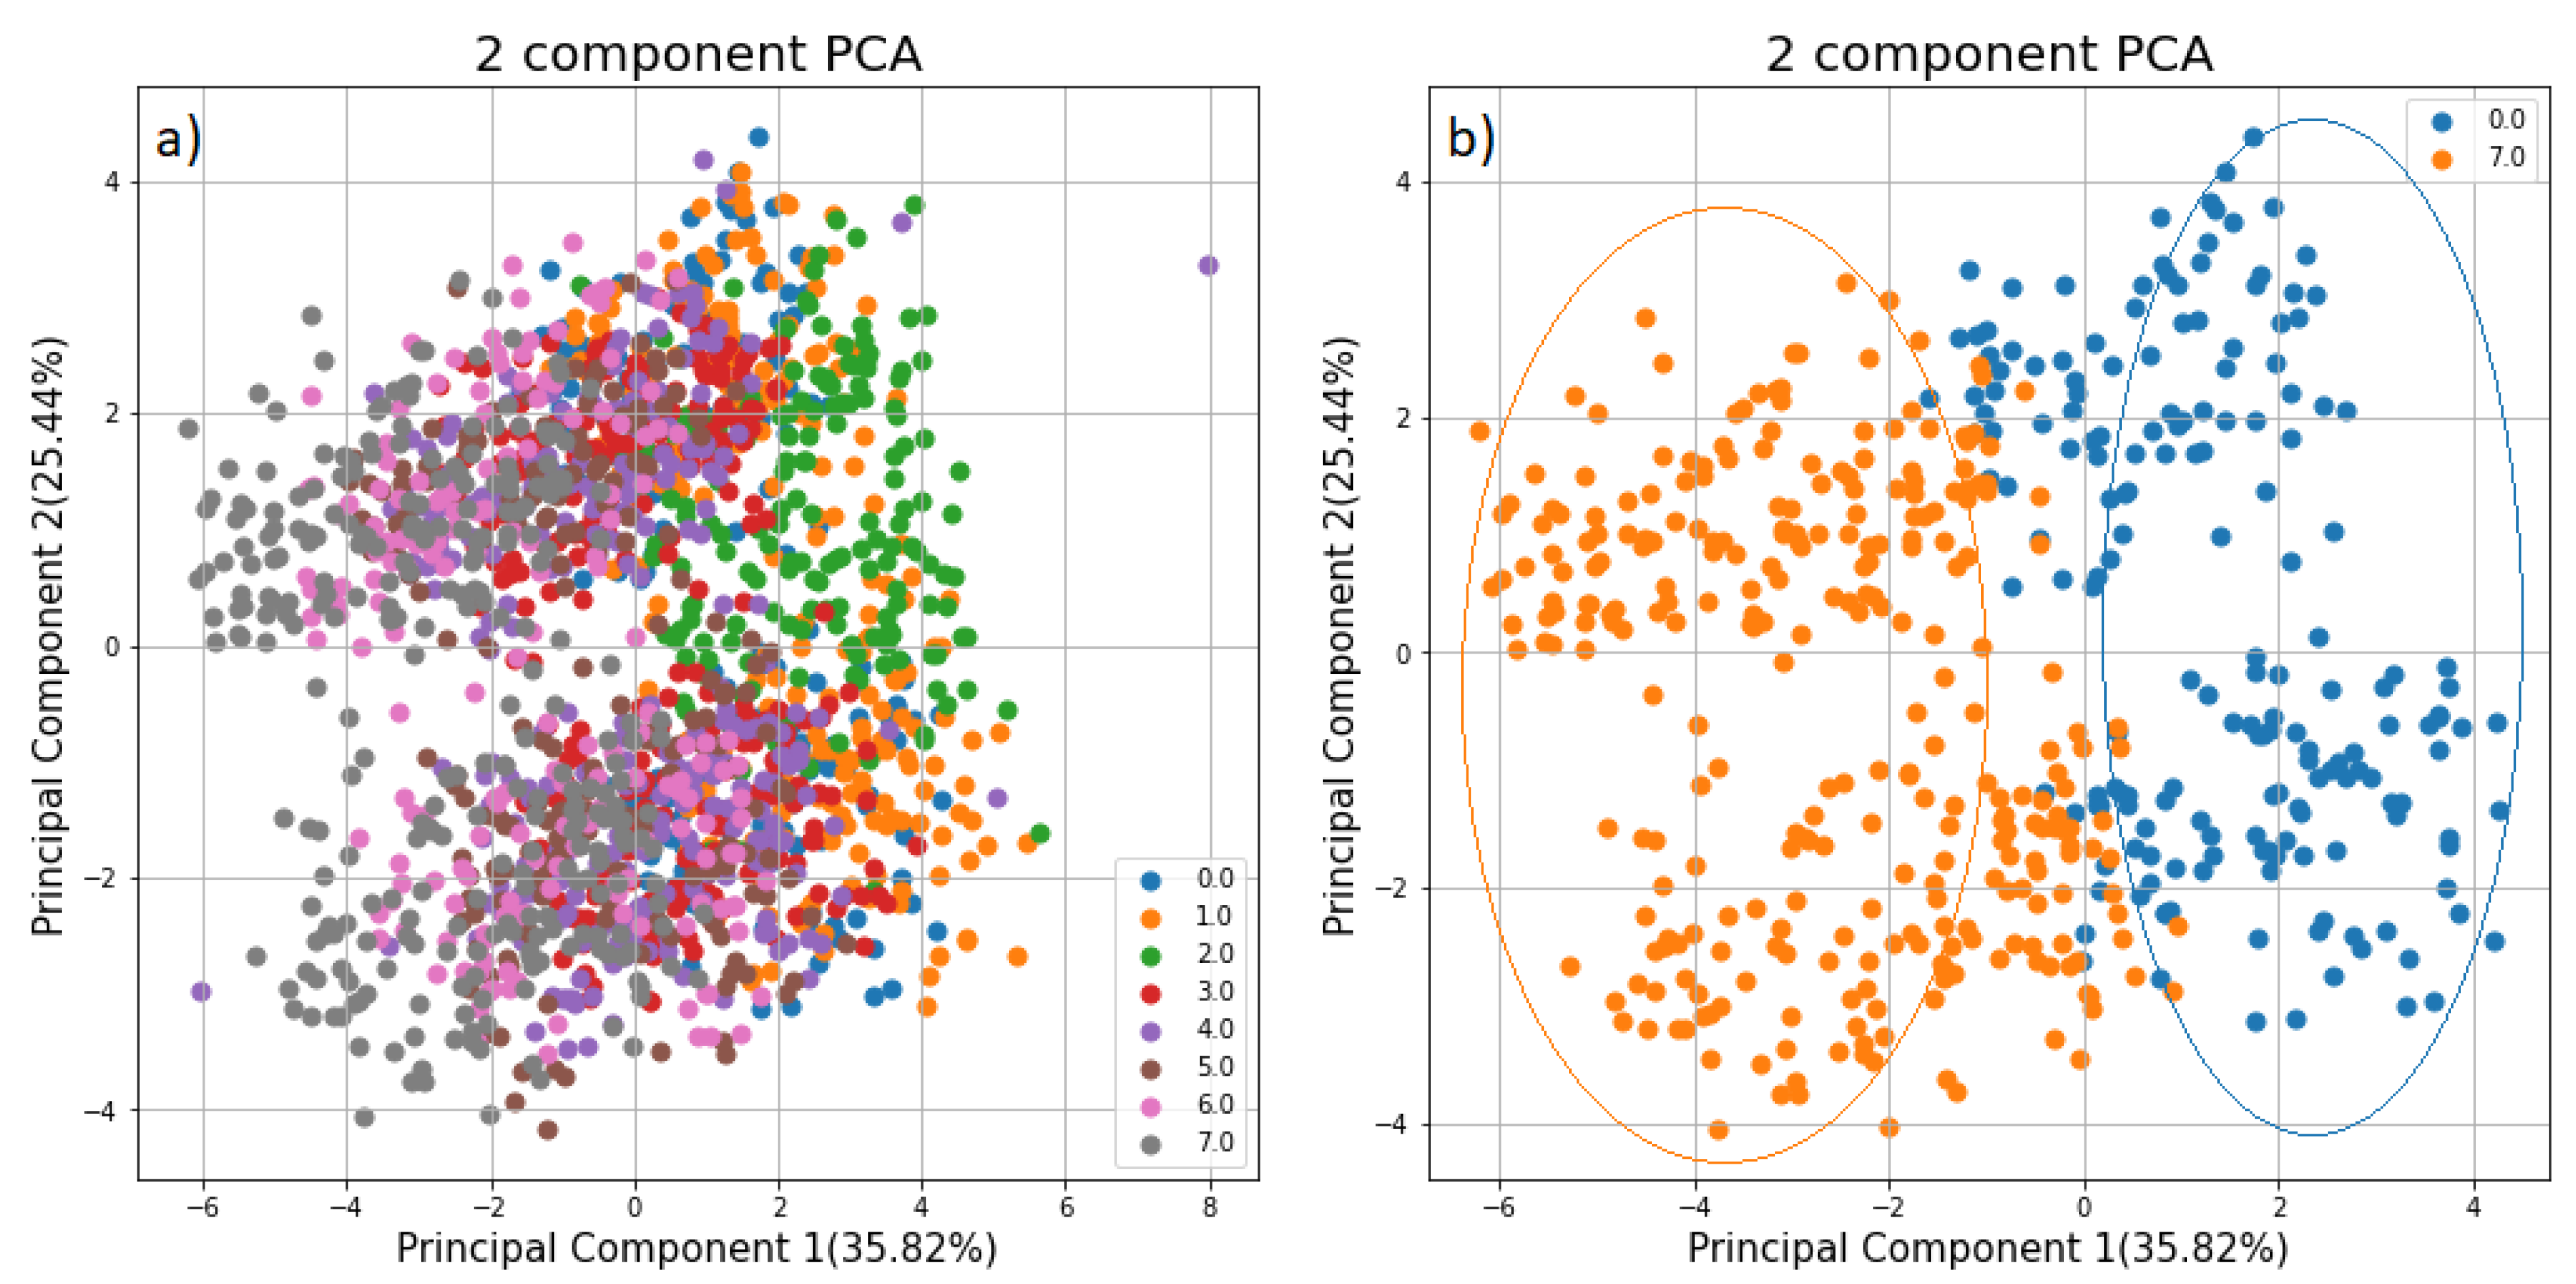
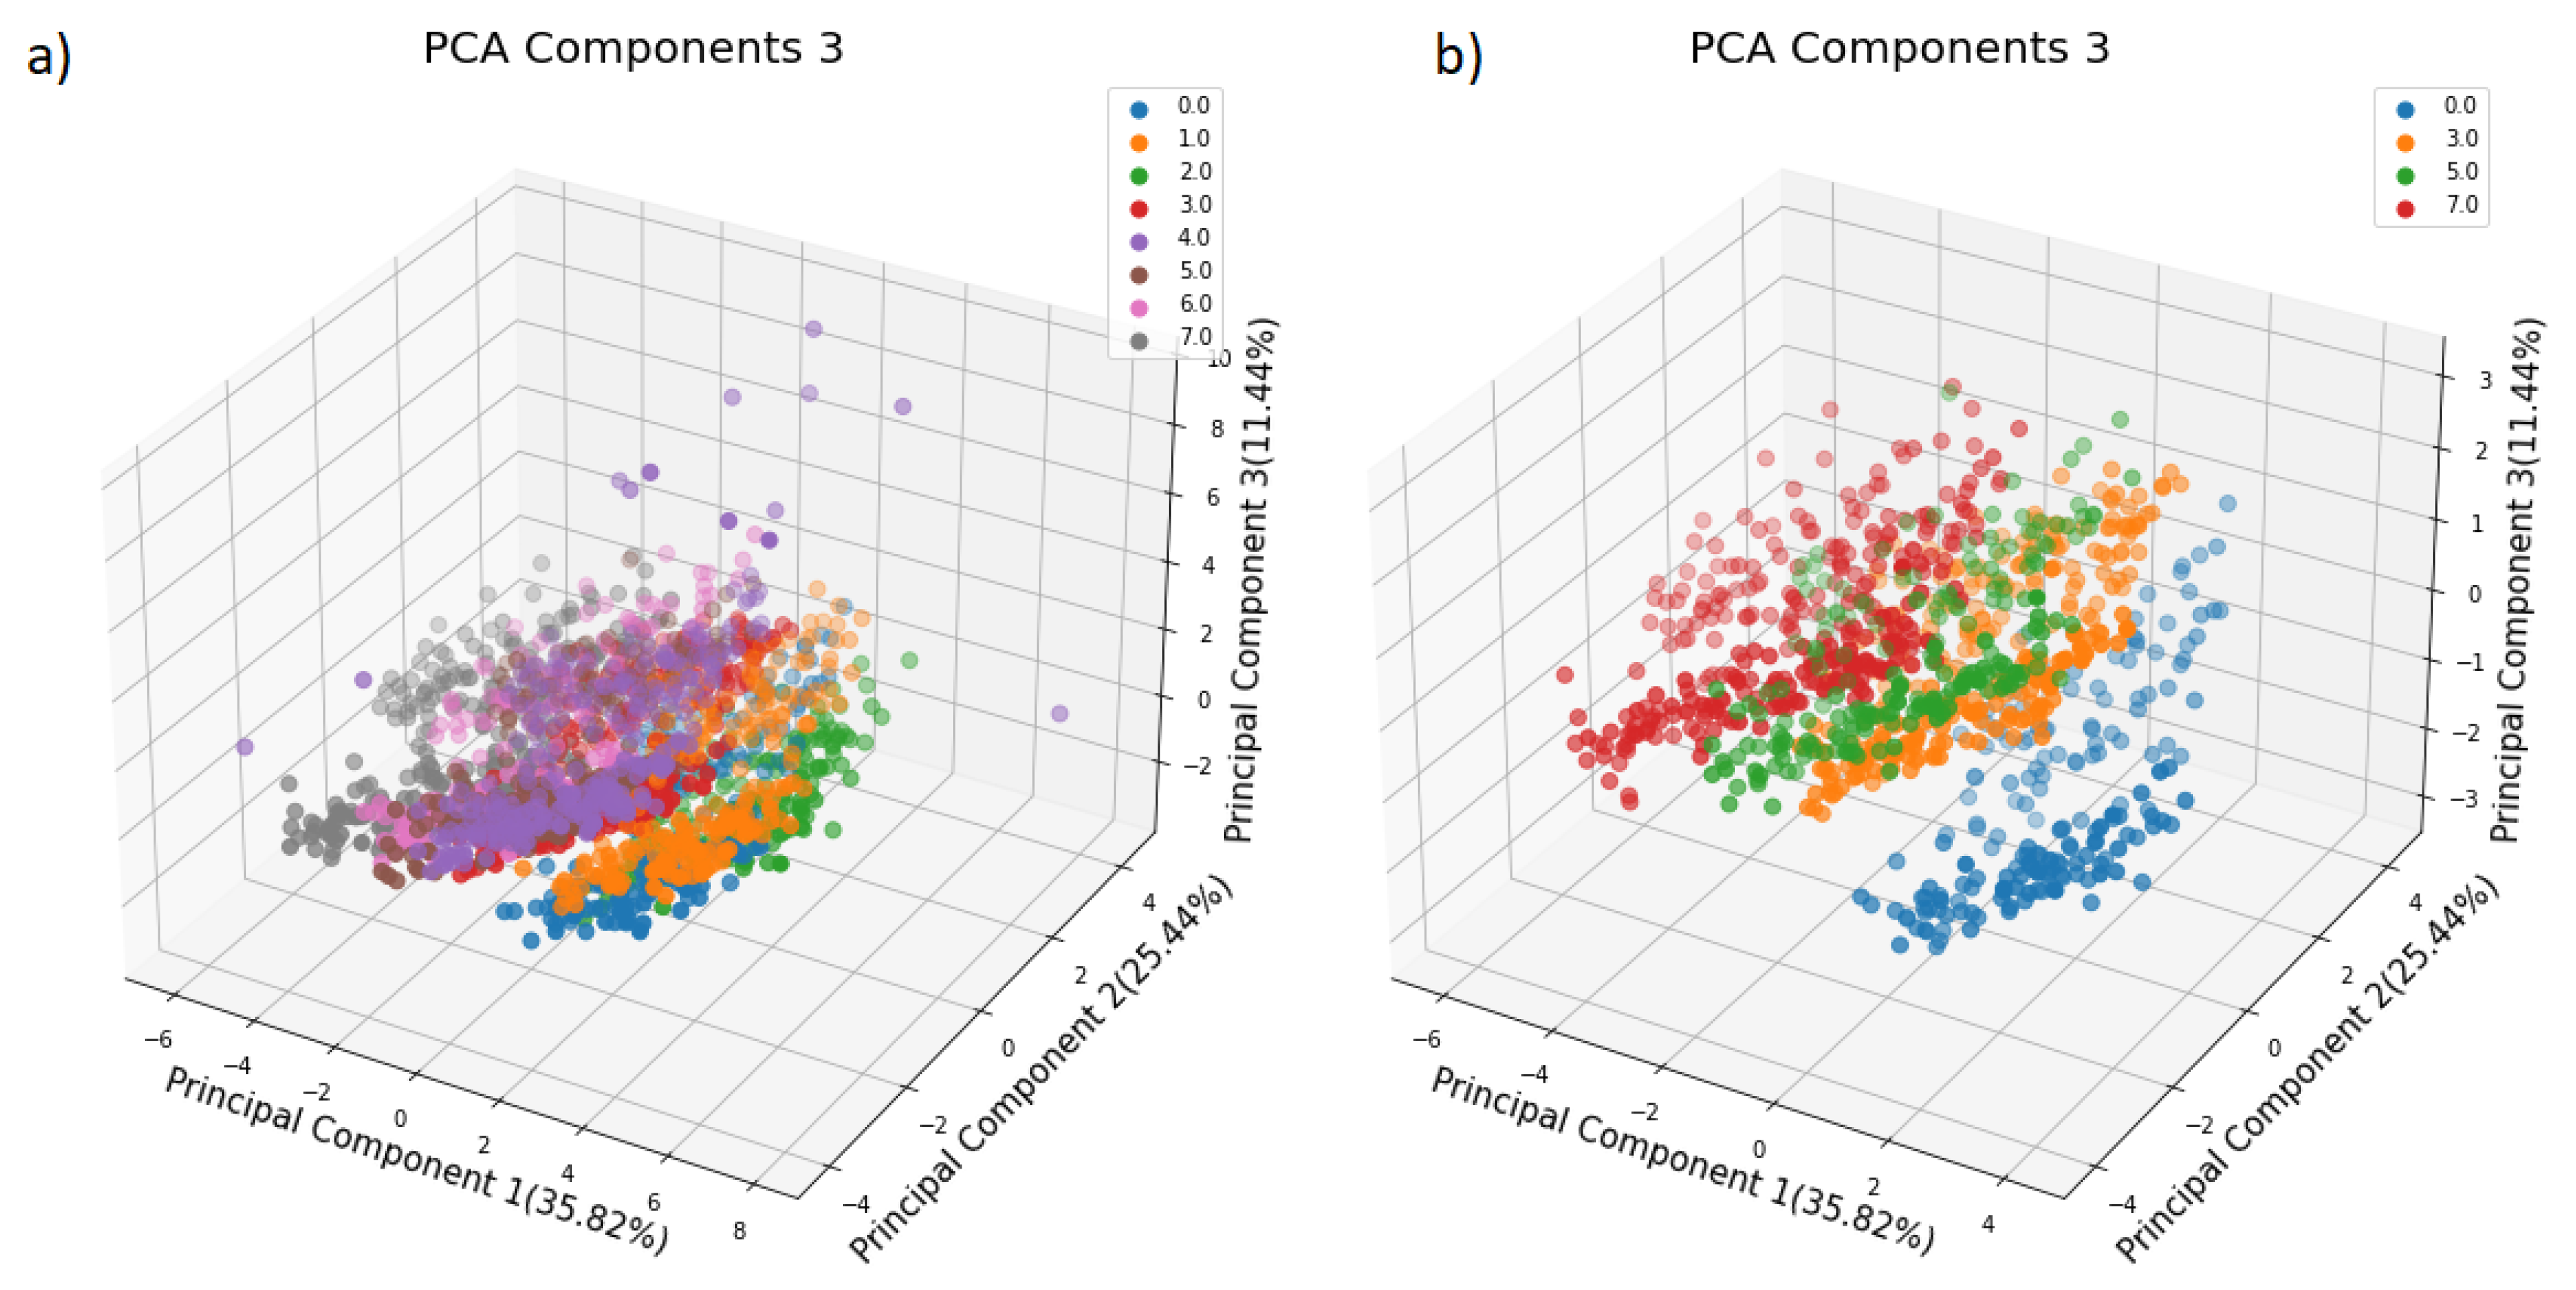
3.1. Results of Data Analysis

PCA was applied to matrix D to see the effect of data reduction on the data. The first PCA model used two principal components (PCs), explaining 35.82% and 25.44% of the total variance in the matrix D. Observing the plot of the first two PCs, it is clear that the two PCs do not separate the data well, especially if the difference between their viscosity is not very big. (Figure 5a). However, we can see that the data is well separated using two components for the sample with only Water and the sample with the PVP Solution (Figure 5b).
The second PCA model used three principal components, explaining 35.82%, 25.44%, and 11.44% of the total variance in the matrix D as shown in Figure 6. This PCA model improved the separation between the data compared to the previous one. However, more components explaining more variance in the data are needed in order to better separate the data.
In this paper, the actual values of the characteristics extracted during the image processing will be used to train the Artificial Neural network models.

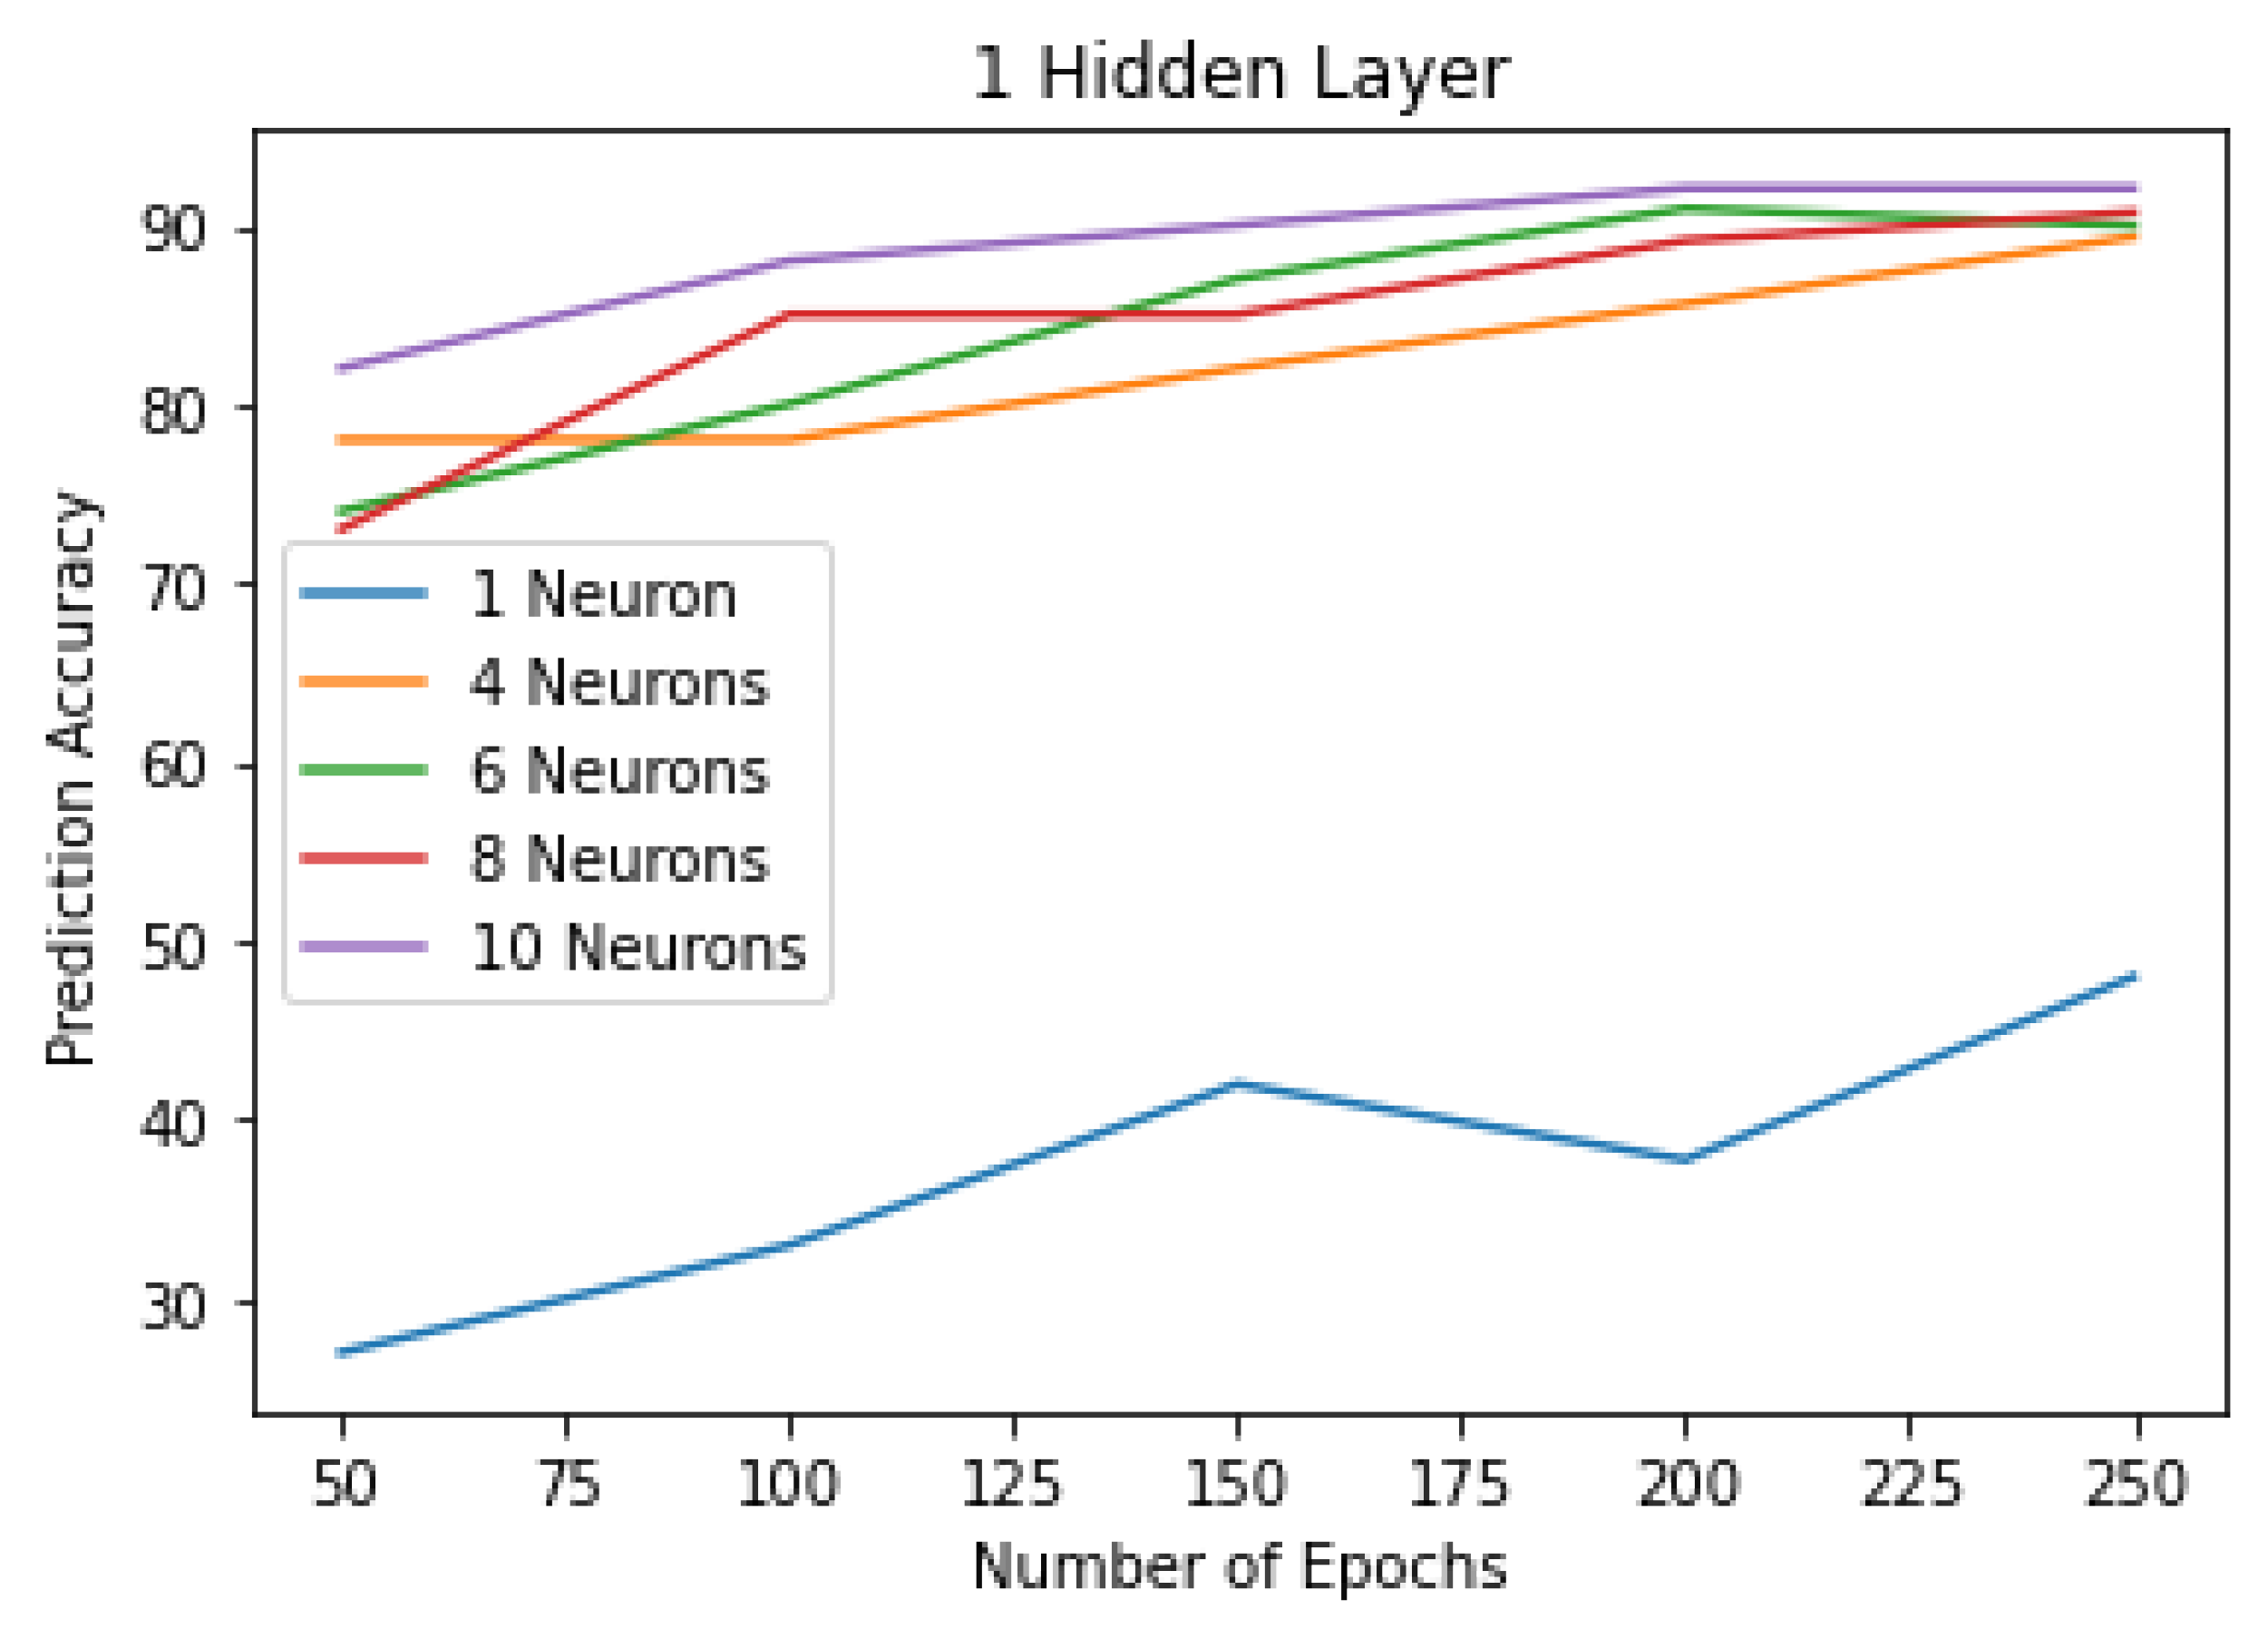
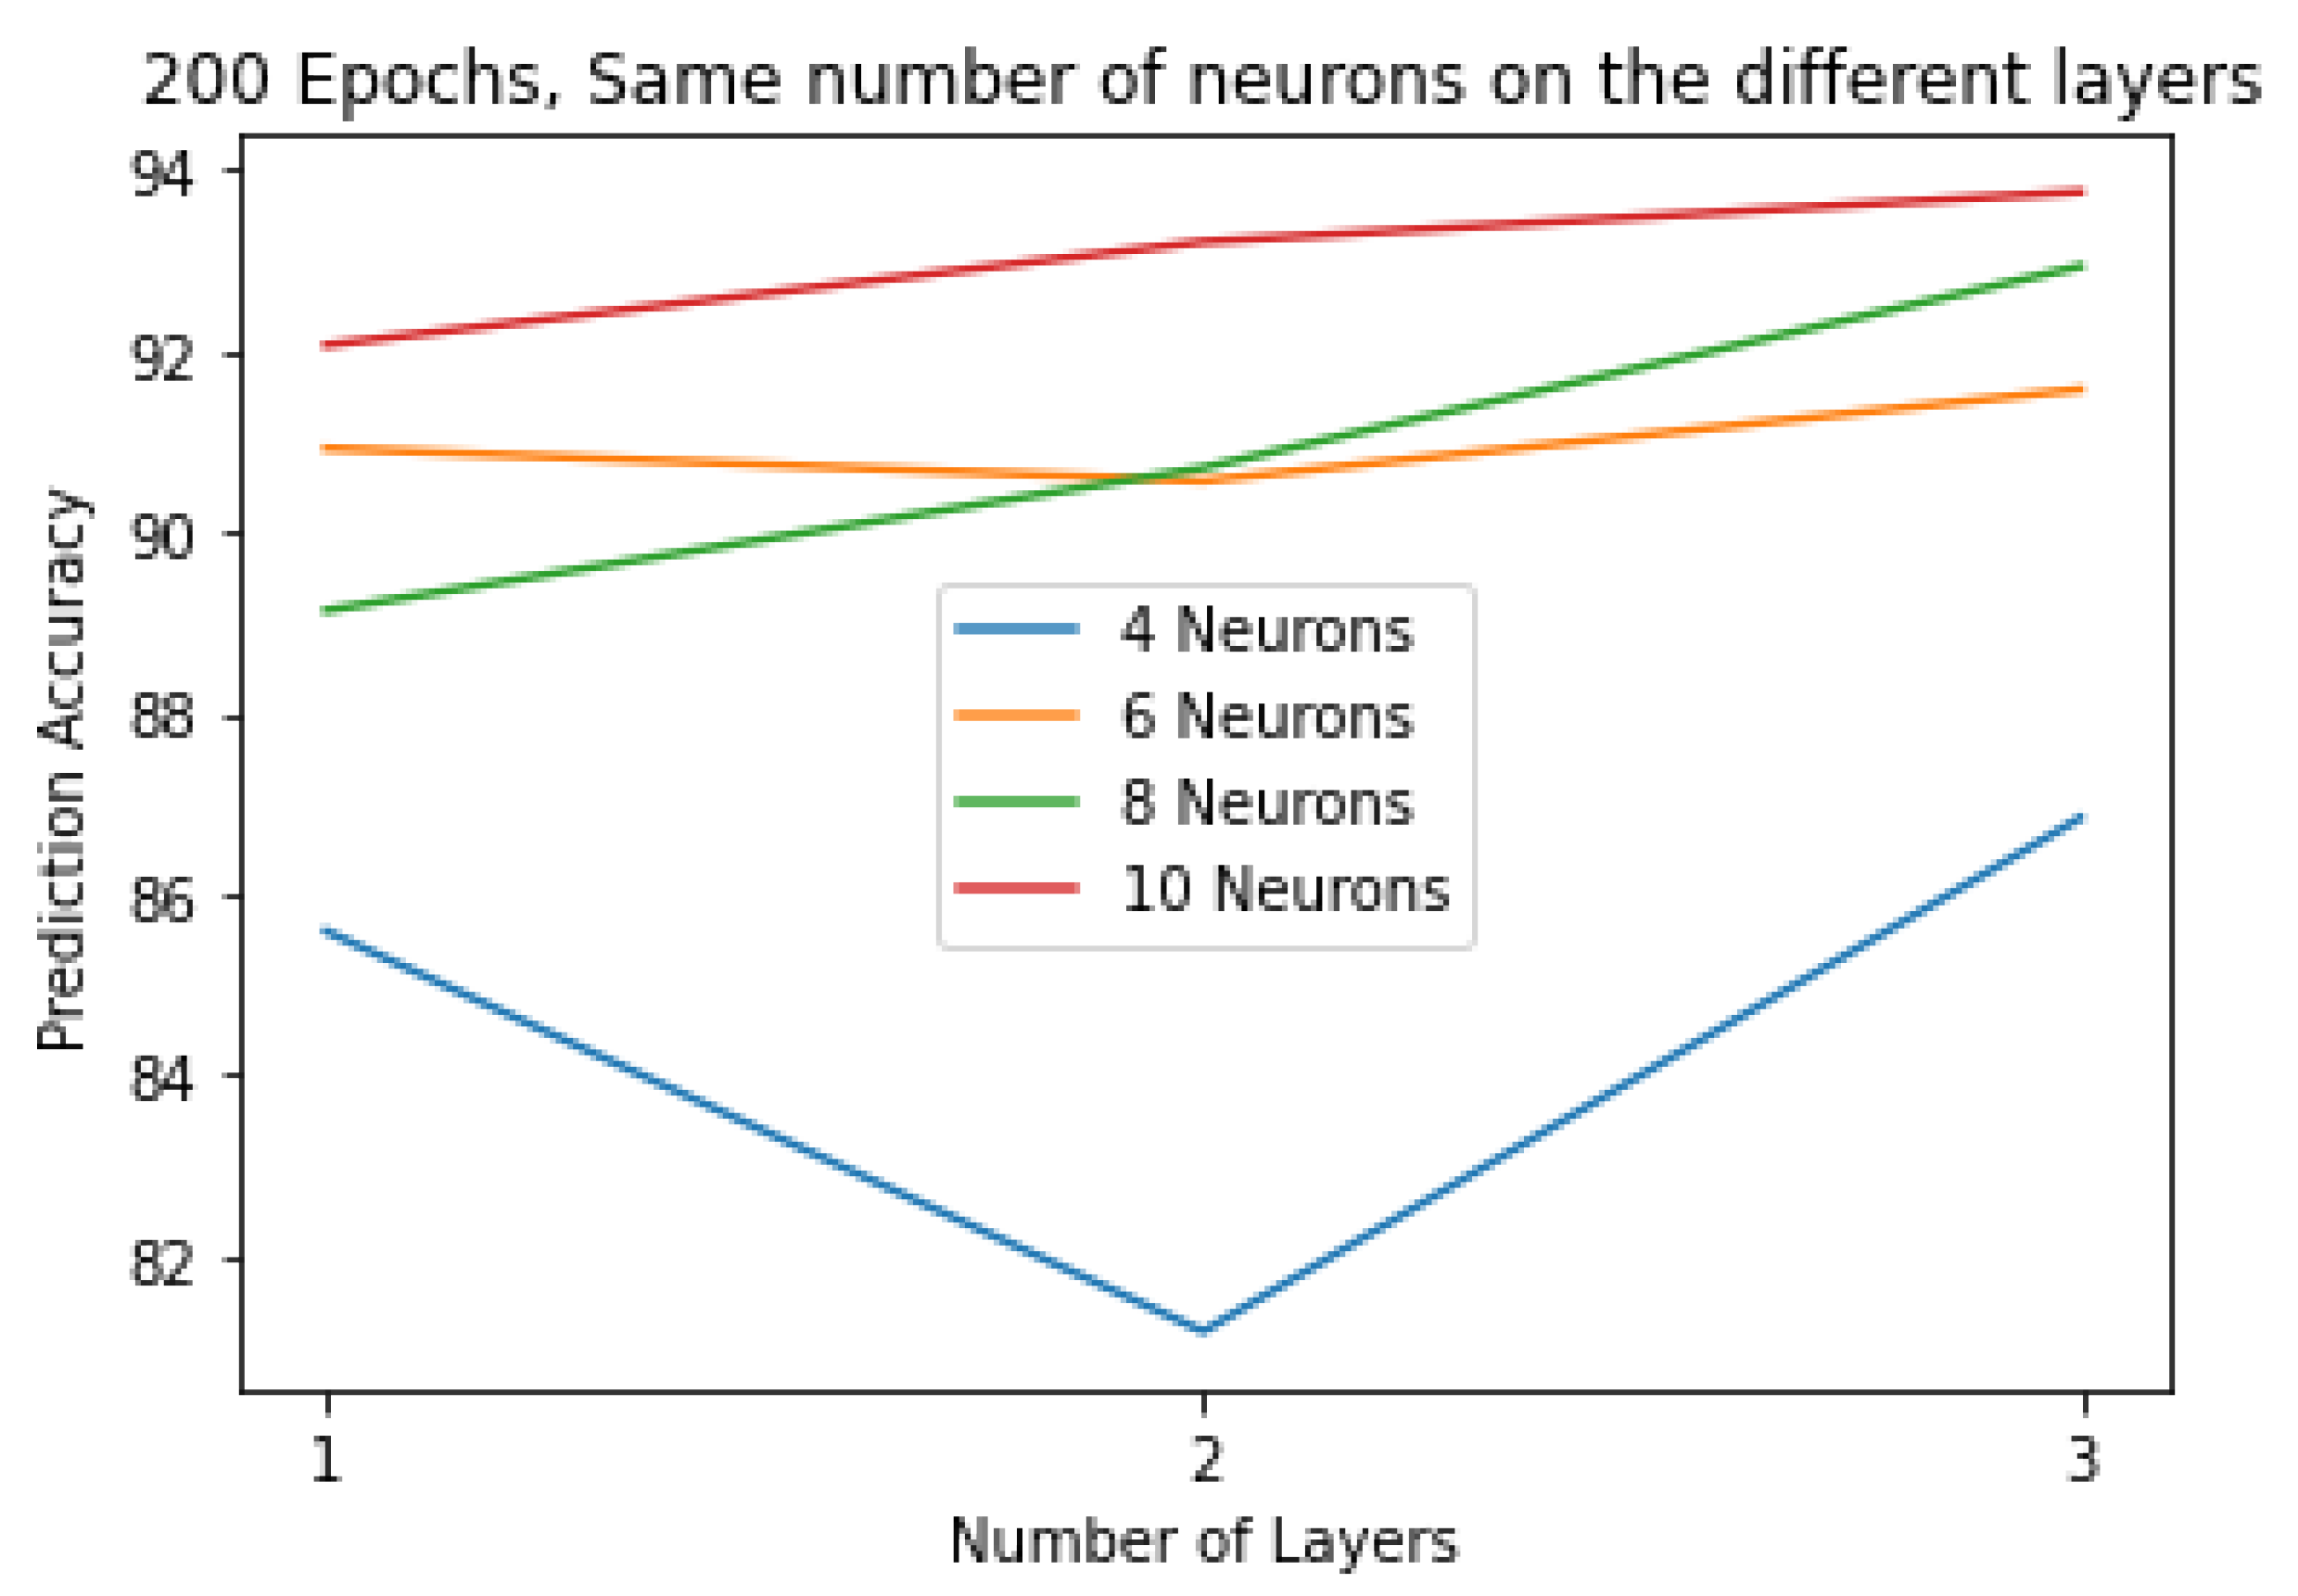
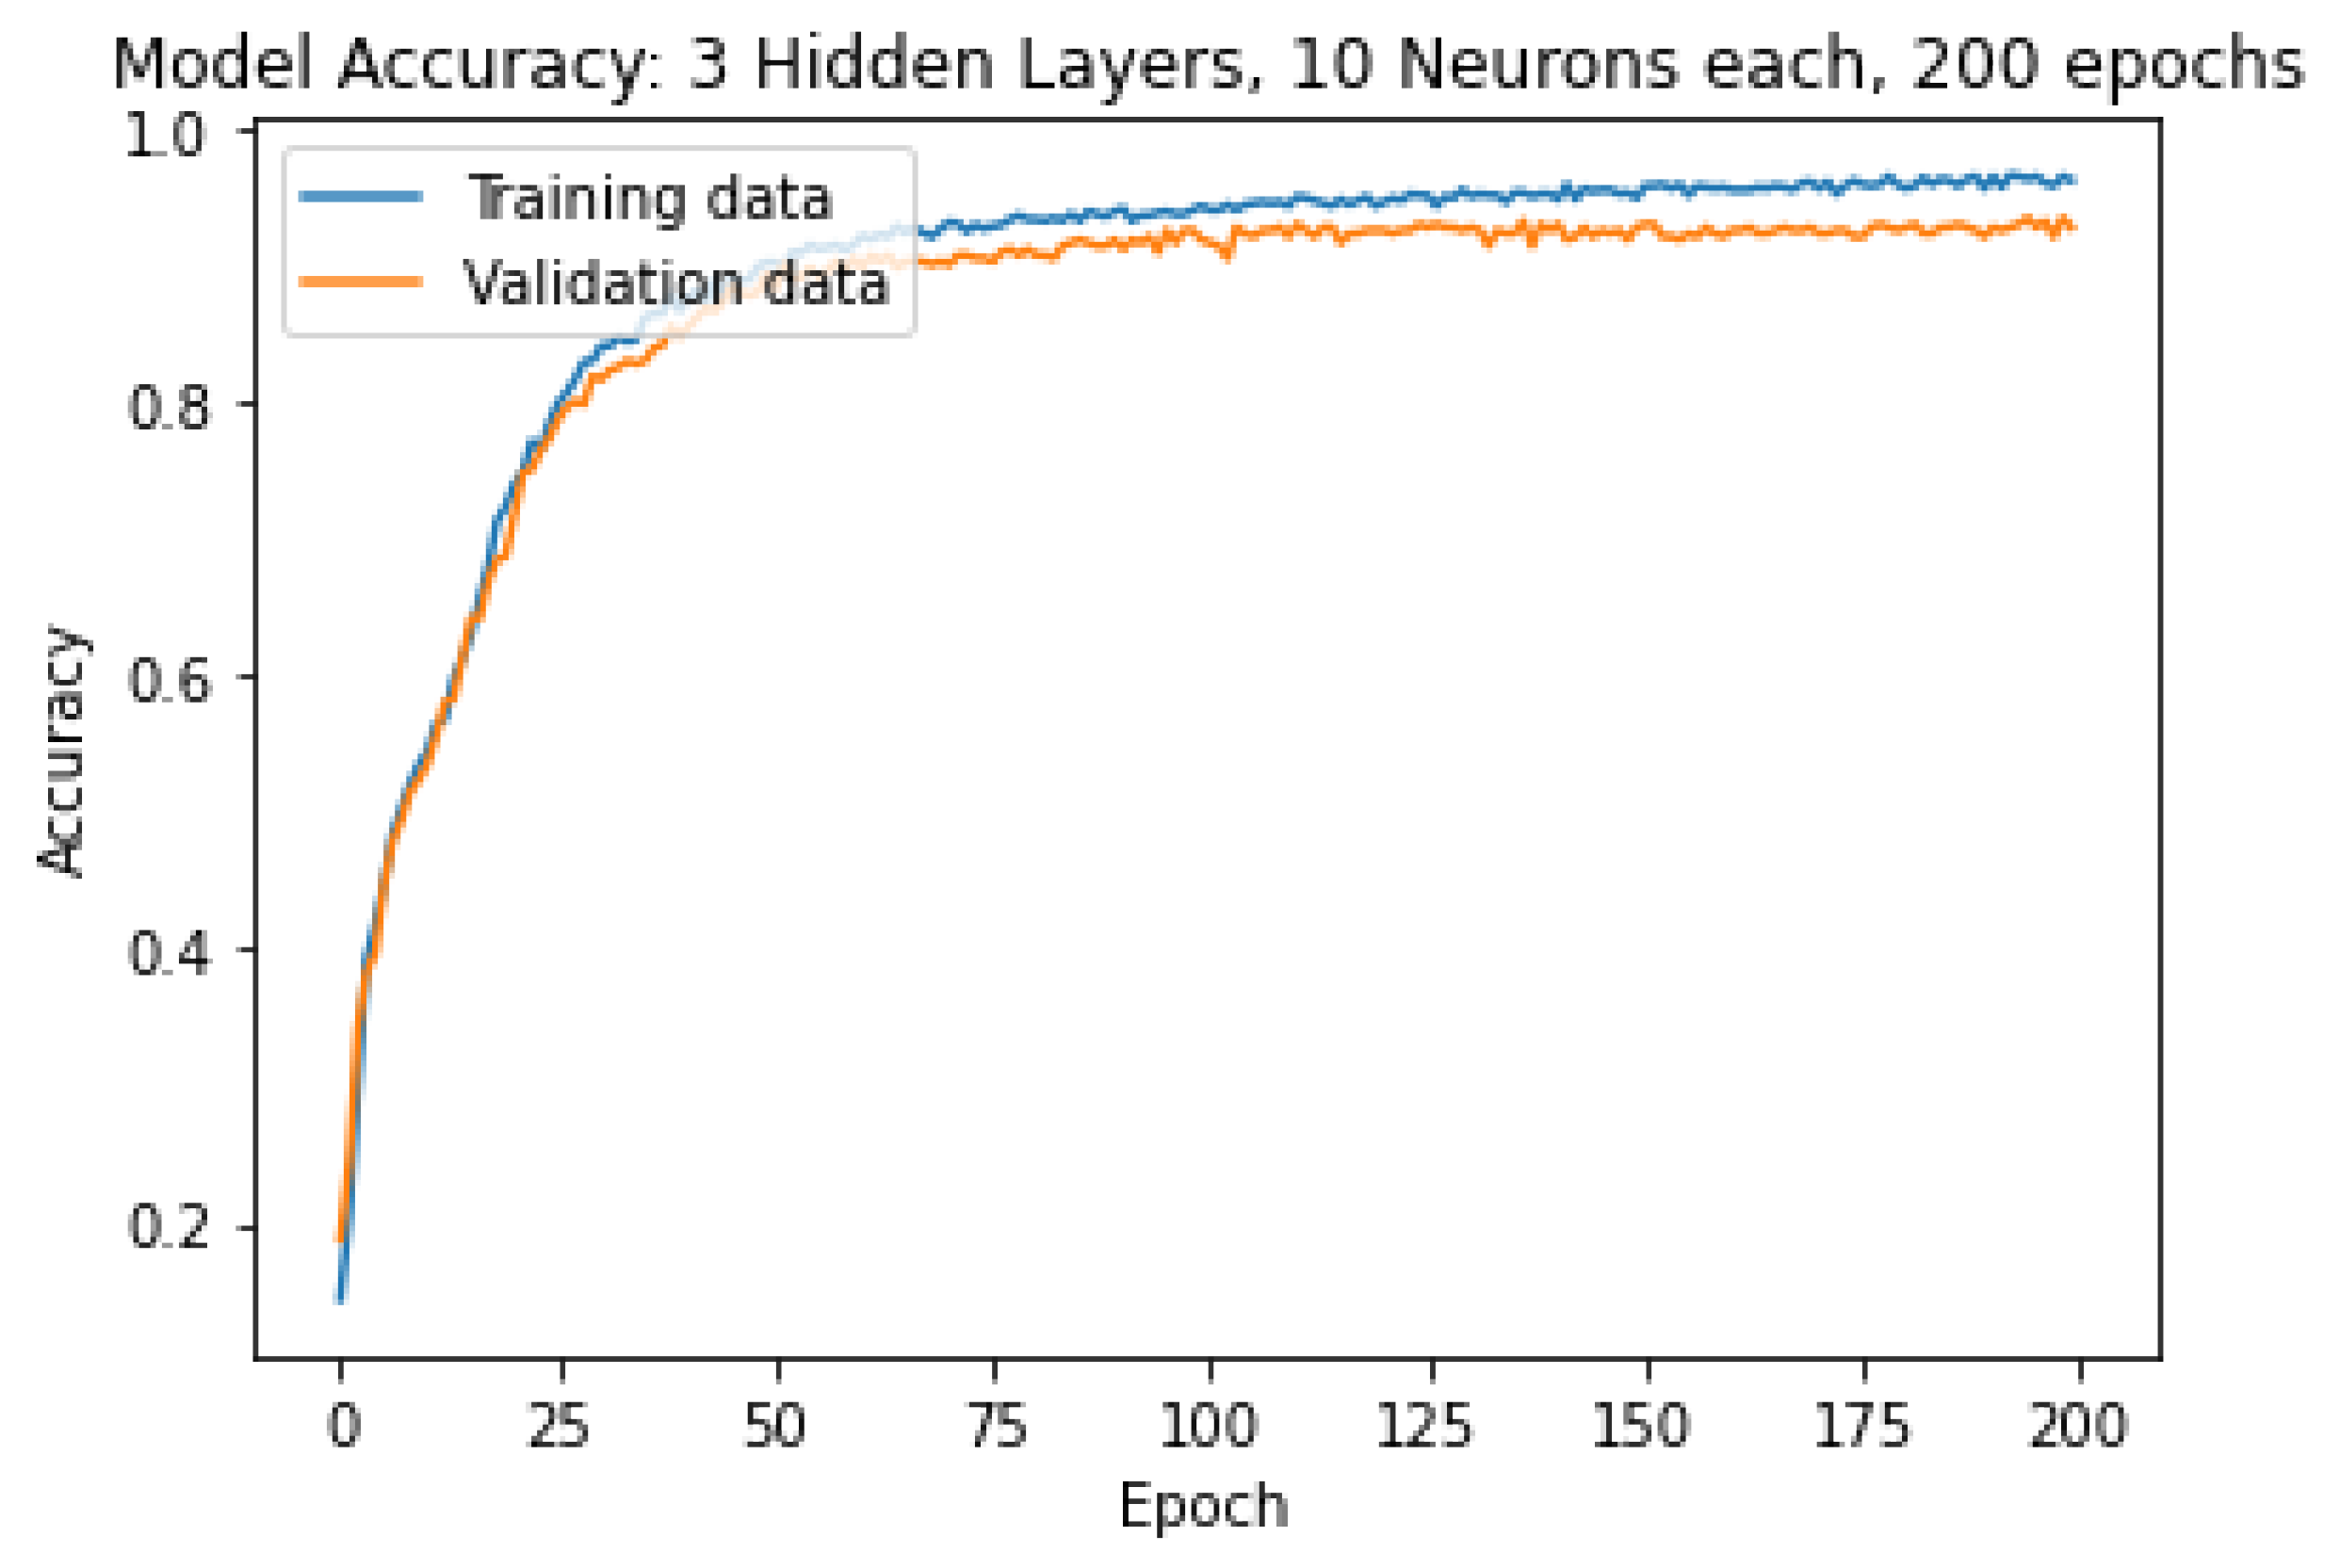
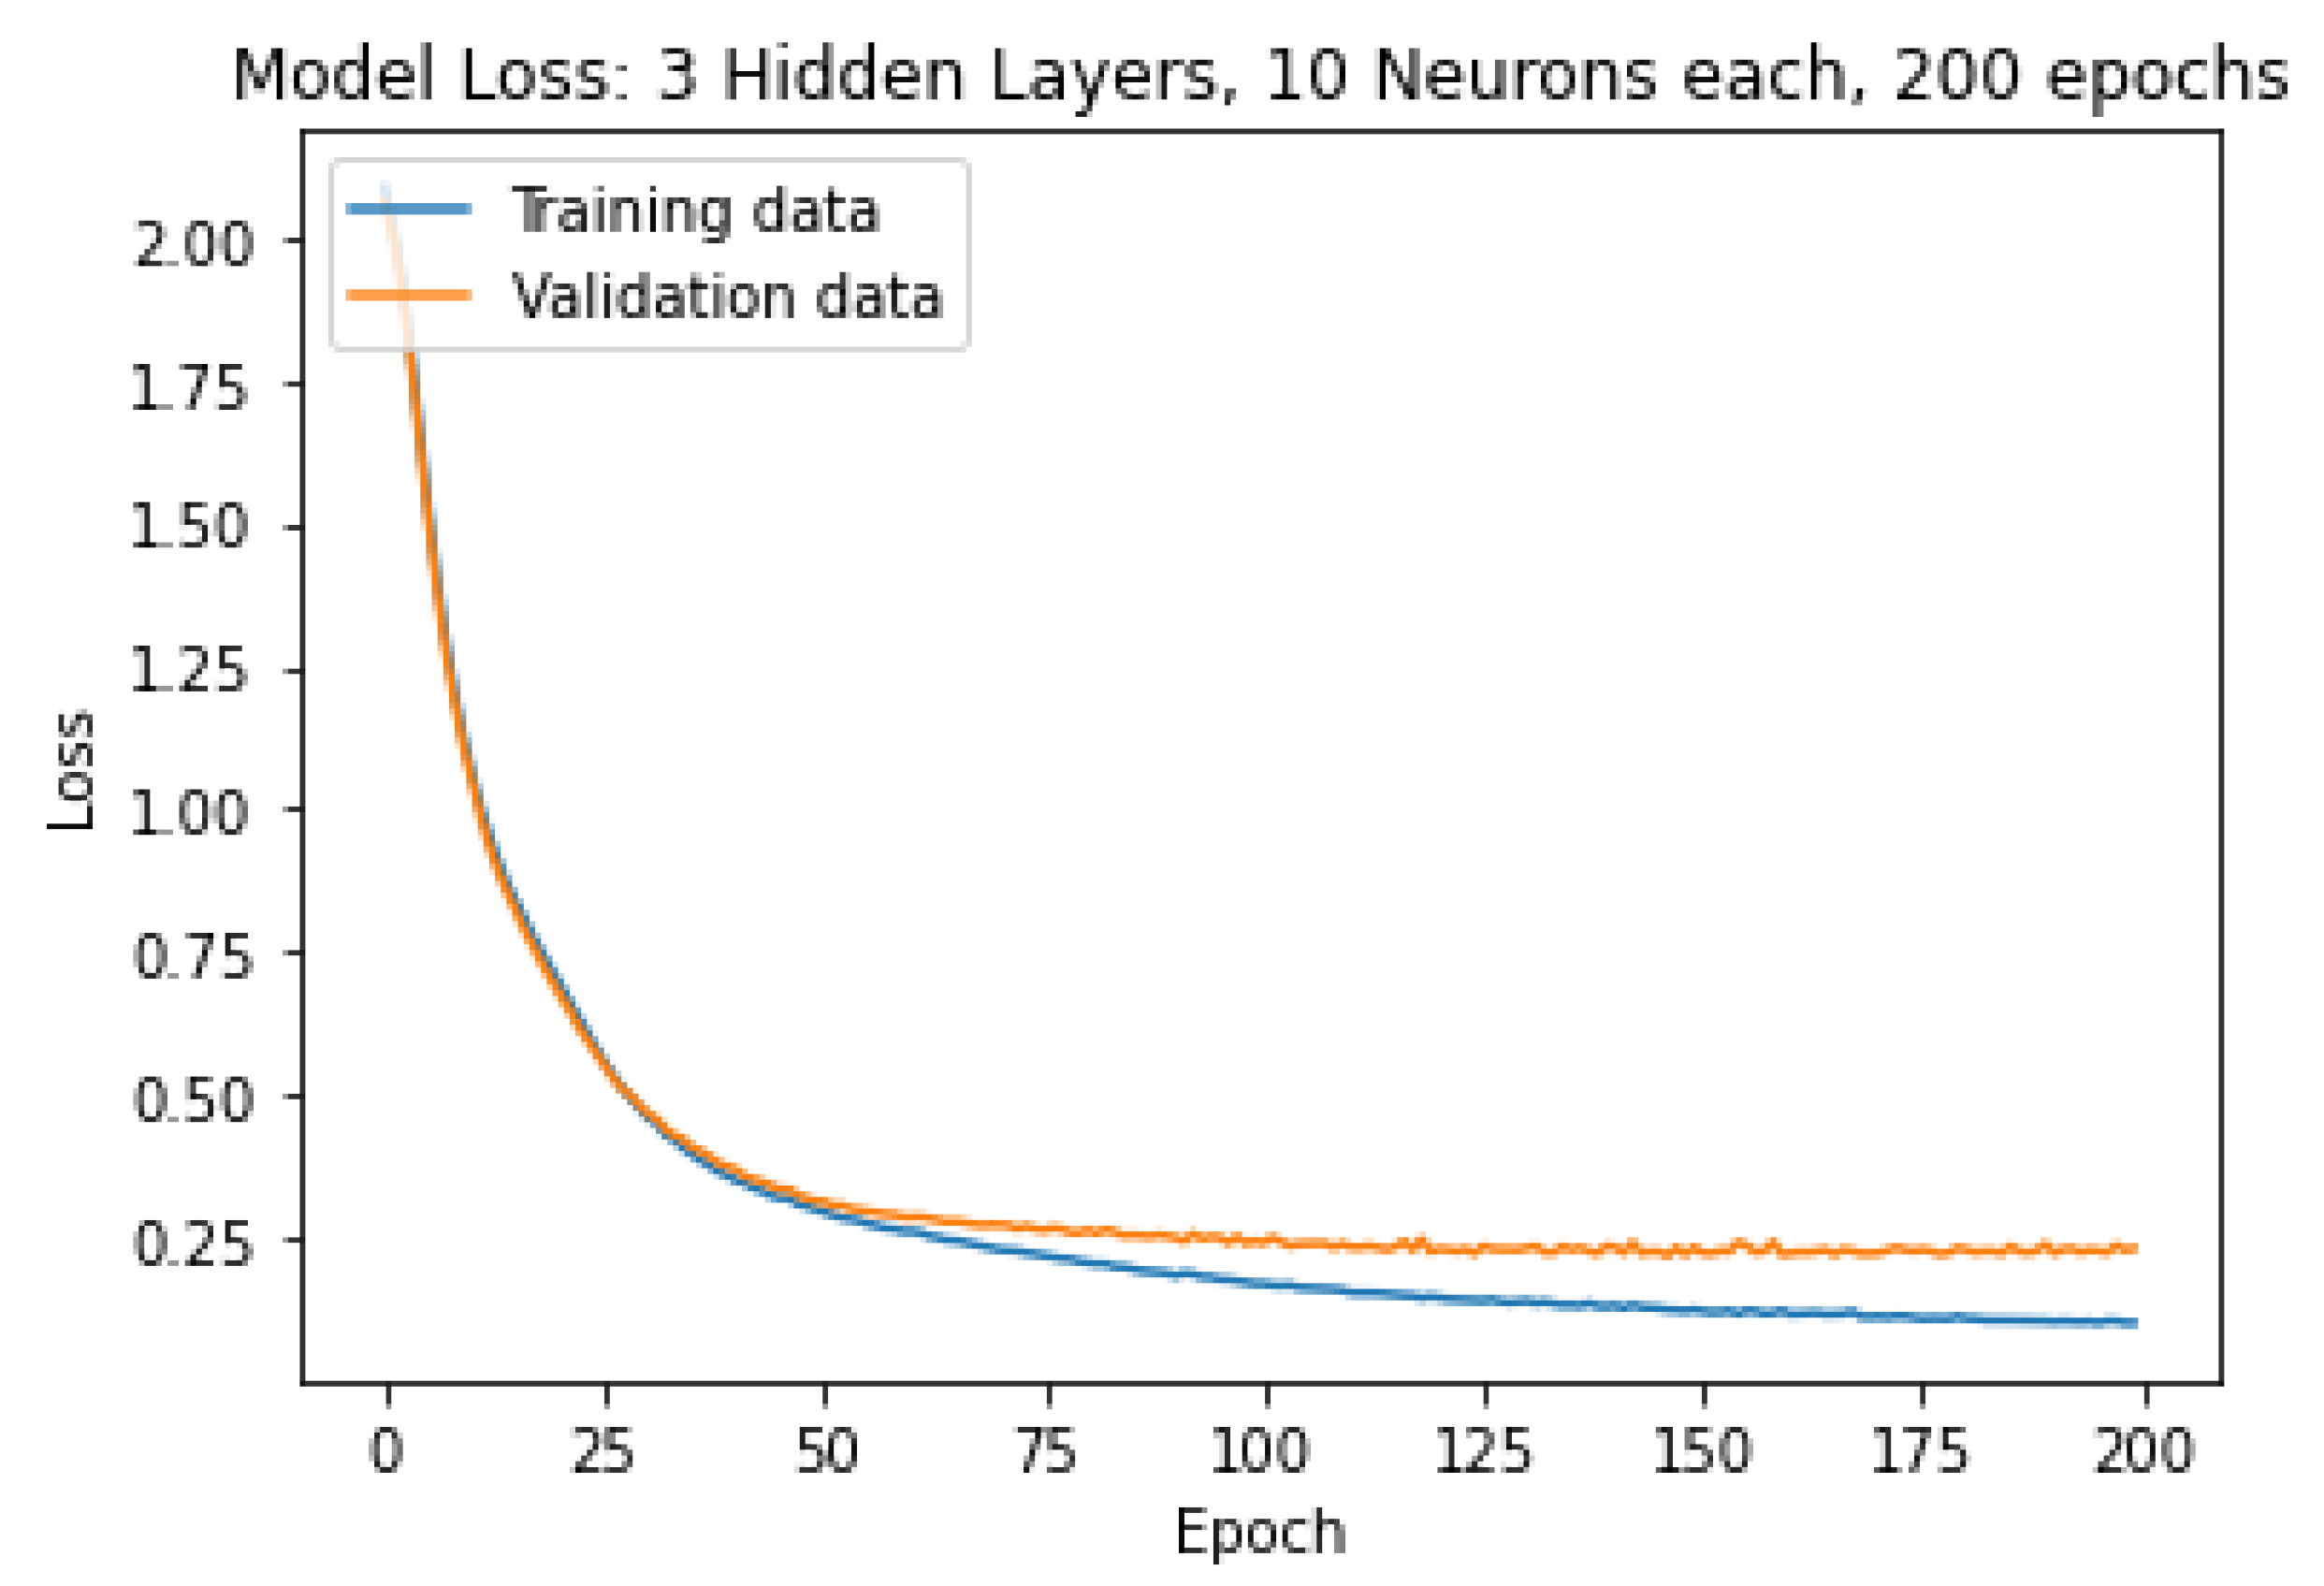
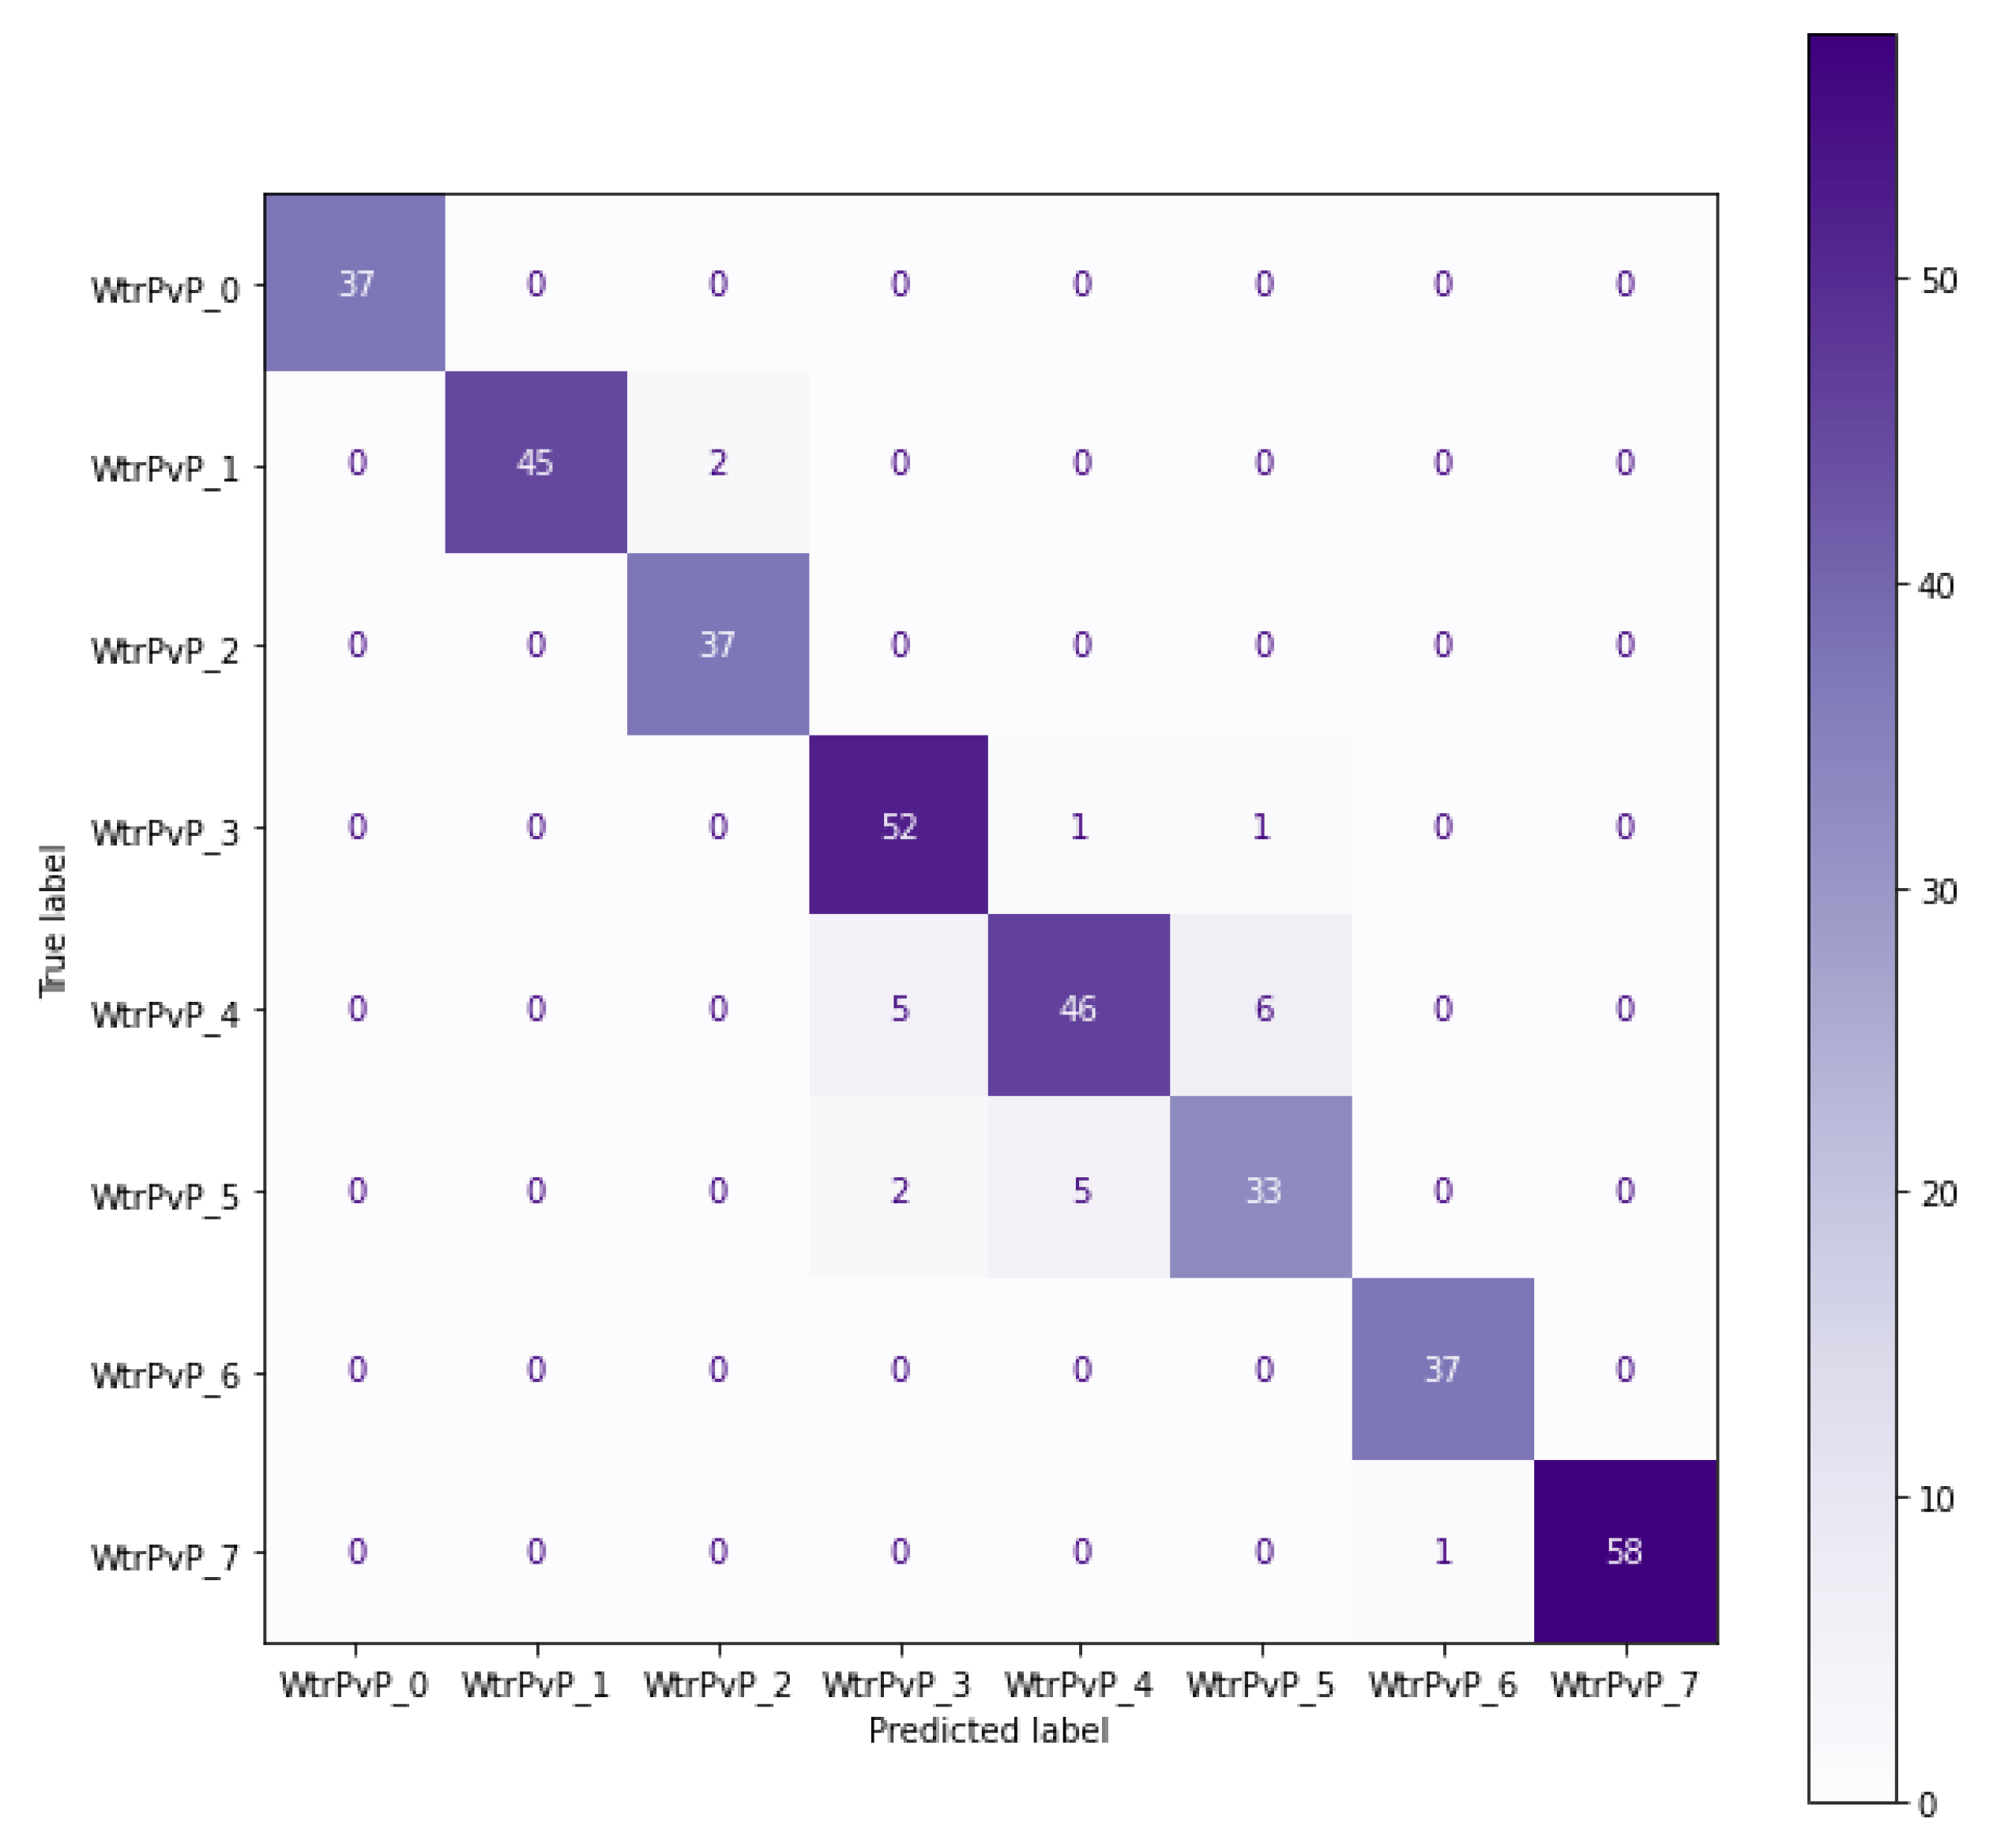
3.2. Predicting the Droplet Categories Using ANN

The number of neurons, layers, and epochs were varied in order to find the parameters of the model with the best prediction accuracy. The ANN model with one layer was first tried with a different number of neurons and epochs in order to detect the effect of increasing the number of neurons and epochs on the performance of the ANN model. Results in Figure 7 show that increasing the number of epochs improved the prediction accuracy. Models with a higher number of neurons on the hidden layer perform significantly better than others: With 200 epochs, a model with one neuron accuracy was 37.77%, four neurons reached an accuracy of 85.59%, and 10 neurons had the best results with a prediction accuracy of 92.06% on the testing data. Additional neurons were beneficial until the tenth neuron. Increasing the epochs number improved the prediction accuracy until epoch 200, then the results were almost the same except for the model with one neuron, and we could see an increase until epoch 250. The results showed that, in order to have a prediction accuracy above 73%, a minimum of two neurons is required. ANN models with only one hidden layer with one neuron performed poorly in all the studied cases.
To check if increasing the number of hidden layers of the ANN model would increase the prediction accuracy, further layers were tested with the same number of neurons each time as the previous layer (e.g., if the first hidden layer has four neurons, then the second was tested with four neurons and the third with four neurons as well). The epochs number remained the same at 200 epochs. The results showed that adding a second hidden layer, with one neuron, to the model decreased the prediction accuracy from 37.77% to 16.03%. Adding a third layer with one neuron did not improve the results. However, adding further layers to the models with neurons 6, 8, and 10 slightly improved the results, as shown in Figure 8. Adding a second hidden layer with 10 neurons improved the results of the model from 92.06% to 93.2%. A third layer further improved the results to 93.75%, which was the best result achieved compared to other models tested. Adding more layers after the third layer did not improve the results in any of the cases.
The ANN model with three hidden layers each having 10 neurons was chosen as the optimal model for predicting the droplet categories. The evolution of the accuracy and loss over the training are shown in Figure 9 and Figure 10, respectively.
At the end of the training, the accuracy of the model was 96.07% on the training data, 93.19% on the validation data, and 93.75% on the testing data. The model was able to accurately predict the category of 345 droplets out of 368. The confusion matrix in Figure 11 shows that even the wrong predictions were classified in the neighboring categories: Five droplets were classified in the waterPvP4 while they belonged to waterPvP3. Five droplets were classified in the waterPvP5 while they belonged to waterPvP4. Six droplets were classified in the waterPvP4 while they belonged to waterPvP5. All the droplets from the samples waterPvP1, waterPvP2, and waterPvP7 were classified with 100% accuracy.

4. Conclusions

The current work utilized videos of droplets from samples formulated using different ratios of water and PVP, resulting in samples with different viscosity values. The work aimed to extract the features of the droplets using image processing and to classify these droplets into the right category and thus to the correct viscosity value. A total of eight samples were produced, and videos were taken of their droplets. Characteristics of the droplets were extracted using OpenCV and Canny Algorithm. Artificial neural network models were trained using the extracted features to classify the droplets based on their categories, which were correlated with their viscosity values. It was found that in the case of the water-PVP solutions, the ANN models could successfully classify the droplets using the data extracted from the videos with high accuracy of 93.75%. The results imply that the ANN model can recognize the differences in the features that affect the viscosity values. Thus, for water PVP solutions, the most cumbersome viscosity measurement methods can be replaced with this technique, which is faster and requires minimal human labor. With these promising results, further research could be carried out to construct a regression model that predicts the actual viscosity values.

Author Contributions

Conceptualization, M.A.M.; data curation, M.A.M. and D.L.G.; methodology, M.A.M. and D.L.G.; resources, D.L.G.; software, M.A.M.; Supervision, K.C., D.L.G. and Z.K.N.; validation, M.A.M.; visualization, M.A.M.; writing—original draft, M.A.M.; writing—review and editing, M.A.M. and K.C. All authors have read and agreed to the published version of the manuscript.

Funding

Project no. 2019-1.3.1-KK-2019-00004 has been implemented with the support provided from the National Research, Development and Innovation Fund of Hungary, financed under the 2019-1.3.1-KK funding scheme.

Institutional Review Board Statement

Not applicable.

Informed Consent Statement

Not applicable.

Data Availability Statement

Data supporting reported results can be obtained based on request from the authors.

Conflicts of Interest

The authors declare no conflict of interest.

Abbreviations

The following abbreviations are used in this manuscript:
ANNArtificial Neural Network
PCAPrincipal Component Analysis
PCsPrincipal components
PVPPolyvinylpyrrolidone

References

  1. Viswanath, D.S.; Ghosh, T.K.; Prasad, D.H.; Dutt, N.V.; Rani, K.Y. Viscosity of Liquids: Theory, Estimation, Experiment, and Data; Springer Science & Business Media: Dordrecht, The Netherlands, 2007. [Google Scholar]
  2. Toropainen, E.; Fraser-Miller, S.J.; Novakovic, D.; Del Amo, E.M.; Vellonen, K.S.; Ruponen, M.; Viitala, T.; Korhonen, O.; Auriola, S.; Hellinen, L.; et al. Biopharmaceutics of topical ophthalmic suspensions: Importance of viscosity and particle size in ocular absorption of indomethacin. Pharmaceutics 2021, 13, 452. [Google Scholar] [CrossRef] [PubMed]
  3. Lokhande, A.B.; Mishra, S.; Kulkarni, R.D.; Naik, J.B. Influence of different viscosity grade ethylcellulose polymers on encapsulation and in vitro release study of drug loaded nanoparticles. J. Pharm. Res. 2013, 7, 414–420. [Google Scholar] [CrossRef]
  4. Nunes, V.M.; Lourenço, M.J.; Santos, F.J.; Nieto de Castro, C.A. Importance of accurate data on viscosity and thermal conductivity in molten salts applications. J. Chem. Eng. Data 2003, 48, 446–450. [Google Scholar] [CrossRef]
  5. Rashid, B.; Bal, A.L.; Williams, G.J.; Muggeridge, A.H. Using vorticity to quantify the relative importance of heterogeneity, viscosity ratio, gravity and diffusion on oil recovery. Comput. Geosci. 2012, 16, 409–422. [Google Scholar] [CrossRef]
  6. Brooks, R.; Dinsdale, A.; Quested, P. The measurement of viscosity of alloys—A review of methods, data and models. Meas. Sci. Technol. 2005, 16, 354. [Google Scholar] [CrossRef]
  7. Zhu, H.; Dexter, R.; Fox, R.; Reichard, D.; Brazee, R.; Ozkan, H. Effects of polymer composition and viscosity on droplet size of recirculated spray solutions. J. Agric. Eng. Res. 1997, 67, 35–45. [Google Scholar] [CrossRef]
  8. Gotaas, C.; Havelka, P.; Jakobsen, H.A.; Svendsen, H.F.; Hase, M.; Roth, N.; Weigand, B. Effect of viscosity on droplet-droplet collision outcome: Experimental study and numerical comparison. Phys. Fluids 2007, 19, 102106. [Google Scholar] [CrossRef]
  9. Wang, Z.; Liu, H.; Zhang, Z.; Sun, B.; Zhang, J.; Lou, W. Research on the effects of liquid viscosity on droplet size in vertical gas–liquid annular flows. Chem. Eng. Sci. 2020, 220, 115621. [Google Scholar] [CrossRef]
  10. Kheloufi, N.; Lounis, M. An Optical Technique for Newtonian Fluid Viscosity Measurement Using Multiparameter Analysis. Appl. Rheol. 2014, 24, 15–22. [Google Scholar]
  11. Santhosh, K.; Shenoy, V. Analysis of liquid viscosity by image processing techniques. Indian J. Sci. Technol. 2016, 9, 98693. [Google Scholar] [CrossRef]
  12. Afrand, M.; Najafabadi, K.N.; Sina, N.; Safaei, M.R.; Kherbeet, A.S.; Wongwises, S.; Dahari, M. Prediction of dynamic viscosity of a hybrid nano-lubricant by an optimal artificial neural network. Int. Commun. Heat Mass Transf. 2016, 76, 209–214. [Google Scholar] [CrossRef]
  13. Omole, O.; Falode, O.; Deng, A.D. Prediction of Nigerian crude oil viscosity using artificial neural network. Pet. Coal 2009, 51, 181–188. [Google Scholar]
  14. Esfe, M.H.; Saedodin, S.; Sina, N.; Afrand, M.; Rostami, S. Designing an artificial neural network to predict thermal conductivity and dynamic viscosity of ferromagnetic nanofluid. Int. Commun. Heat Mass Transf. 2015, 68, 50–57. [Google Scholar] [CrossRef]
  15. Naveenkumar, M.; Vadivel, A. OpenCV for computer vision applications. In Proceedings of the National Conference on Big Data and Cloud Computing (NCBDC’15), Tiruchirappalli, India, 20 March 2015; pp. 52–56. [Google Scholar]
  16. Sharifi, M.; Fathy, M.; Mahmoudi, M.T. A classified and comparative study of edge detection algorithms. In Proceedings of the International Conference on Information Technology: Coding and Computing, Las Vegas, NV, USA, 8–10 April 2002; pp. 117–120. [Google Scholar]
  17. Bisong, E. Introduction to Scikit-learn. In Building Machine Learning and Deep Learning Models on Google Cloud Platform; Springer: New York, NY, USA, 2019; pp. 215–229. [Google Scholar]
  18. Manaswi, N.K. Understanding and working with Keras. In Deep Learning with Applications Using Python; Springer: New York, NY, USA, 2018; pp. 31–43. [Google Scholar]
Figure 1. Experimental setup.
Processes 10 01780 g001
Figure 2. Experimental setup in test: Droplet formed and about to detach from the dropper.
Processes 10 01780 g002
Figure 3. A droplet with its edges detected in yellow during its different states: the four droplets from the left show the development phase. Fifth droplet from the left: completely formed droplet in the frame just before the detachment. Last droplet: after detachment.
Processes 10 01780 g003
Figure 4. PCA Explained and Cumulative variances (x: Principle Components).
Processes 10 01780 g004
Figure 5. Two Components PCA model: (a) PCA applied to all samples. (b) PCA applied only to sample WaterPvP0 and WaterPvP7.
Processes 10 01780 g005
Figure 6. Three Components PCA model: (a) PCA applied to all samples. (b) PCA applied only to four samples WaterPvP0, WaterPvP3, WaterPvP5 and WaterPvP7.
Processes 10 01780 g006
Figure 7. The effect of increasing Neurons/Epochs on the ANN prediction accuracy (%).
Processes 10 01780 g007
Figure 8. The effect of adding further hidden Layers on the ANN prediction accuracy (%).
Processes 10 01780 g008
Figure 9. Model ANN(10, 10, 10) Prediction Accuracy.
Processes 10 01780 g009
Figure 10. Model ANN(10, 10, 10) Loss curve.
Processes 10 01780 g010
Figure 11. Model ANN(10, 10, 10) Confusion Matrix.
Processes 10 01780 g011
Table 1. The different formulations applied for the samples preparation.
Formulation NumberWater (mL)PVP Solution (mL)
WaterPVP0 (Water)3000
WaterPVP130050
WaterPVP212550
WaterPVP366.6650
WaterPVP437.550
WaterPVP52050
WaterPVP68.3350
WaterPVP7 (PVP Solution)050
Table 2. Viscosity values of the different samples.
Formulation NumberViscosity Value mPa·S
WaterPVP0 (Water)0.891
WaterPVP11.825
WaterPVP24.306
WaterPVP37.601
WaterPVP49.347
WaterPVP516.51
WaterPVP633.13
WaterPVP7 (PVP Solution)61.40
Table 3. The data after cleaning.
MatrixNumber of Rows (n)Number of Columns (i)Number of DropletsRuntime (s)
WaterPVP0 (Water)111,00114181740.26
WaterPVP1134,84414233901.04
WaterPVP2104,74814182700.22
WaterPVP3179,127142691197.95
WaterPVP4185,722142831246.84
WaterPVP5133,01614200889.53
WaterPVP6116,14814184777.44
WaterPVP7 (PVP solution)184,686142951233.07
Table 4. One-Hot encoding of the target categories.
Category NumberEncoding
WaterPVP0 (Water)(1, 0, 0, 0, 0, 0, 0, 0)
WaterPVP1(0, 1, 0, 0, 0, 0, 0, 0)
WaterPVP2(0, 0, 1, 0, 0, 0, 0, 0)
WaterPVP3(0, 0, 0, 1, 0, 0, 0, 0)
WaterPVP4(0, 0, 0, 0, 1, 0, 0, 0)
WaterPVP5(0, 0, 0, 0, 0, 1, 0, 0)
WaterPVP6(0, 0, 0, 0, 0, 0, 1, 0)
WaterPVP7 (PVP Solution)(0, 0, 0, 0, 0, 0, 0, 1)
Publisher’s Note: MDPI stays neutral with regard to jurisdictional claims in published maps and institutional affiliations.

