Article

Optimization and Internal Flow Analysis of Inlet and Outlet Horn of Integrated Pump Gate

1
College of Engineering, Anhui Agricultural University, Hefei 230036, China
2
Suqian Branch of Jiangsu Water Source Company of South to North Water Diversion, Suqian 223800, China
*
Author to whom correspondence should be addressed.
Processes 2022, 10(9), 1753; https://doi.org/10.3390/pr10091753
Submission received: 8 August 2022 / Revised: 20 August 2022 / Accepted: 22 August 2022 / Published: 2 September 2022
(This article belongs to the Topic Latest Developments in Fluid Mechanics and Energy)

Abstract

:
In order to improve the hydraulic performance of the integrated pump gate, the flow pattern of the inlet and outlet of the pump gate is improved. This paper adopts the SST k-ω turbulence model to numerically calculate the initial scheme of the integrated pump gate, verifies its internal flow pattern through experiments, then adds and optimizes the design of the inlet and outlet horn pipes of the integrated pump gate through orthogonal optimization. The research results conclude that the hydraulic performance of the integrated pump gate is significantly improved after adding the inlet and outlet horn. Under the design flow condition (Qd = 11.5 L/s), the efficiency of the pump gate increased from 60.50% to 67.19%, the head increased from 2.7569 m to 3.1178 m, the hydraulic loss in the inlet channel decreased from 0.064 m to 0.027 m, and the hydraulic loss in the outlet channel decreased from 1.337 m to 1.027 m. The optimized trumpet pipe can improve the inlet conditions of the pump while weakening the vortices in the outlet channel, thus improving the efficiency and safety of the integrated pump gate. The research results of this paper are of reference value for similar projects.

1. Introduction

In recent years, with the increasing flood control and drainage requirements, pump stations are required not only to achieve energy saving and emission reduction but also to improve their emergency performance, save land resources and high-speed construction. The asymmetric distribution of traditional pumping stations leads to a small cross-sectional area of overflow in the same civil construction area, which reduces the efficiency of land use; the integrated pump gate changes the form of the traditional combination of gate and station and has the characteristics of a small footprint, short construction period and a high degree of automation. It comprises gates, through-flow pumps, clapper gates, water stopping structures, opening and closing mechanisms and inflow structures. The integrated pump gate has been used to a certain extent as it reduces the civil construction investment and, at the same time, has an outstanding flood control and drainage capacity.
However, there are fewer related studies and even fewer directly related to their optimal design. For example, Chen Wei [1] used ANSYS software to investigate the influence of pump form, installation quantity, overhang height, pump spacing and flapper gate angle on the performance of integrated pump gates by using CFD numerical calculation method, taking a local integrated pump gate as the research object, which provided basic data for subsequent pump gate selection, etc. You Wu et al. [2] used RNG k-ε to obtain the influence of different bottom edge structures on the flow pattern as studied by numerical calculation. The results show that only the gate with flat bottom always has a negative pressure zone just below the bottom edge, and there is no obvious negative pressure zone in the other three structures. In addition to the gate structure, the main components of the integrated pump gate are the cross-flow pump and the inlet and outlet guide structures. Some scholars have conducted research on the optimization of the structure of the cross-flow pump [3,4,5,6,7,8,9,10,11,12], which has improved its hydraulic performance and analysed the influence of the structural parameters on its performance. Some researchers analysed the energy characteristics, cavitation characteristics and stall characteristics of the cross-flow pump device [13]. Some scholars also analysed the cross-flow pump’s internal flow and pressure pulsation characteristics, employing pressure fluctuation data [14] and vane passage frequency [15]. Others applied fluid–solid coupling [16] and finite element methods [17] to analyse the structural vibration [18] and dynamic characteristics [19]. For the inlet and outlet horn of the pump unit, scholars have carried out an optimised design to investigate the influence of the horn tube height (H) on the uniformity of the impeller inlet flow rate and the operational stability of the pump unit [20].
At present, the integrated pump gate has been more widely used, but there is a lack of research on the optimization design; this paper reveals the internal flow and energy characteristics of the original scheme of the integrated pump gate and builds a test bench to carry out visualization, this paper reveals the internal flow and energy characteristics of the original scheme of the integrated pump gate, and builds a test bench for visualization and verification of the flow pattern, and then optimizes the design of the integrated pump gate through the orthogonal optimization method expecting to improve its operation flow pattern, enhance the pump gate efficiency, and guarantee the efficient, stable and safe operation of the integrated pump gate.

2. Model Building, Meshing and Calculation Methods

2.1. Pump Gate Model

According to the construction needs of a project for an integrated pump gate, this paper designed the cross-flow pump, gate structure and inlet and outlet structure, etc. It then used SolidWorks to establish the integrated pump gate model and as shown in Figure 1. The Geometry module in ANSYS Workbench software [21] was imported for further adjustment of the model and naming of boundary conditions. In this paper, the impeller diameter of the cross-flow pump is D = 60 mm and the speed n = 6692 r/min.

2.2. Meshing

In the calculation of this paper, the integrated pump gate is a table-hole type; in order to better retain the characteristics of the pump gate surface, the model is meshed with an unstructured grid, and under the design flow condition (Qd = 11.5 L/s), the grid-independent analysis is carried out by changing the number of grids, when the number of grids reaches 3,035,460, the pump gate efficiency basically does not change with the number of grids. Grid-independent efficiency calculation is shown in Table 1. The grid number is determined as 3,035,460 for the subsequent numerical calculation. Grid division is shown in Figure 2.

2.3. Control Equations, Boundary Conditions and Calculation Methods

In this paper, the SST k-ω turbulence model is used to calculate and optimise the internal flow characteristics of the integrated pump gate. The turbulence model combines the advantages of the standard k-ε model [22] and the standard k-ω model [23], and the flow in the boundary layer is better captured by using the automatic functions in the boundary layer. In addition, the finite volume method based on finite elements is used for the solution.
The numerical calculation of the integrated pump gate uses Mass Flow Inlet, mean Static Pressure Outlet, Symmetric Boundary for the free liquid surface, Frozen Rotor method for the dynamic–static intersection, and None for the static–static intersection.
The head of the integrated pump gate is:
H n e t = s 2 P 2 u t d s ρ Q g + H 2 + s 2 u 2 2 u t 2 d s 2 Q g s 1 P 1 u t d s ρ Q g + H 1 + s 1 u 1 2 u t 1 d s 2 Q g ,
where: the first term on the right side of the equation is the total pressure at the outlet of the outflow channel, and the second term is the total pressure at the inlet of the inlet channel.
Where Q is the flow rate (m3/s); H1, H2 for the integrated pump gate into the water, the discharge section elevation (m); s1, s2 for the integrated pump gate into the water, the discharge section; u1, u2 for the integrated pump gate into the water, the discharge channel section at each point flow velocity (m/s); ut1, ut2 for the integrated pump gate into the water, the discharge channel section at each point flow velocity normal component (m/s); P1, P2 for the integrated pump gate P1, P2 is the static pressure (Pa) at each point of the inlet and outlet sections; g is the acceleration of gravity (m/s2).
The efficiency of the integrated pump gate is:
η = ρ g Q H n e t T p ω ,
where Tp is the torque (N-m); ω is the rotational angular speed of the impeller. The hydraulic loss hf is calculated by the formula.
h f = E 1 E 2 = ( P 1 ρ g P 2 ρ g ) + ( Z 1 Z 2 ) + ( u 1 2 2 g u 2 2 2 g ) ,
where:
E 1 = P 1 ρ g + Z 1 + u 1 2 2 g , E 2 = P 2 ρ g + Z 2 + u 2 2 2 g
where E1, E2 for the total energy at the inlet and outlet of the open flow channel; P1, P2 for the static pressure at the inlet and outlet of the open flow channel (Pa); Z1, Z2 for the inlet and outlet of the open flow channel height (m); u1, u2 for the inlet and outlet of the open flow channel water velocity (m/s); ρ for the water density (kg/m3); g for the acceleration of gravity (m/s2).

3. Test Instrumentation

The total length of the pump gate test bench is about 7.5 m, the total width is about 1.8 m, and the diameter of the circulating pipe is 0.1 m. The test bench is made of transparent plexiglass, which can visually show the flow state of the pump gate’s inlet and outlet water channels, the position of the vortex, and the distribution of the bad flow state. The 2D schematic diagram, 3D rendering, and real object of the test bench are shown in Figure 3 and Figure 4, respectively.
The test flow using an electromagnetic flowmeter (brand: KAIFENG CENTRAL CONTROL INSTRUMENT, model: ZEF-DN100, range: 0–120 m3/h, accuracy: ±0.5%, protection level IP65) can be used for the real-time monitoring of the instantaneous flow rate and flow rate of the entire test device with good reliability. The sealing also has a small head loss, strong anti-interference ability and works reliably. The rotational speed using laser tachometer (brand: LOXSON, model: DT-2234C, range: 2.5–99,999 r/min, accuracy: ±0.05%) built-in quartz crystal timer, measurement method using non-contact laser type, the display is accurate, intuitive and portable. The flow pattern using a high-speed camera (brand: JAPAN OLYMPUS, model: OLYMPUS i-SPEED 3, 2000 fps full resolution, up to 150,000 fps, accuracy: ±1μs) with ultra-sensitive sensitivity; the 1 μs full-field exposure electronic shutter can control the depth of focus and focus of the lens, with the highest recording speed at 150,000 fps.
In this test, we first adjusted the integrated pump gate to the rated speed n = 6692 r/min. We then adjusted the flow rate of the integrated pump gate inlet by controlling the booster pump7, adjusted to the design flow rate (Qd = 11.5 L/s) and then took a high-speed camera shot integrated pump gate inlet, and outlet water flow state.

4. Orthogonal Optimization Analysis

4.1. Orthogonal Table

The pump gate inlet and outlet horn pipes are sized by the following parameters: impeller diameter D, horn pipe height HL, horn pipe inlet diameter DL, straight pipe length Ht, where the impeller diameter D = 60 mm, as shown in Figure 5. Therefore, the orthogonal table with four factors and three levels was chosen to be used in this paper, and one column was left as the error column. That is, L9 (34). L9 (34) has a total of nine schemes, including error columns with a total of four columns. Each column has three levels of orthogonal tables.
In this paper, we selected three factors, namely, horn pipe height HL, horn pipe inlet diameter DL, and straight pipe length Ht, to study the influence law of inlet and outlet horn on hydraulic performance and internal flow characteristics of integrated pump gate, and explored the major and minor factors affecting hydraulic performance. The orthogonal optimization was selected from the L9 (34) orthogonal table with four factors and three levels, the factors and levels are shown in Table 2, and the scheme is shown in Table 3, where the factor codes A, B, and C represent the horn pipe height HL, horn pipe inlet diameter DL, straight pipe length Ht, D is the error column, and the pump gate efficiency was selected as the evaluation index.
Based on Table 4, the horn pipe models under nine schemes were established, respectively, as shown in Figure 6, and numerical calculations were performed under the design flow condition (Qd = 11.5 L/s), and the results were extracted and analyzed, as shown in Table 5.

4.2. Results and Analysis

4.2.1. Pump Gate Energy Characteristics and Results Analysis

The pressure and torque are extracted from the result file obtained from the simulation, the pump gate head is calculated according to Equation (1), and the pump gate efficiency is calculated according to Equation (2) to obtain the integrated pump gate energy performance, as shown in Table 5.
In this paper, the results of orthogonal optimization are analyzed using the intuitive analysis method, also known as the extreme difference analysis method, where the extreme difference is the difference between the maximum and minimum values of the mean of the sum of the levels; that is, R = max{k1, k2, k3, k4} − min{k1, k2, k3, k4}. In the intuitive analysis method, the extreme difference reflects the degree of influence of the factor on the efficiency of the integrated pump gate. The larger the value, the greater the influence of the factor on the efficiency of the pump gate. As can be seen from Table 5, the order of influence of the extreme difference of each influencing factor on the efficiency of the integrated pump gate is C > B > A; that is, the straight pipe length 
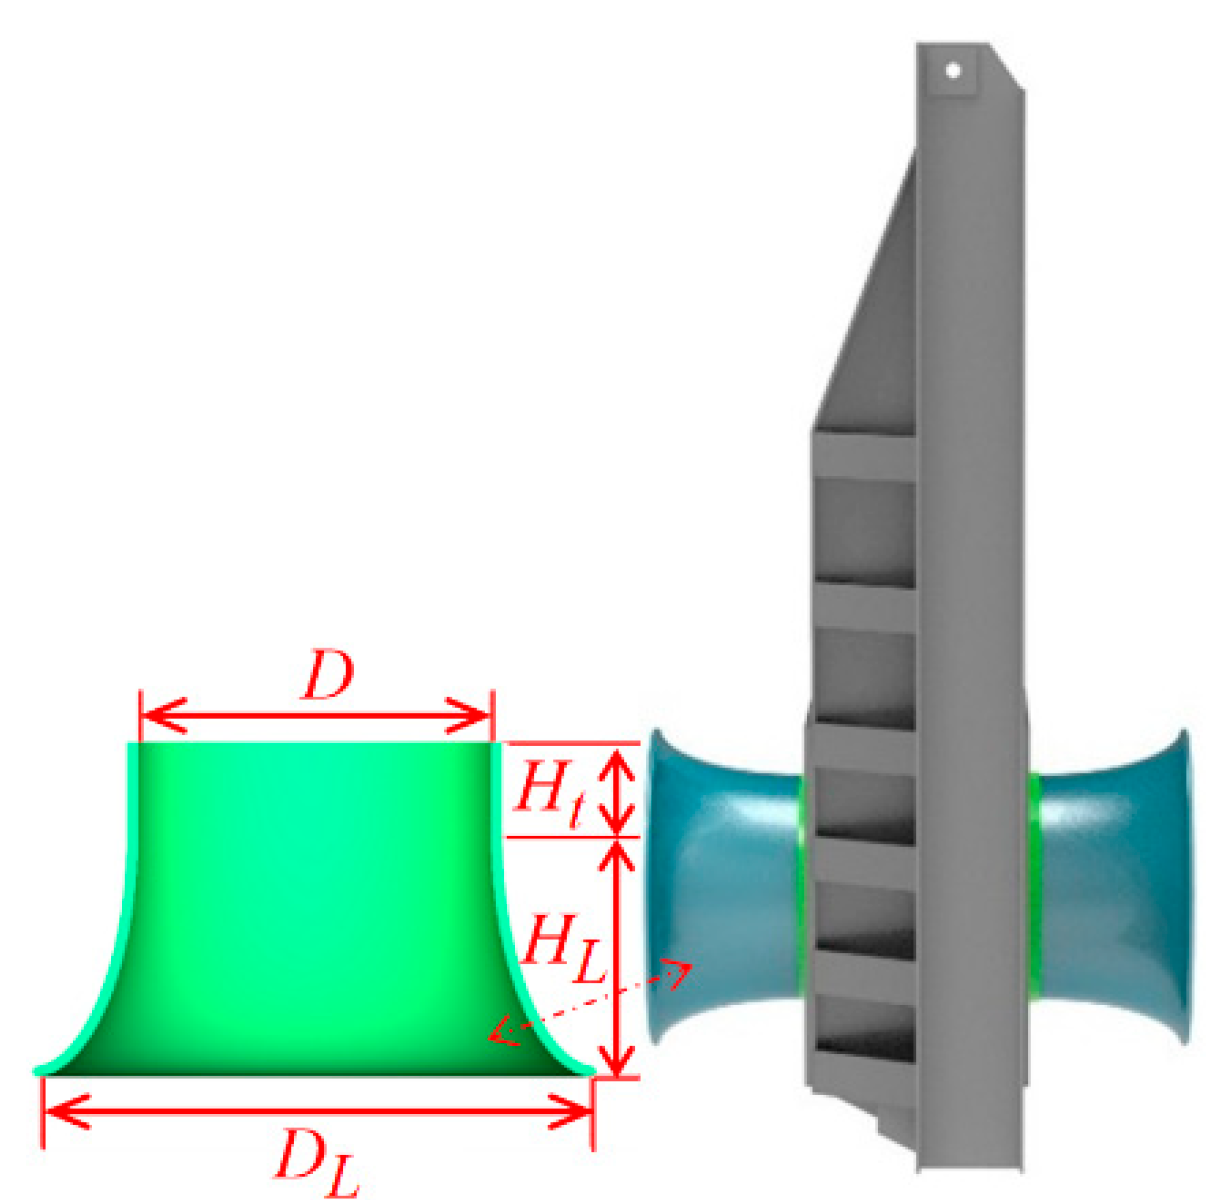
Ht is the main factor, the horn pipe inlet diameter DL is the general factor, and the horn pipe height HL is the secondary factor.
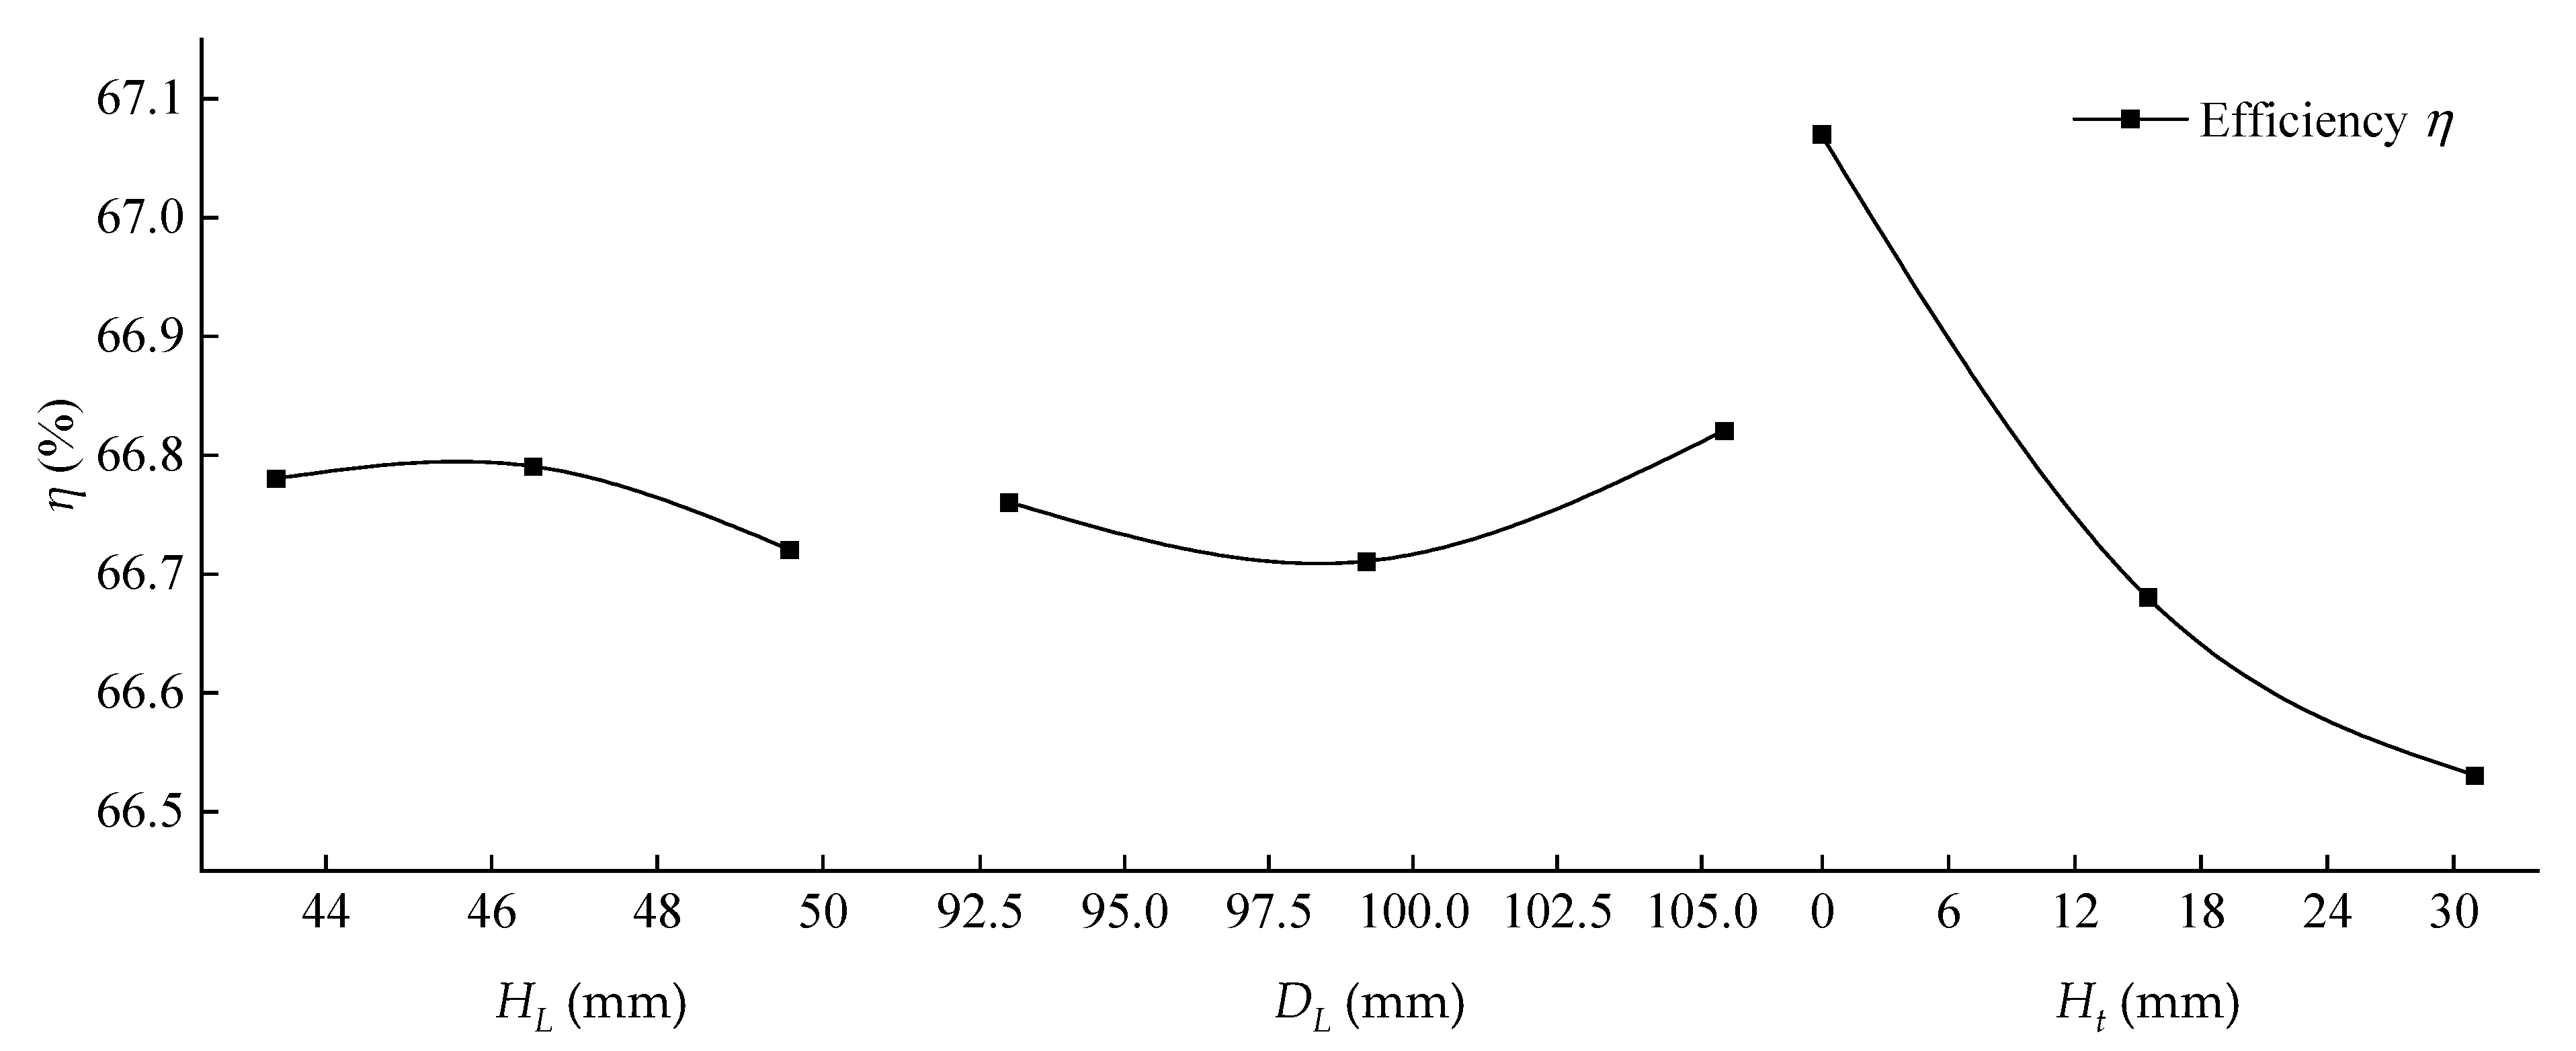
To further analyze the trend of the influence of each influencing factor on improving the efficiency of the integrated pump gate, the trend was plotted using the level of each factor as the horizontal coordinate and the average of the sum of the level results of each factor as the vertical coordinate, as shown in Figure 7.
As can be seen from Figure 7, the effect of each influencing factor on the efficiency is not exactly the same; as the horn pipe height HL increases, the pump gate efficiency increases and then decreases, reaching a maximum at a horn pipe height HL of 46.5 mm (0.75 D); as the horn pipe inlet diameter DL increases, the pump gate efficiency decreases and then increases, reaching a maximum at a horn pipe inlet diameter DL of 105.4 mm (1.7 D). With the increase of the straight pipe length Ht, the pump gate efficiency decreases continuously and reaches the maximum when the straight pipe length Ht is 0 (0 
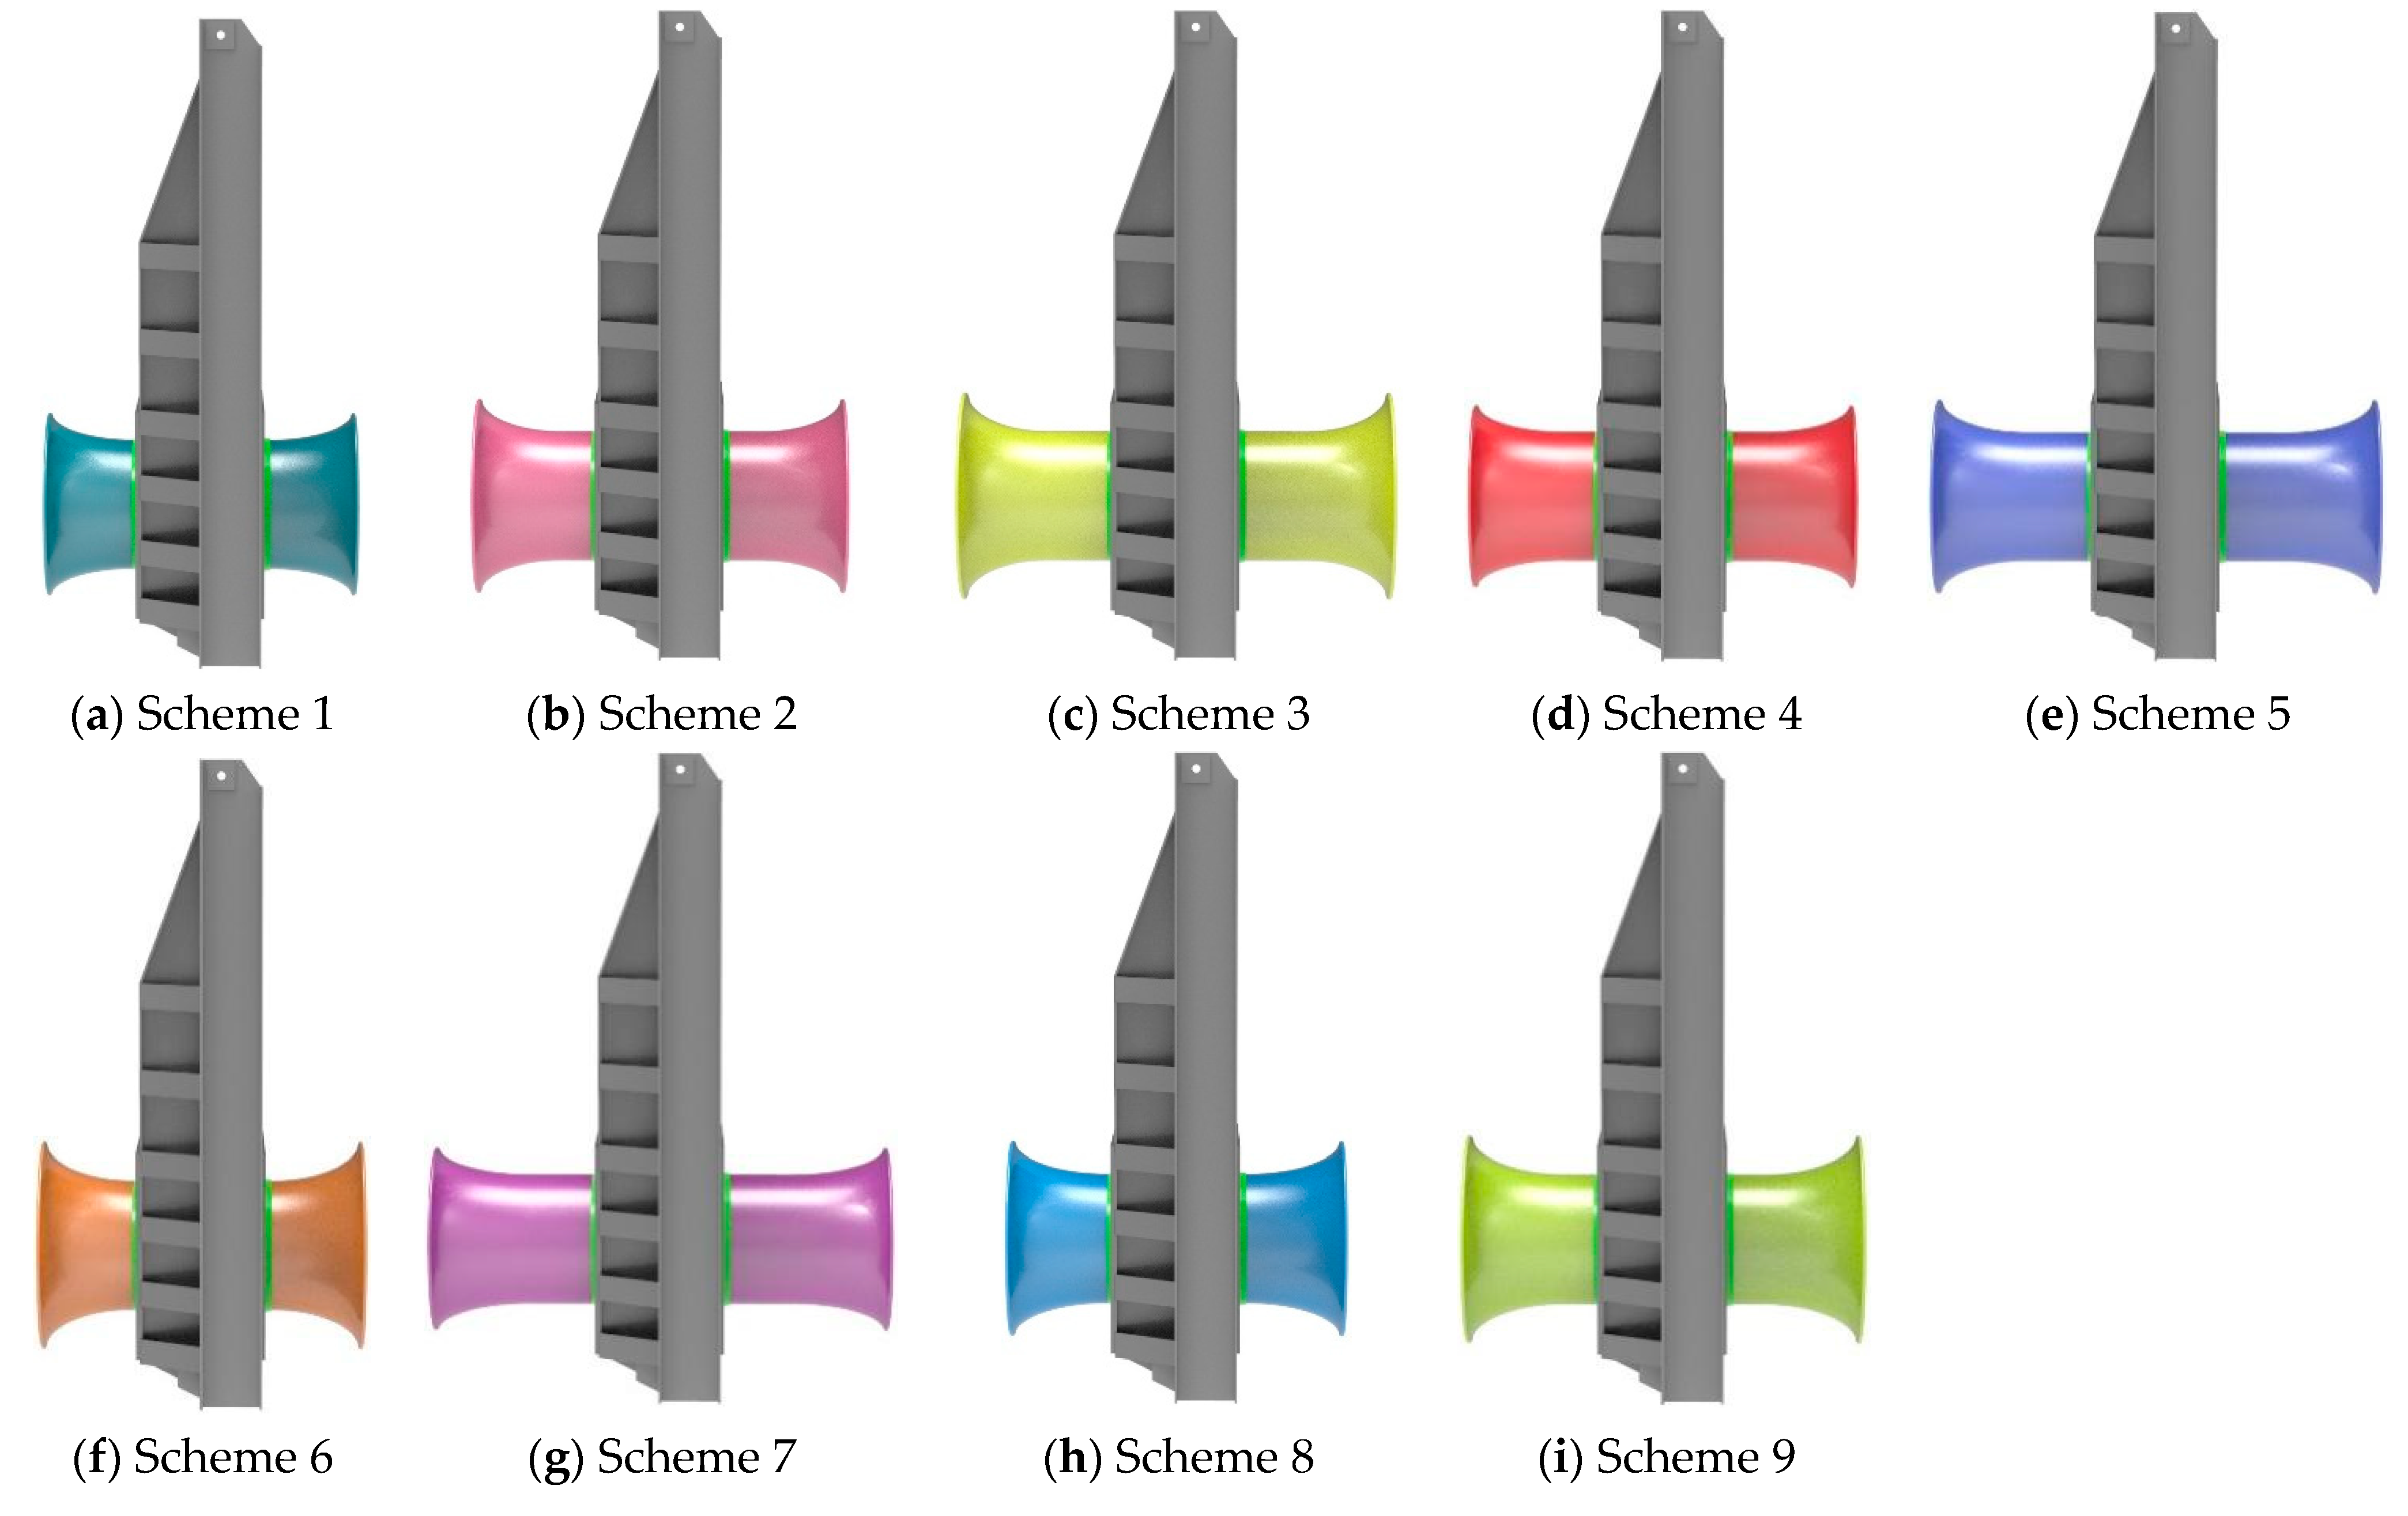
D). Through the analysis, it is determined that the best scheme is Scheme 6, under which the efficiency of the integrated pump gate is 67.19% under the design flow condition. The corresponding head is 3.1178 m, compared with the original scheme before optimization, the efficiency is increased by 6.69%, and the head is increased by 0.3609 m.
Both the direct observation method and the visual analysis method were compared, and Scheme 6 was found to be the best scheme, so the internal flow analysis was carried out with this scheme.

4.2.2. Internal Flow Characteristics Analysis

  • Pump gate inlet channel streamline and axial flow velocity distribution.
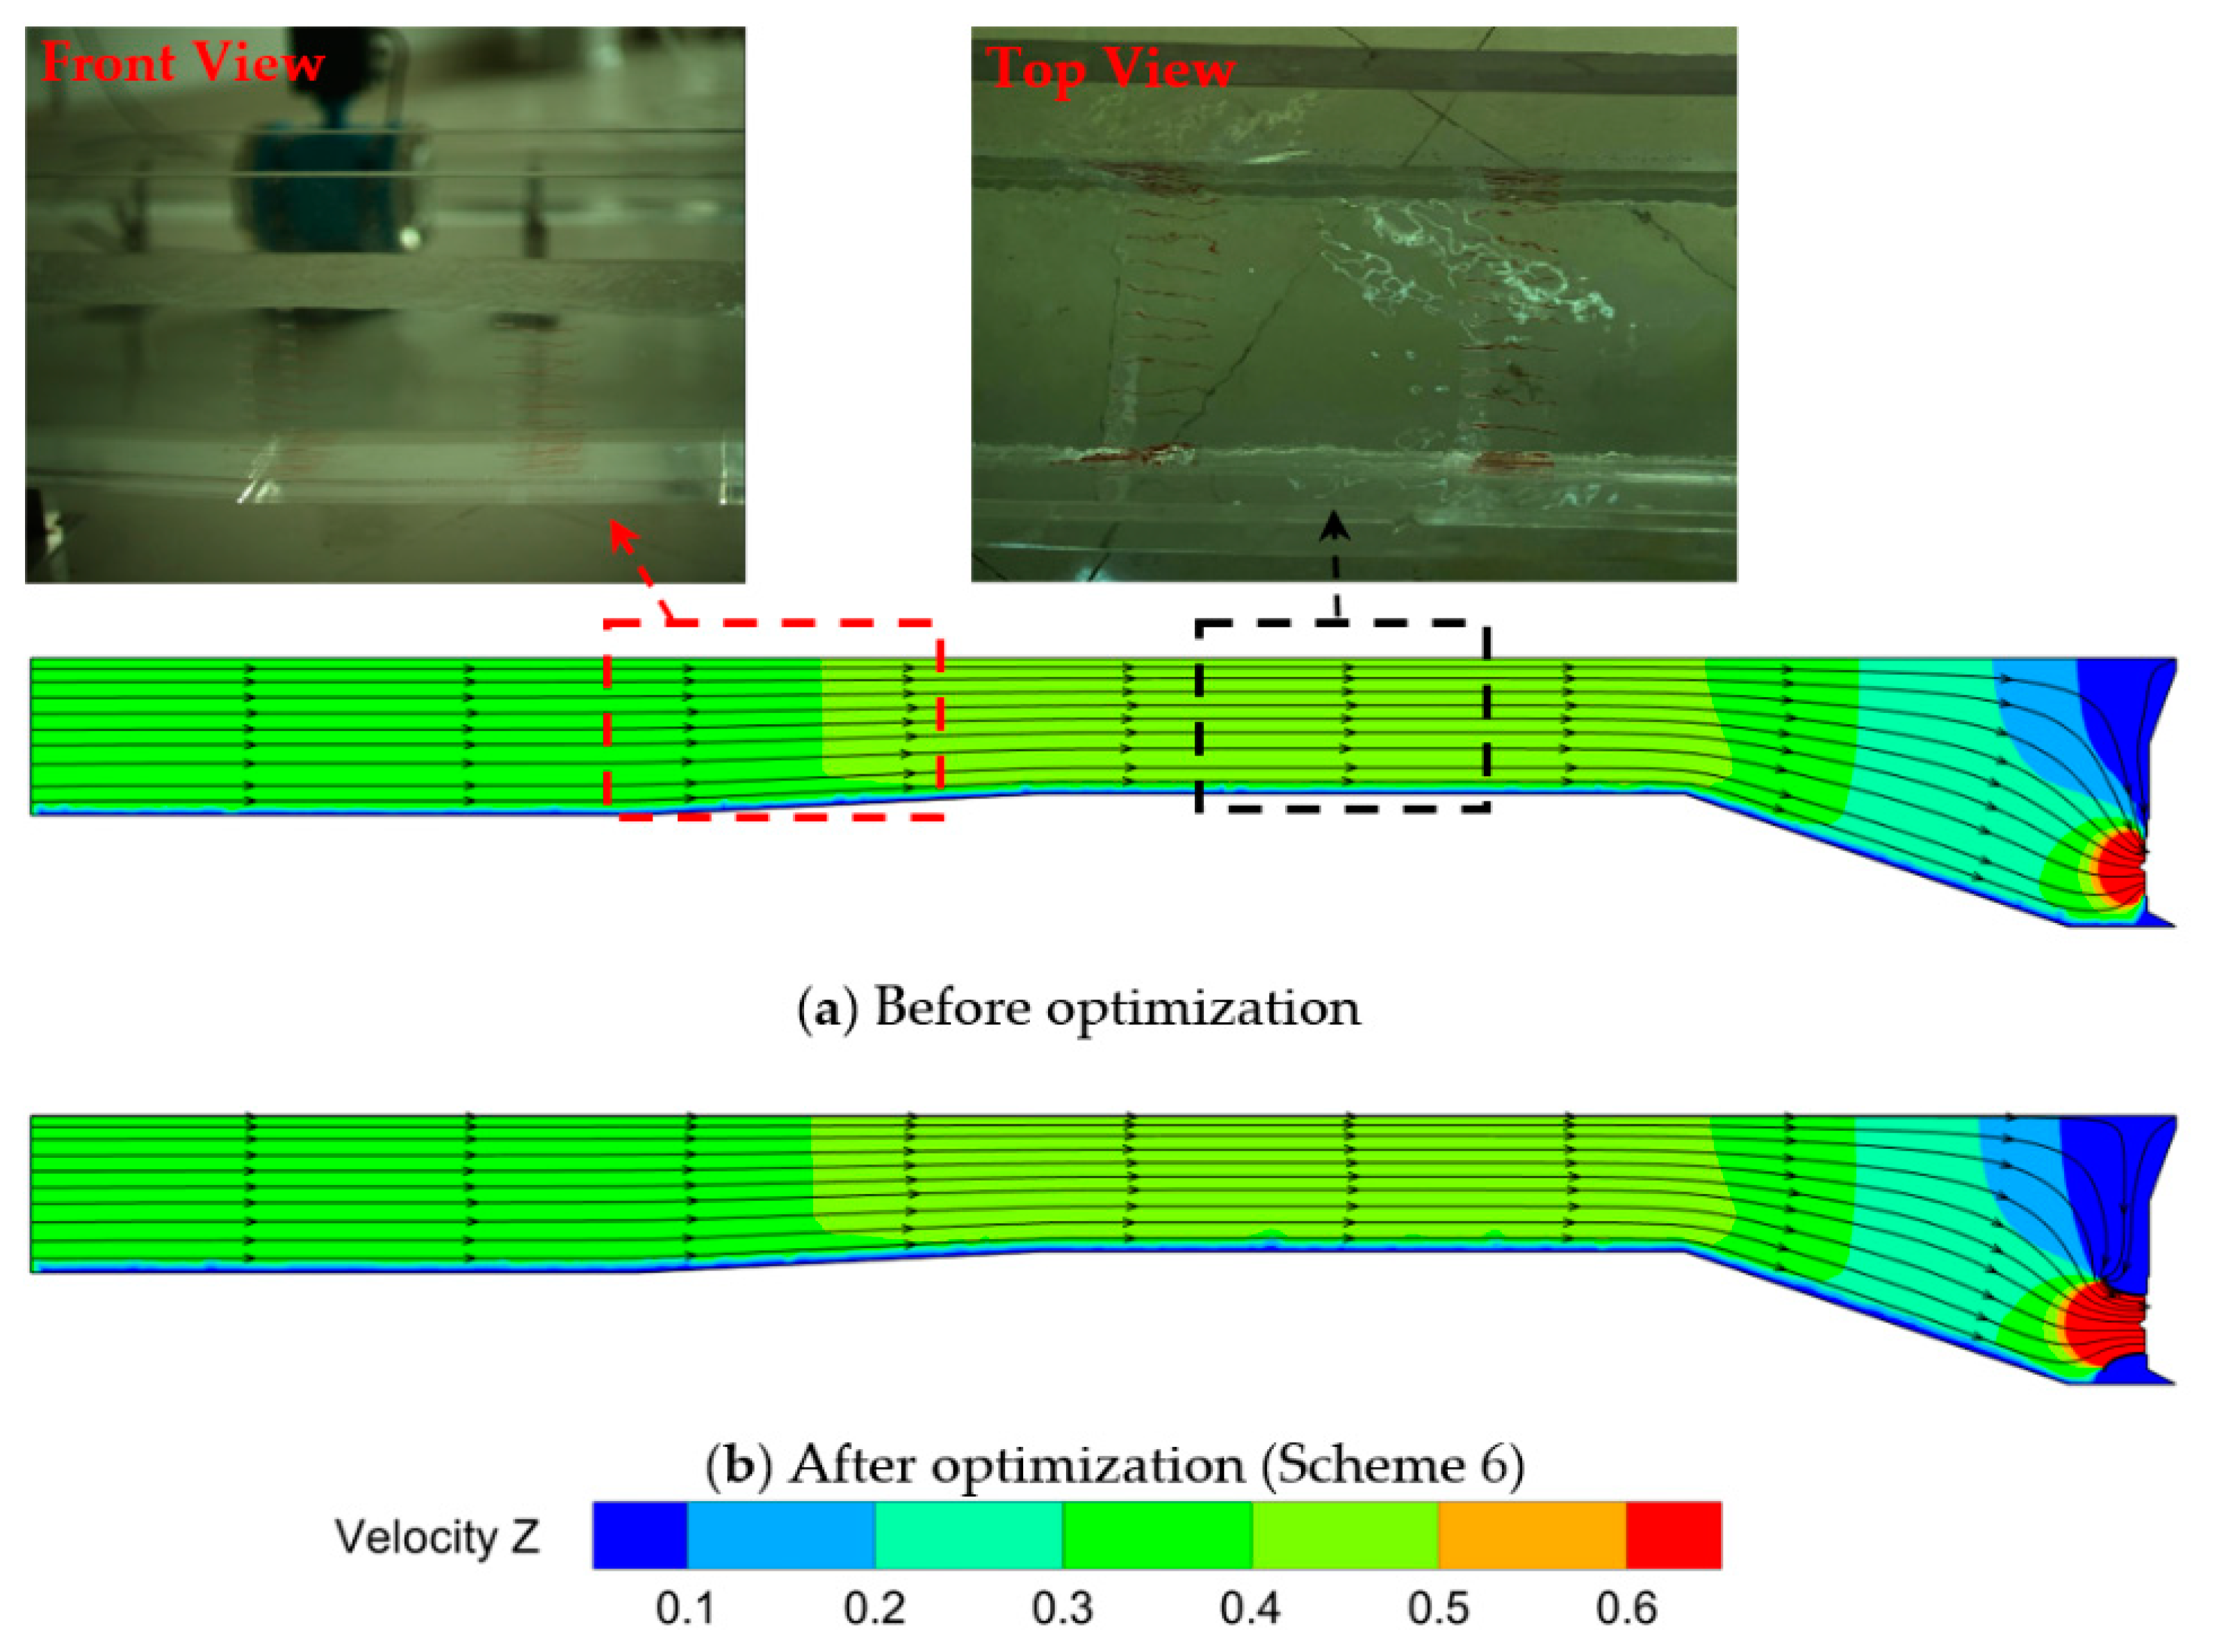
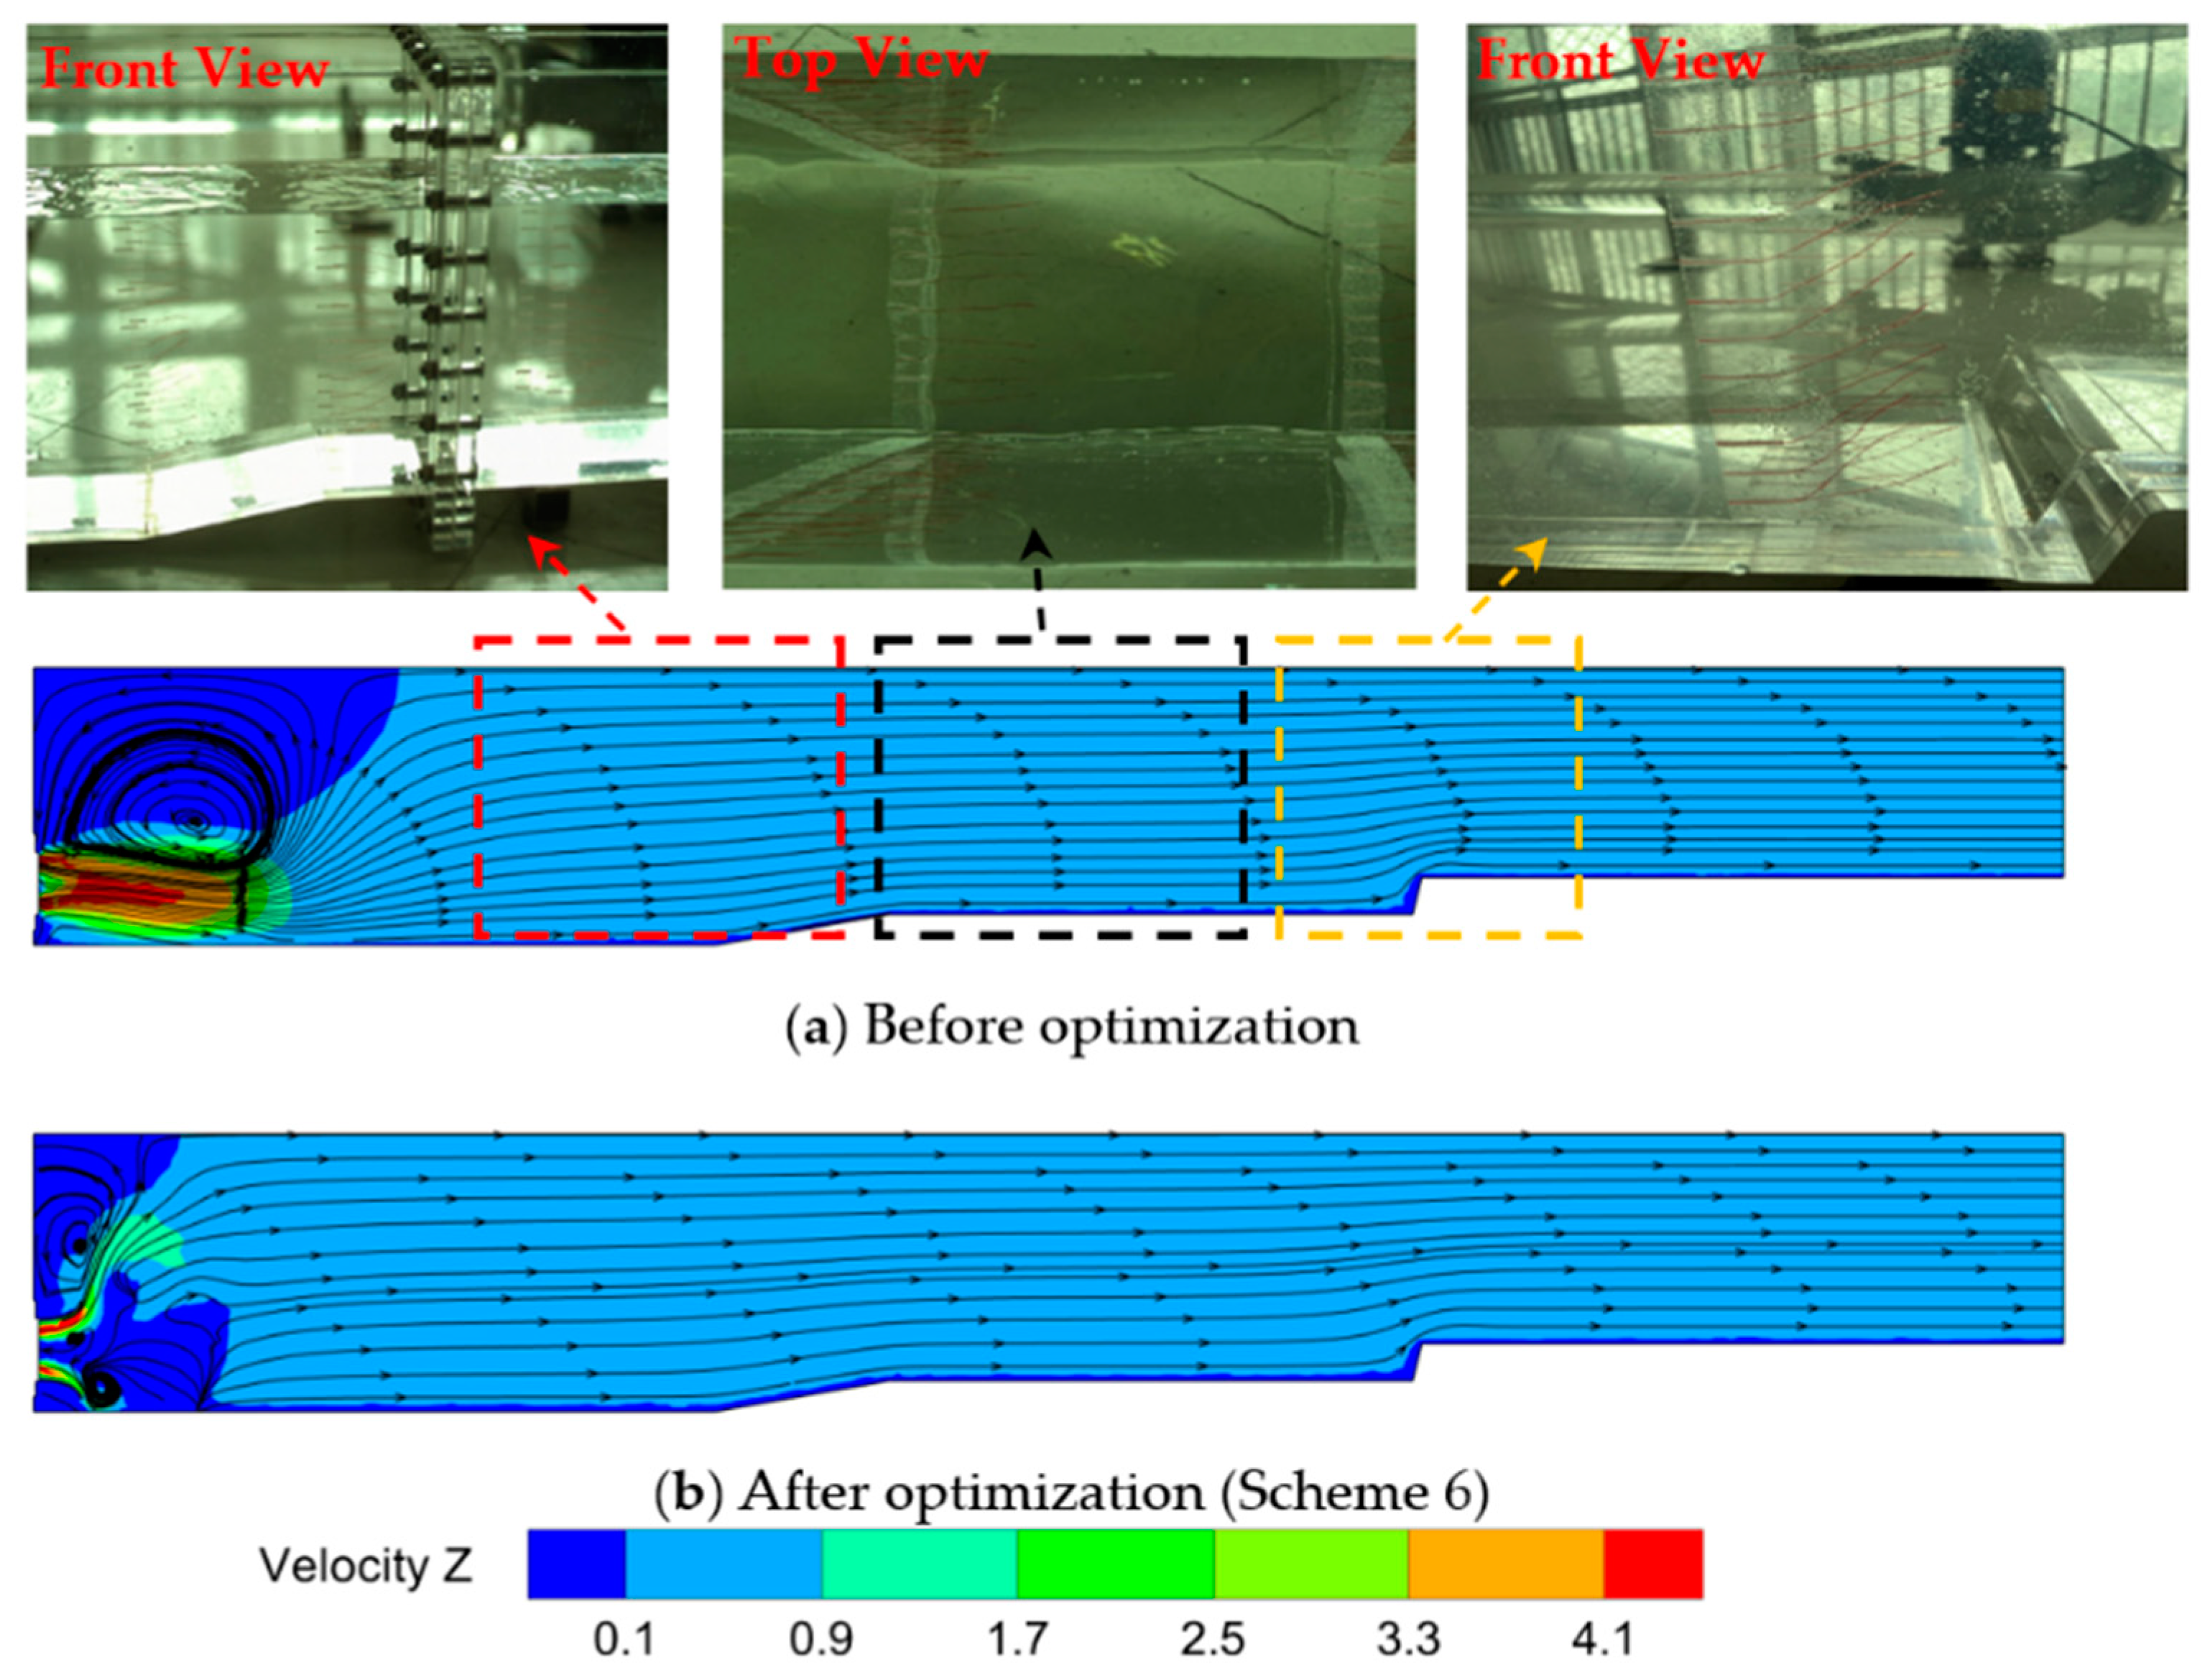
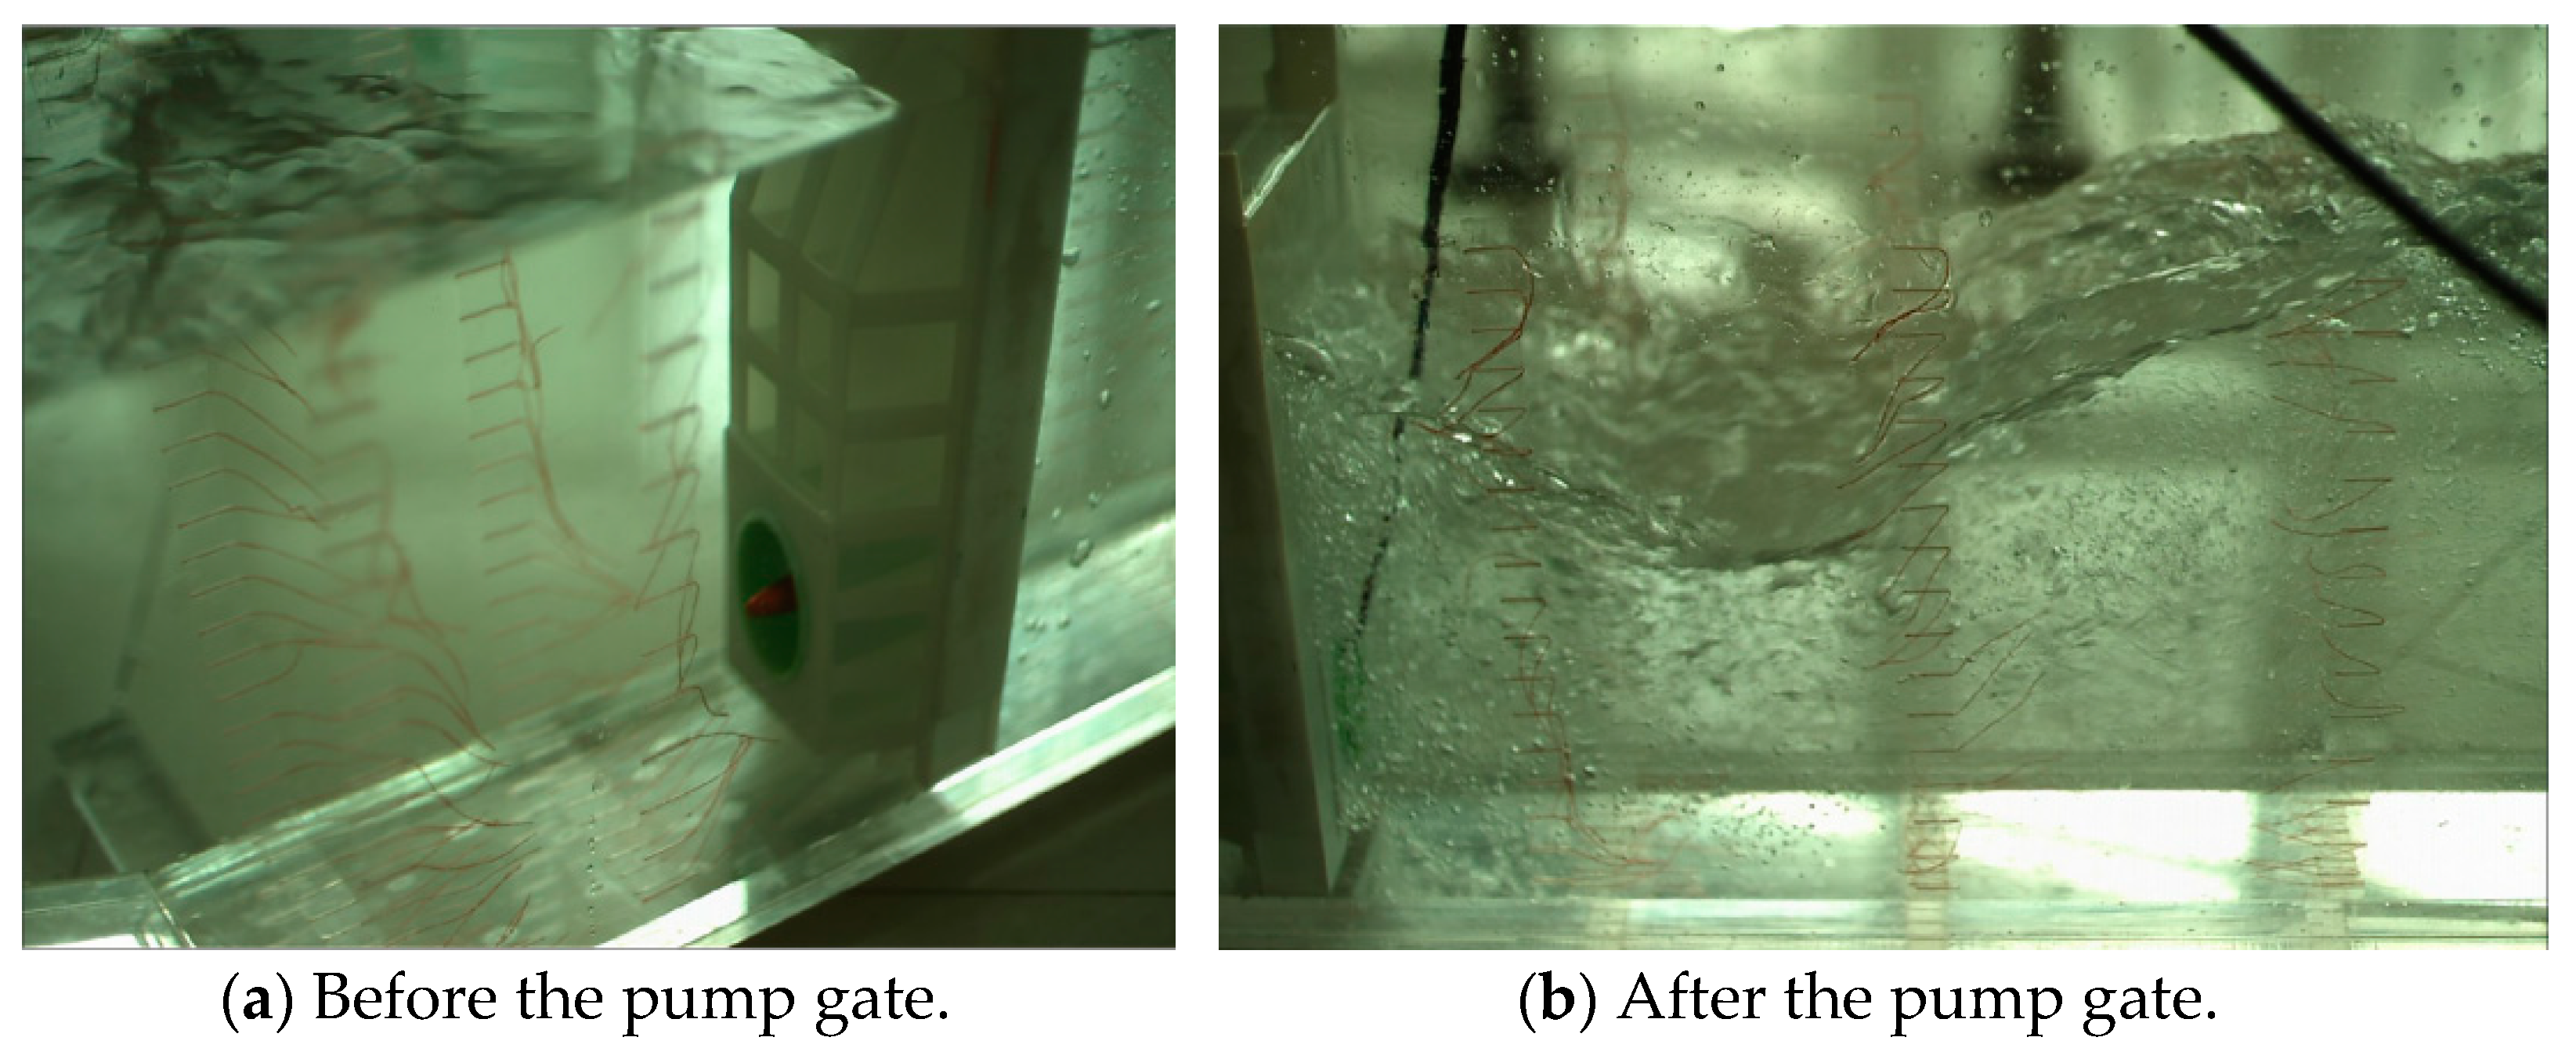
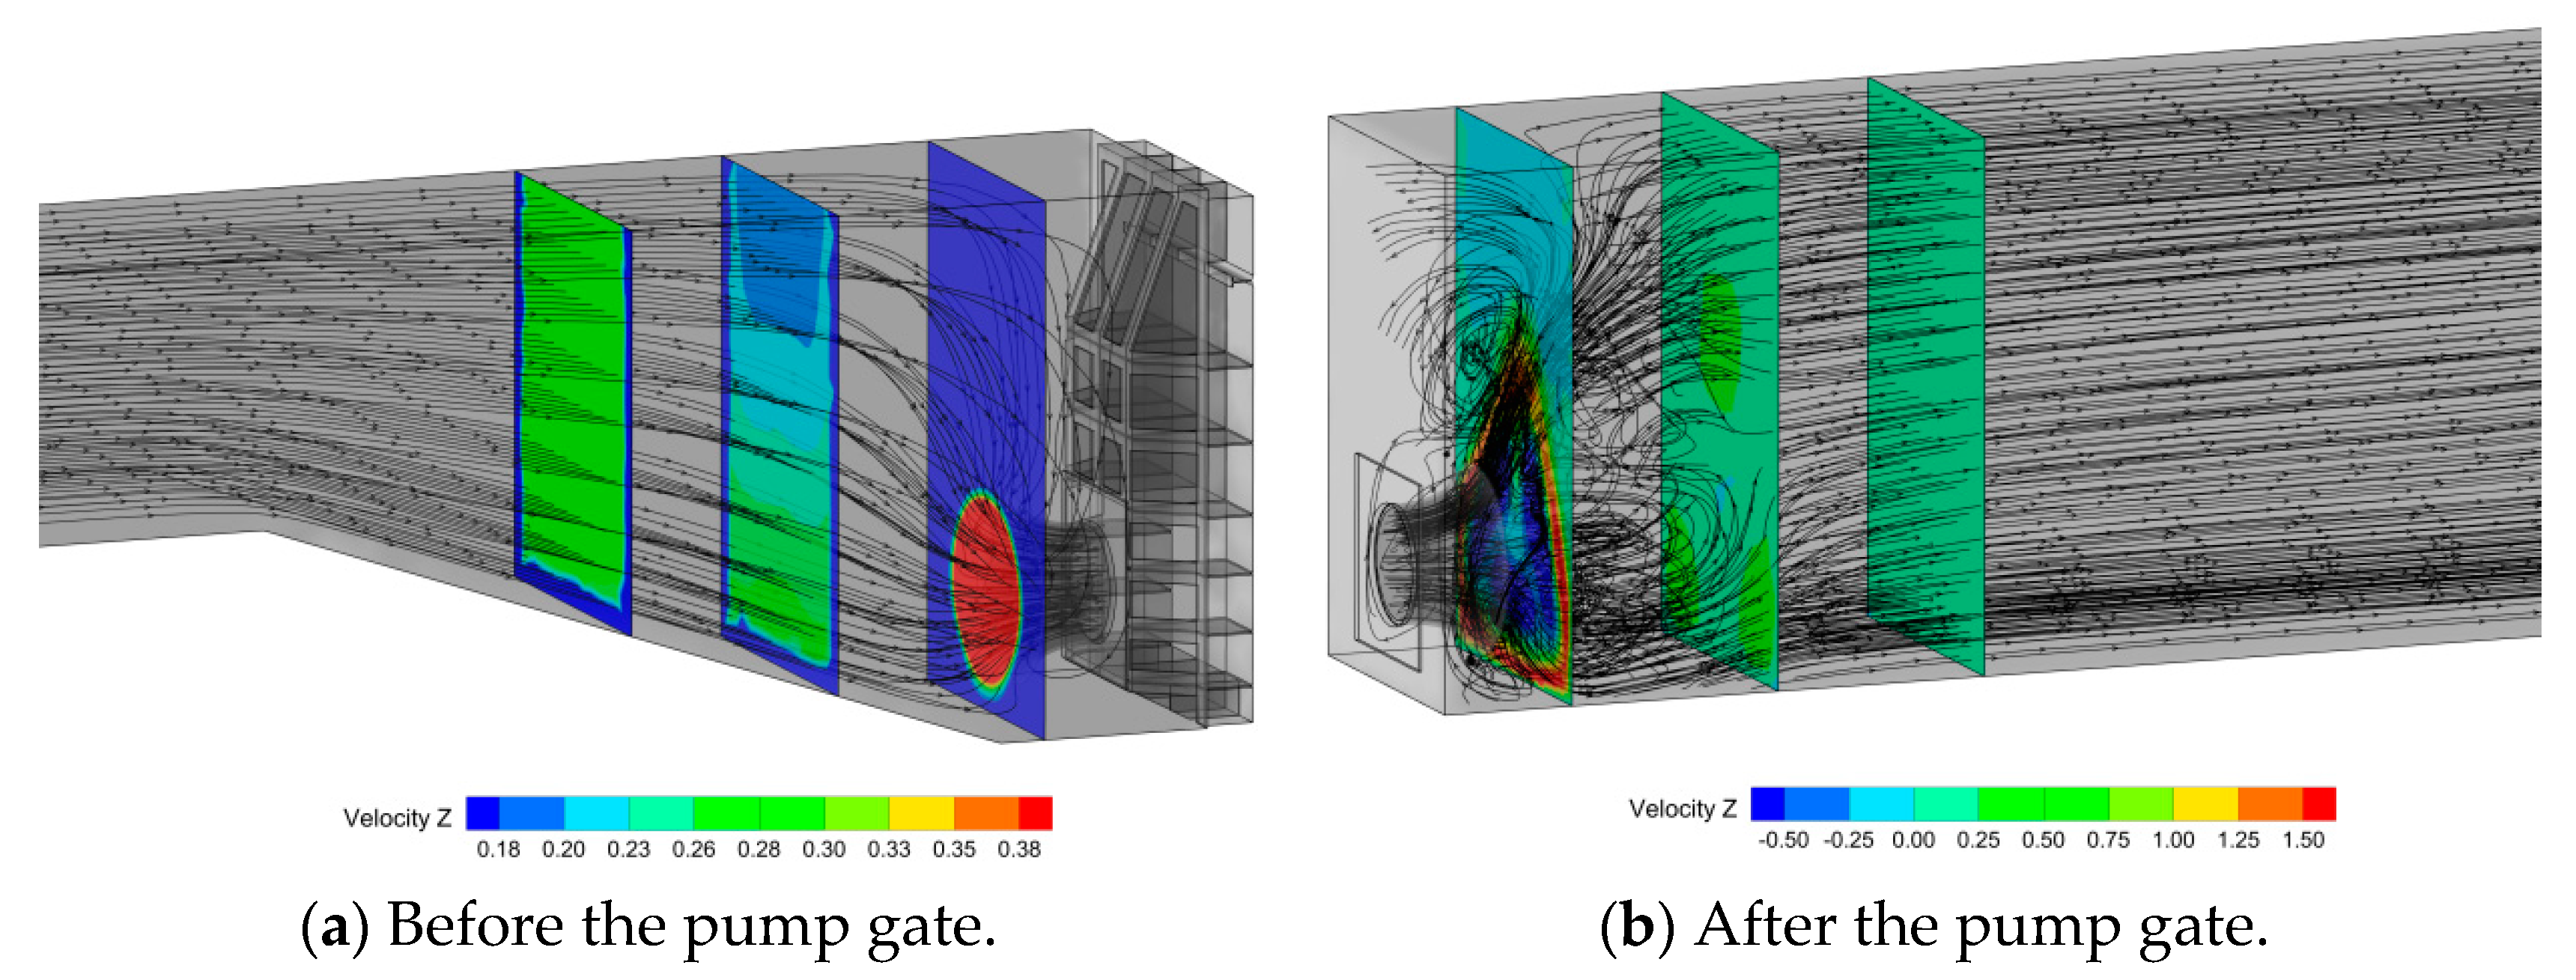
Select the pump gate inlet channel inlet to the pump gate inlet in the middle section, and draw the profile before and after the optimization of the pump gate inlet streamline and axial flow velocity distribution clouds, as shown in Figure 8.
Figure 8 shows that the numerical calculation and test before optimization show that the streamline in the inlet channel of the pump gate is smooth. After adding the horn pipe in front of the pump gate, it has less effect on the flow characteristics of the front and middle sections of the inlet channel. The axial flow velocity in the near-wall area of each scheme is still low, but it will change the flow pattern in front of the gate, making the inlet streamline contraction more uniform and the streamline smoother; at the same time, the existence of the horn pipe makes the area of high axial flow velocity at the inlet increase, which obviously improves the pump inlet efficiency. The flow velocity transition is regular and distributed more reasonable.
2.
Streamline and axial velocity distribution of outlet passage of pump gate.
Select the middle section from the outlet of the pump gate to the outlet of the outflow channel, and draw a cloud diagram of the outflow line and axial flow velocity distribution of the pump gate before and after optimization in the section, as shown in Figure 9.
As shown in Figure 9, both numerical calculations and tests before optimization show that the streamlines in the second half of the pump gate outlet channel return to parallel. The existence of the horn pipe makes the high axial flow velocity area at the outlet of the pump gate in the original scheme significantly reduced, and only exists near the side wall of the horn pipe. The existence of the horn pipe makes the huge return vortex at the outlet of the pump gate disperse into two smaller vortices, which are located near the mid-upper and the bottom of the flow channel. In addition, the streamlines return to the parallel state earlier than the original solution. The outlet horn significantly improved in terms of flow characteristics in the outlet channel.
3.
Hydraulic loss of inlet and outlet channels of pump gate.
Based on Bernoulli’s equation, the total energy difference between the inlet section and outlet section of the inlet and outlet channels were extracted after optimization, and the hydraulic losses were calculated according to Equation (3) and compared with those before optimization, as shown in Table 6.
According to the calculation results, it can be seen that under the design flow condition, the horn pipe installed in Scheme 6 reduces the hydraulic loss in the inlet channel and outlet channel compared with the original scheme, and the hydraulic loss in the inlet channel is reduced by 0.037 m. The hydraulic loss in the outlet channel is reduced by 0.31 m, which is because the horn pipe obviously improves the vortex condition in the outlet channel and improves the inlet efficiency to a certain extent, thus reducing the hydraulic loss in the flow channel.
4.
Streamline and pressure distribution at pump gate inlet.
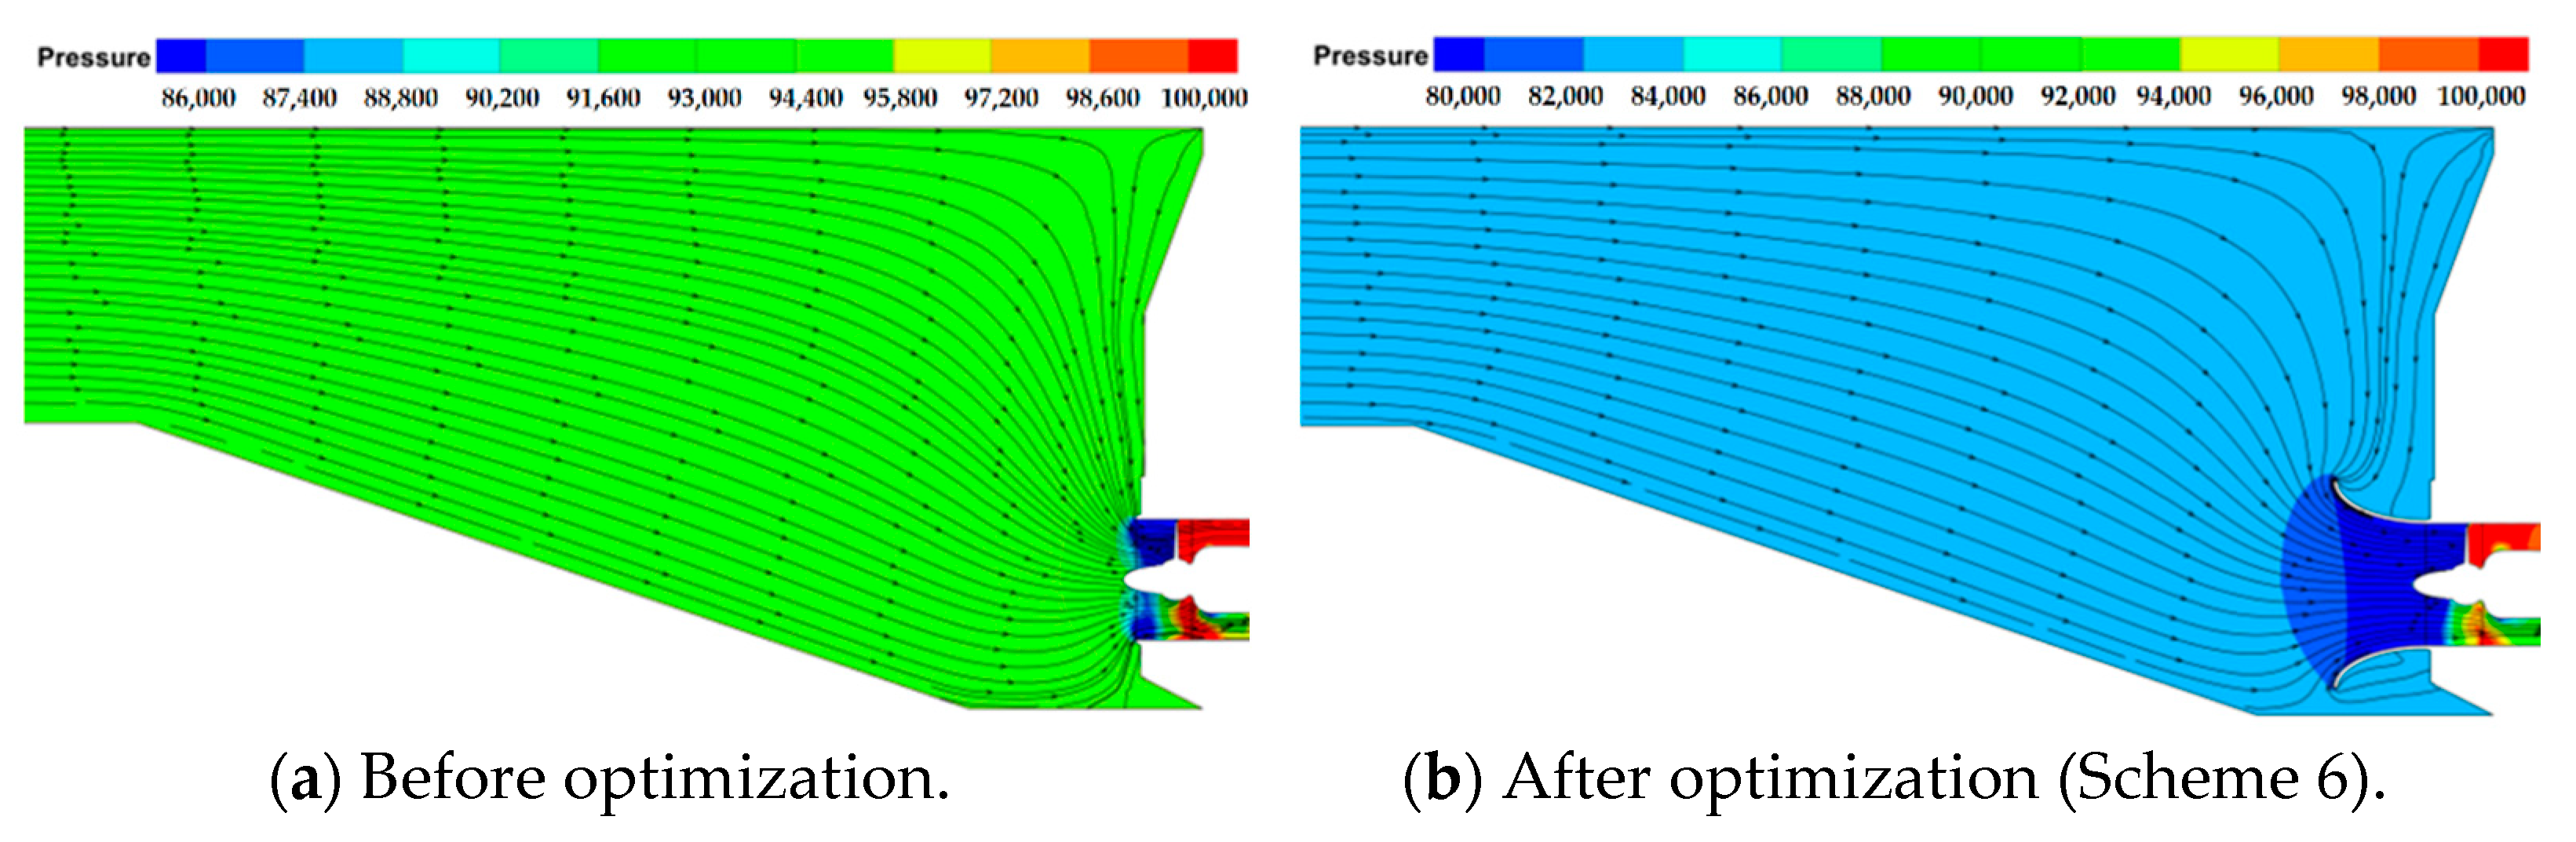
Select the inlet of the pump gate in the middle of the profile, and draw the profile before and after the optimization of the open inlet flow channel pump gate inlet streamlines and the pressure distribution cloud map, as shown in Figure 10.
The comparative analysis in Figure 10 shows that the pressure in the flow channel is lower than the original scheme before optimization after the addition of the horn pipe. The pressure transition at the inlet of the pump gate is more uniform and reduced in a gradient. This is because the tubular pump has a good over-water efficiency, which leads to an increase in the flow rate of the inlet water and a decrease in the pressure in the inlet channel. The horn pipe installed in front of the pump gate can also improve the efficiency of the integrated pump gate to a certain extent. Thus, when the conditions allow, it is recommended to install a horn pipe in front of the pump gate to guide the flow and improve the inlet ability of the tubular pump.
5.
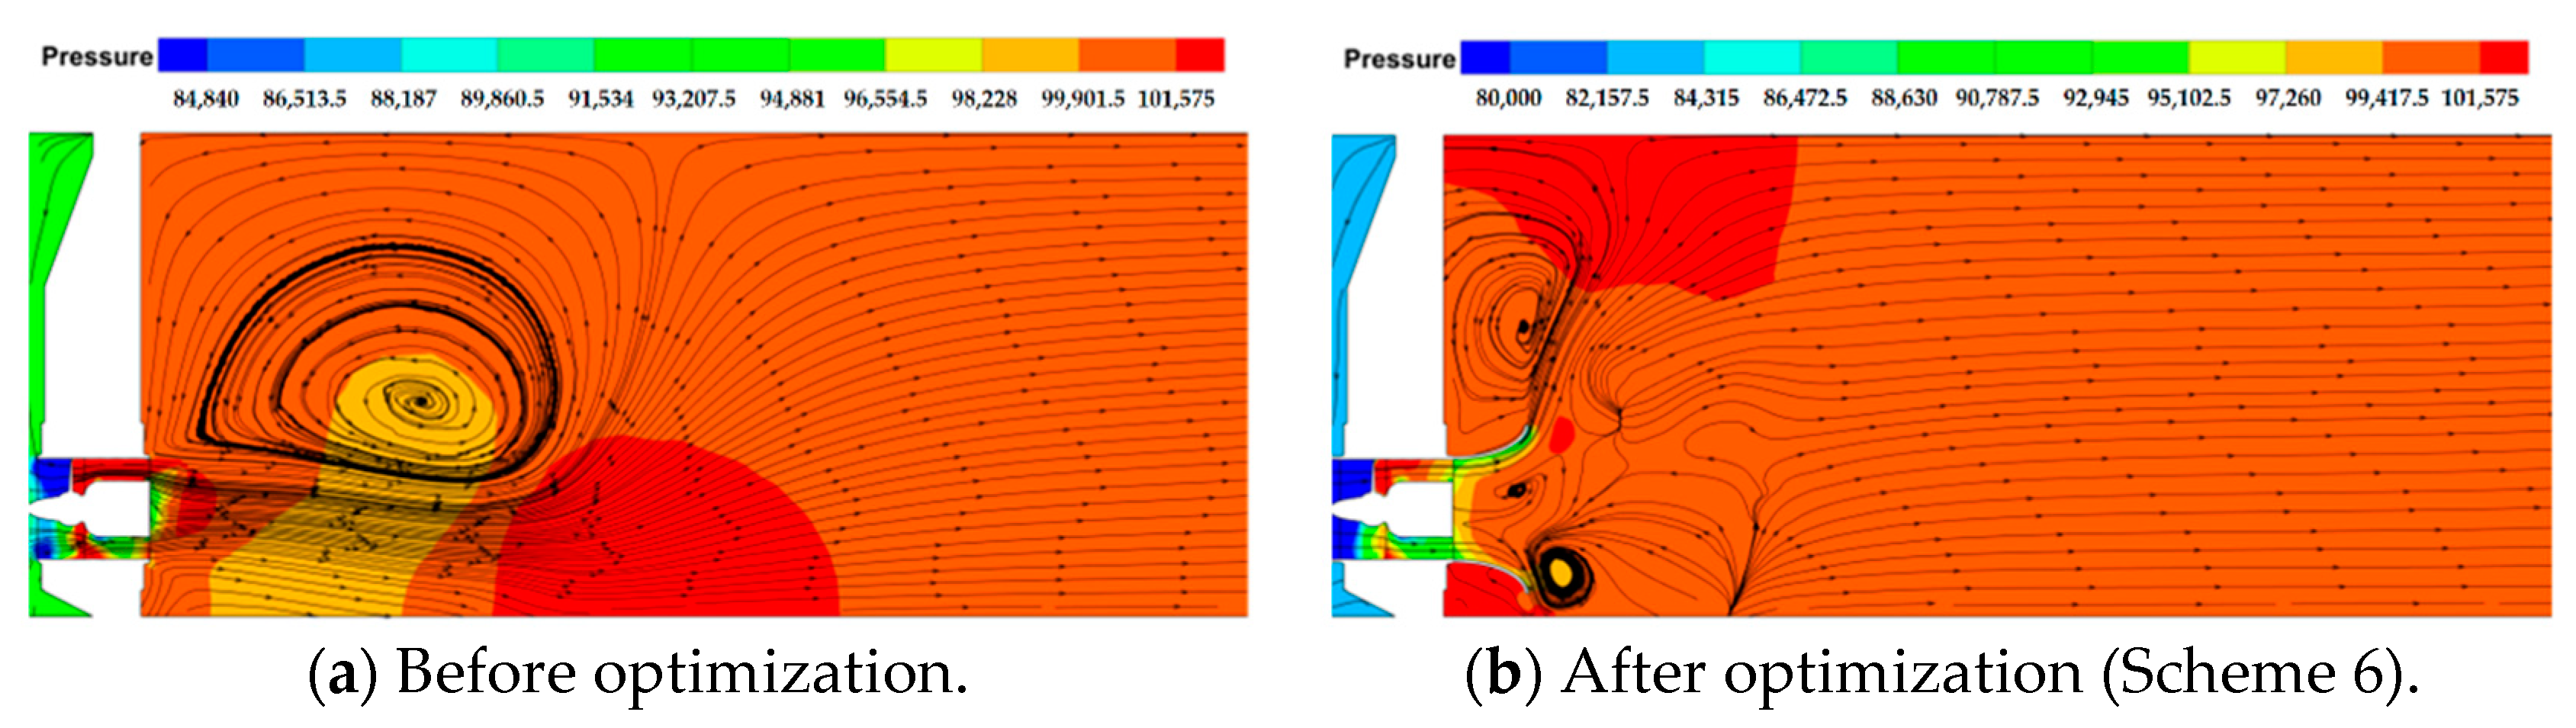
Streamline and pressure distribution at pump gate outlet.
The middle section at the outlet of the pump gate is selected, and the streamline and pressure distribution clouds at the outlet of the pump gate of the open outflow channel are drawn before and after optimization in the section, as shown in Figure 11.
The comparison in Figure 11 shows that the presence of the horn pipe can improve the flow characteristics at the outlet of the pump gate. The added horn pipe can significantly improve the pressure distribution at the pump outlet, reducing the semicircular lamellar high-pressure area significantly and almost disappear. At the same time, the huge backflow vortex at the outlet is also dispersed into two small vortexes, wherein the streamlined distribution can also be found. The streamline along the direction of water flow then restores the parallel state. This is due to the diffusion profile of the horn pipe, which causes the water to flow in a radial pattern and enables the energy to be released evenly and buffered to a certain extent. The addition of the horn pipe at the rear of the pump gate not only improves the efficiency of the pump outflow but also significantly improves the flow pattern inside the outlet water channel.
6.
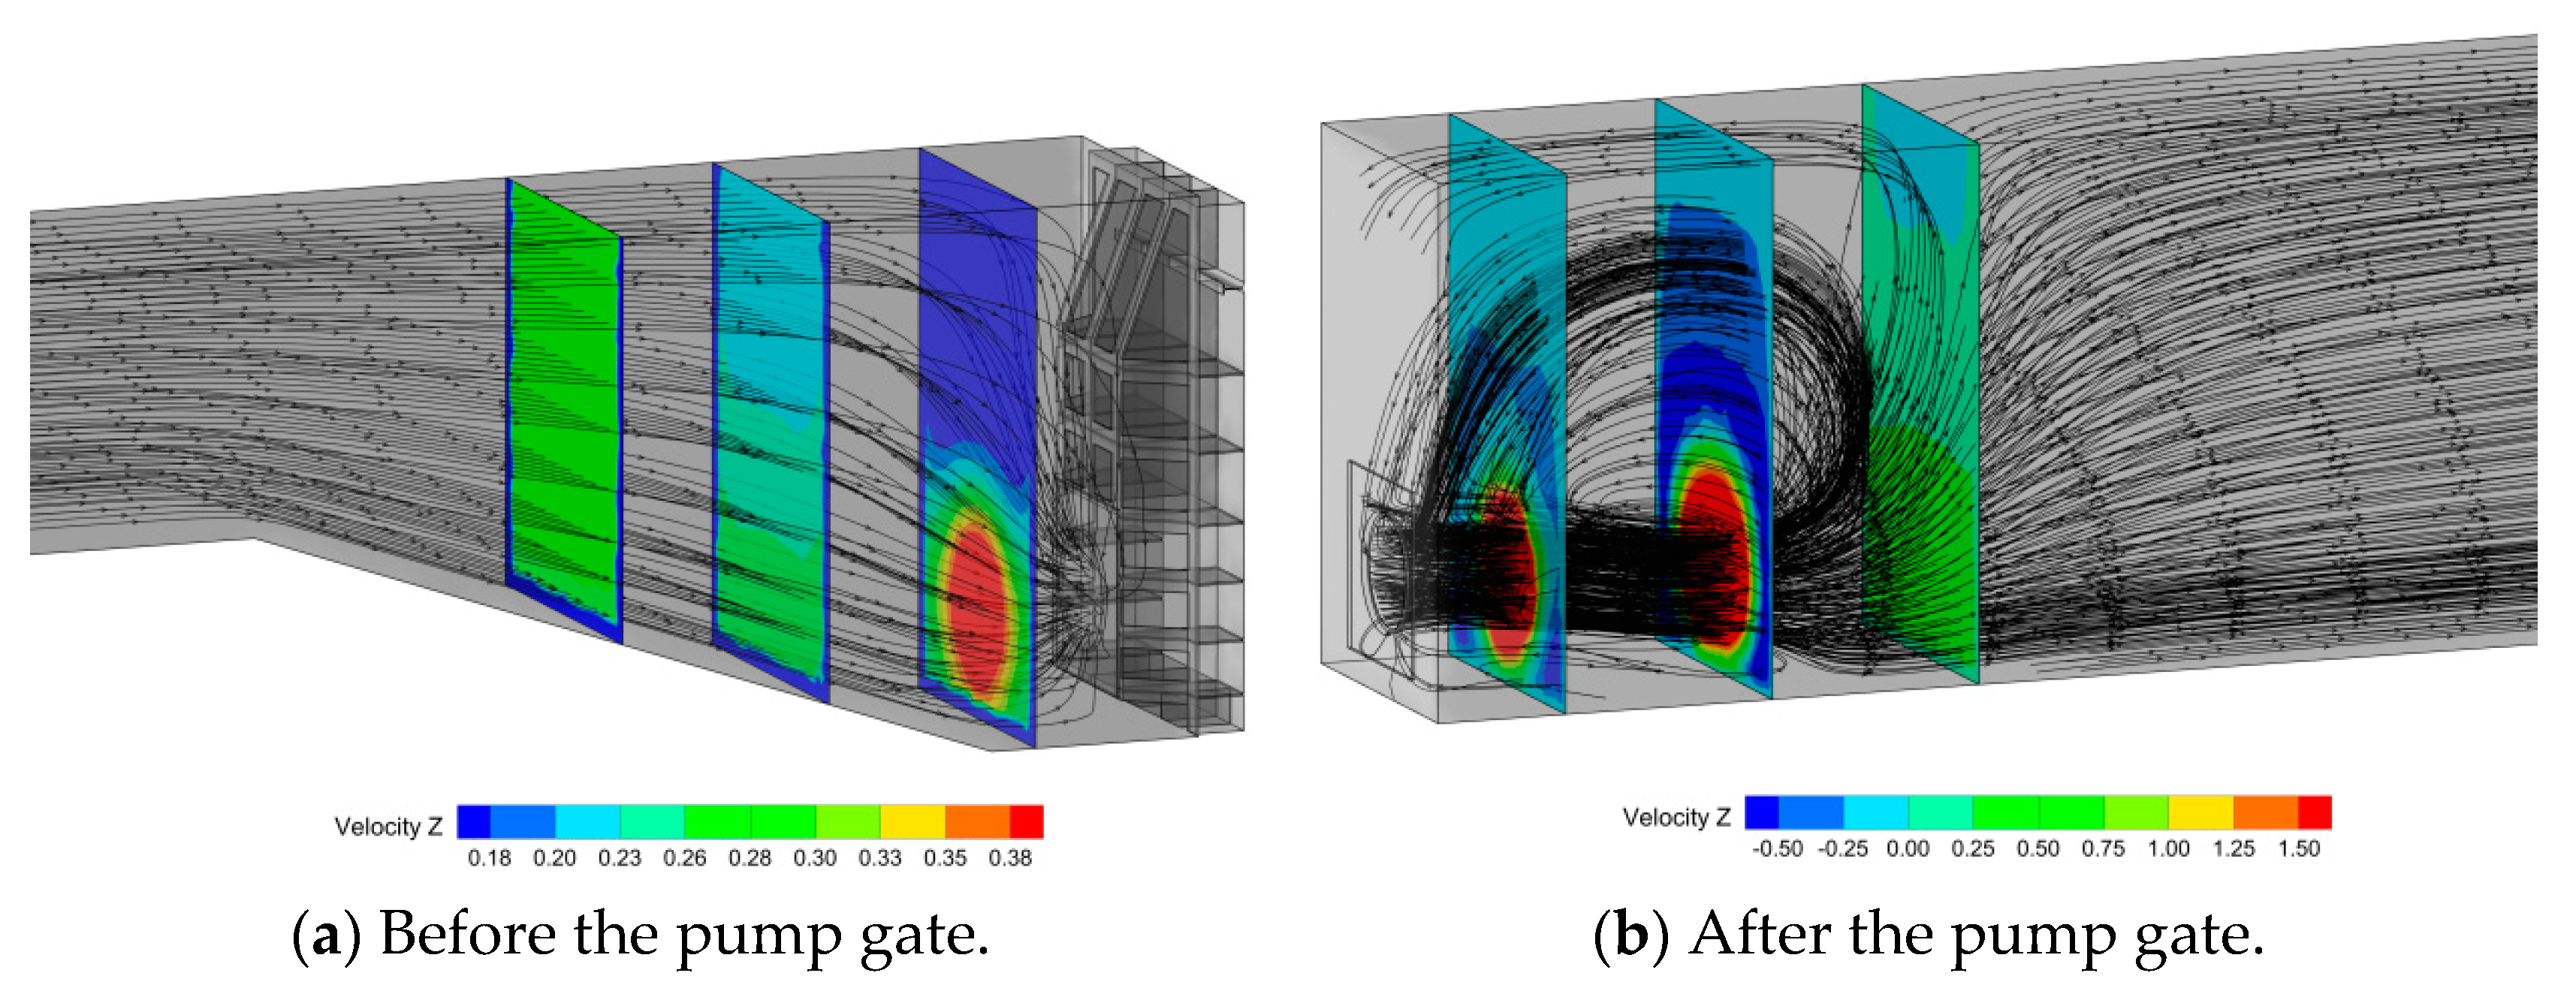
3D streamline of pump gate and axial flow velocity distribution of characteristic section.
Select 5D, 3D, and D positions from the impeller inlet and the D, 3D and 5D positions from the guide vane outlet to make transverse sections and observe the distribution of 3D streamline and axial flow velocity in the characteristic section of the pump gate.
By comparing Figure 12 and Figure 13, it can be seen that the results of the numerical calculation and test streamline before optimization are similar. The inlet streamline shrinks evenly to the inlet, the outlet has large swirl eddies, and the outlet streamline of the pump gate moves against the direction of water flow. It can be seen from the comparison of Figure 12 and Figure 14 that the additional horn pipe has little influence on the axial flow velocity in the 5D section from the impeller inlet, which is similar to the distribution of flow velocity in the section before optimization. The axial flow velocity in the inner wall and the bottom near the wall area of the section is close to 0 m/s, mainly caused by the side wall effect. The axial flow velocity in other areas is about 0.26–0.33 m/s. The difference of axial flow velocity in 3D section from the impeller inlet is increased by the addition of the horn pipe, and the axial flow velocity in the inner side wall and near wall area of the bottom of the section before and after the addition of the horn pipe is low. The axial flow velocity at the bottom of the section was not significantly increased after the addition of the horn pipe, but the area of the high axial flow velocity region was increased to 0.23–0.26 m/s at the middle and lower parts, and the middle and upper parts were reduced to 0.20–0.23 m/s than without the horn pipe, and the flow velocity at the upper part near the top of the liquid surface was even lower at 0.18–0.20 m/s or so. In section D from the impeller inlet, there is a significant difference in the distribution of axial flow velocity before and after optimization. The area of high axial flow velocity is larger when the horn pipe is installed, and the low-speed area near the side wall and bottom surface is also larger. This is due to the existence of the horn pipe wall, which isolates the flow and mainstream at the side wall.
The pump gate outlet and the horn pipe causes different effects at different section.
  • Within D section from the outlet of the guide vane.
After the addition of the horn pipe, the high axial flow velocity area in the section is distributed in a more dispersed circular shape, and the flow velocity in the central area of the circle is reduced. There is an obvious transition zone between high and low velocities. Combined with the 3D streamline diagram, it can be found that since the section, the streamline begins to gradually return to parallelism and the flow pattern gradually returns to flatness, which is earlier than the original scheme.
2.
Within 3D section from the outlet of the guide vane.
After the addition of the horn pipe, only three cloud-like high flow velocity areas exist in the lower and middle parts of the section, with a size of about 1 m/s. Compared with the original scheme, the inhomogeneous velocity areas are significantly reduced, and the flow transition is smoother.
3.
Within a 5D section from the outlet of the guide vane.
After adding the horn pipe, the flow velocity in the section is only higher at the bottom, which is about 0.5 m/s, and the flow velocity in the rest of the area is more consistent, approximately 0.25 m/s. Combined with the 3D streamline, this is because at this location, the streamline has returned to a parallel state, and the flow pattern has been more gentle. The flow pattern in this section is better than in the original scheme.
Therefore, installing a horn pipe in front of the pump gate can concentrate the axial streamline in section D from the pump impeller inlet, thus improving the water intake efficiency. The horn pipe installed at the outlet of the guide vane makes the return vortex dispersed into two small vortexes. After D is far from the outlet of the guide vane, the outlet water line gradually returns to parallel, which significantly improves the flow pattern of the outlet water after the pump gate and improves the efficiency and head of the pump gate.

4.2.3. Energy Characteristic Analysis of Pump Gate

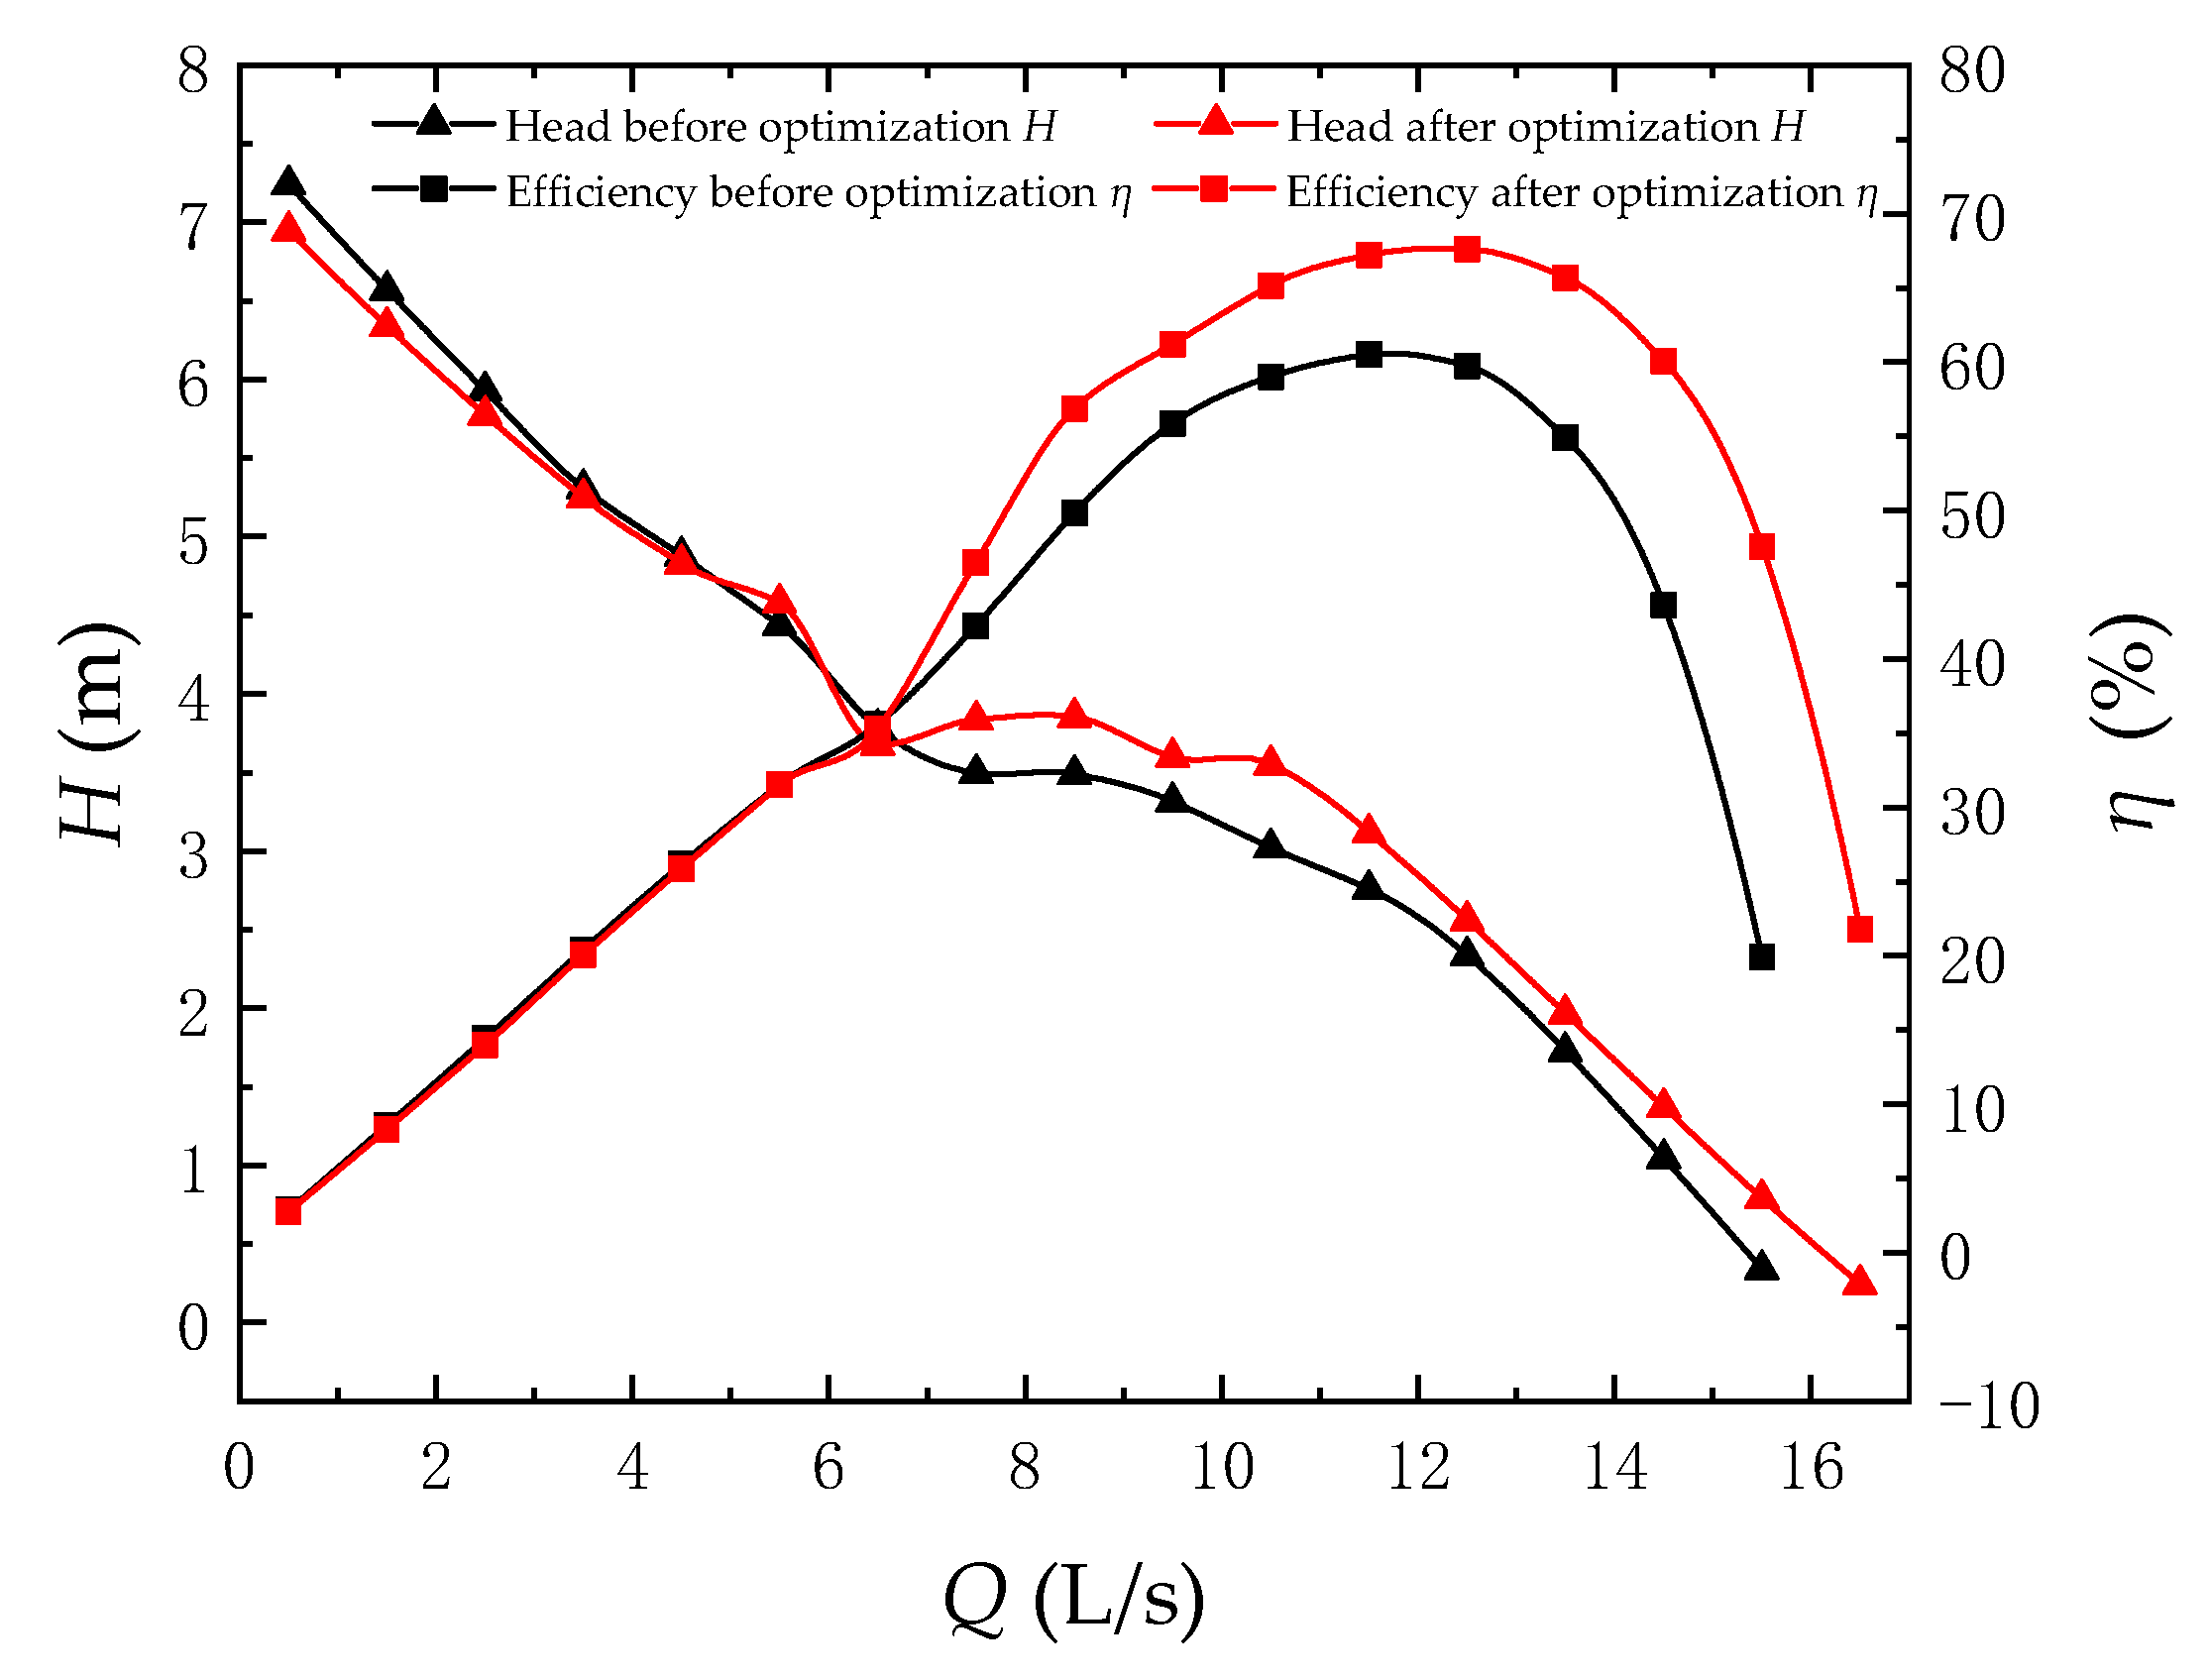
The pressure and torque are extracted from the result file of simulation calculation; the pump gate head is calculated according to Equation (1), and the pump gate efficiency is calculated according to Equation (2) to obtain the energy characteristics data of the integrated pump gate before and after optimization under different flow conditions. The data points with relatively significant changes in head and efficiency are organized as shown in Table 7. The head-efficiency curve of the integrated pump gate before and after optimization is drawn, as shown in Figure 15.
Table 7 and Figure 15 show that when the flow rate is 0.5–16.5 L/s, the pump gate efficiency is approximately distributed in a quadratic function, and the pump gate head gradually decreases from 6.9484 m to 0.2458 m. The efficiency of the pump gate near the original design flow rate (Qd = 11.5 L/s) is 67.19%, the corresponding flow rate is 11.5 L/s, and the head is 3.1178 m. When the flow rate is Q = 12.5 L/s, the optimized pump gate reaches the highest efficiency of 67.60%, the corresponding head is 2.5590 m, and the highest efficiency point is shifted to the high flow rate.
In the range of flow rate Q = 0.5–6.5 L/s, the performance of the pump gate before and after optimization did not change much. In the range of flow rate Q = 6.5–16.5 L/s, the efficiency and head of the pump gate increased, indicating that the influence of the inlet and outlet horn on the hydraulic performance of the large flow rate and design conditions was greater, and the influence of the small flow rate was smaller. After optimization, the hydraulic performance of the integrated pump gate is significantly improved. Under the original design flow rate (Qd = 11.5 L/s) working condition, the efficiency is increased by 6.69%, and the head is increased by 0.3609 m compared with that before optimization.

5. Conclusions

In this paper, the SST k-ω turbulence model is used to numerically calculate the integrated pump gate, the internal flow characteristics are verified through experiments, and finally, its inlet and outlet horn pipes are optimally designed through orthogonal optimization. The main conclusions are as follows:
(1) Before optimization, the efficiency of the integrated pump gate near the design flow condition is 60.50%, the corresponding flow is 11.5 L/s, the head is 2.7569 m, the hydraulic loss of the inlet channel is 0.064 m, and the hydraulic loss of the outlet channel is 1.337 m.
(2) Combining the axial flow velocity distribution cloud diagram, pressure distribution cloud diagram and streamline diagram, it can be seen that the horn tube installed in front of the pump gate can improve the water inlet conditions of the pump, thus improving the pump gate efficiency and head; the horn tube installed at the rear of the pump gate can greatly improve the backflow vortex after the pump gate, thus improving the flow pattern in the outlet water channel.
(3) In this paper, the orthogonal optimization of the integrated pump gate horn pipe is carried out. After optimization, the efficiency of the pump gate near the original design flow rate (Qd = 11.5 L/s) is 67.19%, the head is 3.1178 m, the hydraulic loss in the inlet channel is 0.027 m, and the hydraulic loss in the outlet channel is 1.027 m at this flow rate. In summary, after orthogonal optimization, the hydraulic performance of the integrated pump gate is significantly improved compared with that before optimization, the efficiency is increased by 6.69%, the head is increased by 0.3609 m, and the hydraulic losses in the inlet and outlet channels are reduced by 0.037 m and 0.31 m, respectively.

Author Contributions

Concept design, C.X. and T.F.; numerical calculation, W.X. and T.F.; experiment and data analysis, T.F., W.X., C.B. and L.W.; manuscript writing, C.X. and T.F. All authors have read and agreed to the published version of the manuscript.

Funding

This research was funded by: Anhui Province Natural Science Funds for Youth Fund Project, grant number 2108085QE220; key scientific research project of Universities in Anhui Province, grant number KJ2020A0103; Anhui Province Postdoctoral Researchers’ Funding for Scientific Research Activities, grant number 2021B552; Anhui Agricultural University unveiled the list of “scientific research” projects; Anhui Agricultural University President’s Fund, grant number 2019zd10; Stabilization and Introduction of Talents in Anhui Agricultural University Research Grant Program, grant number rc412008.

Institutional Review Board Statement

Not applicable.

Informed Consent Statement

Not applicable.

Data Availability Statement

Not applicable.

Conflicts of Interest

The authors declare no conflict of interest.

References

  1. Chen, W. Numerical Computation Study on Hydraulic Optimization of Integrated Pump Gate. Master’s Thesis, Yangzhou University, Yangzhou, China, 2021. [Google Scholar] [CrossRef]
  2. Wu, Y.; Zhao, H.D.; Liu, C. Based on The Gate Bottom Edge Structures Specific Numerical Simulation of Flow Pattern of Gate. In E3S Web of Conferences; EDP Sciences: Les Ulis, France, 2021; Volume 261, p. 02018. [Google Scholar]
  3. Zhao, W.; Zhang, J.; Yu, X.; Zhou, D.; Calamak, M. Multiobjective optimization of a tubular pump to improve the applicable operating head and hydraulic performance. Proc. Inst. Mech. Eng. Part C J. Mech. Eng. Sci. 2020, 235, 1555–1566. [Google Scholar] [CrossRef]
  4. Yuan, Y.; Zhang, Y.Q.; Xu, X.D.; Yang, F. Physical model experimental analysis of bidirectional shaft tubular pump device. In IOP Conference Series: Earth and Environmental Science; IOP Publishing: Bristol, UK, 2020; Volume 612, p. 012053. [Google Scholar]
  5. Jiao, H.; Sun, C.; Chen, S. Analysis of the Influence of Inlet Guide Vanes on the Performance of Shaft Tubular Pumps. Shock. Vib. 2021, 2021, 5177313. [Google Scholar] [CrossRef]
  6. Shi, L.; Wu, C.; Wang, L.; Xu, T.; Jiang, Y.; Chai, Y.; Zhu, J. Influence of Blade Angle Deviation on the Hydraulic Performance and Structural Characteristics of S-Type Front Shaft Extension Tubular Pump Device. Processes 2022, 10, 328. [Google Scholar] [CrossRef]
  7. Ji, D.; Lu, W.; Lu, L.; Xu, L.; Liu, J.; Shi, W.; Huang, G. Study on the Comparison of the Hydraulic Performance and Pressure Pulsation Characteristics of a Shaft Front-Positioned and a Shaft Rear-Positioned Tubular Pump Devices. J. Mar. Sci. Eng. 2021, 10, 8. [Google Scholar] [CrossRef]
  8. Sun, Z.; Yu, J.; Tang, F. The Influence of Bulb Position on Hydraulic Performance of Submersible Tubular Pump Device. J. Mar. Sci. Eng. 2021, 9, 831. [Google Scholar] [CrossRef]
  9. Shi, L.; Zhang, W.; Jiao, H.; Tang, F.; Wang, L.; Sun, D.; Shi, W. Numerical simulation and experimental study on the comparison of the hydraulic characteristics of an axial-flow pump and a full tubular pump. Renew. Energy 2020, 153, 1455–1464. [Google Scholar] [CrossRef]
  10. Gao, H.; Yang, F.; Chen, S.J.; Liu, C. Effect of rotational speed on the hydraulic performance for flow conduits of shaft extension tubular pumping system. In IOP Conference Series: Earth and Environmental Science; IOP Publishing: Bristol, UK, 2018; Volume 163, p. 012038. [Google Scholar]
  11. Meng, F.; Li, Y.; Pei, J. Energy Characteristics of Full Tubular Pump Device with Different Backflow Clearances Based on Entropy Production. Appl. Sci. 2021, 11, 3376. [Google Scholar] [CrossRef]
  12. Li, P.; Jin, F.; Tao, R.; Zhang, F.; Xiao, R. Unsteady Simulation of the Internal Flow in a Tubular Pump Considering Tip-Leakage Flow. In IOP Conference Series: Earth and Environmental Science; IOP Publishing: Bristol, UK, 2022; Volume 1037, p. 012044. [Google Scholar]
  13. Chen, J.; Mao, J.; Shi, H.; Wang, X. Experimental and Numerical Study on the Hydraulic Characteristics of an S-Type Bidirectional Shaft Tubular Pump. J. Mar. Sci. Eng. 2022, 10, 671. [Google Scholar] [CrossRef]
  14. Li, J.; Xu, F.; Cheng, L.; Pan, W.; Zhang, J.; Shen, J.; Ge, Y. Numerical Simulation of Internal Flow Characteristics and Pressure Fluctuation in Deceleration Process of Bulb Tubular Pump. Water 2022, 14, 1788. [Google Scholar] [CrossRef]
  15. Shi, L.; Yuan, Y.; Jiao, H.; Tang, F.; Cheng, L.; Yang, F.; Jin, Y.; Zhu, J. Numerical investigation and experiment on pressure pulsation characteristics in a full tubular pump. Renew. Energy 2021, 163, 987–1000. [Google Scholar] [CrossRef]
  16. Shen, J.; Pei, J.; Chen, S. Mechanical property analysis of shaft tubular pump rotor with different blade angle based on fluid-structure interaction. In Journal of Physics: Conference Series; IOP Publishing: Bristol, UK, 2022; Volume 2217, p. 012044. [Google Scholar]
  17. Yang, J.; Fang, G.; Hu, D.; Cai, Z.; Zhai, J.; Zheng, Y.; Kan, K. Hydrodynamic and Structural Stability Analysis for Shaft Tubular Pump Unit. In IOP Conference Series: Earth and Environmental Science; IOP Publishing: Bristol, UK, 2021; Volume 647, p. 012038. [Google Scholar]
  18. Wang, S.; Zhang, L.; Yin, G. Numerical Investigation of the FSI Characteristics in a Tubular Pump. Math. Probl. Eng. 2017, 2017, 7897614. [Google Scholar] [CrossRef]
  19. Kan, K.; Zheng, Y.; Fu, S.; Liu, H.; Yang, C.; Zhang, X. Dynamic stress of impeller blade of shaft extension tubular pump device based on bidirectional fluid-structure interaction. J. Mech. Sci. Technol. 2017, 31, 1561–1568. [Google Scholar] [CrossRef]
  20. Li, Y.; Lu, R.; Zhang, H.; Deng, F.; Yuan, J. Improvement of Intake Structures in a Two-Way Pumping Station with Experimental Analysis. Appl. Sci. 2020, 10, 6842. [Google Scholar] [CrossRef]
  21. Launder, B.E.; Spalding, D.B. Lectures in Mathematical Model of Turbulence; Academic Press: Cambridge, MA, USA, 1972. [Google Scholar]
  22. Menter, F.R. Zonal two equation k-ω turbulence models for aerodynamic flows. In Proceedings of the 23rd fluid dynamics, plasmadynamics, and lasers conference, Orlando, FL, USA, 6–9 July 1993. [Google Scholar]
  23. ANSYS. ANSYS CFX Modeling Guide; ANSYS: Canonsburg, PA, USA, 2015. [Google Scholar]
Figure 1. 3D rendering of the gate pump.
Processes 10 01753 g001
Figure 2. Grid division diagram.
Processes 10 01753 g002
Figure 3. Schematic diagram of the test bench. 1. Water inlet tank. 2. Water inlet channel support part. 3. Open inlet and outlet channels. 4. Outlet channel support part. 5. Outlet water tank. 6. Flange butterfly valve. 7. Booster pump. 8. Tested integrated pump gate. 9. Pipe support. 10. Electromagnetic flowmeter. 11. Circulating pipeline.
Processes 10 01753 g003
Figure 4. 3D rendering and physical drawing of the integrated pump gate test bench.
Processes 10 01753 g004
Figure 5. Schematic diagram of the geometric parameters of the horn pipe.
Processes 10 01753 g005
Figure 6. Schematic diagram of the inlet and outlet horn pipes of different Schemes.
Processes 10 01753 g006
Figure 7. Trend diagram of influence of various factors on efficiency.
Processes 10 01753 g007
Figure 8. Cloud diagram of inlet streamline and axial velocity distribution of pump gate before and after optimization.
Processes 10 01753 g008
Figure 9. Cloud diagram of outlet water line and axial velocity distribution of pump gate before and after optimization.
Processes 10 01753 g009
Figure 10. Cloud diagram of streamline and pressure distribution at the inlet of pump gate before and after optimization.
Processes 10 01753 g010
Figure 11. Cloud diagram of streamline and pressure distribution at pump gate outlet before and after optimization.
Processes 10 01753 g011
Figure 12. 3D streamline and axial flow velocity distribution of characteristic section before optimization.
Processes 10 01753 g012
Figure 13. High-speed camera test flow pattern before optimization.
Processes 10 01753 g013
Figure 14. Optimized 3D streamline and characteristic section axial flow velocity distribution.
Processes 10 01753 g014
Figure 15. Comparison curve of pump gate head-efficiency before and after optimization.
Processes 10 01753 g015
Table 1. Grid-independent efficiency calculation table.
Serial NumberNumber of GridsEfficiency (%)
1441,55262.6202
2727,19962.5301
31,127,74061.9122
41,438,93061.5366
51,935,42061.3413
62,230,54061.2641
72,406,07061.2127
83,035,46060.4957
93,511,65060.4258
103,825,00060.4077
114,208,40060.4107
Table 2. Table of orthogonal optimization factor levels.
LevelFactor
A (Hornpipe Height) HL/mmB (Horn Pipe Inlet Diameter) DL/mmC (Straight Pipe Length) Ht/mm
10.7 D (43.4)1.5 D (93)0 D
20.75 D (46.5)1.6 D (99.2)0.25 D (15.5)
30.8 D (49.6)1.7 D (105.4)0.5 D (31)
Table 3. Table of L9 (34) orthogonal optimization scheme.
SchemeA (Horn Pipe Height HL)B (Horn Pipe Inlet Diameter DL)C (Straight Pipe Length Ht)D (Error Column)
11111
21222
31333
42123
52231
62312
73132
83213
93321
Table 4. Selection table of orthogonal optimization parameters.
SchemeOptimization Parameters of the Horn Tube (mm)
A (Horn Pipe Height HL)B (Horn Pipe Inlet Diameter DL)C (Straight Pipe Length Ht)
10.7 D (43.4)1.5 D (93)0 D
20.7 D (43.4)1.6 D (99.2)0.25 D (15.5)
30.7 D (43.4)1.7 D (105.4)0.5 D (31)
40.75 D (46.5)1.5 D (93)0.25 D (15.5)
50.75 D (46.5)1.6 D (99.2)0.5 D (31)
60.75 D (46.5)1.7 D (105.4)0 D
70.8 D (49.6)1.5 D (93)0.5 D (31)
80.8 D (49.6)1.6 D (99.2)0 D
90.8 D (49.6)1.7 D (105.4)0.25 D (15.5)
Table 5. Table of orthogonal optimization results.
SchemeABCDEfficiency η (%)Head H (m)
1111167.093.1112
2122266.683.0946
3133366.573.0903
4212366.673.0931
5223166.503.0861
6231267.193.1178
7313266.523.0863
8321366.943.1064
9332166.693.0946
K1200.34200.28201.22200.28 Τ = i = 1 9 η = 600.85
K2200.36200.12200.04200.39
K3200.15200.45199.59200.18
k166.7866.7667.0766.76 η ¯ = T 9 = 66.76
k266.7966.7166.6866.80
k366.7266.8266.5366.73
Rj0.070.110.540.07
Note: ki is the average of the sum of the efficiencies of the pump gates at level i for the same factor. Rj is the extreme difference in the average efficiency of the same factor at each level.
Table 6. Hydraulic loss before and after optimization.
Qd (Q = 11.5 L/s)hf (m)
Inlet ChannelOutlet Channel
Before optimization0.0641.337
After optimization (Scheme 6)0.0271.027
Table 7. Energy characteristics of integrated pump gate before and after optimization.
Flow Rate Q (L/s)Head Before Optimization H (m)Efficiency before Optimization η (%)Head after Optimization H (m)Efficiency after Optimization η (%)
8.5 (0.74 Qd)3.488449.833.852256.84
9.5 (0.83 Qd)3.312655.853.596761.20
10.5 (0.91 Qd)3.020659.013.549765.13
11.5 (1.00 Qd)2.756960.503.117867.19
12.5 (1.09 Qd)2.334359.732.559067.60
13.5 (1.17 Qd)1.724554.871.966765.68
14.5 (1.26 Qd)1.042643.581.370860.03
Publisher’s Note: MDPI stays neutral with regard to jurisdictional claims in published maps and institutional affiliations.

