Article

Screening of Phenolic Compounds in Rejected Avocado and Determination of Their Antioxidant Potential

School of Agriculture and Food, Faculty of Veterinary and Agricultural Sciences, The University of Melbourne, Parkville, VIC 3010, Australia
*
Author to whom correspondence should be addressed.
Processes 2022, 10(9), 1747; https://doi.org/10.3390/pr10091747
Submission received: 5 August 2022 / Revised: 27 August 2022 / Accepted: 27 August 2022 / Published: 2 September 2022
(This article belongs to the Section Biological Processes and Systems)

Abstract

:
Avocados are one of the important fruits in our diet, showing many health benefits. However, a significant amount of avocados become defective as they are transported throughout the supply chain and are refused by consumers, ending up at animal or pet feed manufacturers. Indeed, some previous evidence suggests that rejected avocados still present high phenolic content that can be reused in the drug or pharmacological industry. Therefore, in the present work, we measured the phenolic content from rejected avocado pulp and evaluated the antioxidant potential, followed by characterization and quantification using LC-ESI-QTOF-MS/MS and HPLC-PDA. Reed avocado pulp was highest in TPC (0.21 mg GAE/g f.w.) and TFC (0.05 mg QE/g f.w.), whereas in TCT assay, low traces of tannins were exhibited in Wurtz and Reed avocado pulp. Hass avocado pulp had the highest antioxidant potential in DPPH (0.32 AAE/g f.w.), FRAP (0.13 AAE/g f.w.), ABTS (0.32 AAE/g f.w.), •OH-RSA (0.51 AAE/g f.w.) and FICA (0.47 mg EDTA/g) assays. Wurtz avocado pulp had higher antioxidant potential in RPA (0.07 mg AAE/g) and PMA (0.27 AAE/g f.w.). A total of 64 phenolic compounds were characterized in avocado pulp, including 10 in Hass avocado pulp, 31 in Wurtz avocado pulp and 45 in Reed avocado pulp. In HPLC-PDA quantification, chlorogenic acid (21.36 mg/g f.w.), epicatechin (14.24 mg/g f.w.) and quercetin (21.47 mg/g f.w.) were detected to be the highest in Hass, Wurtz and Reed avocado pulp, respectively. Our study showed the presence of phenolic compounds in rejected avocado pulp and hence can be utilized in food and pharmaceutical industries.

1. Introduction

Food waste and loss is a global concern due to the adverse effect it has on ecology, the economy and food security. Generally, food waste can occur throughout the supply chain during production, manufacturing, distribution, retail and as it reaches the consumers [1]. Fruits and vegetables, essential parts of our diet, are susceptible to damage during these processes. Particularly, they are sensitive to temperature, humidity, contamination and physical injury, which shortens their shelf life during transportation due to their relatively soft and wet nature [2]. Further storage and improper handling methods in shops and supermarkets accelerate food spoilage, and then food is discarded as waste as it is deemed unmarketable [3]. However, bioactive compounds abundantly present in these rejected fruits and vegetables, especially phenolic compounds, can be extracted and utilized [4,5]. Phytochemicals have positive biological effects on preventing chronic diseases, including cardiovascular, inflammatory, neurodegenerative, cancer as well as diabetes and senescence, which contribute to human health [6,7].
Avocado (Persea americana M.) is a popular stone fruit native to South America that consists of peel (7–15%), pulp (65–72%) and stone (20%) [8]. The avocado’s thick and creamy texture as well as its high protein content, fat-soluble vitamins and potassium content make it a popular and widely consumed fruit globally as part of an alternative diet [9,10]. Additionally, avocado contains considerable amounts of phytochemicals, especially phenolic acids and flavonoids, which provide antioxidative capabilities [10,11]. Avocado pulp can be directly consumed or further processed to create guacamole, avocado oil, puree, sauce and other commercial avocado products [12]. For direct consumption, consumers prefer fresh avocados with moderate maturity, firmness and with few defects [13]. The frequent collision and compression that occur during harvest, transport and storage lead to bruising, cracking and visible injuries on avocados, reducing their quality [14]. However, 80% of avocados on the shelf have quality defects and more than 10% have bruises, which reduces the purchasing desire of consumers [15,16]. Despite the physical injuries, they still contain beneficial bioactive compounds which can be utilized to develop functional products.
Phenolic compounds are widely present in plants as secondary bioactive metabolites [17]. They act as electron donors to eliminate free radicals and inhibit undesirable redox reactions in the human body, promoting human health [7]. In fruits and vegetables, they are widely found as flavonoids (flavanols, flavones, anthocyanin), phenolic acids (hydrocinnamic and hydrobenzoic acids), lignans and tannins [18]. These compounds can be extracted with organic solvents under various temperature, time and treatment conditions which affect their purity and extraction yield [18,19]. The antioxidant activity and phenolic estimation in fruits were previously determined in vitro via spectrophotometric methods [20]. Their antioxidative activities were determined by 2,2′-diphenyl-1-picrylhydrazyl (DPPH) antioxidant assay, ferric reducing antioxidant power (FRAP) assay, 2,2′-azino-bis-(3-ethylbenzo-thiazoline-6-sulfonic acid) (ABTS) reducing power assay (RPA), hydroxyl radical scavenging activity (•OH-RSA), ferrous ion chelating activity (FICA) and phosphomolybdate assay (PMA). Furthermore, the characterization and quantification of compounds can be achieved by liquid chromatography coupled with electrospray ionization and quadrupole time-of-flight mass spectrometry (LC-ESI-QTOF-MS/MS) and high-performance liquid chromatography equipped with a photodiode array detector (HPLC-PDA). To the best of our knowledge, previous studies on the phenolic profile and the extraction, purification and characterization of phenolic compounds from rejected avocado pulp are limited.
With this study, we aim to provide sufficient information on the phenolic content and antioxidant properties in rejected avocado pulp to be utilized in food and pharmaceutical industries. We expected to extract high content of phenolic compounds with strong antioxidant capacity, giving avocado the potential to be a food processing agent and nutritional supplement. Hence, we estimated the phenolic, flavonoid and tannin content from rejected avocado pulp and further evaluated their antioxidative potential by DPPH, FRAP, ABTS, RPA, •OH-RSA, FICA and PMA assays. Furthermore, the phenolic profile of avocado pulp was characterized by LC-ESI-QTOF-MS/MS with several targeted phenolics, and flavonoids was quantified by HPLC-PDA.

2. Materials and Methods

2.1. Chemicals and Reagents

Most of the chemicals and reagents used in the extraction and characterization process were of analytical grade and were purchased from Sigma-Aldrich (Castle Hill, NSW, Australia). Folin–Ciocalteu phenol reagent, aluminum chloride hexahydrate, 2,2′-diphenyl-1-picrylhydrazyl (DPPH), 2,4,6-tripyridyl-s-triazine (TPTZ), 2,2′-azinobis-(3-ethylbenzo-thiazoline-6-sulfonic acid) (ABTS), hydrochloric acid, potassium persulfate and vanillin were purchased from Sigma-Aldrich (Castle Hill, NSW, Australia). The standard for in vitro antioxidant assays, including gallic acid, quercetin, catechin and L-ascorbic acid, were obtained from Sigma-Aldrich (Castle Hill, NSW, Australia). Sodium carbonate, sodium acetate, sulfuric acid, methanol, acetonitrile and acetic acid were acquired from Thermo Fisher (Scoresby, VIC, Australia). For HPLC analysis, reference standards including catechin, quercetin, caffeic acid, syringic acid, coumaric acid, gallic acid, protocatechuic acid, p-hydroxybenzoic acid, chlorogenic acid, caffeic acid, catechin, epicatechin, epicatechin gallate, quercetin and kaempferol were purchased from Sigma-Aldrich (Castle Hill, NSW, Australia).

2.2. Sample Preparation

Avocado pulp samples rejected by consumers, including Hass, Wurtz and Reed varieties, were obtained from a local retail store in Melbourne, Australia. The pulps of each variety were separately blended in a 1.5 L blender (Russell Hobbs Classic, model DZ-1613, Melbourne, VIC, Australia). Samples were stored at −20 °C for a week for further analysis.

2.3. Extraction of Phenolic Compounds

Samples were extracted with 70% (v/v) ethanol and homogenized by Ultra-Turrax T25 Homogenizer (IKA, Staufe, Germany) at 1000 rpm for 15 min followed by incubation in the ZWYR-240 incubator shaker (Labwit, Ashwood, VIC, Australia) at 120 rpm at 4 °C for 12 h. Centrifugation was conducted at 5000 rpm using ROTINA 380R centrifuge (Hettich (Beverly, MA, USA)) under 10 °C for 15 min. The supernatant was filtrated and stored at −20 °C for a week for further analysis.

2.4. Polyphenol Estimation and Antioxidant Assays

TPC, TFC and TCT were assessed for polyphenol content, and DPPH, FRAP, ABTS, RPA, •OH-RSA, FICA and PMA assays were conducted to quantify the antioxidant potential of the extracts. All the assays were performed in triplicates using modified methods of Tang et al. [21] and Subbiah et al. [22]. The data were obtained from the Multiskan® Go microplate reader (Thermo Fisher Scientific, Waltham, MA, USA).

2.4.1. Determination of Total Phenolic Content (TPC)

The TPC of the extract was quantified by modifying the Folin–Ciocalteu assay protocol in Wang et al. [23]. First, 25 μL of sample was mixed with 25 μL of Folin reagent and 200 μL of Milli-Q water in 96-well plates (Costar, Corning (Glendale, CA, USA)), and incubated at room temperature for 5 min. Then, 25 μL sodium carbonate (10%, w/w) was added to the reaction mixture and incubated in a dark place for 60 min at 25 °C. The absorbance was measured at 765 nm by a microplate reader (Thermo Fisher Scientific, Waltham, MA, USA). The calibration curve was prepared with gallic acid standard (0–200 μg/mL), and the TPC result was expressed as mg of gallic acid equivalents (GAE) per gram of each sample (mg GAE/g f.w.).

2.4.2. Determination of Total Flavonoids Content (TFC)

The TFC of the extract sample was quantified by the aluminum chloride method described by Gu, Howell, Dunshea and Suleria [20], with some modifications. First, 80 μL (2%, w/v) of aluminum chloride and 80 μL of sample extract were added to 96-well plates, followed by mixing 120 μL of 50 mg/mL sodium acetate solution and incubation at 25 °C for 2.5 h. The absorbance was read at 440 nm. The quercetin (0–50 μg/mL) calibration curve was used to determine TFC, expressed as quercetin (QE) equivalents per gram fresh sample (mg QE/g f.w.).

2.4.3. Determination of Total Tannins Content (TTC)

The TTC method was followed according to the method described by Suleria et al. [24]. First, 150 μL (4%, w/v) vanillin solution was mixed with 25 μL of extract, followed by 25 μL (32%, v/v) of sulfuric acid in a 96-well plate. The absorbance was read at 500 nm after incubation at 25 °C for 15 min. The concentration ranged between 0 and 1000 μg/mL. Catechin was used for the calibration curve, and the TTC was expressed as mg catechin (CE) equivalents per gram of fresh sample (mg CE/g f.w.).

2.4.4. 2,2′-Diphenyl-1-picrylhydrazyl (DPPH) Antioxidant Assay

The assay aimed to calculate the free radical scavenging ability of rejected avocado pulp, and the procedure was followed according to Rocchetti et al. [25], with some modifications. First, 40 μL of sample and 260 μL of 0.1 mM DPPH methanol reagent were added to 96-well plates. Absorbance was read at 517 nm after incubation for 30 min in the dark. The ascorbic acid standard curve was prepared with a concentration ranging from 0 to 50 μg/mL. The DPPH scavenging capability was calculated and expressed as ascorbic acid (AAE) equivalent per gram fresh sample (mg AAE/g f.w.).

2.4.5. Ferric Reducing Antioxidant Power (FRAP) Assay

The FRAP assay was used to evaluate the sample ability to reduce Fe3+ complex into Fe2+ complex based on the method described by Gu, Howell, Dunshea and Suleria [20]. FRAP solution was prepared by mixing 10 mM TPTZ (2,4,6-tripyridyl-s-triazine) of solution, 20 mM of FeCl3 and 300 mM of sodium acetate solution in the ratio of 1:10:10 (v/v/v). Then, 280 μL of FRAP reagent was added to 20 μL sample extract and incubated at 37 °C for 10 min. Absorbance was read at 593 nm. The ascorbic acid standard curve with the concentration ranging from 0 to 50 μg/mL was used to determine the FRAP values, expressed as mg ascorbic acid (AAE) equivalents per gram sample (mg AAE/g f.w.).

2.4.6. 2,2′-Azinobis-(3-ethylbenzothiazoline-6-sulfonic acid) (ABTS) Assay

The ABTS scavenging ability of the extract was quantified by the modifying the method of Severo et al. [26]. The ABTS+ stock solution was prepared by the addition of 5 mL of 7 mM ABTS and 88 µL of 140 mM potassium persulfate solution, incubated in a dark place for 16 h. Then, 10 μL of extract and 290 μL of dye solution were added to a 96-well plate and incubated for 6 min at 25 °C. Absorbance was measured at 734 nm. The antioxidant potential was measured using the standard curve of ascorbic acid (0 to 150 µg/mL) and was expressed in ascorbic acid equivalents (AAE) in mg per gram of sample.

2.4.7. Total Antioxidant Capacity (TAC)

Total antioxidant capacity was quantified by following the method of Suleria, Barrow and Dunshea [24]. Phosphomolybdate reagent was prepared by mixing 0.6 M of sulfuric acid, 0.028 M of sodium phosphate and 0.004 M of ammonium molybdate. Then, 40 μL of sample was added to 260 μL of phosphomolybdate reagent, followed by incubation at 95 °C for 10 min and then cooling to room temperature. Absorbance was read at 695 nm. Ascorbic acid with the concentration range of 0–200 μg/mL was prepared as the standard curve, and the results were calculated as mg ascorbic acid equivalents (AAE) per g of fresh sample weight (mg AAE/g f.w.).

2.4.8. Reducing Power Assay (RPA)

The reducing power activity was determined by modifying the method of Ferreira et al. [27]. First, 10 μL of extract, 25 μL of 0.2 M sodium phosphate buffer (pH 6.6) and 25 μL of K3[Fe(CN)6] were added, followed by incubation at 25 °C for 20 min. Then, 25 μL of 10% TCA solution was added to stop the reaction, followed by the addition of 85 μL of water and 8.5 μL of FeCl3. The solution was further incubated for 15 min at 25 °C. Then, the absorbance was measured at 750 nm. Ascorbic acid from 0 to 500 μg/mL was used to obtain a standard curve, and data were presented as mg ascorbic acid equivalents (AAE) per g of fresh sample weight (f.w.) ± standard deviation (SD).

2.4.9. Hydroxyl Radical Scavenging Activity (•OH-RSA)

The Fenton-type reaction method of Smirnoff and Cumbes [28] was used to determine •OH-RSA, with some modifications. First, 50 μL extract was mixed with 50 μL of 6 mM FeSO4·7H2O and 50 μL of 6 mM H2O2 (30%), followed by incubation at 25 °C for 10 min. After incubation, 50 μL of 6 mM 3-hydroxybenzoic acid was added and absorbance was measured at a wavelength of 510 nm. Ascorbic acid from 0 to 300 μg/mL was used to obtain a standard curve and data were expressed as ascorbic acid equivalents (AAE) per g of fresh sample weight (f.w.) ± standard deviation (SD).

2.4.10. Ferrous Ion Chelating Activity (FICA)

The Fe2+ chelating activity of the sample was measured according to Dinis et al. [29], with modifications. First, 20 μL extract was mixed with 80 μL of water, 50 μL of 2 mM ferrous chloride (with an additional 1:15 dilution in water) and 50 μL of 5 mM ferrozine (with an additional 1:6 dilution in water), followed by incubation at 25 °C for 10 min. Then, the absorbance was measured at a wavelength of 562 nm. Ethylenediaminetetraacetic acid (EDTA) from concentrations of 0 to 30 μg/mL was used to obtain a standard curve and data were presented as mg EDTA/g f.w.

2.5. Characterization of Phenolic Compounds by LC-ESI-QTOF-MS/MS Analysis

Phenolic characterization was carried out by using LC-ESI-QTOF-MS/MS and the protocol was followed according to Zhong et al. [30]. We used Agilent 1200 series High-Performance Liquid Chromatography (HPLC) (Agilent Technologies, Santa Clara, CA, USA) coupled with electrospray ionization (ESI) and Agilent 6520 Accurate-Mass Q-TOF LC/MS (Agilent Technologies, CA, USA), as well as Synergi Hydro-RP 80 Å LC column 250 mm × 4.6 mm and 4 μm (Phenomenex, Lane Cove) with temperature 25 °C and sample temperature at 10 °C. Mobile phase A: 98% water and 2% acetic acid; mobile phase B: acetonitrile, water and acetic acid solution (50:49.5:0.5). Then, 6 μL of sample filtrate was injected with the flow rate of 0.8 mL/min. Mobile phase A and B were mixed as follows: 90% A and 10% B in 0–20 min; 75% A and 25% B in 20–30 min; 65% A and 35% B in 30–40 min; 60% A and 40% B in 40–70 min; 45% A and 55% B in 70–75 min; 20% A and 80% B in 75–77 min; 100% B in 77–82 min; 10% A and 90% B in 82–85 min. Both positive and negative modes were applied for peak identification and the m/z range was obtained from 50 to 1300 amu. The parameters of nitrogen gas were set as 45 psi, 300 °C with a 5 L/min flow rate, and sheath gas was under 250 °C with 11 L/min velocity. The capillary and nozzle voltage were operated at 3.5 kV and 500 V, respectively. Results were obtained by MassHunter Data Acquisition Software (Qualitative Analysis, version B.03.01, Agilent).

2.6. Quantification of Phenolic Compounds by HPLC-PDA Analysis

The quantification of phenolic components was performed according to Tang et al. [21] with Agilent 1200 serious HPLC (Agilent Technologies, CA, USA) equipped with a photodiode array (PDA) detector. The analysis was operated with the same column size and condition as those of LC-ESI-QTOF-MS/MS with temperature 25 °C and sample temperature at 10 °C, except for the 20 µL injection volume for each sample with the flow rate of 0.8 mL/min. Wavelengths were set at 280 nm, 320 nm and 370 nm for identifying hydroxybenzoic acids, hydroxycinnamic acids and flavonol groups, respectively. Data acquisition and analysis were carried out by Agilent LC-ESI-QTOF-MS/MS MassHunter Workstation Version B.03.01.

2.7. Statistical Analysis

The result in each assay is expressed as mean ± standard deviation (SD). One-way analysis of variance (ANOVA) through Minitab Program 18.0 (Minitab, LLC, Stage College, PA, USA) was conducted to test the differences between each sample group, followed by Tukey’s honestly significant differences (HSD) multiple rank test at p < 0.05.

3. Results and Discussions

3.1. Polyphenol Estimation (TPC, TFC and TTC)

Avocado pulp is not only nutrient-dense and rich in vitamins, but also contains a variety of active phytochemicals which contribute to their positive health benefits [7,10,11]. However, these health benefits are not widely explored in rejected avocado pulp. Hence, the phenolic contents of rejected Hass, Wurtz and Reed avocado pulp were estimated to evaluate their health potential. The total phenolic, flavonoid and condensed tannin contents were estimated by TPC, TFC and TCT assays and are reported in Table 1.
For the TPC assay, Reed avocado pulp was found to have the highest total phenolic content (0.21 ± 0.04 mg GAE/g) compared to Hass (0.17 ± 0.06 mg GAE/g) and Wurtz (0.16 ± 0.03 mg GAE/g). Previous studies reported a higher total phenolic content of Hass avocado pulp, which might be due to different solvents and concentrations used for extraction [31]. In Wang, Bostic and Gu [23]’s study, the avocado pulp phenolic content ranged from 60 to 490 mg GAE/100 g f.w., higher than our results.
For the TFC assay, Reed avocado pulp was found to have the highest total flavonoid content (0.05 ± 0.05 mg QE/g), followed by Hass (0.04 ± 0.03 mg QE/g) and Wurtz (0.02 ± 0.04 mg QE/g). Different ripening stages of avocado showed different flavonoid contents ranging from 9.91 to 26.36 mg QE/100 g on a fresh weight basis [32]. Hence, the small quantity of flavonoids found in our study might be due to the avocados’ maturity level, storage condition, bruising and metabolism processes [26,33].
Tannin content was found to be negligible in all three avocado pulp varieties by the TCT assay. Previously, Poovarodom et al. [34] examined the tannin content of the Ettinger avocado variety extracted in methanol, water, acetone and hexane and reported the presence of tannin as 497 mg CE/100 g d.w., 72 mg CE/100 g d.w., 832 mg CE/100 g d.w. and 625 mg CE/100 g d.w., respectively. However, Princewill-Ogbonna et al. [35] reported lower condensed tannin concentrations in avocado, which aligns with the low tannin content in our rejected avocado pulp. The low tannin concentration may be due to the vanillin reagent in the TCT assay, which reacts with specific chemical groups in avocado itself and reduces its detection scope.

3.2. Antioxidant Activities

The antioxidant capacity of three varieties of rejected avocado pulp was determined by DPPH, FRAP, ABTS, RPA, •OH-RSA, FICA and TAC in vitro assays and is reported in Table 1.
DPPH and FRAP are single-electron transfer (SET) reaction-based assays that determine antioxidant activity. DPPH assay evaluates the donating hydrogen ability to eliminate free radicals [36]. The odd electron in the nitrogen atom present in DPPH (C18H12N5O6, M = 394.33) is reduced by receiving a hydrogen atom from an antioxidant to the corresponding hydrazine [37]. The highest DPPH value of Hass avocado is 0.32 mg AAE/g and is significantly different from other avocado varieties (p < 0.05). The lowest DPPH value among the samples was the Reed avocado with 0.12 mg AAE/g. In a previous study by Wang, Bostic and Gu [23], the antioxidant potential ranged between 0.4 and 1.3 μmol TE/g. The difference in the antioxidant potential might be due to maturity level, storage condition, bruising and metabolism processes [26,33].
The FRAP assay is based on the reduction of ferric-tripyridyltriazine [FeIII(TPTZ)]3+, forming an intense blue-colored ferrous complex [FeII(TPTZ)]2+. The reaction was conducted under the acidic condition to maintain iron stability and transfer the electron, improving the redox potential [38]. The FRAP results had a similar trend to those of DPPH assay because it utilizes a similar SET mechanism. The antioxidant potential between the avocado varieties is significantly different (p < 0.05). Similarly, Hass avocado had higher antioxidant potential (0.13 ± 0.05 mg AAE/g), followed by Wurtz (0.09 ± 0.01 mg AAE/g) and Reed (0.04 ± 0.03 mg AAE/g) avocado pulp. This present study reports a higher FRAP value than a previous study conducted by Poovarodom, Haruenkit, Vearasilp, Namiesnik, Cvikrová, Martincová, Ezra, Suhaj, Ruamsuke and Gorinstein [34], where methanol extract of avocado pulp was reported to have antioxidant potential of 32 µmol FeSO4/g [39]. These differences might be due different growing regions and/or extraction solvents, as different solvents were used to extract avocado pulp phenolics and perform antioxidant activities, which might affect the extraction rate and overall antioxidant potential.
For the ABTS scavenging radical capacity assay, the antioxidant ability is measured by reaction of the extracts with ABTS+ radical cation [40]. Hass avocado pulp was found to have the highest ability to eliminate free radicals (0.32 ± 0.09 mg AAE/g), followed by Reed (0.28 ± 0.06 mg AAE/g) and Wurtz (0.21 ± 0.04). The difference between each avocado pulp is significantly different from one another (p < 0.05). However, Daieni Alves Vieira et al. [41] compared avocado pulp of different varieties (Hass, Margarida, Quintal and Fortuna) and found that Hass avocado pulp showed the lowest antioxidant potential compared to other avocado varieties.
For RPA, the rejected Wurtz avocado pulp had higher antioxidant potential (0.07 ± 0.03 mg AAE/g) compared to other varieties, namely, Hass (0.01 ± 0.04 mg AAE/g) and Reed (0.01 ± 0.01 mg AAE/g). However, the value is very small and is negligible, although the values are significantly different (p < 0.05) between Wurtz and other varieties. Furthermore, similar studies only report a milli amount of antioxidant activity. In a previous study, the avocado peel ranged from 63 to 742 mg ascorbic acid/g based on the different solvents used [42]. In another study, the methanolic extract of the avocado pulp ranged between 42 and 90 µg/mL depending on their concentration [43]. The values in the previous studies were higher than our studies, which might be due to differences in varieties, growing regions and extraction solvents.
For •OH-RSA, hydroxyl radicals (•OH) are produced in the presence of hydrogen peroxide and Fe2+ ion through the Fenton reaction [44]. Each avocado variety showed significantly different antioxidative potential, ranging from 0.07 to 0.51 mg AAE/g of dry samples with the highest value recorded in Hass and the lowest in Wurtz avocado pulp.
Next, FICA is a metal chelation transition assay. Antioxidant potential is measured by the chelating ability of ferrous ion. Phenolic compounds (Ph-OH) bind with a fraction of Fe2+, while the remaining Fe2+ ions can react with ferrozine (C20H12N4Na2O6S2) to form a ferrous ion–ferrozine complex which is stable and water-soluble under mild acid conditions (pH 6) [45]. The rejected Hass avocado pulp showed the highest antioxidant potential of 0.47 mg EDTA/g compared to other avocado varieties. However, this is the first paper to estimate antioxidant activity by FICA and phosphomolybdate assay.
In the phosphomolybdate assay, Wurtz avocado (0.27 ± 0.04 mg AAE/g) showed the highest antioxidant potential, followed by Reed (0.21 ± 0.03 mg AAE/g) and Hass (0.19 ± 0.05 mg AAE/g) varieties.

3.3. LC-ESI-QTOF-MS/MS-Based Characterization of Phenolic Compounds

The quantification of phenolic profiles of avocado pulp samples was carried out using LC-ESI-QTOF-MS/MS in both modes of ionization, negative and positive ([M − H]/[M + H]+). Compounds were tentatively characterized based on their mass to charge ratio (m/z) and MS spectra using Agilent LC-MS mass hunter qualitative software and the Personal Compounds Database and Library (PCDL). The criteria for the compounds to be further analyzed were mass error < 5 ppm and a PCDL library score of more than 80; thereby, compounds were further identified using MS/MS identification and m/z characterization (Table 2).
In the present study, a total of 64 phenolic compounds were characterized among three avocado pulp samples, including 15 phenolic acids, 33 flavonoids, 8 other polyphenols, 2 stilbenes and 6 lignans.

3.3.1. Phenolic Acids

Phenolic acids categorized into four subclasses, namely, hydroxybenzoic acids, hydroxycinnamic acids, hydroxyphenylacetic acids and hydroxyphenylpropanoic acids, were identified.
  • Hydroxycinnamic Acids
Compound 2 was observed in Wurtz avocado and characterized as p-coumaroyl malic acid with precursor ion [M − H] at m/z 279.0514, which was further identified due to the loss of C4H4O4 at m/z 163 and m/z 119 [46]. Compound 5 present in Reed avocado pulp was tentatively identified as sinapic acid with [M − H] at m/z 223.0617, and further confirmed by the MS2 experiment due to the loss of H2O and 2CHO from precursor ions at m/z 205 and m/z 163 [47]. Compound 6 (ferulic acid 4-O-glucoside) was detected with both ionization modes at m/z 355.1041, and further identification was achieved by the fragment losses of glucoside (162 Da), C7H13O (177 Da), C7H10O7 (206 Da) and C8H13O7 (221 Da) at m/z 193, m/z 178, m/z 149 and m/z 134, respectively [48].
In previous studies, the observation of p-coumaroyl malic acid was reported by Mpai and Sivakumar [49] in Hass avocado pulp. The presence of sinapic acid was consistent with the study of Sumitra et al. [36], which reported the presence of the compound in avocado and mango. Similarly, the observation of sinapic acid was reported in cauliflower [50]. 1-sinapoyl-2-feruloylgentiobiose compound was detected in Brassica oleracea in abundance, including broccoli and cabbage [51]. Caffeoylquinic acid and ferulic acid have been identified in various tropical fruits, including quince, mulberry mango, durian, avocado and grapefruit [52,53]. p-coumaroyl tartaric acid was identified in grapes [54]. In addition, phenylethanoid glycosides, including verbascoside, have been detected in Sideritis trojana, which is a herb plant that is used to treat cold [55].
  • Hydroxybenzoic Acids
Compound 10 was tentatively identified as 2-hydroxybenzoic acid at m/z 137.0241 in both ionization modes, which was further identified due to the characteristic loss of CO2 (44 Da) from the precursor ions at m/z 93 [48,56]. Compound 11 was detected in Reed avocado at m/z 185.0444 with positive ionization mode and was identified as 3-O-methylgallic acid due to the loss of CO2 (44 Da) at m/z 142.
Previously, Malakar et al. [57] detected salicylic acid (2-hydroxybenzoic acid) in Hass avocado pulp, which is similar to our results. Moreover, the existence of salicylic acid has been confirmed in fruit peels, including avocado, mango, pineapple, etc. [24].

3.3.2. Flavonoids

Flavonoids were the predominant category of phenolic compounds. A total of 33 flavonoids were identified and classified into eight subclasses, with five anthocyanins, eight flavonols, three flavones, seven isoflavonoids, three flavanols, three flavanones, three dihydrochalcones and one dihydroflavonol.
  • Anthocyanins
Compounds 17, 18 and 20 were present in Reed avocado, and were tentatively identified as delphinidin 3-O-glucosyl-glucoside, cyanidin 3,5-O-diglucoside and petunidin 3-O-(6″-acetyl-glucoside), respectively. Compounds 17 and 18 were detected with positive ionization mode at m/z 628.1630 and m/z 522.1372. Compound 20 was present in both modes at m/z 522.1372. Further confirmation was given by the loss of sugar moieties in the MS2 experiment [58]. Cyanidin glycosides, including cyanidin 3,5-O-diglucoside, was identified in pomegranate fruits [59].
  • Flavonols
Two kaempferol glycosides, Compounds 25 and 28, were detected in both modes with precursor ions at m/z 755.2069 and m/z 739.209 and were tentatively identified as kaempferol 3-O-glucosyl-rhamnosyl-galactoside and kaempferol 3-O-(2″-rhamnosyl-galactoside) 7-O-rhamnoside, respectively. In the MS2 experiment, kaempferol 3-O-glucosyl-rhamnosyl-galactoside compound was confirmed with the loss of glucoside. Kaempferol 3-O-(2″-rhamnosyl-galactoside) 7-O-rhamnoside peaks at m/z 593, m/z 447 and m/z 285 was detected with the removal of fragments such as C6H10O4, 2C6H10O4, 2C6H10O4 and C6H10O5.
  • Flavones
Compound 29 with both ionization modes at m/z 593.1506 was tentatively identified as apigenin 6,8-di-C-glucoside, and the MS2 experiment confirmed that peaks were detected at m/z 503 and m/z 473 due to the fragment removal at [M-H-90] and [M-H-120] [60]. Roowi and Crozier [61] reported the observation of apigenin 6,8-di-C-glucoside in tropical citrus fruits, including Citrus microcarpa, Citrus hystrix and Citrus suhuiensis.
  • Other Derivatives of Flavonoids
Compounds 40 and 41 were detected in Wurtz and Reed avocado pulp at m/z 611.1401 and m/z 289.0717, and were tentatively identified as prodelphinidin dimer B3 and (+)-catechin, respectively. In the MS2 experiment, prodelphinidin dimer B3 was found with characteristic peaks at m/z 469, m/z 311 and m/z 291, which were caused by the heterocyclic ring fission and the breakdown of dimer (Zalke, 2014). (+)-Catechin was identified with the fragment losses of CO2 (44 Da), flavonoid ring A (84 Da) and flavonoid ring B (110 Da) at m/z 245, m/z 205 and m/z 179, respectively [56].
Compound 42 was detected in both modes at m/z 741.2271 and tentatively identified as naringin 4′-O-glucoside, which was further confirmed by characteristic fragments at m/z 433 and m/z 271 [62]. Compound 43 was assigned as neoeriocitrin at m/z 595.1677 with negative mode due to the loss of rhamnoside and H2O at m/z 431, and rhamnoside and glucoside at m/z 287 [63,64].
Compounds 47 and 48 were detected in Wurtz and Reed avocado pulp with both modes at m/z 435.1298 and m/z 465.1040, which were identified as phloridzin and dihydromyricetin 3-O-rhamnoside, respectively. In the MS2 experiment, the loss of glucoside (162 Da) was identified at m/z 273 in phloridzin, and the removal of rhamnose (164 Da) was detected at m/z 301 in dihydromyricetin 3-O-rhamnoside [65].
Phloridzin was reported in the Nariño variety of avocado cultivated in Colombia [66]. The observation of 3-hydroxyphloretin 2′-O-glucoside was previously reported in apple fruits [67]. Neoeriocitrin was detected as a rich resource of phytochemicals in various citrus fruits, including mandarin, lemon, grapefruit, sweet orange, etc. [68].

3.3.3. Other Polyphenols

The LC-ESI-QTOF-MS/MS characterized a total of eight other polyphenols including tyrosols, hydroxyphenylpropenes, hydroxybenzaldehydes, curcuminoids, furanocoumarins and other polyphenols in three avocado varieties.
Compound 49 was detected in Wurtz and Reed avocado pulp in both ionization modes with precursor ion at m/z 195.0667. The MS2 experiment identified the compound as 3,4-DHPEA-AC due to the loss of C2H4O2 [69]. It has been reported previously that tyrosol derivatives were widely identified in olive oil (Di Maio et al., 2013).

3.3.4. Lignans and Stilbenes

Compounds 61 and 64 were detected in Wurtz and Reed avocado pulp and were identified as schisandrin C and pinoresinol, respectively. Schisandrin C was tentatively identified at m/z 385.1651 with positive ionization mode, which was further confirmed by the MS/MS analysis due to the removal of CH3 15 Da at m/z 370, C5H10 (70 Da) at m/z 315, and CH3 and C5H10 (85 Da) at m/z 300 (Yang et al., 2017). MS/MS analysis identified Compound 64 based on the characteristic loss of CH3 (15 Da) at m/z 342, C2H6 (30 Da) at m/z 327, CO2 (44 Da) at m/z 313 and C8H8O2 (136 Da) at m/z 221 [48].

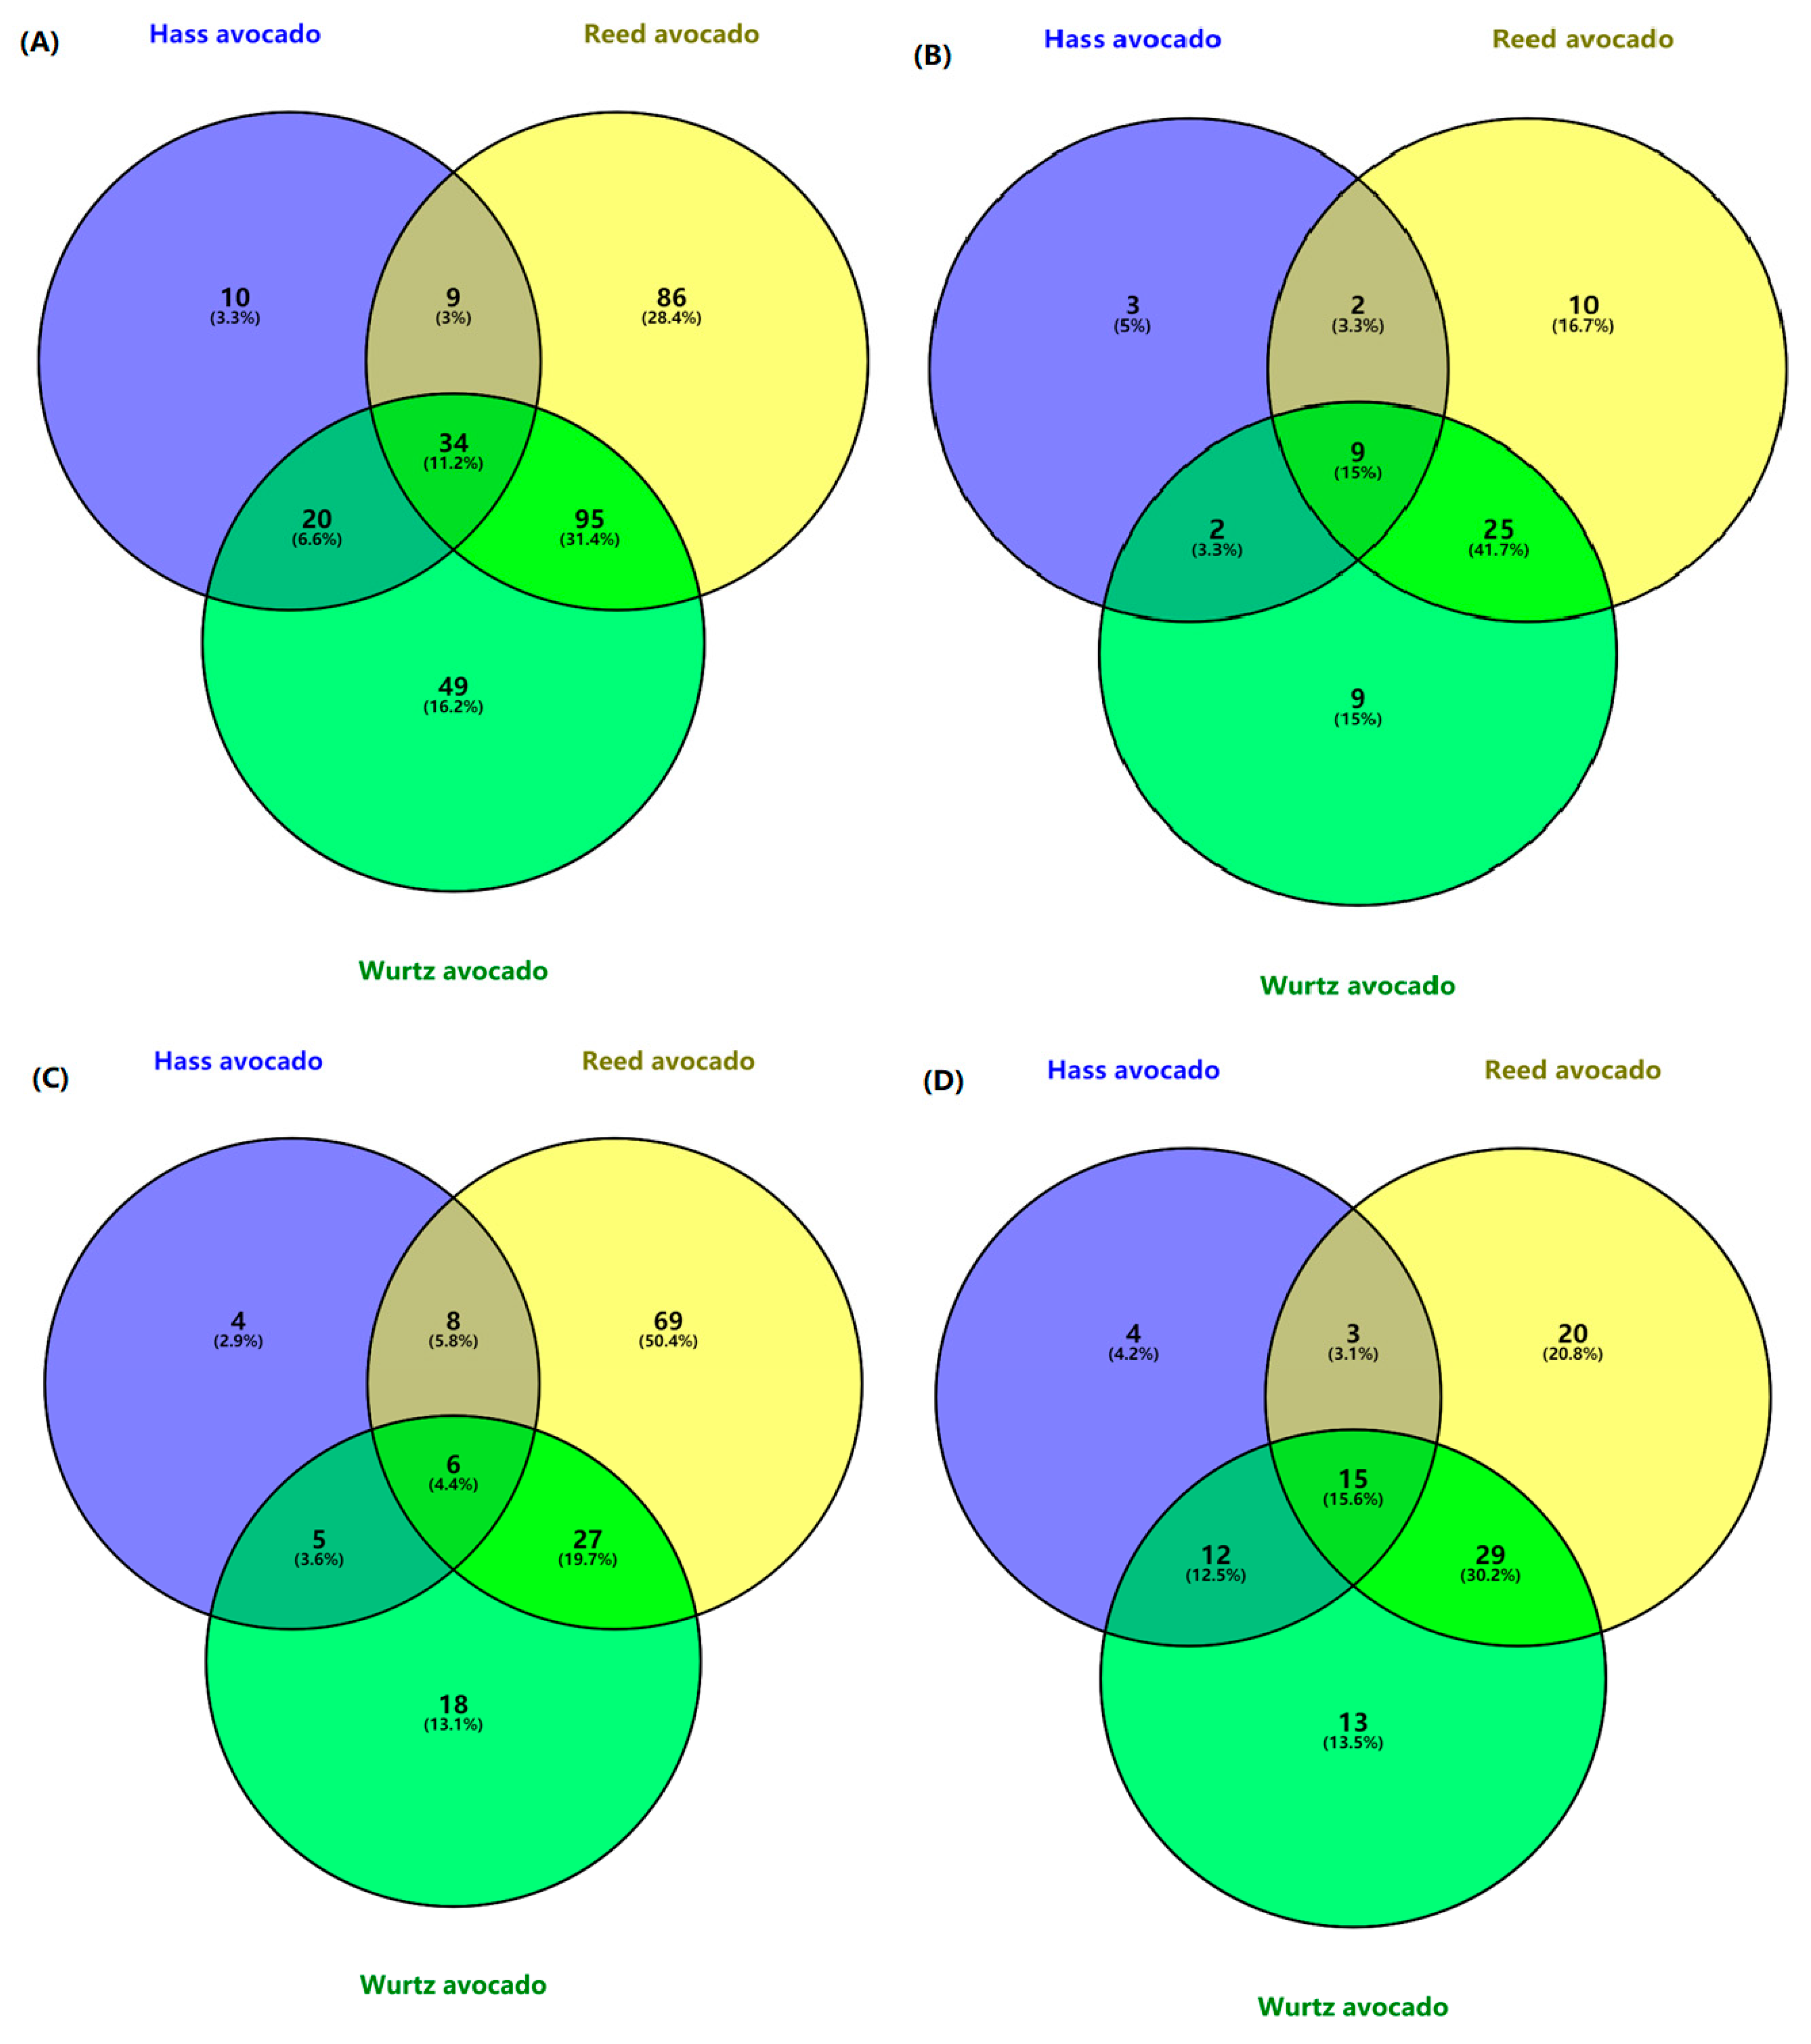
3.4. Distribution of Phenolic Compounds—Venn Diagram

The phenolic compounds in three avocado pulp varieties, Hass, Wurtz and Reed, are shown in Venn diagrams (Figure 1). The results of the Venn diagrams emphasize that the content of phenolic compounds, including phenolic acids, flavonoids, lignans, stilbenes and other compounds, varied among the different varieties of avocado pulp, and further exploration is helpful to indicate the correlation among phenolic content, avocado varieties and growing regions.
According to Figure 1, a total of 303 phenolic compounds were tentatively identified in rejected avocado pulp of the three varieties. In total, 10 (3.3%), 86 (28.4%) and 49 (16.2%) phenolic compounds were detected in rejected Hass, Reed and Wurtz avocados, respectively. Moreover, 11.2% of compounds were present in all three varieties. A total of 95 (31.4%) compounds were identified in both Reed and Wurtz avocado pulp. However, only 9 (3%) were characterized in Hass and Reed avocado pulp. In Figure 1B, 15% of the phenolic acids were present in all varieties. The percentage of unique phenolic acids in Hass, Reed and Wurtz avocado pulp was 5%, 16.7% and 5%, respectively. Similar to the total phenolic compound, the highest numbers of phenolic acids were detected in Reed and Wurtz avocado pulp, which accounted for 41.7% of the phenolic acids. Flavonoids and other phenolic compounds shown in Figure 1 C,D amounted to 4.4% and 15.6%, respectively.
The total phenolic compounds, phenolic acids, flavonoids and other common phenolic compounds shared among the samples are low. This indicates that the difference in phenolic content among different varieties leads to differences in antioxidant activities. Stefano et al. [70] identified protocatechuic acid with a concentration ranging from 0 to 1.07 mg analyte/kg based on fresh sample weight in Hass, Orotwa, Pinkerton, Rincon, Bacon and Fuerte avocados. Additionally, Reed avocado had the highest number of unique compounds in total phenolic compounds, phenolic acids and flavonoids. The results were supported by phenolic content estimation assays. Reed avocado had the highest values in TPC and TFC. Villa-Rodríguez, Molina-Corral, Ayala-Zavala, Olivas and González-Aguilar [32] reported that kaempferol, a flavonoid derivative, decreases during ripening. The studies report that the phenolic profile might have changed compared to fresh samples due to deterioration and other metabolism processes [71].
The Venn diagram shows that the variety and growing regions of avocados may affect phenolic content in samples, and the differences in the composition of phenolic compounds were identified. Further study is necessary to explore the influences of variety on targeted components.

3.5. HPLC-PDA Quantification of Phenolic Compounds

HPLC was used for the quantification of compounds [72]. The quantification analysis of targeted phenolic compounds was based on the peak area upon comparison with reference standards. A total of ten phenolic compounds were quantified. They were five phenolic acids, i.e., gallic acid, protocatechuic acid, p-hydroxybenzoic acid, chlorogenic acid and caffeic acid, and five flavonoids, namely, catechin, epicatechin, epicatechin gallate, quercetin and kaempferol. The result was represented as mg/g of fresh sample weight (Table 3).
In the study, five phenolic acids were quantified in three varieties of rejected avocado pulp samples. In Hass avocado pulp, four out of five phenolic acids were detected: gallic acid (Compound 1), protocatechuic acid (Compound 2), chlorogenic acid (Compound 4) and caffeic acid (Compound 5). Gallic acid (Compound 1), chlorogenic acid (Compound 4) and caffeic acid (Compound 5) were significantly higher among three varieties. Previously, protocatechuic acid and caffeic acid were reported to have 0.37 ± 0.02 and 2.26 ± 0.10 μg/g based on dry weight in avocado samples [34]. Moreover, catechin was previously quantified to have 3.3 ± 0.3 mg/100 g based on dry weight in Hass avocado pulp [73].
In Wurtz avocados, protocatechuic acid (Compound 2) was higher when compared to other varieties. p-hydroxybenzoic acid (Compound 3) was exclusively detected in Wurtz and Reed avocado pulp. Previously, protocatechuic acid was reported with a concentration of 0 to 1.07 mg analyte/kg based on fresh sample weight in six different avocado varieties, namely, Hass, Orotwa, Pinkerton, Rincon, Bacon and Fuerte [70].
Four flavonoids were detected in Hass avocado, including catechin (Compound 6), epicatechin (Compound 7), quercetin (Compound 9) and kaempferol (Compound 10). Epicatechin gallate (Compound 8) was only quantified in Wurtz and Reed avocados. Catechin (Compound 6) was higher in Reed avocado, followed by Hass and Wurtz. Epicatechin (Compound 7) were quantified with the highest value in Wurtz avocados, while quercetin (Compound 9) displayed significantly (p ≤ 0.05) lower values among the three varieties. Catechin (Compound 6), quercetin (Compound 9) and kaempferol (Compound 10) had higher concentrations in Reed avocado, which supported the results of the total flavonoid content in phenolic estimation. Previous study has reported that the phenolic profile differs according to the stage of ripening [32].

4. Conclusions

In this study, we analyzed rejected avocado pulp of three varieties, Hass, Reed and Wurtz. Hass avocado pulp contained the highest bioactive values in almost all antioxidant assays due to its high phenolic content (0.17 mg/GAE g). The most dominant phenolic in rejected avocados is chlorogenic acid, ranging from 13.49 mg/g to 21.36 mg/g. Additionally, a total of 64 phenolic compounds were identified in rejected avocado cultivars, with 10 in Hass avocado pulp, 31 in Wurtz avocado pulp and 45 in Reed avocado pulp. In HPLC-PDA quantification, chlorogenic acid (21.36 mg/g f.w.), epicatechin (14.24 mg/g f.w.) and quercetin (21.47 mg/g f.w.) were detected to be the highest in Hass, Wurtz and Reed avocado pulp, respectively. Given the demonstrated antioxidant activities and phenolic profiles, the results of this study can be used for further potential guidance in the recycling of rejected avocados as an ingredient for drugs or pharmaceuticals.

Author Contributions

Conceptualization, methodology, formal analysis, validation and investigation, S.F., Y.Q., L.S., M.G., N.A.A.Z., S.G. and H.A.R.S.; resources, H.A.R.S.; writing—original draft preparation, S.F. and H.A.R.S.; writing—review and editing, S.F., Y.Q., L.S., M.G., N.A.A.Z., S.G. and H.A.R.S.; supervision, H.A.R.S.; idea sharing, H.A.R.S.; funding acquisition, H.A.R.S. All authors have read and agreed to the published version of the manuscript.

Funding

Hafiz Suleria is the recipient of an Australian Research Council—Discovery Early Career Award (ARC-DECRA—DE220100055) funded by the Australian Government. This research was funded by the University of Melbourne under the McKenzie Fellowship Scheme (grant no. UoM-18/21), the Future Food Hallmark Research Initiative Funds (grant no. UoM-21/23) and Collaborative Research Development Grant (grant no. UoM-21/23) funded by the Faculty of Veterinary and Agricultural Sciences, the University of Melbourne, Australia.

Institutional Review Board Statement

Not applicable.

Informed Consent Statement

Not applicable.

Acknowledgments

We would like to thank Nicholas Williamson, Shuai Nie and Michael Leeming from the Mass Spectrometry and Proteomics Facility, Bio21 Molecular Science and Biotechnology Institute, the University of Melbourne, VIC, Australia for providing access and support for the use of HPLC-PDA and LC-ESI-QTOF-MS/MS and data analysis. We would like to thank The Future Food Hallmark Research Initiative at the University of Melbourne, Australia. We would like to thank researchers of the Hafiz Suleria group from the School of Agriculture and Food, Faculty of Veterinary and Agricultural Sciences, the University of Melbourne for their incredible support.

Conflicts of Interest

The authors declare no conflict of interest.

References

  1. Lebersorger, S.; Schneider, F. Food loss rates at the food retail, influencing factors and reasons as a basis for waste prevention measures. Waste Manag. 2014, 34, 1911–1919. [Google Scholar] [CrossRef] [PubMed]
  2. Mazhar, M.; Joyce, D.; Hofman, P.; Vu, N. Factors contributing to increased bruise expression in avocado (Persea americana M.) cv. ‘Hass’ fruit. Postharvest Biol. Technol. 2018, 143, 58–67. [Google Scholar] [CrossRef]
  3. Parfitt, J.; Barthel, M.; Macnaughton, S. Food waste within food supply chains: Quantification and potential for change to 2050. Philos. Trans. Biol. Sci. 2010, 365, 3065–3081. [Google Scholar] [CrossRef] [PubMed]
  4. Ben-Othman, S.; Joudu, I.; Rajeev, B. Bioactives from agri-food wastes: Present insights and future challenges. Molecules 2020, 25, 510. [Google Scholar] [CrossRef]
  5. Cheok, C.Y.; Gun Hean, C.; Noranizan Mohd, A.; Norhayati, H.; Nur Hanani Zainal, A.; Rabiha, S.; Russly Abdul, R. Current trends of tropical fruit waste utilization. Crit. Rev. Food Sci. Nutr. 2018, 58, 335–361. [Google Scholar] [CrossRef]
  6. Grosso, G. Effects of Polyphenol-Rich Foods on Human Health. Nutrients 2018, 10, 1089. [Google Scholar] [CrossRef]
  7. Francesco, P.; Daniele, S.; Giorgia, S.; Francesca, Z.; Ilaria, Z. Polyphenol Health Effects on Cardiovascular and Neurodegenerative Disorders: A Review and Meta-Analysis. Int. J. Mol. Sci. 2019, 20, 351. [Google Scholar] [CrossRef]
  8. García-Vargas, M.C.; del Mar Contreras, M.; Gómez-Cruz, I.; Romero-García, J.M.; Castro, E. Avocado-derived biomass: Chemical composition and antioxidant potential. Proceedings 2021, 70, 100. [Google Scholar] [CrossRef]
  9. Dembitsky, V.M.; Poovarodom, S.; Leontowicz, H.; Leontowicz, M.; Vearasilp, S.; Trakhtenberg, S.; Gorinstein, S. The multiple nutrition properties of some exotic fruits: Biological activity and active metabolites. Food Res. Int. 2011, 44, 1671–1701. [Google Scholar] [CrossRef]
  10. Dreher, M.L.; Davenport, A.J. Hass avocado composition and potential health effects. Crit. Rev. Food Sci. Nutr. 2013, 53, 738–750. [Google Scholar] [CrossRef] [Green Version]
  11. Gorinstein, S.; Haruenkit, R.; Poovarodom, S.; Vearasilp, S.; Ruamsuke, P.; Namiesnik, J.; Leontowicz, M.; Leontowicz, H.; Suhaj, M.; Sheng, G.P. Some analytical assays for the determination of bioactivity of exotic fruits. Phytochem. Anal. 2010, 21, 355–362. [Google Scholar] [CrossRef] [PubMed]
  12. Kosinska, A.; Karamac, M.; Estrella, I.; Hernandez, T.; Bartolome, B.; Dykes, G.A. Phenolic compound profiles and antioxidant capacity of Persea americana Mill. peels and seeds of two varieties. J. Agric. Food Chem. 2012, 60, 4613–4619. [Google Scholar] [CrossRef] [PubMed]
  13. Mazhar, M.S.; Joyce, D.C.; Collins, R.J. Bruising in Avocado (Persea americana M.) ‘HASS’ Supply Chains in Queensland Australia: Ripener to Retailer. In Proceedings of the 2014 ASHS Annual Conference, Orlando, FL, USA, 28–31 July 2014; Volume 49, p. S205. [Google Scholar]
  14. Van Zeebroeck, M.; Van Linden, V.; Ramon, H.; De Baerdemaeker, J.; Nicolaï, B.M.; Tijskens, E. Impact damage of apples during transport and handling. Postharvest Biol. Technol. 2007, 45, 157–167. [Google Scholar] [CrossRef]
  15. Mazhar, M.; Joyce, D.C.; Petty, J.; Taylor, L.; Symonds, N.; Hofman, P.J. Skin spotting situation at retail level in Australian avocados. Acta Hortic. 2016, 2016, 171–176. [Google Scholar] [CrossRef]
  16. Gamble, J.; Harker, F.R.; Jaeger, S.R.; White, A.; Bava, C.; Beresford, M.; Stubbings, B.; Wohlers, M.; Hofman, P.J.; Marques, R.; et al. The impact of dry matter, ripeness and internal defects on consumer perceptions of avocado quality and intentions to purchase. Postharvest Biol. Technol. 2010, 57, 35–43. [Google Scholar] [CrossRef]
  17. Williamson, G. The role of polyphenols in modern nutrition. Nutr. Bull. 2017, 42, 226–235. [Google Scholar] [CrossRef]
  18. Haminiuk, C.W.I.; Maciel, G.M.; Plata-Oviedo, M.S.V.; Peralta, R.M. Phenolic compounds in fruits—An overview. Int. J. Food Sci. Technol. 2012, 47, 2023–2044. [Google Scholar] [CrossRef]
  19. Turkmen, N.; Sari, F.; Velioglu, Y.S. Effects of extraction solvents on concentration and antioxidant activity of black and black mate tea polyphenols determined by ferrous tartrate and Folin–Ciocalteu methods. Food Chem. 2006, 99, 835–841. [Google Scholar] [CrossRef]
  20. Gu, C.; Howell, K.; Dunshea, F.R.; Suleria, H.A.R. LC-ESI-QTOF/MS Characterisation of Phenolic Acids and Flavonoids in Polyphenol-Rich Fruits and Vegetables and Their Potential Antioxidant Activities. Antioxidants 2019, 8, 405. [Google Scholar] [CrossRef]
  21. Tang, J.; Dunshea, F.R.; Suleria, H.A.R. LC-ESI-QTOF/MS Characterization of Phenolic Compounds from Medicinal Plants (Hops and Juniper Berries) and Their Antioxidant Activity. Foods 2020, 9, 7. [Google Scholar] [CrossRef] [Green Version]
  22. Subbiah, V.; Zhong, B.; Nawaz, M.A.; Barrow, C.J.; Dunshea, F.R.; Suleria, H.A. Screening of Phenolic Compounds in Australian Grown Berries by LC-ESI-QTOF-MS/MS and Determination of Their Antioxidant Potential. Antioxidants 2021, 10, 26. [Google Scholar] [CrossRef] [PubMed]
  23. Wang, W.; Bostic, T.R.; Gu, L. Antioxidant capacities, procyanidins and pigments in avocados of different strains and cultivars. Food Chem. 2010, 122, 1193–1198. [Google Scholar] [CrossRef]
  24. Suleria, H.A.R.; Barrow, C.J.; Dunshea, F.R. Screening and Characterization of Phenolic Compounds and Their Antioxidant Capacity in Different Fruit Peels. Foods 2020, 9, 1206. [Google Scholar] [CrossRef] [PubMed]
  25. Rocchetti, G.; Gianluca, M.; Luigi, L.; Patricia, C.; Sara, C. UHPLC-ESI-QTOF-MS phenolic profiling and antioxidant capacity of bee pollen from different botanical origin. Int. J. Food Sci. Technol. 2019, 54, 335–346. [Google Scholar] [CrossRef]
  26. Severo, J.; Tiecher, A.; Chaves, F.C.; Silva, J.A.; Rombaldi, C.V. Gene transcript accumulation associated with physiological and chemical changes during developmental stages of strawberry cv. Camarosa. Food Chem. 2011, 126, 995–1000. [Google Scholar] [CrossRef]
  27. Ferreira, I.C.; Baptista, P.; Vilas-Boas, M.; Barros, L. Free-radical scavenging capacity and reducing power of wild edible mushrooms from northeast Portugal: Individual cap and stipe activity. Food Chem. 2007, 100, 1511–1516. [Google Scholar] [CrossRef]
  28. Smirnoff, N.; Cumbes, Q.J. Hydroxyl radical scavenging activity of compatible solutes. Phytochemistry 1989, 28, 1057–1060. [Google Scholar] [CrossRef]
  29. Dinis, T.C.; Madeira, V.M.; Almeida, L.M. Action of phenolic derivatives (acetaminophen, salicylate, and 5-aminosalicylate) as inhibitors of membrane lipid peroxidation and as peroxyl radical scavengers. Arch. Biochem. Biophys. 1994, 315, 161–169. [Google Scholar] [CrossRef]
  30. Zhong, B.; Robinson, N.A.; Warner, R.D.; Barrow, C.J.; Dunshea, F.R.; Suleria, H.A.R. LC-ESI-QTOF-MS/MS Characterization of Seaweed Phenolics and Their Antioxidant Potential. Mar. Drugs 2020, 18, 331. [Google Scholar] [CrossRef]
  31. Golukcu, M.; Ozdemir, F. Changes in phenolic composition of avocado cultivars during harvesting time. Chem. Nat. Compd. 2010, 46, 112–115. [Google Scholar] [CrossRef]
  32. Villa-Rodríguez, J.A.; Molina-Corral, F.J.; Ayala-Zavala, J.F.; Olivas, G.I.; González-Aguilar, G.A. Effect of maturity stage on the content of fatty acids and antioxidant activity of ‘Hass’ avocado. Food Res. Int. 2011, 44, 1231–1237. [Google Scholar] [CrossRef]
  33. Yang, J.; Liu, X.; Zhang, X.; Jin, Q.; Li, J. Phenolic Profiles, Antioxidant Activities, and Neuroprotective Properties of Mulberry (Morus atropurpurea Roxb.) Fruit Extracts from Different Ripening Stages. J. Food Sci. 2016, 81, C2439–C2446. [Google Scholar] [CrossRef] [PubMed]
  34. Poovarodom, S.; Haruenkit, R.; Vearasilp, S.; Namiesnik, J.; Cvikrová, M.; Martincová, O.; Ezra, A.; Suhaj, M.; Ruamsuke, P.; Gorinstein, S. Comparative characterisation of durian, mango and avocado. Int. J. Food Sci. Technol. 2010, 45, 921–929. [Google Scholar] [CrossRef]
  35. Princewill-Ogbonna, I.L.; Ogbonna, P.C.; Ogujiofor, I.B. Proximate Composition, Vitamin, Mineral and biologically Active Compounds Levels in Leaves of Mangifera indica (Mango), Persea americana (Avocado pea), and Annona muricata (Sour sop). J. Appl. Sci. Environ. Manag. 2019, 23, 65–74. [Google Scholar] [CrossRef]
  36. Shahidi, F.; Ying, Z. Measurement of antioxidant activity. J. Funct. Foods 2015, 18, 757–781. [Google Scholar] [CrossRef]
  37. Contreras-Guzmán, E.S.; Strong III, F.C. Determination of tocopherols (vitamin E) by reduction of cupric ion. J. Assoc. Off. Anal. Chem. 1982, 65, 1215–1221. [Google Scholar] [CrossRef]
  38. Lahmass, I.; Ouahhoud, S.; Elmansuri, M.; Sabouni, A.; Elyoubi, M.; Benabbas, R.; Choukri, M.; Saalaoui, E. Determination of Antioxidant Properties of Six By-Products of Crocus sativus L. (Saffron) Plant Products. Waste Biomass Valoriz. 2018, 9, 1349–1357. [Google Scholar] [CrossRef]
  39. Morais, D.R.; Alexandra, C.H.F.S.; Eduardo, M.S.; Eliza, M.R.; Elton Guntendorfer, B.; Jesuí, V.V.; Marcos, N.E.; Sheisa, C.S. Antioxidant activity, phenolics and UPLC–ESI(–)–MS of extracts from different tropical fruits parts and processed peels. Food Res. Int. 2015, 77, 392–399. [Google Scholar] [CrossRef]
  40. Bunea, A.; Rugina, O.D.; Pintea, A.M.; Sconta, Z.; Bunea, C.I.; Socaciu, C. Comparative polyphenolic content and antioxidant activities of some wild and cultivated blueberries from Romania. Not. Bot. Horti Agrobot. Cluj-Napoca 2011, 39, 70–76. [Google Scholar] [CrossRef]
  41. Daieni Alves Vieira, A.; Giovani Andrey Bet, H.; Alessandra Maria, D.; Sérgio Luiz Colucci de, C.; Caroline Mariana de, A.; Clayton Antunes, M.; Tatiana Shioji, T.; Solange Maria, C. Antioxidant and antibacterial activity and preliminary toxicity analysis of four varieties of avocado (Persea americana Mill.). Braz. J. Food Technol. 2019, 22, e2018044. [Google Scholar] [CrossRef]
  42. Antasionasti, I.; Riyanto, S.; Rohman, A. Antioxidant activities and phenolics contents of avocado (Persea americana Mill.) peel in vitro. Res. J. Med. Plants 2017, 11, 55–56. [Google Scholar]
  43. Asaolu, M.; Asaolu, S.; Fakunle, J.B.; Emman-Okon, B.; Ajayi, E.; Togun, R. Evaluation of In-Vitro Antioxidant Activities of Methanol Extracts of Persea americana and Cnidosculus aconitifolius. Pak. J. Nutr. 2010, 9, 1074–1077. Available online: http://repository.elizadeuniversity.edu.ng/jspui/handle/20.500.12398/434 (accessed on 5 August 2022). [CrossRef]
  44. Lipinski, B. Hydroxyl radical and its scavengers in health and disease. Oxid. Med. Cell. Longev. 2011, 2011, 809696. [Google Scholar] [CrossRef]
  45. Gulcin, İ. Antioxidants and antioxidant methods: An updated overview. Arch. Toxicol. 2020, 94, 651–715. [Google Scholar] [CrossRef] [PubMed]
  46. Abu-Reidah, I.M.; Arraez-Roman, D.; Warad, I.; Fernandez-Gutierrez, A.; Segura-Carretero, A. UHPLC/MS2-based approach for the comprehensive metabolite profiling of bean (Vicia faba L.) by-products: A promising source of bioactive constituents. Food Res. Int. 2017, 93, 87–96. [Google Scholar] [CrossRef] [PubMed]
  47. Geng, C.-A.; Chen, H.; Chen, X.-L.; Zhang, X.-M.; Lei, L.-G.; Chen, J.-J. Rapid characterization of chemical constituents in Saniculiphyllum guangxiense by ultra fast liquid chromatography with diode array detection and electrospray ionization tandem mass spectrometry. Int. J. Mass Spectrom. 2014, 361, 9–22. [Google Scholar] [CrossRef]
  48. Wang, X.; Liu, J.; Zhang, A.; Sun, H.; Zhang, Y. Chapter 23—Systematic Characterization of the Absorbed Components of Acanthopanax senticosus Stem. In Serum Pharmacochemistry of Traditional Chinese Medicine; Academic Press; Cambridge, MA, USA, 2017; pp. 313–336. [Google Scholar] [CrossRef]
  49. Mpai, S.; Sivakumar, D. Influence of growing seasons on metabolic composition, and fruit quality of avocado cultivars at ‘ready-to-eat stage’. Sci. Hortic. 2020, 265, 109159. [Google Scholar] [CrossRef]
  50. Kaluzewicz, A.; Lisiecka, J.; Gasecka, M.; Krzesinski, W.; Spizewski, T.; Zaworska, A.; Fraszczak, B. The effects of plant density and irrigation on phenolic content in cauliflower. Hortic. Sci. 2017, 44, 178–185. [Google Scholar] [CrossRef]
  51. Pablo, V.; María Elena, C.; Pilar, S.; Marta, F. Phenolic Compounds in Brassica Vegetables. Molecules 2010, 16, 251–280. [Google Scholar] [CrossRef]
  52. Dillenburg Meinhart, A.; Fernanda Mateus, D.; Helena Teixeira, G.; José Teixeira, F.; Letícia Cardoso da, S.; Lívia da Silva, C.; Lucas, C.o.; Milton de Jesus, F.; Roger, W. Chlorogenic and Caffeic Acids in 64 Fruits Consumed in Brazil. Food Chem. 2019, 286, 51–63. [Google Scholar] [CrossRef]
  53. Kelebek, H. Sugars, organic acids, phenolic compositions and antioxidant activity of Grapefruit (Citrus paradisi) cultivars grown in Turkey. Ind. Crops Prod. 2010, 32, 269–274. [Google Scholar] [CrossRef]
  54. Del-Castillo-Alonso, M.Á.; Diago, M.P.; Monforte, L.; Tardaguila, J.; Martínez-Abaigar, J.; Núñez-Olivera, E. Effects of UV exclusion on the physiology and phenolic composition of leaves and berries of Vitis vinifera cv. Graciano. J. Sci. Food Agric. 2015, 95, 409–416. [Google Scholar] [CrossRef] [PubMed]
  55. Kirmizibekmez, H.; Ariburnu, E.; Masullo, M.; Festa, M.; Capasso, A.; Yesilada, E.; Piacente, S. Iridoid, phenylethanoid and flavonoid glycosides from Sideritis trojana. Fitoterapia 2012, 83, 130–136. [Google Scholar] [CrossRef] [PubMed]
  56. Escobar-Avello, D.; Lozano-Castellon, J.; Mardones, C.; Perez, A.J.; Saez, V.; Riquelme, S.; Baer, D.V.; Vallverdu-Queralt, A. Phenolic profile of grape canes: Novel compounds identified by LC-ESI-LTQ-Orbitrap-MS. Molecules 2019, 24, 3763. [Google Scholar] [CrossRef]
  57. Malakar, S.; Gibson, P.R.; Barrett, J.S.; Muir, J.G. Naturally occurring dietary salicylates: A closer look at common Australian foods. J. Food Compos. Anal. 2017, 57, 31–39. [Google Scholar] [CrossRef]
  58. Kim, I.; Lee, J. Variations in Anthocyanin Profiles and Antioxidant Activity of 12 Genotypes of Mulberry (Morus spp.) Fruits and Their Changes during Processing. Antioxidants 2020, 9, 242. [Google Scholar] [CrossRef]
  59. Legua, P.; Forner-Giner, M.A.; Nuncio-Jauregui, N.; Hernandez, F. Polyphenolic compounds, anthocyanins and antioxidant activity of nineteen pomegranate fruits: A rich source of bioactive compounds. J. Funct. Foods 2016, 23, 628–636. [Google Scholar] [CrossRef]
  60. Singh, A.; Kumar, S.; Bajpai, V.; Reddy, T.J.; Rameshkumar, K.B.; Kumar, B. Structural characterization of flavonoid C- and O-glycosides in an extract of Adhatoda vasica leaves by liquid chromatography with quadrupole time-of-flight mass spectrometry. Rapid Commun. Mass Spectrom. RCM 2015, 29, 1095–1106. [Google Scholar] [CrossRef]
  61. Roowi, S.; Crozier, A. Flavonoids in Tropical Citrus Species. J. Agric. Food Chem. 2011, 59, 12217–12225. [Google Scholar] [CrossRef]
  62. Yang, Y.; Xi Juan, Z.; Yu, P.; Zhiqin, Z. Identification of the chemical compositions of Ponkan peel by ultra performance liquid chromatography coupled with quadrupole time-of-flight mass spectrometry. Anal. Methods 2016, 8, 893–903. [Google Scholar] [CrossRef]
  63. Zeng, X.; Su, W.; Zheng, Y.; Liu, H.; Li, P.; Zhang, W.; Liang, Y.; Bai, Y.; Peng, W.; Yao, H. UFLC-Q-TOF-MS/MS-Based Screening and Identification of Flavonoids and Derived Metabolites in Human Urine after Oral Administration of Exocarpium Citri Grandis Extract. Molecules 2018, 23, 895. [Google Scholar] [CrossRef] [PubMed]
  64. Kelebek, H.; Kadiroğlu, P.; Demircan, N.B.; Selli, S. Screening of bioactive components in grape and apple vinegars: Antioxidant and antimicrobial potential. J. Inst. Brew. 2017, 123, 407–416. [Google Scholar] [CrossRef]
  65. Ivanova, V.; Doernyei, A.; Mark, L.; Vojnoski, B.; Stafilov, T.; Stefova, M.; Kilar, F. Polyphenolic content of Vranec wines produced by different vinification conditions. Food Chem. 2011, 124, 316–325. [Google Scholar] [CrossRef]
  66. Johanna, C.R.; Silvia, C.; Coralia, O.; Nelson, H. Analysis of Phenolic Composition of Byproducts (Seeds and Peels) of Avocado (Persea americana Mill.) Cultivated in Colombia. Molecules 2019, 24, 3209. [Google Scholar] [CrossRef]
  67. De Paepe, D.; Valkenborg, D.; Noten, B.; Servaes, K.; Diels, L.; De Loose, M.; Van Droogenbroeck, B.; Voorspoels, S. Variability of the phenolic profiles in the fruits from old, recent and new apple cultivars cultivated in Belgium. Metabolomics 2015, 11, 739–752. [Google Scholar] [CrossRef]
  68. Barreca, D.; Gattuso, G.; Bellocco, E.; Calderaro, A.; Trombetta, D.; Smeriglio, A.; Lagana, G.; Daglia, M.; Meneghini, S.; Nabavi, S.M. Flavanones: Citrus phytochemical with health-promoting properties. BioFactors 2017, 43, 495–506. [Google Scholar] [CrossRef]
  69. Drira, M.; Kelebek, H.; Guclu, G.; Jabeur, H.; Selli, S.; Bouaziz, M. Targeted analysis for detection the adulteration in extra virgin olive oil’s using LC-DAD/ESI–MS/MS and combined with chemometrics tools. Eur. Food Res. Technol. 2020, 246, 1661–1677. [Google Scholar] [CrossRef]
  70. Stefano, V.d.; Avellone, G.; Bongiorno, D.; Indelicato, S.; Massenti, R.; Bianco, R.L. Quantitative evaluation of the phenolic profile in fruits of six avocado (Persea americana) cultivars by ultra-high-performance liquid chromatography-heated electrospray-mass spectrometry. Int. J. Food Prop. 2017, 20, 1302–1312. [Google Scholar] [CrossRef]
  71. Santos, J.; Ibáñez, E.; Herrero, M.; Oliveira, M.B.P.P. Phenolic profile evolution of different ready-to-eat baby-leaf vegetables during storage. J. Chromatogr. 2014, 1327, 118–131. [Google Scholar] [CrossRef]
  72. Ignat, I.; Volf, I.; Popa, V.I. A critical review of methods for characterisation of polyphenolic compounds in fruits and vegetables. Food Chem. 2011, 126, 1821–1835. [Google Scholar] [CrossRef] [PubMed]
  73. Rodriguez-Carpena, J.G.; Morcuende, D.; Andrade, M.J.; Kylli, P.; Estevez, M. Avocado (Persea americana Mill.) phenolics, in vitro antioxidant and antimicrobial activities, and inhibition of lipid and protein oxidation in porcine patties. J. Agric. Food Chem. 2011, 59, 5625–5635. [Google Scholar] [CrossRef] [PubMed]
Figure 1. Venn diagrams of phenolic compounds in various rejected avocado samples. (A) The relations of total phenolic compounds in different avocados; (B) the relations of phenolic acids in different samples; (C) the relations of flavonoids in different avocados; (D) the relations of other phenolic compounds in rejected samples.
Processes 10 01747 g001
Table 1. Polyphenol content estimation and antioxidant capacity of rejected avocados.
Antioxidant AssaysHass AvocadoWurtz AvocadoReed Avocado
TPC (mg GAE/g)0.17 ± 0.06 b0.16 ± 0.03 b0.21 ± 0.04 a
TFC (mg QE/g)0.04 ± 0.03 a0.02 ± 0.04 b0.05 ± 0.05 a
TTC (mg CE/g)0.02 ± 0.01_0.01 ± 0.02
DPPH (mg AAE/g)0.32 ± 0.09 a0.24 ± 0.07 b0.12 ± 0.05 c
FRAP (mg AAE/g)0.13 ± 0.05 a0.09 ± 0.01 b0.04 ± 0.03 c
ABTS (mg AAE/g)0.32 ± 0.09 a0.21 ± 0.04 c0.28 ± 0.06 b
RPA (mg AAE/g)0.01 ± 0.04 b0.07 ± 0.03 a0.01 ± 0.01 b
•OH-RSA (mg AAE/g)0.51 ± 0.01 a0.07 ± 0.01 c0.17 ± 0.02 b
FICA (mg EDTA/g)0.47 ± 0.12 a0.18 ± 0.02 c0.34 ± 0.08 b
PMA (mg AAE/g)0.19 ± 0.05 c0.27 ± 0.04 a0.21 ± 0.03 b
The data are expressed in mg equivalents per gram based on fresh weight and shown as mean ± standard deviation (SD) (n = 3); the lettering (a,b,c) indicates the significant difference (p < 0.05) using one-way analysis of variance (ANOVA) and Tukey’s HSD test. GAE: gallic acid equivalents; QE: quercetin equivalents; CE: catechin equivalents; AAE: ascorbic acid equivalents, EDTA: ethylenediaminetetraacetic acid.
Table 2. Characterization of phenolic compounds in rejected avocados by LC-ESI-QTOF-MS/MS.
No.Proposed CompoundsMolecular FormulaRT
(min)
Ionization Molecular WeightTheoretical
(m/z)
Observed
(m/z)
Error
(ppm)
MS2 Product IonsSamples
Phenolic acid
Hydroxycinnamic acids
11,5-Dicaffeoylquinic acidC25H24O124.181[M − H]516.1268515.1195515.11960.2353, 335, 191, 179Wurtz
2p-Coumaroyl malic acidC13H12O75.953[M − H]280.0583279.0510279.05141.4163, 119Wurtz
3p-Coumaroyl tartaric acidC13H12O88.935** [M − H]296.0532295.0459295.0451−2.7115* Wurtz, Reed
43-Caffeoylquinic acidC16H18O924.757** [M − H]354.0951353.0878353.08913.7253, 190, 144* Wurtz, Reed
5Sinapic acidC11H12O529.019[M − H]224.0685223.0612223.06172.2205, 163Reed
6Ferulic acid 4-O-glucosideC16H20O930.870** [M − H]356.1107355.1034355.10412.0193, 178, 149, 134* Wurtz, Reed
7Ferulic acidC10H10O442.847** [M − H]194.0579193.0506193.05060.0178, 149, 134Reed, * Wurtz
8VerbascosideC29H36O1544.703[M − H]624.2054623.1981623.1977−0.6477, 461, 315, 135Wurtz
91-Sinapoyl-2-feruloylgentiobioseC33H40O1872.821[M − H]724.2215723.2142723.21460.6529, 499Reed
Hydroxybenzoic acids
102-Hydroxybenzoic acidC7H6O34.327** [M − H]138.0317137.0244137.0241−2.293* Hass, Reed
113-O-Methylgallic acidC8H8O512.938[M + H]+184.0372185.0445185.0444−0.5170, 142Wurtz
12PaeoniflorinC23H28O1140.731** [M − H]480.1632479.1559479.15794.2449, 357, 327Reed
Hydroxyphenylacetic acids
133,4-Dihydroxyphenylacetic acidC8H8O431.864** [M − H]168.0423167.0350167.03595.4149, 123* Wurtz, Reed
142-Hydroxy-2-phenylacetic acidC8H8O336.105[M − H]152.0473151.0400151.04074.6136, 92Wurtz
Hydroxyphenylpropanoic acids
15Dihydroferulic acid 4-sulfateC10H12O7S4.112[M − H]276.0304275.0231275.0230−0.4195, 151, 177Hass
Flavonoids
Anthocyanins
16Delphinidin 3-O-galactosideC21H21O1236.639[M + H]+465.1033466.1106466.1097−1.9303Reed
17Delphinidin 3-O-glucosyl-glucosideC27H31O1736.655[M + H]+627.1561628.1634628.1630−0.6465, 3030Reed
18Cyanidin 3,5-O-diglucosideC27H31O1640.382** [M + H]+611.1612612.1685612.1678−1.1449, 287Reed
19Petunidin 3,5-O-diglucosideC28H33O1740.846[M + H]+641.1718642.1791642.17940.5479, 317* Reed, Wurtz
20Petunidin 3-O-(6″-acetyl-glucoside)C24H25O1361.318[M + H]+521.1295522.1368522.13720.8317Reed
Flavonols
21Quercetin 3-O-xylosyl-rutinosideC32H38O2016.481[M + H]+742.1956743.2029743.20381.2479, 317Reed
223-MethoxynobiletinC22H24O920.837[M + H]+432.1420433.1493433.1482−2.5403, 385, 373, 345Reed
233-MethoxysinensetinC21H22O829.374** [M + H]+402.1315403.1388403.13931.2388, 373, 355, 327Wurtz, * Hass, Reed
24Quercetin 3-O-arabinosideC20H18O1130.907[M − H]434.0849433.0776433.07893.0301Reed
25Kaempferol 3-O-glucosyl-rhamnosyl-galactosideC33H40O2032.709** [M − H]756.2113755.2040755.20693.8285* Wurtz, Hass
26Myricetin 3-O-rhamnosideC21H20O1251.748[M − H]464.0955463.0882463.08922.2317Reed
27Quercetin 3-O-(6″-malonyl-glucoside) 7-O-glucosideC30H32O2053.914[M + H]+712.1487713.1560713.15681.1551, 303* Reed, Wurtz
28Kaempferol 3-O-(2″-rhamnosyl-galactoside) 7-O-rhamnosideC33H40O1960.098** [M − H]740.2164739.2091739.20930.3593, 447, 285Reed
Flavones
29Apigenin 6,8-di-C-glucosideC27H30O1532.261** [M − H]594.1585593.1512593.1506−1.0503, 473* Wurtz, Reed
306-Hydroxyluteolin 7-O-rhamnosideC21H20O1151.777[M − H]448.1006447.0933447.09503.8301Wurtz
31Apigenin 7-O-apiosyl-glucosideC26H28O1459.215** [M + H]+564.1479565.1552565.1542−1.8296Wurtz, * Reed
Isoflavonoids
32Dihydrobiochanin AC16H14O59.841[M + H]+286.0841287.0914287.09191.7269, 203, 201, 175Wurtz
333′-HydroxygenisteinC15H10O631.357[M + H]+286.0477287.0550287.0540−3.5269, 259* Wurtz, Reed
345,6,7,3′,4′-PentahydroxyisoflavoneC15H10O731.423** [M + H]+302.0427303.0500303.0493−2.3285, 257Reed, * Wurtz
35GlycitinC22H22O1038.236[M + H]+446.1213447.1286447.12982.7285Hass
36Formononetin 7-O-glucuronideC22H20O1042.036** [M − H]444.1056443.0983443.0976−1.6267, 252* Wurtz, Reed
376″-O-MalonyldaidzinC24H22O1245.551[M + H]+502.1111503.1184503.11931.8255Wurtz
386″-O-MalonylgenistinC24H22O1364.084[M + H]+518.1060519.1133519.11615.4271Reed
Flavanols
39(+)-Gallocatechin 3-O-gallateC22H18O1117.150[M − H]458.0849457.0776457.07892.8305, 169Hass
40Prodelphinidin dimer B3C30H26O1428.673[M + H]+610.1323611.1396611.14010.8469, 311, 291* Wurtz, Reed
41(+)-CatechinC15H14O631.118** [M − H]290.0790289.0717289.07170.0245, 205, 179* Wurtz, Reed
Flavanones
42Naringin 4′-O-glucosideC33H42O1912.481** [M − H]742.2320741.2247741.22713.2433, 271* Wurtz, Hass
43NeoeriocitrinC27H32O1545.015[M − H]596.1741595.1668595.16771.5431, 287* Hass, Reed
446-PrenylnaringeninC20H20O545.633[M + H]+340.1311341.1384341.13963.5323, 137Reed
Dihydrochalcones
453-Hydroxyphloretin 2′-O-xylosyl-glucosideC26H32O1536.370[M − H]584.1741583.1668583.1666−0.3289Wurtz
463-Hydroxyphloretin 2′-O-glucosideC21H24O1142.383** [M − H]452.1319451.1246451.1237−2.0289, 273* Wurtz, Reed
47PhloridzinC21H24O1042.847** [M − H]436.1369435.1296435.12980.5273* Wurtz, Reed
Dihydroflavonols
48Dihydromyricetin 3-O-rhamnosideC21H22O1226.430** [M − H]466.1111465.1038465.10400.4301* Wurtz, Reed
Other polyphenols
Tyrosols
493,4-DHPEA-ACC10H12O49.681** [M − H]196.0736195.0663195.06672.1135* Wurtz, Reed
50DemethyloleuropeinC24H30O1323.050** [M − H]526.1686525.1613525.16211.5495* Wurtz, Hass, Reed
Hydroxyphenylpropenes
512-Methoxy-5-prop-1-enylphenolC10H12O223.305[M + H]+164.0837165.0910165.0906−2.4149, 137, 133, 124Reed
Hydroxybenzaldehydes
52p-AnisaldehydeC8H8O217.690[M + H]+136.0524137.0597137.05980.7122, 109Reed
Hydroxycoumarins
53CoumarinC9H6O252.192[M + H]+146.0368147.0441147.04442.0103, 91Reed
Curcuminoids
54DemethoxycurcuminC20H18O576.809[M − H]338.1154337.1081337.10830.6217Wurtz
Furanocoumarins
55IsopimpinellinC13H10O514.808[M + H]+246.0528247.0601247.06072.4232, 217, 205, 203Reed
Other polyphenols
56Lithospermic acidC27H22O1231.035[M − H]538.1111537.1038537.10471.7493, 339, 295Wurtz
Stilbenes
57Resveratrol 5-O-glucosideC20H22O844.305[M − H]390.1315389.1242389.1238−1.0227Wurtz
584-Hydroxy-3,5,4′-trimethoxystilbeneC17H18O463.306[M + H]+286.1205287.1278287.1265−4.5271, 241, 225Reed
Lignans
59ConidendrinC20H20O64.340[M + H]+356.1260357.1333357.1330−0.8339, 221, 206Reed
607-HydroxymatairesinolC20H22O710.282[M − H]374.1366373.1293373.1288−1.3343, 313, 298, 285Reed
61Schisandrin CC22H24O632.682[M + H]+384.1573385.1646385.16511.3370, 315, 300* Wurtz, Reed
627-OxomatairesinolC20H20O735.437[M + H]+372.1209373.1282373.13035.6358, 343, 328, 325Hass
63Todolactol AC20H24O741.489[M − H]376.1522375.1449375.1438−2.9313, 137Wurtz
64PinoresinolC20H22O647.768** [M − H]358.1416357.1343357.13532.8342, 327, 313, 221* Wurtz, Reed
* Compound was identified in more than one avocado samples, and the data presented in the table are from the sample with the asterisk. ** Compounds were detected in both negative [M − H] and positive [M + H]+ ionization modes, but only single-mode data are presented. RT is the abbreviation for “retention time”.
Table 3. Quantification of phenolic compounds in rejected avocados by HPLC-PDA.
No.Compounds NameChemical
Formula
RT (min)Hass Avocado
(mg/g)
Wurtz
Avocado
(mg/g)
Reed Avocado
(mg/g)
Polyphenol Class
1Gallic acidC7H6O56.8366.78 ± 0.34 a2.39 ± 0.19 c4.58 ± 0.23 bPhenolic acids
2Protocatechuic acidC7H6O412.5694.58 ± 0.32 b7.54 ± 0.38 a3.89 ± 0.27 bPhenolic acids
3p-Hydroxybenzoic acidC7H6O320.240-2.13 ± 0.09 a1.24 ± 0.06 aPhenolic acids
4Chlorogenic acidC16H18O920.57921.36 ± 0.85 a13.49 ± 0.67 b14.67 ± 0.73 bPhenolic acids
5Caffeic acidC9H8O425.0017.25 ± 0.44 a2.14 ± 0.17 c3.29 ± 0.19 bPhenolic acids
6CatechinC15H14O619.70413.68 ± 0.96 b9.57 ± 0.38 c15.94 ± 0.80 aFlavonoids
7EpicatechinC15H14O624.9615.48 ± 0.27 b14.24 ± 0.85 a3.71 ± 0.22 cFlavonoids
8Epicatechin gallateC22H18O1038.015-3.21 ± 0.19 a1.25 ± 0.08 aFlavonoids
9QuercetinC15H10O770.09817.37 ± 0.87 b6.87 ± 0.55 c21.47 ± 1.07 aFlavonoids
10KaempferolC15H10O680.3473.6 ± 0.14 b2.14 ± 0.15 b9.68 ± 0.58 aFlavonoids
The values are expressed as mg/g, mean ± standard deviation (SD) (n = 3). The superscript letters (a, b and c) indicate significant differences (p < 0.05) by one-way analysis of variance (ANOVA) and Tukey’s test in the row.
Publisher’s Note: MDPI stays neutral with regard to jurisdictional claims in published maps and institutional affiliations.

