
Scale-Up Strategies of Jet Loop Reactors for the Intensification of Mass Transfer Limited Reactions

 ,
,  ,
, 
Abstract
:1. Introduction
2. Materials and Methods
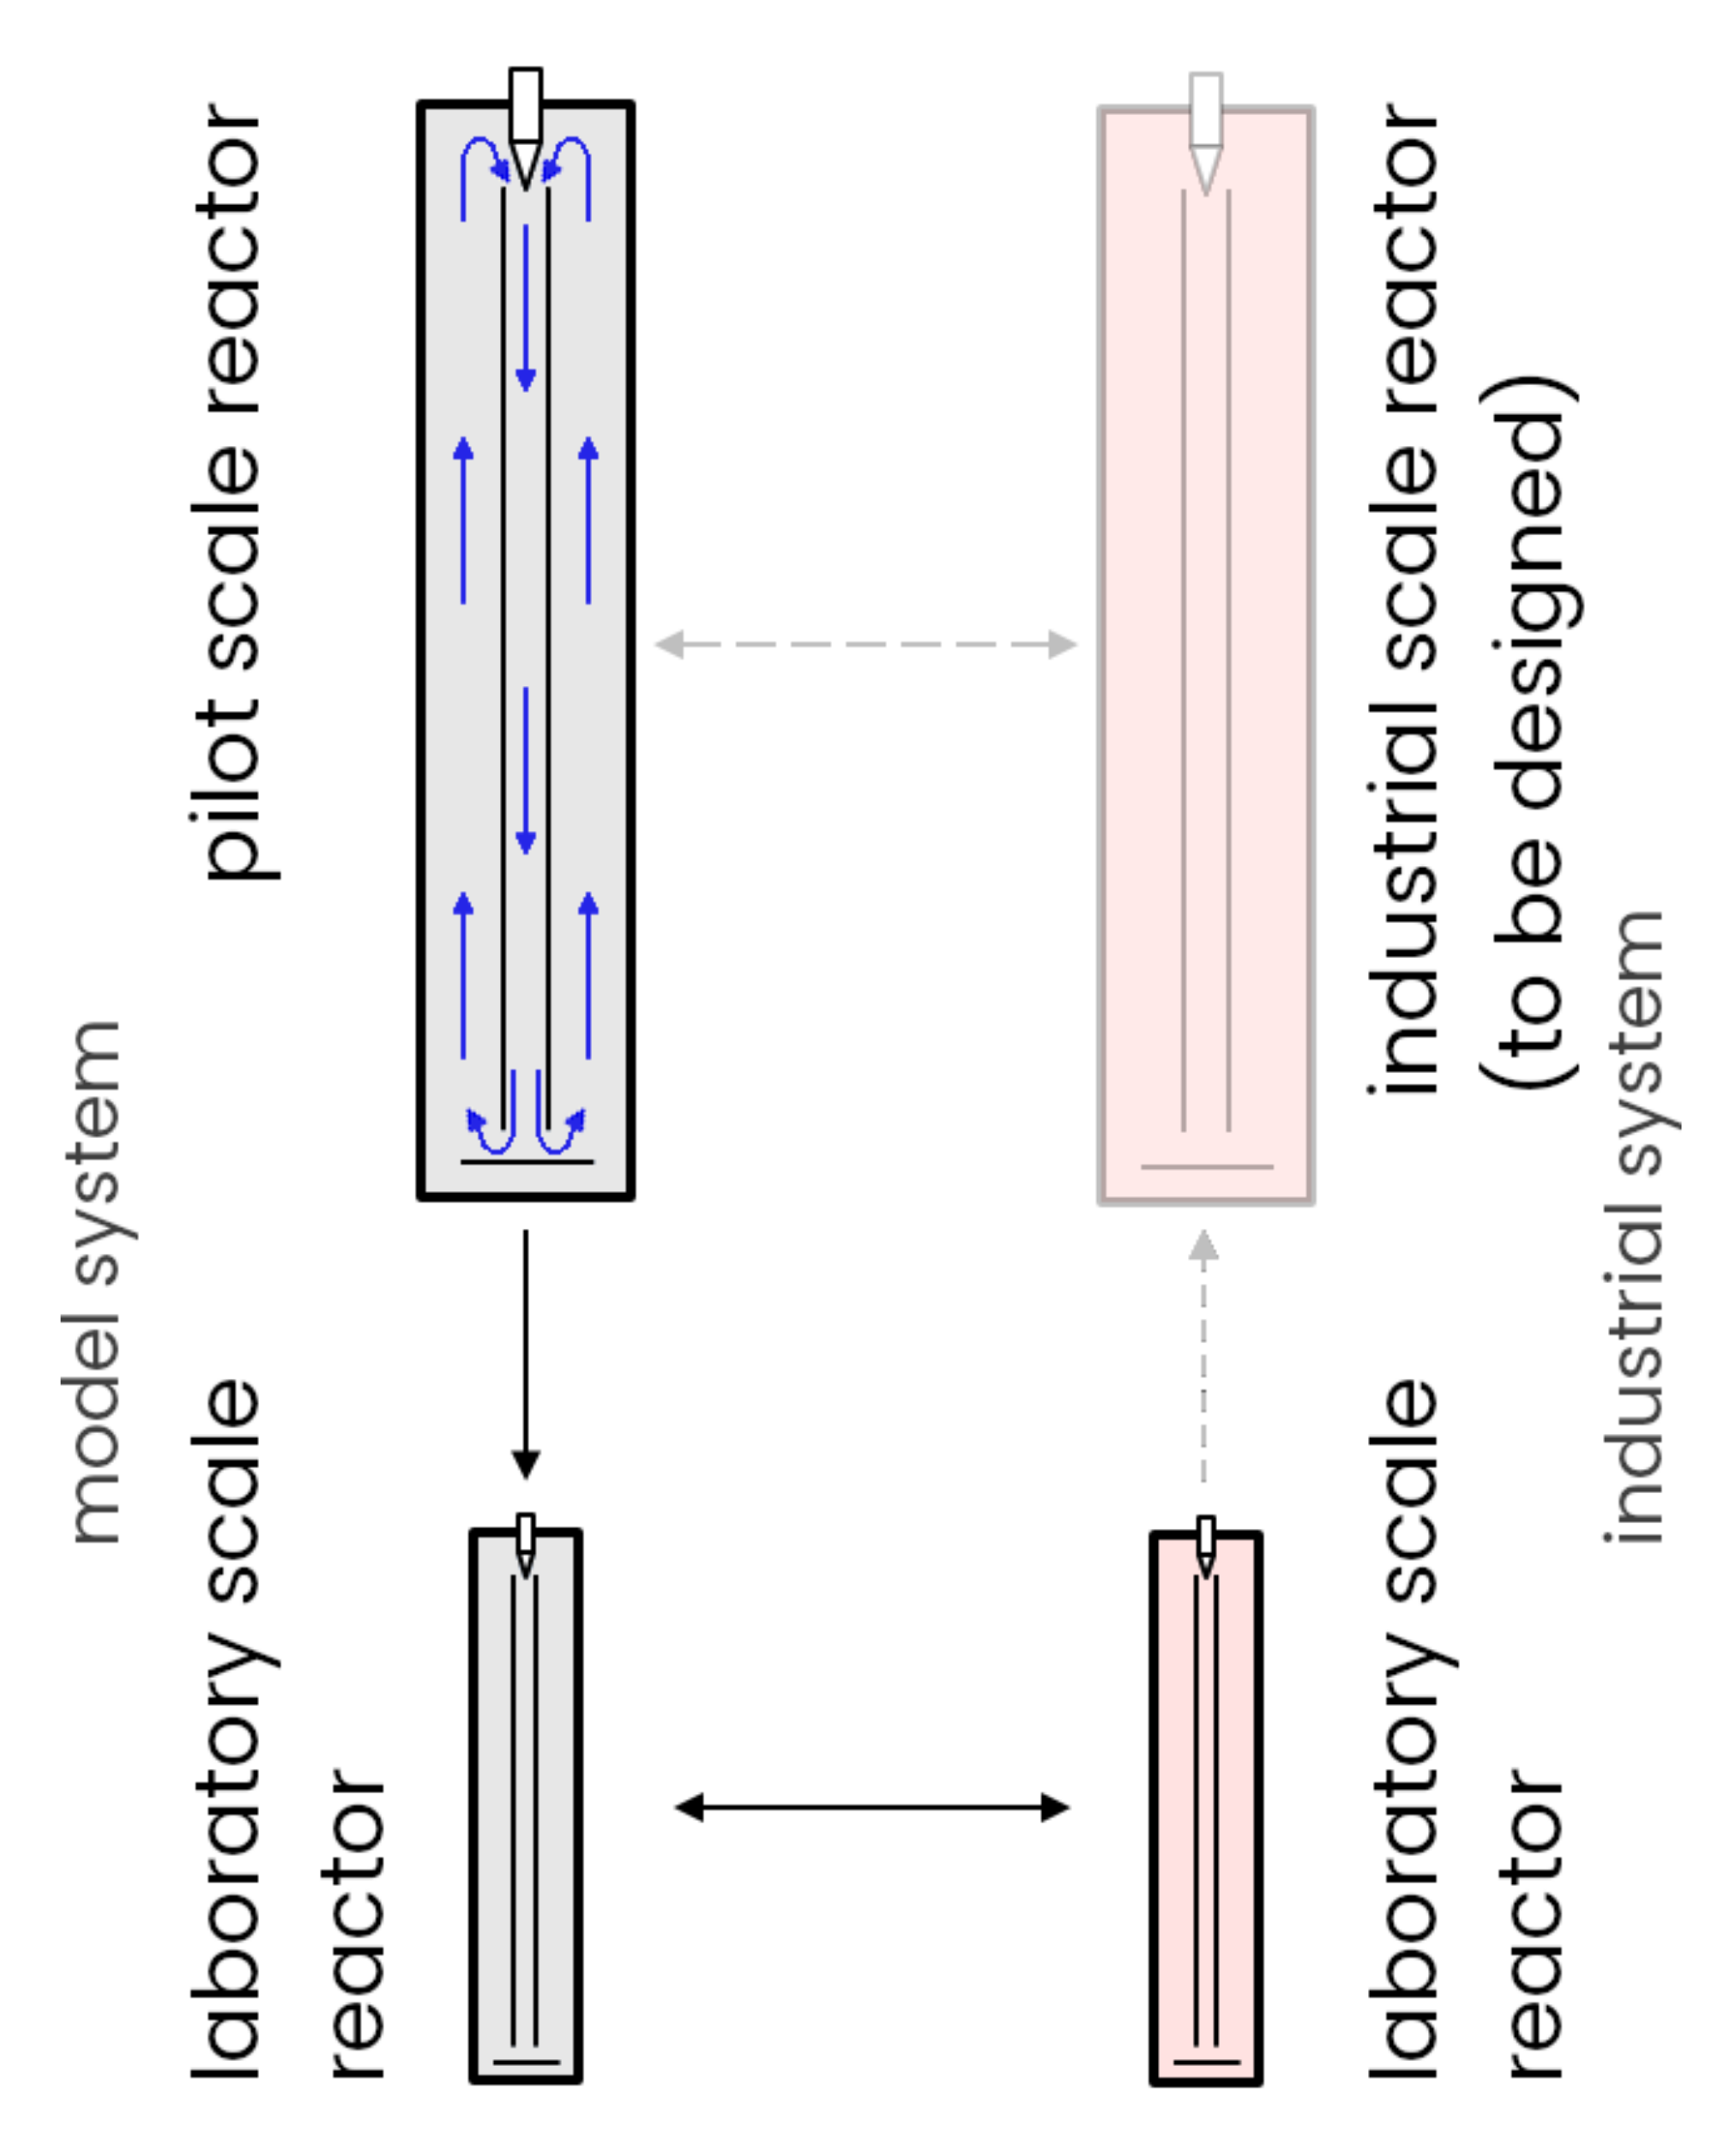
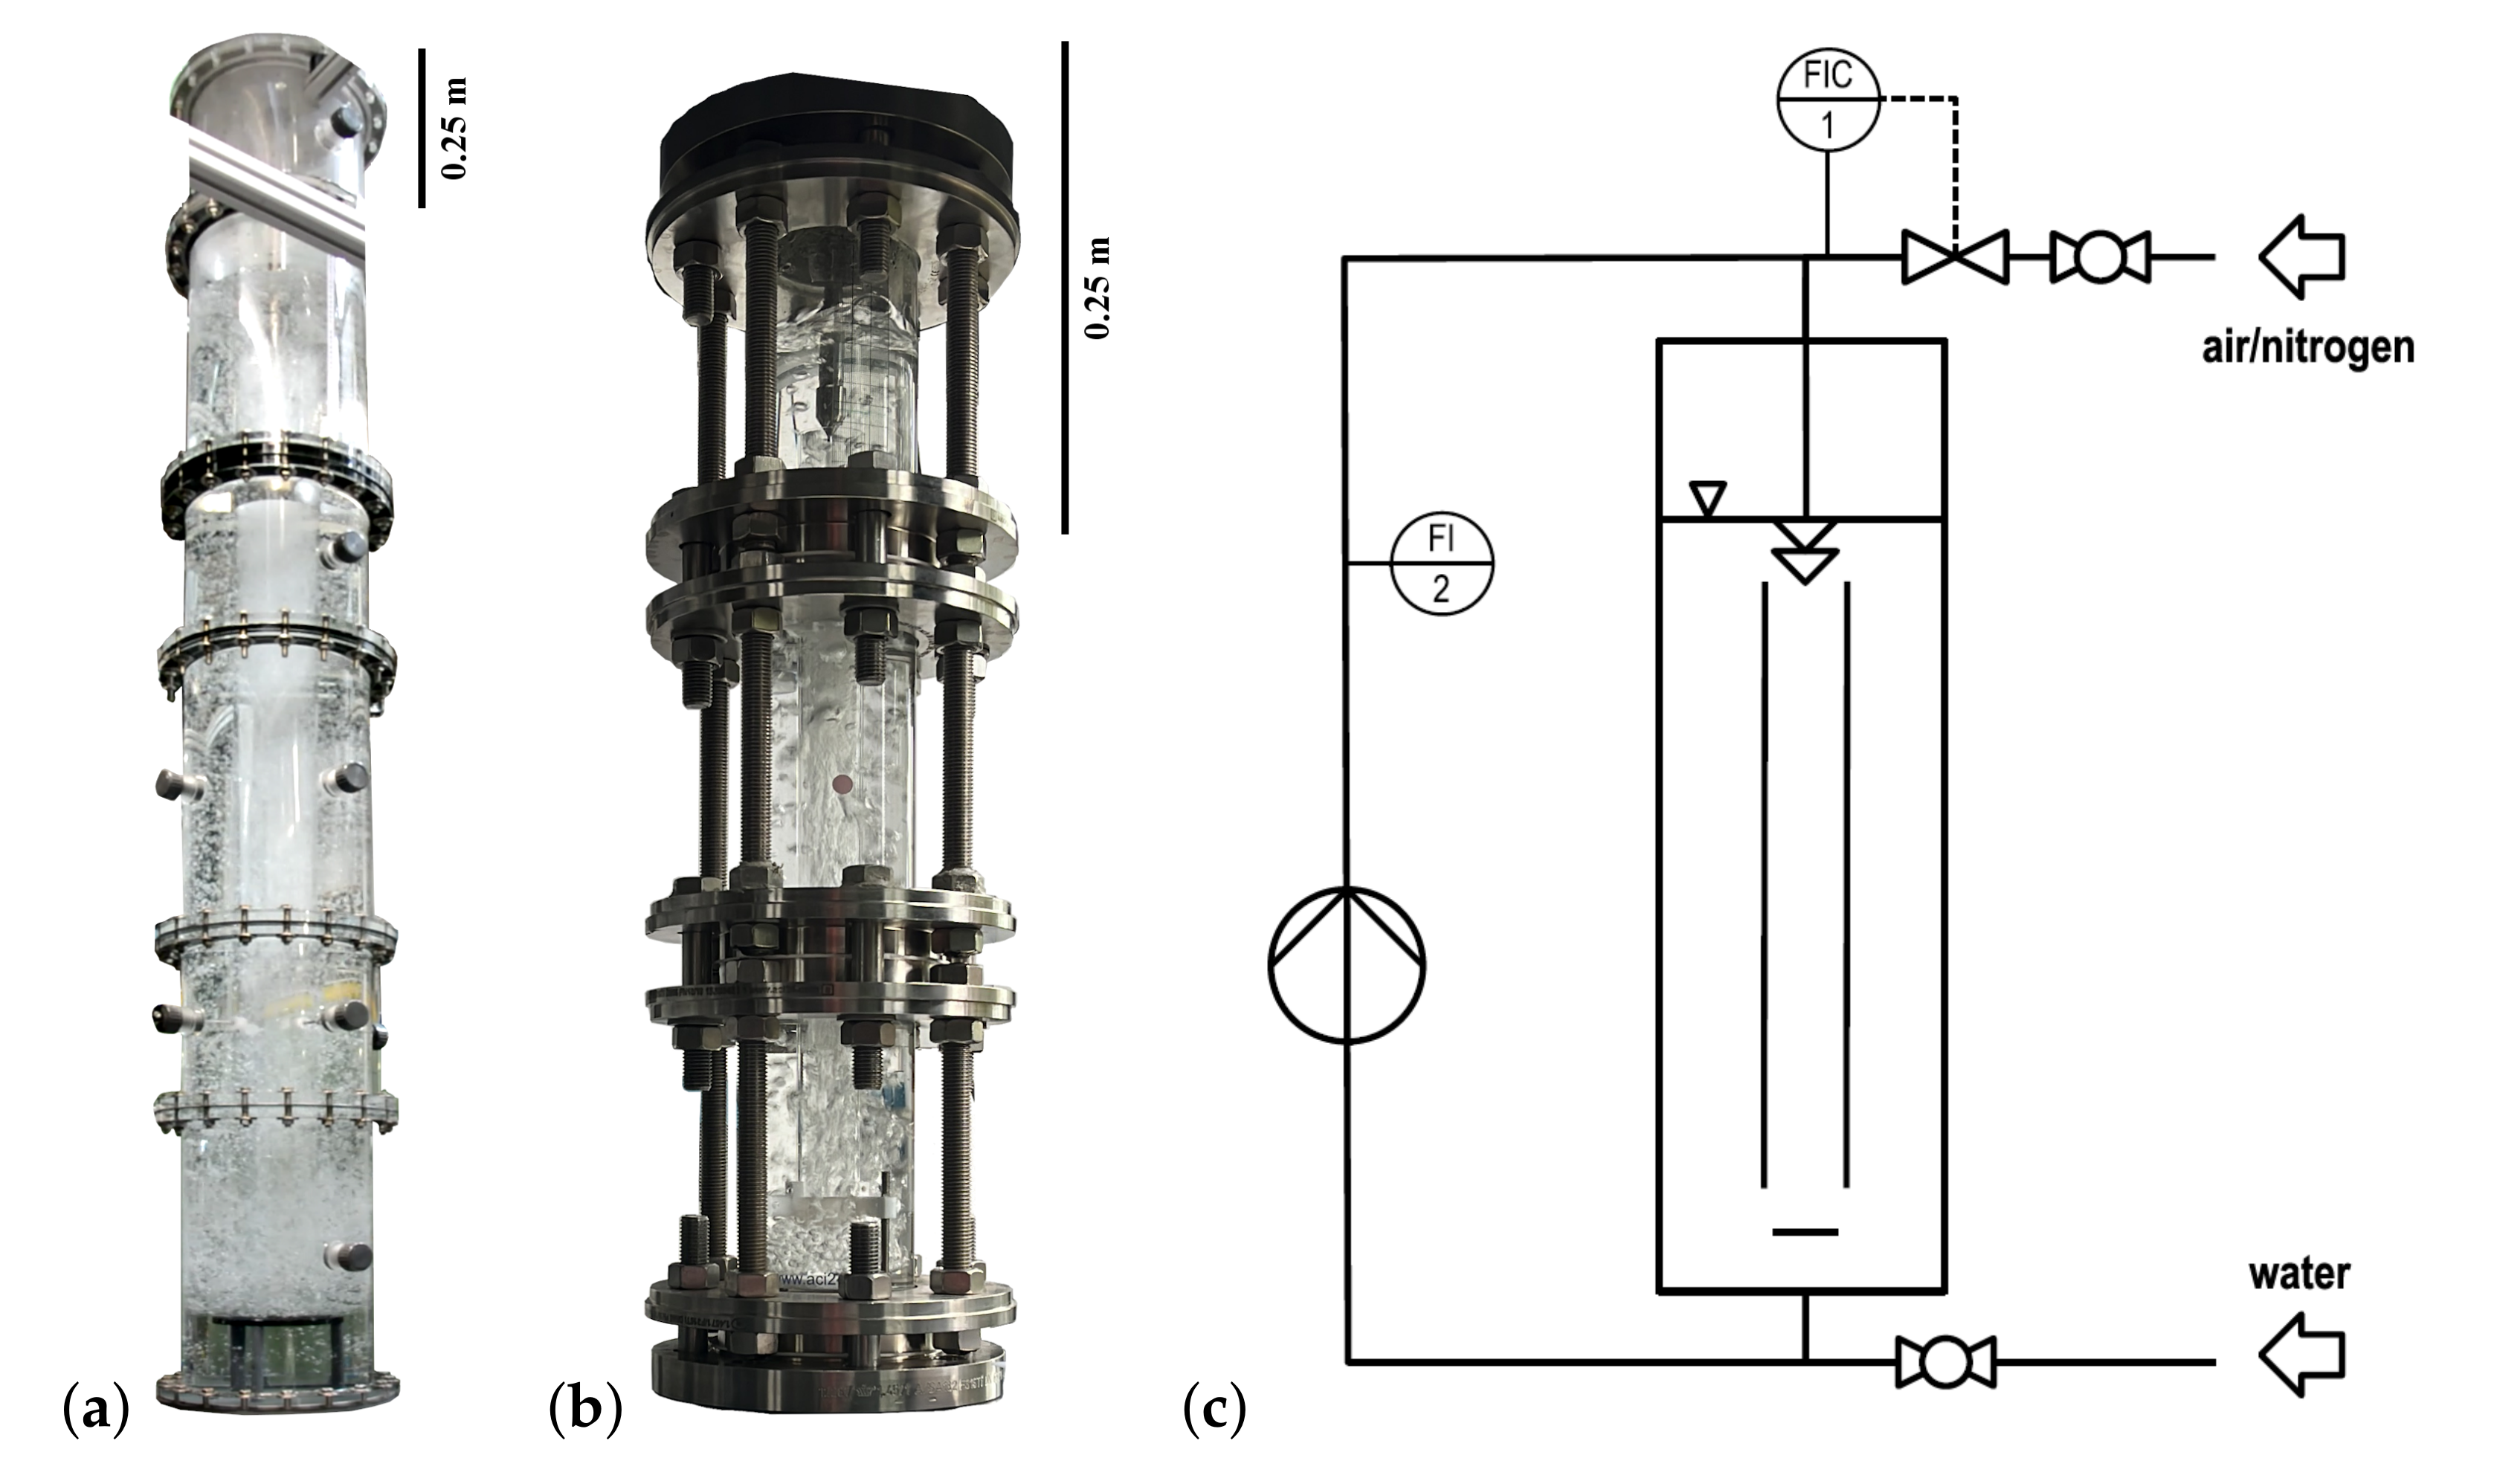
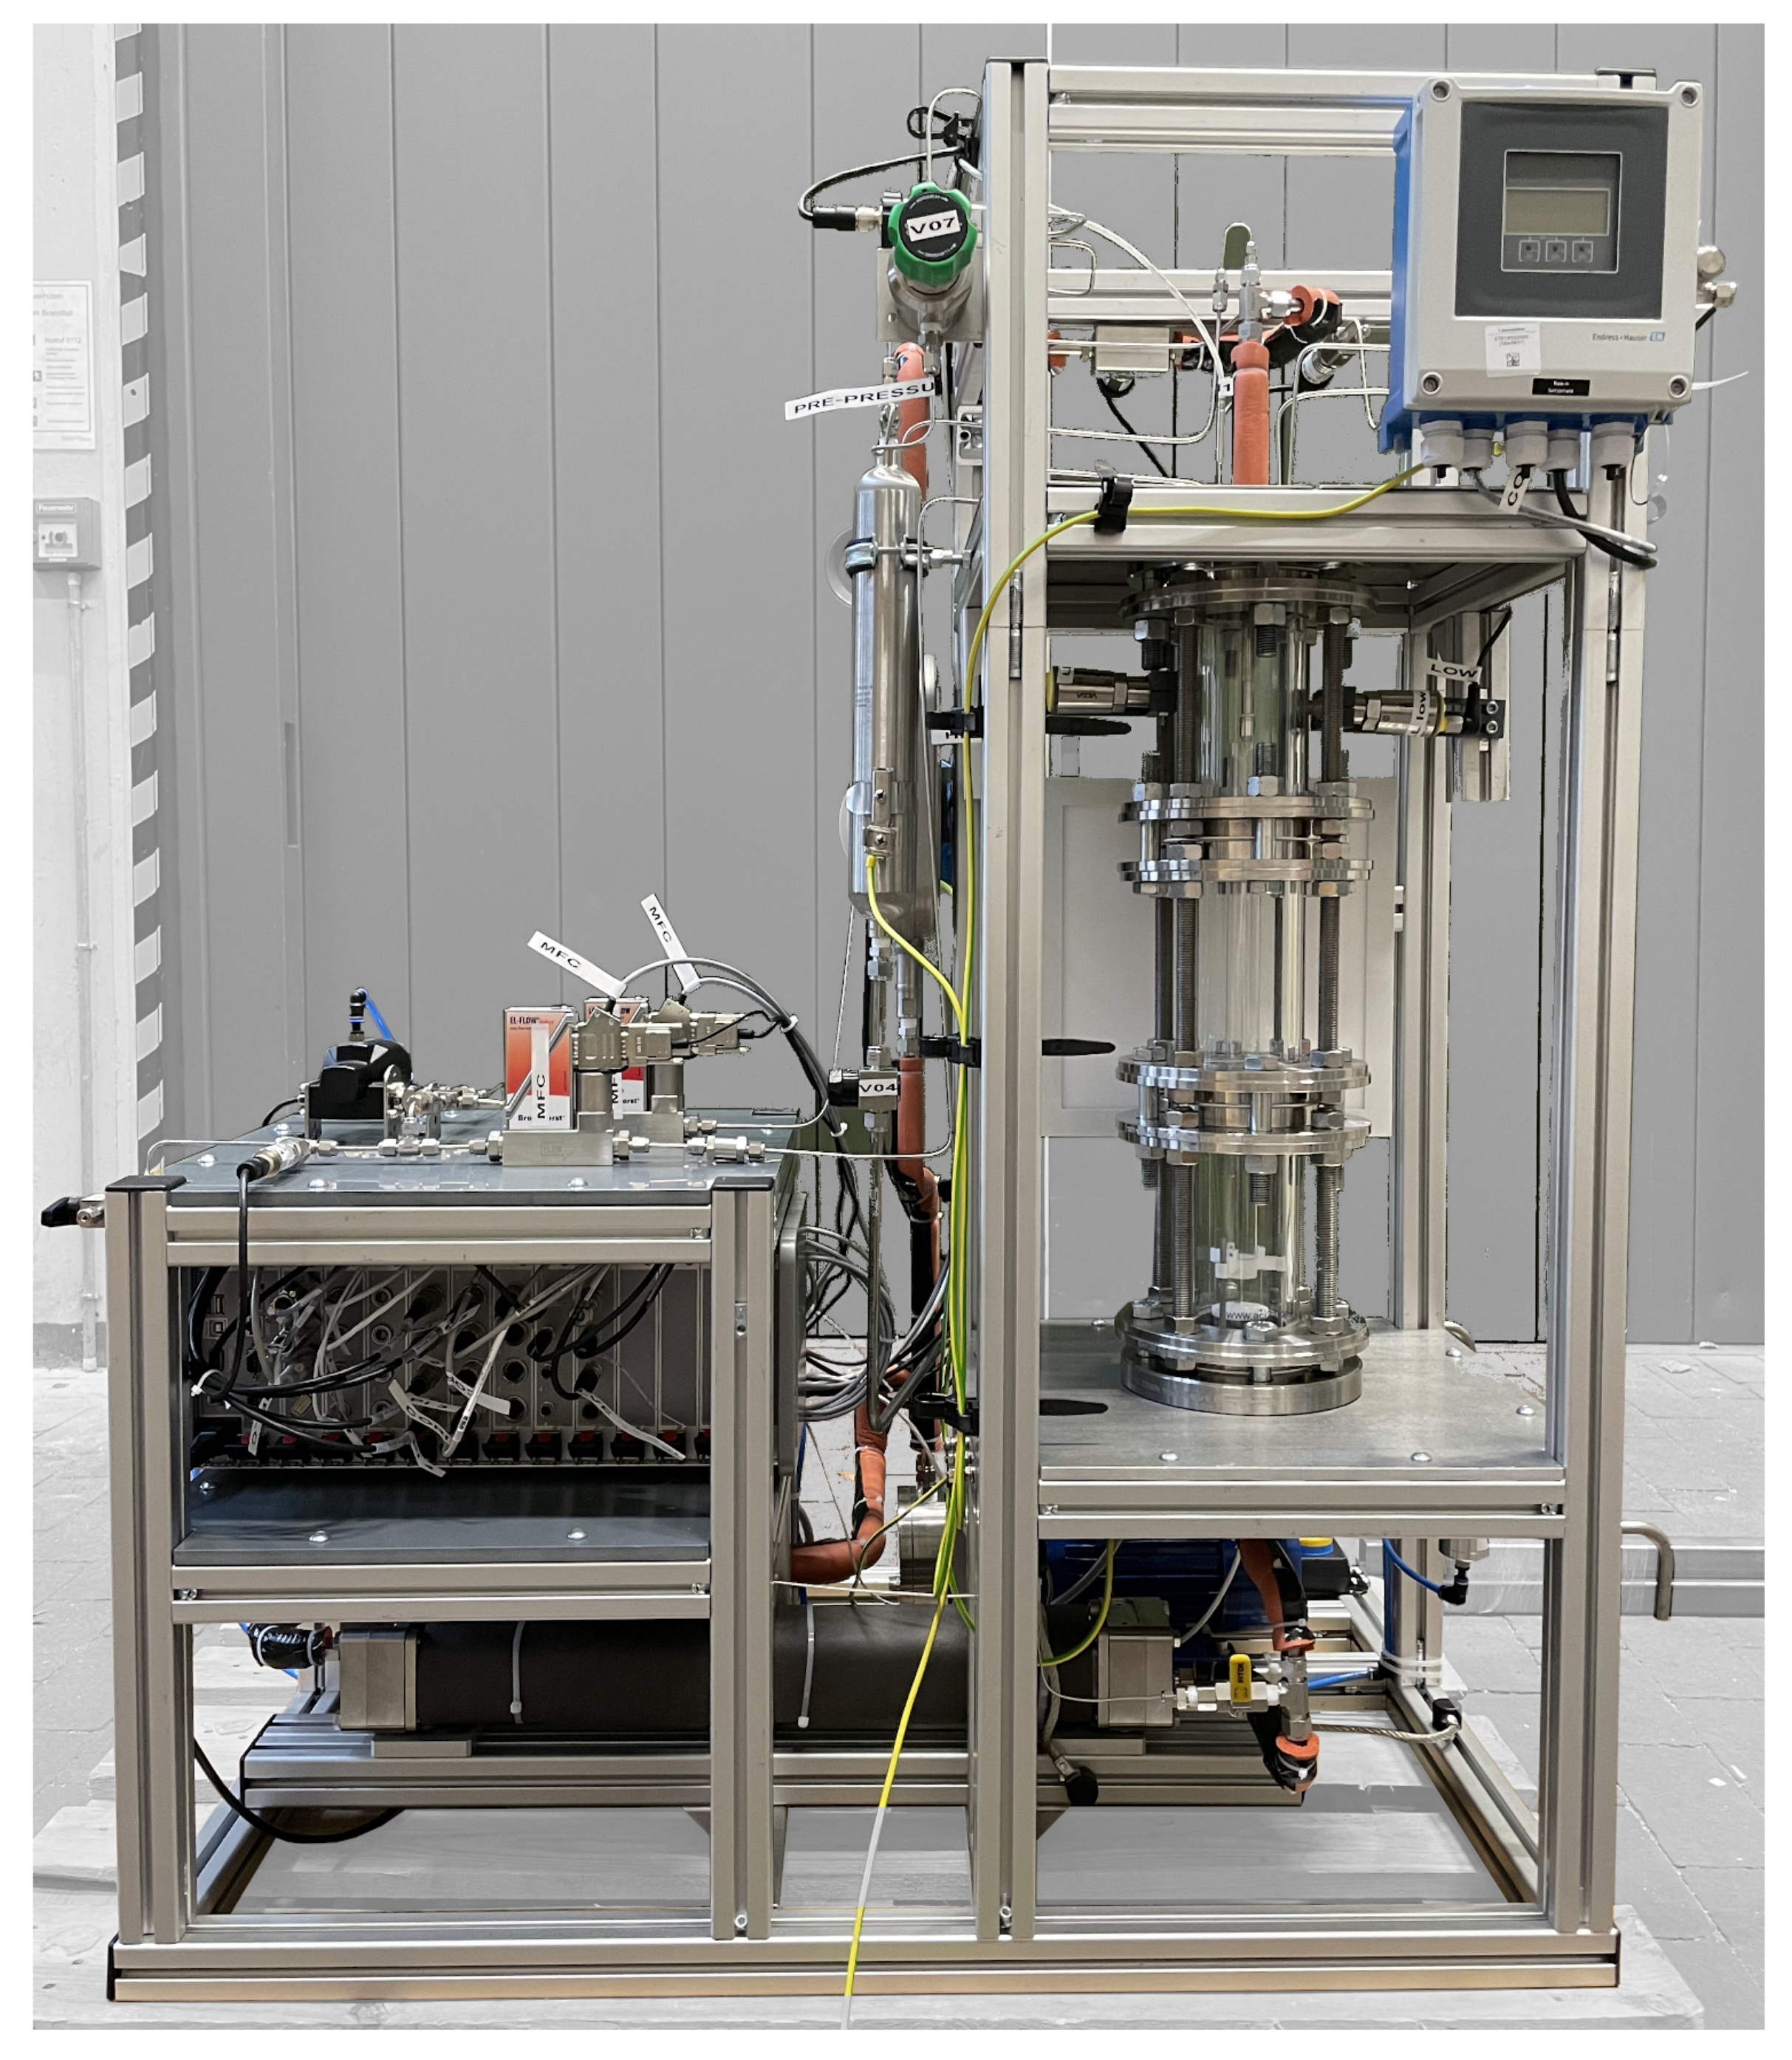
2.1. Reactors and Scale-Down
- a constant volumetric gas input
- a constant specific energy dissipation rate
- geometric similarity based on the scaling factor
- a constant residence time of the liquid within the reactor.
2.2. Media
2.3. Parameters of Investigation

| Ratio / min | 34.0 | 17.0 | 6.5 |
|---|---|---|---|
| setup | gassing rates / L min | ||
| pilot scale | 3.80 | 7.60 | 20.00 |
| laboratory scale | 0.06 | 0.12 | 0.31 |
| setup | superficial gas velocity u / mm s | ||
| pilot scale | 0.97 | 1.94 | 5.12 |
| laboratory scale | 0.25 | 0.49 | 1.27 |
2.4. Investigation Methods
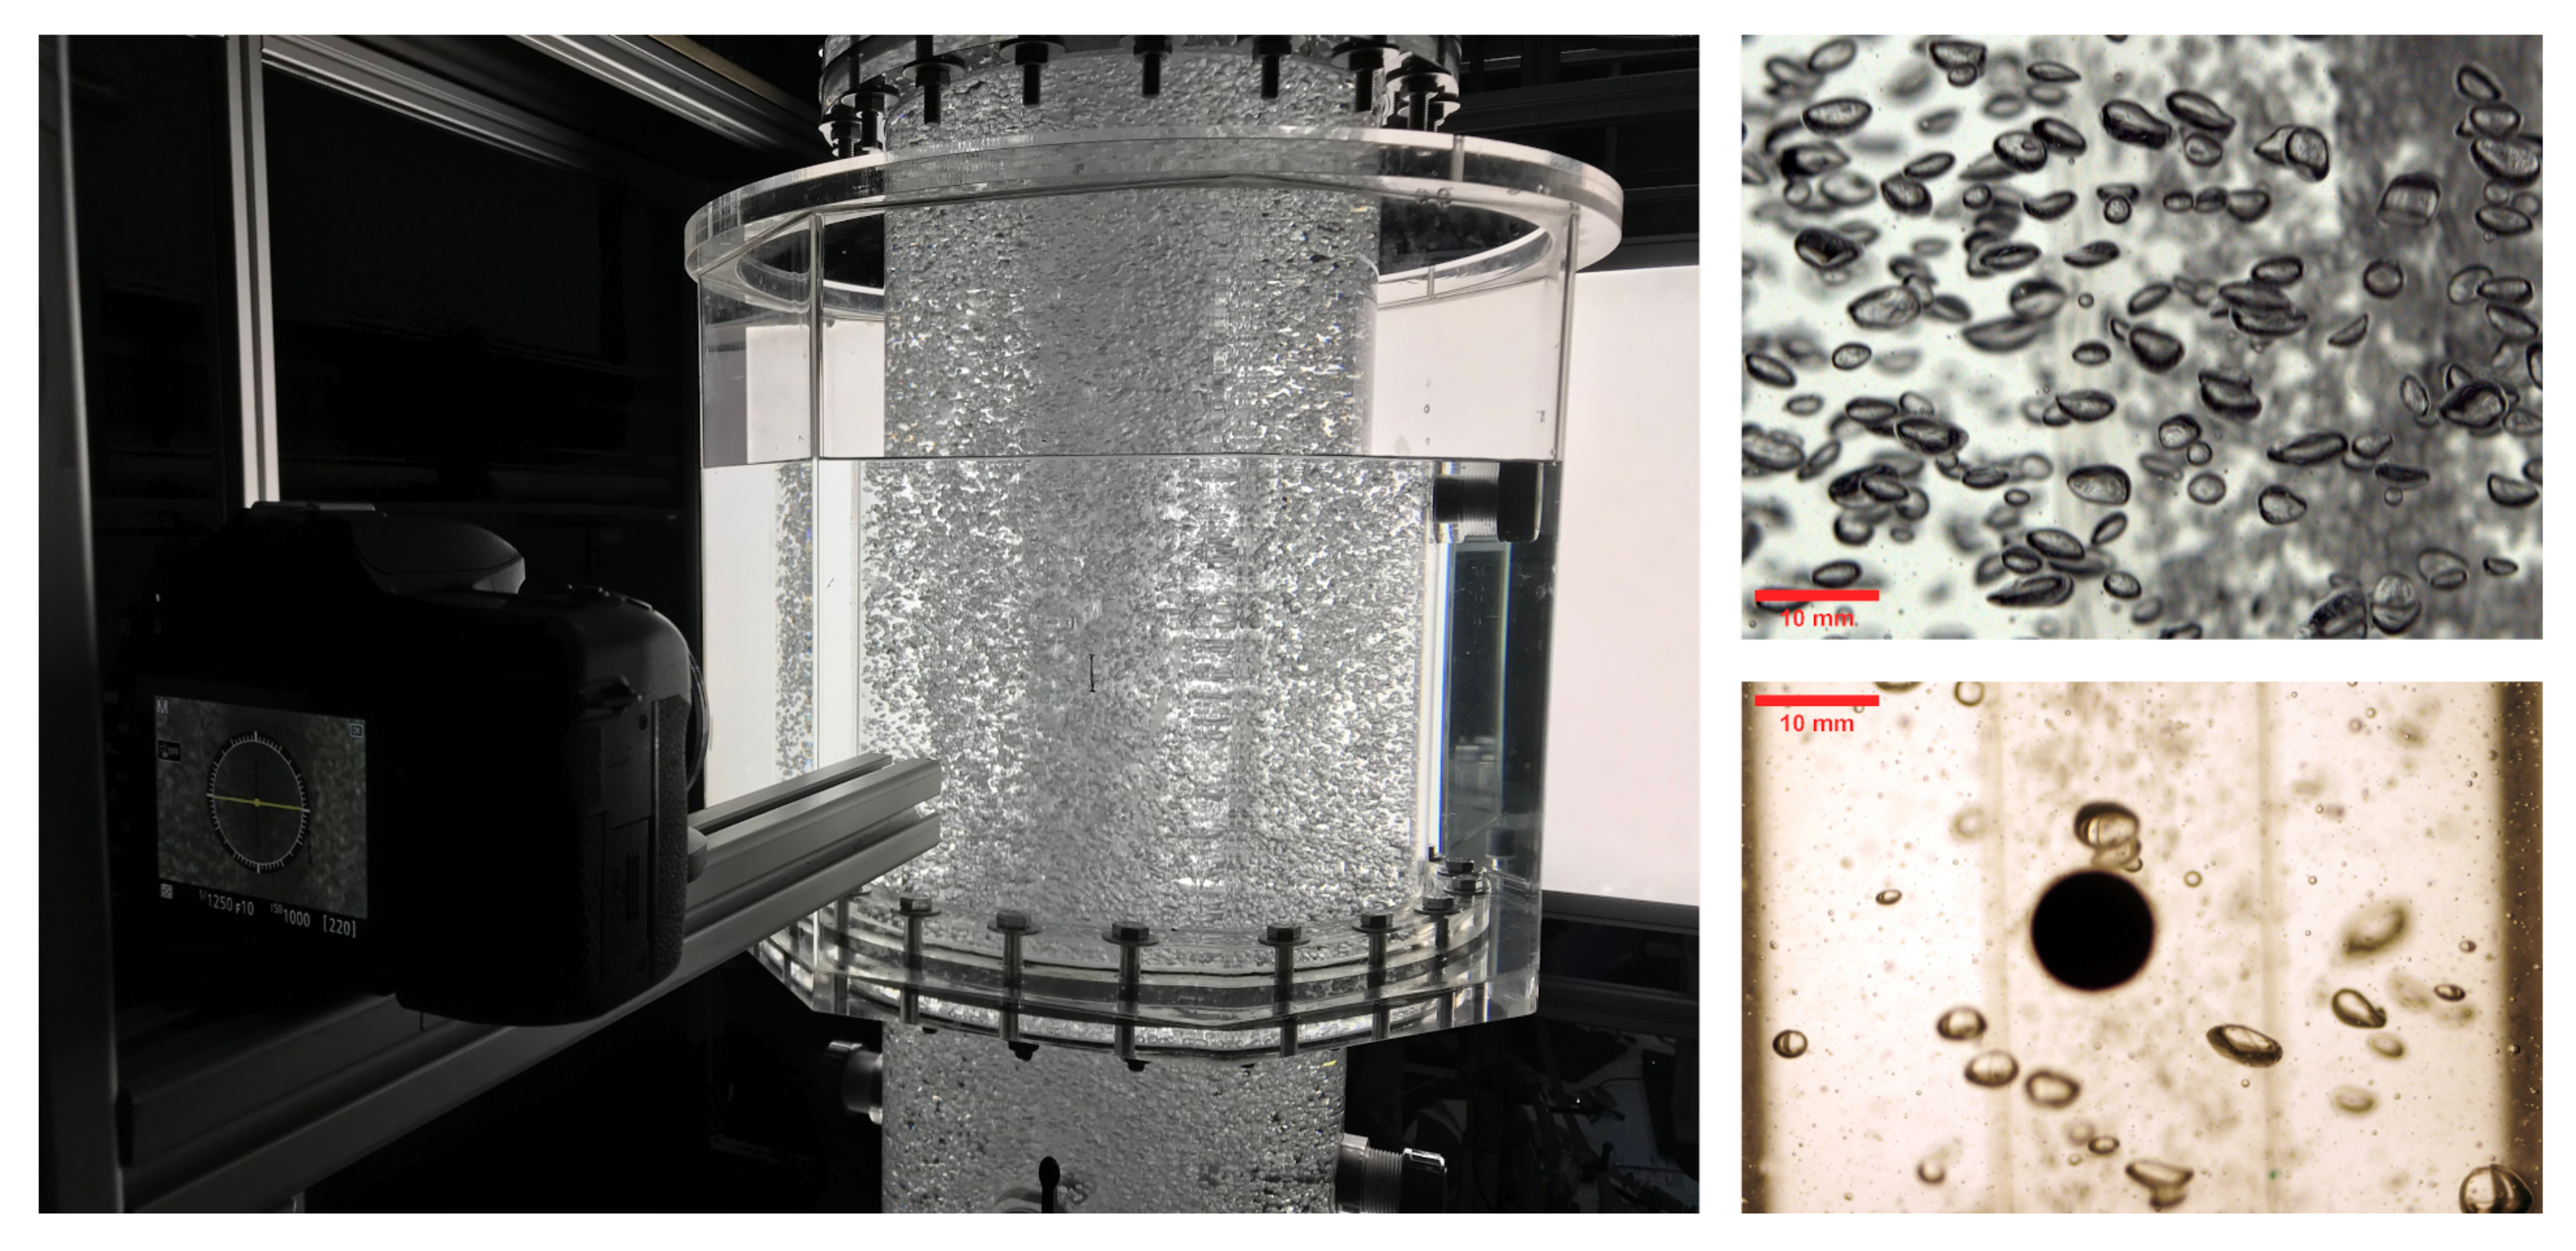
2.4.1. Determination of Bubble Sizes
2.4.2. Determination of Gas Hold-Up
2.4.3. Determination of Volumetric Mass Transfer Coefficient
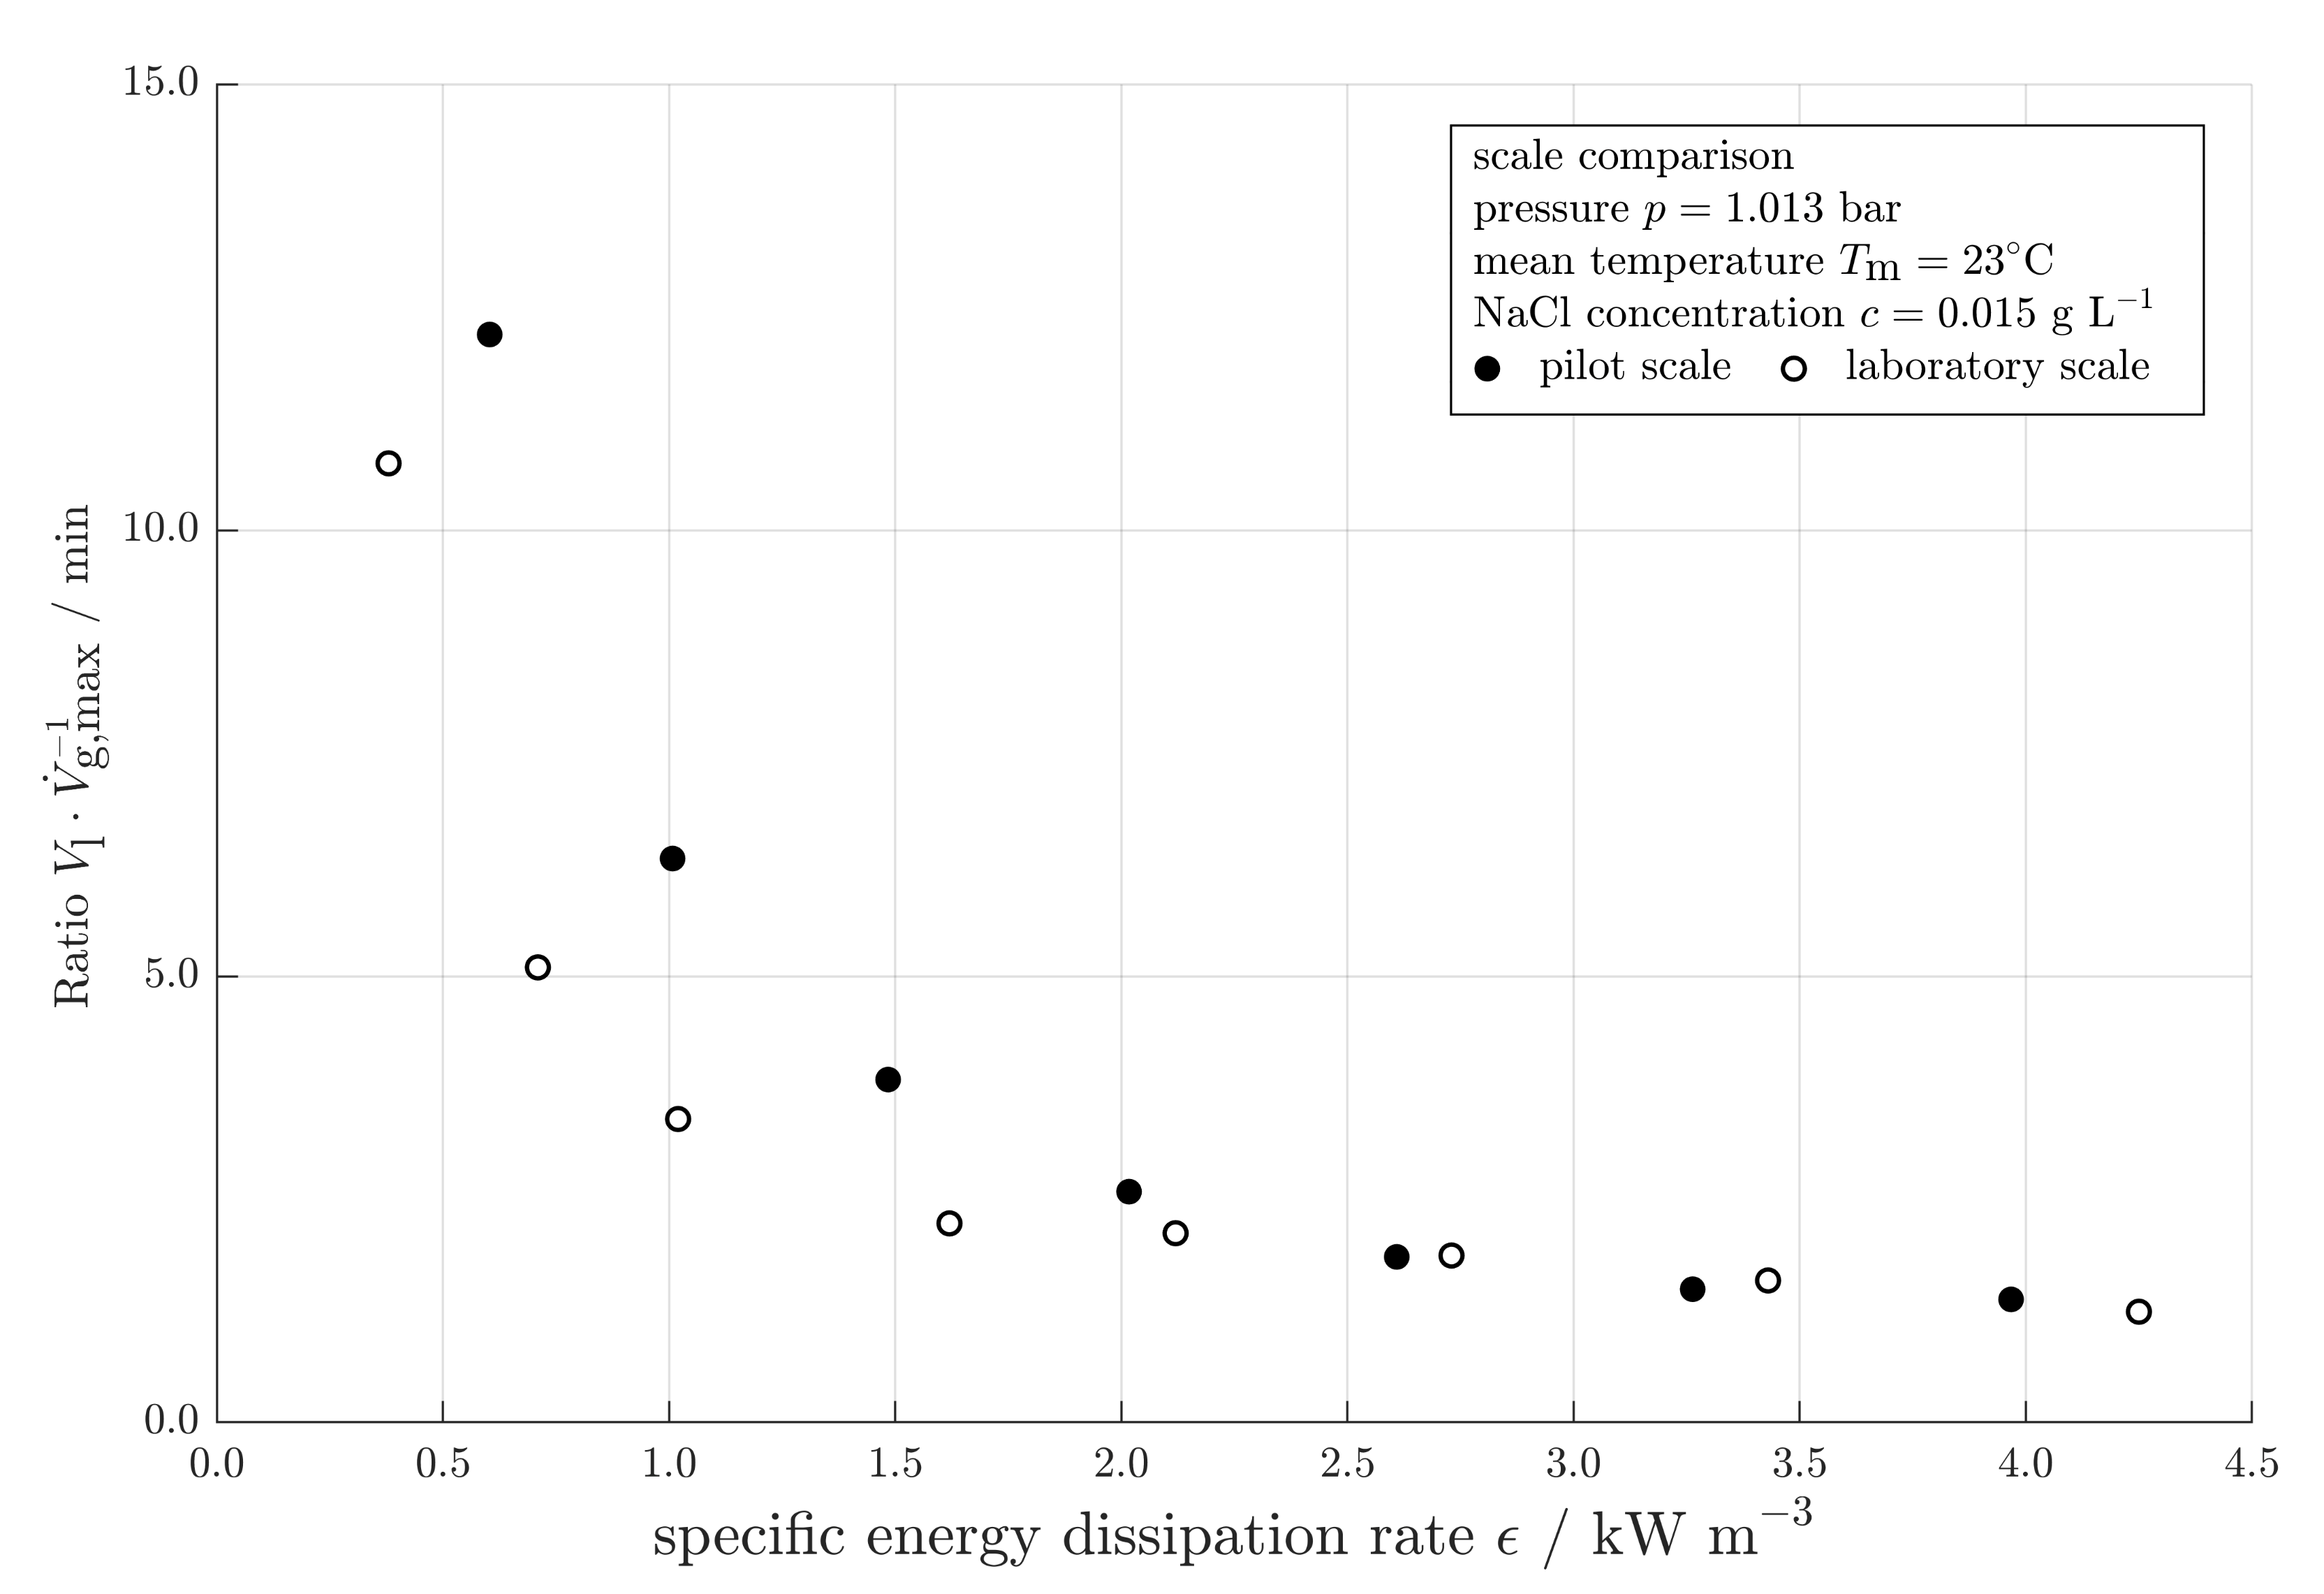
2.4.4. Determination of the Stability of the Loop
3. Results
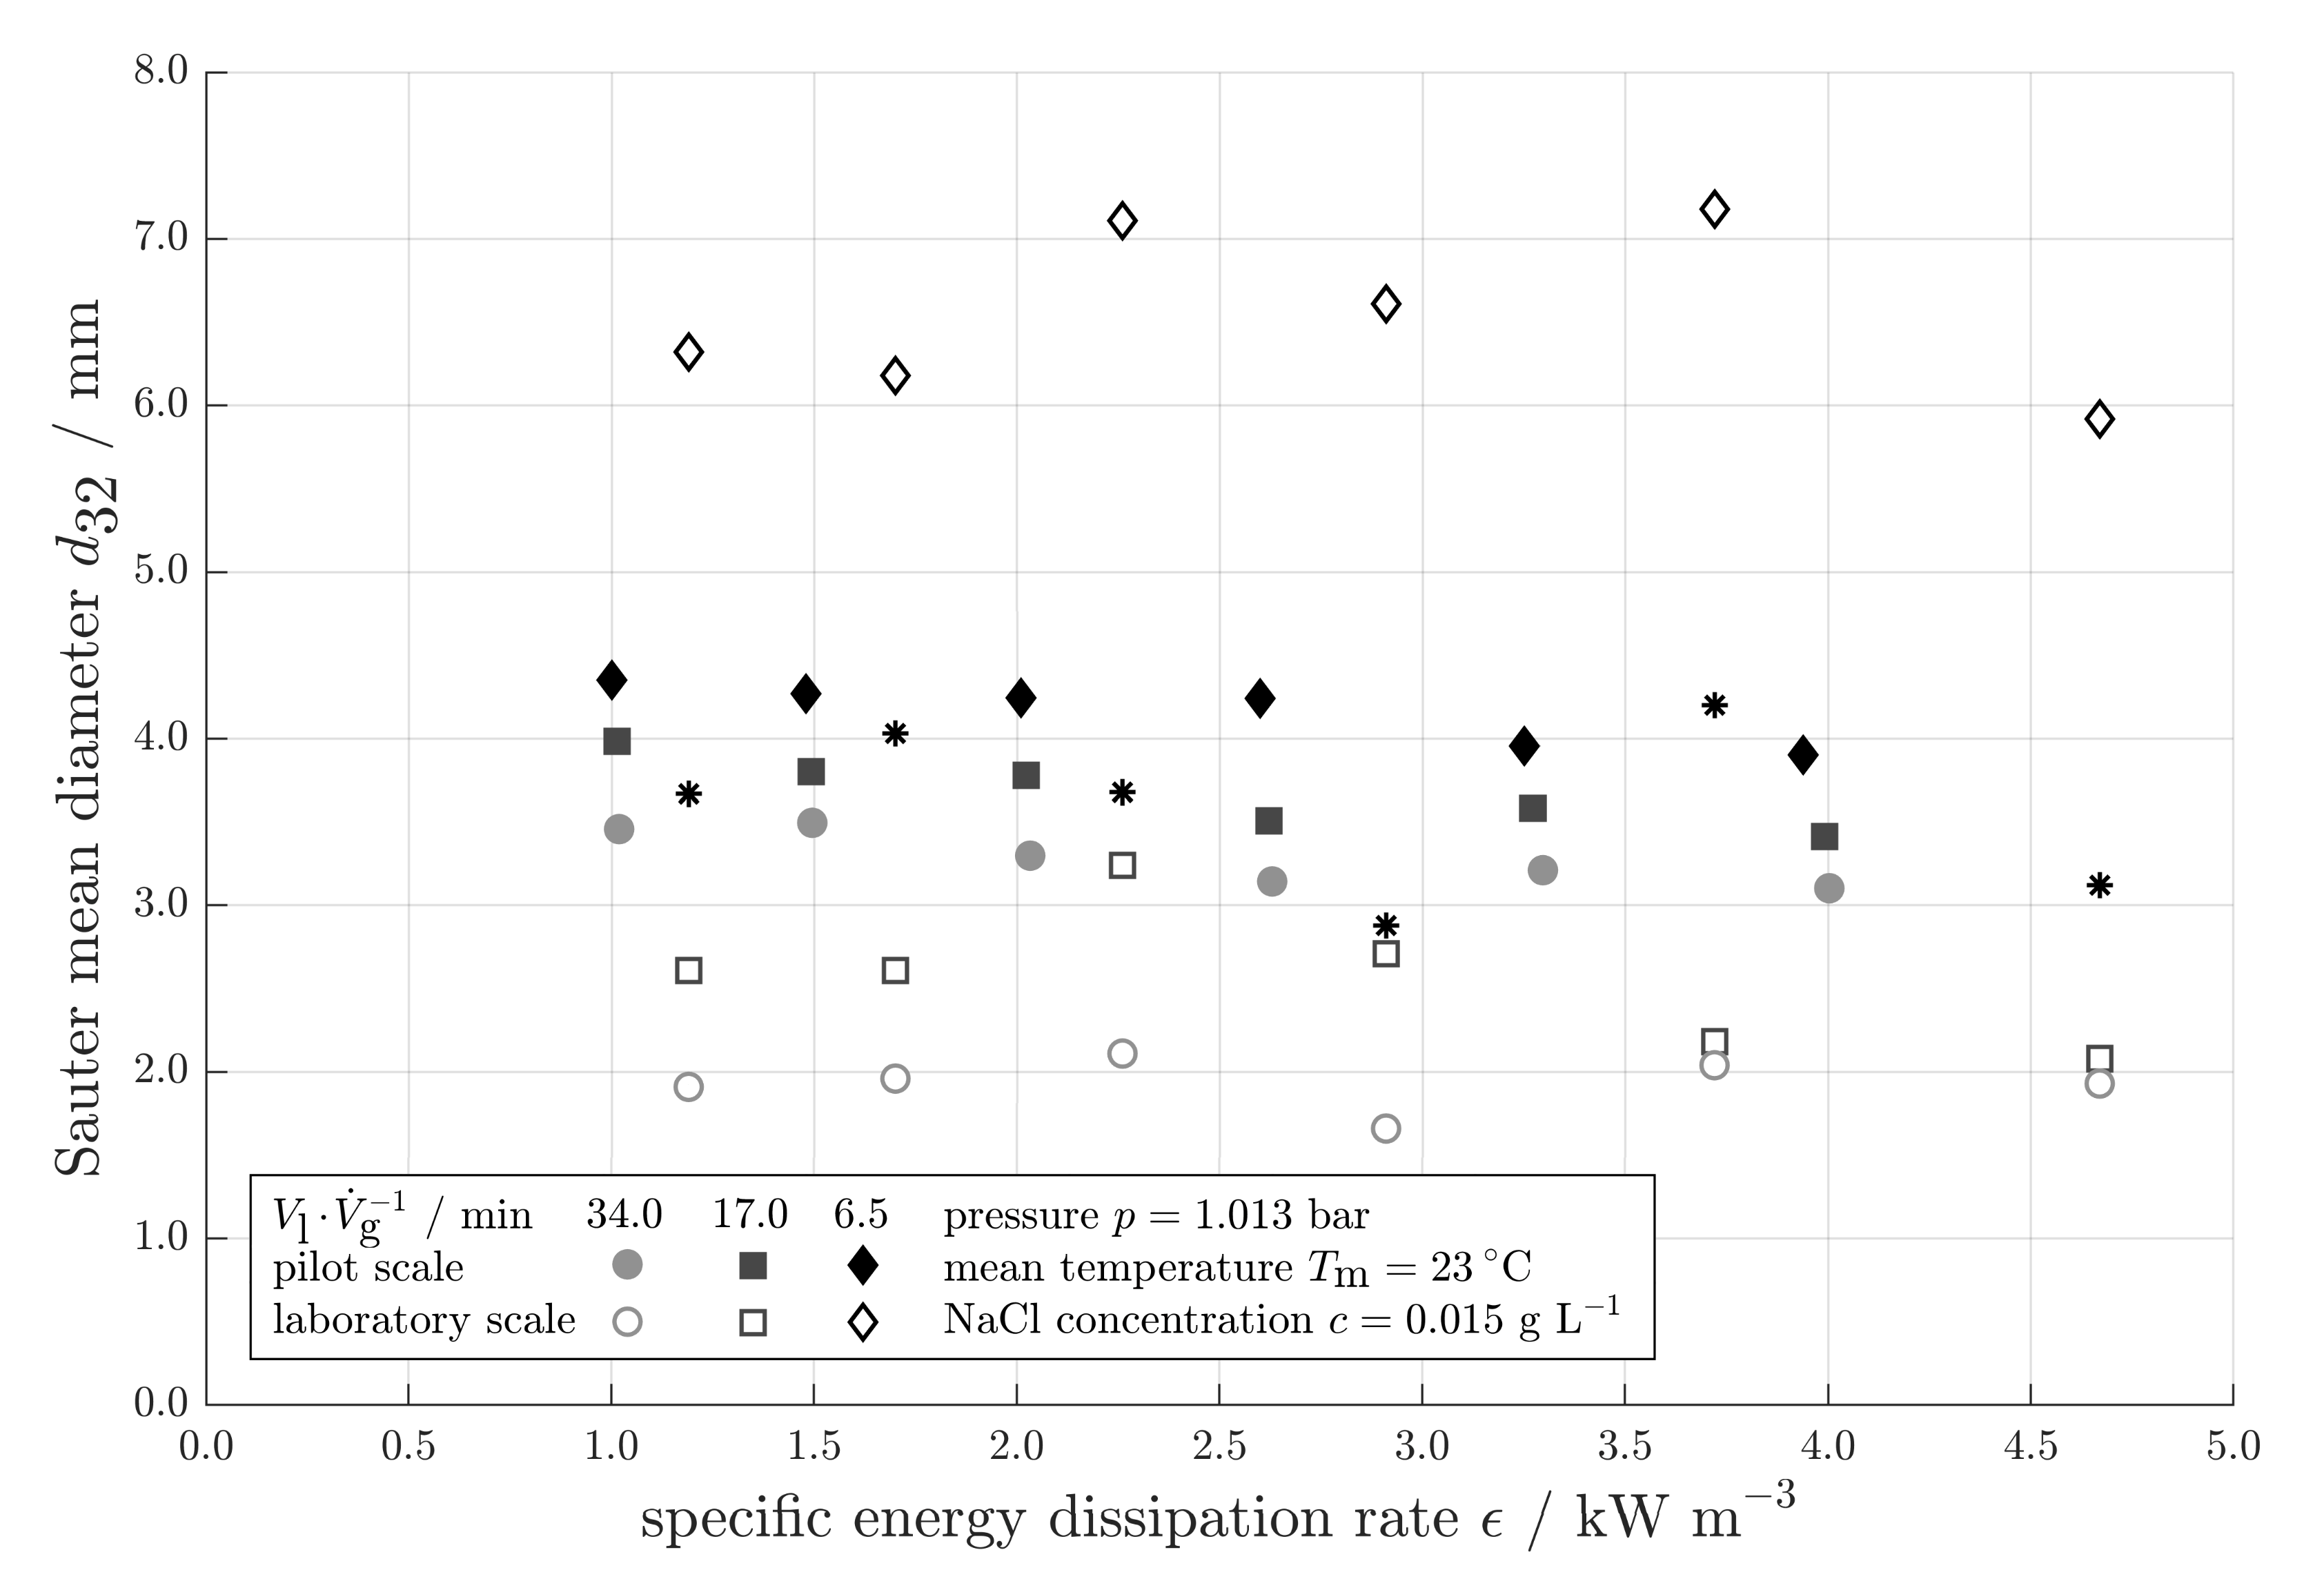
3.1. Bubble Sizes
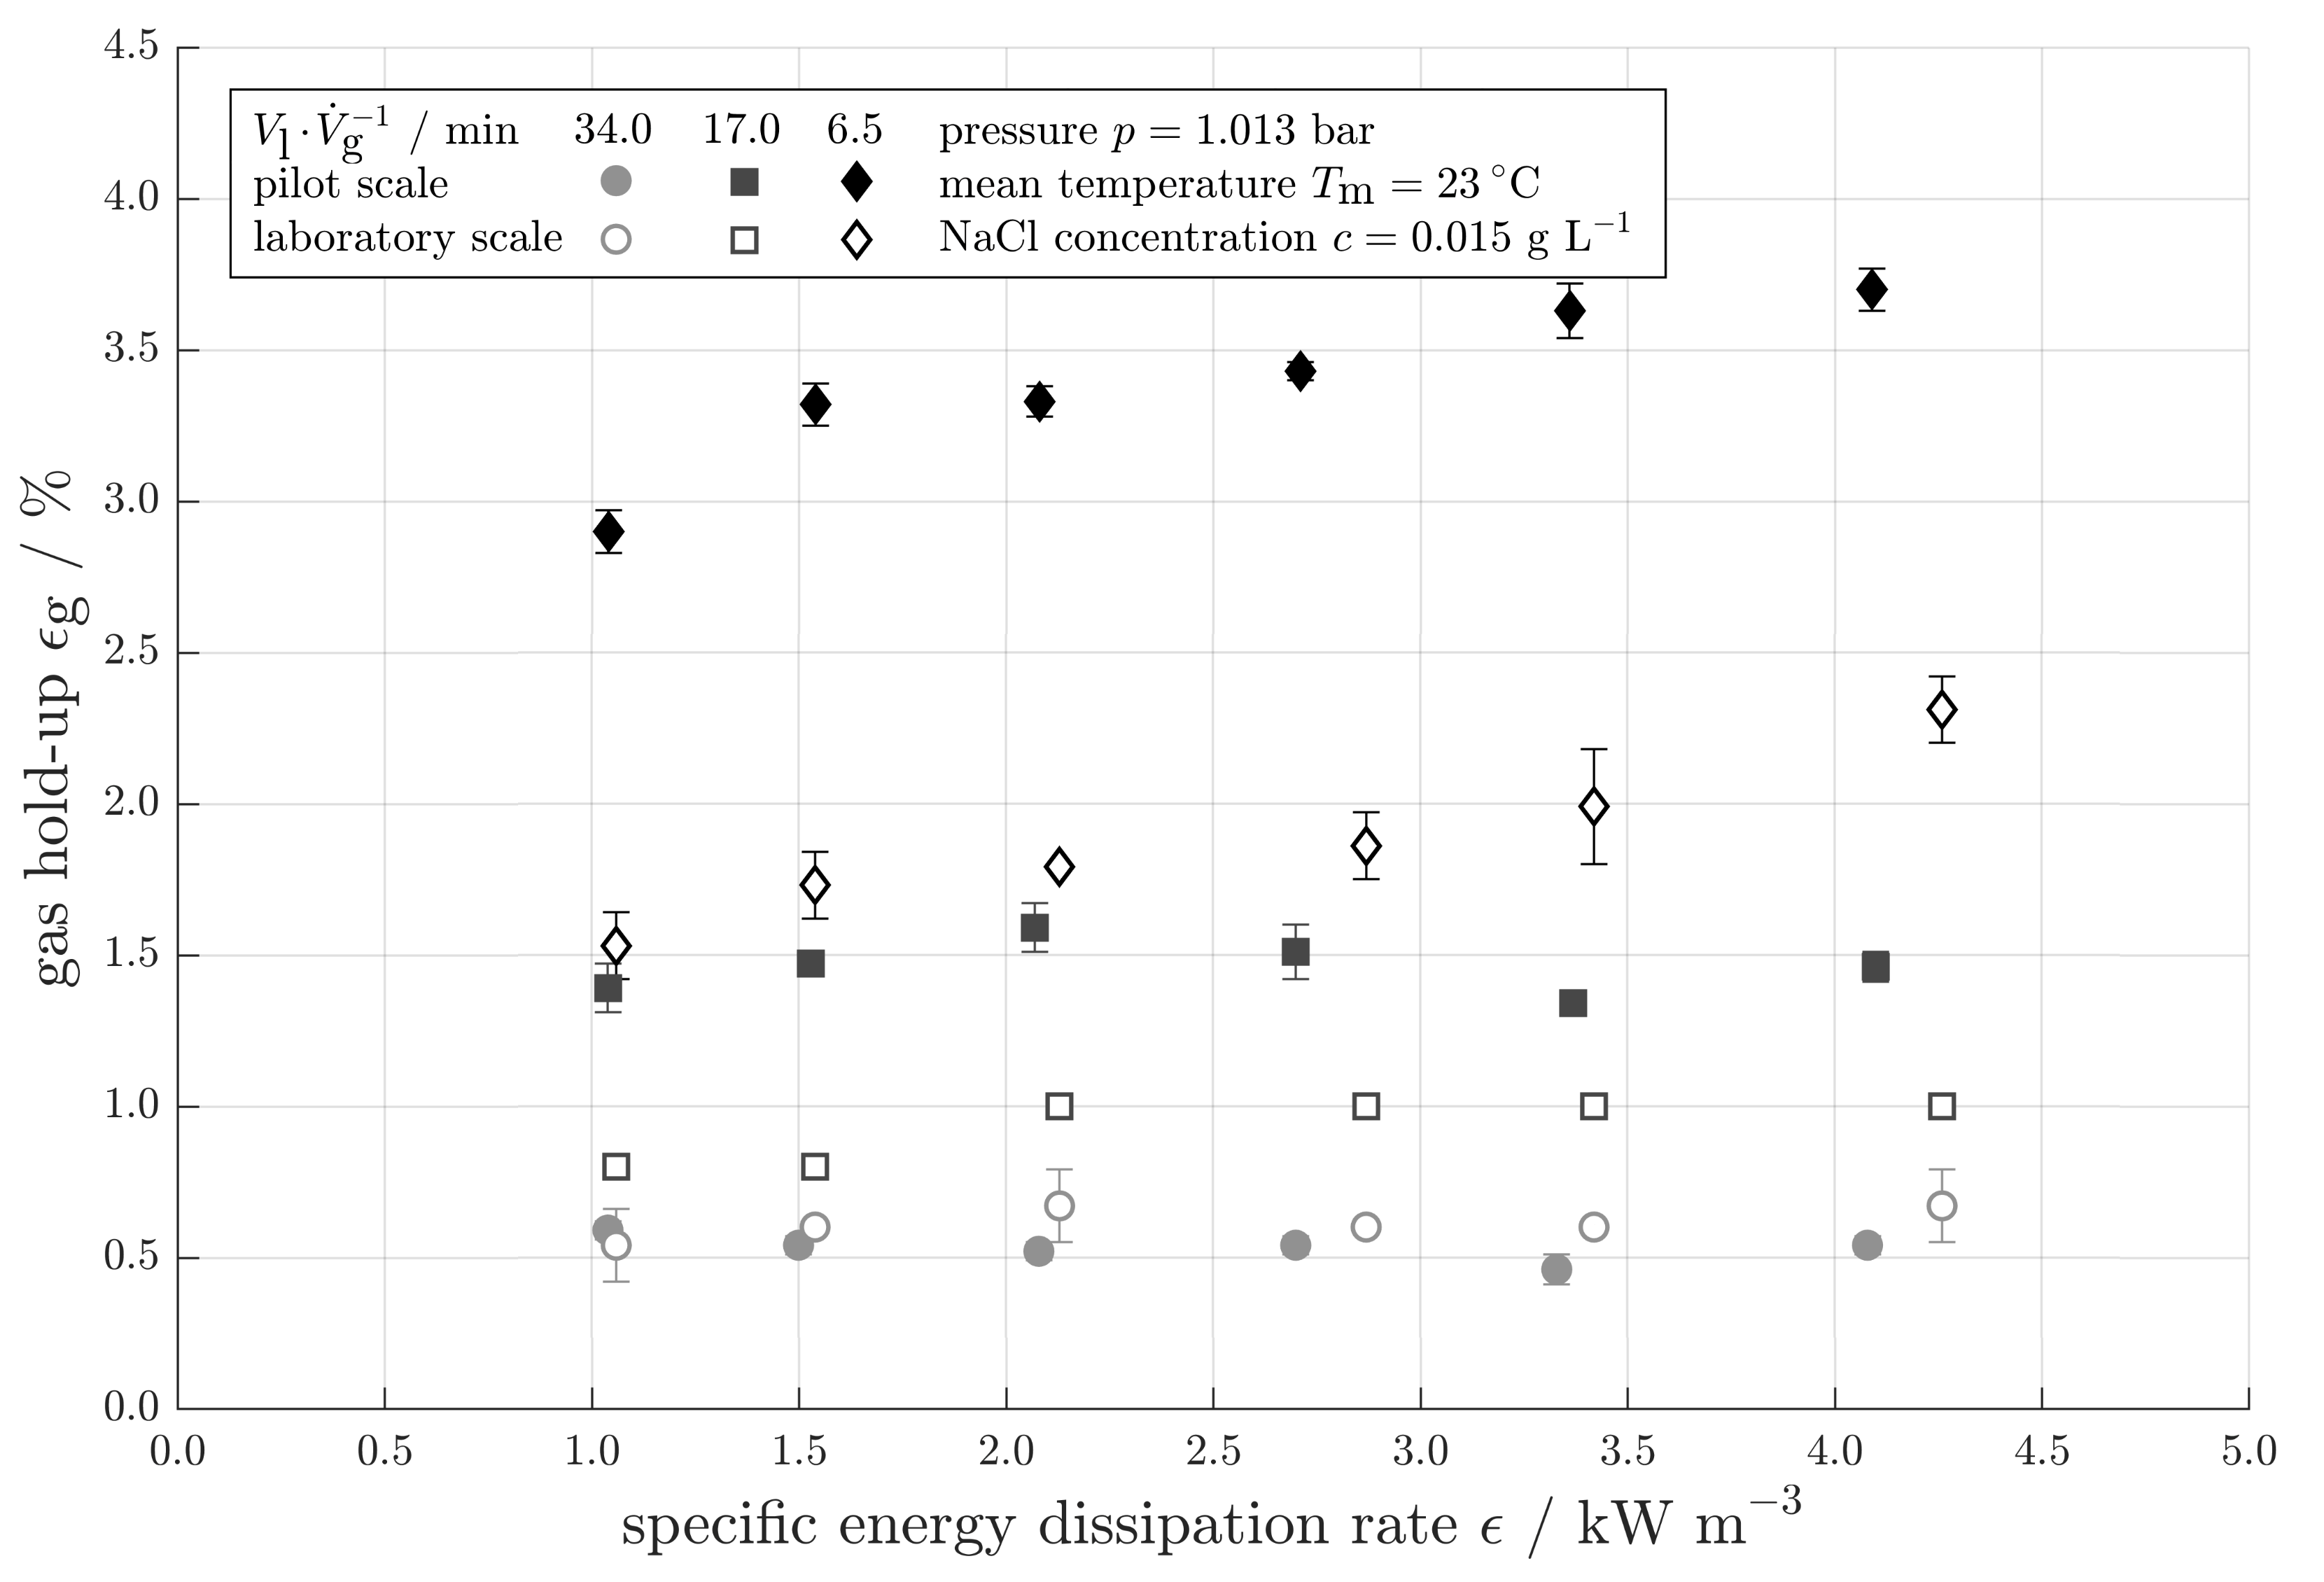
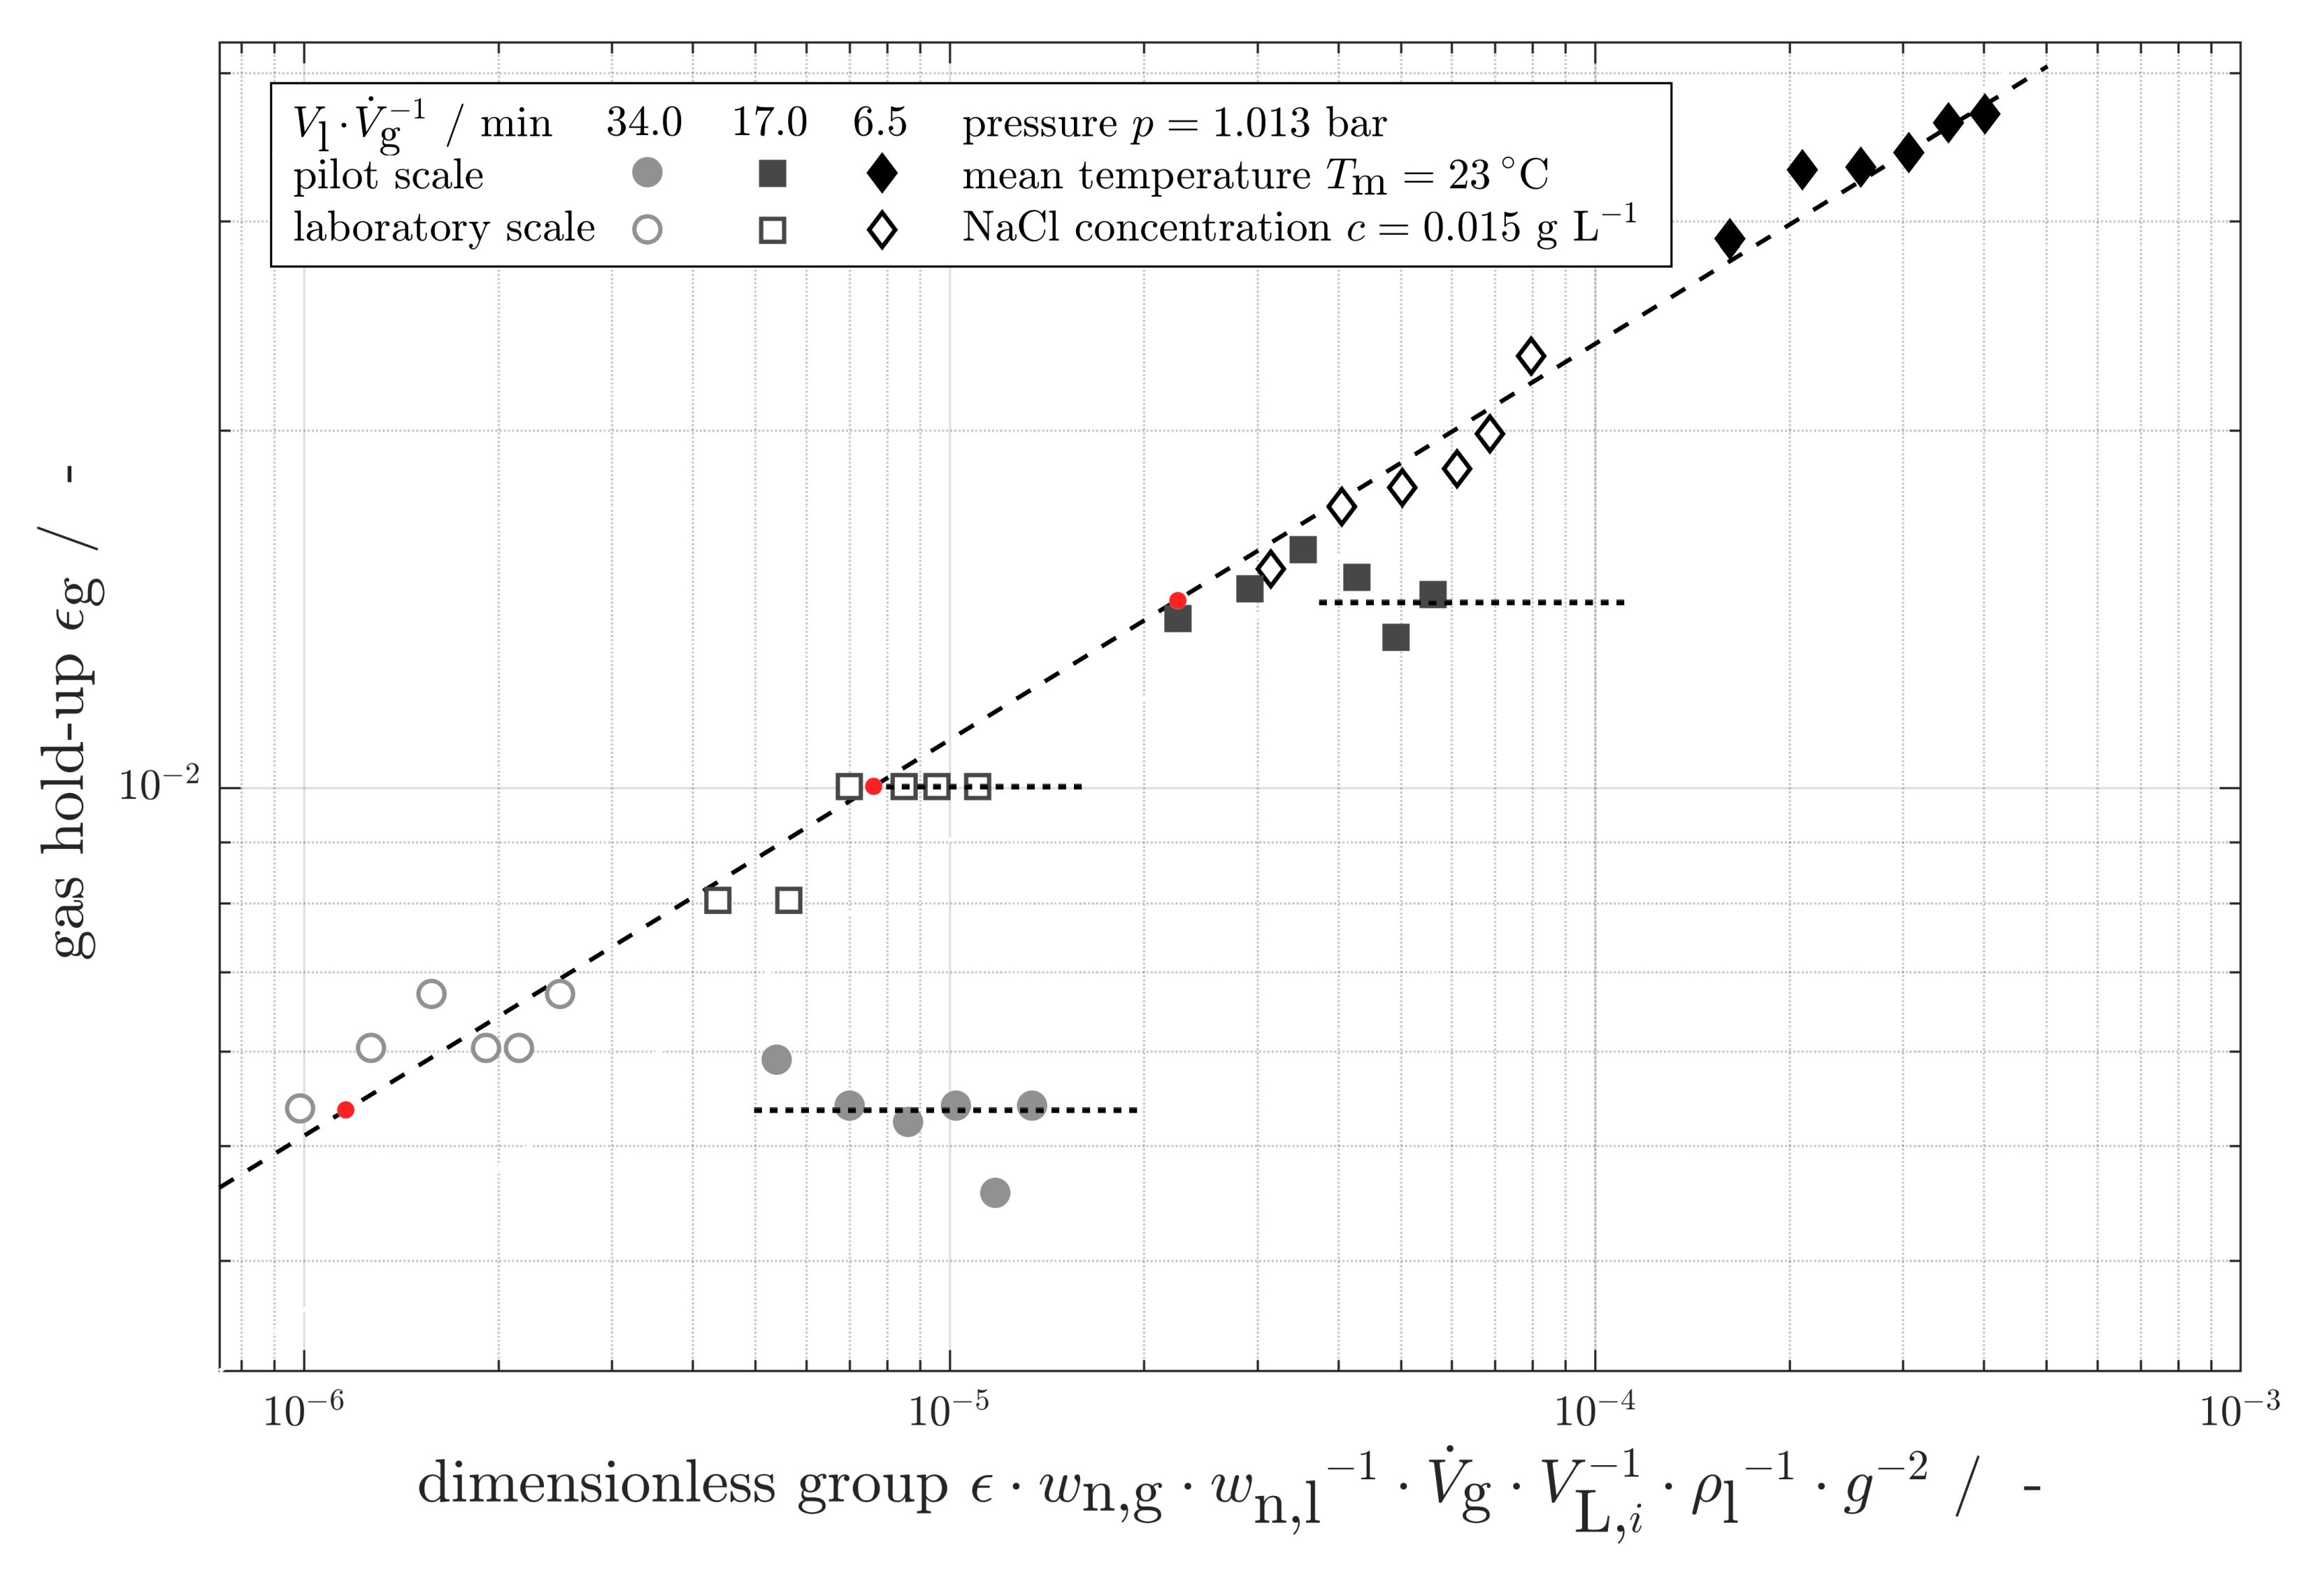
3.2. Gas Hold-Up
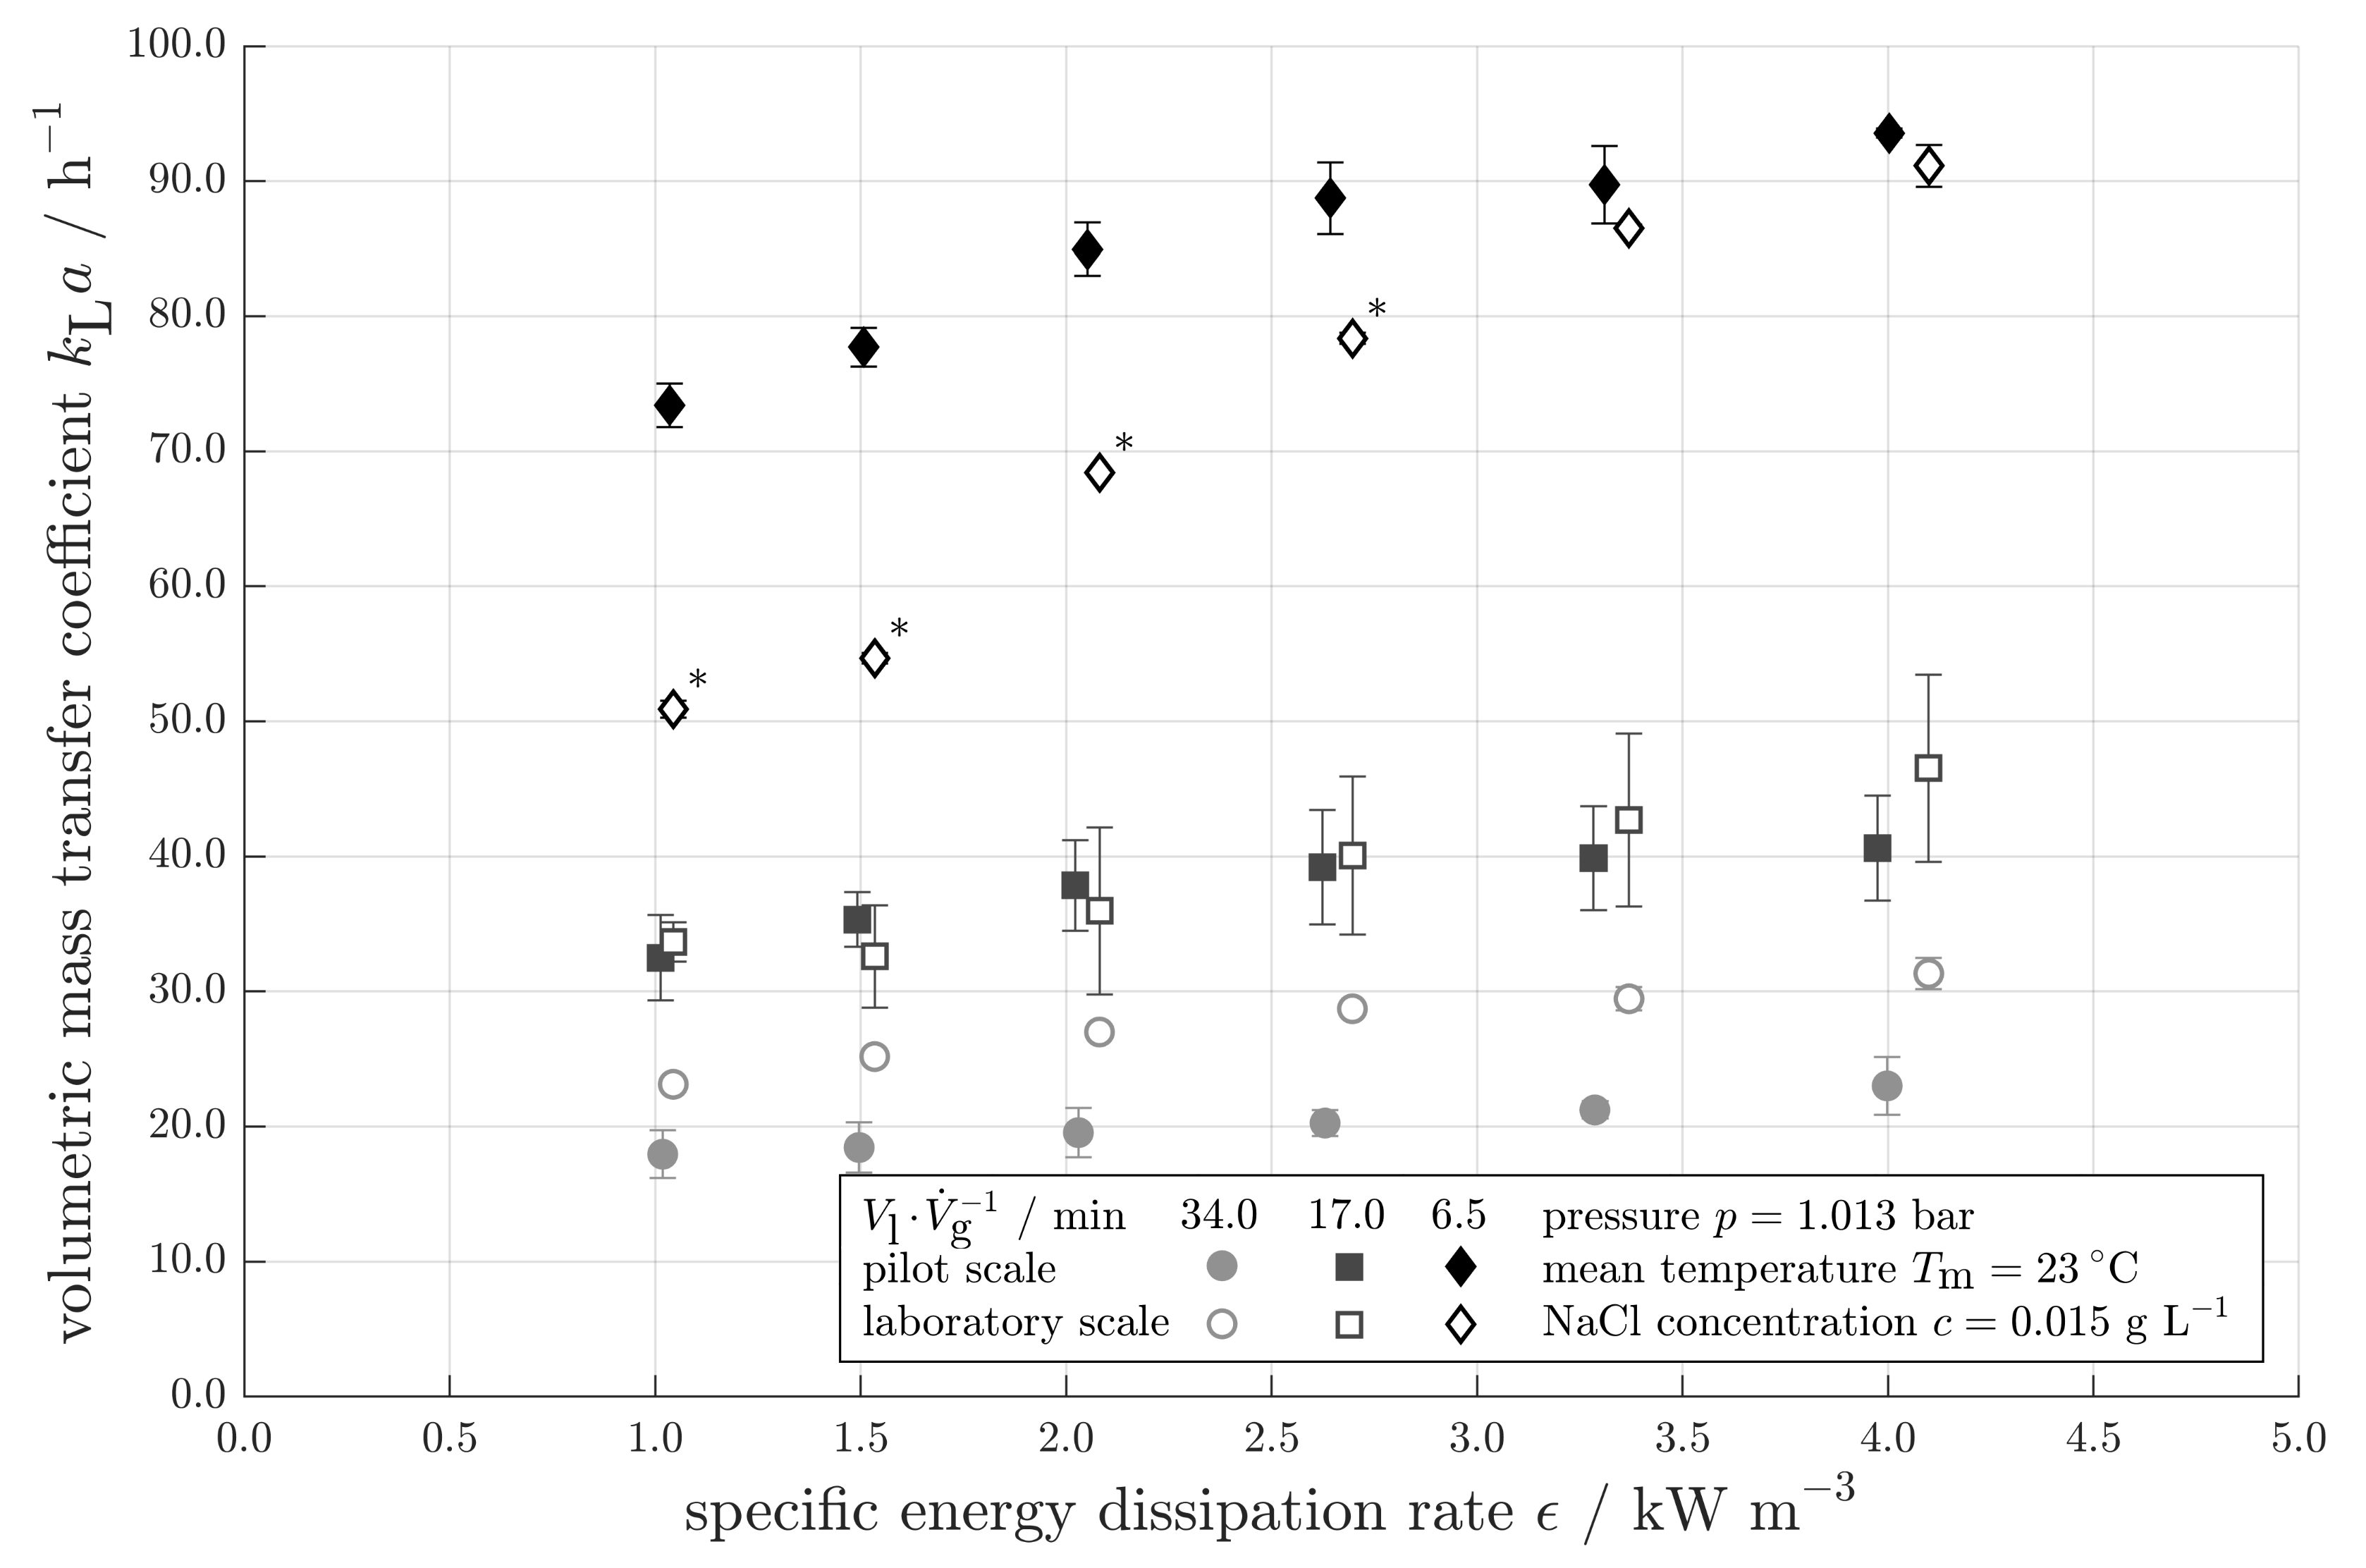
3.3. Volumetric Mass Transfer Coefficient
3.4. Stability of the Loop
4. Discussion
5. Outlook
Author Contributions
Funding
Acknowledgments
Conflicts of Interest
Abbreviations
| FWM | Forschungswerkstatt Maschinenbau |
| IMS | Institute of Multiphase Flows |
| JLR | Jet Loop Reactor |
| LED | Light-Emitting Diode |
| MFC | Mass Flow Controler |
| NaCl | sodium chloride |
| PTFE | Polytetrafluoroethylene |
| TUHH | Hamburg University of Technology |
| VVM | vessel volumes per minute |
Appendix A. Bubble Calculations
References
- Lohrengel, B. Untersuchungen zur Fluiddynamik zwei- und dreiphasig betriebener Schlaufenreaktoren. Ph.D. Thesis, Technische Universität Clausthal, Clausthal, Germany, 1990. [Google Scholar]
- Behr, A.; Becker, M. Multiphase Catalysis in Jetloop-Reactors. Chem. Eng. Trans. 2009, 17, 141–144. [Google Scholar] [CrossRef]
- Behr, A.; Becker, M.; Dostal, J. Bubble-size distributions and interfacial areas in a jetloop reactor for multiphase catalysis. Chem. Eng. Sci. 2009, 64, 2934–2940. [Google Scholar] [CrossRef]
- Wiedemann, M.; Räbiger, N.; Schlüter, M.; Eisenlauer, J.; Riener, F.X.; Kutschera, D.; Neumann, S. Scale-down des Strahlzonen-Schlaufenreaktors: Entwicklung eines Screening-Tools für transportlimitierte chemische Reaktionen. Chem. Ing. Tech. 2010, 83, 349–357. [Google Scholar] [CrossRef]
- Schlüter, M.; Warnecke, H.J.; Zehner, P. Reaktoren für Fluid-Fluid-Reaktionen: Schlaufenreaktoren. In Handbuch Chemische Reaktoren: Grundlagen und Anwendungen der Chemischen Reaktionstechnik; Reschetilowski, W., Ed.; Springer: Berlin/Heidelberg, Germany, 2019; pp. 1–32. [Google Scholar] [CrossRef]
- Blenke, H.; Bohner, K.; Schuster, S. Beitrag zur optimalen Gestaltung chemischer Reaktoren. Chem. Ing. Tech. 1965, 37, 289–294. [Google Scholar] [CrossRef]
- Blenke, H.; Bohner, K.; Pfeiffer, W. Hydrodynamische Berechnung von Schlaufenreaktoren für Einphasensysteme. Chem. Ing. Tech. 1971, 43, 10–17. [Google Scholar] [CrossRef]
- Zehner, P. Suspendieren von Feststoffen im Strahlschlaufenreaktor. Chem. Ing. Tech. 1980, 52, 910–911. [Google Scholar] [CrossRef]
- Tebel, K.H.; Zehner, P.; Langer, G.; Müller, W. Homogenisieren strukturviskoser Flüssigkeiten in Schlaufenreaktoren und Rührkesseln. Chem. Ing. Tech. 1986, 58, 820–821. [Google Scholar] [CrossRef]
- Warnecke, H.J.; Geisendörfer, M.; Hempel, D.C. Mass transfer behaviour of gas-liquid jet loop reactors. Chem. Eng. Technol.-CET 1988, 11, 306–311. [Google Scholar] [CrossRef]
- Tebel, K.H.; Zehner, P. Fluid dynamic description of jet-loop reactors in multiphase operation. Chem. Eng. Technol.-CET 1989, 12, 274–280. [Google Scholar] [CrossRef]
- Warnecke, H.J. Macromixing characteristics of gas-liquid jet loop reactors. Acta Biotechnol. 1989, 9, 111–121. [Google Scholar] [CrossRef]
- Yagna Prasad, K.; Ramanujam, T. Enhancement of gas-liquid mass transfer in a modified reversed flow jet loop reactor with three-phase system. Chem. Eng. Sci. 1995, 50, 2997–3000. [Google Scholar] [CrossRef]
- Jamshidi, A.M.; Sohrabi, M.; Vahabzadeh, F.; Bonakdarpour, B. Studies on the hydrodynamic behavior and mass transfer in a down-flow jet loop reactor with a coaxial draft tube. J. Chem. Technol. Biotechnol. 2001, 76, 39–46. [Google Scholar] [CrossRef]
- Farizoglu, B.; Keskinler, B. Influence of draft tube cross-sectional geometry on KLa and ϵ in jet loop bioreactors (JLB). Chem. Eng. J. 2007, 133, 293–299. [Google Scholar] [CrossRef]
- Behr, A.; Becker, M.; Dostal, J.; Kohlmann, D. Hydrodynamik und Verweilzeitverhalten eines Düsenumlaufreaktors für den Einsatz in der Mehrphasenkatalyse. Chem. Ing. Tech. 2008, 80, 1501–1508. [Google Scholar] [CrossRef]
- Bey, O.; von Harbou, E. Einfluss der Wechselwirkung von Reaktion und Fluiddynamik auf das Verhalten von Strahlschlaufenreaktoren. Chem. Ing. Tech. 2021, 93, 191–200. [Google Scholar] [CrossRef]
- Warmeling, H.; Behr, A.; Vorholt, A.J. Jet loop reactors as a versatile reactor set up—Intensifying catalytic reactions: A review. Chem. Eng. Sci. 2016, 149, 229–248. [Google Scholar] [CrossRef]
- DIN EN 13445-1:2018-12; Unfired Pressure Vessels—Part 1: General. DIN Deutsches Institut für Normung e. V.: Berlin, Germany, 2018.
- Kraume, M. Transportvorgänge in der Verfahrenstechnik, 3rd ed.; Springer: Berlin/Heidelberg, Germany, 2020. [Google Scholar] [CrossRef]
- Wiedemann, M. Einfluss der lokalen Energiedissipationsdichte in Reaktoren auf Umsatz und Selektivität chemischer Reaktionen; Berichte aus der Verfahrenstechnik, Shaker: Aachen, Germany, 2011. [Google Scholar]
- Dreimann, J.; Behr, A.; Vorholt, A.J. Reaktoren für Fluid-Fluid-Reaktionen: Strahldüsenreaktoren. In Handbuch Chemische Reaktoren: Grundlagen und Anwendungen der Chemischen Reaktionstechnik; Reschetilowski, W., Ed.; Springer: Berlin/Heidelberg, Germany, 2018; pp. 1–28. [Google Scholar] [CrossRef]
- Aizad, S.; Yahaya, B.H.; Zubairi, S.I. Fabrication of 3-D polymeric scaffold: The development of continuous flow salt leaching kit coupled with ion conductivity detection. Regen. Res. 2014, 3, 165–168. [Google Scholar]
- Stieß, M. Mechanische Verfahrenstechnik-Partikeltechnologie 1, 3rd ed.; Springer: Berlin/Heidelberg, Germany, 2009; pp. 34–37. [Google Scholar] [CrossRef]
- Garcia-Ochoa, F.; Gomez, E. Bioreactor scale-up and oxygen transfer rate in microbial processes: An overview. Biotechnol. Adv. 2009, 27, 153–176. [Google Scholar] [CrossRef] [PubMed]
- Rosseburg, A.; Fitschen, J.; Wutz, J.; Wucherpfennig, T.; Schlüter, M. Hydrodynamic inhomogeneities in large scale stirred tanks—Influence on mixing time. Chem. Eng. Sci. 2018, 188, 208–220. [Google Scholar] [CrossRef]


| Scale of Reactor: | Pilot | Laboratory |
|---|---|---|
| inner diameter of reactor / m | 0.288 | 0.072 |
| filling level / m | 1.998 | 0.499 |
| liquid volume / L | 129.0 | 2.0 |
| inner diameter of draft tube / m | 0.096 | 0.023 |
| length of draft tube / m | 1.648 | 0.412 |
| height of draft tube above bottom / m | 0.250 | 0.063 |
| diameter of deflection plate / m | 0.160 | 0.040 |
| height of deflection plate above bottom / m | 0.130 | 0.033 |
| liquid coverage above nozzle exit / m | 0.100 | 0.025 |
| spec. Energy Dissipation Rate / kW m | 1.02 | 1.50 | 2.03 | 2.63 | 3.29 | 4.00 |
|---|---|---|---|---|---|---|
| setup | corresponding volume flow rates / L min | |||||
| pilot scale | 47.93 | 54.49 | 60.32 | 65.67 | 70.83 | 75.61 |
| laboratory scale | 1.06 | 1.20 | 1.33 | 1.45 | 1.56 | 1.67 |
Publisher’s Note: MDPI stays neutral with regard to jurisdictional claims in published maps and institutional affiliations. |
© 2022 by the authors. Licensee MDPI, Basel, Switzerland. This article is an open access article distributed under the terms and conditions of the Creative Commons Attribution (CC BY) license (https://creativecommons.org/licenses/by/4.0/).
Share and Cite
Maly, M.; Schaper, S.; Kuwertz, R.; Hoffmann, M.; Heck, J.; Schlüter, M. Scale-Up Strategies of Jet Loop Reactors for the Intensification of Mass Transfer Limited Reactions. Processes 2022, 10, 1531. https://doi.org/10.3390/pr10081531
Maly M, Schaper S, Kuwertz R, Hoffmann M, Heck J, Schlüter M. Scale-Up Strategies of Jet Loop Reactors for the Intensification of Mass Transfer Limited Reactions. Processes. 2022; 10(8):1531. https://doi.org/10.3390/pr10081531
Chicago/Turabian StyleMaly, Marc, Steffen Schaper, Rafael Kuwertz, Marko Hoffmann, Joachim Heck, and Michael Schlüter. 2022. "Scale-Up Strategies of Jet Loop Reactors for the Intensification of Mass Transfer Limited Reactions" Processes 10, no. 8: 1531. https://doi.org/10.3390/pr10081531