Article

FTIR as a Powerful Tool for Measurements of Diffusion in Supercritical Carbon Dioxide Using Taylor Dispersion Method

by
Cecilia I. A. V. Santos
1,*,
Marisa C. F. Barros
1,
Maria P. R. T. Faro
1,
Valentina Shevtsova
2 and
Ana C. F. Ribeiro
1
1
Department of Chemistry, CQC-IMS, University of Coimbra, 3004-535 Coimbra, Portugal
2
Mechanical and Manufacturing Department, Mondragon University, Loramendi 4, 20500 Mondragon, Spain
*
Author to whom correspondence should be addressed.
Processes 2022, 10(8), 1528; https://doi.org/10.3390/pr10081528
Submission received: 24 June 2022 / Revised: 22 July 2022 / Accepted: 26 July 2022 / Published: 3 August 2022
(This article belongs to the Special Issue Utilization and Storage of Carbon Dioxide in Petroleum Engineering)

Abstract

:
A new experimental high-pressure setup for measuring diffusion coefficients in supercritical fluids, based on Taylor dispersion method, and using an FTIR detector to operate up to 25.0 MPa was designed and optimized. Tracer diffusivities, D12, of toluene and benzene in supercritical carbon dioxide were measured in the temperature range of 306.15–320.15 K, and pressure range of 7.5–17 MPa to evaluate the setup and experimental protocol. The effects of flow velocity, volume of the cell, absorbance at different wavenumbers on the diffusion coefficient as well as all parameters respecting the Taylor dispersion method have been analyzed. The obtained diffusion coefficients are in excellent agreement with the available literature data. The dependence of D12 on temperature, pressure, and solvent density were examined. Some correlation models based on the hydrodynamic theory were used to estimate the diffusion coefficients in supercritical carbon dioxide, which is the best agreement obtained for an improved version of the Wilke–Chang model.

1. Introduction

The last decades of the 20th century have boosted the interest and importance of research on supercritical technologies, mainly due to its contribution in the mitigation of climate change. Nowadays, the amount of carbon dioxide (CO2) emitted to the atmosphere is enormous (over 50 Gt annually) and the majority of that is related to anthropogenic activities [1]. As CO2 is a greenhouse gas, not so environmentally friendly, several technologies started to appear with the main purpose of minimizing its harsh effects, focusing on sustainability. Among them, carbon capture and storage (CCS) technologies, considered as one of the most promising options for carbon reduction, make use of supercritical conditions to allow the storage of large industrial quantities of CO2 into reservoirs in deep permeable geologic formations. Current storage capacity is around 39 million tons of CO2 annually, which equals slightly more than 0.1% of global emissions [2]. Perspective studies show that up to 400 MtCO2 p.a. could be captured from electricity and industry combined (in Europe), because only 80–90% of the CO2 emissions of thermal power plants can be captured [3]. Feasibility of CCS technologies appears quite reasonable with studies showing that for a combined CCS and heat and power plant, it is possible to attain negative CO2 emissions although this technology is still not economically feasible due to the small scale of the projects (high operational costs) and underdevelopment of CCS technologies [2]. Still, CCS must be validated to be a feasible option not only in terms of cost but also in safety to the environment, which leads to research focused on the short- and long-term effects of carbon dioxide injection into reservoirs [4,5,6,7]. Fundamental research in both the migration of supercritical CO2 inside the geological formation, important for the knowledge of the sequestration process (whose trapping mechanisms depend on the hydrodynamic, physical, and chemical conditions in the formation), or the assessment of the sealing efficiency, is being conducted by more than a few research groups around the globe in order to better comprehend the risks associated with this technology. This is, however, a very challenging task since performing research in supercritical fluids near the supercritical point comes with the possibility of minor changes either in pressure or temperature outcome in not so accurate results, thus, the measurement of diffusion in supercritical fluids require specific equipment prepared to operate in high stress conditions, that simulate temperature and pressure in underground circumstances, and a validated method [8].
The physical state of carbon dioxide is very dependent on both temperature and pressure, and the transition between states, in underground conditions, depends also on the geothermal gradient. When under specific conditions (pc = 7.38 MPa, Tc = 304.18 K), CO2 becomes a supercritical fluid, that can expand as a gas but has a density like a liquid [9,10]. This low viscosity combined with its high solute diffusivity results in superior mass transfer characteristics and has encouraged the use of carbon dioxide as a green solvent in a large range of applications. Carbon dioxide chemical stability, inertness, low critical temperature, relative non-toxicity, non-flammability, and availability at low cost makes CO2, in a supercritical state, a tool that can be applied in the development of new geothermal energy systems [11,12,13].
Thus, it is of great importance to research and understand the supercritical behavior of fluids and their heat transfer processes. Literature can provide a few theoretical and empirical correlative models capable to predict diffusion coefficients, e.g., hydrodynamic- based models [14,15,16,17,18,19], but there is still insufficient information, namely, experimental data for a given system that can allow to accurately calculate the diffusion coefficient values, as it is the case of certain carbon mixtures, or the models fail in certain temperature and pressure conditions. The availability of accurate diffusion coefficients is key to validly mimic real geological conditions, becoming essential information to design and optimize any process involving supercritical CO2, namely, to model the migration behavior inside the reservoirs but also, to complement with other properties (solubility, vapor–liquid equilibrium, etc.) to meliorate the already existent theoretical models.
Taylor dispersion technique (or chromatographic peak broadening technique) is one of the experimental methods that can be adapted to investigate supercritical diffusion, since it would allow to operate with a higher pressure range, providing transport data measured in conditions corresponding to those in real geological reservoirs and thus allowing to accurately predict the thermodynamic behavior of these multicomponent systems. Taylor dispersion method has proved to be a fast and reliable method to achieve diffusion coefficients for a wide range of aqueous and non-aqueous systems [10,20,21,22,23,24,25]. Taylor first applied his technique in the late 1950s [26] and since then, several academic and research works were published where the dispersion technique was used to predict diffusion coefficients of different mixtures.
In this work, we describe the design and assembling of a new experimental setup for the measurement of supercritical diffusion, based on Taylor dispersion method and integrating an FTIR detector, and aim to demonstrate the applicability of this spectroscopic technique as a tool for the measurement of mass transport coefficients. The equipment and experimental parameters are carefully tested and optimized.
Validation of the method is carried out by cross-checking the measurements of diffusion coefficients for pure toluene and pure benzene in supercritical carbon dioxide at temperature range 306.15–320.15 K and pressure range 7.5–17 MPa. Additional data for these systems in the near-critical region is also provided. Effects of flow velocity, measurements of absorbance at different wavelengths, and the inside volume of the cell, among others, are parameters analyzed and discussed in detail. Thermodynamic empirical models are also used to estimate the diffusion coefficients and their evaluation against experimental data is conducted.

2. Materials and Methods

2.1. Materials

Toluene 99.85% (CAS Number: 110-82-7) was supplied by Acros Organics and Benzene 99.8% (Cas Number: 71-43-2) was supplied by Sigma Aldrich. All liquids were used as received, with no further purification. CO2 with purity higher than 99.995% (water content < 40 ppm) was supplied by Messer.

2.2. Equipment and Procedure

In this work, we are using the principle of the Taylor dispersion technique for the conception of a high-pressure apparatus for the measurement of supercritical diffusion coefficients. Taylor dispersion technique consists of the injection of a small volume of solute (or solution of different composition) into a laminar carrier stream of solvent. Radial diffusion and axial convection shape the injected concentration pulse into a Gaussian distribution as it flows through a long capillary tube. At the end of the tube, a detector records the change in the concentration profile and the diffusion coefficients are calculated from the broadened distribution of the dispersed sample. This method has numerous advantages including relatively fast measurements, ease of automation, use of standard high-performance liquid chromatography (HPLC) components, and especially, a fully developed working equation that permits absolute measurements. Moreover, this method has been widely used for the measurement of diffusion coefficients in a wide range of fluids and conditions [10,20,21,22,23,24,25], solid reasons that justify its choice as a base for the design of our high-pressure apparatus.

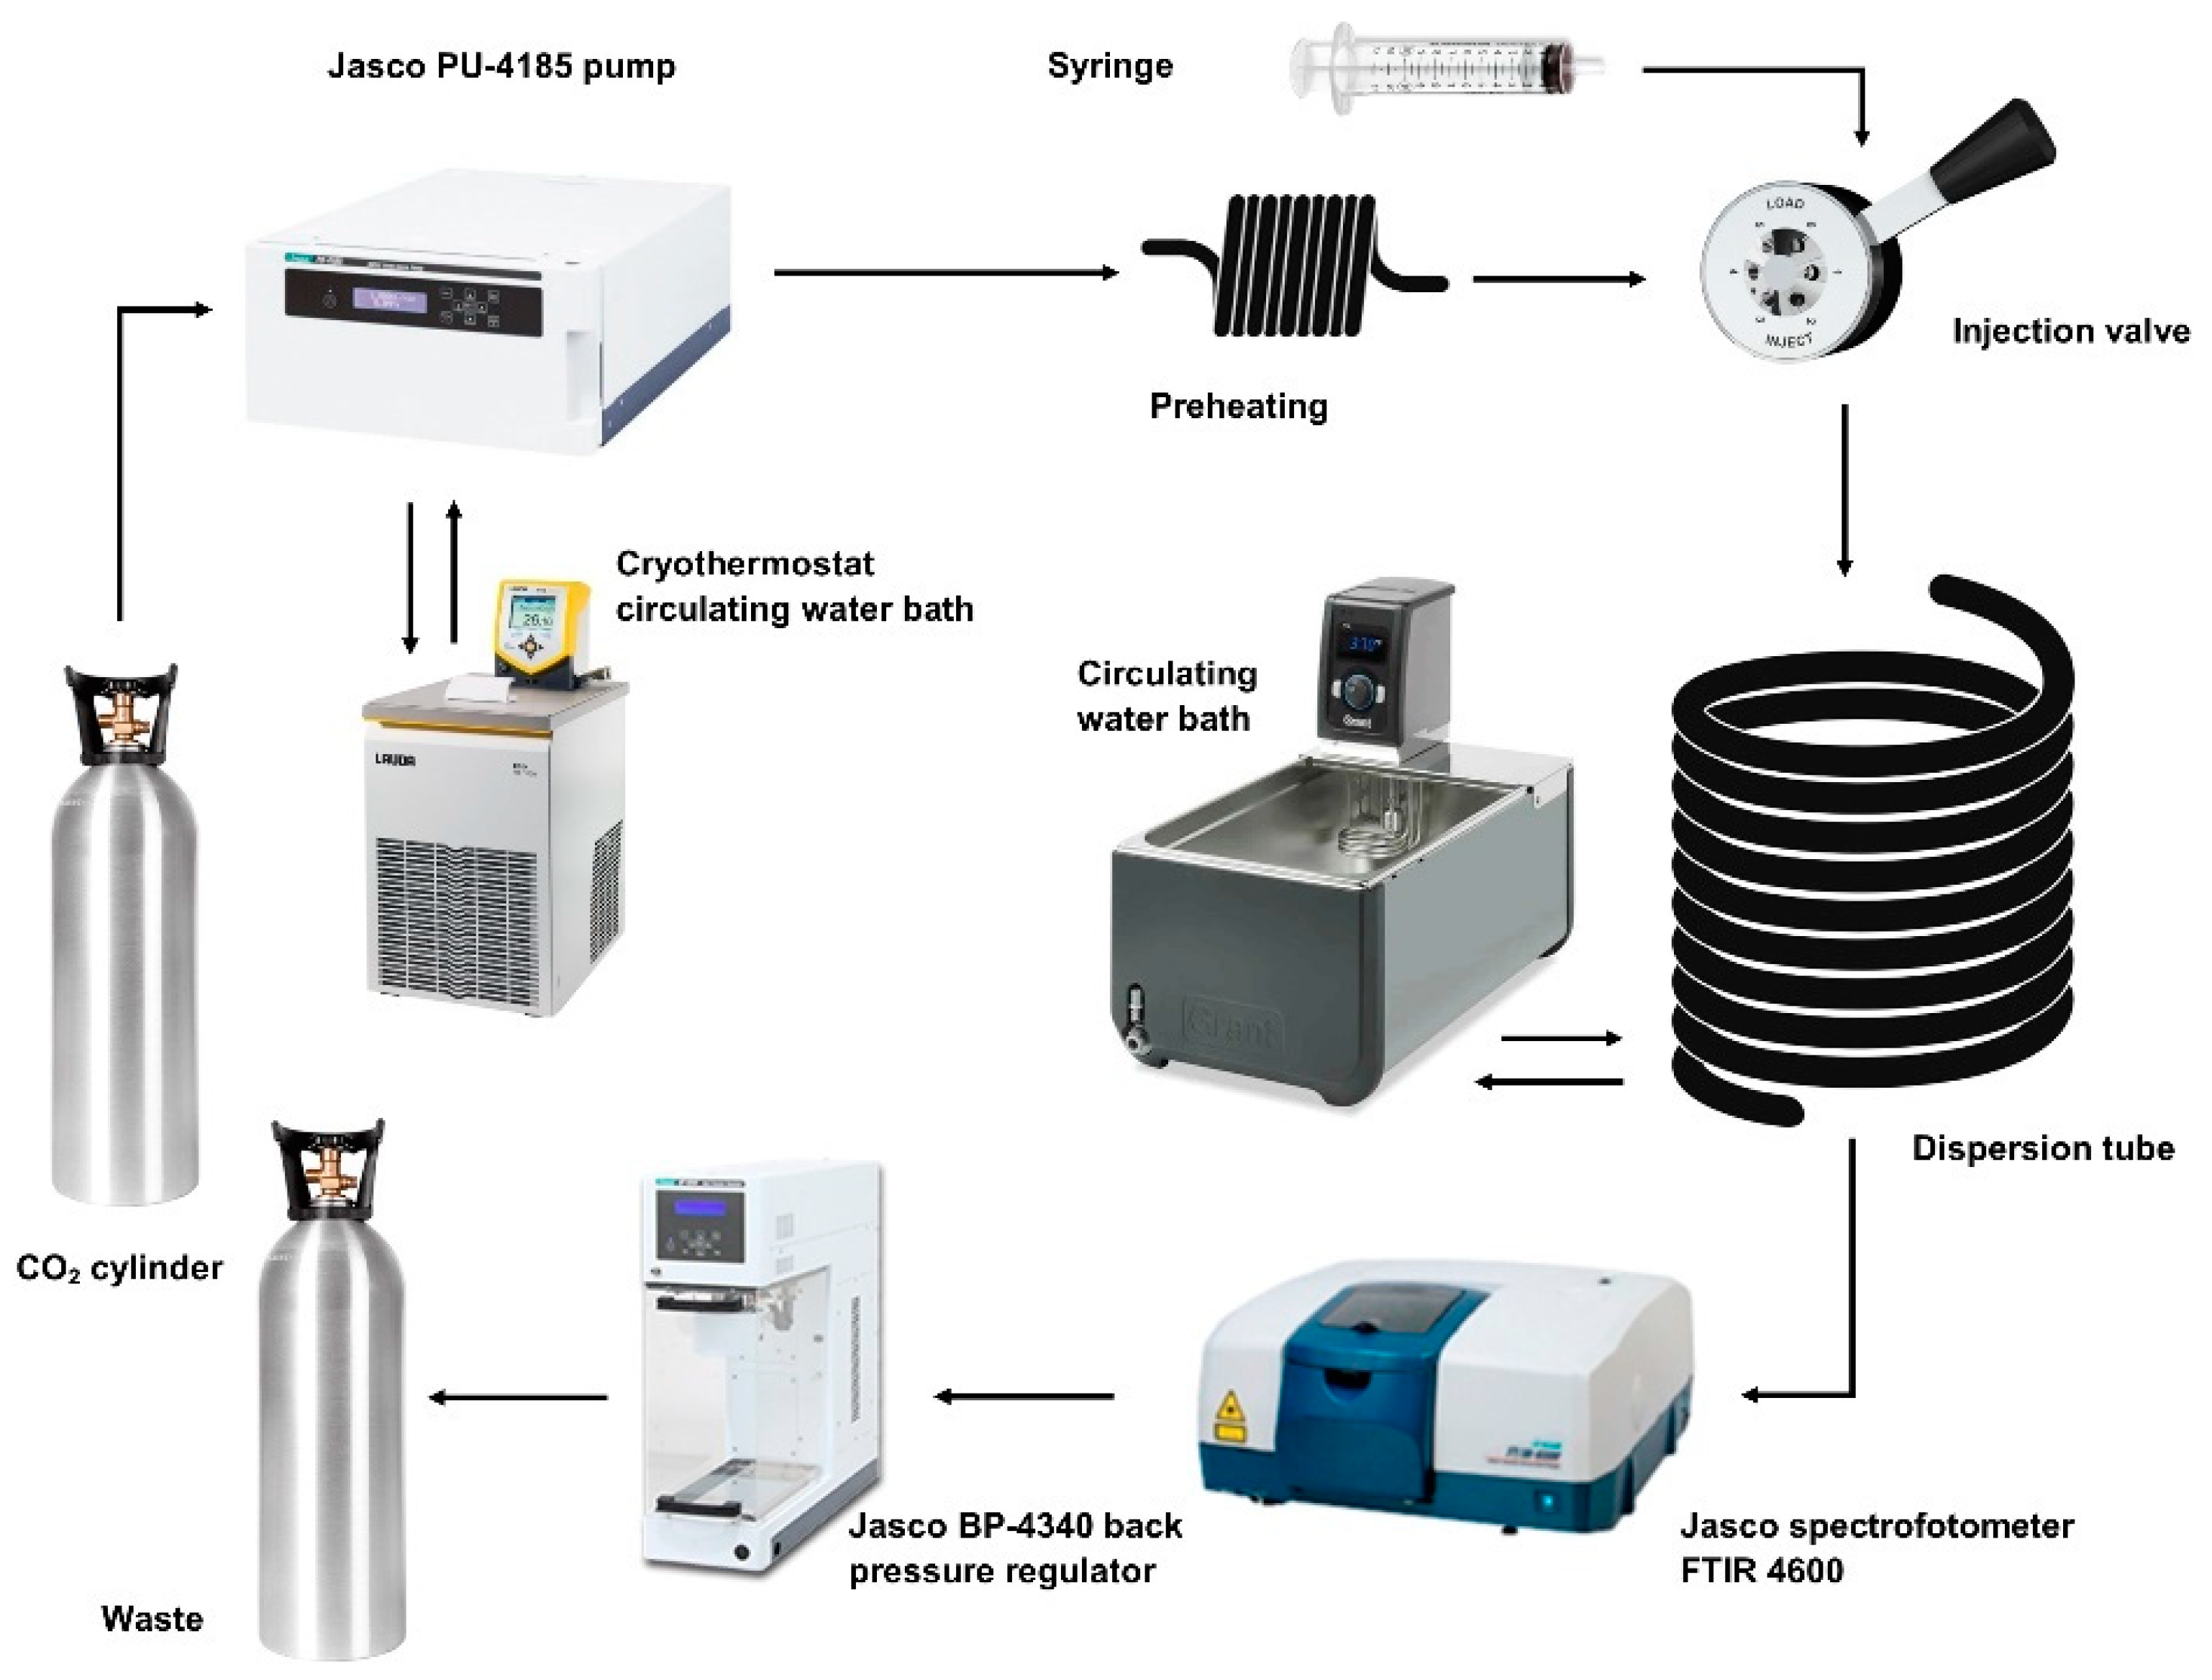
2.2.1. Bases of Instrument Design

The design of the experimental instrument for the measurement of diffusion coefficients in supercritical fluids must be validated at several levels, namely, in what concerns the applicability of the method for supercritical fluids and the suitability of the use of the FTIR detector from a spectroscopical and analytical point of view.
Alizadeh et al. [27] have reviewed the fundamental details that support the application of the Taylor dispersion technique for the measurement of diffusion coefficients. Below, we only summarize the main aspects used to validate the method and to attain the optimal conditions for the equipment to operate.
In this experimental method, a small amount of solute is injected into a fluid (eluent) flowing in laminar flow through a long, narrow tube. After injection, the solute is dispersed by a combination of processes due to molecular diffusion, caused by the concentration gradient and the parabolic velocity profile of the eluent. These processes act in opposition: the laminar flow distorts the initial pulse of solute, tending to disperse it; if molecular diffusion is fast enough, solute molecules move from the inside of the tube to the region close to the walls, and vice versa, in a radial motion that diminishes the effect of axial dispersion. After a certain time interval, the axial profile of concentration inside the tube assumes an almost Gaussian shape that can be followed in the detector. The concentration profile of the pulse of solute under the previously described conditions can be expressed as the variance of the response curve, σ2 [28]:
σ 2 = 2 D 12 L U 0 + r 0 2 U 0 L 24 D 12 = L H
where D12 is the binary diffusion coefficient of the solute (1) in the fluid (2), L is the tube length, U0 is the average velocity of the eluent, r0 is the inner radius of the dispersion tube, and H is the theoretical plate height. The first term in third member represents the dispersion due to the axial diffusion, and the second one considers the peak opening because of the parabolic velocity profile and the diffusion in radial direction. The shape of this distribution will be of the Gaussian type if:
D 12 U 0 L + r 0 2 U 0 48 D 12 L < 0.01
Thus, D12, can be obtained from:
D 12 = U 0 4 [ H ± H 2 r 0 2 3 ]
where H can be calculated from the known tube length L and retention time (tR) by:
H = L W 1 / 2 2 5.545 t R 2
by measuring the peak width at half height, W 1 / 2 2 .
While Equations (1) and (2) were specifically derived for a straight capillary tube, they can be applied to a coiled tube added with the following restriction:
D e 2 S c < 10
where De and Sc are the Dean and Schmidt numbers, respectively, and are defined as D e = R e ( r c r 0 ) 1 2   where Re is the Reynolds number, r0 is the inner radius and rc is the coil radius of the dispersion tube, and S c = η / ρ D 12, where η and ρ are the viscosity and density of the fluid. This restriction is particularly important to define the geometry of the system in a way that it meets the main criteria of laminar flow and neglects secondary flow induced by the capillary tube coiling. It is considered laminar flow in a tube for Reynolds number inferior to 2000. In the case of typical Taylor experiments, Reynolds number is usually inferior to 200. The ratio between the radius of the tube coiling and the inner radius of the tube then becomes a parameter of great importance because the capillary tubes employed in Taylor dispersion technique are usually quite long (usually 20 to 30 m long) and have small inner radius (usually 0.5 mm or less), requiring it to be coiled to ensure constant temperature conditions. When coiled, this circumstance leads to the existence of two competing dispersion mechanisms inside the tube [29]. Curvature increases the difference in the retention time across the flow in comparison to a straight tube, leading to the increase of the dispersion coefficient (and thus a decrease in the diffusion coefficient), but the secondary flow, which occurs due to centrifugal effects, creates radial mixing, which increases diffusion coefficient. Although a correction factor, K, was defined to overcome effects of the secondary flow by several authors [29,30,31], here, Equation (5) is primarily used to define geometry and estimate the error introduced by the secondary flow, when operating in conditions close to the supercritical point, rather than to make corrections on the diffusion coefficients.
Conventional Taylor dispersion setup can generally work in a broad range of temperatures but is limited to a low-pressure range, generally bellow 0.5 MPa, and usually integrate, as detector, a differential refractometer. Being that Taylor dispersion is a transient response method, the signal originated from the injection of a pulse of solute is detected in terms of a small change in concentration, in this case, the refractive index. The need to achieve more data on diffusion in a wider range of pressure has driven the introduction of adjustments to the Taylor dispersion technique, aiming for its application in the measurement of diffusivities in high pressure conditions and thus integrating new equipment accordingly [32,33,34,35,36]. One of the most usual adjustments is the introduction of restriction tubes before the refractive index detectors [31,34], to allow higher pressures in the diffusion tube, but this has the disadvantage of perturbing the diffusion process (e.g., the flow is disrupted, the fluid velocity may change, and the dispersion of the solute becomes distorted). More recently, the adoption of UV detectors, equipped with analytical flow cells of fixed size, and with pressure regulation by back-pressure regulators, is becoming a more conventional solution [37]. Temporal changes in concentration of the sample are monitored by the UV detector and followed in terms of wavelengths with time (between a range of wavelengths or at a fixed wavelength).
For the equipment designed here, we have chosen an FT-IR spectrophotometer, equipped with a high-pressure flow cell, and capable of investigating absorption peaks at multiple wavenumbers, corresponding to one (or several) specific type of vibration modes of a molecule.
In the last years, a growing number of investigators have recognized the potential of employing spectroscopy-based techniques to diffusion studies, namely, for the study of diffusion in polymers, e.g., self-diffusion by pulsed field gradient NMR and diffusion of gases and liquids in polymers, by means of time-resolved FT-IR spectroscopy [38,39]. To our knowledge, an FT-IR spectrophotometer has not yet been applied as a detector for the measurement of diffusion in liquids at high pressure, nor supercritical fluids, with exception of our own studies [10,40,41], although this is a detection method typically used in supercritical fluid chromatography [42,43]. The main reasons that justify the choice of the FT-IR spectrophotometer as a detector are due to the high sampling rate, the sensitivity and accuracy of the quantitative analysis, and, above all, the wealth of information at molecular level contained in the vibrational spectrum. In fact, IR spectroscopy is a powerful tool to detect vibrational motions in a molecule. Vibration modes of a molecule can be either stretching, like a spring, or bending (changes on the angle of the atoms). There are four bending vibrations: wagging, twisting, rocking, and scissoring. Each type of vibration absorbs specific wavelengths of IR light. FT-IR is also a well-established technique to identify functional groups in organic molecules based on their vibration modes at different infrared wavenumbers. The presence or absence of functional groups, their protonation states, or any changes due to new interactions can be monitored by analyzing the position and intensity of the different infrared absorption bands. Consequently, IR spectrum acts as a “fingerprint” for identification of the molecule from the vibrational modes in it.
Furthermore, and from a design point of view, the FT-IR spectrophotometer has one more advantage. By introducing a high-pressure cell, it can be combined in line with the Taylor dispersion tube and the back-pressure regulator, allowing for the flow to be decompressed only after the detector, without causing any negative disturbing effects that invalidate the measurement of the diffusion coefficient. Finally, FT-IR high pressure flow cell can be adjusted for the optimal optical path and volume of the sample, and the optical windows can be changed to increase the range of pressure where the equipment is able to operate (raising up to 50 MPa in case of sapphire windows) against the 30 MPa limit in UV high-pressure flow cells.
Based on the supercritical fluid chromatography (SFC) instrumentation using FT-IR detectors, we can anticipate that supercritical CO2 is nearly an ideal solvent with broad IR transparency. Indeed, transmittance spectra for supercritical carbon dioxide presents three IR transparent regions ranging from 850–1200, 1400–2100, and 2600–3400 cm−1 [42,43,44], thus meaning that it will be possible to detect any vibrational modes of the solute molecules that appear in those regions (with the exception of the observation of the OH stretching vibrational modes of hydroxy groups, the rest of the spectrum is remarkably free of interfering CO2 absorption bands). Quantitative studies via IR spectroscopy rely on measurements of absorbance that are related to concentration by the Beer–Lambert law. Although it has been observed that absorptivity can change with pressure (and thus with density), this can be overcome by following several bands at the same time (e.g., overtone bands or bands corresponding to vibrations with a smaller change of dipole movement). The use of a flow cell also allows a dynamic measurement of the background, allowing to follow the absorption bands for supercritical CO2 spectrum and to use it for subtraction purposes.
The lower range of T and p parameters required to perform the diffusion study in supercritical CO2 is limited by the critical parameters of carbon dioxide: Tc = 304.18 K and pc = 7.38 MPa [45]. Conditions of temperature and pressure need accurate control given that the mobile phase can present some spectral changes. It has been observed that a decrease in the density of supercritical carbon dioxide induces a reduction in transparency of the spectral region 1350–1430 cm−1 [43]. At a given pressure, the absorbance decreases with increasing temperature, so the supercritical carbon dioxide transparency will be better with a higher temperature. However, under subcritical detection conditions, the variation of the carbon dioxide density may induce a small increase in solute peak concentration and hence lead to higher absorbance [42].

2.2.2. Experimental Setup and Procedure

Accounting for all the previous considerations, our Taylor dispersion apparatus, for the measurement of supercritical diffusion coefficients, was assembled as follows (Figure 1). A stainless steel capillary tube of (30.916 ± 0.001) m length and 0.375 mm inner radii was used. It was coiled, in the form of a helix, over an aluminum cylinder with 0.36 m diameter, for both support and temperature regulation, and immersed in a temperature-regulated water bath (Grant JD100 from Grant Instruments, UK) kept at the experimental temperature ± 0.1 K. At the start of each run, a pulse of 5 μL of pure solute was injected through a 6-port injection valve (Knauer model A1357, from Knauer, Germany) into carbon dioxide flowing at a constant flow rate of 0.3 cm3 min−1, maintained by an HPLC analytical pump (Jasco PU-4185, from Jasco Inc.,Tokyo, Japan). Attached to the pump head, there is a custom-designed cooling jacket device, temperature regulated by a Peltier module which is regulated itself through a circulating water bath (Lauda Eco RE415G from Lauda, Lauda-Königshofen, Germany), set to 260.15 K, to ensure CO2 is in the liquid state and the pump can pressurize liquid CO2 above its critical pressure. This cooling assembly works in permanence. A heat exchanger of about 1.5 m long, placed at the pump outlet, allows the preheating of the liquid CO2 to its supercritical state before entering the injection valve. Dispersion of the injected samples was monitored at the outlet of the dispersion tube using an FT-IR refractometer (Jasco FT-IR 4600 from Jasco Inc., Japan), equipped with a high-pressure demountable cell (Harrick). The high-pressure cell was assembled with ZnSe optical windows, with 6 mm thickness, allowing a maximum working pressure of 25 MPa. Inside the cell, a Teflon spacer defines the volume of the size of the optical path, and thus the volume of sample analyzed. Different spacers with different thicknesses were tested to attain for the best signal-to-noise ratio.
Response curves, corresponding to the changes in the flow with time, were monitored in terms of absorbance/transmittance spectra at wavenumbers corresponding to different vibration modes of the solutes here studied. The detector is connected to a computer for digital data acquisition using the Spectra Manager software provided by Jasco. A back- pressure regulator (Jasco BP-4340 from Jasco Inc., Japan) is used to establish the pressure inside the system and the latter is controlled with a pressure sensor (Jumo dTrans p30 from JUMO Process Control, Inc., New York, NY, USA) within ±0.05 MPa. Data were recorded at increments of 4 cm−1 and at time intervals of 4 s for each measurement. Diffusion coefficients presented here are the average of 4 to 6 injections of sample.
Before each experiment, the water bath, where the dispersion tube is immersed, is set to the desired working temperature, and allowed to stabilize for at least 3 to 4 h. Refrigeration circuit for the cooling device of the pump’s head, set to 260.15 K and permanently running, is also cross-checked. Pressure is set at the back-pressure regulator and the pump is switched on at the highest possible flow rate (4.0 mL/min). When the system attains the desired pressure, the flow rate is then gradually decreased to the working flow rate (here varying from 0.2 mL/min to 0.7 mL/min). To ensure a stationary baseline, the CO2 flow through the tube is maintained for at least 1 h before the experiment begins. Then, the solute is injected into the carrier flow. When the experiment is finished, the system is depressurized, releasing the pressure to the ambient. Each experiment is performed 4 to 6 times, and injections are administered independently.

2.2.3. Processing of Results

Determination of the diffusion coefficients from the solute absorbance response curves was performed assuming the same procedure defined for the conventional Taylor equipment using a differential refractometer [20,46,47,48]. That is, when a sample of concentration C0 + ΔC is injected into a tube across which a carrier liquid (with composition C0) flow in a steady laminar regime, it spreads out longitudinally under the combined effect of molecular diffusion and advection with the flow, and the averaged concentration profile of the dispersed sample (from Equation (1)) can be calculated from:
C ( t ) = C 0 + 2 Δ C Δ V r 0 3 U 0 3 D π 3 t exp   ( 12 D ( t t r ) 2 r 0 2 )
where tR is retention time of the peak (calculated from t r = L U 0 ), L is the length of the dispersion tube, U0 is the average velocity of the carrier liquid, ΔV is the volume of the sample, and D is the solute diffusion coefficient. Equation (6) is valid under the assumption that D is constant across the dispersion profile. In our particular case, the FT-IR detector does not sample the concentration directly; it can be assumed there is a direct proportionality between the small changes in concentration C and the variations in absorbance, and thus extracting the diffusion coefficients by fitting the experimentally measured signal to:
A ( t ) = A 0 + A 1 t + A 2 t 2 + R ( C ( t ) C 0 ) = A 0 + A 1 t + A 2 t 2 + Δ A t R t exp ( 12 D ( t t R ) 2 R 2 t )
where the three first terms A0 + A1t + A2t2 consider the drift and curvature of the baseline due to small concentration and temperature variations; tR is retention time of the peak, R = (∂A/∂C)λ is the sensitivity of the detector (that depends on the wavenumber upon which the measurements are carried); ΔA is the peak height relative to the baseline. Diffusion coefficients D are then obtained by fitting the response curve to the theoretical solution expressed by Equation (7), by withdrawing the baseline, and offset by non-linear least-squares procedures [20,49,50].

3. Results and Discussion

3.1. Optimization of Experimental Parameters

Validation and optimization of the Taylor setup for operating at high pressure was conducted by carrying out measurements of diffusion coefficients for toluene and benzene in supercritical CO2; both systems are very well studied in literature [36,46,47,48,51,52,53,54,55,56]. Optimization tests were all performed at 306.15 K and 10.5 MPa. We validated both FT-IR parameters and Taylor dispersion parameters.
The accuracy of diffusion coefficient measurements is directly dependent on the accuracy of absorbance measurements obtained by FT-IR. The contribution on the uncertainty of the measurements, arising from the use of the FT-IR detector, can have an origin on detector linearity or detector volume, or both, which are reason for these parameters to be optimized.

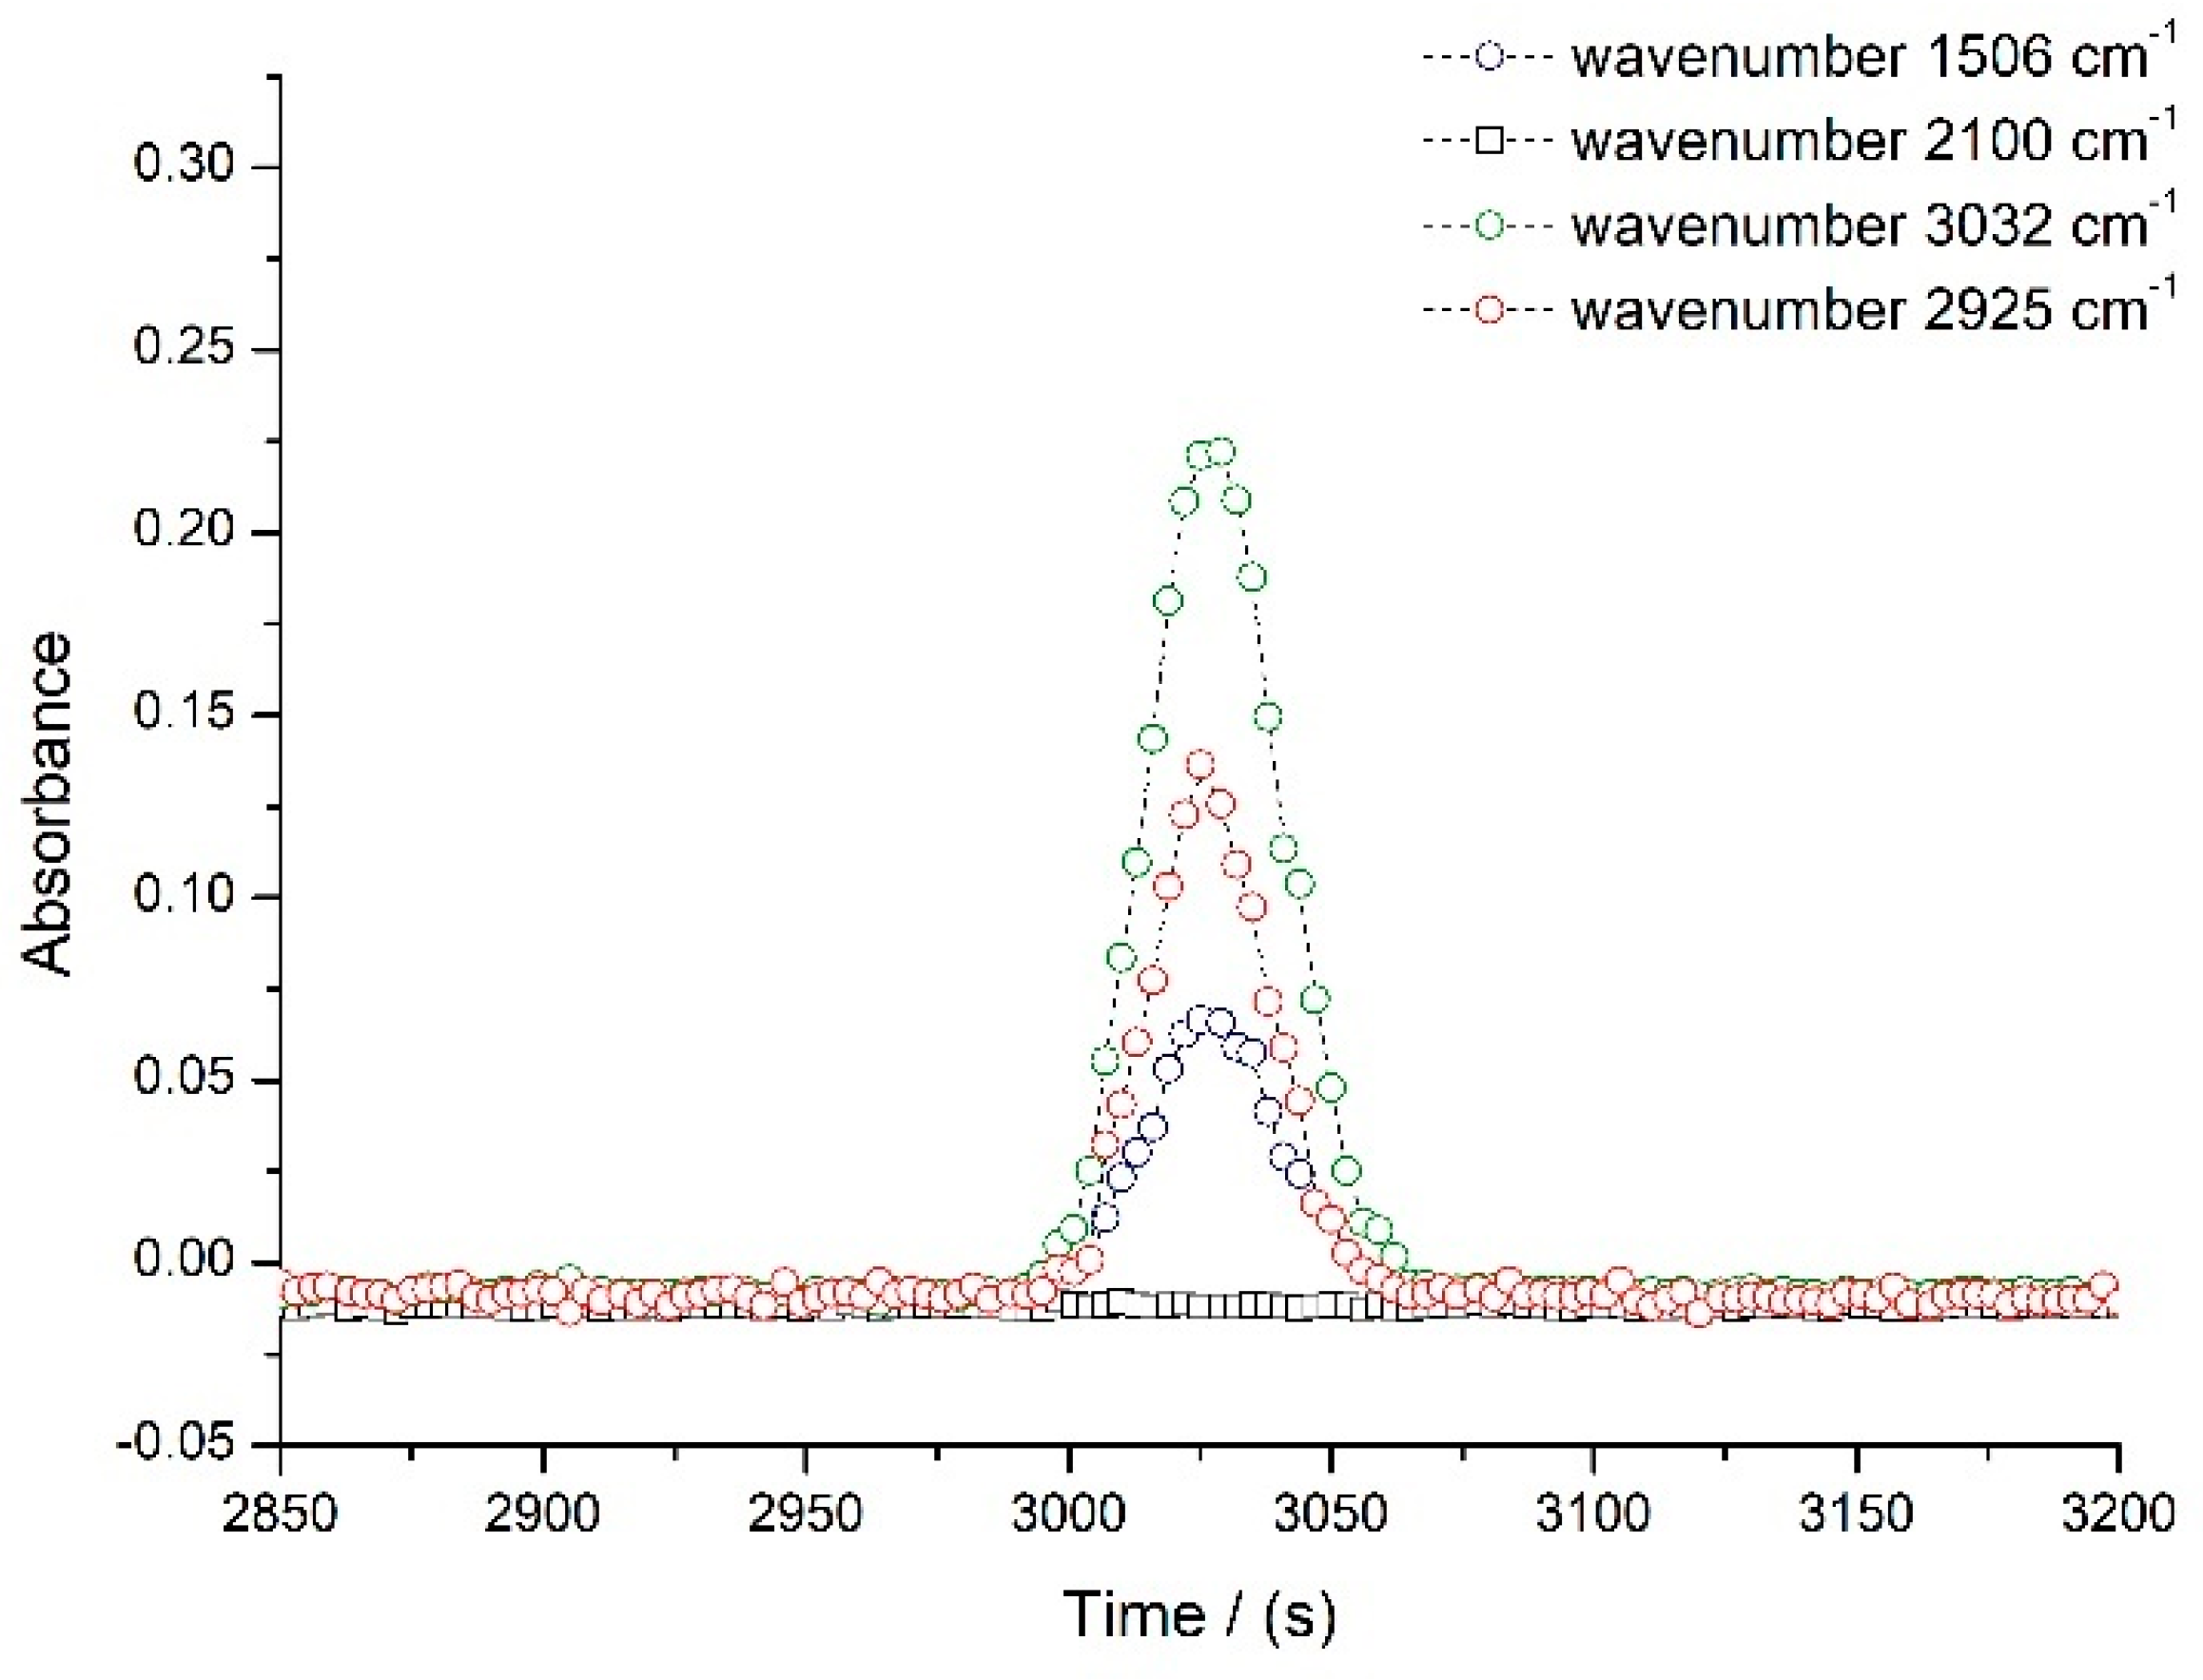
3.1.1. Selection of Working Wavenumbers

Transmittance spectra of pure toluene [57] and pure benzene [40] were obtained prior to the experiment. Toluene shows the maximum absorbance at wavenumbers 1506 cm−1, 2925 cm−1, and 3036 cm−1, which correspond, respectively, to C = C stretching, C-CH3, and aromatic C-H (sp2) stretching vibrational modes, respectively. In the case of benzene, the detected wavenumbers with maximum absorbance were 1035 cm−1, 1478 cm−1, and 3036 cm−1, that correspond to =C-H bending in ring plane, C = C stretching, and aromatic C-H stretching vibrational modes, respectively.
All of these vibration modes appear in the supercritical CO2 IR transparent regions; therefore, the detected signal corresponds to the dispersion of the pulse of injected hydrocarbon molecule in supercritical CO2. Additionally, and with the purpose of controlling the stability of the baseline during the experiments, we have selected, from the IR transmittance spectra for scCO2, a wavenumber at which absorbance of the hydrocarbon solutes is minimum, at 2100 cm−1.
The typical response curve for the dispersion of a solute in supercritical carbon dioxide is a Gaussian shape representation. In Figure 2, it is possible to identify three peaks for the diffusion of toluene in supercritical CO2, each obtained by following the absorbance of the flow at the wavenumbers defined below. At 2100 cm−1, the absorption is minimum and remains stable during the measurement, and this information is equivalent to the reading of a baseline signal. An analogous response was obtained for benzene; in both cases, the solutes present Gaussian curves with good symmetry and have no associated peak tailing effect [40].
When processing the experimental data to calculate the diffusion coefficient, it was verified that the calculated diffusion coefficients do not depend on the wavenumber. For the experiment presented in Figure 2, the estimated diffusion coefficient values obtained for 1506, 2925, and 3032 cm−1 were 1.439, 1.443, and 1.437, respectively. That represents a solely 1% variation.
In each experiment, the injection of solute was repeated 4 to 6 times. Experimental random error was estimated as a standard deviation, SD, over repeated runs. Then, the average value of the diffusion coefficient over wavenumbers for each run was assessed, followed by the calculation of the averaged diffusion coefficients and of the respective standard deviations over all runs at given pressure and temperature. We believe that within the experimental error, the small variation of the diffusion coefficients obtained at various wavenumbers is a demonstration of the detector linearity within the selected wavelength range.

3.1.2. Selection of Detector Volume

FT-IR detector flow cell is demountable and can be adjusted to attain the optimal optical path and volume of the sample by introducing, between the ZnSe windows, a PTFE spacer with defined thickness. Thickness can range from 6 to 950 μm. We have tested the different thicknesses to attain optimal results by measuring the diffusion coefficients of toluene in supercritical carbon dioxide at 306.15 K and 10.5 MPa.
We have observed that the smaller spacers lead to sharper Gaussian curves (smaller amplitude), even though symmetrical, while larger spacers produce broader peaks but with some type of asymmetry. The fitting of results has revealed that a midterm thickness leads, in general, to a smaller scattering of the results. Within the experimental error, the Beer–Lamber law is respected. Spacer of thickness 150 μm is, then, the one that presents better results. As seen by the results presented in Table 1, a simple variation on the volume of the sample can contribute by as much as 5% to the uncertainty of the results.
Taylor dispersion parameters were verified and optimized in terms of optimal design for capillary coiling, optimal flow rate, and negligible effects of secondary flow.

3.1.3. Optimal Capillary Coiling

Theoretically, Taylor dispersion experiments are normally performed with the use of small diameter capillaries. Here, we used a stainless steel tube of a length, L, of (30.916 ± 0.001) m and with a circular cross-section of radius r = 0.375 mm. Equation (5) has been used to estimate the optimal coil radius for our system, departing from the assumption that the experimental working conditions would use flow velocities below 0.5 mL min−1, diffusion coefficients for solutes in supercritical carbon dioxides are in the order of 10−8 m2 s−1, and viscosity in the order of 10−5 cP. We have assessed that we would be needing a minimum of 0.34 m helix diameter in order to ensure that the error associated with tube coiling [27] was negligibly small.
In a second step, once the equipment was assembled and tested, with real working conditions and experimental diffusion coefficients, we have estimated the secondary flow effects related to the coiled column, with a diameter of 0.36 m, and obtained from Equation (5) the result De2Sc < 14, thus proving they were negligible.

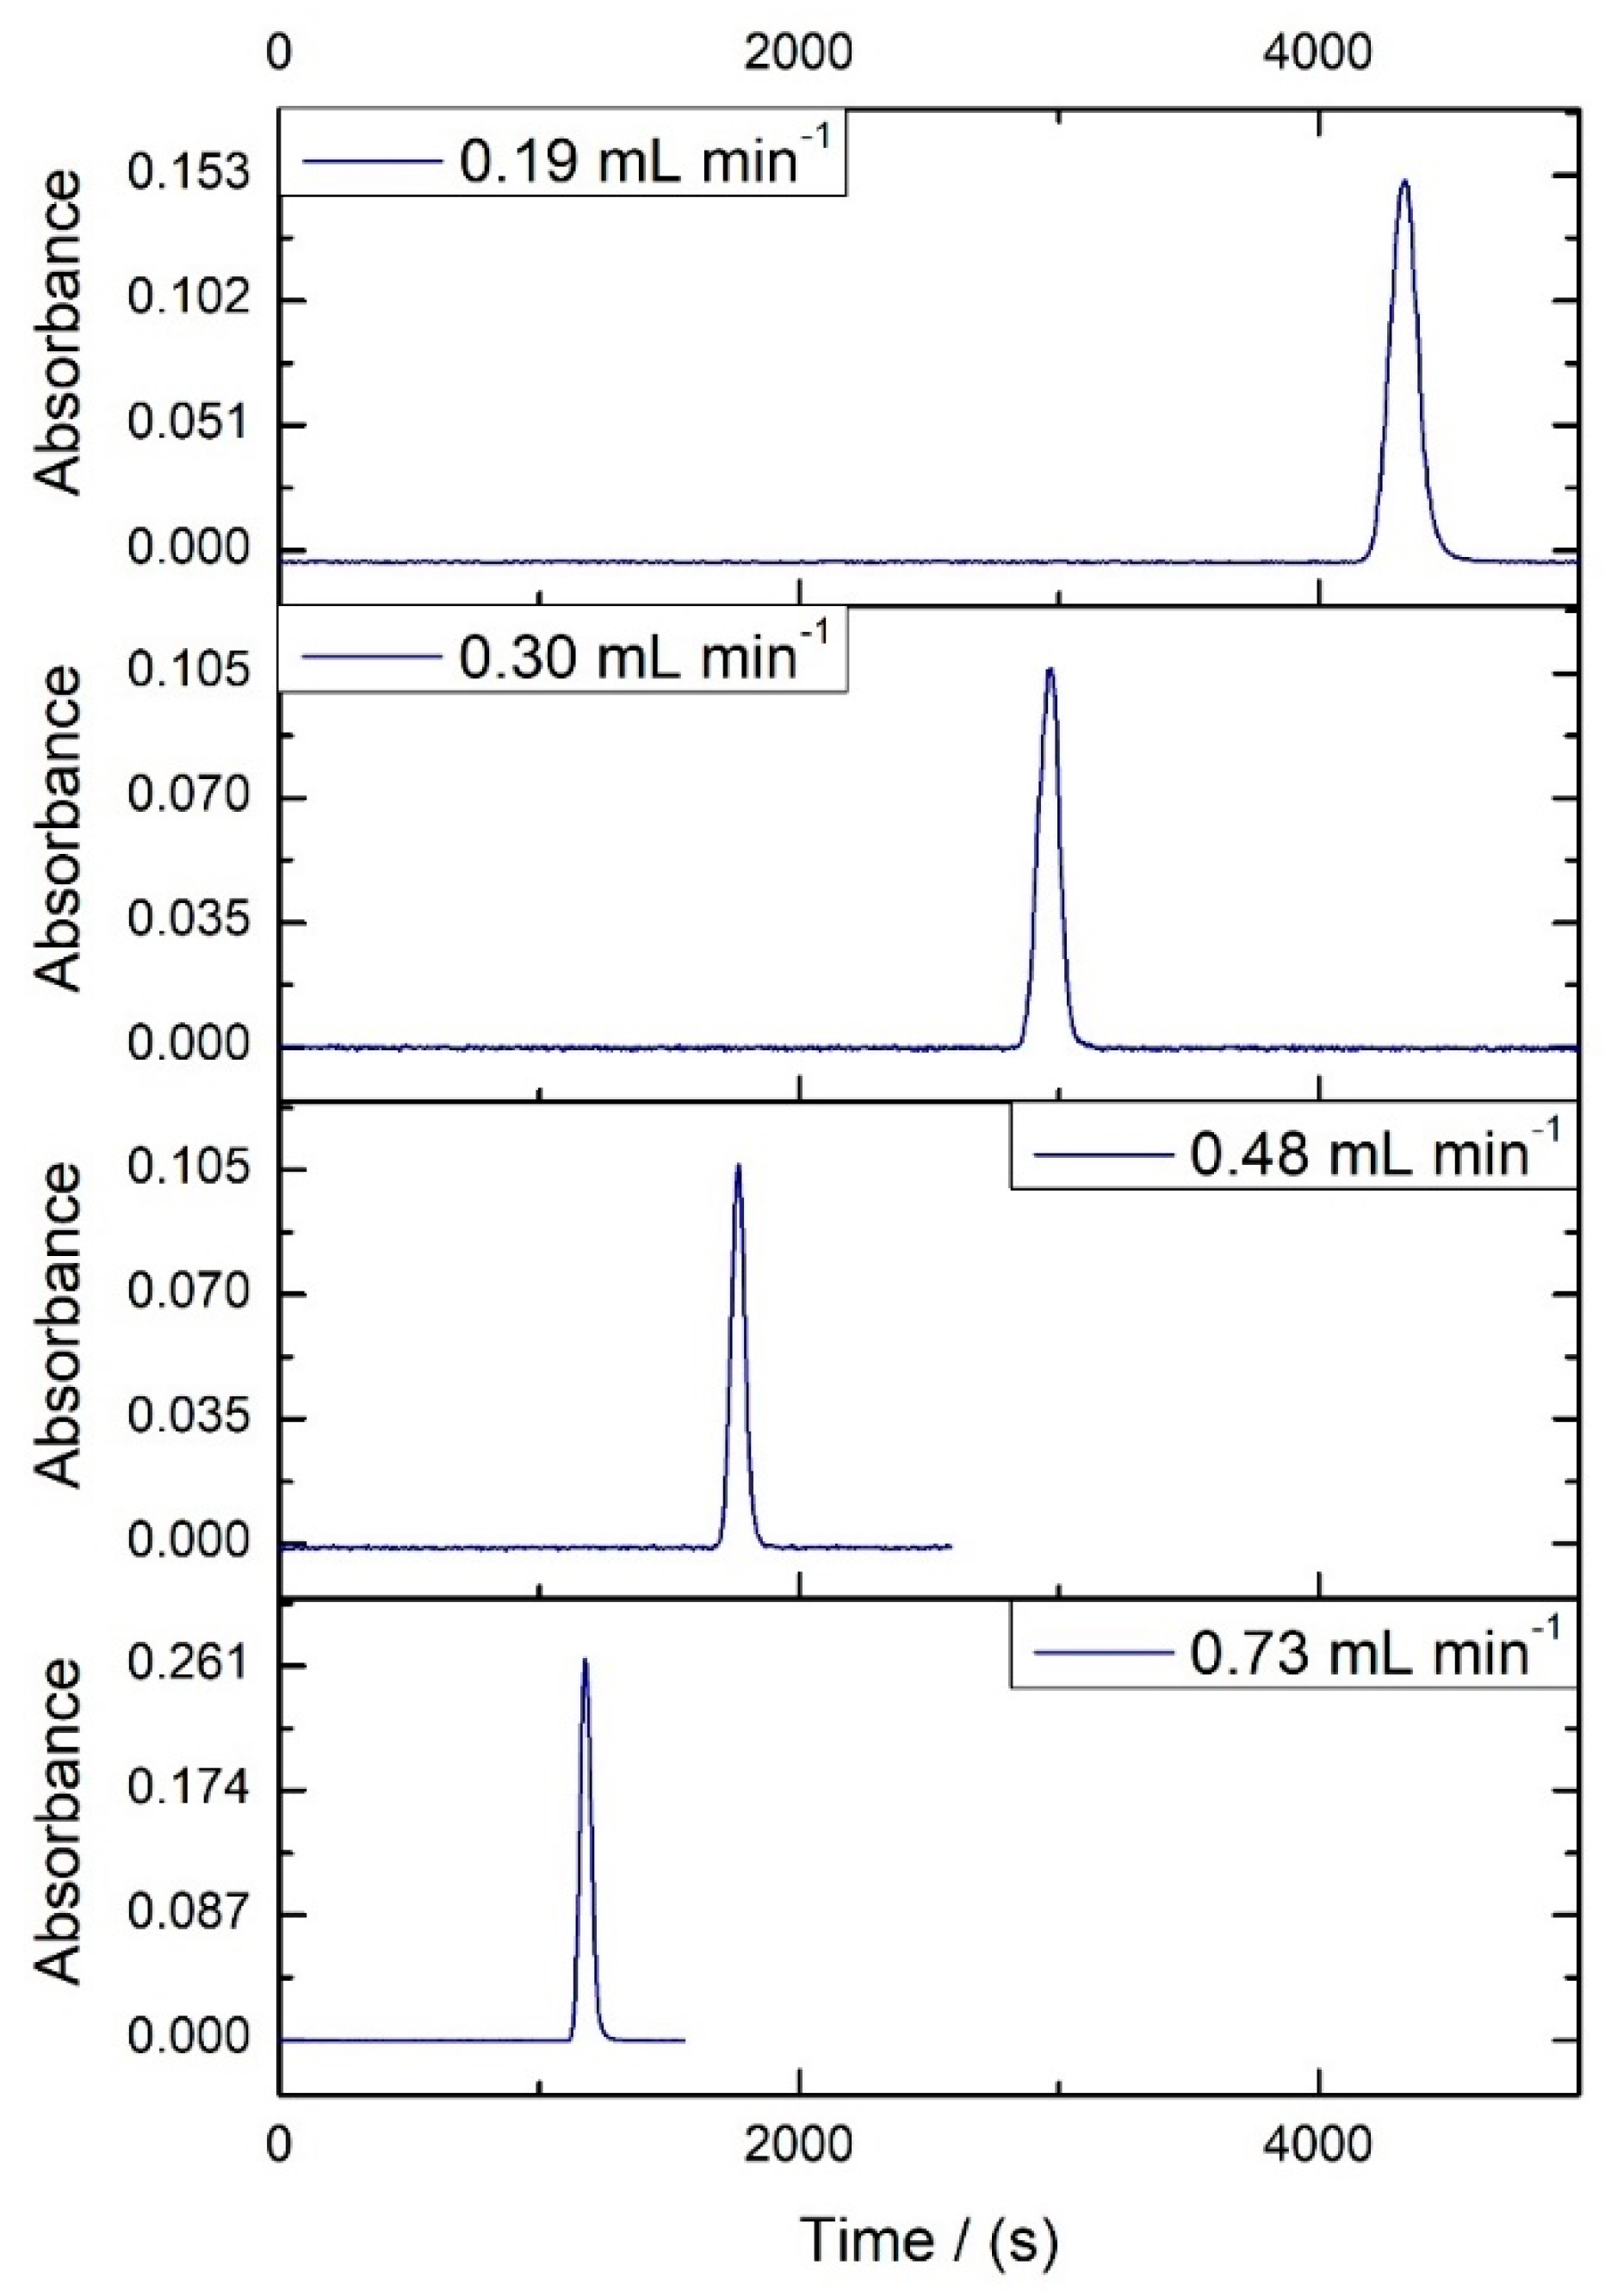
3.1.4. Effects of the Flow Rate on the Diffusion Coefficient

It is established that the experimentally determined diffusion coefficients for the measurements of a solute in supercritical fluids are only reliable if they are independent of the flow velocity [27,51]. Moreover, as stated before, the secondary flow produced by the centrifugal force can significantly influence the final diffusion results (Equation (5)). Having known that, we verified the flow velocity influence on the diffusion coefficients for pure toluene. The tests were conducted at p = 10.5 MPa and T = 306.15 K, and flow velocity was varied from 0.2 to 0.7 mL min−1.
Figure 3 shows a graphical representation of the effect of the flow velocity on the diffusion coefficient values of toluene in supercritical carbon dioxide. Our results show an increase of the diffusion coefficient with the increase of the flow velocity in the lower range of velocities, then a flat region where the diffusion coefficients show to be independent of the flow velocity for the intermediate velocities and, a new increase of the diffusion coefficient at higher velocities. Our studies with benzene [40] have presented the same plateau region in the same range of flow velocities (from approximately 0.3 to 0.5 mL·min−1), and this is also in agreement with other studies in literature (benzene and naphthalene) [51,58]. The observed much lower diffusion coefficient for the small flow rate (0.2 mL·min−1) can be due to local oscillations on the mobile phase (supercritical carbon dioxide), caused by the occurrence of pressure pulses at the back-pressure regulator. In consequence, the peaks are more asymmetrical and broadened (as can be seen in Figure 4), and there is a higher scattering of the results. In the high flow velocity range, the calculated diffusion coefficient is higher because it is being enhanced by the secondary flow effect. The peak profile is generally sharper, and asymmetry is also noticed, e.g., the peak at 0.73 mL min−1 presents a tail on the right side.
From both the study of the effect of flow velocity in the diffusion coefficient (Figure 3) and the shape of the observed peaks (Figure 4), it is relatively easy to infer that the choice of the working flow rate should both be in a region where the diffusion coefficient shows no dependence on this variable but also where the detector signal shows the most symmetrical peaks and, thus, a smaller scattering of the results. Flow rates of 0.3–0.32 mL min−1 have been verified to be the optimal experimental conditions and given rise to the best results.
Compliance of our concentration profiles, resulting from the dispersion of the initial pulse of solute to a Gaussian shape, was verified by following the inequality in Equation (2) that states that D/ u 0 ¯ L < 0.01. We have obtained a value of 0.0024 for our experimental conditions. Additionally, we have proven the laminar regime of the solvent flow in our experiments that are characterized by a Reynolds number, Re, ranging from 55 to 144 for supercritical CO2.

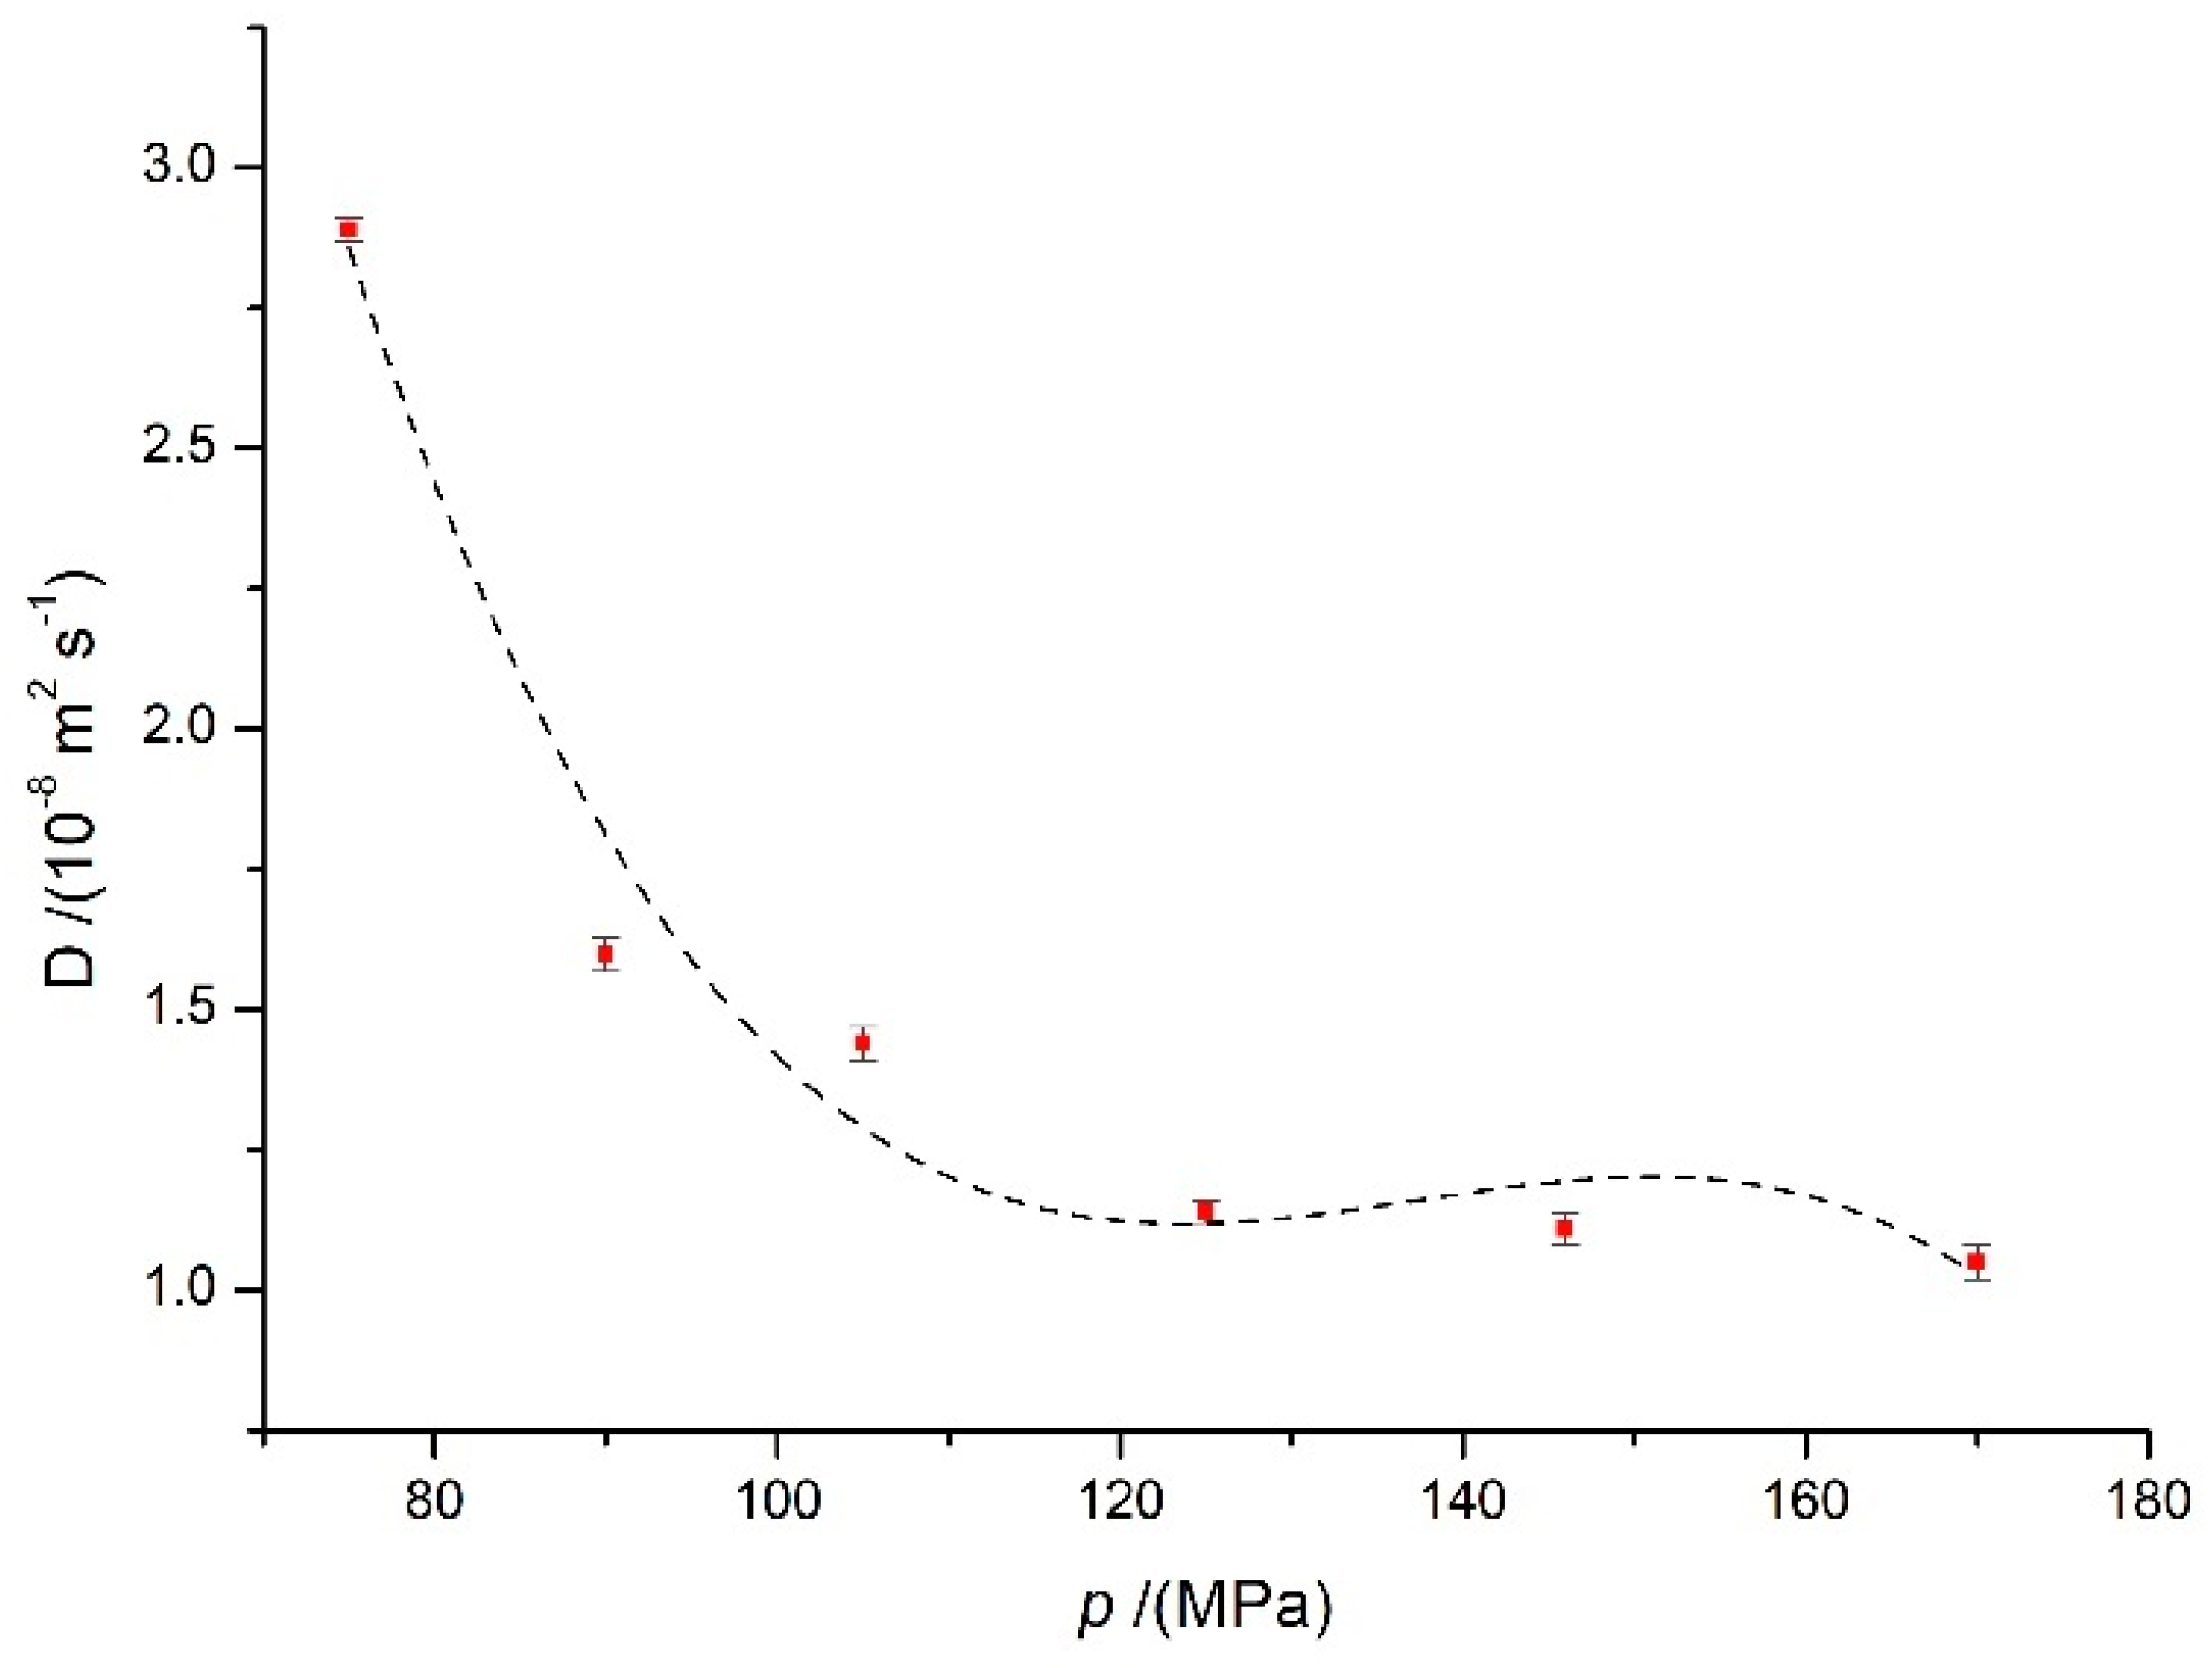
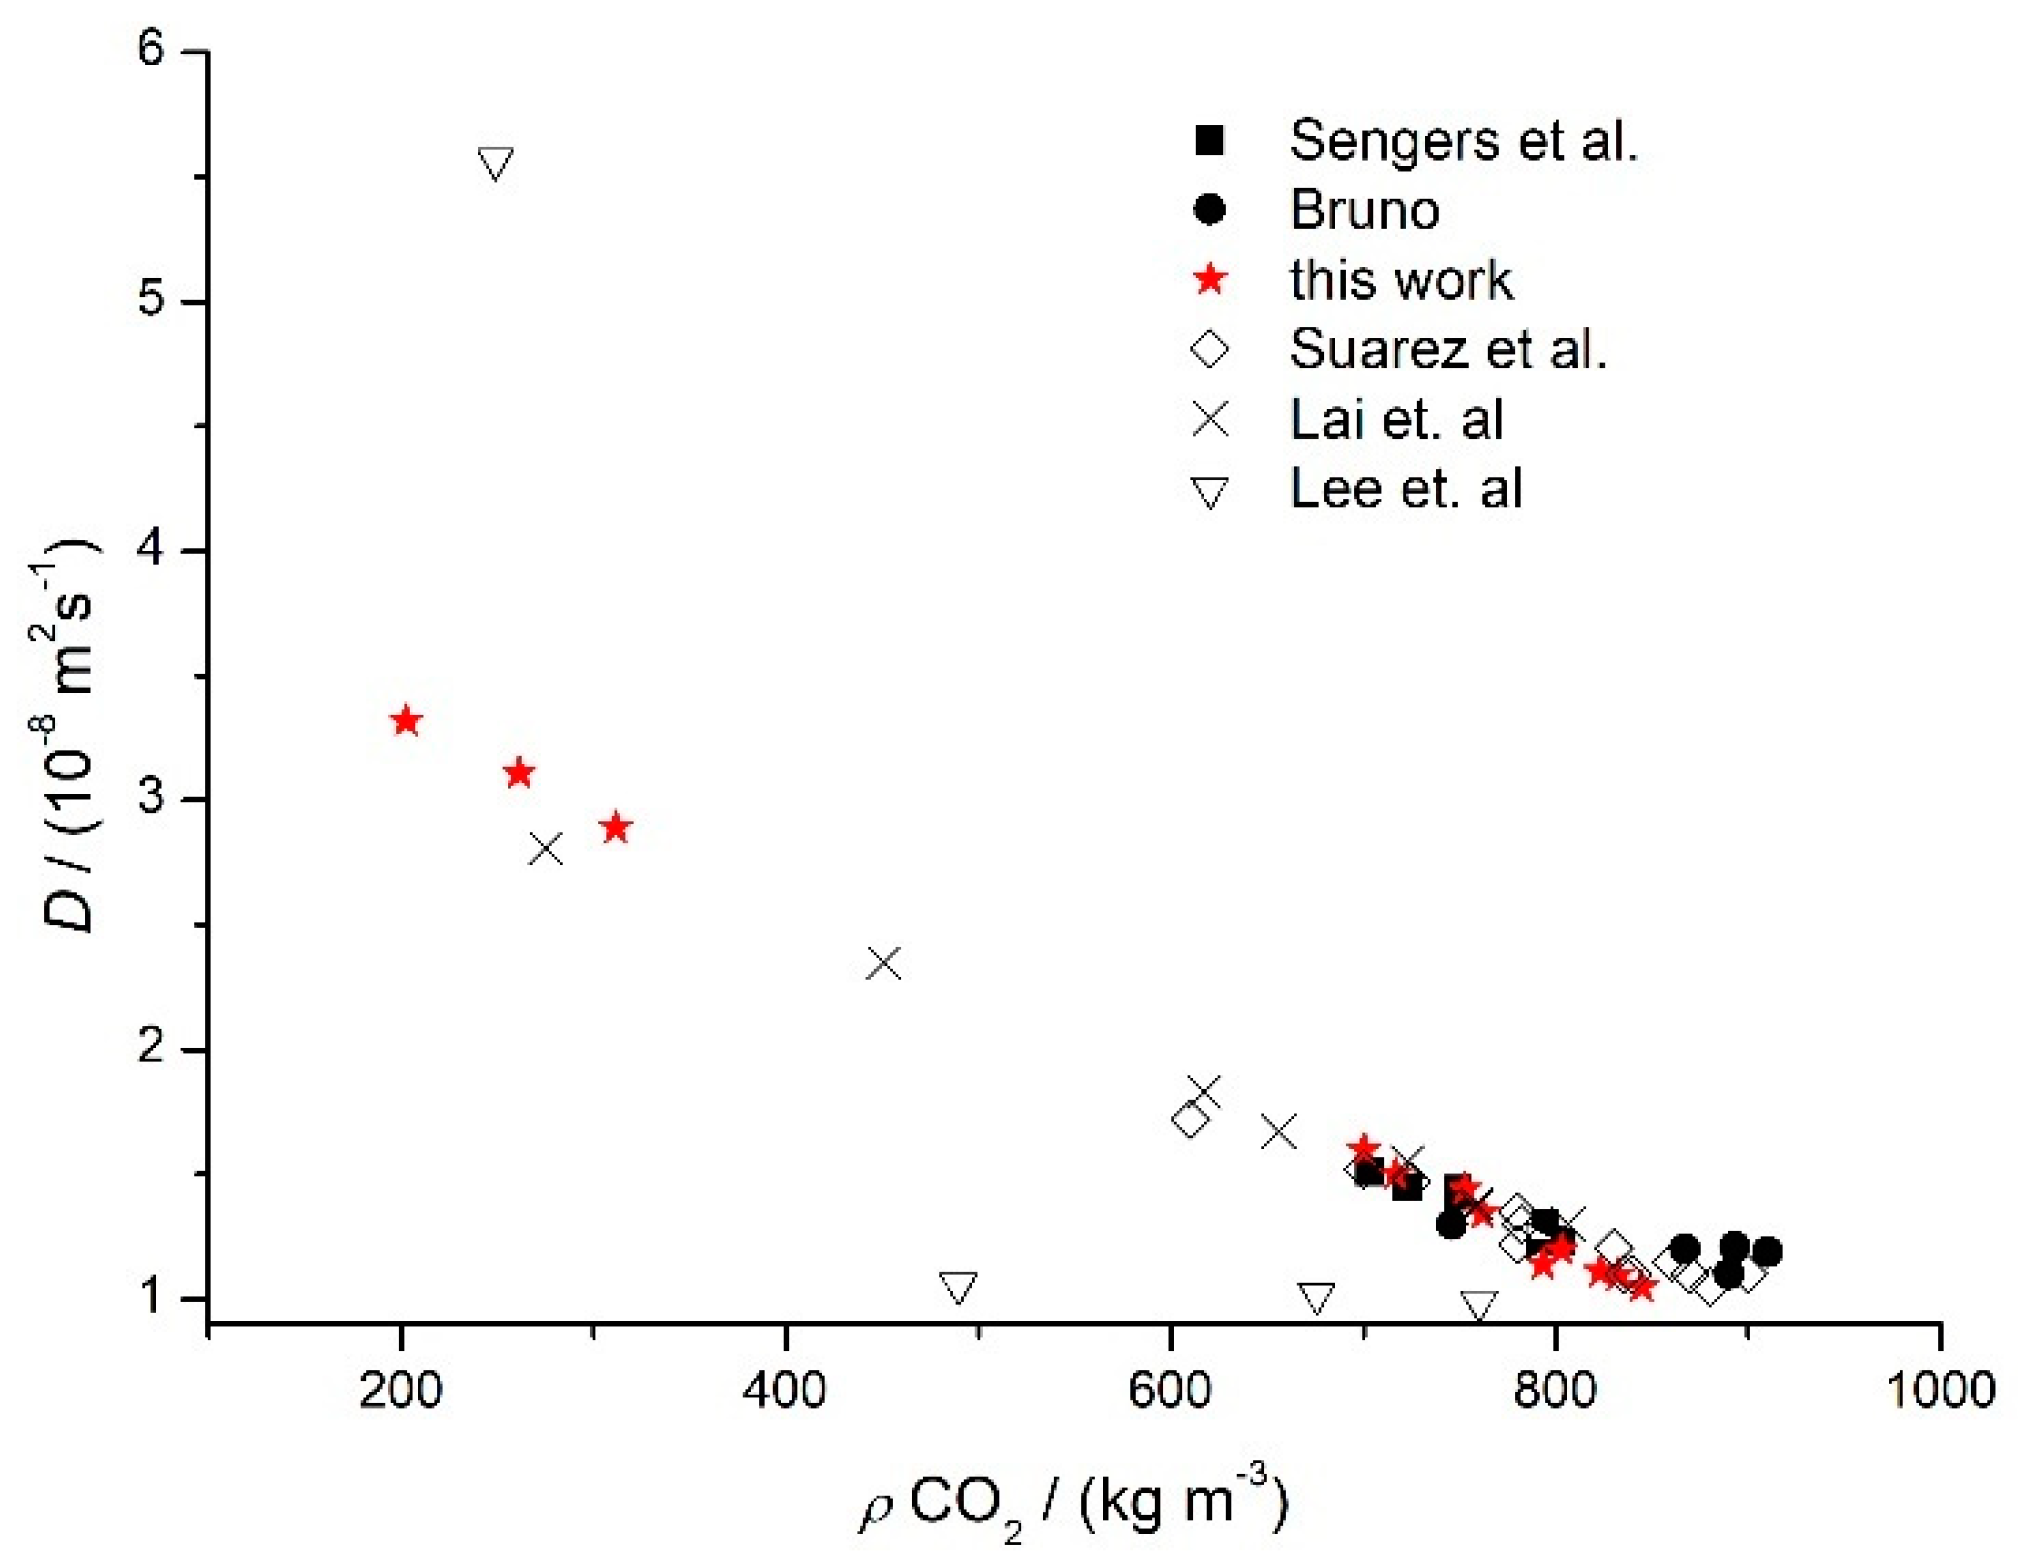
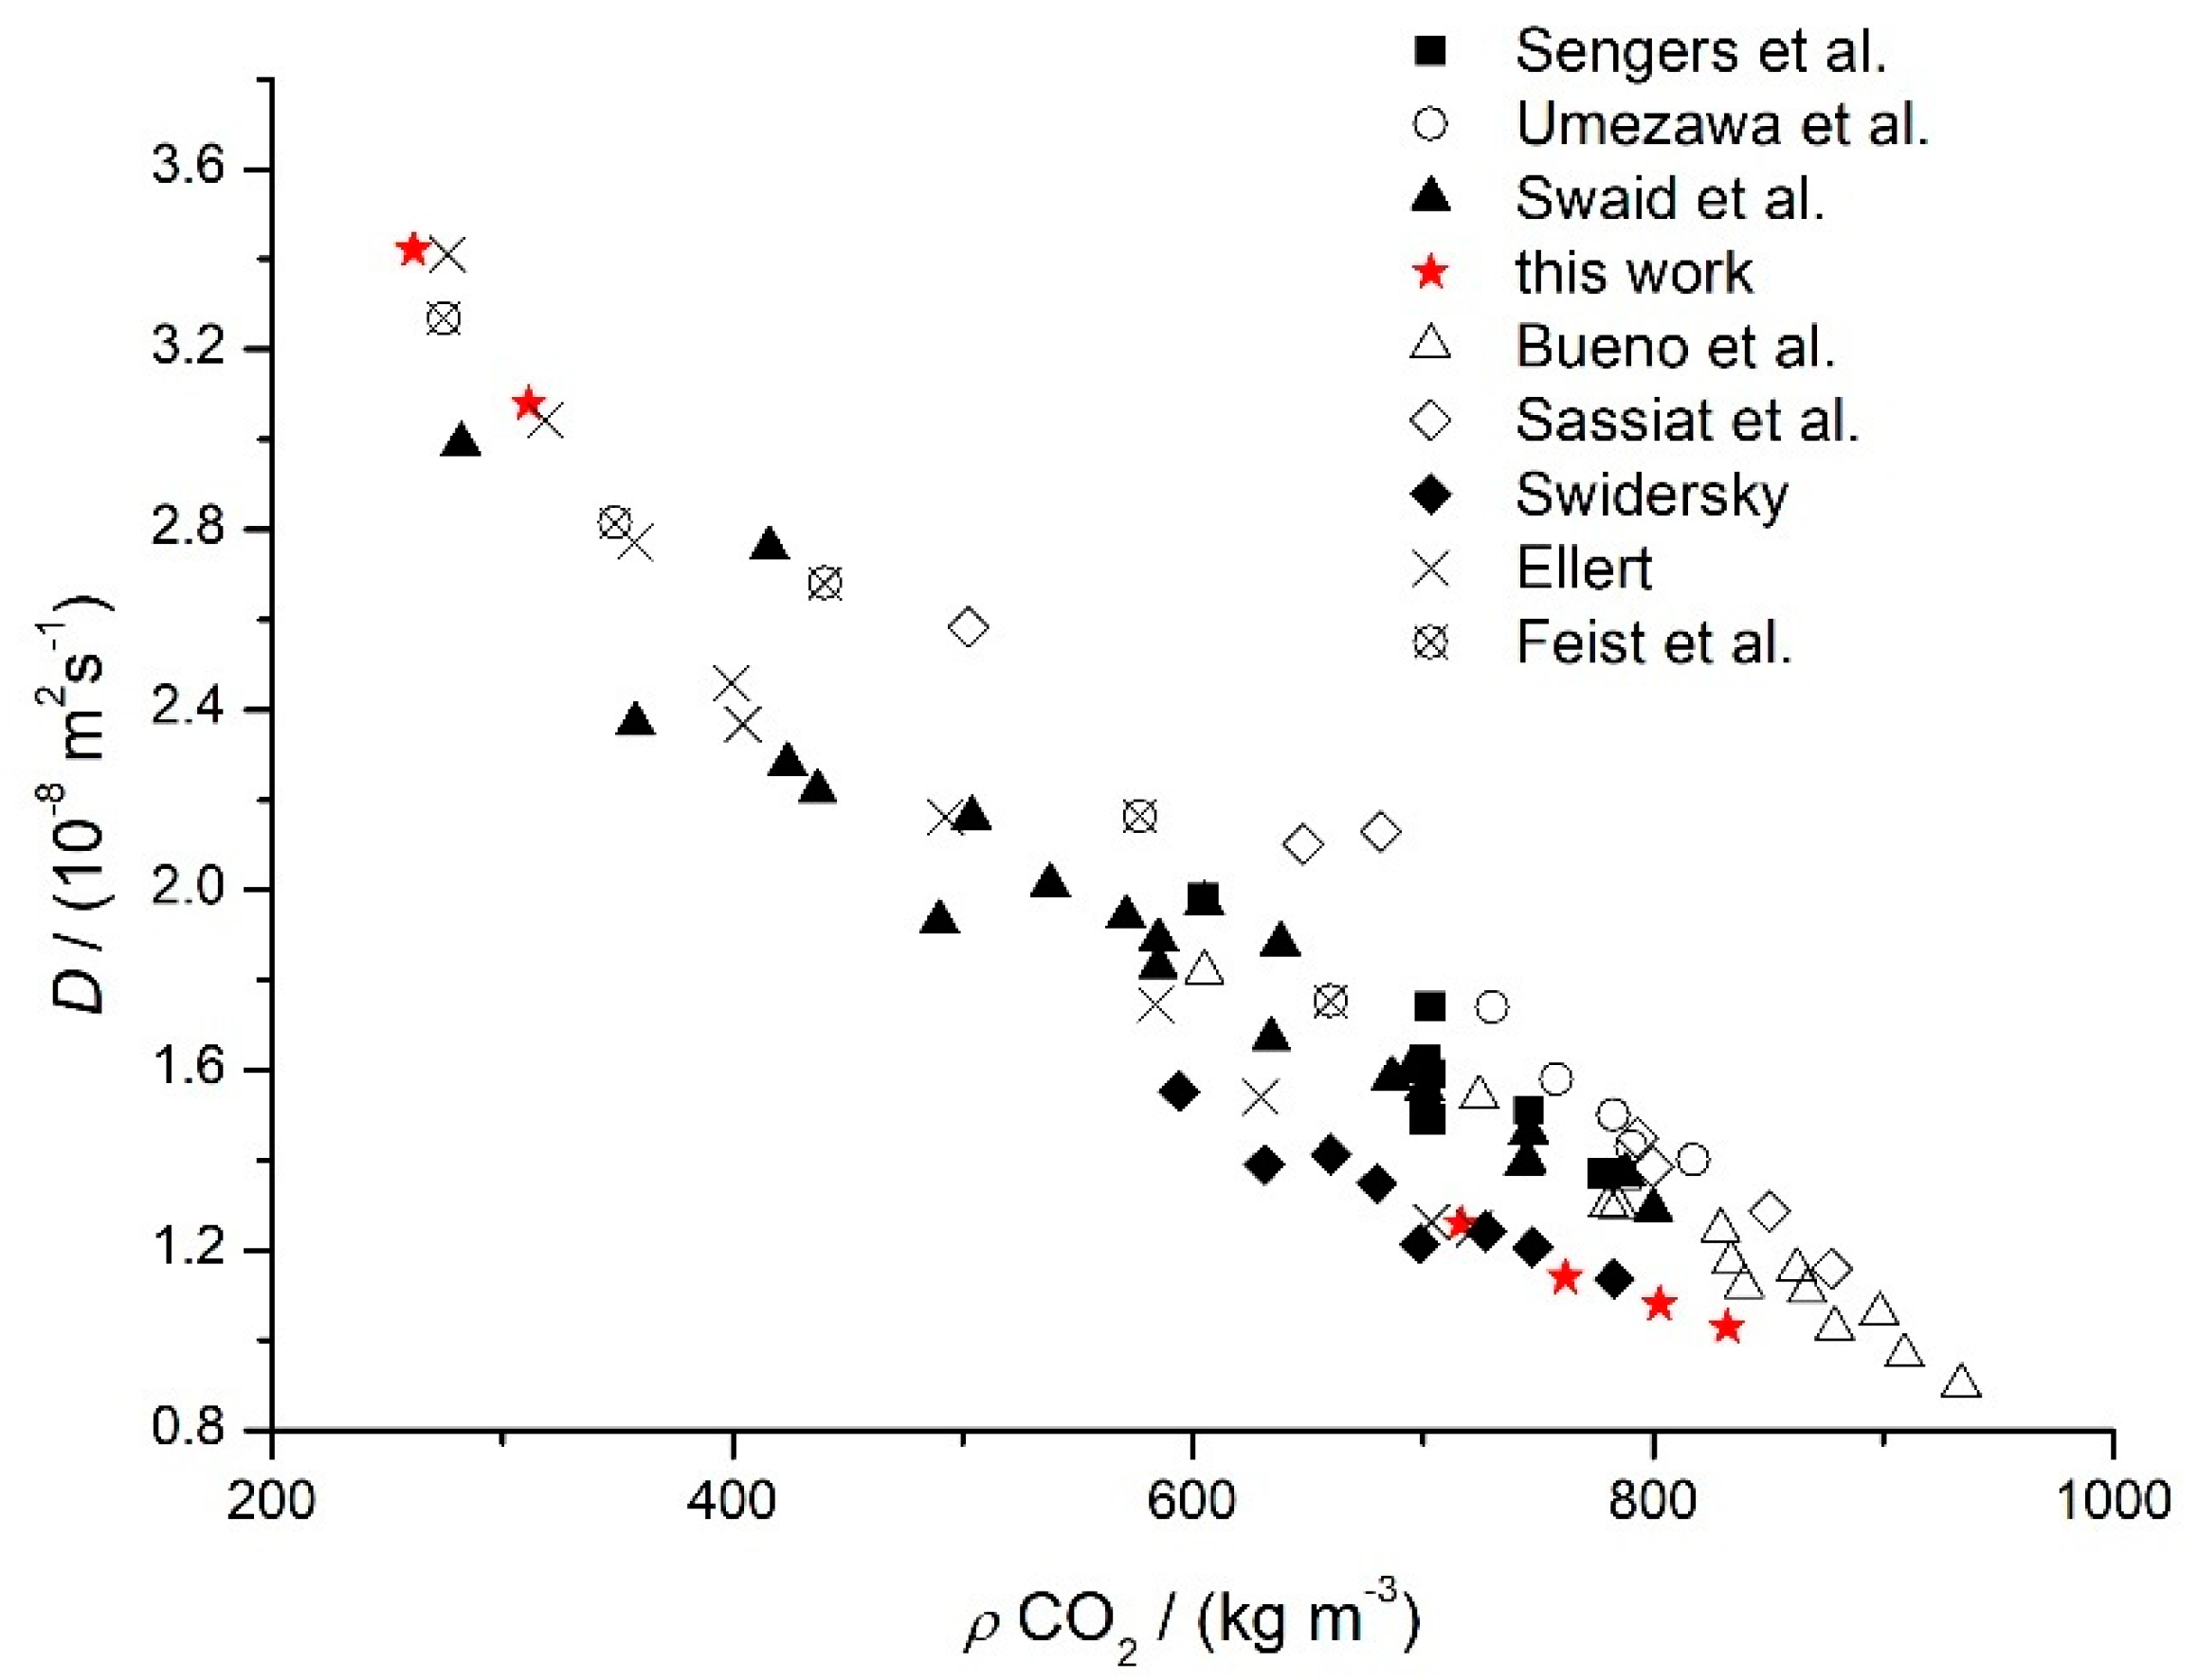
3.2. Experimental Diffusion Coefficients for Toluene and Benzene in Supercritical CO2

Diffusion coefficients for toluene and benzene in supercritical carbon dioxide were measured in the temperature range of 306.15 K to 320.15 K and in the pressure range of 7.5 to 17 MPa. The obtained diffusion coefficients are presented in Table 2 and were determined from four to six replicate dispersion profiles. Mobile phase parameters, that is, the calculated density and viscosity [59] for supercritical carbon dioxide in the range of temperatures and pressures studied are also presented. Standard deviation is estimated as stated before.
As anticipated, diffusion coefficients for toluene and benzene decrease with the increase of pressure at constant temperature and increase with the increase of temperature at constant pressure, as expected, due to the increase of kinetic energy. Figure 5 shows the variation with pressure of the diffusion coefficients for toluene in supercritical carbon dioxide at 306.15 K. Experimental diffusion coefficients decrease non-monotonically with the increase of pressure at a constant temperature, with a sharp decrease in the near critical zone. Our experimental data best fit to a third-order polynomial (with r2 = 0.97). Although the diffusion coefficients for benzene presented here cover a smaller range of temperature and pressure, it is observed the same non-monotonic decrease of the diffusion coefficient with pressure, at both 309.15 and 319.15 K, and the best fit of experimental data, is given by a second-order polynomial (with r2 = 0.99).
It has become a standard to assess the dependence of the diffusion coefficients D on carbon dioxide density rather than directly over the operating temperature and pressure, because these directly influence the solvent density and viscosity. Since both toluene and benzene diffusion on supercritical carbon dioxide has been the focus of investigation of several teams, we have included all the available literature data for toluene [36,46,47,48,51] and benzene [35,51,52,54,55,60,61,62] in our analysis. Although there are many studies, data remains scattered and scarce in the near critical region, most likely because of the carbon dioxide high-density fluctuations. In that sense, with this work, we aim to contribute with a little more consensual, if not, more accurate data. Figure 6 and Figure 7 show the behavior of the diffusion coefficients for toluene and benzene in supercritical CO2 at pressure range p from 7.5 to 17 MPa and at different temperatures from 306.15 to 320.15 K. Values of density for supercritical carbon dioxide were obtained from NIST [59].
We can see that diffusion coefficients for both toluene and benzene decrease with increasing density of scCO2, because the increase in density brings molecules in closer proximity, and the mean free path available for the molecules to move becomes smaller. The observed diffusion coefficient for benzene is approximately 5 to 10% smaller than for toluene, due to the smaller molecular weight of the latter. Interestingly, notwithstanding the similarity of the molecular structures, diffusion coefficient for toluene seems to have a monotonous (linear) dependence on carbon dioxide density, while for benzene, the trend is more precisely represented by a second-order polynomial.
We have found an excellent agreement between our results and the available literature data for toluene [36,46,47,50,51], with less than 6% difference for the measurements in similar conditions of Sengers et al. [51] and Lai et al. [36] and, in the case of benzene, less than 5% difference for the measurements in similar conditions of Ellert [61] and Swidersky [62], thus within the experimental error (uncertainty of our results is in the order of 5–6%). We have also contributed to provide diffusion coefficients for toluene and benzene in supercritical CO2 in the near critical region, which is scarce in information due to the high difficulty of the measurements in the vicinity of the critical point.

3.3. Theoretical Diffusion Coefficients for Toluene and Benzene in Supercritical CO2

Diffusion coefficients in liquids can be estimated from theoretical and empirical models. Thermodynamic models, based on the Stokes–Einstein equation, have shown to be a simple and useful tool to obtain valuable information about the diffusion process, namely, to achieve a reasonable estimation of the diffusion coefficients. Wilke–Chang (WC) [15], Scheibel (Sch) [16], and Lusis–Ratcliff (LR) [17] are some of the most usual models; they have been built for estimation of the transport occurring in liquid systems. Recently, they have been revised and improved by Vaz et al. [18]. For the specific case of transport in supercritical fluids, the Lai–Tan (LT) [36] model is available. Equations (8)–(11) for the WC, Sch, LR, and LT models are presented below.
D W C = 7.4 × 10 8 T ϕ M 1 η 1 V b p , 2 0.6
D S c h = 8.2 × 10 8 T η 1 V b p , 2 1 / 3 [ 1 + ( 3 V b p , 1 V b p , 2 ) 2 3 ]
D L R = 8.52 × 10 8   T η 1 V b p , 1 1 / 3 [ 1.4 ( V b p , 1 V b p , 2 ) 1 3 + ( V b p , 1 V b p , 2 ) ]
D L T = 2.5 × 10 7 T M 1 ( 10 η 1 ) 0.688 V c , 2 1 / 3
In the Equations (8)–(11), temperature T is in K, η1 is the solvent viscosity in cP, φ is a dimensionless association factor of the solvent, M1 is the solvent molecular weight in g/mol, Vbp,1 and Vbp,2 are the solvent and solute molar volumes at their normal boiling points in cm3/mol, respectively, and Vc,2 is the solute critical volume in cm3/mol. In these equations, the diffusion coefficient is correlated with temperature and solvent viscosity, having as base the Stokes–Einstein equation. They follow the same assumption of a large rigid spherical molecule of solute moving through a continuum of solvent under infinitely dilute conditions and thus, the diffusion coefficient is controlled by the viscosity and the hydrodynamic radius of the solute. In general, these correlations have specific constants obtained from the fitting of data obtained for a relatively large number of solutes. They introduce the solute molar volume at the normal boiling point, because the effect of solvent viscosity on the rate of diffusion also depends on the size of diffusing molecules. In the case of Wilke–Chang and Lai–Tan models, the correlations also include the molecular weight of the solute, accounting for an additional dependence on the latter, arising from the fact that the diffusivities in supercritical fluids present values between those of liquids and gases. Still, while Wilke–Chang model (and Sch and LR) were originally developed for diffusion in liquids, the Lai–Tan model was built having as base the diffusion coefficients obtained in supercritical carbon dioxide. While the former tends to significantly overestimate D12, most likely due to their inability to describe the role of viscosity in the diffusion process, it is expected that the Lai–Tan model can provide more accurate predictions on the diffusion coefficient.
The average absolute deviation (AAD) allows to evaluate the performance of these models in the calculation of the diffusion coefficients, when compared to the experimental ones, being that:
A A D   ( % ) = 100 n i = 1 n | D e x p D p r e d D e x p |
where the subscripts “exp” and “pred” refer to the experimental and calculated diffusion coefficients, and n is the number of experimental points. Table 3 shows results for the various correlations tested for the prediction of diffusion coefficients of toluene and benzene in supercritical CO2.
Even though the equations from WC, Sch, and LS empirical models are not specific for the estimation of diffusion coefficients in supercritical CO2, they can reasonably predict the diffusion coefficients in this media, with values of AAD% ranging from 2 to 12%, being the Wilke–Chang model the one that presents the best performance in the prediction of the diffusion coefficients. This is not surprising since for diffusion in liquids, where the solute molecules are significantly larger than the solvent molecules, the hydrodynamic theory has been proven effective. The improved models developed by Vaz et al. [18] can effectively enhance the accuracy of prediction, and ADD values decrease when these are used.
Application of the Lai–Tan model was expected to deliver a higher accordance to our experimental results, considering that this is a model developed from measurements of diffusion in supercritical carbon dioxide. The authors provide a possible explanation to this, since, in the supercritical region, there can be clustering of the solutes and the degree of clustering depends on the density. Nevertheless, deviations presented in the estimations using this model are in the same range of general hydrodynamic models but still in very good agreement with our data. In summary, they can be assumed as reliable models for the prediction of the diffusion coefficients of solutes in supercritical CO2, particularly for new systems at any condition.

4. Conclusions

We have designed and tested a new experimental setup for the measurement of supercritical diffusion, based on Taylor dispersion method and integrating an FTIR detector. The applicability of FT-IR as a tool for the measurement of mass transport coefficients was demonstrated. The equipment and experimental parameters were carefully tested and optimized.
Molecular diffusion coefficients for toluene and benzene in supercritical CO2 were measured using the new assembly of the high-pressure Taylor dispersion technique, in the temperature range of 306.15 to 320.15 K and pressure range of 7.5 to 17 MPa. D decreased with the increase of pressure (non-linearly) and with the increase of carbon dioxide density, and results were consistent with similar studies in the literature, within the 5-6% uncertainty for this method at high pressure. Various correlation models were assessed to estimate the diffusion coefficients, with the best results obtained for the Wilke–Chang optimized model.

Author Contributions

Conceptualization and methodology, C.I.A.V.S.; investigation, C.I.A.V.S., M.C.F.B. and M.P.R.T.F.; formal analysis, C.I.A.V.S., A.C.F.R. and V.S.; writing—review and editing, C.I.A.V.S., A.C.F.R. and V.S.; funding acquisition, C.I.A.V.S. and A.C.F.R. All authors have read and agreed to the published version of the manuscript.

Funding

This research was funded by FEDER—European Regional Development Fund through the COMPETE Programme and FCT—Fundação para a Ciência e a Tecnologia, for the KIDIMIX project POCI-01-0145-FEDER-030271, and by “The Coimbra Chemistry Centre” which is supported by the Fundação para a Ciência e a Tecnologia (FCT), Portuguese Agency for Scientific Research, through the programmes UIDB/00313/2020 e UIDP/00313/2020 and COMPETE. V.S. acknowledges support from micro4IloT, grant number KK-2019/00101, from the Basque government.

Institutional Review Board Statement

Not applicable.

Informed Consent Statement

Not applicable.

Data Availability Statement

The data that support the findings of this study are available from the corresponding author upon reasonable request.

Conflicts of Interest

The authors declare no conflict of interest.

References

  1. Climate Change 2021: The Physical Science Basis. Contribution of Working Group I to the Sixth Assessment Report of the Intergovernmental Panel on Climate Change; Masson-Delmotte, V.; Zhai, P.; Pirani, A.; Connors, S.L.; Péan, C.; Berger, S.; Caud, N.; Chen, Y.; Goldfarb, L.; Gomis, M.I.; et al. (Eds.) Cambridge University Press: Cambridge, UK; New York, NY, USA, 2021; pp. 3–32. [Google Scholar] [CrossRef]
  2. Gladysz, P.; Sowizdzal, A.; Miecznik, M.; Hacaga, M.; Pajak, L. Techno-Economic Assessment of a Combined Heat and Power Plant Integrated with Carbon Dioxide Removal Technology: A Case Study for Central Poland. Energies 2020, 13, 2841. [Google Scholar] [CrossRef]
  3. Holz, F.; Scherwath, T.; Crespo del Granado, P.; Skar, C.; Olmos, L.; Ploussard, Q.; Ramos, A.; Herbst, A. A 2050 Perspective on the Role for Carbon Capture and Storage in the European Power System and Industry Sector. Energy Econ. 2021, 104, 105631. [Google Scholar] [CrossRef]
  4. Vilarrasa, V.; Makhnenko, R.Y.; Rutqvist, J. Field and Laboratory Studies of Geomechanical Response to the Injection of CO2. In Science of Carbon Storage in Deep Saline Formations: Process Coupling across Time and Spatial Scales; Newell, P., Ilgen, G.A., Eds.; Elsevier: Amsterdam, The Netherlands, 2019; pp. 209–236. [Google Scholar] [CrossRef]
  5. Oraee-Mirzamani, B.; Cockerill, T.; Makuch, Z. Risk Assessment and Management Associated with CCS. Energy Procedia 2013, 37, 4757–4764. [Google Scholar] [CrossRef] [Green Version]
  6. Deng, H.; Bielicki, J.M.; Oppenheimer, M.; Fitts, J.P.; Peters, C.A. Leakage Risks of Geologic CO2 Storage and the Impacts on the Global Energy System and Climate Change Mitigation. Clim. Chang. 2017, 144, 151–163. [Google Scholar] [CrossRef] [Green Version]
  7. Li, Q.; Liu, G. Risk Assessment of the Geological Storage of CO2: A Review. In Geologic Carbon Sequestration; Springer: Berlin/Heidelberg, Germany, 2016; pp. 249–284. [Google Scholar]
  8. Faro, M.P.R.T.; Ribeiro, A.C.F.; Santos, C.I.A.V. Geological Carbon Capture: A Literature Review on Diffusion Coefficients for Hydrocarbons in Supercritical CO2. In Research Methodologies in Applied Chemistry with Multidisciplinary Perspectives, Innovations and Visions for the Future; Nova Science Publishers: Hauppauge, NY, USA, 2020; pp. 83–113. [Google Scholar]
  9. Guo, P.; Liu, S.; Yan, J.; Wang, J.; Zhang, Q. Experimental Study on Heat Transfer of Supercritical CO2 Flowing in a Mini Tube under Heating Conditions. Int. J. Heat Mass Transf. 2020, 153, 119623. [Google Scholar] [CrossRef]
  10. Gaponenko, Y.; Gousselnikov, V.; Santos, C.I.A.V.; Shevtsova, V. Near-Critical Behavior of Fick Diffusion Coefficient in Taylor Dispersion Experiments. Microgravity Sci. Technol. 2019, 31, 475–486. [Google Scholar] [CrossRef]
  11. Buscheck, T.A.; Bielicki, J.M.; Edmunds, T.A.; Hao, Y.; Sun, Y.; Randolph, J.B.; Saar, M.O. Multifluid Geo-Energy Systems: Using Geologic CO2 Storage for Geothermal Energy Production and Grid-Scale Energy Storage in Sedimentary Basins. Geosphere 2016, 12, 678–696. [Google Scholar] [CrossRef] [Green Version]
  12. McDonnell, K.; Molnár, L.; Harty, M.; Murphy, F. Feasibility Study of Carbon Dioxide Plume Geothermal Systems in Germany–utilising Carbon Dioxide for Energy. Energies 2020, 13, 2416. [Google Scholar] [CrossRef]
  13. Vilarrasa, V.; Rutqvist, J. Thermal Effects on Geologic Carbon Storage. Earth-Sci. Rev. 2017, 165, 245–256. [Google Scholar] [CrossRef] [Green Version]
  14. Hertz, H.G.; Erdey-Grúz, T. Transport Phenomena in Aqueous Solutions; Adam Hilger Ltd.: London, UK, 1974; p. 512. [Google Scholar] [CrossRef]
  15. Wilke, C.R.; Chang, P. Correlation of Diffusion Coefficients in Dilute Solutions. AIChE J. 1955, 1, 264–270. [Google Scholar] [CrossRef]
  16. Scheibel, E.G. Correspondence. Liquid Diffusivities. Viscosity Gases. Ind. Eng. Chem. 1954, 46, 2007–2008. [Google Scholar] [CrossRef]
  17. Lusis, M.A.; Ratcliff, C.A. Diffusion in Binary Liquid Mixtures at Infinite Dilution. Can. J. Chem. Eng. 1968, 46, 385–387. [Google Scholar] [CrossRef]
  18. Vaz, R.V.; Magalhães, A.L.; Silva, C.M. Improved Stokes-Einstein Based Models for Diffusivities in Supercritical CO2. J. Taiwan Inst. Chem. Eng. 2014, 45, 1280–1284. [Google Scholar] [CrossRef]
  19. Magalhães, A.L.; Vaz, R.V.; Gonçalves, R.M.G.; da Silva, F.A.; Silva, C.M. Accurate Hydrodynamic Models for the Prediction of Tracer Diffusivities in Supercritical Carbon Dioxide. J. Supercrit. Fluids 2013, 83, 15–27. [Google Scholar] [CrossRef]
  20. Santos, C.I.A.V.; Ribeiro, A.C.F.; Esteso, M.A. Drug Delivery Systems: Study of Inclusion Complex Formation between Methylxanthines and Cyclodextrins and Their Thermodynamic and Transport Properties. Biomolecules 2019, 9, 196. [Google Scholar] [CrossRef] [Green Version]
  21. Santos, C.I.A.V.; Esteso, M.A.; Lobo, V.M.M.; Cabral, A.M.T.D.P.V.; Ribeiro, A.C.F. Taylor Dispersion Technique as a Tool for Measuring Multicomponent Diffusion in Drug Delivery Systems at Physiological Temperature. J. Chem. Thermodyn. 2015, 84, 76–80. [Google Scholar] [CrossRef]
  22. Santos, C.I.A.V.; Esteso, M.A.; Sartorio, R.; Ortona, O.; Sobral, A.J.N.; Arranja, C.T.; Lobo, V.M.M.; Ribeiro, A.C.F. A Comparison between the Diffusion Properties of Theophylline/β-Cyclodextrin and Theophylline/2-Hydroxypropyl-β-Cyclodextrin in Aqueous Systems. J. Chem. Eng. Data 2012, 57, 1881–1886. [Google Scholar] [CrossRef]
  23. Santos, C.I.A.V.; Shevtsova, V.; Burrows, H.D.; Ribeiro, A.C.F. Optimization of Taylor Dispersion Technique for Measurement of Mutual Diffusion in Benchmark Mixtures. Microgravity Sci. Technol. 2016, 28, 459–465. [Google Scholar] [CrossRef]
  24. Shevtsova, V.; Santos, C.; Sechenyh, V.; Legros, J.C.; Mialdun, A. Diffusion and Soret in Ternary Mixtures. Preparation of the DCMIX 2 Experiment on the ISS. Microgravity Sci. Technol. 2014, 25, 275–283. [Google Scholar] [CrossRef]
  25. Santos, C.I.A.V.; Shevtsova, V.; Ribeiro, A.C.F. Diffusion and Thermodiffusion in Hydrocarbon Mixtures. In Chemical Science and Engineering Technology; Apple Academic Press: Waretown, NJ, USA, 2019. [Google Scholar]
  26. Taylor, G.I. Dispersion of Soluble Matter in Solvent Flowing Slowly through a Tube. Proc. R. Soc. Lond. Ser. A Math. Phys. Sci. 1953, 219, 186–203. [Google Scholar] [CrossRef]
  27. Alizadeh, A.; Nieto de Castro, C.A.; Wakeham, W.A. The Theory of the Taylor Dispersion Technique for Liquid Diffusivity Measurements. Int. J. Thermophys. 1980, 1, 243–284. [Google Scholar] [CrossRef]
  28. Liong, K.K.; Wells, P.A.; Foster, N.R. Diffusion in Supercritical Fluids. J. Supercrit. Fluids 1991, 4, 91–108. [Google Scholar] [CrossRef]
  29. Nunge, R.J.; Lin, T.S.; Gill, W.N. Laminar Dispersion in Curved Tubes and Channels. J. Fluid Mech. 1972, 51, 363–383. [Google Scholar] [CrossRef]
  30. Erdogan, M.E.; Chatwin, P.C. The Effects of Curvature and Buoyancy on the Laminar Dispersion of Solute in a Horizontal Tube. J. Fluid Mech. 1967, 29, 465–484. [Google Scholar] [CrossRef]
  31. Cadogan, S.P.; Maitland, G.C.; Trusler, J.P.M. Diffusion Coefficients of CO2 and N2 in Water at Temperatures between 298.15 K and 423.15 K at Pressures up to 45 MPa. J. Chem. Eng. Data 2014, 59, 519–525. [Google Scholar] [CrossRef] [Green Version]
  32. Funazukuri, T.; Kong, C.Y.; Kagei, S. Infinite Dilution Binary Diffusion Coefficients of Benzene in Carbon Dioxide by the Taylor Dispersion Technique at Temperatures from 308.15 to 328. 15 K and Pressures from 6 to 30 MPa. Int. J. Thermophys. 2001, 22, 1643–1660. [Google Scholar] [CrossRef]
  33. Funazukuri, T.; Kong, C.Y.; Kagei, S. Binary Diffusion Coefficients of Acetone in Carbon Dioxide at 308.2 and 313.2 K in the Pressure Range from 7.9 to 40 MPa. Int. J. Thermophys. 2000, 21, 651–669. [Google Scholar] [CrossRef]
  34. Secuianu, C.; Maitland, G.C.; Trusler, J.P.M.; Wakeham, W.A. Mutual Diffusion Coefficients of Aqueous KCl at High Pressures Measured by the Taylor Dispersion Method. J. Chem. Eng. Data 2011, 56, 4840–4848. [Google Scholar] [CrossRef]
  35. Bueno, J.L.; Suárez, J.J.; Dizy, J.; Medina, I. Infinite Dilution Diffusion Coefficients: Benzene Derivatives as Solutes in Supercritical Carbon Dioxide. J. Chem. Eng. Data 1993, 38, 344–349. [Google Scholar] [CrossRef]
  36. Lai, C.C.; Tan, C.S. Measurement of Molecular Diffusion Coefficients in Supercritical Carbon Dioxide Using a Coated Capillary Column. Ind. Eng. Chem. Res. 1995, 34, 674–680. [Google Scholar] [CrossRef]
  37. Kong, C.Y.; Sugiura, K.; Natsume, S.; Sakabe, J.; Funazukuri, T.; Miyake, K.; Okajima, I.; Badhulika, S.; Sako, T. Measurements and Correlation of Diffusion Coefficients of Ibuprofen in Both Liquid and Supercritical Fluids. J. Supercrit. Fluids 2020, 159, 3–5. [Google Scholar] [CrossRef]
  38. Musto, P.; Mascia, L.; Ragosta, G.; Scarinzi, G.; Villano, P. The Transport of Water in a Tetrafunctional Epoxy Resin by Near-Infrared Fourier Transform Spectroscopy. Polymer 2000, 41, 565–574. [Google Scholar] [CrossRef]
  39. Elabd, Y.A.; Baschetti, M.G.; Barbari, T.A. Time-Resolved Fourier Transform Infrared/Attenuated Total Reflection Spectroscopy for the Measurement of Molecular Diffusion in Polymers. J. Polym. Sci. Part B Polym. Phys. 2003, 41, 2794–2807. [Google Scholar] [CrossRef]
  40. Ancherbak, S.; Santos, C.; Legros, J.C.; Mialdun, A.; Shevtsova, V. Development of a High-Pressure Set-up for Measurements of Binary Diffusion Coefficients in Supercritical Carbon Dioxide. Eur. Phys. J. E 2016, 39, 111. [Google Scholar] [CrossRef] [PubMed]
  41. Gaponenko, Y.; Mialdun, A.; Shevtsova, V. Diffusion of Quinine with Ethanol as a Co-Solvent in Supercritical CO2. Molecules 2020, 25, 5372. [Google Scholar] [CrossRef] [PubMed]
  42. Johnson, C.C.; Jordan, J.W.; Taylor, L.T.; Vidrine, D.W. On-Line Supercritical Fluid Chromatography with Fourier Transform Infrared Spectrometric Detection Employing Packed Columns and a High Pressure Lightpipe Flow Cell. Chromatographia 1985, 20, 717–723. [Google Scholar] [CrossRef]
  43. Morin, P.; Caude, M.; Richard, H.; Rosset, R. Carbon Dioxide Supercritical Fluid Chromatography-Fourier Transform Infrared Spectrometry. Chromatographia 1986, 21, 523–530. [Google Scholar] [CrossRef]
  44. Shafer, K.H.; Griffiths, P.R. On-Line Supercritical Fluid Chromatography/Fourier Transform Infrared Spectrometry. Anal. Chem. 1983, 55, 1939–1942. [Google Scholar] [CrossRef]
  45. Suehiro, Y.; Nakajima, M.; Yamada, K.; Uematsu, M. Critical Parameters of {xCO2+ (1−x)CHF3} Forx= (1.0000, 0.7496, 0.5013, and 0.2522). J. Chem. Thermodyn. 1996, 28, 1153–1164. [Google Scholar] [CrossRef]
  46. Lee, C.H.; Holder, G.D. Use of Supercritical Fluid Chromatography for Obtaining Mass Transfer Coefficients in Fluid-Solid Systems at Supercritical Conditions. Ind. Eng. Chem. Res. 1995, 34, 906–914. [Google Scholar] [CrossRef]
  47. Suárez, J.J.; Medina, I.; Bueno, J.L. Diffusion Coefficients in Supercritical Fluids: Available Data and Graphical Correlations. Fluid Phase Equilibria 1998, 153, 167–212. [Google Scholar] [CrossRef]
  48. Bruno, T.J. A Supercritical Fluid Chromatograph for Physicochemical Studies. J. Res. Natl. Bur. Stand. 1989, 94, 105. [Google Scholar] [CrossRef] [PubMed]
  49. Tyrell, H.J.V.; Harris, K.R. Diffusion in Liquids; Elsevier: Amsterdam, The Netherlands, 1984; ISBN 9780408175913. [Google Scholar]
  50. Callendar, R.; Leaist, D.G. Diffusion Coefficients for Binary, Ternary, and Polydisperse Solutions from Peak-Width Analysis of Taylor Dispersion Profiles. J. Solut. Chem. 2006, 35, 353–379. [Google Scholar] [CrossRef]
  51. Levelt Sengers, J.M.H.; Deiters, U.K.; Klask, U.; Swidersky, P.; Schneider, G.M. Application of the Taylor Dispersion Method in Supercritical Fluids. Int. J. Thermophys. 1993, 14, 893–922. [Google Scholar] [CrossRef]
  52. Sassiat, P.R.; Mourier, P.; Caude, M.H.; Rosset, R.H. Measurement of Diffusion Coefficients in Supercritical Carbon Dioxide and Correlation with the Equation of Wilke and Chang. Anal. Chem. 1987, 59, 1164–1170. [Google Scholar] [CrossRef]
  53. Kong, C.Y.; Funazukuri, T.; Kagei, S. Chromatographic Impulse Response Technique with Curve Fitting to Measure Binary Diffusion Coefficients and Retention Factors Using Polymer-Coated Capillary Columns. J. Chromatogr. A 2004, 1035, 177–193. [Google Scholar] [CrossRef] [PubMed]
  54. Feist, R.; Schneider, G.M. Determination of Binary Diffusion Coefficients of Benzene, Phenol, Naphthalene and Caffeine in Supercritical CO2 between 308 and 333 K in the Pressure Range 80 to 160 Bar with Supercritical Fluid Chromatography (SFC). Sep. Sci. Technol. 1982, 17, 261–270. [Google Scholar] [CrossRef]
  55. Umezawa, S.; Nagashima, A. Measurement of the Diffusion Coefficients of Acetone, Benzene, and Alkane in Supercritical CO2 by the Taylor Dispersion Method. J. Supercrit. Fluids 1992, 5, 242–250. [Google Scholar] [CrossRef]
  56. Suárez, J.J.; Bueno, J.L.; Medina, I. Determination of Binary Diffusion Coefficients of Benzene and Derivatives in Supercritical Carbon Dioxide. Chem. Eng. Sci. 1993, 48, 2419–2427. [Google Scholar] [CrossRef]
  57. Santos, C.I.A.V.; Barros, M.C.F.; Ribeiro, A.C.F. Diffusion of Ethanol in Supercritical Carbon Dioxide—Investigation of ScCO2-Cosolvent Mixtures Used in Pharmaceutical Applications. Processes 2022, 10, 660. [Google Scholar] [CrossRef]
  58. Akgerman, A.; Erkey, C.; Orejuela, M. Limiting Diffusion Coefficients of Heavy Molecular Weight Organic Contaminants in Supercritical Carbon Dioxide. Ind. Eng. Chem. Res. 1996, 35, 911–917. [Google Scholar] [CrossRef]
  59. Lemmon, E.W.; McLinden, M.O. Thermophysical Properties of Fluid Systems. In NIST Chemistry Webbook; NIST Standard Reference Database No. 69; Linstrom, P.J., Mallard, W.G., Eds.; NIST: Gaithersburg, MD, USA, 1998; p. 20899. [Google Scholar] [CrossRef]
  60. Swaid, I.; Schneider, G.M. Determination of Binary Diffusion Coefficients of Benzene and Some Alkylbenzenes in Supercritical CO2 Between 308 and 328 K in the Pressure Range 80 To 160 Bar With Supercritical Fluid Chromatography (Sfc). Ber. Bunsenges./Phys. Chem. Chem. Phys. 1979, 83, 969–974. [Google Scholar] [CrossRef]
  61. Ellert, J. Differentialkalorimetrie (DSC) bei hohen Drücken. Diploma Thesis, University of Bochum, Bochum, Germany, 1986. Available online: http://www.ub.rub.de/katalog/titel/1257414 (accessed on 23 June 2022).
  62. Swidersky, P. Spektroskopische Hochdruckuntersuchungen zur Löslichkeit von Anthrachinonfarbstoffen in überkritischen Gasen bei Drücken bis zu 180 MPa und Temperaturen zwischen 300 K und 360 K. Diploma Thesis, University of Bochum, Bochum, Germany, 1991. Available online: http://www.ub.rub.de/katalog/titel/1412001 (accessed on 23 June 2022).
Figure 1. Schematic representation of high-pressure Taylor dispersion setup.
Processes 10 01528 g001
Figure 2. Typical response curves for toluene in supercritical carbon dioxide at different wavenumbers, at 306.15 K and 10.5 MPa.
Processes 10 01528 g002
Figure 3. Effect of the flow velocity on the measured diffusion coefficients of toluene in supercritical carbon dioxide at p = 10.5 MPa and T = 306.15 K. Dashed line shows tendency.
Processes 10 01528 g003
Figure 4. Absorbance peaks for toluene in supercritical carbon dioxide at p = 10.5 MPa and T = 306.15 K at different flow velocities.
Processes 10 01528 g004
Figure 5. Variation of the diffusion coefficient of toluene in scCO2 at different pressures and T = 306.15 K. Dashed line shows tendency.
Processes 10 01528 g005
Figure 6. Diffusion coefficient for toluene in scCO2 at pressure range 7.5 to 17 MPa and temperatures from 306.15 to 320.15 K vs. literature data. Red stars are the results presented in this work, black squares ■ are from ref [51], black circles ● are from ref [48], diamonds ◇ are from ref [47], X-shape x are from ref [36] and inverted triangles ∇ are from ref [46].
Processes 10 01528 g006
Figure 7. Diffusion coefficient for benzene in scCO2 at pressure range 7.5 to 17 MPa and temperatures from 306.15 to 320.15 K vs. literature data. Red stars are the results presented in this work, black squares ■ are from ref [51], circles ◯ are from ref [55], black triangles ▲ are from ref [60], triangles ∆ are from ref [35], diamonds ◇ are from ref [52], black diamonds ◆ are from ref [62], X-shape x are from ref [61] and crossed circles ⊗ are from ref [54].
Processes 10 01528 g007
Table 1. Experimental diffusion coefficients for toluene in supercritical carbon dioxide at 306.15 K and 10.5 MPa and different high-pressure cell spacer thickness.
Spacer Thickness
/μm
Peak
Amplitude
Da
/(10−8 m2 s−1)
Peak
Symmetry
Signal-to-Noise Ratio
250.0291.40PerfectLow
1000.0491.44SymmetricMedium
1500.0781.45SymmetricHigh
2500.1351.46AsymmetricHigh
5000.2561.48AsymmetricHigh
a The results presented in the table are for experimental diffusion coefficient calculated for the 3032 cm−1 wavenumber.
Table 2. Experimental diffusion coefficients D for toluene and benzene in supercritical CO2 at pressure range p from 7.5 to 17 MPa, calculated density ρ, and viscosity η [59] for supercritical CO2 at different temperatures from 306.15 to 320.15 K.
T
/K
p
/MPa
ρ
/kg/m3
η
/(10−5 cP)
(DToluene ± SD) a
/(10−8 m2 s−1)
(DBenzene ± SD) a
/(10−8 m2 s−1)
306.1575311.470.230262.89 b ± 0.023.08 ± 0.04
306.1590700.340.562021.60 ± 0.03
306.15105752.750.637381.44 b ± 0.03
306.15125793.270.704981.14 b ± 0.02
306.15146823.000.759981.11 ± 0.03
306.15170844.640.812571.05 ± 0.03
309.1575261.400.21043.11 ± 0.03 3.42 ± 0.03
309.15146802.880.722791.20 ± 0.041.08 c ± 0.02
309.15170832.200.777871.09 ± 0.051.03 c ± 0.02
319.95146716.670.58967 1.26 c ± 0.03
319.95170761.960.65706 1.14 c ± 0.02
320.1575202.570.195963.32 ± 0.033.85 ± 0.05
320.15146716.670.77461.50 ± 0.05
320.15170761.960.829931.34 ± 0.05
a Standard deviation of the mean. b from [57]. c from [40]. Standard uncertainties are uc (T) = 0.01 K and uc (p) = 0.005 MPa. The expanded uncertainties uc (D) ≅ 0.05 × 10⁻⁸ m2 s−1 (level of confidence 0.95).
Table 3. The average absolute deviation (AAD) for the hydrodynamic models adopted for the prediction of the diffusion coefficients for toluene and benzene in supercritical carbon dioxide.
ModelAAD %
Toluene
AAD%
Benzene
OriginalModifiedOriginalModified
Wilke–Chang (Equation (8))1.9 a2.0 e6.28 a1.76 e
Scheibel (Equation (9))9.1 b5.3 e11.67 b9.26 e
Lusis–Ratcliff (Equation (10))3.7 c2.2 e7.79 c1.95 e
Lai–Tan (Equation (11))7.7 d 9.05 d
a [15], b [16], c [17], d [36], e [18]; n for toluene is 60 and for benzene is 36.
Publisher’s Note: MDPI stays neutral with regard to jurisdictional claims in published maps and institutional affiliations.

