
Green Chemistry Metrics, A Review


Abstract
:
1. Introduction
2. Methods
- Green chemistry approach
- Green chemistry evaluation
- Green chemistry metrics
- Green chemistry measures
- How green is?
- Which is greener?
- Greenness evaluation
- Greenness synthesis
- Greenness chemistry
3. Results and Discussion
- (a)
- The obtained information was found in several languages: English, Portuguese, Japanese, Polish, Chinese, and Spanish.
- (b)
- Linked to the two last keywords, almost all references correspond to examples of application of the metrics.
- (c)
- The 12 principles are conceptual and do not provide a quantitative framework [38]; however, the encountered works possess both quantitative and/or qualitative features.
- (d)
- The work is only addressed on the 12 Principles of Green Chemistry, with it important to note that the LCA evaluation was dropped, since to our knowledge it is outside the scope of green chemistry.
3.1. Mass Metrics
- The effective mass yield (EMY) was proposed in 1999 [43] for the synthesis of conduritol C and conduritol F, attempting to define the yield considering the percent of mass of desired product with respect to the mass of all-hazard materials used in the synthesis, without considering the mass of benign solvents.
- Curzons et al. [44] reported a green technology guidance involving several metrics: mass intensity, energy pollutants, and toxics. The authors highlighted in the long term, the AE, and in the short term, the solvent use, focusing their use on the reaction and during the workup step to increase the mass intensity value. In addition, solvents are considered for both their development and considerable life cycle impact associated with impacts through use and final disposition.
- In 2002, Ref. [45] defined the entitled metric mass productivity, being the reciprocal of mass intensity (MI), as analogous to effective mass yield and AE. Moreover, it is also defined the AE as including the intermediates in the reaction, in addition to the association with the cost.
- In general, Andraos (2005–2007) combined a set of four metrics [46,47,48], considering both experimental and calculated parameters and displaying the dependence between them: reaction yield, atom economy, stoichiometric factor (SF), and the corresponding value to the aspect that accounts for the solvent during and post-reaction and/or the catalyst recovery, evaluating linear and convergent sequences. This was in addition to the kinetic resolution of chiral substrates.Andraos [47] involved the construction of a synthesis plan tree to know the efficiency of linear and convergent synthesis by the determination of the gRME. In addition, a study involving costs and quantities in the different steps of a reaction depicted by Andraos and Sayed [48] was performed employing a radial pentagon considering the key metrics; this was to guide bachelor students in understanding the green chemistry concept. Complementarily, Andraos [49], using a pentagram, displayed a simplified approach for a linear and convergent synthesis plan by direct application of green chemistry principles.
- Concerning the MI metric, Augé, in 2008 [50], introduced the parameter of the mass of all auxiliaries for linear, convergent, and mixed sequences. It is convenient to note that the metric is influenced by atom economy, yield, excess of reactants, and mass auxiliaries, indicating that the explanation of environmental (E) impact is produced from auxiliaries.
- Quantifying the volume intensity of the solvent consumed (AMVI) and waste generated from the HPLC analytical method, an interesting metric was developed by Hartman et al. [51]. In this study, the authors considered both sample preparation and operation of the analytical device waste, considering the number of samples analyzed, during all the steps of the analysis.
- At an industrial level, the American Chemical Society Institute Pharmaceutical Roundtable (the Roundtable) [52,53] implemented the concept process mass intensity (PMI) as the main mass green metric instead of the E-factor, bearing in mind the importance of the process efficiency. In other words, it is preferably an efficient process. Moreover, related to the water, it is convenient to note its inclusion in the PMI metric by the Roundtable, with E excluding it.
- A holistic metric for a total synthesis is the global material economy (GME), employed for linear, convergent, and multiconvergent synthesis [54]. This metric is based on the mass of all the required materials to generate the product.
- A new metric reaction mass intensity (RMI) was introduced by Song et al. in 2012 [55]; it focuses on the efficiency of the route instead of the process, excluding the solvents. It was defined between total of mass of reaction material and mass of product.
- Two novel metrics were developed (based on the first two principles of the Green Chemistry Protocol), hybridizing three well-known metrics (AE, MI, and RME), green atomic level, and green mass level [56]. Both cases considered the incorporation of reagents into the product, the theoretical value from AE, and the evaluation of total reaction.
- In 2015, Roschangar et al. [12] established the Green Aspiration LevelTM (GALTM); it is based on the concept of a modified E, particularly in the pharmaceutical industry. The implementation of the API was launched on the concept of E, considering a complete-E (cE) in later phases. Consequently, knowing the waste stream from solvents and water and the average steps per target drug, it is possible to describe the average chemical transformation (tGALTM) and process (GALTM). Complementarily, to know the green status of a synthetic process, a new metric (relative process greenness (RPG) was developed based on the GALTM. Thus, to determine the RPG, the changes between each phase, using the relative (green) process improvement, RPI, and relative complexity improvement, RCI, are considered.
- In 2018 [57], an update of the previously commented metric, iGAL, was made. In this case, the impact of the synthesis plan and the innovations for the process design are highlighted. In this sense, the approach considers three complex parameters (number of fluorine functional groups, rings, and chiral centers) to know the molecular weight (MW) of the drug and its salt-free form (FMW). It is worth noting that the last indicator is considered as the best descriptor related to drug complexity. Consequently, the iGAL metric is employed to determine the RPG parameter to know the greenness of a pharmaceutical process.
- A holistic toolkit (the CHEM 21 project) was proposed (2015) [58] for the pharmaceutical industry; it includes several stages, considering the different parameters covered in each pass. Thus, three new metrics—optimum efficiency (OE), renewable percentage (RP), and waste percentage (WP)—were accomplished. In this sense, the first new metric is dependent on AE which determines the theoretical efficiency, while RME gives the observed value and allows a direct comparison between different reaction types. The second metric is derived from renewable intensity, i.e., the mass of all renewably derivable materials used and the mass of the product. Finally, the third metric is based on the waste intensity and PMI. Using flags with different colors, to determine the hazard of the different steps of the overall process, a green flag is indicative of the preferred option, an amber flag is an acceptable option but with some issues, and a red flag is assigned to an undesirable process. In this strategy are also considered the solvents, the hazard of reagents, the type of process (batch or flow), and the work steps in the manufacture of the drug. It is convenient to comment that a central objective of designing the toolkit was to allow the recent, state of the art to be assessed for each class of transformation, to know the reaction or pathway, providing a convenient baseline to compare discoveries; in other words, to be an indicator of success. This, in addition, to recognizing hot-spots and bottlenecks in current methodologies helps chemists direct their research to areas of highest effect. A final objective is to inspire constant improvement, and to lead academics to surmise conveniently about sustainability by examining and generating improvements to their synthetic routes.
- A classroom activity that focused on bachelor’s students facilitating the teaching–learning of green chemistry was reported in 2016 [59]. In this sense, several reaction metrics were joined (conversion, selectivity, yield, AE, RME, CE, E, and effective mass yield), employing the assembly, alteration, and disassembly of interlocking building blocks for molecular models. In this study, an accomplished model represents a molecule, a brick represents an atom, and the number of connections points represents the molecular weight. The activity is suitable for students in general chemistry courses through advanced undergraduate green chemistry or industrial chemistry courses.
- An important study connected to the biopharmaceutical field applying the PMI metric was published in 2019 [60]; its main objective was an application to produce monoclonal antibody (mAb) to quantify the corresponding environmental footprint. The PMI inputs were grouped in four categories: (1) upstream process (cell culture and bioreactor production), (2) harvest (centrifugation and filtration), (3) downstream process (purification train), and (4) drug substance (ultrafiltration/diafiltration and bulk fill), to collect mass data on the amount of water, raw material, and consumables employed to generate 1 kg of API. Accordingly, the authors reported that in large scale, PMI ranged between 3000–24,000, and in small scale, PMI ranged between 3000–17,000. It can be concluded that the efficiency in the production of mAb is not dependent on scale, with it being important to note that the chromatography operation step is the main water consumption, increasing the PMI value.
- As has been previously asserted, the PMI green metric is considered the key metric for an industrial pharmaceutical process. Thus, in recent research (2020), two synthetic processes were compared to determine their green qualifications [10]. The authors pondered three parameters—yield, concentration, and the difference in molecular weight of the reactants—as being important to highlight that the corresponding difference must be as close as practically possible, instead of considering only a mass metric such as AE or E, to obtain a more realistic response.
- A novel metric manufacturing mass intensity (MMI) was recently developed [61] to measure the impact of producing API through a synthetic process. The metric is an extension of the PMI metric. It considers the categories excluded in PMI, such as cleaning/preparation, equipment conditioning, effluent management, abatement, overages, circularity, reuse, and recycling. With the MMI metric, it is possible to know the mass requirements to prepare the equipment, verify if some reagent or solvent might be replaced, and know if it is possible to reuse (recycle) any solvent or reagent, and recognize the accurate mass quantification to avoid more optimizations in the process.

| Mass Metrics | Expression | References |
|---|---|---|
| E-factor (E) | Total waste/products | [12,41,42,52,53,59,60] |
| Atom economy (AE) | (FW product/FW of all reactants used in reaction) × 100 | [12,39,40,44,45,49,56,59,60] |
| Mass intensity (index) (MI) | Total mass/mass of product | [12,44,50,52,53,54,56,60] |
| Mass productivity | Mass of product/total mass in process or process step | [45] |
| Effective mass yield (EMY) | (Mass of products/mass of non-benign reagents) × 100 | [12,43,44,59] |
| Generalized reaction mass efficiency (gRME) | Mass of product/total mass used in a process or process step | [46,47,48,49] |
| Reaction mass efficiency (RME) | (Mass of isolated product/total mass of reactants used in reaction) × 100 | [12,44,45,54,56,59,60] |
| Stoichiometric factor (SF) 1 | [46,47,48,49] | |
| Carbon efficiency (CE) | (Mass of carbon in product/total mass of carbon in reactants) × 100 | [12,44,45,59,60] |
| Process mass intensity (PMI) | Total mass in a process or process step/mass of product | [12,49,52,53] |
| Global material economy (GME) | Mass of product/total mass used in total synthesis | [54] |
| Reaction mass intensity (RMI) | Total of mass of reaction materials/mass of product | [55] |
| Greener atomic level | 100 × (RME/AE) | [56] |
| Greener mass level 2 | [56] | |
| Complete E-factor (cE) | ∑m(Raw materials) + ∑m(reagents) + ∑m(solvent) + ∑m(water) − m(product)/m(product) | [12] |
| Transformation green aspiration levelTM (GALTM) | xE/average complexity, where xE = cE o E | [12] |
| Green aspiration levelTM (tGALTM) | (tGALTM) × complexity | [12] |
| Relative process greenness (RPG) | GAL(xF)/xE | [12] |
| Innovation green aspiration level (iGAL) | iGAL = (mGAL × FMW)/1000 | [57] |
| Optimum efficiency (OE) | (RME/AE) × 100 | [58] |
| Renewable percentage (RP) | (Renewable intensity/PMI) × 100 | [58] |
| Manufacturing mass intensity (MMI) | U(PMI) + U(MI of component under consideration) 3 | [61] |
| Scale risk index (SRI) | SRI = t (HFR + HFP + HFD) | [62] |
3.2. Environmental-Human Health Metrics
- i.
- A set of indicators assembled in a hierarchical metric has been proposed to evaluate the greenness of new and existing chemical technologies, as well as for the analysis of flow sheets of new processes. In this sense, two criteria were developed: (a) it should enable comparison of alternative technologies, and (b) ideally, it should provide a single framework, applicable across the chemical industries with an appropriate selection of indicators, considering four vertical hierarchy levels: 1. product and process, 2. company, 3. infrastructure, and 4. society. It is important to note that the selection of indicators depends on each industrial sector and which their products consider the most relevant aspects oriented to green chemistry in vertical hierarchy levels: 1. climate change, 2. continuous availability of energy, 3. footprint resource efficiency, 4. product toxicity, 5. minimum use of solvents, and 6. recyclability, among others [9].
- ii.
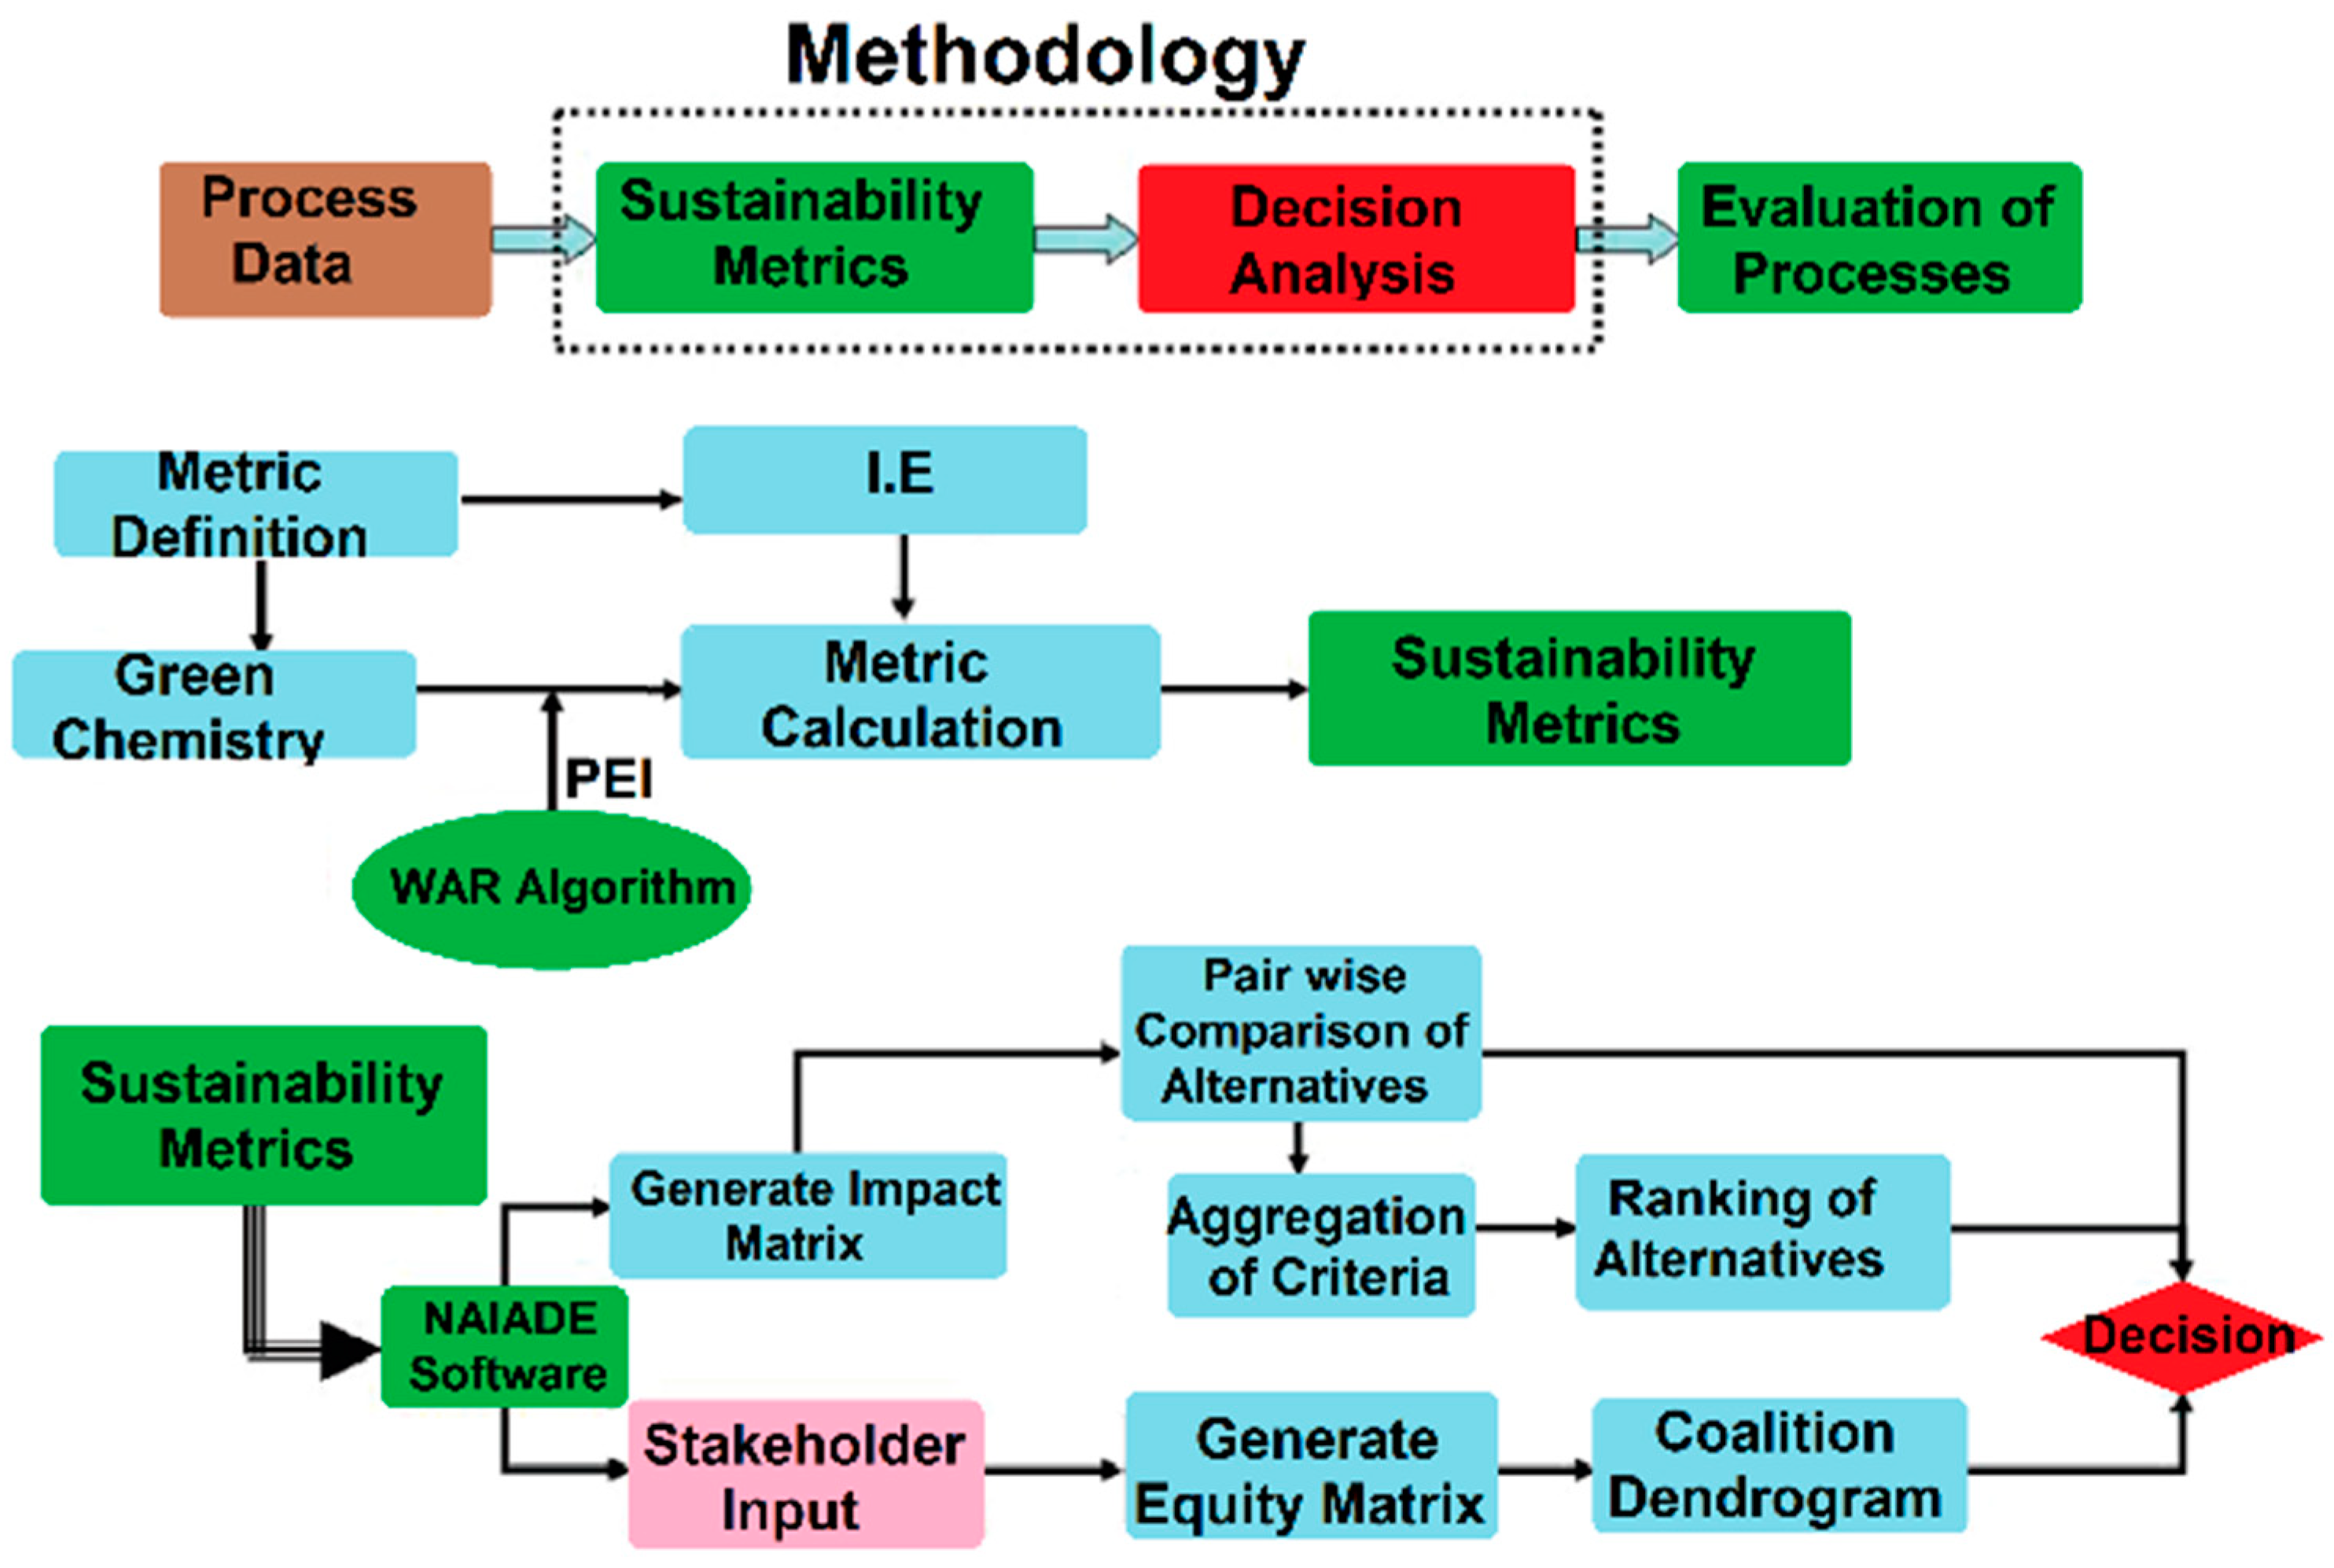
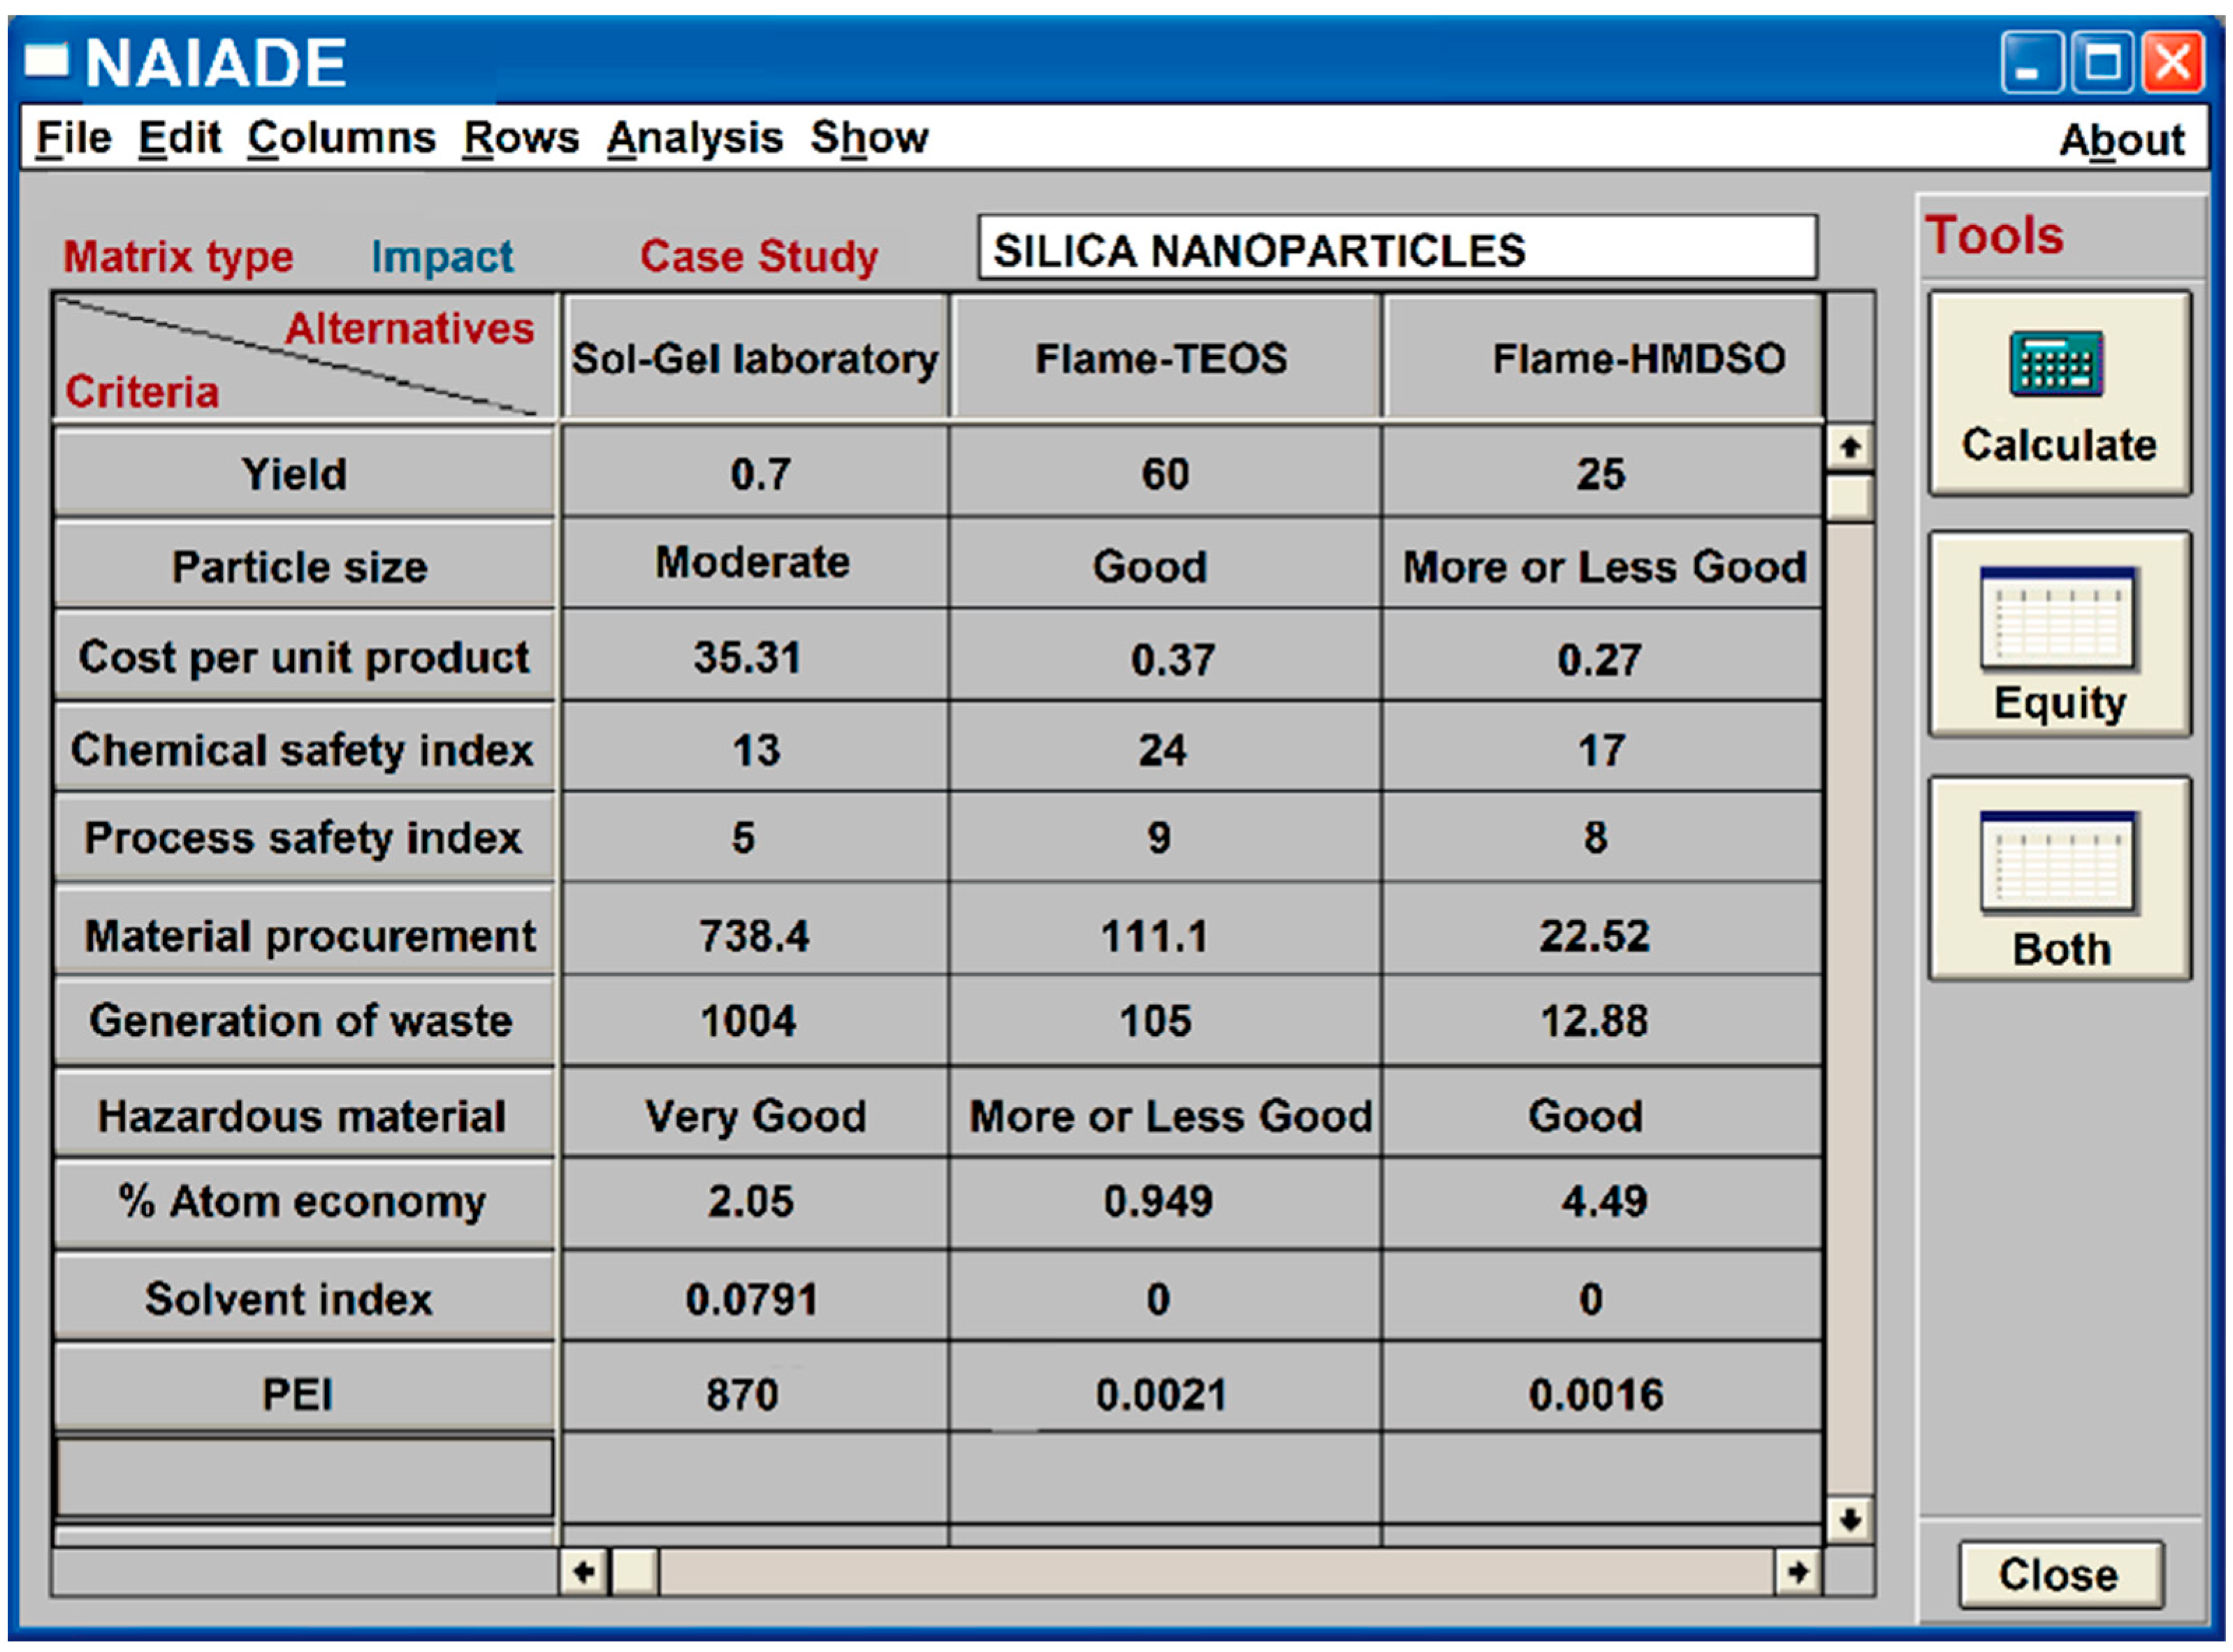
- In 2008 [63], a study to produce nanomaterials was reported; this work coupled both industrial engineering and green chemistry, determining the environmental impact for the synthesis of silica nanoparticles, implicating: a sol-gel process, a simple flame- and an improved HMDSO-flame method. In general, the practice involves two components, shown in Figure 1. The first component involves the development of a set of sustainability metrics and, in a second place, taking up the corresponding decision applying the metrics to evaluate the rate of the process. It is convenient to consider that the sustainability metrics for industrial engineering are process and safety parameters, such as heat of the reaction, chemical interactions, toxicity, pressure, and temperature, among others. For green chemistry, environmental impact metrics include solvent index, generation of waste, and AE, among others.
- iii.
- During the performance of a study related to the polymers field, Ref. [64] evaluated the efficacy of both the 12 green engineering, Table S1, and the green chemistry principles with LCA. In this sense a set of 12 polymers was studied considering the metrics AE, mass from renewable sources, biodegradability, recycled percent, the distance of furthest feedstock, price, life cycle health hazard, and life cycle energy use. Thus, it was reported that the 12 polymers from petroleum or biological categories represent a good option toward the green design principles, reducing the environmental impact.
- iv.
- Environmental matters are a world concern; in this sense, Mercer et al. reported in 2012 [65] an instance created for undergraduate and graduate students to determine the greenest of several syntheses. In this case, nine metrics from LCA were employed: acidification potential, ozone depletion potential, smog formation potential, global warming potential, human toxicity by ingestion, human toxicity by inhalation, persistence, bioaccumulation, and abiotic resource depletion potential, in addition to AE and E. This study reported that the LCA metrics are more reliable than AE and E metrics. Consequently, these calculations allow students to make environmental decisions to attach a label of green to a particular chemical process.
- v.
- In 2012, Gałuszka et al. [66] proposed a semi-quantitative Eco-Scale as a novel approach to evaluate the greenness of an analytical methodology, based on assigning penalty points to parameters of an analytical process without agreement with the ideal green analysis. This green analytical methodology involves the following facts: 1. sample collection, 2. preservation, 3. transport and storage, 4. sample preparation, 5. calibration, and 6. validation of analytical methods. The basis of the concept of an analytical Eco-Scale is that the ideal green analysis has a value of 100, but in a more realistic case, >75 represents excellent green analysis, and <50 represents inadequate green analysis. This simple analytical Eco-Scale is a good semi-quantitative tool for laboratory practice and educational purposes.
- vi.
- A new benign index (BI) [67] based on the following environmental hazards—acidification–basification, ozone depletion, global warming, smog formation, inhalation toxicity, ingestion toxicity, inhalation carcinogenicity, ingestion carcinogenicity, bio-concentration, abiotic resource depletion, cancer potency, persistence, and endocrine disruption—was announced by Andraos, vide supra. It is important to mention that this index is defined as a fraction between 0 and 1, and it may be added as another radial axis to previous work [33] to evaluate the green merits of any given chemical reaction. Importantly, this index is applicable to waste, input, and output materials.
- vii.
- In the same way, the safety/hazard index (SHI) was introduced [68], considering the following environmental impacts: corrosive gas, corrosive liquid/solid, flammability, oxygen balance applied to combustion reactions and oxidation reactions, hydrogen gas generation, occupational exposure limit, and dermal absorption, among others. In addition, there is the temperature and pressure hazard. These indexes are applicable to single- and multiple-step synthetic plans.
- viii.
- An interesting hybrid comparison was developed at the University of Toronto [69] between Eco-Scale, Green Star method, and BI and SHI indexes, considering the following parameters: reaction temperature, reaction pressure, LD50 (oral and dermal), flammability, and corrosivity, among others. Employing a red–yellow–green–gray color code, where the score is achieved by the mass contribution of waste substance and the number of color cells accrued for each substance, this score is also applicable for the input materials.
- ix.
- Another interesting study relates to microscale (at a laboratory level) [62], though in this analysis the microscale did not improve safety. Thus, a new scale risk index was introduced (SRI), shown in Table 3. Its purpose is to assess the improvement of safety on reducing the scale of synthesis experiments. This index includes the following variables: 1. hazard of substances, 2. the time of exposure to substances, and 3. the amounts of substances used. It is important to note that this index is a direct metric of the risk, being an inverse metric of safety and benignity.
- x.
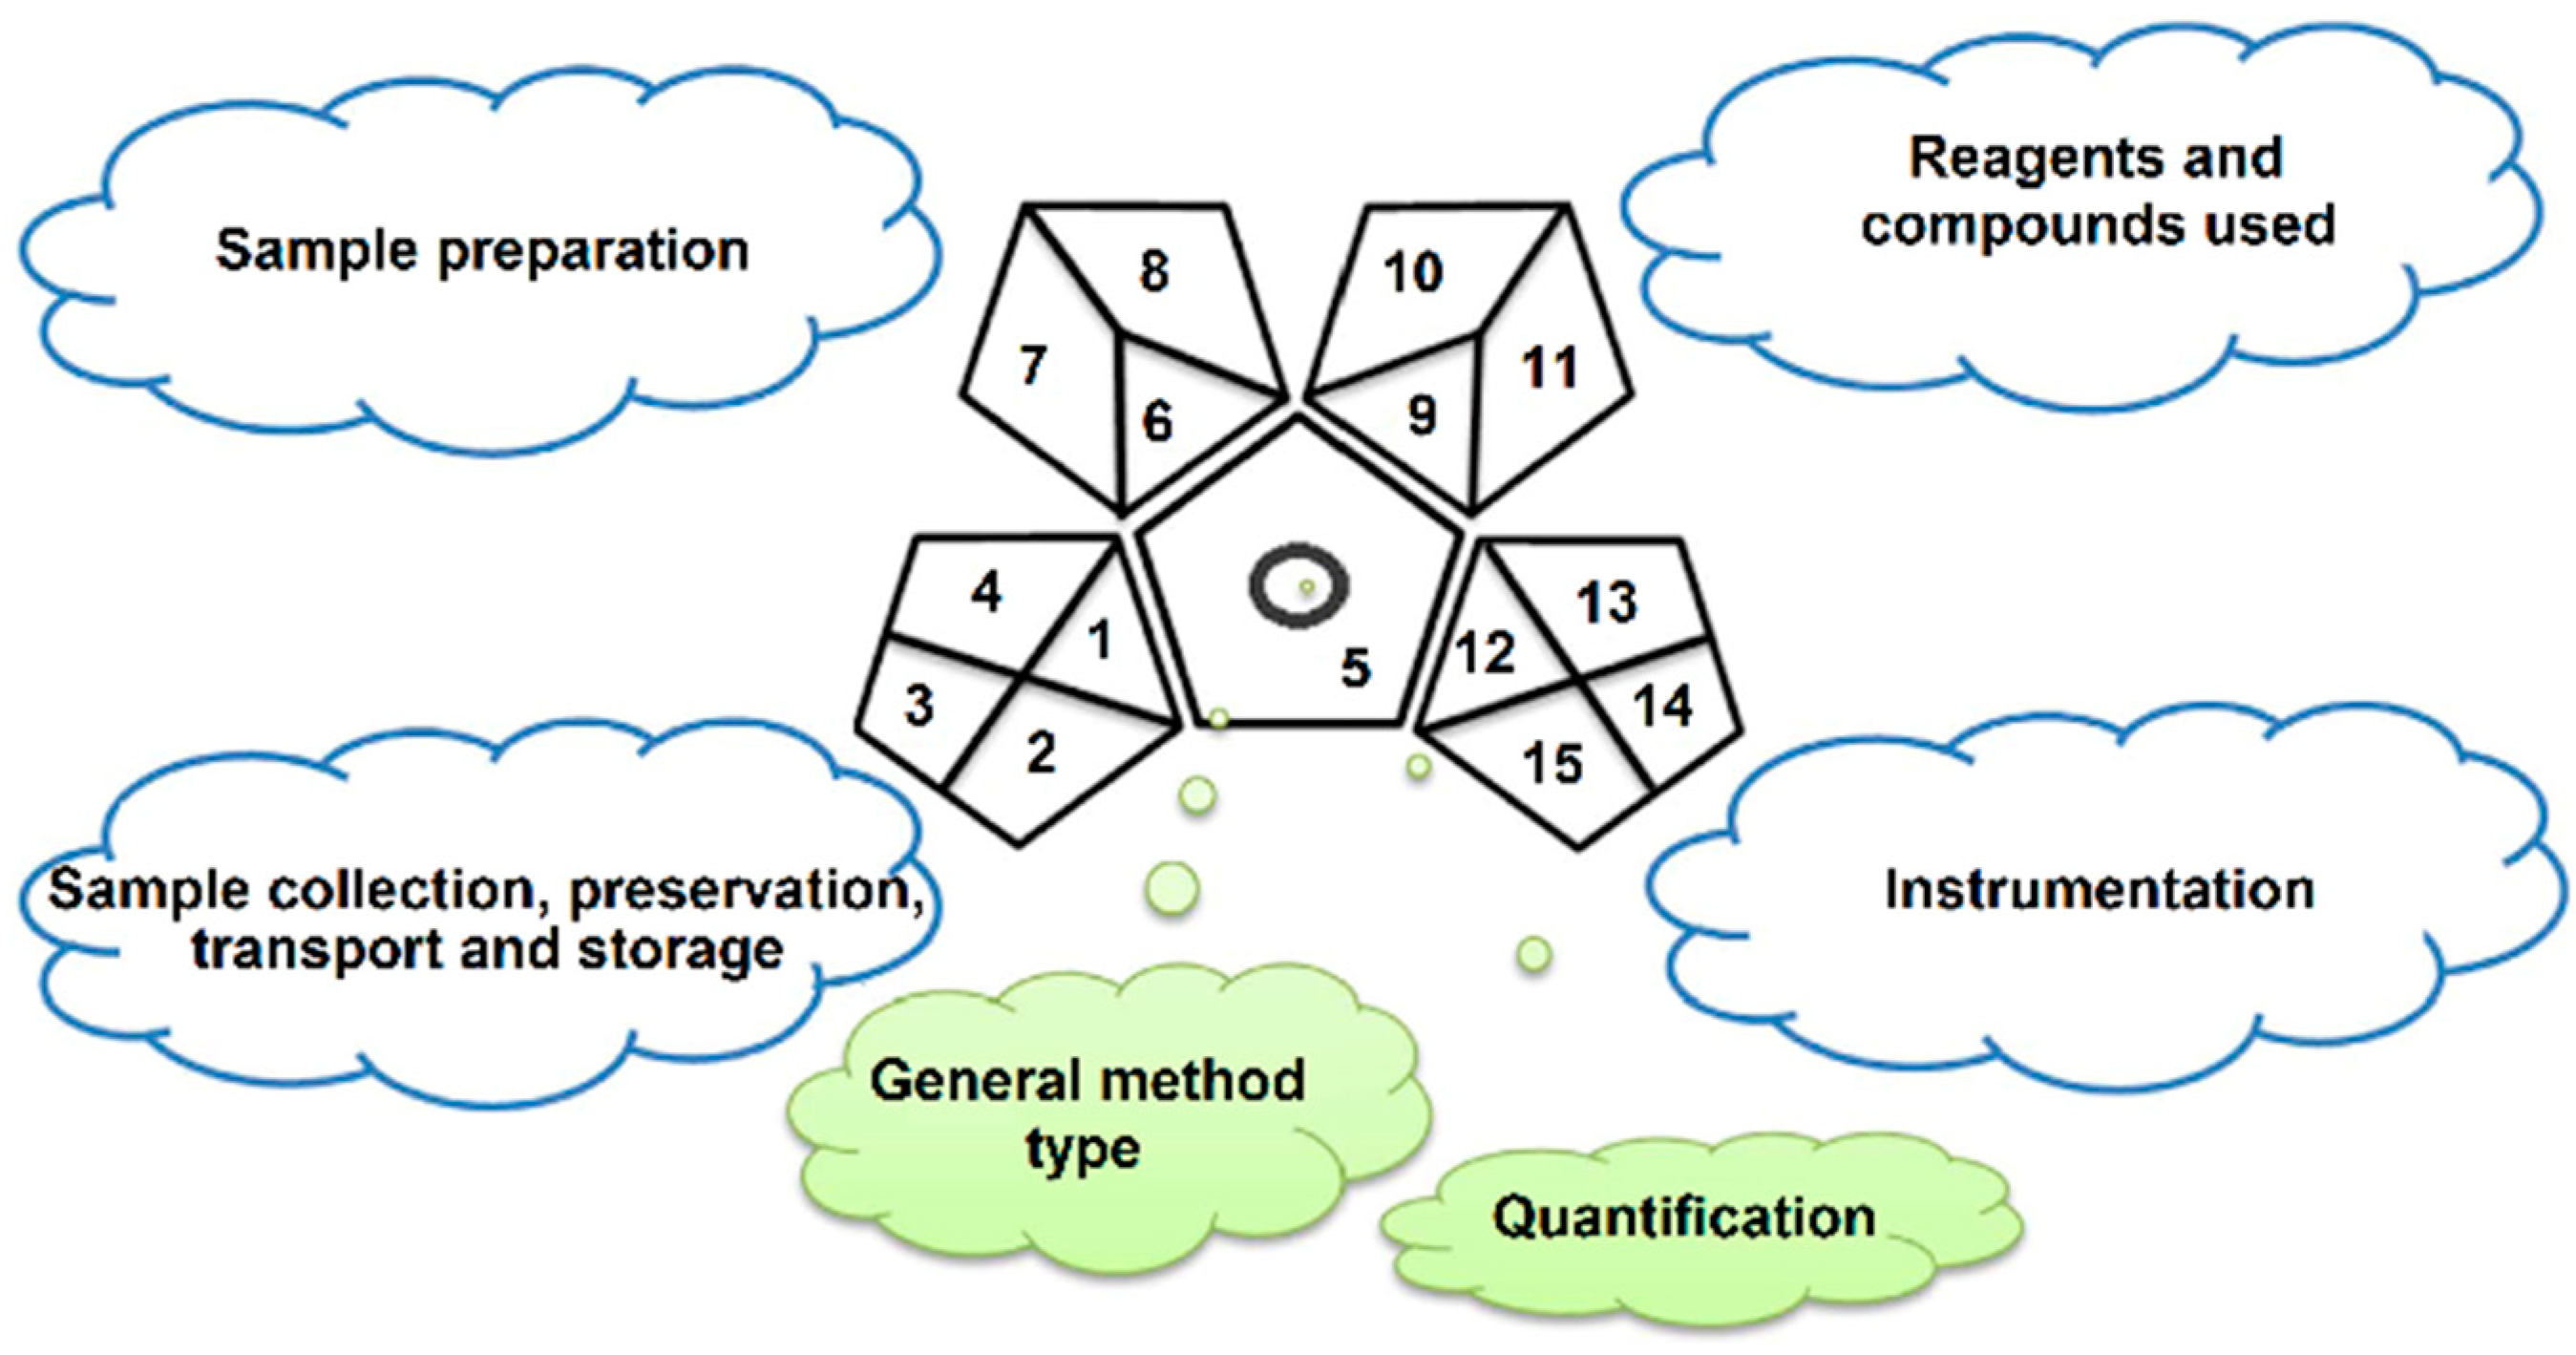
- In 2018, Ref. [70] published a paper in the analytical area that used the green analytical procedure index (GAPI) to evaluate the green character of an entire analytical methodology, from sample collection to final determination, focusing on the 12 green analytical principles, shown in Table S2. In this methodology, five pentagrams were proposed to evaluate and quantify the environmental impact for each step of any analytical methodology, shown in Figure 2. The GAPI tool is a pictogram determining the greenness of each stage in the analytical procedure, employing both a color scale and three levels of evaluation for each stage. The color scale is from green through yellow to red to quantify low, medium, and high environmental impact, respectively, for each step, remarking that this tool is more efficient comparing different procedures. Additionally, the circle in middle GAPI is related to a procedure for qualification and quantification; thus, the GAPI does not show the circle where a procedure is only for qualification.
3.3. Metrics Using Computational Programs (Software, Spreadsheets)
- i.
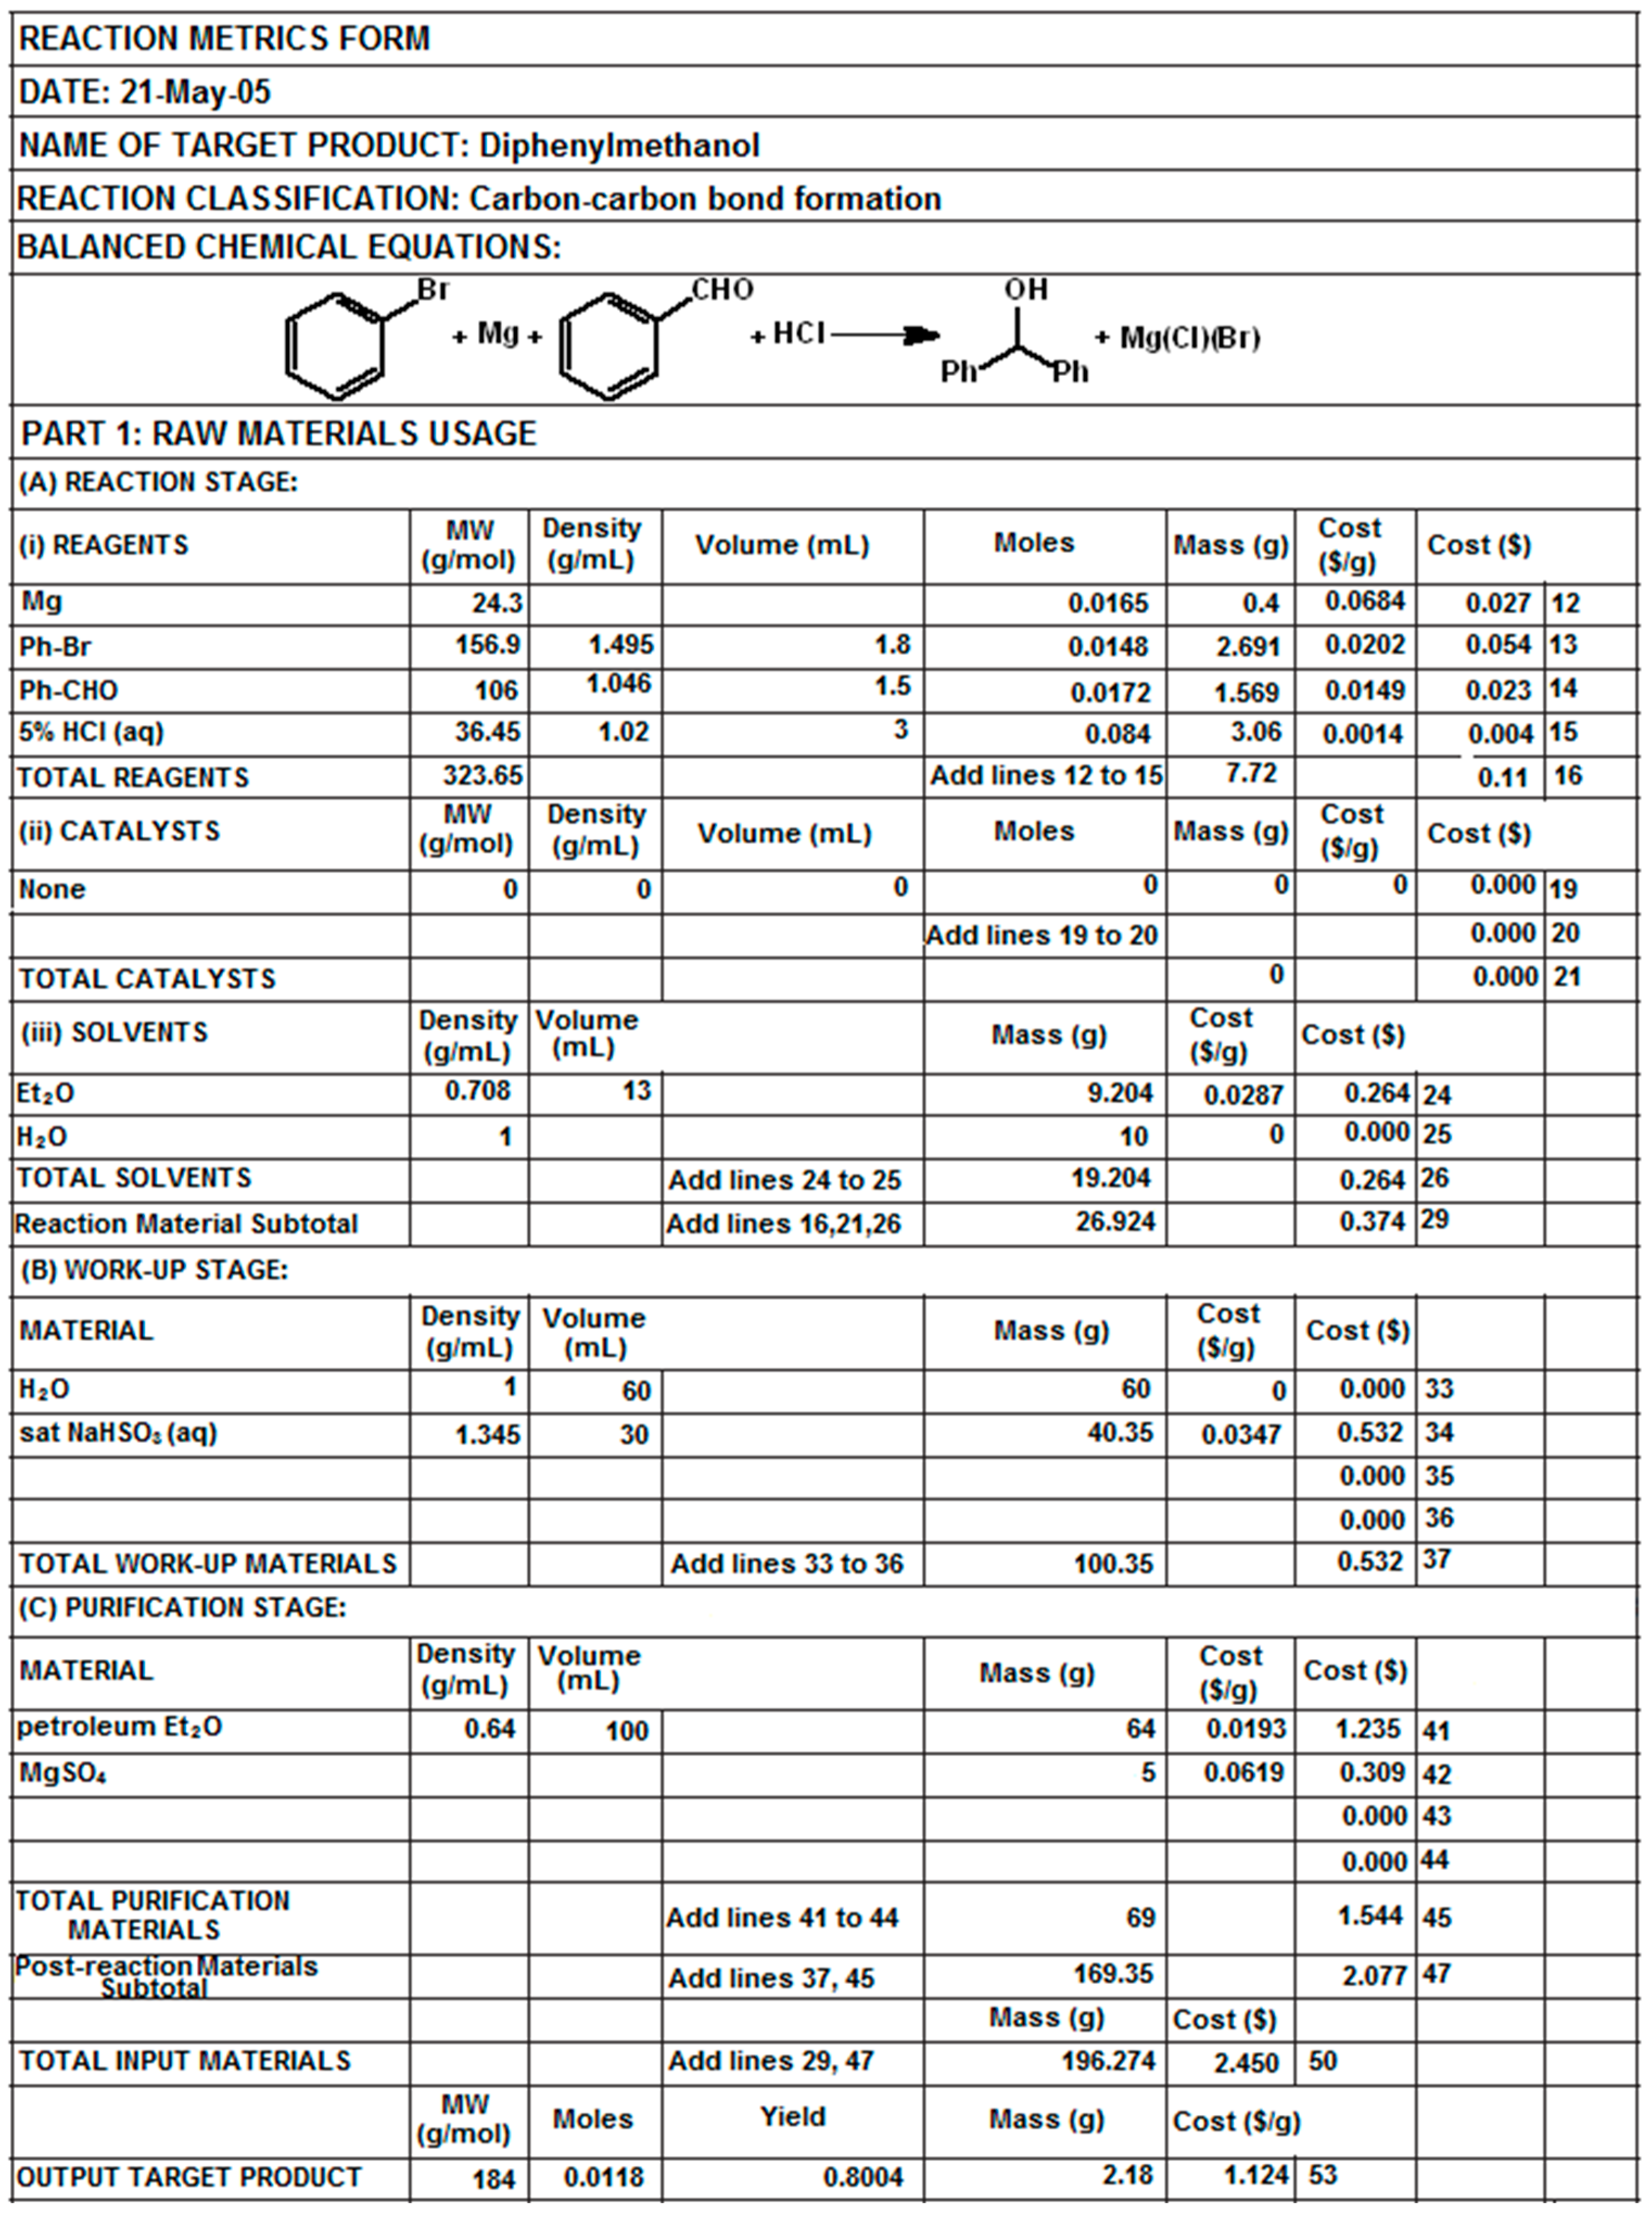
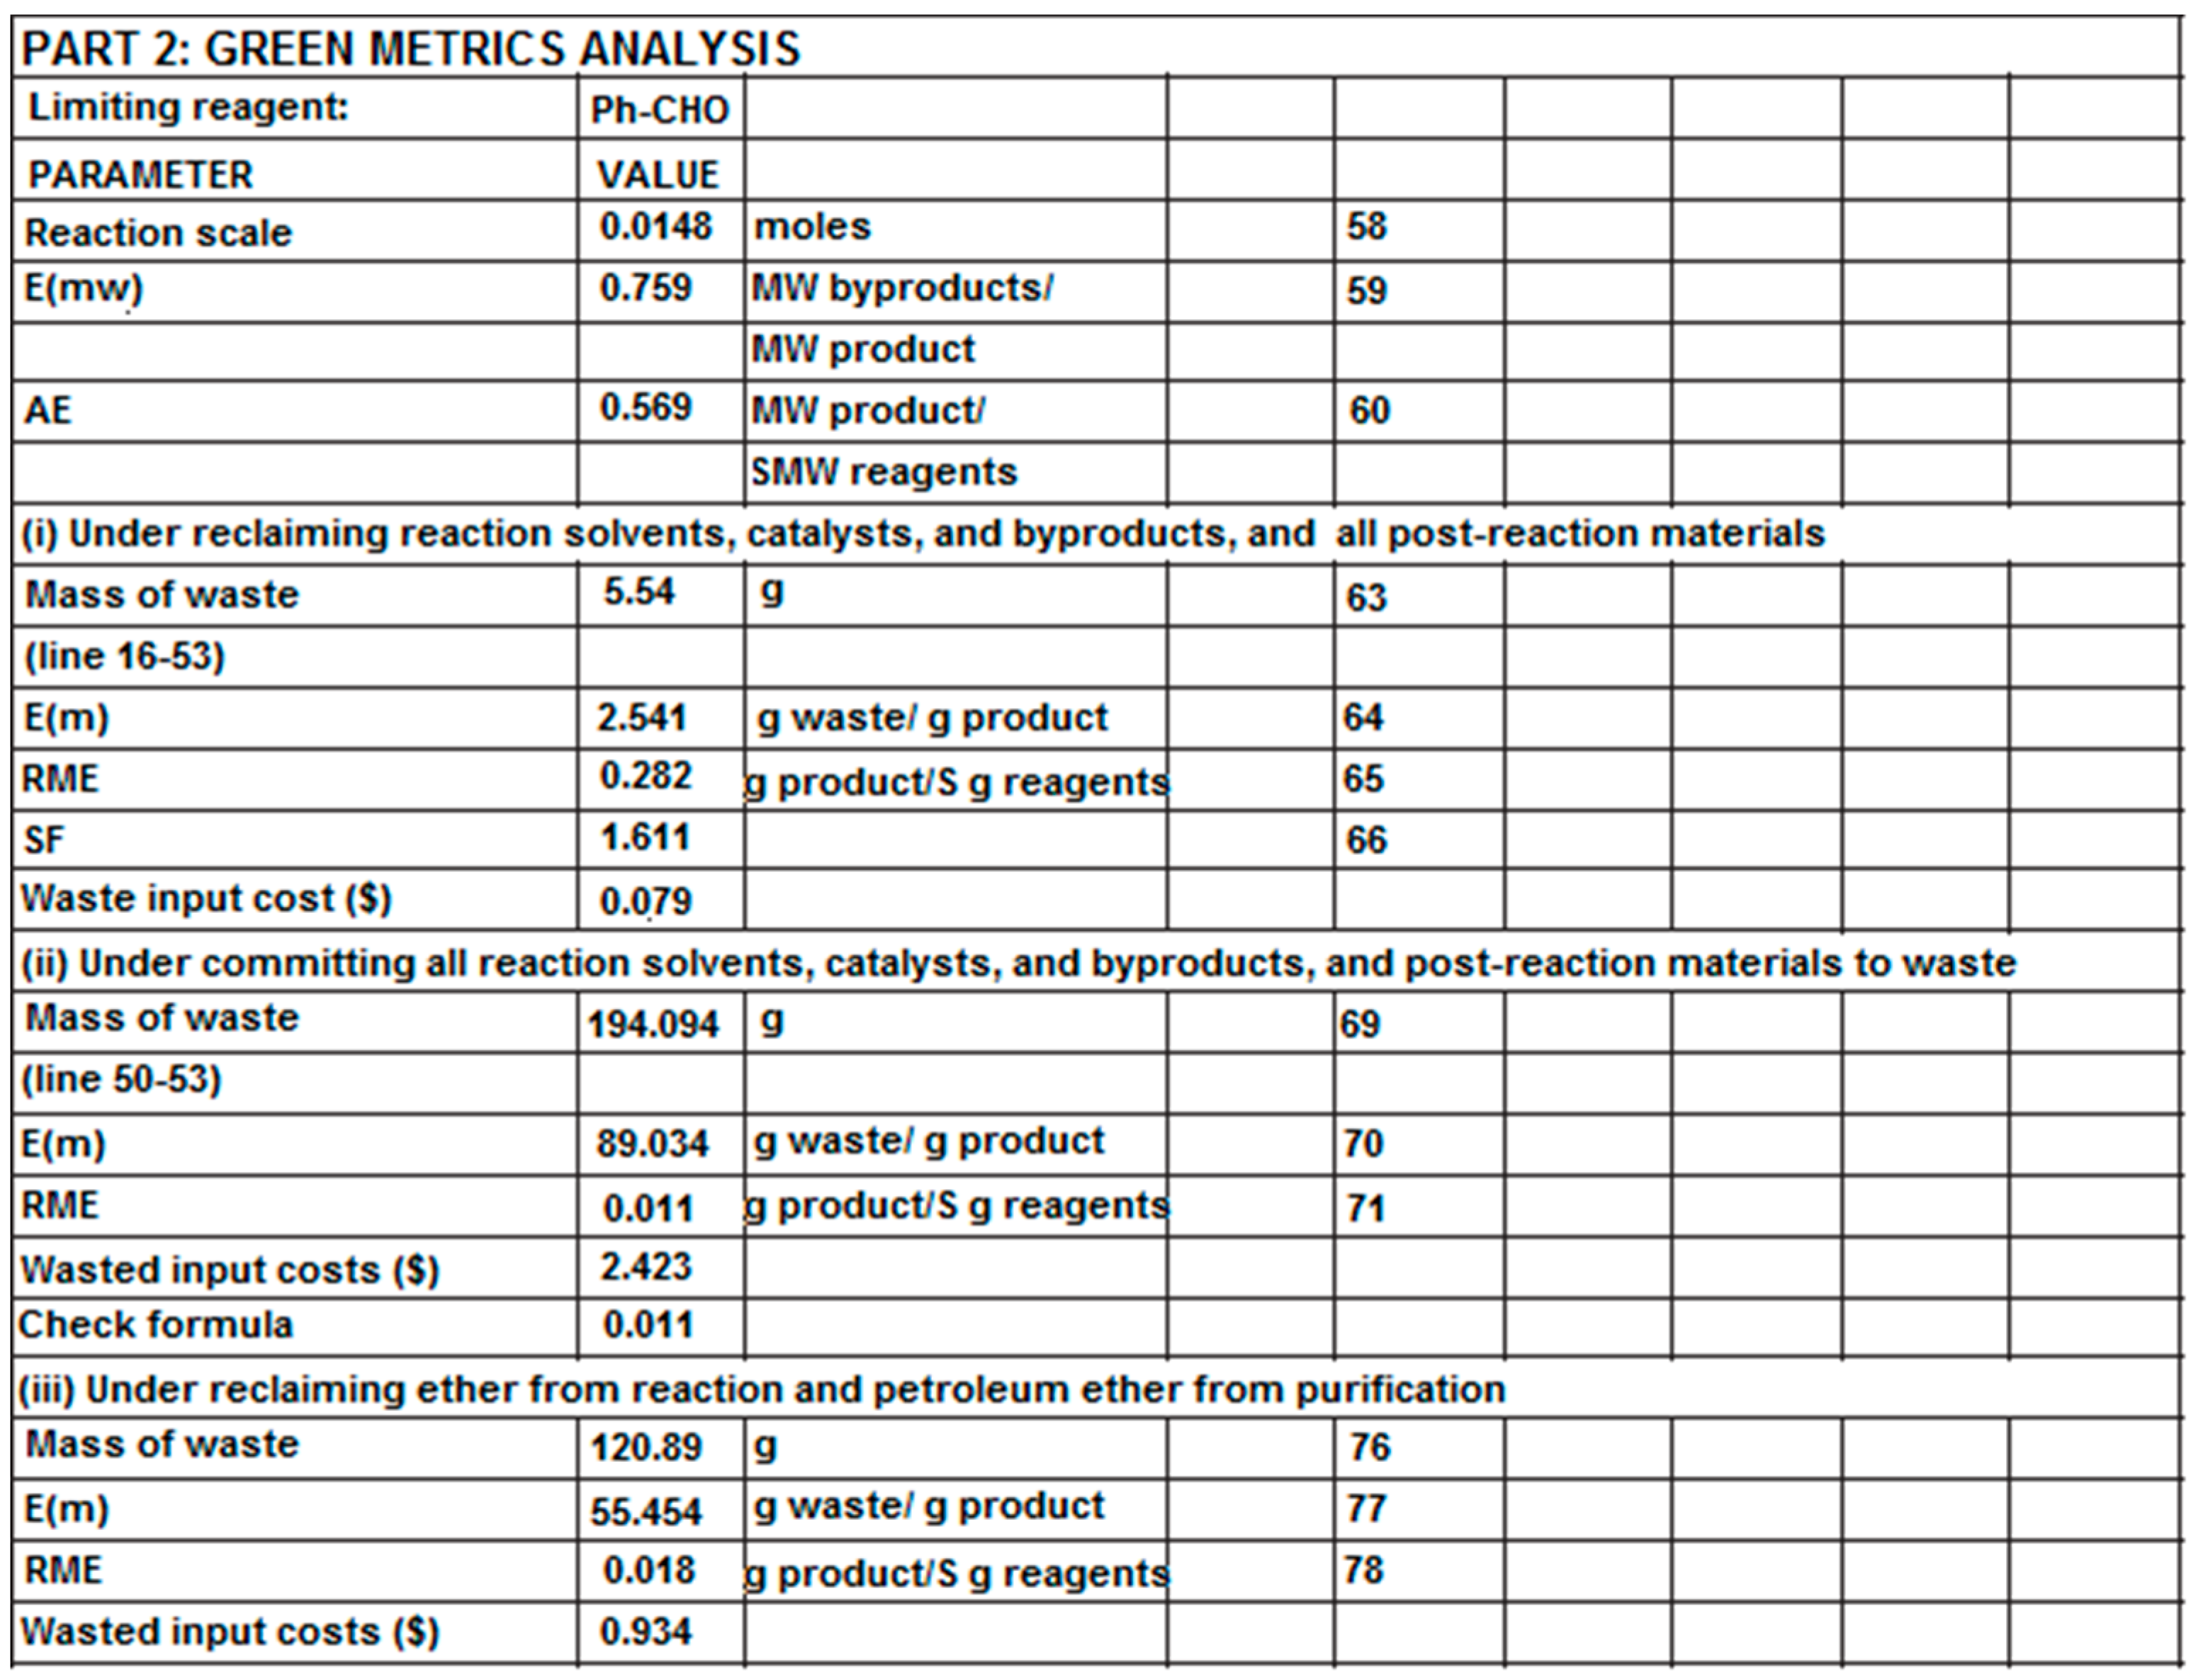
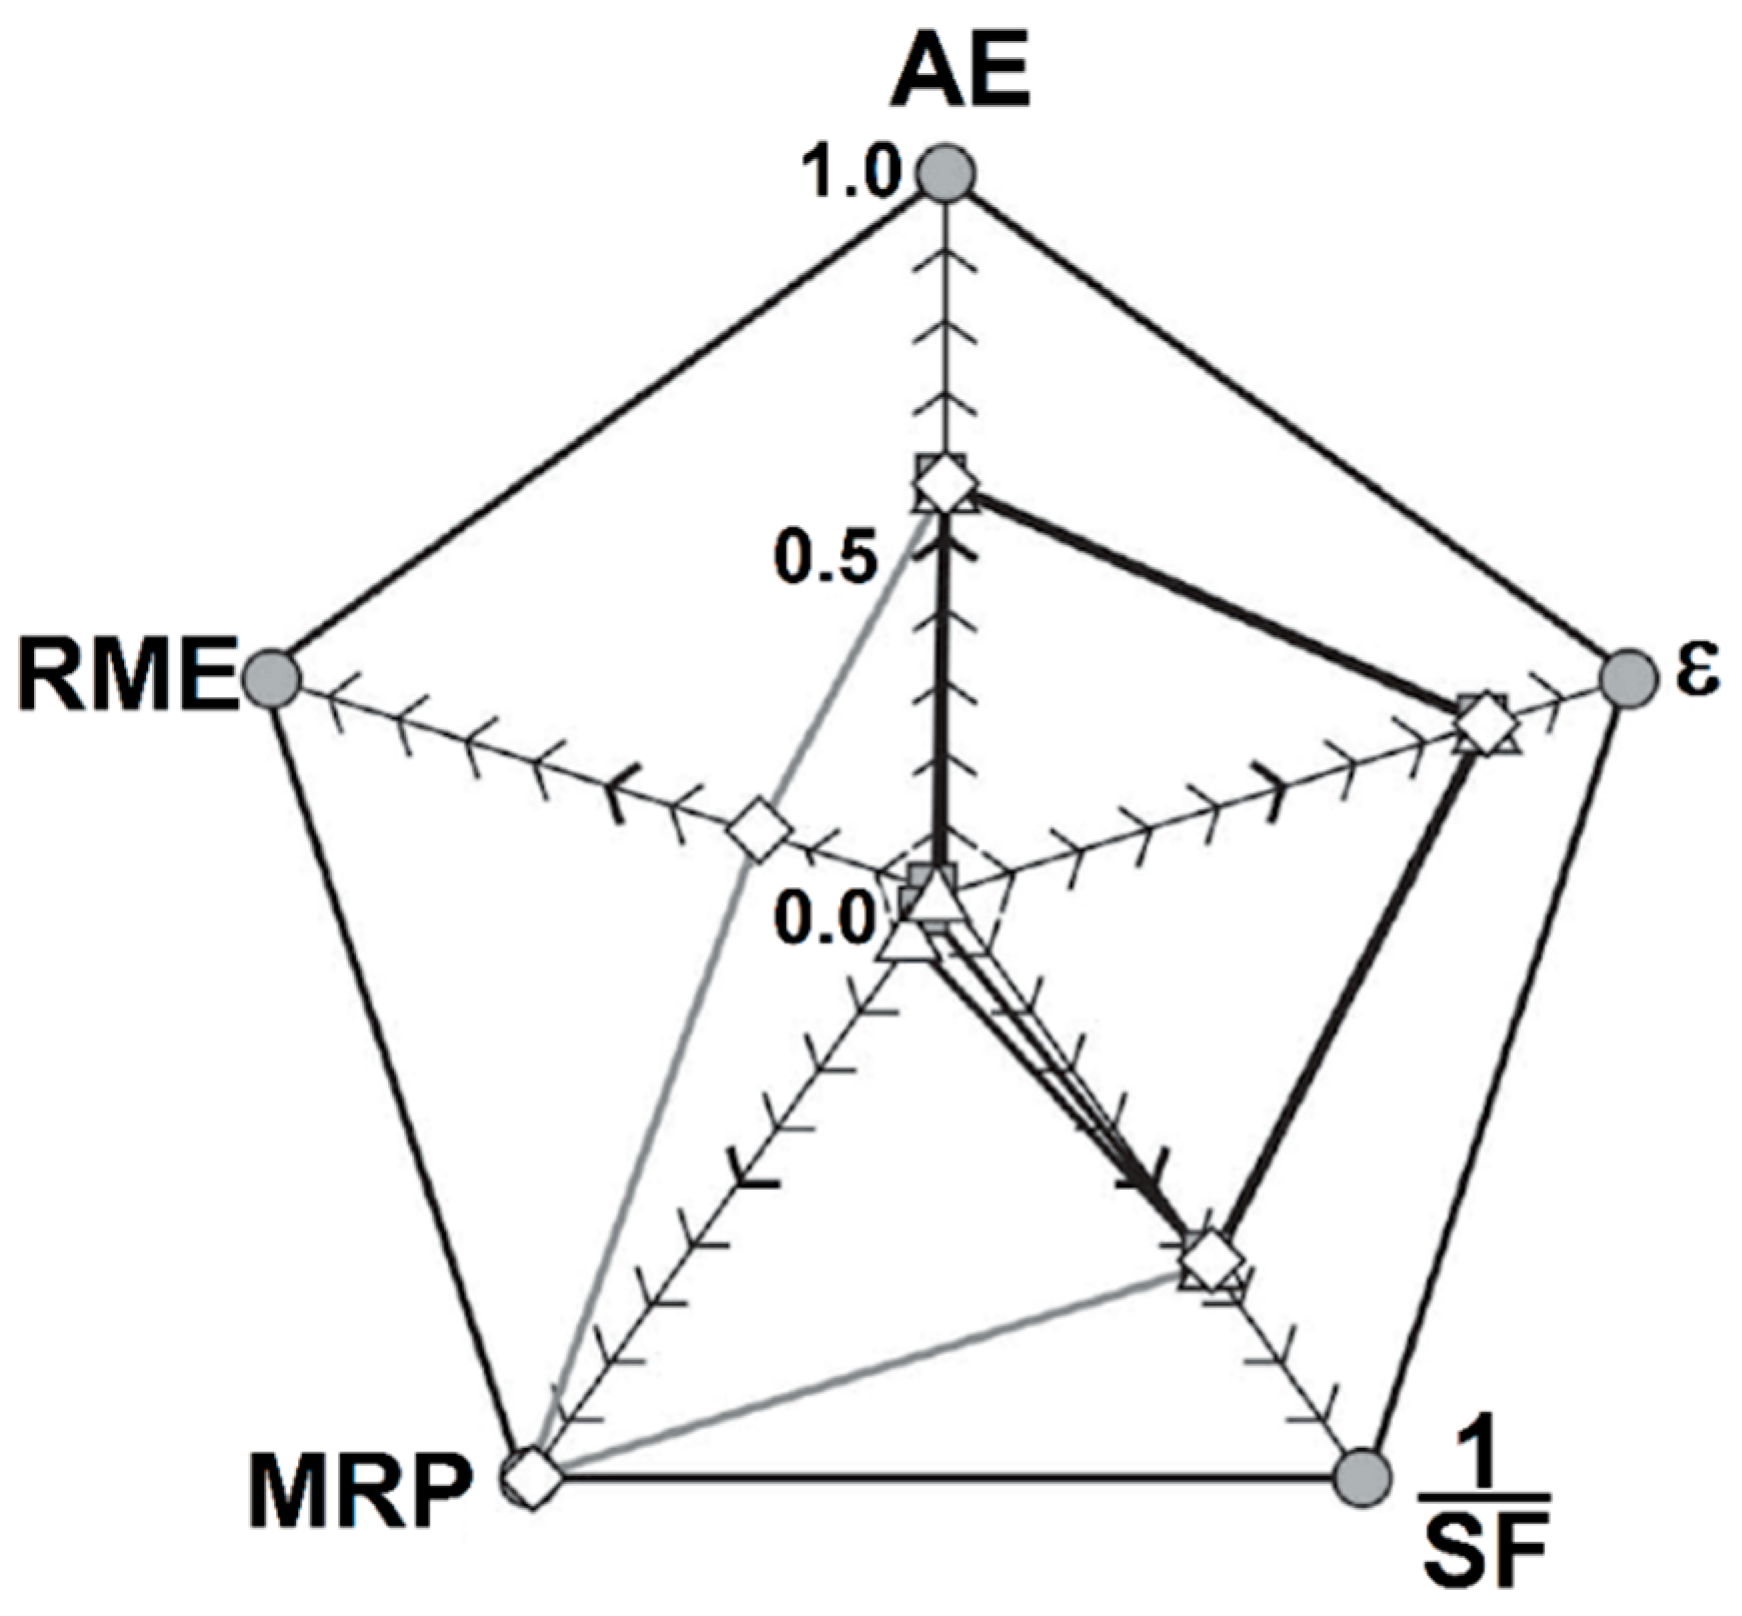
- In 2007, Andraos and Sayed [48] employed a spreadsheet template, shown in Figure 3, to calculate the RME for chemical transformations at the laboratory level. In this sense, the parameters immersed in RME calculation (AE, reaction yield (є), stoichiometric factor (SF), and material recovery parameter (MRP)) are displayed in a radial pentagon. Each axis corresponds to one of five parameters arising from the center with values ranging between 0 and 1, shown in Figure 4. Therefore, the best green condition is caused by a regular pentagon and the worst green situation is represented by the distorted pentagon [71]. Complementarily, an upgrade study, employing a radial hexagon was introduced by Andraos in 2012 [67].
- ii.
- A strategy, coupling both industrial engineering and green chemistry, was performed to determine the environmental impact during the synthesis of silica nanoparticles by sol-gel or flame processes, using as complements the Waste Reduction Algorithm (WAR) and Novel Approach to Imprecise Assessment and Decision Environments (NAIADE) software [63], shown in Figure 5. It is important to note that the employed green chemistry metrics (material procurement, generation of waste, hazardous material, AE, solvent index, and energy efficiency) were employed to determine the environmental impact of three nanoparticles synthesis (HMDSO, flame-TEOS, and sol-gel methods) using the WAR and NAIADE software strategies.
- iii.
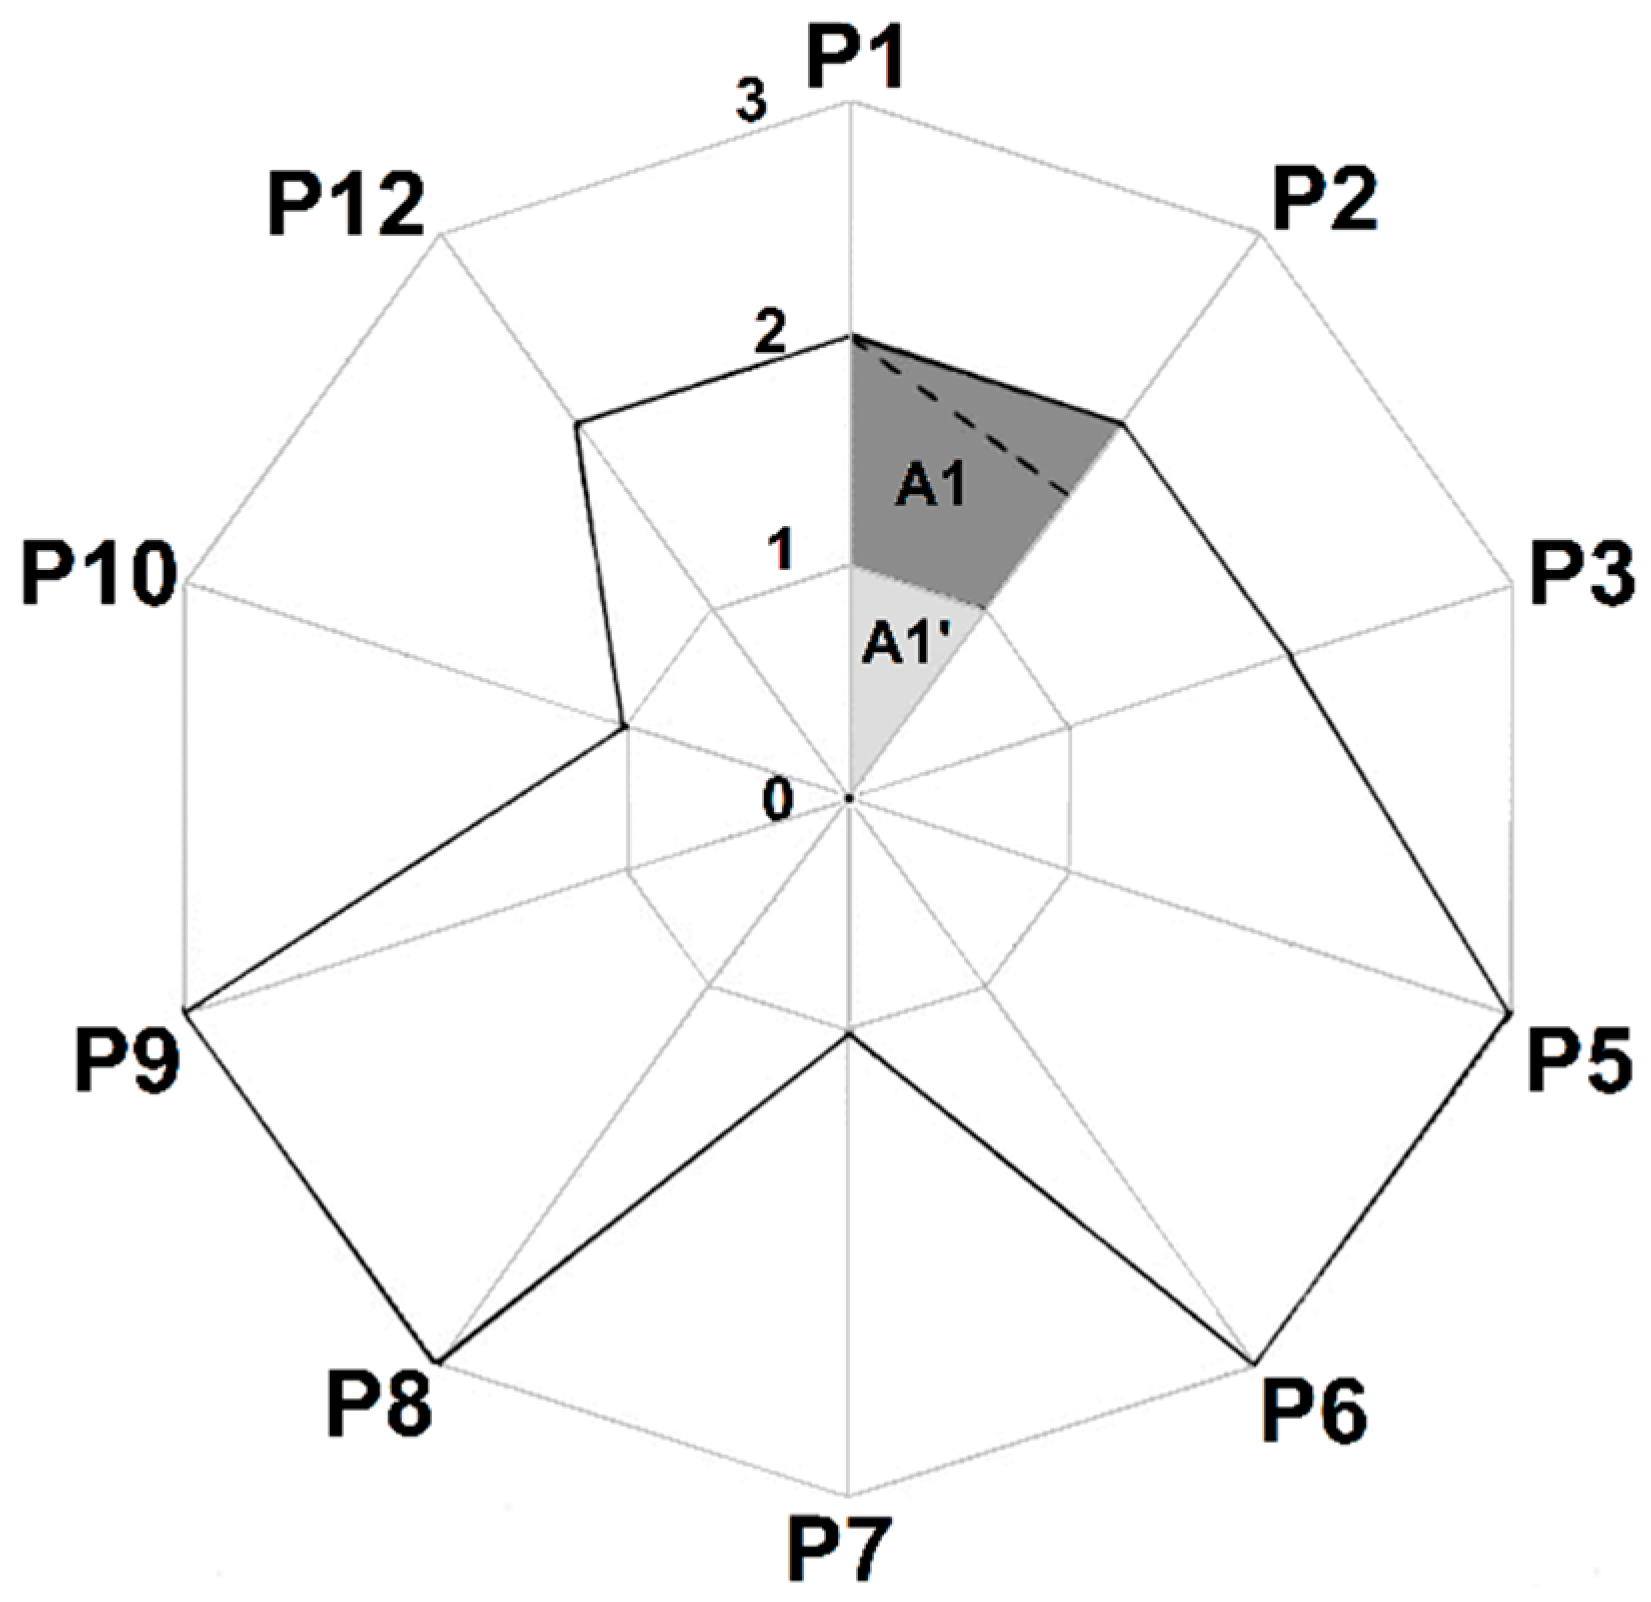
- A semi-quantitative metric to recognize the greenness of a reaction, entitled green star (GC), was developed by Ribeiro in 2010 [72]. The 12 principles are involved, and an Excel radar chart is employed, shown in Figure 6. The scale proposed to establish the greenness of a reaction comprises values from 1 to 3. This approach evaluated the substances involved in a process, considering both the risk to human health and the environment.
- iv.
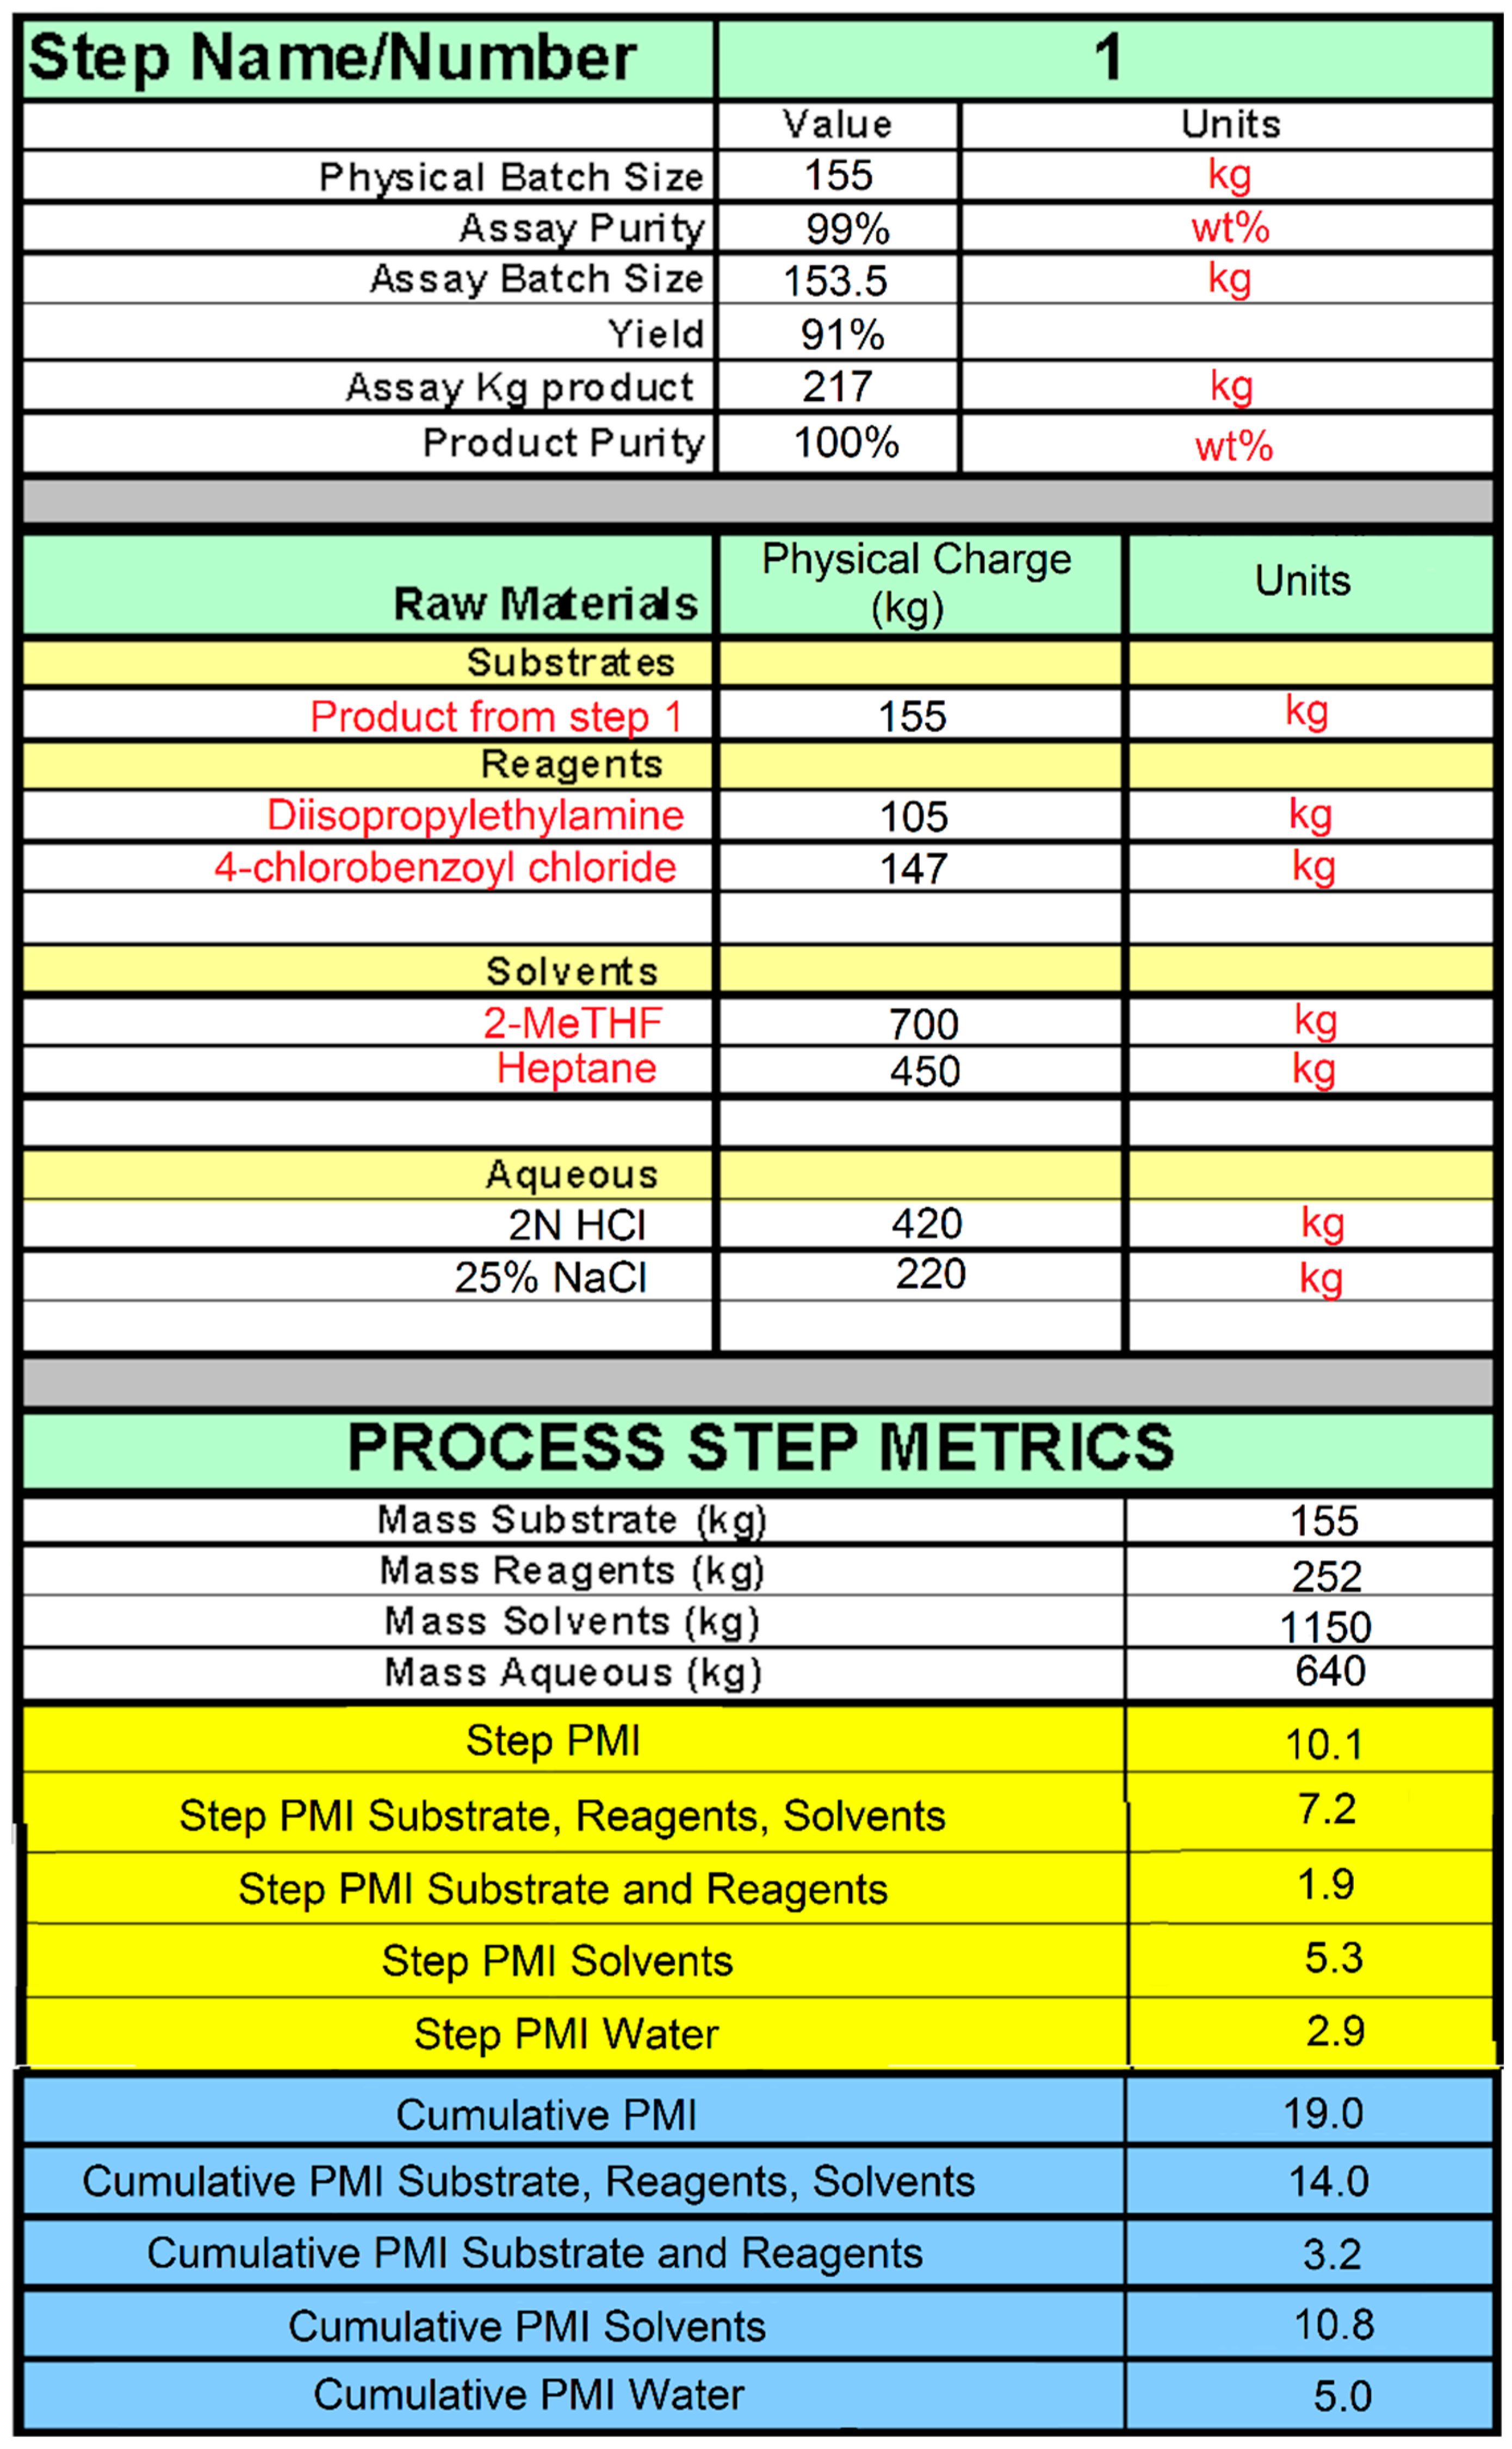
- The PMI implemented by the Roundtable [52,53] as the main mass green metric, at the Pharmaceutical–industrial level since 2011 has a novel version known as the PMI-spreadsheet calculator tool, shown in Figure 7. It was developed by Merck to recognize the process mass intensity across the entire pharmaceutical supply chain. This procedure involves the substrates, reagents, and solvents, among other stages in the API’s development [52]. It must be mentioned that this tool has been accomplished with LCA to know the environmental impact, but it is essential to remark that the LCA data are unavailable for many solvents; consequently, some features of nearest solvent are necessary.
- v.
- To measure the health, safety, and environmental impacts for the flavor and fragrance industry, the GREEN MOTIONTM metric tool was established [73]. It is a simple and quantitative method; however, it displays several limitations, such as the lack of the analysis of manufacturing processes and that the penalty points (0–100) were arbitrarily selected by the authors. The core of this metric are seven concepts: raw material, solvent, hazard and toxicity of the reagents, reaction, process, hazard and toxicity of the final products, and waste. It was created by a simple answer (yes or no) from a total of 100 points; for each question answered with negative impacts, penalty points are subtracted.
- vi.
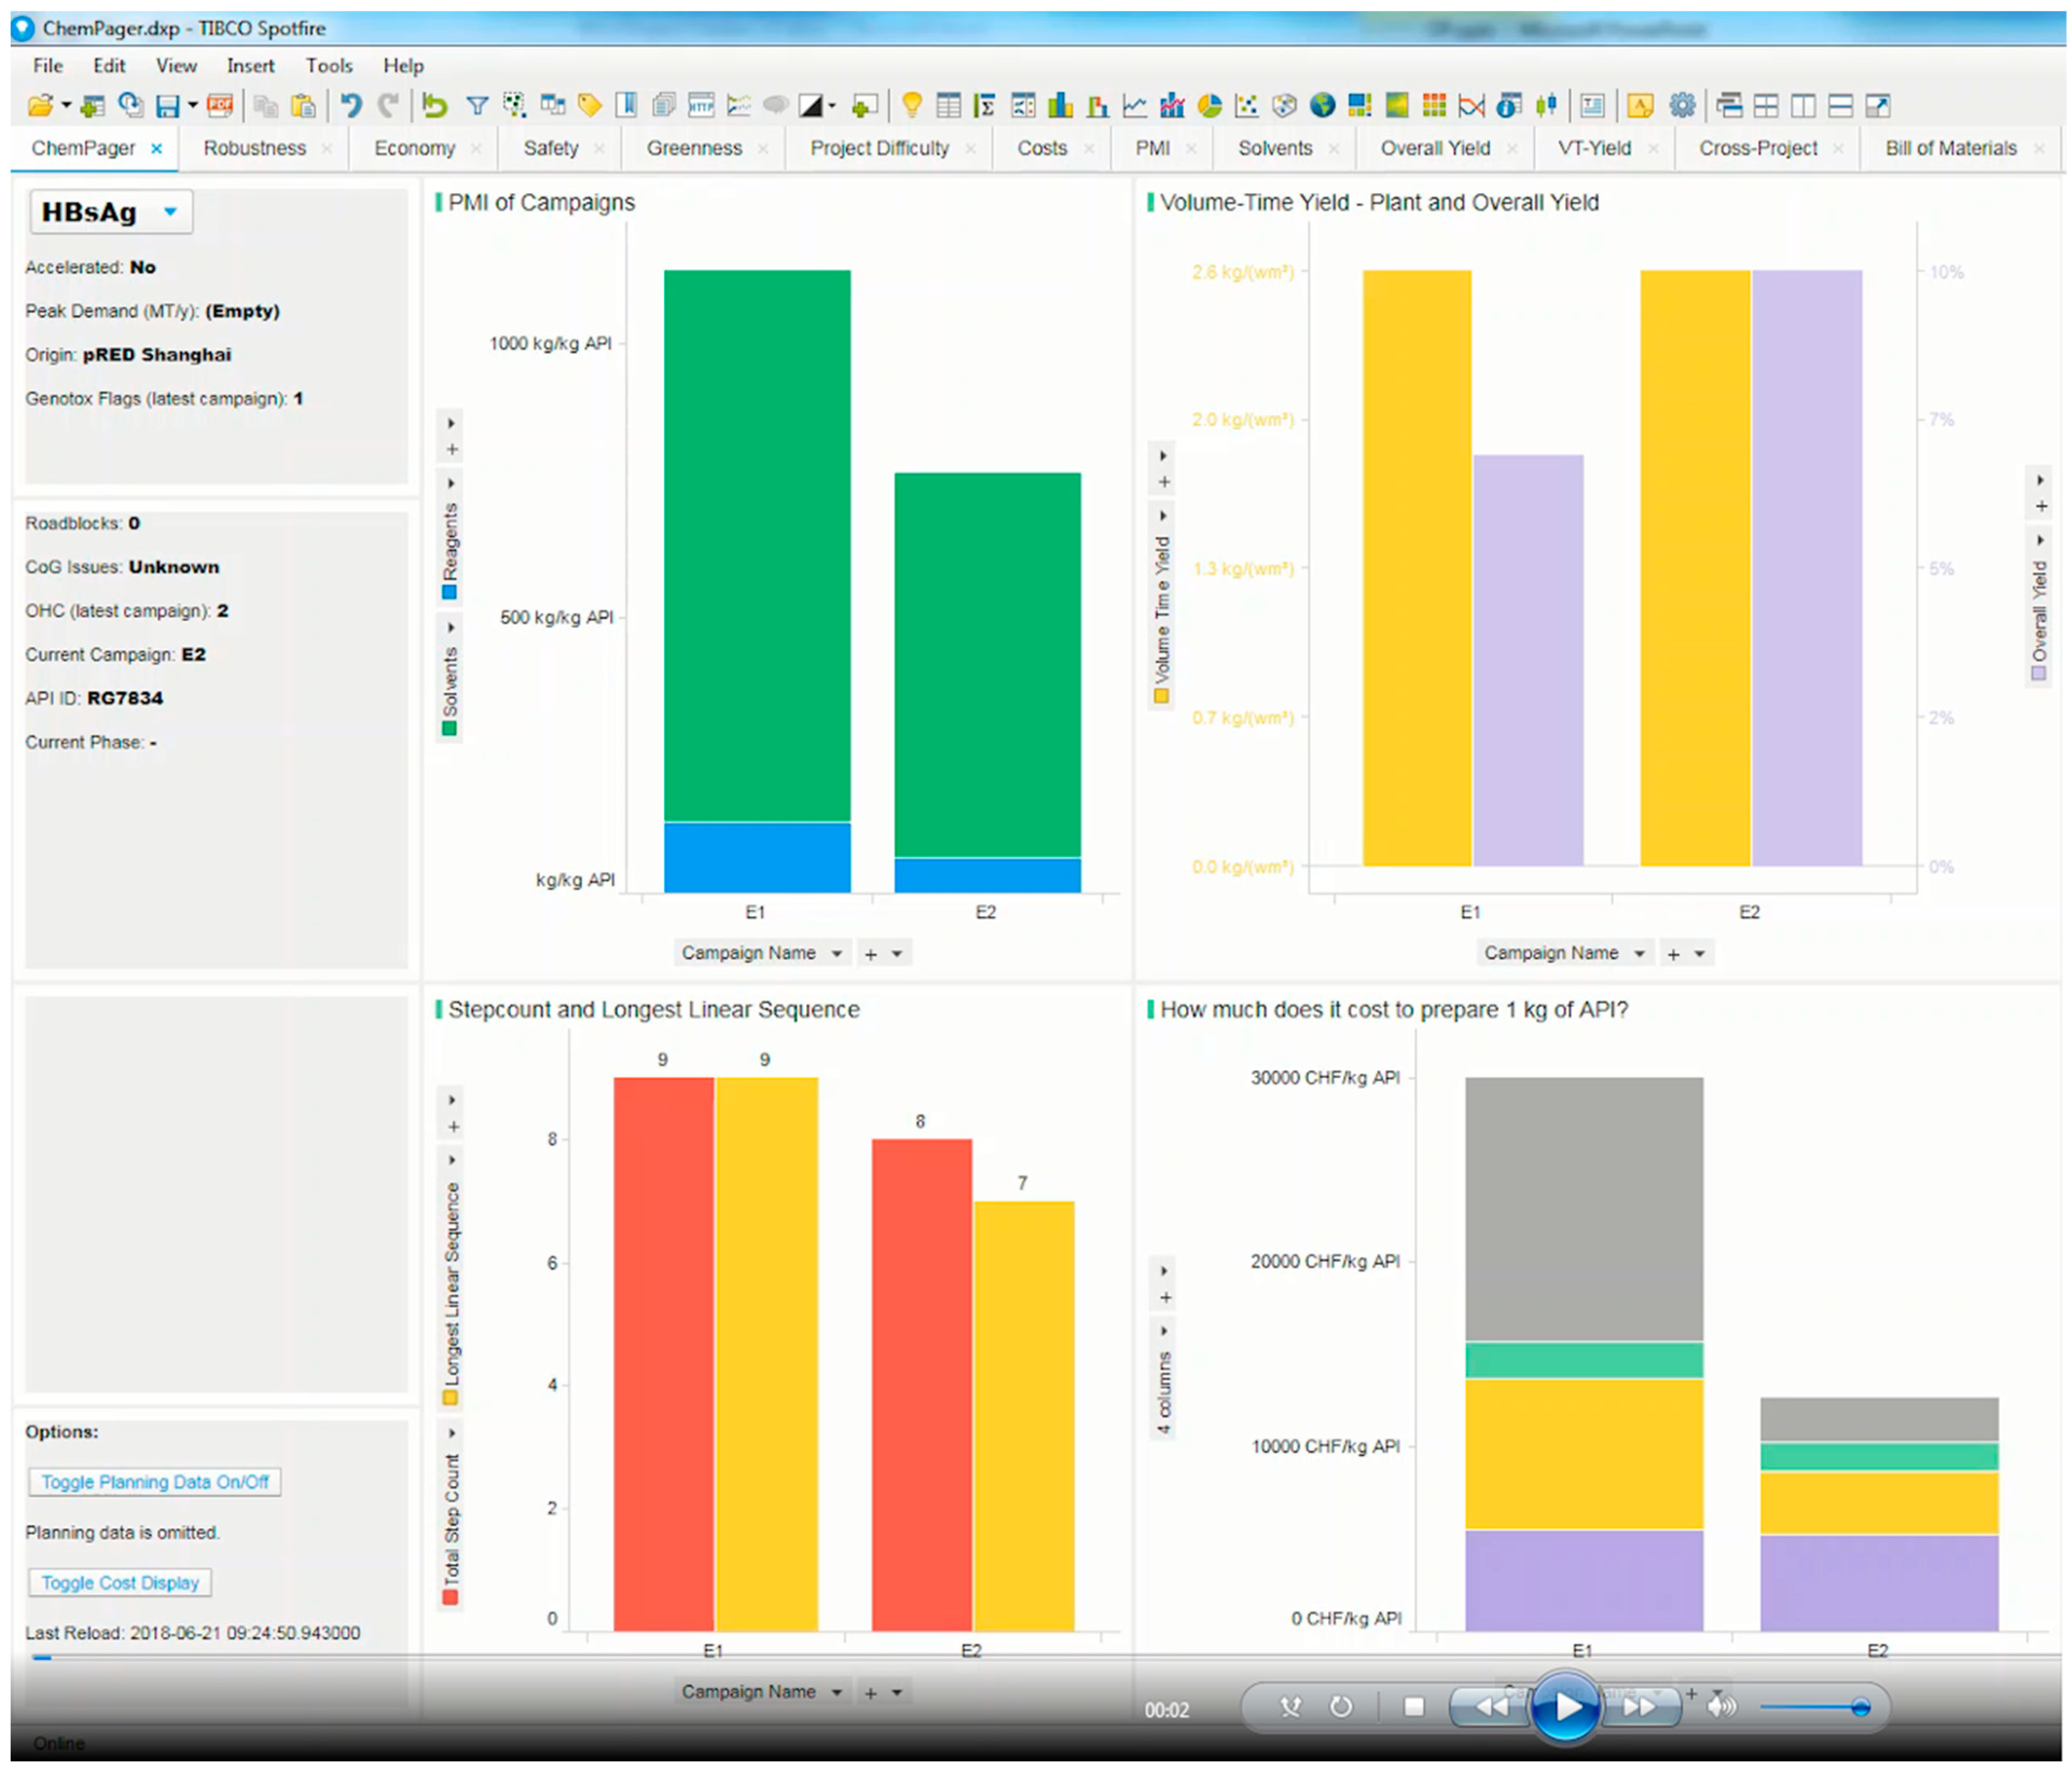
- Recently, both the ChemPager tool [74] and an improved version [75] were launched, based on Google sheets or an Excel spreadsheet, and Tibco Spotfire platform for the required visualization. The convenient use of this tool offers appropriate summarized information of the valued project; consequently, the assistant chemist could conveniently review the process to make a suitable decision. In addition, the ChemPager displays important data of a PMI metric, solvent distribution, production cost, volume-time yield, and a performance score, shown in Figure 8. The data allows distinguishment of the variability of the process, if any component is changed, for example, the equivalents of catalyst in a batch process.
- vii.
- The use of “big data” to determine the hazard and risk of the chemicals has been important in silico tools to know their toxicology. In this sense, several data sources (ECHA, ToxCast, HSDB, and ACToR) display, for more than 1000 chemicals, their toxicological features to elucidate the molecular mechanism of toxicity. Moreover, some computational approaches have been applied: Ecosar calculates the physical properties and the potential ecotoxicity values, OncoLogic predicts the cancer hazard, the Scivera approach uses curated data to derive scores for individual endpoints, and the Verisk 3E GreenScore methodology displays hazard scores, using logarithmic transformation of raw scientific data [76].
- viii.
- Related to the field of analytical chemistry, a color metric scale has been reported to evaluate any analytical procedure [77], employing an Excel spreadsheet. This tool is based on the three primary colors (red, green, and blue) to define a color scale, proportioning a final evaluating color. In this case, the red color is attributed to the analytical performance, the green color for safety/eco-friendliness, and the blue color for productivity or practical effectiveness. In general, the quantitative range corresponds to 0–100%. In this sense, if the color scale is ≥66.6%, it indicates a satisfying value; if the obtained value is between 33.3% and 66.6%, it is labeled as tolerance range; finally, if the color scale is <33.3%, it indicates a lack of acceptance. In addition, it is important to mention that this metric is assisted using quantitative parameter W (method brilliance) which integrate the three-color scales with different weights and the parameter w (criteria) that can be adjusted according to the situation.
- ix.
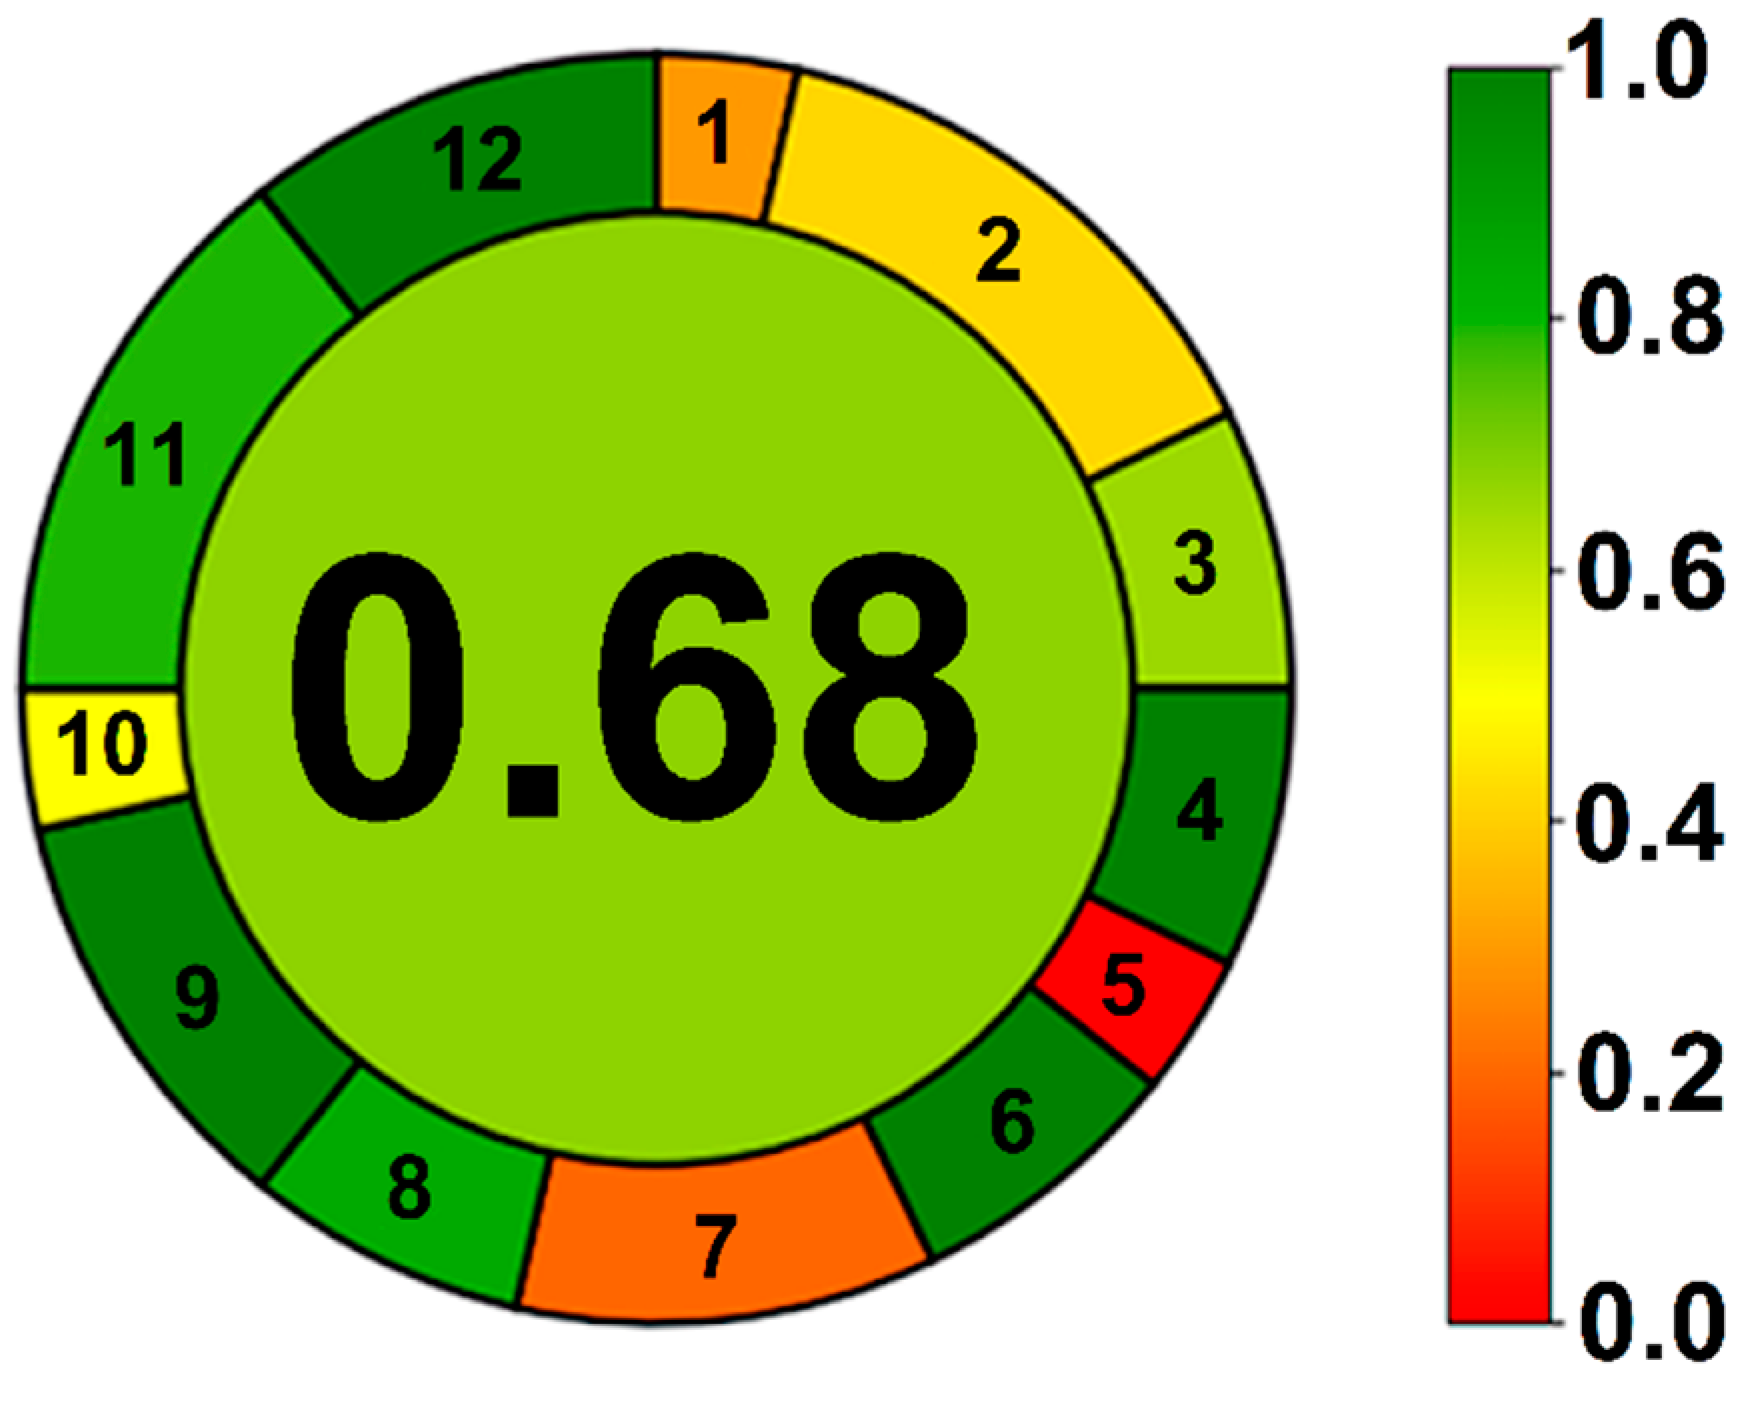
- An interesting green metric tool, entitled AGREE (analytical greenness) software [78], appeared in recent research. It focuses on the 12 principles of green analytical chemistry (GAC), shown in Table S2. In the AGREE metric, a scale of 0–1 is employed, and the result is offered by a pictogram, shown in Figure 9, where the scale values are designated by the user. It is important to note that all 12 principles of GAC have been assigned a scale, from sample treatment (direct input is preferred), the size of the sample, the use of energy (minimized), to the safety of the operator.
- x.
- A convenient update of the above-commented work [70] was recently published (2021) by Płotka-Wasylka and Wojnowski [79]; it was named the Complex Green Analytical Procedure Index (ComplexGAPI). In this work, a pentagram–pictogram, a color scale, and two or three levels of evaluation are employed. Additionally, a hexagon–pictogram was implemented, shown in Figure 10, complementing the evaluation: yield, reagents, solvents, conditions, instrumentation, workup, and purification of the final product.
- xi.
- An interesting study is the application of a multicriteria decision analysis (MCDA) to determine the greenest organic synthesis procedures, employing the TOPSIS algorithm (Technique for Order of Preference by Similarity to Ideal Solution) [80]. This proposal was established with nine criteria: 1. reagent, 2. reaction efficiency, 3. atom economy, 4. temperature, 5. pressure, 6. synthesis time, 7. solvent, 8. catalyst, and 9. reactant. This metric is based on a scale from 0 to 10 points, with the criteria assigned by two experts according to their perception, aided by the material safety data sheets of reagents and reactants and a Globally Harmonized System of classification and labeling of chemicals (GHS), being a more systemic tool because it combines criteria into a final score.
- xii.
- Also related to the GAC area, it is important to highlight that the sample preparation is a main step in the separation of the analyte. In this sense, there was a report of the first work with a metric tool (AGREEprep) [81] that gives importance to sample preparation. It was fashioned considering 10 categories, based on the principles of the green sample preparation, shown in Table S3 [82]. It is also employed a scale subscore from 0 to 1, with a further final qualitative calculation score. The result is visualized by mean of a colorful pictogram with the final evaluation value, localized inside a colored circle in the center of the pictogram, displaying the overall sample preparation greenness performance, Figure 11.
3.4. Global Metrics
- i.
- A metric labelled as Eco-Scale, planned by Van Aken et al. [83], uses a scale from 0 to 100, with 100 the value for an ideal reaction and, consequently, 0 indicates a failed reply. The assigned value is based on outcomes that consider six parameters: yield, price of reaction components, safety, technical configuration, temperature/time, treatment and purification, shown in Table 4. It is important to note that each parameter comprises individual cumulative penalty points. The corresponding analyses are straightforward given that all important parameters are transparent (it is clear how the final score is obtained), are fast, can be calculated in less than 5 min, and do not take a general standpoint but consider advantages and disadvantages of specific methodologies or auxiliary reagents, in addition to offering a general overview of the reaction conditions.
- ii.
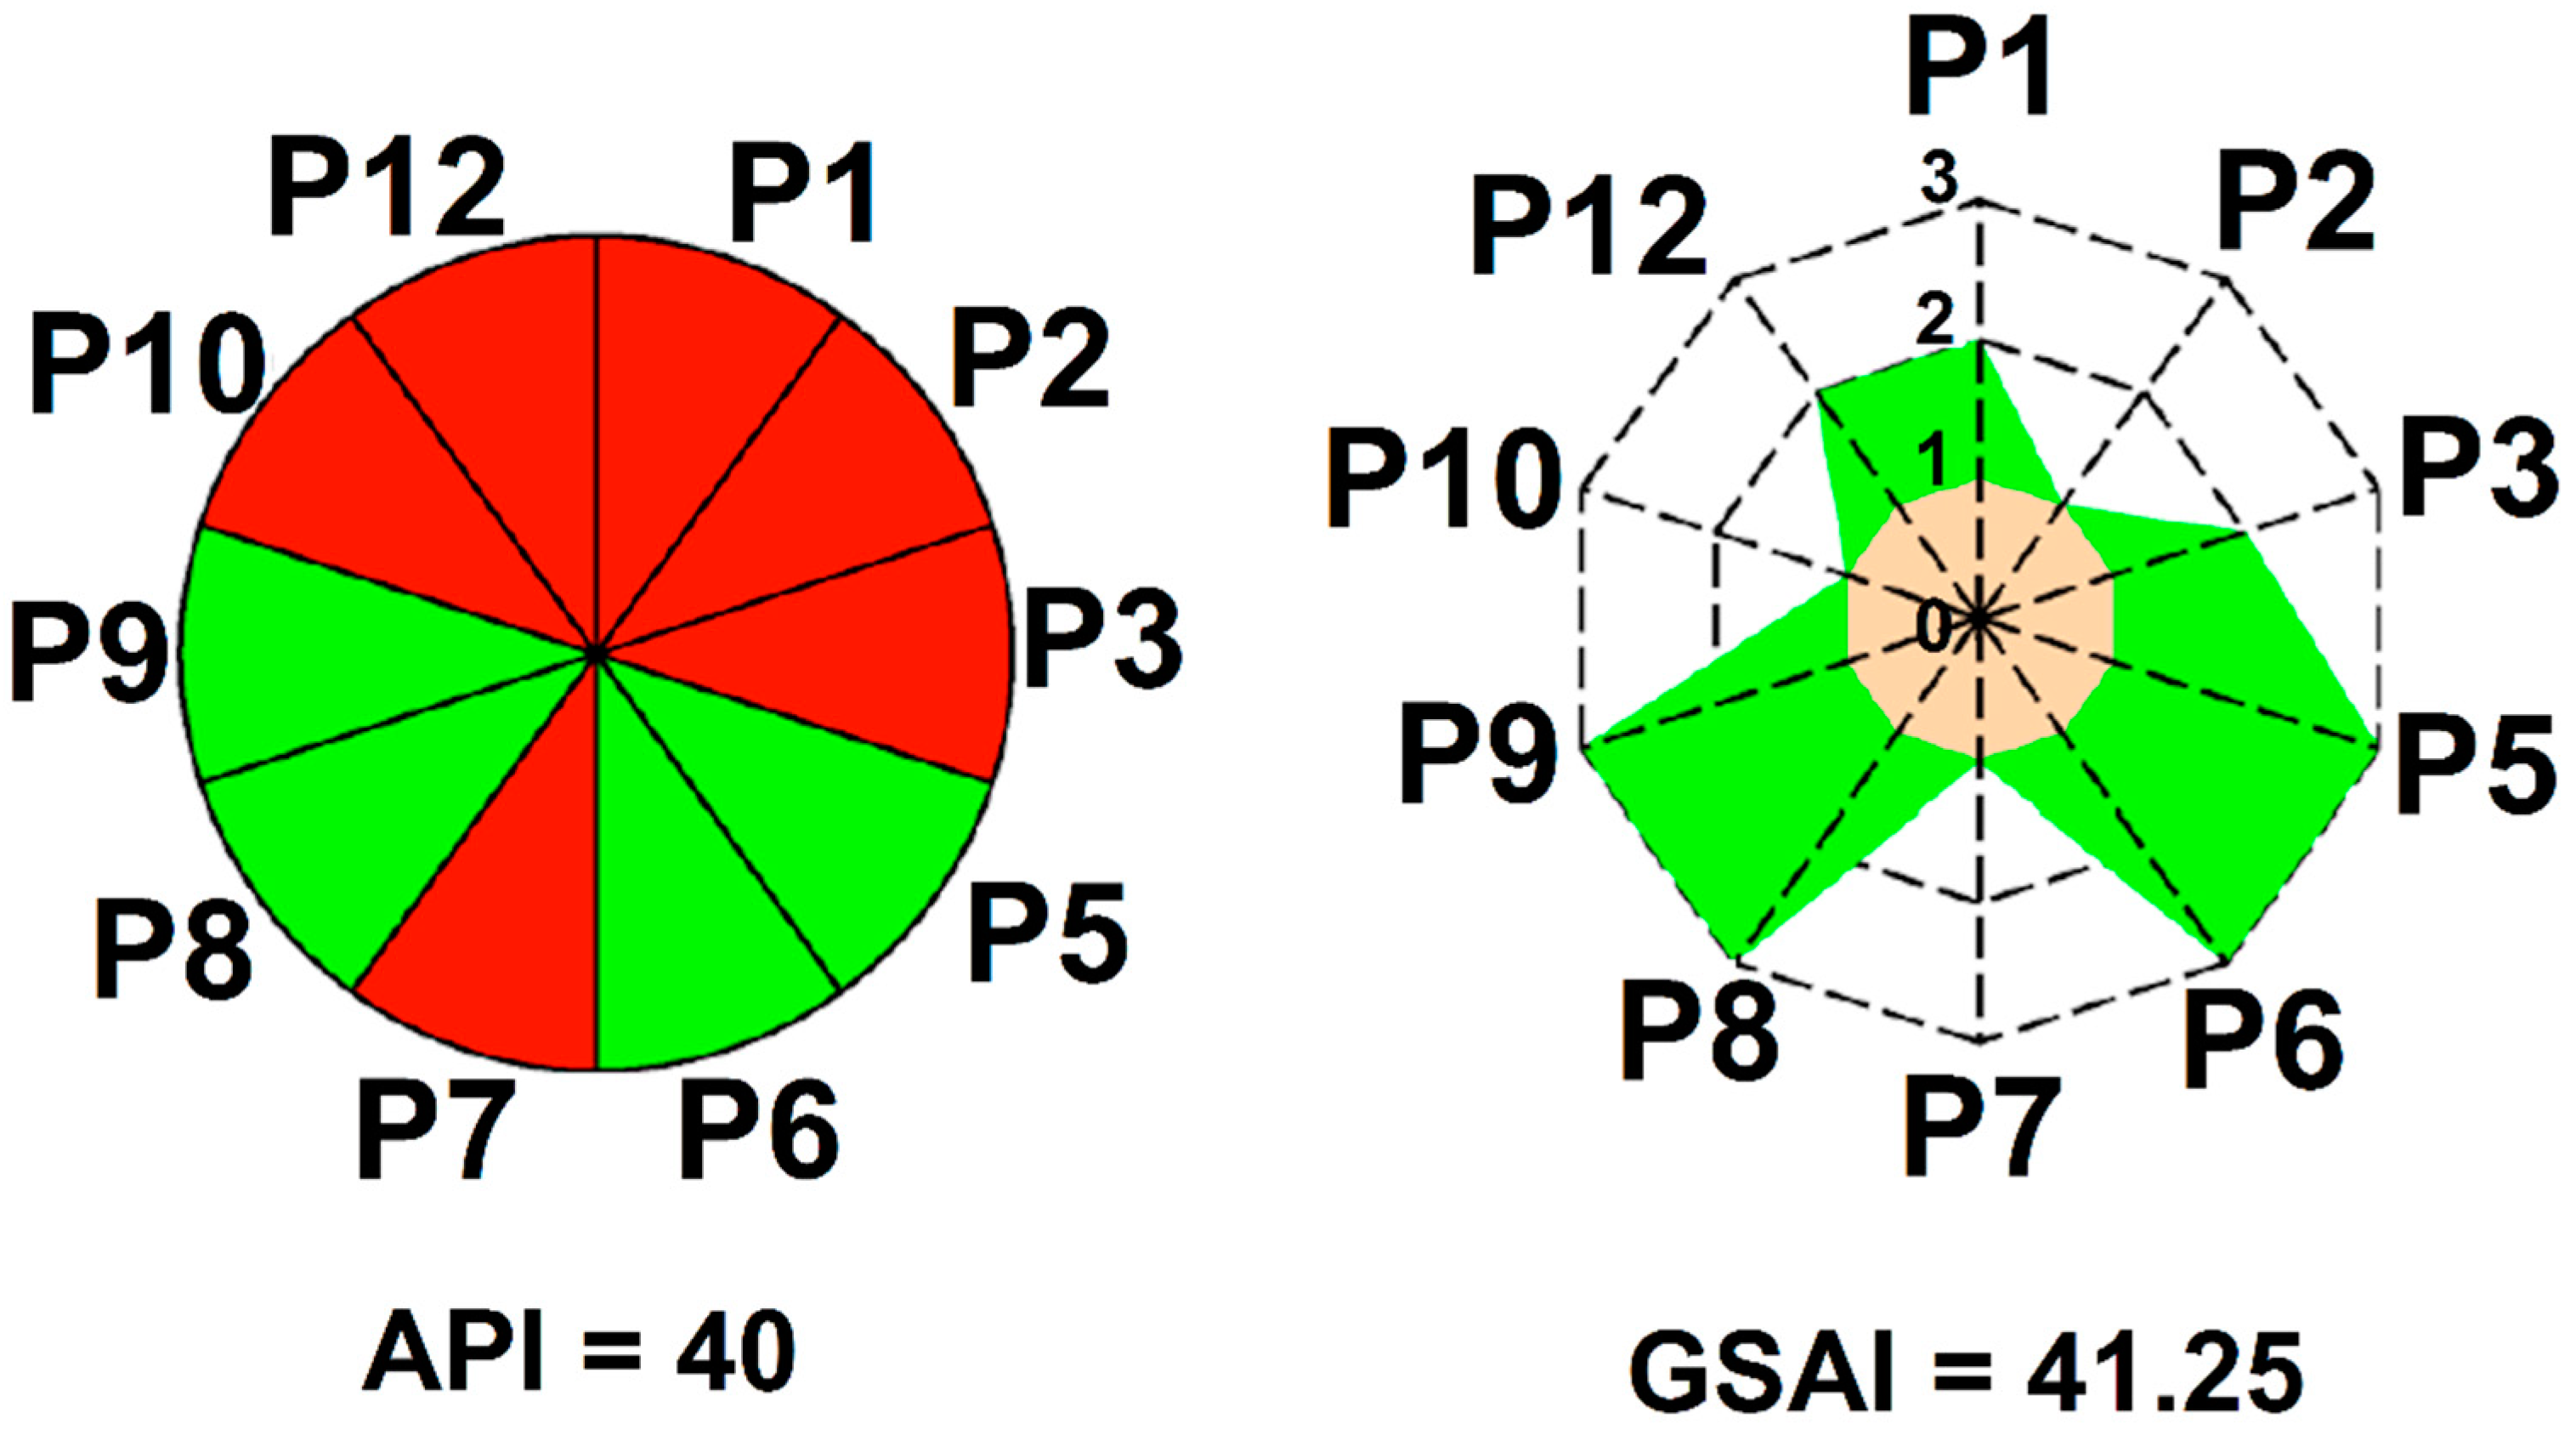
- In 2010, an interesting semi-quantitative metric entitled Green Star (GS) was reported [72,84]. According to the authors, this graphical metric helps decide the most acceptable reaction, considering the 12 principles. The graphical metric consists of a star, with each corner associated with one of the 12 principles, shown in Figure 6, linking a punctuation from 1 to 3, according to the risks for both human health and the environment. This is in addition to pondering chemical accidents, and degradability and renewability of the substances involved; moreover, combining mass metrics (yield %, MI, AE, EF, and RME). Consequently, this metric offers a visual analysis, allowing the optimization of the process by inspection, to improve the greenness of the process. However, it is important to highlight that the fourth and eleventh principles are not considered.In the same context, two other semi-quantitative metrics were settled: the green circle (GrC) and the green matrix [85,86]. In this case, the GrC, shown in Figure 12, is divided in 12 sections. Each section is colored according to its agreement with a particular principle, allowing the identification of those features that can be improved which, in the case of the green matrix, are considered the strengths and weaknesses, and the advantages and disadvantages, of a chemical process.
- iii.
- An update of the previously discussed metrics was reported in 2014 by Ribeiro et al. [87]. In this case, the use of both GS and GrC in conjunction with GHS was offered, displaying advantages such as a more systemic assessment of the hazards of chemicals for use in evaluation criteria and increased contact with GHS in the laboratory context.
- iv.
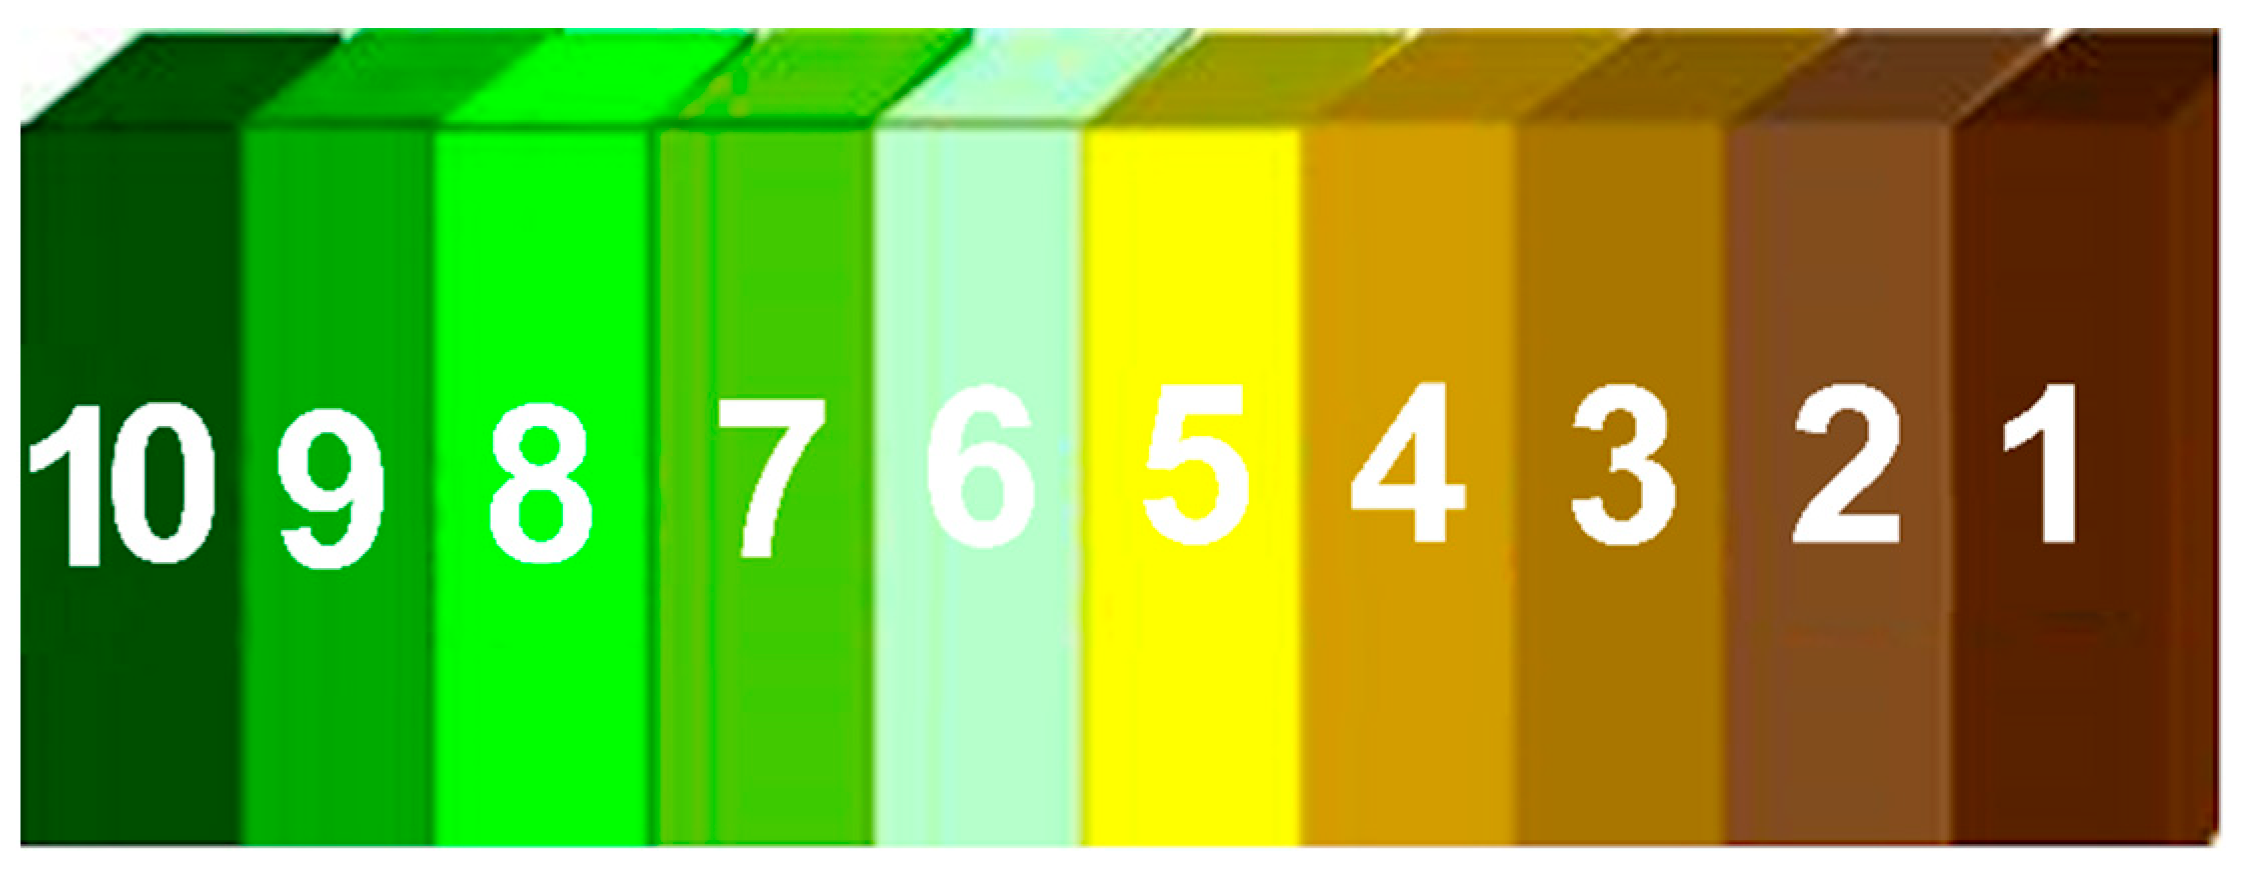
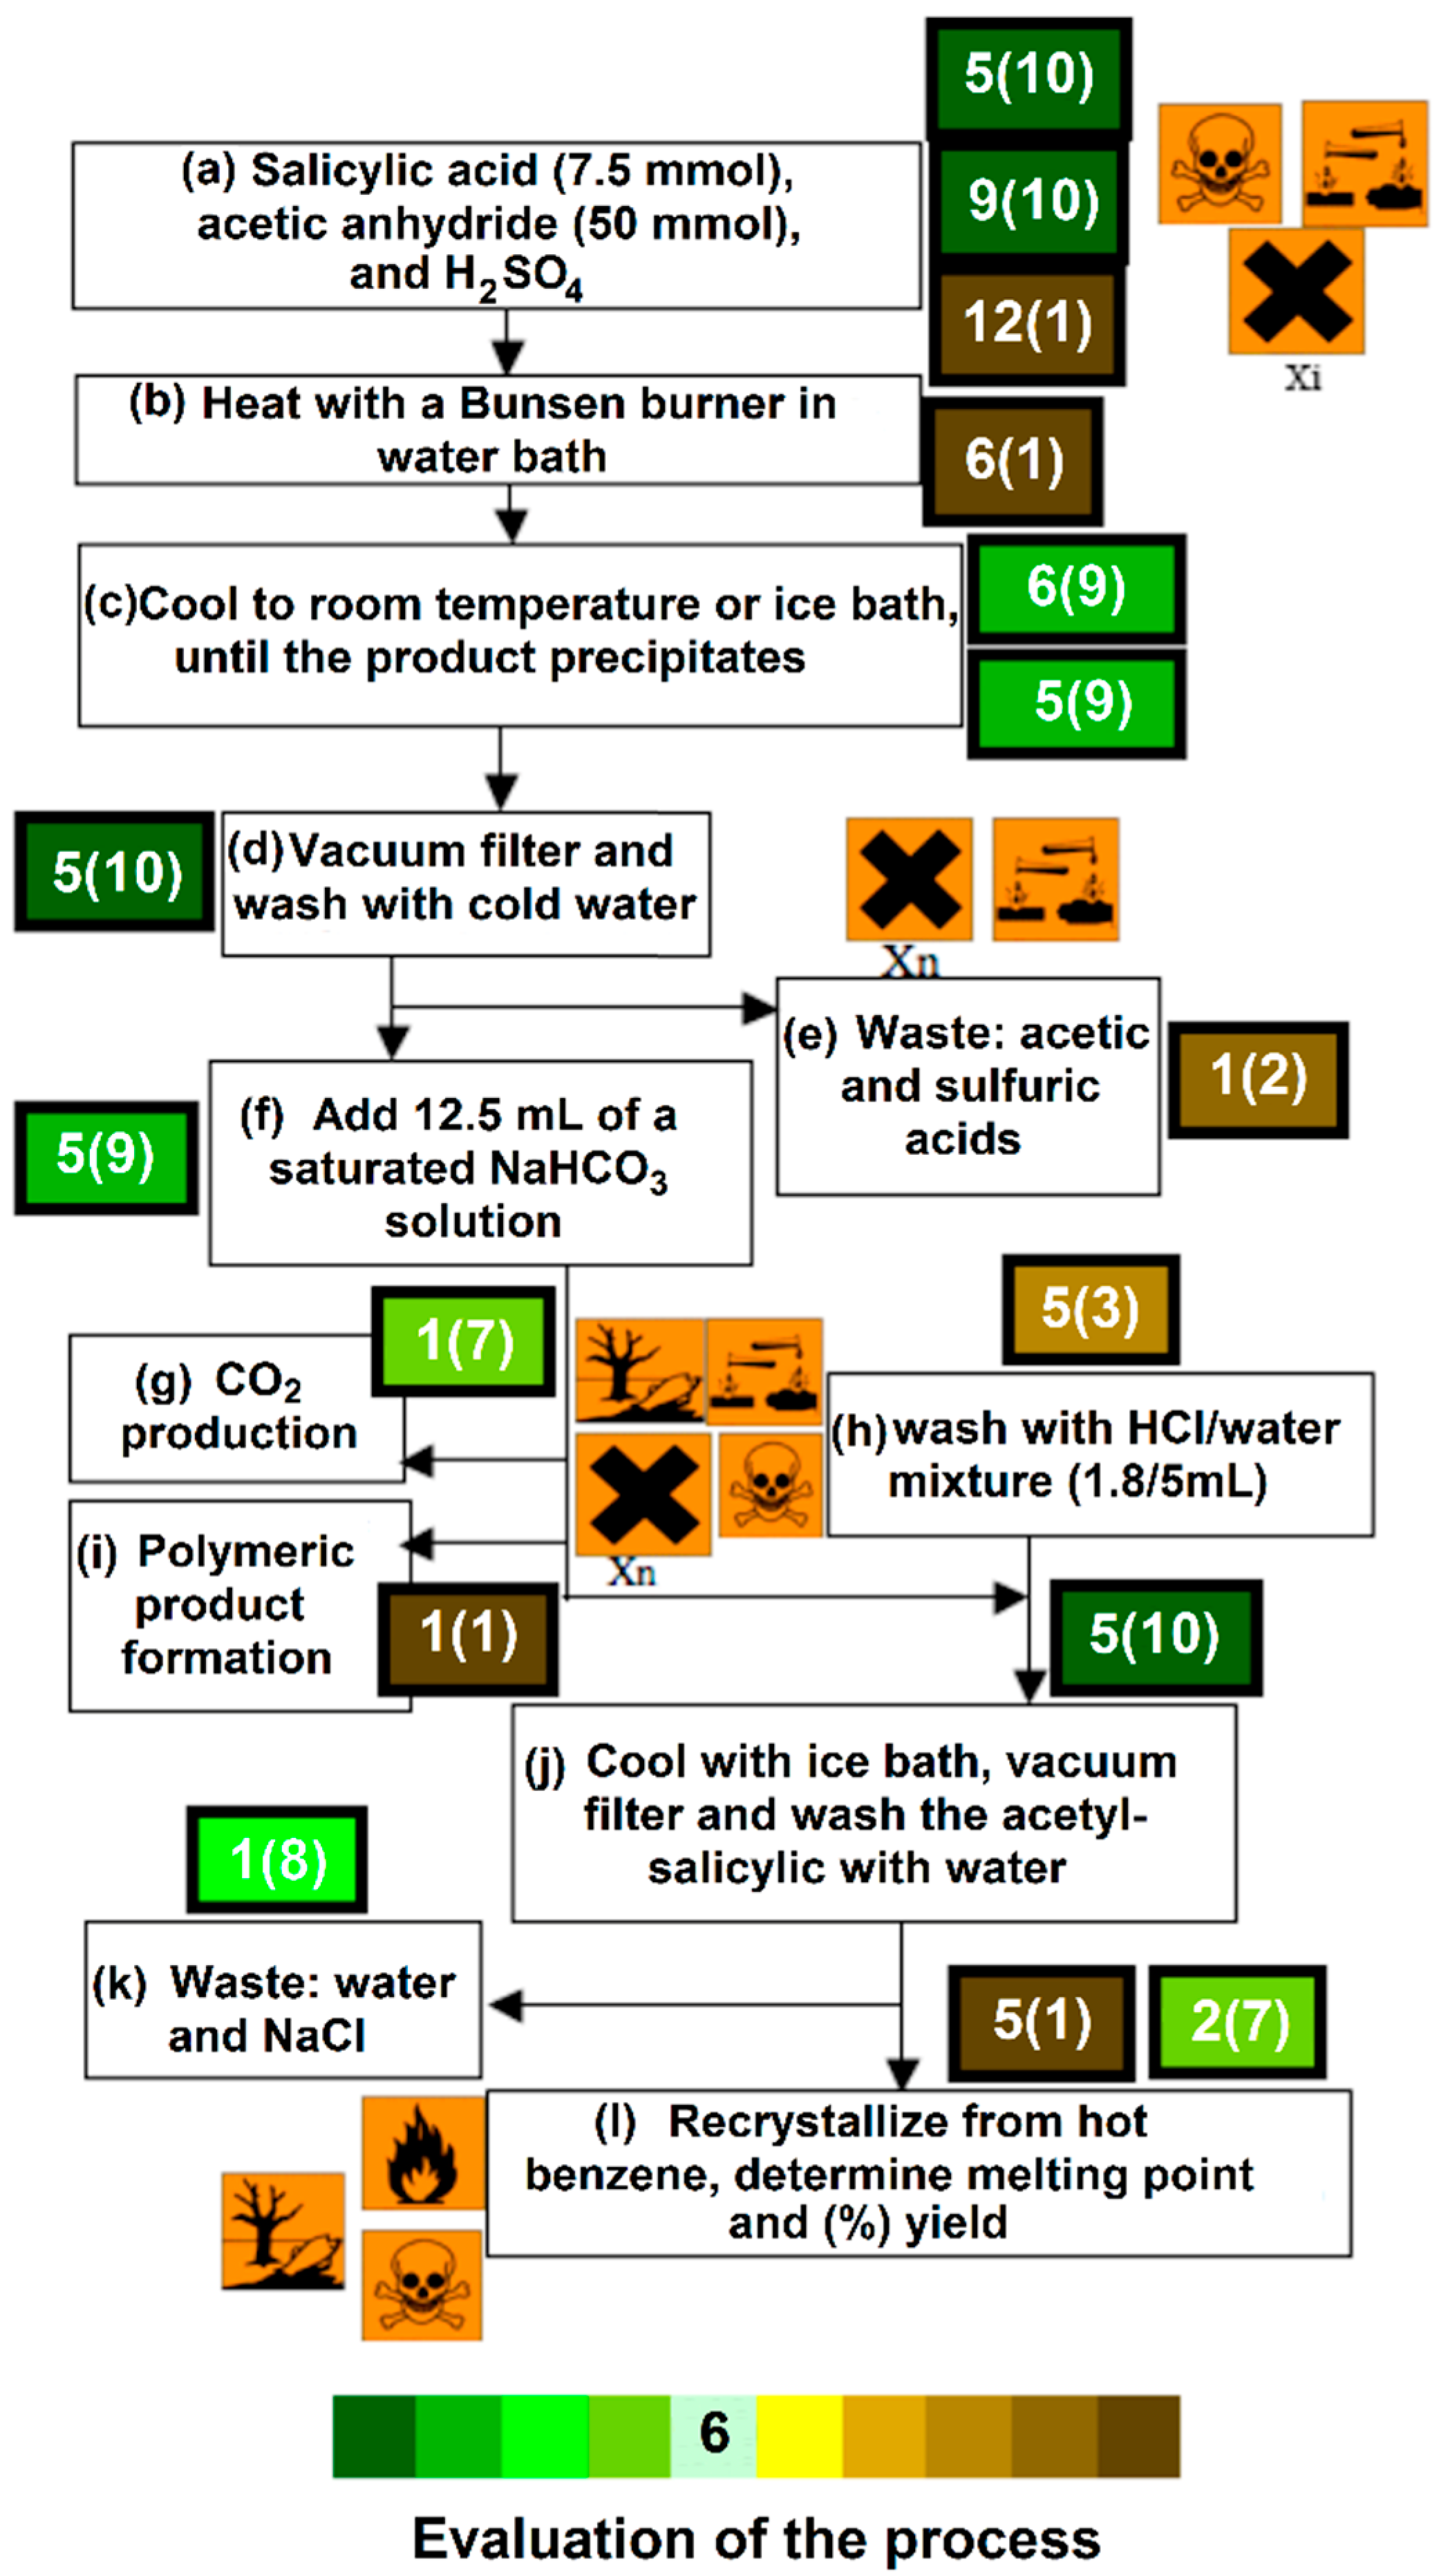
- In 2011, an interesting hybrid tool to evaluate experimental procedures related to green chemistry was reported [21]. In this concern, a green metric pondering all 12 principles of the GC was presented. This approach is qualitative by means of a color code and semi-quantitative by using a Likert-type scale: from totally brown (number 1) to completely green (number 10), as shown in Figure 13. As can be seen, clear assignment (increasing vs. diminishing, the green contribution) is offered by considering several green color tones, a yellow color as interface, and the various brown color tones. To complement the green-degree evaluation of a particular process, a flowchart of the complete experimental procedure is displayed, step by step (reaction, isolation, and purification of a product), as illustrated in Figure 14. It is important to note that health and safety pictograms of reagents and solvents are also considered during the evaluation. Each principle is considered in every step (step by step), with the corresponding value score placed in parentheses linking the involved principle by its number in a box color according to the green intensity assigned to the corresponding experimental step. The concluding greenness value is the average result of all the steps judged in the entire experimental procedure.
- v.
- In 2013, Ref. [89] was launched the iSUSTAIN® tool developed by the chemical industry. It involved the 12 Principles of GC to measure the sustainability of products and processes. The 12 principles are updated and measured using a score range between 0 and 100, with 100 corresponding to the best score. Some principles such as 3, 5, 6, 8, 9, 11, and 12 are evaluated according to the original literature. However, principle 1 is measured by EF, principle 2 by reaction mass efficiency, principle 4 is a mixed metric (aquatic toxicity and human toxicity), principle 7 is the sum of the weight of renewable raw materials in a product per weight of the product, and principle 10 is measured by actual experimental data. This approach aids researchers to improve a product, since they can detect the stage with the lowest score in the process and consequently make further modifications, contributing to generating better sustainability for a particular product.
- vi.
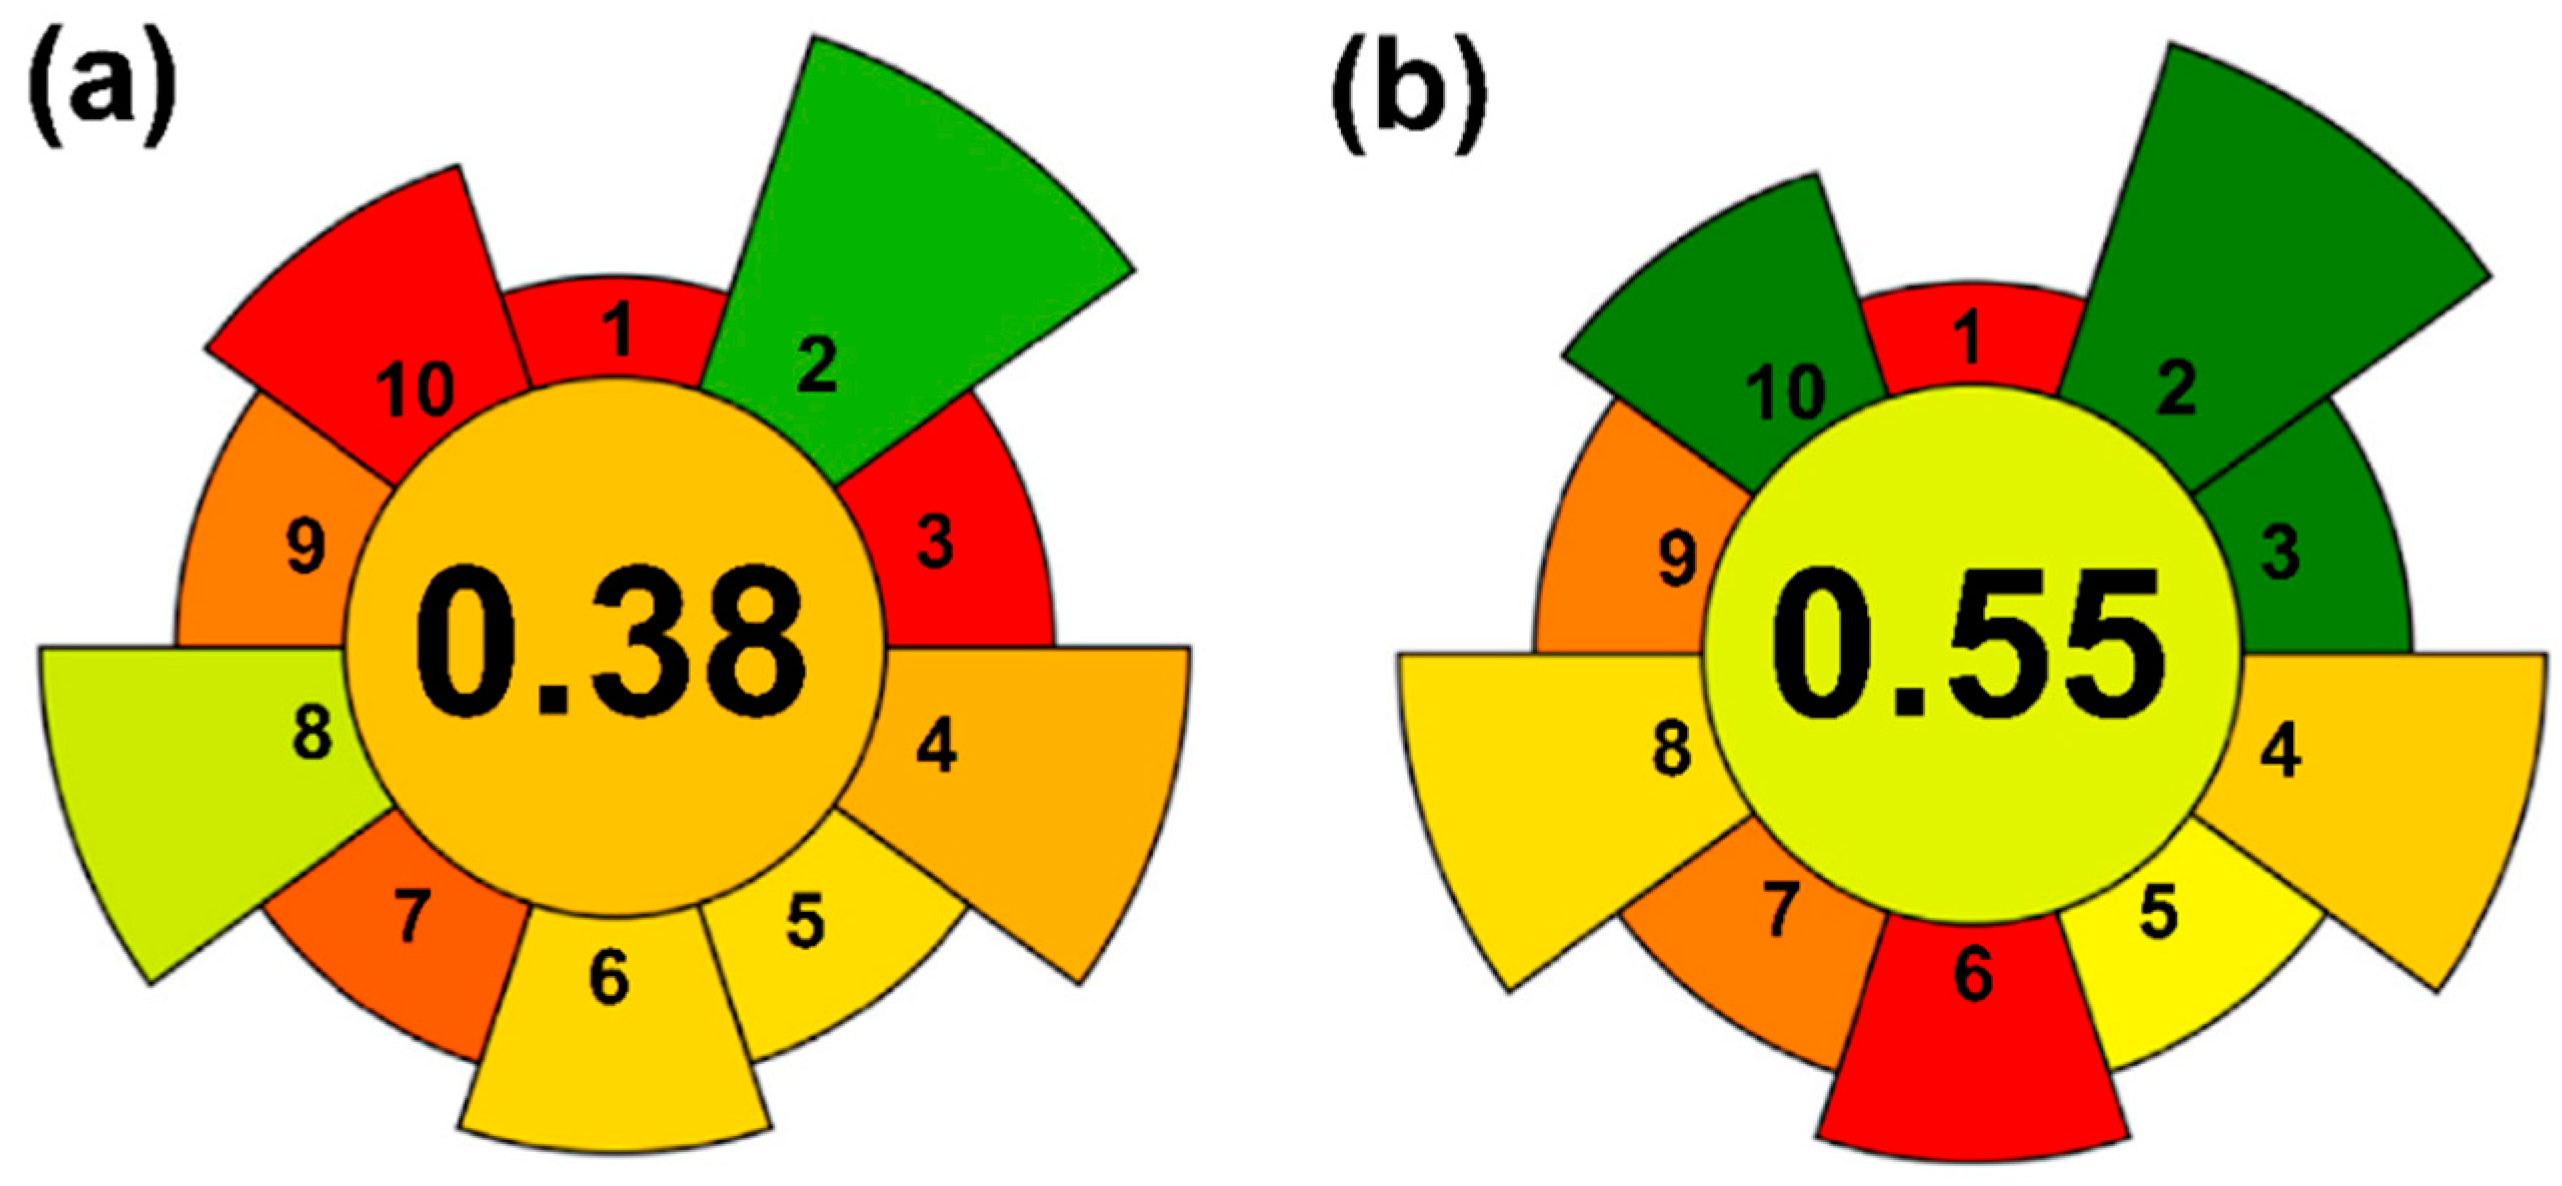
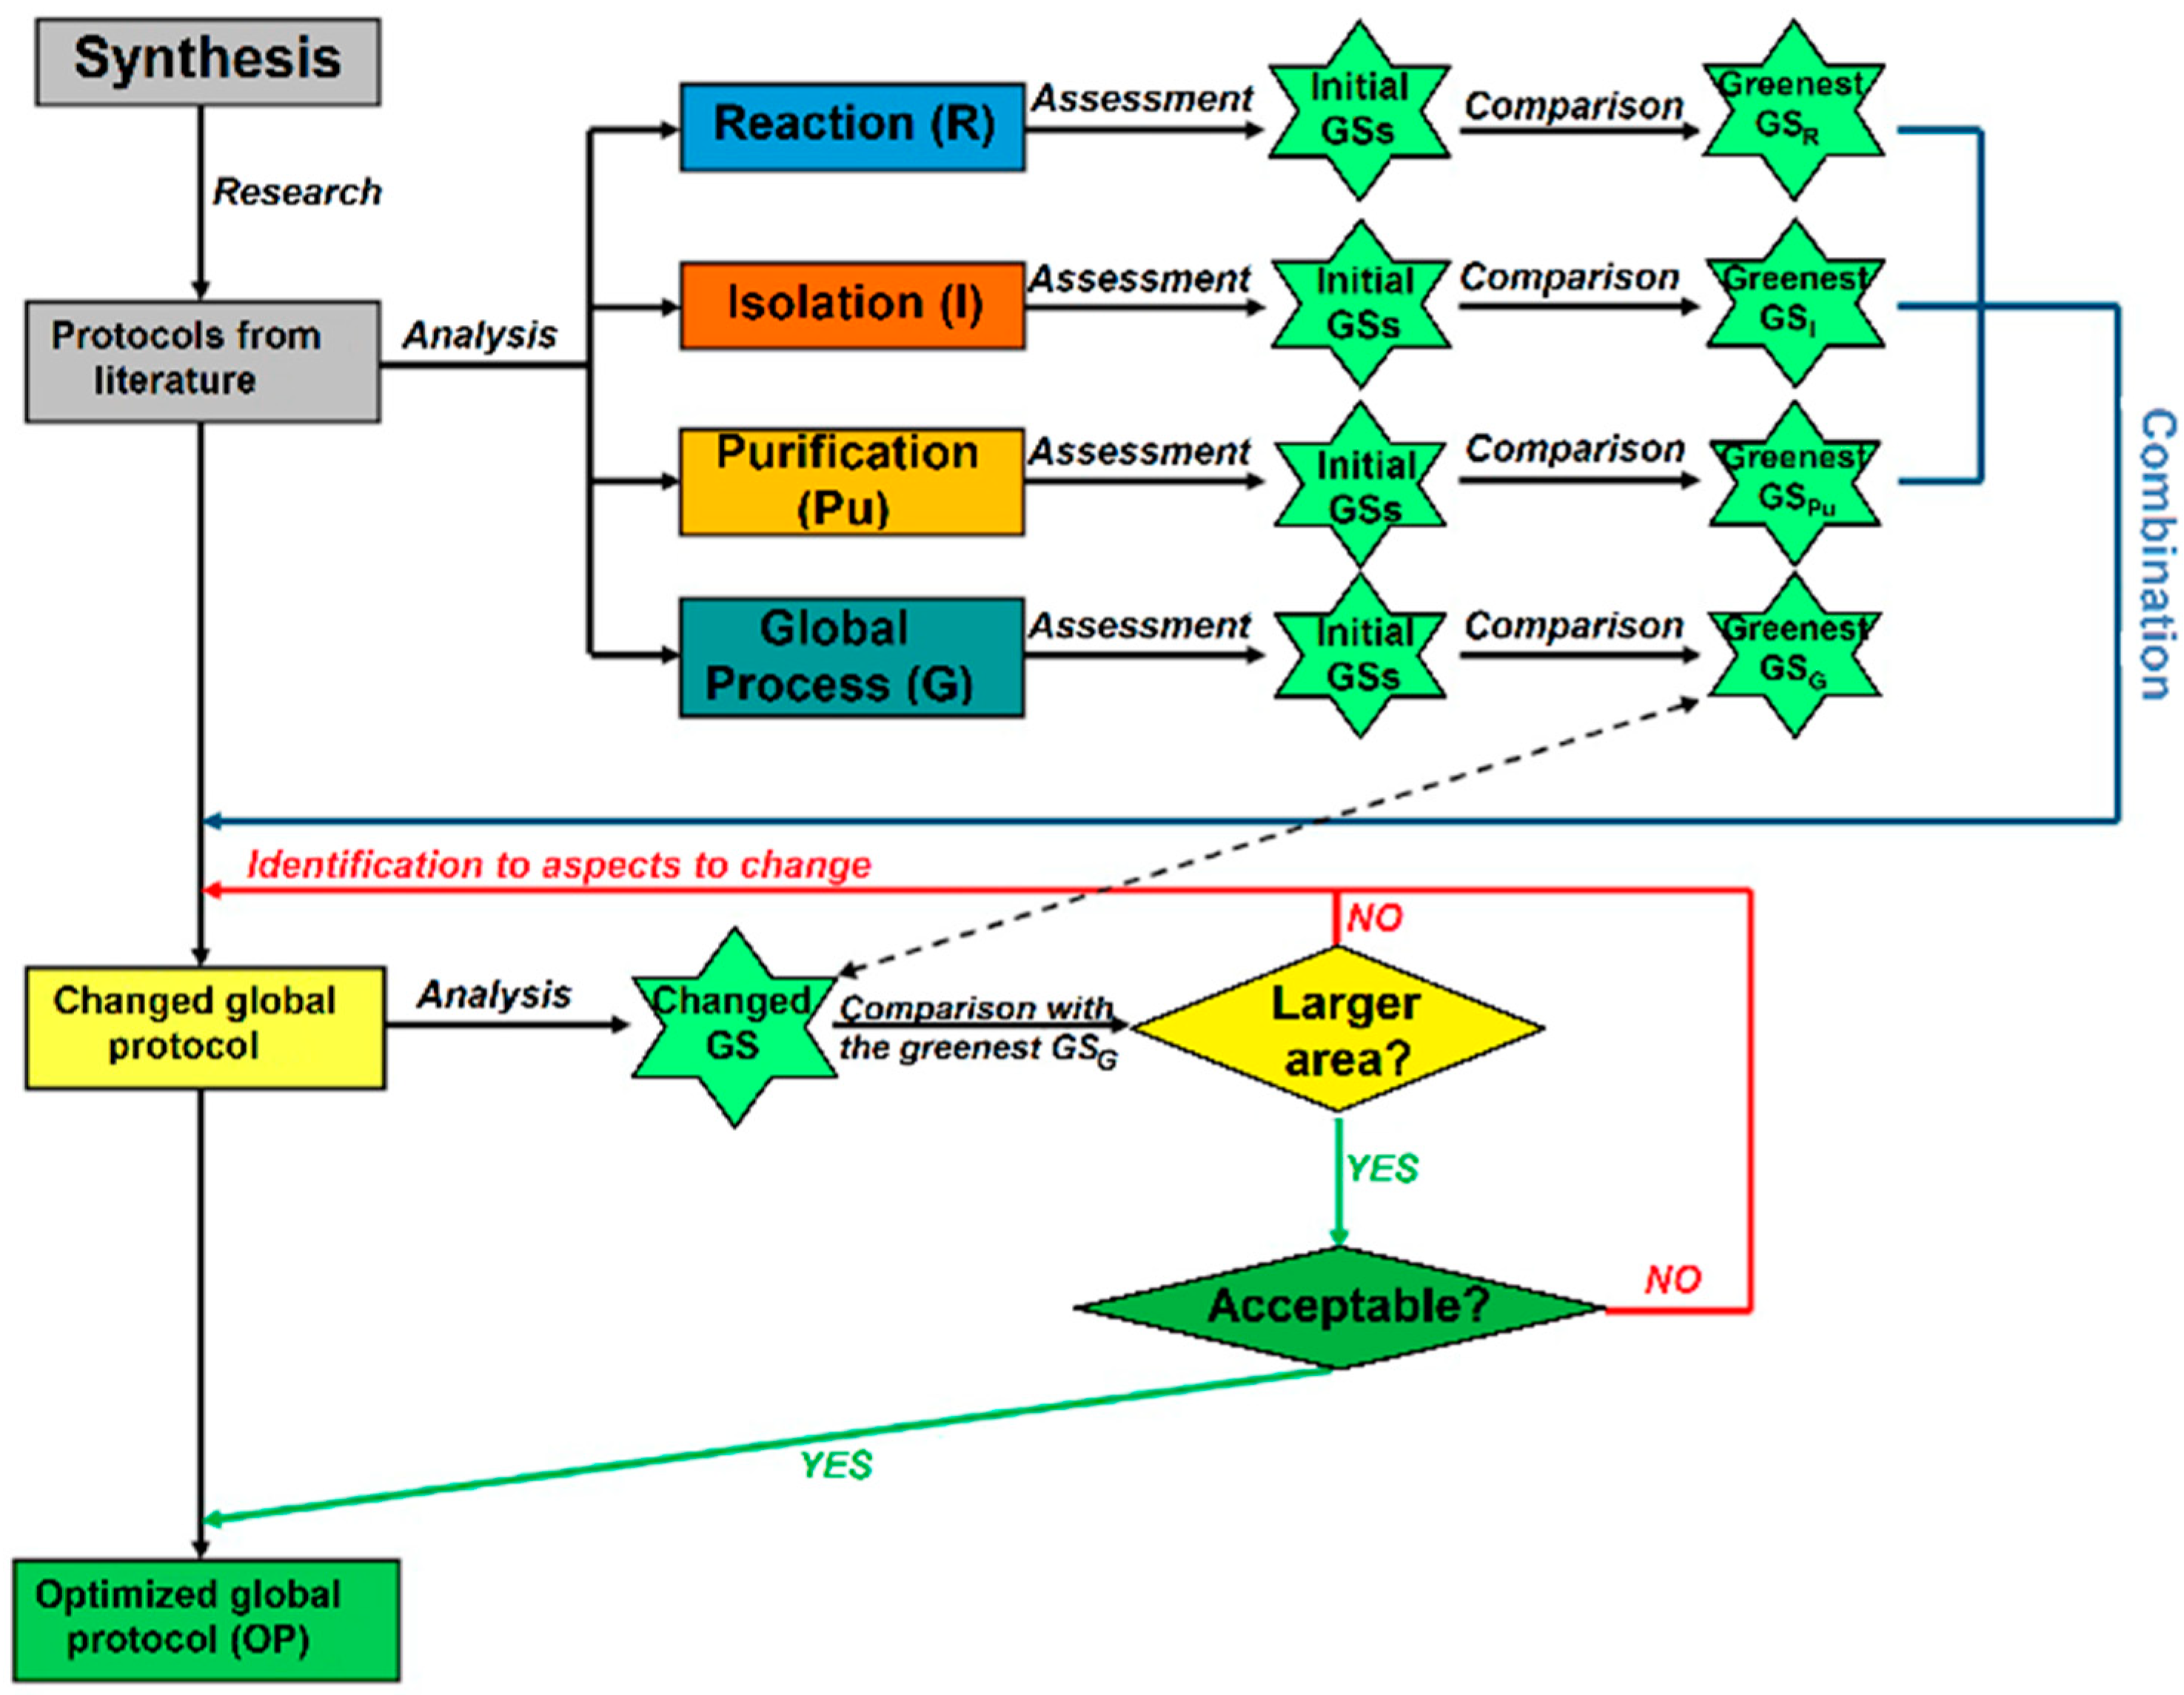
- Another important contribution was reported by Duarte et al. [90]. In this work, the authors analyze the greenness of a synthesis describing the total process in a separate assessment of the different steps—reaction, isolation, and purification—as well as the global process, shown in Figure 15. The methodology involves the 12 Principles of Green Chemistry and GS [72,84,85,86,87] methodology, as described above. In this case, regarding the GS, the metric uses a ten-corner star for the reaction and six corner star for the workup operations. It is convenient to highlight that the authors made this assumption: “It is possible to improve the greenness of a synthesis without performing laboratory work, just by identifying the best performing reaction, isolation, and purification steps.”
- vii.
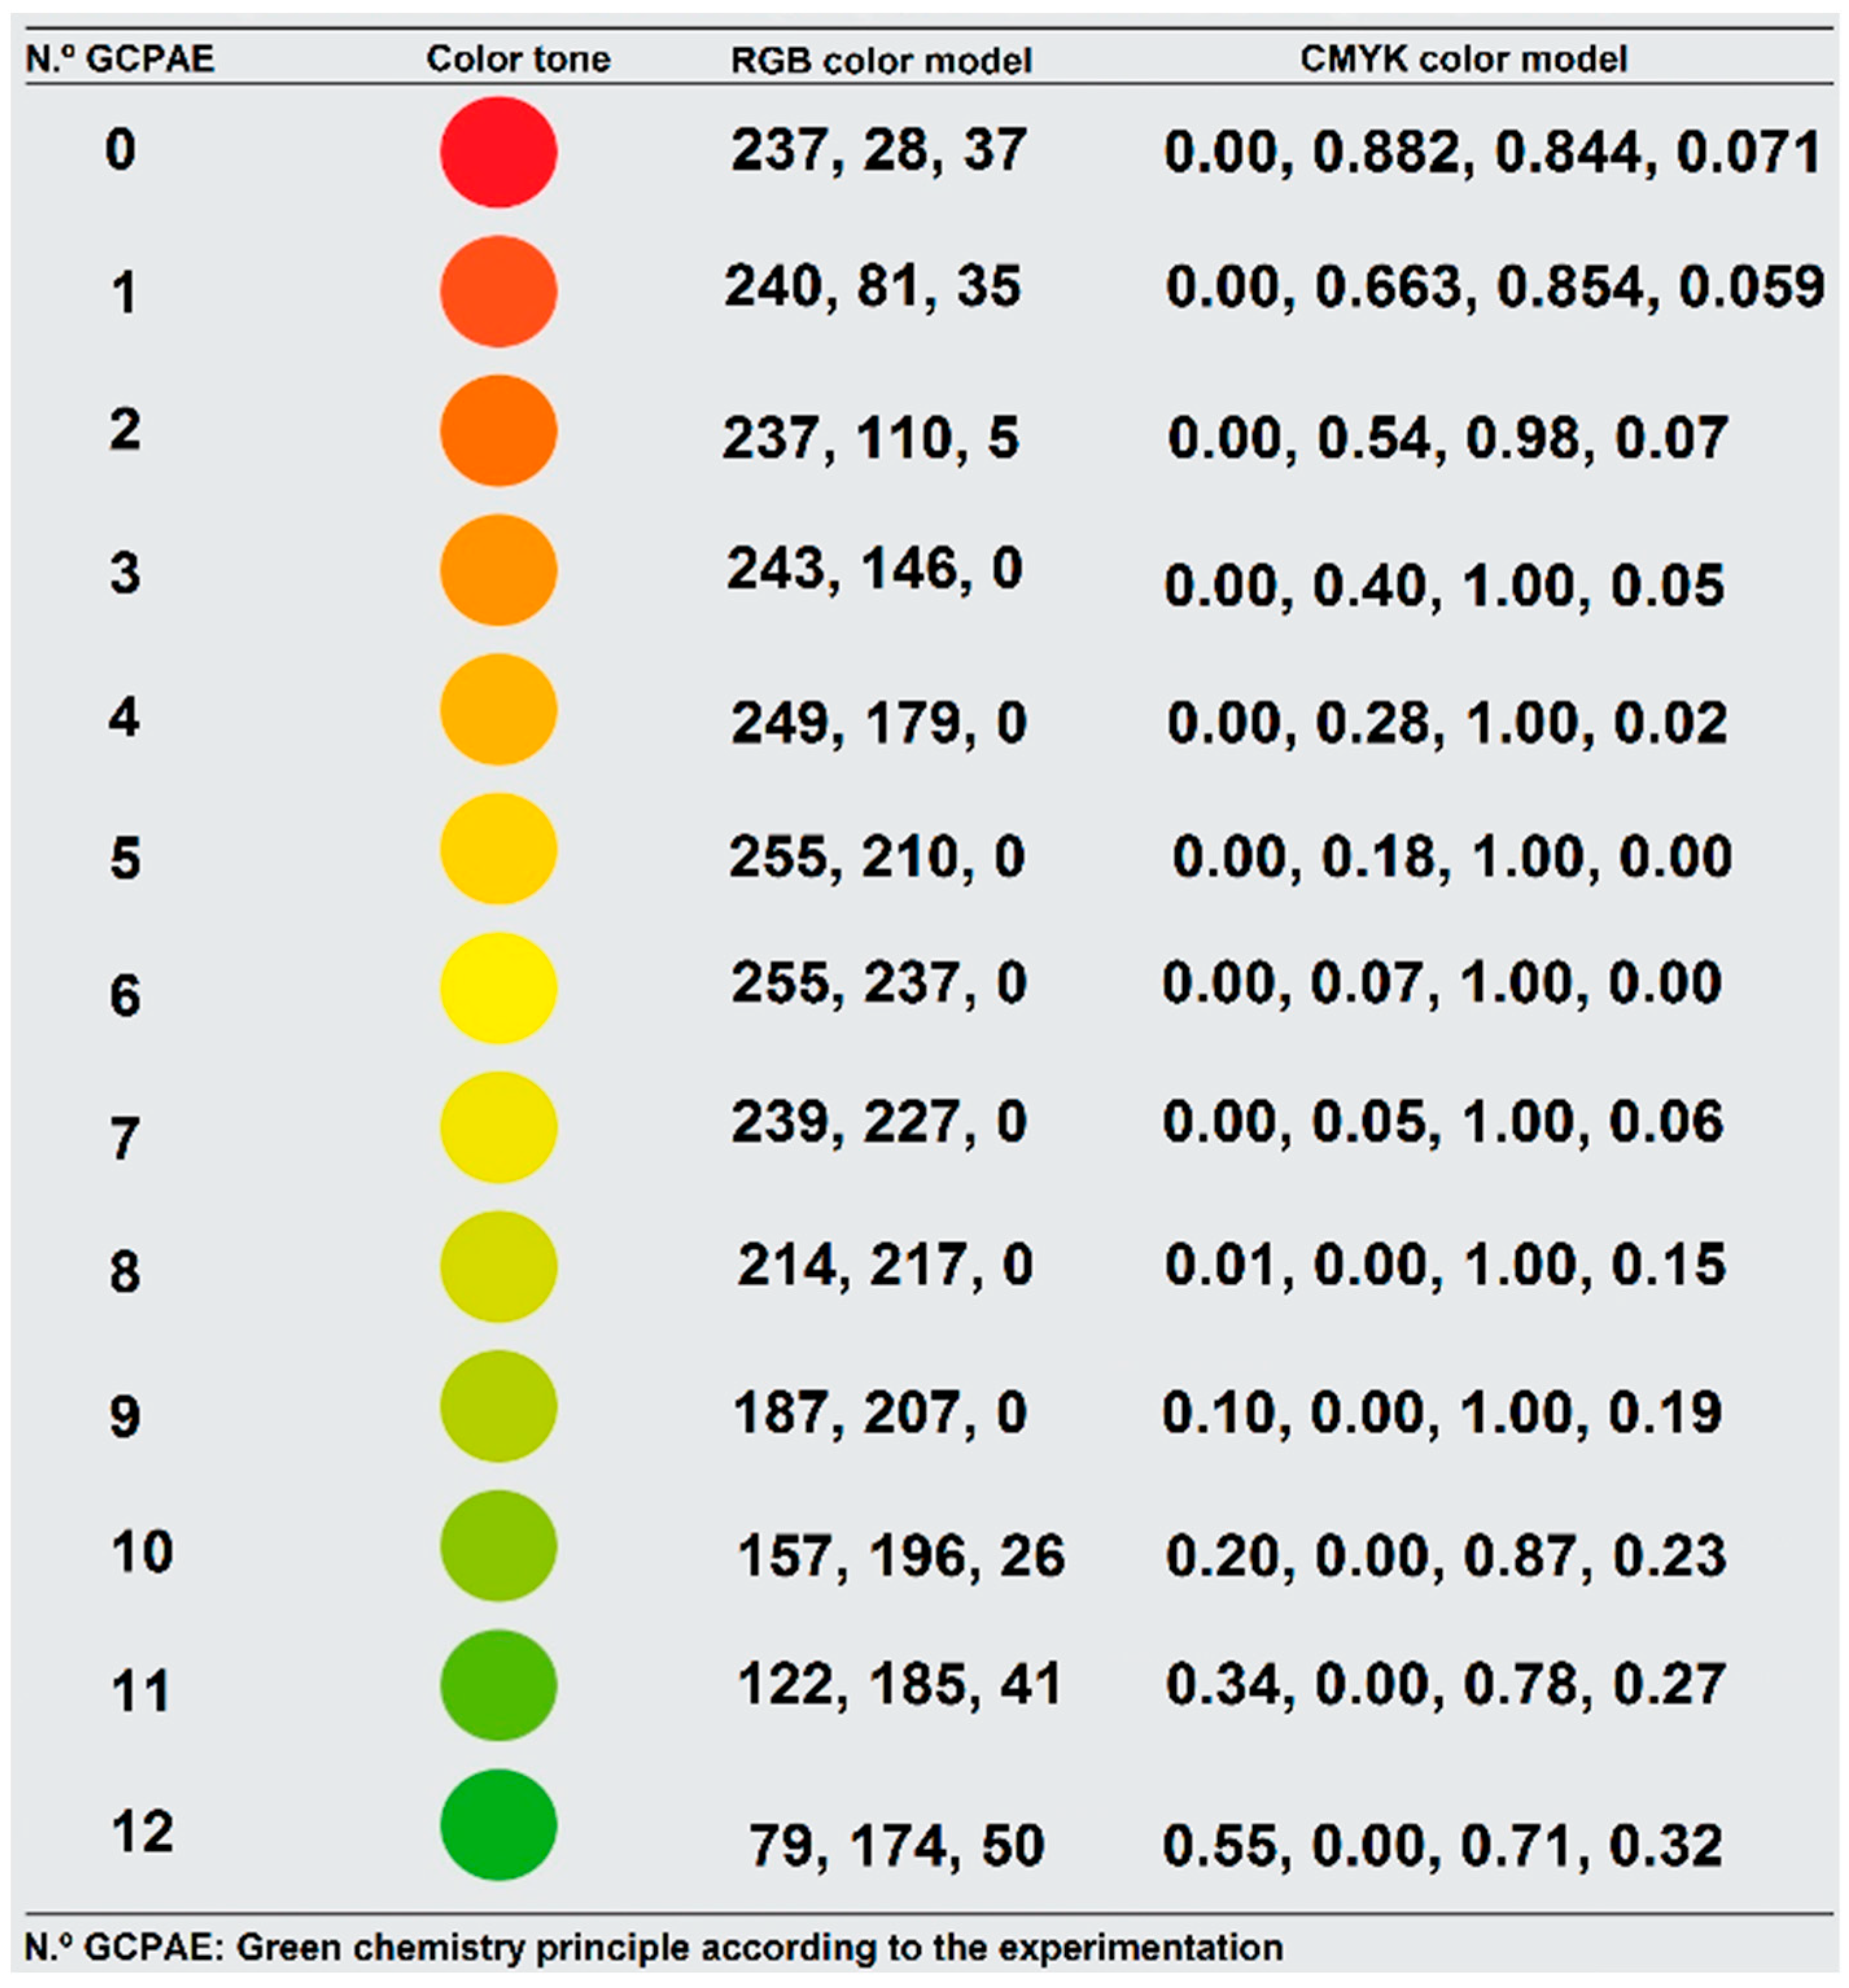
- An interesting work employing a traffic-light tactic to assert a green metric methodology, in other words the greenness of a process, was reported in 2016 [22]. By this practice, 13 color tones were engaged, wandering between green–yellow–red, as in traffic-light devices, shown in Figure 16. It is important to highlight that the 12 Principles of Green Chemistry are considered. In addition, to allow a suitable mode for the greenness of a particular process, an experimental flowchart is depicted.In the corresponding diagram, the treatment and disposal of waste—in addition, the risk to human health and the environment are considered—as a complement, the pictograms of GHS and fire diamond of NFPA are appropriately applied. In conclusion, depending on the resulting color tone, a greenness degree of the experiment is afforded. It is convenient to note that the resulting color tones are obtained using both RGB (red, green, black) and CMYK (cyan, magenta, yellow, black, key) models from computational evaluation codes.
4. Future Recommendations
5. Conclusions
Supplementary Materials
Author Contributions
Funding
Data Availability Statement
Conflicts of Interest
References
- UNESCO. UNESCO Science Report: Toward 2030; UNESCO Publishing: Paris, France, 2015; ISBN 9789231001291. [Google Scholar]
- Sustainable Development Goals. United Nations Programme. 2022. Available online: https://www.undp.org/sustainable-development-goals#responsible-consumption-and-production (accessed on 12 January 2022).
- Naciones Unidas. Resolución Aprobada Por la Asamblea General el 25 de Septiembre de 2015. Septuagésimo Periodo de Sesiones. Tema 5 y 116 del Programa. A/RES/70/1. Available online: http://www.un.org/ga/search/view_doc.asp?symbol=A/RES/70/1&Lang=S (accessed on 12 January 2022).
- Anastas, P.T.; Warner, J.C. Green Chemistry: Theory and Practice; Oxford University Press: Oxford, UK, 1998. [Google Scholar]
- Martínez, J.; Miranda, R. Chapter 3: Infrared irradiation, an excellent, alternative green energy source. In Green Chemistry Applications; Eyvaz, M., Ed.; IntechOpen: London, UK, 2019. [Google Scholar] [CrossRef] [Green Version]
- Gonzalez, M.A.; Smith, R.L. A methodology to evaluate process sustainability. Environ. Prog. 2003, 22, 269–276. [Google Scholar] [CrossRef]
- Consoli, F.; Allen, D.; Boustead, I.; Fava, J.; Franklin, W.; Jensen, A.A.; de Oude, N.; Parrish, R.; Perriman, R.; Postlethwaite, D.; et al. (Eds.) Guidelines for the Life-Cycle Assessment: A “Code of Practice”. In Proceedings of the SETAC Workshop, Sesimbra, Portugal, 31 March–3 April 1993; Society of Environment Toxicology and Chemistry: Pensacola, FL, USA, 1993. [Google Scholar]
- Marteel, A.E.; Davies, J.A.; Olson, W.W.; Abraham, M.A. Green chemistry and engineering: Drivers, metrics, and reduction to practice. Annu. Rev. Environ. Resour. 2003, 28, 401–428. [Google Scholar] [CrossRef]
- Lapkin, A.; Joyce, L.; Crittenden, B. Framework for evaluating the “greenness” of chemical processes: Case studies for a novel VOC recovery technology. Environ. Sci. Technol. 2004, 38, 5815–5823. [Google Scholar] [CrossRef]
- Monteith, E.R.; Mampuys, P.; Summerton, L.; Clark, J.H.; Maes, B.U.W.; McElroy, C.R. Why the might be misusing process mass intensity (PMI) and a methodology to apply it effectively as a discovery level metric. Green Chem. 2020, 22, 123–135. [Google Scholar] [CrossRef]
- Constable, D.J.C.; Curzons, A.D.; Freitas dos Santos, L.M.; Geen, G.R.; Hannah, R.E.; Hayler, J.D.; Kitteringham, J.; McGuire, M.A.; Richardson, J.E.; Smith, P.; et al. Green chemistry measures for process research and development. Green Chem. 2001, 3, 7–9. [Google Scholar] [CrossRef]
- Roschangar, F.; Sheldon, R.A.; Senanayake, C.H. Overcoming barriers to green chemistry in the pharmaceutical industry—The green aspiration level™ concept. Green Chem. 2015, 17, 752–768. [Google Scholar] [CrossRef]
- Pérez, H.; Miranda, R.; Saavedra-Leos, Z.; Zarraga, R.; Alonso, P.; Moctezuma, E.; Martínez, J. Green and facile sol-gel synthesis of the mesoporous SiO2-TiO2 catalyst by four different activation modes. RSC Adv. 2020, 10, 39580–39588. [Google Scholar] [CrossRef]
- Martínez, J.; Rosas, J.; Pérez, J.; Saavedra, Z.; Carranza, V.; Alonso, P. Green approach to the extraction of major capsaicinoids from habanero pepper using near-infrared, microwave, ultrasound and Soxhlet methods, a comparative study. Nat. Prod. Res. 2018, 33, 447–452. [Google Scholar] [CrossRef]
- Escobedo, R.; Miranda, R.; Martínez, J. Infrared irradiation: Toward green chemistry, a review. Int. J. Mol. Sci. 2016, 17, 453. [Google Scholar] [CrossRef] [Green Version]
- Martínez, J.; Romero-Vega, S.; Abeja-Cruz, R.; Álvarez-Toledano, C.; Miranda, R. Green approach-multicomponent production of boron-containing Hantzsch and Biginelli esters. Int. J. Mol. Sci. 2013, 14, 2903–2915. [Google Scholar] [CrossRef]
- Martínez, J.; Velasco-Bejarano, B.; Delgado, F.; Pozas, R.; Torres Domínguez, H.M.; Trujillo Ferrara, J.G.; Arroyo, G.A.; Miranda, R. Eco-contribution to the chemistry of perezone, a comparative study, using different modes of activation and solventless conditions. Nat. Prod. Commun. 2008, 3, 1465–1468. [Google Scholar] [CrossRef] [Green Version]
- Martínez, J.; Sánchez, L.; Pérez, F.J.; Carranza, V.; Delgado, F.; Reyes, L.; Miranda, R. Uncatalysed production of coumarin-3-carboxylic acid: A green approach. J. Chem. 2016, 2016, 4678107. [Google Scholar] [CrossRef] [Green Version]
- Escobedo-González, R.G.; Vázquez-Cabañas, A.; Martínez-González, A.; Mendoza-Sánchez, P.; Saavedra-Leos, Z.; Cruz-Olivares, J.; Nava Serrano, J.; Martínez, J.; Miranda Ruvalcaba, R. Green approach extraction of perezone from the roots of Acourtia platyphilla (A. Grey): A comparison of four activating modes and supercritical carbón dioxide. Molecules 2019, 24, 3035. [Google Scholar] [CrossRef] [PubMed] [Green Version]
- Zarco-Juarez, M.; Martínez, J.O.; Noguez-Cordova, O.; Nicolás-Vazquez, M.I.; Ramírez-Apan, T.; Pérez-Flores, J.; Miranda-Ruvalcaba, R.; Arroyo-Razo, G.A. A green approach to the production of hybrid diindolylmethane-phenylboronic acids via 3MCR: Promising antineoplasic molecules. J. Chem. 2013, 2013, 531208. [Google Scholar] [CrossRef]
- Morales-Galicia, M.L.; Martínez, J.O.; Reyes-Sánchez, L.B.; Martín-Hernández, O.; Arroyo-Razo, G.A.; Obaya-Valdivia, A.; Miranda-Ruvalcaba, R. ¿Qué tan verde es un experimento? Educ. Quim. 2011, 22, 240–248. [Google Scholar] [CrossRef]
- Vargas-Rodríguez, Y.M.; Obaya Valdivia, A.; Lima Vargas, S.; Hernández Escamilla, A.; Miranda Ruvalcaba, R.; Vargas Rodríguez, G.I. El diagrama de flujo como semáforo de seguridad ecológica de los experimentos de laboratorio. Educ. Quim. 2016, 27, 30–36. [Google Scholar] [CrossRef] [Green Version]
- García-Quintero, A.; Palencia, M. A critical analysis of environmental sustainability metrics applied to green synthesis of nanomaterials and the assessment of environmental risk associated with the nanotechnology. Sci. Total Environ. 2021, 793, 148524. [Google Scholar] [CrossRef]
- Zhang, J.; Cue, B.W., Jr. Green processes chemistry in the pharmaceutical industry: Recent cases studies. In Green Techniques for Organic Synthesis and Medicinal Chemistry; Zhang, W., Cue, B.W., Jr., Eds.; Wiley: Chichester, UK, 2021; pp. 631–658. [Google Scholar]
- Margalef, J.; Samec, J.S.M. Assessing methodologies to synthetize α-sulfenylated carbonyl compounds by green chemistry metrics. ChemSusChem 2020, 14, 808–823. [Google Scholar] [CrossRef]
- Colberg, J.; Piper, J.L.; Wong, J.W. Green chemistry. In Practical Synthetic Organic Chemistry: Reaction, Principles, and Techniques, 2nd ed.; Wiley: Hoboken, NJ, USA, 2020; pp. 705–720. [Google Scholar]
- Roschangar, F.; Colberg, J. Green chemistry metrics. In Green Techniques for Organic Synthesis and Medicinal Chemistry, 2nd ed.; Wiley: Hoboken, NJ, USA, 2018; pp. 1–19. [Google Scholar]
- Andraos, J. Application of green metrics to scalable industrial synthesis plans: Approaches to oseltamivir phosphate (Tamiflu). In Scalable Green Chemistry; Koenig, S.G., Ed.; Jenny Stanford Publishing: Singapore, 2013; pp. 75–104. [Google Scholar]
- Andraos, J. A green metrics assessment of phosgene and phosgene-free synthesis of industrially important commodity chemicals. Pure Appl. Chem. 2012, 84, 827–860. [Google Scholar] [CrossRef]
- Kopach, M.; Leahy, D.; Manley, J. The green chemistry approach to pharma manufacturing. Innov. Pharmaceut. Technol. 2012, 43, 72–75. [Google Scholar]
- Sheldon, R.A. Reaction efficiencies and green chemistry metrics of biotransformations. In Biocatalysis for Green Chemsitry and Chemical Process Development; Tao, J., Kazlauskas, R., Eds.; Wiley: Hoboken, NJ, USA, 2011; pp. 67–88. [Google Scholar]
- Henderson, R.K.; Constable, D.J.C.; Jiménez-González, C. Green chemistry metrics. In Green Chemistry in the Pharmaceutical Industry; Dunn, P.J., Wells, A.S., Williams, M.T., Eds.; Wiley-VCH Verlag GmbH & Co. KGaA: Weinheim, Germany, 2010; pp. 21–48. [Google Scholar]
- Andraos, J. Application of green metrics analysis to chemical reactions and synthesis plan. In Green Chemistry Metrics: Measuring and Monitoring Sustainable Processes; Lapkin, A., Constable, D.J.C., Eds.; Wiley: Chichester, UK, 2009; pp. 69–199. [Google Scholar]
- Abraham, M.A.; Clark, J.; Winterton, N. Introduction to green chemistry metrics. In Green Chemistry Metrics; Lapkin, A., Constable, D.J.C., Eds.; Wiley: Chichester, UK, 2009; pp. 1–26. [Google Scholar]
- Selva, M.; Perosa, A. Green chemistry metrics: A comparative evaluation of dimethyl carbonate, methyl iodide, dimethyl sulfate and methanol as methylating agents. Green Chem. 2008, 10, 457–464. [Google Scholar] [CrossRef]
- Sheldon, R.A. Metrics of green chemistry and sustainability: Past, present, future. ACS Sustain. Chem. Eng. 2018, 6, 32–48. [Google Scholar] [CrossRef] [Green Version]
- Derbenev, I.N.; Dowden, J.; Twycross, J.; Hirst, J.D. Software tools for green and sustainable chemistry. Curr. Opin. Green Sustain. Chem. 2022, 35, 100623. [Google Scholar] [CrossRef]
- Devierno Kreuder, A.; House-Knight, T.; Whitford, J.; Ponnusamy, E.; Miller, P.; Jesse, N.; Rodenborn, R.; Sayag, S.; Gebel, M.; Aped, I.; et al. A method for assessing greener alternatives between chemical products following the 12 principles of green chemistry. ACS Sustain. Chem. Eng. 2017, 5, 2927–2935. [Google Scholar] [CrossRef] [Green Version]
- Trost, B.M. The atom economy-a search for synthetic efficiency. Science 1991, 254, 1471–1477. [Google Scholar] [CrossRef]
- Trost, B.M. On inventing reaction for atom economy. Acc. Chem. Res. 2002, 35, 695–705. [Google Scholar] [CrossRef]
- Sheldon, R.A. Organic synthesis: Past, present and future. Chem. Ind. 1992, 23, 903–906. [Google Scholar]
- Sheldon, R.A. The E factor 25 years on: The rise of green chemistry and sustainability. Green Chem. 2017, 19, 18–43. [Google Scholar] [CrossRef]
- Hudlicky, T.; Frey, D.A.; Koroniak, C.D.; Claeboe, L.; Brammer, L.E. Toward a reagent-free synthesis. Green Chem. 1999, 1, 57–59. [Google Scholar] [CrossRef]
- Curzons, A.D.; Constable, D.J.C.; Mortimer, D.N.; Cunningham, V.L. So you think your process is green, how do you know?—Using principles of sustainability to determine what is green-a corporate perspective. Green Chem. 2001, 3, 1–6. [Google Scholar] [CrossRef]
- Constable, D.J.C.; Curzons, A.D.; Cunningham, V.L. Metrics to green chemistry-which are the best? Green Chem. 2002, 4, 521–527. [Google Scholar] [CrossRef]
- Andraos, J. Unification of reaction metrics for green chemistry: Applications to reaction analysis. Org. Process Res. Dev. 2005, 9, 149–163. [Google Scholar] [CrossRef]
- Andraos, J. On using tree analysis to quantify the material, input energy, and cost throughput efficiencies of simple and complex synthesis plans and networks: Towards a blue print for quantitative total synthesis and green chemistry. Org. Process Res. Dev. 2006, 10, 212–240. [Google Scholar] [CrossRef]
- Andraos, J.; Sayed, M. On the use of “green” metrics in the undergraduate organic chemistry lecture and lab to assess the mass efficiency of organic reactions. J. Chem. Educ. 2007, 84, 1004–1010. [Google Scholar] [CrossRef]
- Andraos, J. Simplified application of material efficiency green metrics to synthesis plans: Pedagogical case studies selected from organic syntheses. J. Chem. Educ. 2015, 92, 1820–1830. [Google Scholar] [CrossRef]
- Augé, J. A new rationale of reactions metrics for green chemistry. Mathematical expression of the environmental impact factor of chemical processes. Green Chem. 2008, 10, 225–231. [Google Scholar] [CrossRef]
- Hartman, R.; Helmy, R.; Al-Sayah, M.; Welch, C.J. Analytical method volume intensity (AMVI): A green chemistry metric for HPLC methodology in the pharmaceutical industry. Green Chem. 2011, 13, 934–939. [Google Scholar] [CrossRef]
- Jiménez-González, C.; Ponder, C.S.; Broxterman, Q.B.; Manley, J.B. Using the right green yardstick: Why process mass intensity is used in the pharmaceutical industry to drive more sustainable processes. Org. Process Res. Dev. 2011, 15, 912–917. [Google Scholar] [CrossRef]
- Jiménez-González, C.; Ollech, C.; Pyrz, W.; Hughs, D.; Broxterman, Q.B.; Bhathela, N. Expanding the boundaries: Developing a streamlined tool for eco-footprint of pharmaceuticals. Org. Process Res. Dev. 2013, 17, 239–246. [Google Scholar] [CrossRef]
- Augé, J.; Scherrmann, M.-C. Determination of the global material economy (GME) of synthesis sequences—A green chemistry metric to evaluate the greenness of products. New J. Chem. 2012, 36, 1091–1098. [Google Scholar] [CrossRef]
- Song, J.J.; Frutos, R.P.; Tampone, T.; Senanayake, C.H. Industrial applications of asymmetric synthesis: Asymmetric synthesis as an enabler of green chemistry. In Comprehensive Chirality: Industrial Applications of Asymmetric Synthesis; Carreira, E.M., Yamamoto, H., Eds.; Elsevier Science: Amsterdam, The Netherlands, 2012; Volume 9, pp. 46–72. [Google Scholar]
- Machado, A.A.S.C. Bateria de métricas para avaliação da verdura material de reações de síntese. Quim. Nova 2014, 37, 1094–1109. [Google Scholar]
- Roschangar, F.; Zhou, Y.; Constable, D.J.C.; Colberg, J.; Dickson, D.P.; Dunn, P.J.; Eastgate, M.D.; Gallou, G.; Hayler, J.D.; Koenig, S.G.; et al. Inspiring process innovation via an improved green manufacturing metric: iGAL. Green Chem. 2018, 20, 2206–2211. [Google Scholar] [CrossRef]
- McElroy, C.R.; Constantinou, A.; Jones, L.C.; Summerton, L.; Clark, J.H. Towards a holistic approach to metrics for the 21st century pharmaceutical industry. Green Chem. 2015, 17, 3111–3121. [Google Scholar] [CrossRef] [Green Version]
- Hudson, R.; Leaman, D.; Kawamura, K.E.; Esdale, K.N.; Glaisher, S.; Bishop, A.; Katz, J.L. Exploring green chemistry metrics with interlocking building block molecular models. J. Chem. Educ. 2016, 93, 691–694. [Google Scholar] [CrossRef]
- Budzinski, K.; Blewis, M.; Dahlin, P.; D’Aquila, D.; Esparza, J.; Gavin, J.; Ho, S.V.; Hutchens, C.; Kahn, D.; Koenig, S.G.; et al. Introduction of a process mass intensity metric for biologics. New Biotechnol. 2019, 49, 37–42. [Google Scholar] [CrossRef]
- Benison, C.H.; Payne, P.R. Manufacturing mass intensity: 15 years of process mass intensity and development of the metric into plant cleaning and beyond. Curr. Res. Green Sustain. Chem. 2022, 5, 100229. [Google Scholar] [CrossRef]
- Duarte, R.C.; Ribeiro, M.G.T.C.; Machado, A.A.S.C. Reaction scale and green chemistry: Microscale or macroscale, which is greener? J. Chem. Educ. 2017, 94, 1255–1264. [Google Scholar] [CrossRef]
- Naidu, S.; Sawhney, R.; Li, X. A methodology for evaluation and selection of nanoparticle manufacturing processes based on sustainability metrics. Environ. Sci. Technol. 2008, 42, 6697–6702. [Google Scholar] [CrossRef]
- Tabone, M.D.; Cregg, J.J.; Beckman, E.J.; Landis, A.E. Sustainability metrics: Life cycle assessment and green design in polymers. Environ. Sci. Technol. 2010, 44, 8264–8269. [Google Scholar] [CrossRef]
- Mercer, S.M.; Andraos, J.; Jessop, P.G. Choosing the greenest synthesis: A multivariate metric green chemistry exercise. J. Chem. Educ. 2012, 89, 215–220. [Google Scholar] [CrossRef]
- Gałuszka, A.; Konieczka, P.; Migaszewski, Z.M.; Namieśnik, J. Analytical eco-scale for assessing the greenness of analytical procedures. Trends Anal. Chem. 2012, 37, 61–72. [Google Scholar] [CrossRef]
- Andraos, J. Inclusion of environmental impact parameters in radial pentagon material efficiency metrics analysis: Using benign indices as a step towards a complete assessment of “greenness” for chemical reactions and synthesis plans. Org. Process Res. Dev. 2012, 16, 1482–1506. [Google Scholar] [CrossRef]
- Andraos, J. Safety/hazard indices: Completion of a unified suite of metrics for the assessment of “greenness” for chemical reactions and synthesis plans. Org. Process Res. Dev. 2013, 17, 175–192. [Google Scholar] [CrossRef]
- Andraos, J.; Mastronardi, M.L.; Hoch, L.B.; Hent, A. Critical evaluation of published algorithms for determining environmental and hazard impact green metrics of chemical reactions and synthesis plans. ACS Sustain. Chem. Eng. 2016, 4, 1934–1945. [Google Scholar] [CrossRef] [Green Version]
- Płotka-Wasylka, J. A new tool for the evaluation of the analytical procedure: Green analytical procedure index. Talanta 2018, 181, 204–209. [Google Scholar] [CrossRef]
- Andraos, J. Global green chemistry metrics analysis algorithm and spreadsheets: Evaluation of the material efficiency performances of synthesis plans for oseltamivir phosphate (Tamiflu) as a test case. Org. Process Res. Dev. 2009, 13, 161–185. [Google Scholar] [CrossRef]
- Ribeiro, M.G.T.C.; Costa, D.A.; Machado, A.A.S.C. “Green star”: A holistic green chemistry metric for evaluation of teaching laboratory experiments. Green Chem. Lett. Rev. 2010, 3, 149–159. [Google Scholar] [CrossRef]
- Phan, T.V.T.; Gallardo, C.; Mane, J. Green motion: A new and easy to use green chemistry from laboratories to industry. Green Chem. 2015, 17, 2846–2852. [Google Scholar] [CrossRef]
- Kaiser, D.; Yang, J.; Wuitschik, G. Using data analysis to evaluate and compare chemical synthesis. Org. Process Res. Dev. 2018, 22, 1222–1235. [Google Scholar] [CrossRef]
- Loureiro, H.; Prem, M.; Wuitschik, G. ChemPager: Now expanded for even greener chemistry. Chimia 2019, 73, 724–729. [Google Scholar] [CrossRef]
- Maertens, A.; Plugge, H. Better metrics for “sustainable by design”: Toward an in silico green toxicology for green(er) chemistry. ACS Sustain. Chem. Eng. 2018, 6, 1999–2003. [Google Scholar] [CrossRef] [Green Version]
- Nowak, P.M.; Kościelniak, P. What color is your method? Adaptation of the RGB additive color model to analytical method evaluation. Anal. Chem. 2019, 91, 10343–10352. [Google Scholar] [CrossRef] [PubMed]
- Pena-Pereira, F.; Wojnowski, W.; Tobiszewski, M. AGREE-analytical greenness metric approach and software. Anal. Chem. 2020, 92, 10076–10082. [Google Scholar] [CrossRef] [PubMed]
- Płotka-Wasylka, J.; Wojnowski, W. Complementary green analytical procedure index (ComplexGAPI) and software. Green Chem. 2021, 23, 8657–8665. [Google Scholar] [CrossRef]
- Tobiszewski, M.; Przychodzeń, W.; Bystrzanowska, M.; Milewska, M.J. Organic synthesis greenness assessment with multicriteria decision analysis. Green Chem. 2021, 23, 9583–9588. [Google Scholar] [CrossRef]
- Wojnowski, W.; Tobiszewski, M.; Pena-Pereira, F.; Psillakis, E. AGREEprep—Analytical greenness metric for simple preparation. Trends Anal. Chem. 2022, 149, 116553. [Google Scholar] [CrossRef]
- López-Lorente, A.I.; Pena-Pereira, F.; Pedersen-Bjergaard, S.; Zuin, V.G.; Ozkan, S.A.; Psillakis, E. The ten principles of green sample preparation. Trends Anal. Chem. 2022, 148, 116530. [Google Scholar] [CrossRef]
- Van Aken, K.; Strekowski, L.; Patiny, L. Eco-scale, a semiquantitative tool to select an organic preparation based on economical and ecological parameters. Beilstein J. Org. Chem. 2006, 2, 3. [Google Scholar] [CrossRef] [Green Version]
- Ribeiro, M.G.T.C.; Costa, D.A.; Machado, A.S.C. Uma métrica gráfica para avaliação holística da verdura de reacções laboratoriais—“Estrela verde”. Quim. Nova 2010, 33, 759–764. [Google Scholar] [CrossRef] [Green Version]
- Ribeiro, M.G.T.C.; Machado, A.A.S.C. Novas métricas holísticas para avaliação da verdura de reações de síntese em laboratório. Quim. Nova 2012, 35, 1879–1883. [Google Scholar] [CrossRef] [Green Version]
- Ribeiro, M.G.T.C.; Machado, A.A.S.C. Holistic metrics for assessment of the greenness of chemical reactions in the context of chemical education. J. Chem. Educ. 2013, 90, 432–439. [Google Scholar] [CrossRef]
- Ribeiro, M.G.T.C.; Yunes, S.F.; Machado, A.A.S.C. Assessing the greenness of chemical reactions in the laboratory using updated holistic graphic metrics based on the globally harmonized system of classification and labeling of chemicals. J. Chem. Educ. 2014, 91, 1901–1908. [Google Scholar] [CrossRef]
- Toxics Release Inventory (TRI) Program. Available online: https://www.epa.gov/toxics-release-inventory-tri-program/tri-listed-chemicals (accessed on 12 January 2022).
- Koster, K.; Cohen, M. Practical approaches to sustainability: iSUSTAIN® tool for green chemistry case study. In Treatise on Sustainability Science and Engineering; Jawahir, I., Sikdar, S., Huang, Y., Eds.; Springer: Dordrecht, The Netherlands, 2013; pp. 81–108. [Google Scholar]
- Duarte, R.C.C.; Ribeiro, M.G.T.C.; Machado, A.A.S.C. Using green star metrics to optimize the greenness of literature protocols for synthesis. J. Chem. Educ. 2015, 92, 1024–1034. [Google Scholar] [CrossRef]
- Anastas, P.T.; Zimmerman, J.B. Through the 12 principles green engineering. Environ. Sci. Technol. 2003, 37, 94A. [Google Scholar] [CrossRef] [Green Version]


| Principle | Meaning |
|---|---|
| 1 | Prevention: It is better to prevent waste than to treat or clean up waste after it is formed. |
| 2 | Atom economy: Synthetic methods should be designed to maximize the incorporation of all materials used in the process into the final product. |
| 3 | Less hazardous chemical synthesis: Wherever practicable, synthetic methodologies should be designed to use and generate substances that possess little or no toxicity to human health and the environment. |
| 4 | Designing safer chemicals: Chemical products should be designed to preserve efficacy of function while reducing toxicity. |
| 5 | Safer solvents and auxiliaries: The use of auxiliary substances (e.g., solvents, separation agents, etc.) should be made unnecessary wherever possible and innocuous when used. |
| 6 | Design for energy efficiency: Energy requirements should be recognized for their environmental and economic impacts and should be minimized. Synthetic methods should be conducted at ambient temperature and pressure. |
| 7 | Use of renewable feedstocks: A raw material of feedstock should be renewable rather than depleting wherever technically and economically practicable. |
| 8 | Reduce derivatives: Unnecessary derivatization (blocking group, protection/deprotection, temporary modification of physical/chemical processes) should be avoided whenever possible. |
| 9 | Catalysis: Catalytic reagents (as selective as possible) are superior to stoichiometric reagents. |
| 10 | Design for degradation: Chemical products should be designed so that at the end of their function they do not persist in the environment and break down into innocuous degradation products. |
| 11 | Real-time analysis for pollution prevention: Analytical methodologies need to be further developed to allow for real-time, in-process monitoring, and control prior to the formation of hazardous substances. |
| 12 | Inherently safer chemistry for accident prevention: Substances and the form of a substance used in a chemical process should be chosen to minimize the potential for chemical accidents, including releases, explosions, and fires. |
| Keyword | SciFinder® | Scopus | Google Scholar | Researchgate 4 |
|---|---|---|---|---|
| Green chemistry approach | 332 | 716 | 713,000 2 | 10,200,000 |
| Green chemistry evaluation | 63 | 846 | 1,030,000 2 | 6,560,000 |
| Green chemistry metrics | 62 | 122 | 394,000 | 680,000 |
| Green chemistry measures | 62 | 24 | 1,220,000 2 | 14,500,000 |
| How green is? | 49 | 440 | 947,000 3 | 136,000,000 |
| Which is greener? | 17 | 571 | 166,000 | 154,000,000 |
| Greenness evaluation | 13 | 23 | 23,700 | 250,000 |
| Greenness synthesis | 162,102 | 13 | 17,800 | 121,000 |
| Greenness chemistry | 101,912 | 50 | 17,400 | 158,000 |
| Parameter | Penalty Points |
|---|---|
| Yield | |
| Price of reaction components (to obtain 100 mmol of end product) | |
| Inexpensive (<$10) | 0 |
| Expensive (>$10 and <$50) | 3 |
| Very expensive (>$50) | 5 |
| Safety | |
| N (dangerous for environment) | 5 |
| T (toxic) | 5 |
| F (highly flammable) | 5 |
| E (explosive) | 10 |
| F + (extremely flammable) | 10 |
| T + (extremely toxic) | 10 |
| Technical setup | |
| Common setup | 0 |
| Instruments for controlled addition of chemicals | 1 |
| Unconventional activation technique | 2 |
| Pressure equipment, >1 atm | 3 |
| Any additional special glassware | 1 |
| (Inert) gas atmosphere | 1 |
| Glove box | 3 |
| Temperature/time | |
| Room temperature, <1 h | 0 |
| Room temperature, <24 h | 1 |
| Heating, <1 h | 2 |
| Heating, >1 h | 3 |
| Cooling to 0 °C | 4 |
| Cooling, <0 °C | 5 |
| Workup and purification | |
| None | 0 |
| Cooling to room temperature | 0 |
| Adding solvent | 0 |
| Simple filtration | 0 |
| Removal of solvent with bp < 150 °C | 0 |
| Crystallization and filtration | 1 |
| Removal of solvent with bp > 150 °C | 2 |
| Solid phase extraction | 2 |
| Distillation | 3 |
| Sublimation | 3 |
| Liquid–liquid extraction | 3 |
| Classical chromatography | 10 |
Publisher’s Note: MDPI stays neutral with regard to jurisdictional claims in published maps and institutional affiliations. |
© 2022 by the authors. Licensee MDPI, Basel, Switzerland. This article is an open access article distributed under the terms and conditions of the Creative Commons Attribution (CC BY) license (https://creativecommons.org/licenses/by/4.0/).
Share and Cite
Martínez, J.; Cortés, J.F.; Miranda, R. Green Chemistry Metrics, A Review. Processes 2022, 10, 1274. https://doi.org/10.3390/pr10071274
Martínez J, Cortés JF, Miranda R. Green Chemistry Metrics, A Review. Processes. 2022; 10(7):1274. https://doi.org/10.3390/pr10071274
Chicago/Turabian StyleMartínez, Joel, J. Francisco Cortés, and René Miranda. 2022. "Green Chemistry Metrics, A Review" Processes 10, no. 7: 1274. https://doi.org/10.3390/pr10071274