
Influence of Chromatographic Conditions on LOD and LOQ of Fluoxetine and Sertraline Analyzed by TLC-Densitometric Method


Department of Analytical Chemistry, Faculty of Pharmaceutical Sciences in Sosnowiec, Medical University of Silesia in Katowice, Jagiellońska 4, 41-200 Sosnowiec, Poland
*
Authors to whom correspondence should be addressed.
Processes 2022, 10(5), 971; https://doi.org/10.3390/pr10050971
Submission received: 2 March 2022
/
Revised: 6 May 2022
/
Accepted: 9 May 2022
/
Published: 12 May 2022
(This article belongs to the Special Issue Applications of Chromatographic Separation Techniques in Food and Chemistry)
Abstract
:This research introduces the analysis of fluoxetine and sertraline by means of the TLC-densitometric method. They provide information on LOD and LOQ under various chromatographic conditions. The study used adsorption (NPTLC) and partition (RPTLC) thin-layer chromatography in combination with a densitometric analysis. Four types of chromatographic plates precoated with: silica gel 60 F254, silica gel 60, silanized silica gel 60 F254 (RP-2), and a mixture of silica gel 60 and kieselguhr F254, as well as three mobile phases: chloroform + methanol + ammonia (9:1:0.4, v/v/v), chloroform + methanol + glacial acetic acid (5:4:1, v/v/v), and acetone + toluene + ammonia (10:9:1, v/v/v), were used in NPTLC. RP-18F254 and silanized silica gel 60 F254 (RP-2) plates and four mobile phases: methanol + water (10:0 and 9:1, v/v), acetone + water (10:0 and 9:1, v/v), were used in RPTLC. The lowest LOD and LOQ values for fluoxetine were obtained using a silanized silica gel 60 F254 (RP-2) with acetone + toluene + ammonia (10:9:1, v/v/v) in NPTLC, and with a silanized silica gel 60 F254 (RP-2) in combination with methanol + water (10:0, v/v) in RPTLC. The lowest LOD and LOQ values of sertraline were obtained using a silica gel 60 with acetone + toluene + ammonia (10:9:1; v/v/v) in NPTLC. The smallest amount of sertraline was detected on the silanized silica gel 60 F254 plate in combination with methanol + water (9:1, v/v) in RPTLC. The obtained results provide important information that can give a good basis and set the direction for further, more detailed research; the results can also benefit other researchers who analyze fluoxetine and sertraline with the TLC technique in model systems (testing standards) as well as in drug and biological samples.
1. Introduction
Depression is a multifactorial chronic disease; widespread worldwide; associated with serious health, social, and economic problems, and in some cases may lead to the suicidal thoughts of sick people. The most common symptoms are fatigue, malaise, insomnia, and mood changes. One of the factors that may lead to the development of depression when treatment is not started is anxiety [1]. Due to their different chemical structure or mechanisms of action, antidepressants can be classified in different ways. One of the most common classifications is their division into groups depending on the pharmacological action. There are four classes: tricyclic antidepressants (TLPD), selective norepinephrine reuptake inhibitors (SNRI), monoamine oxidase inhibitors (MAOIs), and selective serotonin reuptake inhibitors (SSRI), which include sertraline (Figure 1a) and fluoxetine (Figure 1b) [1,2]. Medicinal substances belonging to selective serotonin reuptake inhibitors (SSRIs) were developed and introduced in the 1980s [2,3].
A review of the literature shows that fluoxetine and sertraline in drugs or in biological material can be determined by various analytical methods such as spectrophotometry, spectrofluorimetry, voltamperometry, capillary electrophoresis, high-performance liquid chromatography (HPLC), and gas chromatography (GC) for pharmaceutical and clinical purposes [4,5,6,7,8,9,10,11,12,13,14,15,16,17,18,19,20,21,22,23,24,25,26,27,28,29,30,31,32,33,34,35]. However, chromatographic techniques are at the fore in the research.
Thin-layer chromatography (TLC) is a very effective tool for tracking the progress of a chemical reaction [36,37,38], whereas TLC in combination with densitometry or mass spectrometry is very often used in drug analysis. Several uses of TLC for the analysis of fluoxetine and sertraline in drugs are described in the scientific literature [39,40,41,42,43,44,45,46].
Compared to other chromatographic techniques such as gas chromatography (GC) and high-performance liquid chromatography (HPLC), TLC is the simplest and cheapest technique. The TLC technique in combination with densitometry is a good tool for the analysis of biologically active compounds, including drugs. Furthermore, TLC has high sensitivity, good selectivity and resolution, good reproducibility, and it is well suitable for qualitative and quantitative analyses. Occasionally, spectrophotometry has been used to analyze sertraline and fluoxetine [4]. However, compared to TLC, spectrophotometry has low selectivity and a lack of resolution. Despite the variety of analytical techniques available on the market for the identification of biologically active substances, TLC remains a key technique in the pharmaceutical industry. In addition, thin-layer chromatography studies are among the key identity studies in most pharmacopoeial monographs. Pharmacopoeial standards are typically used in the industry as a basis for meeting quality control requirements and current Good Manufacturing Practices (GMP). Many TLC tests to identify pharmaceuticals or contaminants are found in the US and European Pharmacopoeia monographs [47,48,49,50].
One of the most important stages of an analytical procedure is their validation. The determination of the limit of detection and the limit of quantification of a given analytical method is one of the most important elements of validation as it allows for the assessment of the sensitivity of the analytical method. The limit of detection (LOD) is the lowest concentration or the smallest amount of a substance that can be detected with sufficient probability using a given analytical technique. The limit of quantification (LOQ) is the lowest concentration or quantity of a substance that can be quantified using a specific analytical method with adequate accuracy and precision. Various methods of LOD determination are currently being used [51,52]. So far, there are existing no studies in the scientific literature on the sensitivity of TLC in terms of the effect of the mobile and stationary phases on the LOD and LOQ of fluoxetine and sertraline. In chromatography, following the ICH guidelines, LOD is most often calculated from the value of the standard deviation of the set of signals and the slope of the calibration curve. In this case, the LOD is calculated from the following formula:
The following formula is used to calculate the limit of quantification (LOQ):
where:
σ—standard deviation (standard deviation of the intercept σa and the residual standard deviation σxy of the calibration curve);
S—slope of the calibration curve [52].
Knowing the LOD, the LOQ value can usually be quickly calculated from the known LOD value, namely:
LOD = 3⋅LOQ
Correctly calculated values of the limit of detection should meet certain assumptions:
where C—concentration of the analyte in the standard samples [52].
10⋅LOD > C
LOD < C
The aim and assumption of this study was to determine the effect of chromatographic conditions on the limit of detection and the limit of quantification of the analyzed fluoxetine and sertraline using: adsorption thin-layer chromatography (normal-phase thin-layer chromatography, NPTLC) in combination with densitometric analysis, and partition thin-layer chromatography (reversed-phase thin-layer chromatography, RPTLC) in combination with densitometric analysis.
2. Materials and Methods
2.1. Chemicals and Reagents
Fluoxetine hydrochloride (United States Pharmacopeia (USP) Reference Standard) and sertraline hydrochloride (European Pharmacopoeia (EP) Reference Standard) were received from Sigma-Aldrich (St. Louis, MO, USA). Chloroform, methanol, ethanol (99.8%), ammonia (25%), glacial acetic acid (99.5%), acetone, and toluene were purchased from POCh (Gliwice, Poland). All solvents were of analytical purity.
2.2. Chromatographic Plates
The following chromatographic plates were used in the tests: silica gel 60 F254 on glass plates (#1.05715); silica gel 60 on glass plates (#1.05721); mixture of silica gel 60 and kieselguhr F254 on aluminum plates (#1.05567); silanized silica gel 60 F254 (RP-2) on glass plates (#1.05747); silica gel RP-18F254 on aluminum plates (#1.05559). All chromatography plates were for the TLC analysis and were purchased from Merck (Darmstadt, Germany).
2.3. Standard Solutions
Standard solutions of fluoxetine and sertraline were prepared by dissolving 50 mg of the standard substance in 50 mL of ethanol (99.8%), resulting in a solution with a concentration of 5 mg/5 mL. A series of dilutions were then made from the resulting solution to obtain the following concentrations of fluoxetine and sertraline: 1.00, 0.90, 0.80, 0.70, 0.60, 0.50, 0.40, 0.30, 0.20, 0.10 mg/5mL.
Tables S1 and S2 (in Supplementary Materials) show the concentration values (µg/spot) of fluoxetine and sertraline, the results of which were included in the LOD and LOQ calculations after the TLC-densitometric analysis. Calibration curves were determined on the basis of the data contained in Tables S3–S37. After determining the parameters that characterize the calibration curve, the LOD and LOQ were then calculated (Tables S38 and S39).
2.4. Conditions for Analysis by Adsorption (NP-TLC) and Partition Thin-Layer Chromatography (RP-TLC)
The following plates were used for NP-TLC analysis: 1.05715, 1.05721, 1.05567, and 1.05747. Before starting the loading of the solutions, the chromatographic plates in the stationary phase were activated at 120 °C in an incubator for 30 min. After the specified time had elapsed, the plates were removed and set aside in order to cool them. Then, the prepared solutions were applied to the designated start site with the use of 5 µL microcapillaries.
The chromatographic plates were then developed in the following mobile phases:
- A—chloroform + methanol + ammonia, 9:1:0.4 (v/v/v);
- B—chloroform + methanol + glacial acetic acid, 5:4:1 (v/v/v);
- C—acetone + toluene + ammonia, 10:9:1 (v/v/v).
RPTLC analyses were performed using the 1.05559 and 1.05747 plates. The previously prepared standard solutions were applied to the designated starting places of the chromatographic plates using micropipettes with a volume of 5 µL. The plates were developed in the following mobile phases:
- D—methanol + water, 10:0 (v/v);
- E—methanol + water, 9:1 (v/v);
- F—acetone + water, 10:0 (v/v);
- G—acetone + water, 9:1 (v/v).
After the chromatographic chambers were saturated with the eluent vapors, the chromatographic plates were placed in them and developed at room temperature until the mobile phase front had reached a height of 7.5 cm, which was measured from the starting line. The plates with developed chromatograms were removed from the chambers and placed in racks in a fume hood, where they remained for 24 h until the complete evaporation of the mobile phase.
2.5. Densitometric and Spectrodensitometric Analysis
Densitometric and spectrodensitometric analyses of fluoxetine and sertraline on individual chromatographic plates were performed using a TLC Scanner 3 densitometer with winCATS 1.4.2 software, manufactured by Camag, Muttenz, Switzerland. The measurement was performed in the absorption mode. The wavelength during the spectrodensitometric analysis was in the range of 200–700 nm. The scan speed was 100 nm/s, with a slit size of 6.0 × 0.3 mm, Micro, and a resolution of 1 nm/step. The radiation sources were a deuterium and tungsten lamps.
Densitometric analysis was also performed using a TLC Scanner 3 densitometer with the winCATS 1.4.2 software by Camag, where the radiation source was a deuterium lamp. The optimal wavelengths during scanning were 200 nm and 202 nm for fluoxetine and sertraline, respectively. The analysis was performed in the absorption mode, with a scan speed of 20 mm/s, a slit size of 10.0 × 6.0 mm, Micro, and a resolution of 100 µm/step. The spectra of fluoxetine and sertraline are provided in the Supplementary Materials (Figures S1 and S2).
3. Results
The limit of detection (LOD) and the limit of quantification (LOQ) of fluoxetine and sertraline were calculated from the intercept standard deviation (σa) and the residual standard deviation (σxy) of the calibration curves, according to Formulas (1) and (2). The calibration curves were obtained from the arithmetic mean of the area of the chromatographic bands. Only the areas of the fluoxetine and sertraline chromatographic bands that met the conditions of Formulas (4) and (5) were taken into account in the calculations. Tables S3–S22 (Supplementary Materials) provide the full characterization of the chromatographic band area and calibration plots (i.e., regression equations) prepared to determine the LOD and LOQ results for fluoxetine when tested with the NP-TLC and RP-TLC techniques. Tables S23–S37 provide the full characterization of the chromatographic band area and calibration plots (i.e., regression equations) prepared to determine the LOD and LOQ results for sertraline with the NP-TLC and RP-TLC techniques. The LOD and LOQ values calculated from the intercept standard deviation (σa) and the residual standard deviation (σxy) of the calibration curve are presented in Tables S38–S41. From these values, the mean LOD and LOQ values of fluoxetine and sertraline, analyzed under the particular chromatographic conditions, were calculated.
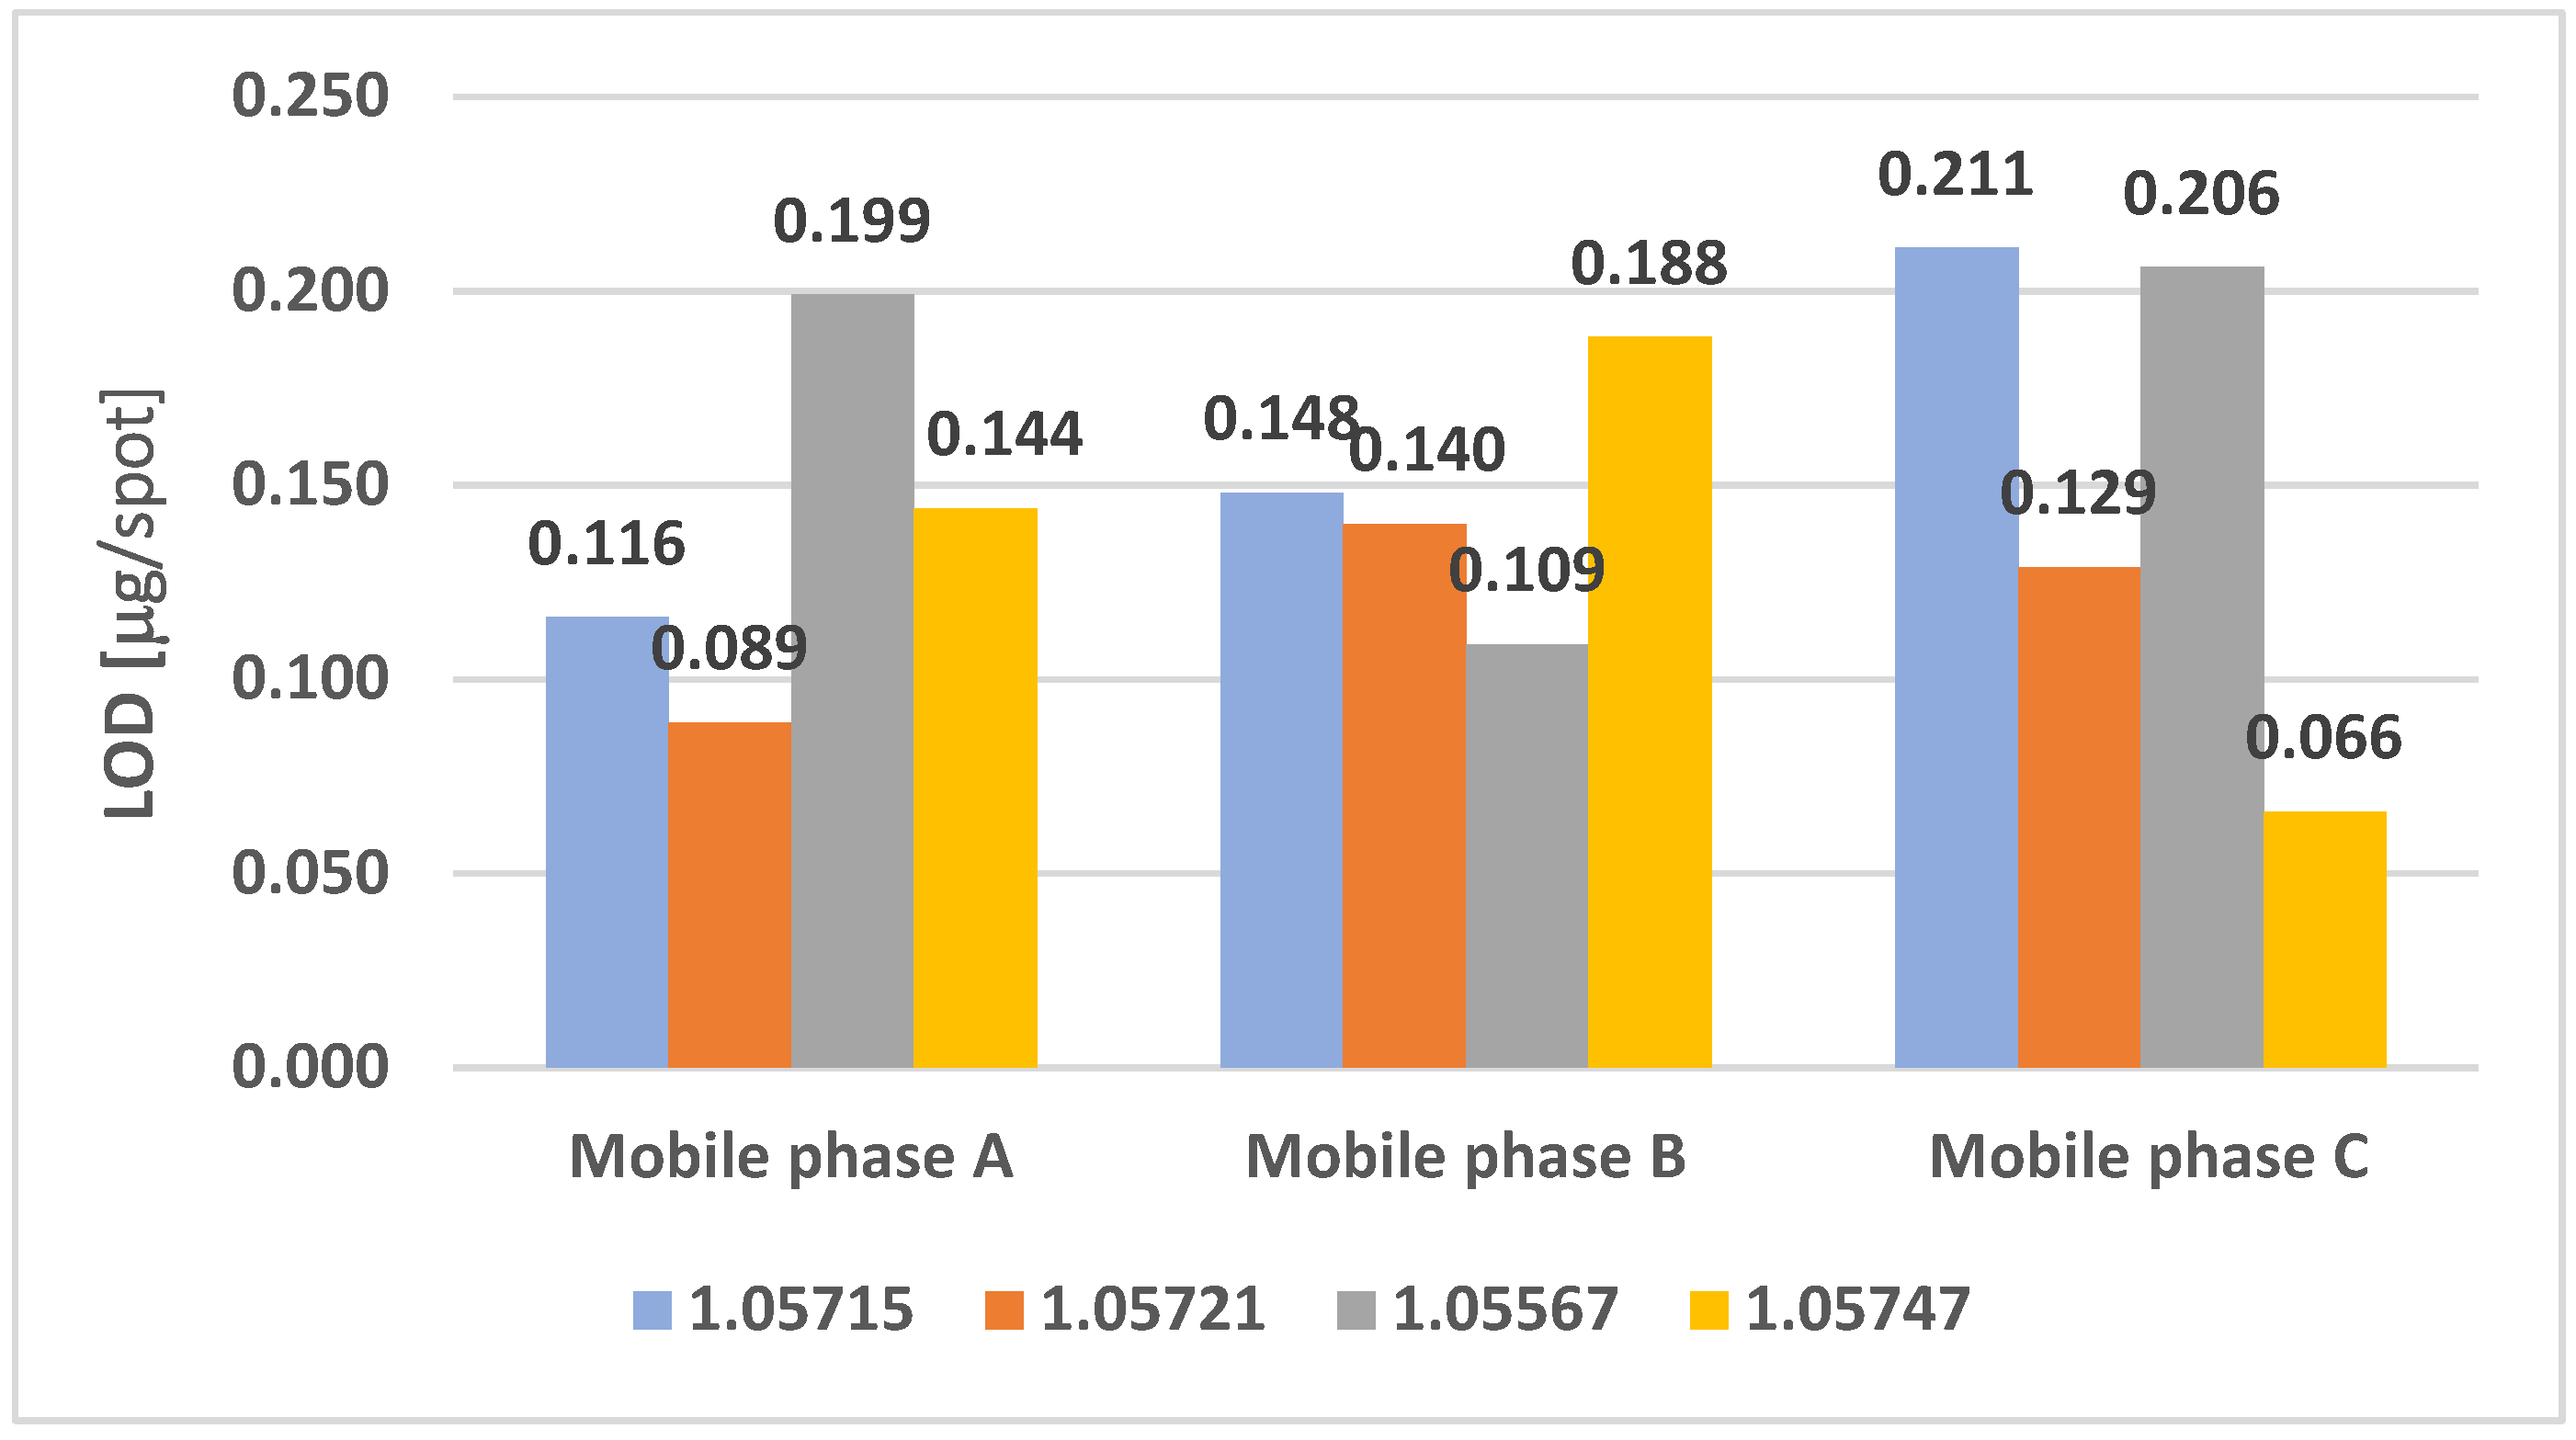
Figure 2 and Figure 3 show a successive comparison of the mean values of the limits of detection and quantification of fluoxetine, obtained by adsorption thin-layer chromatography (NPTLC) with the use of three mobile phases and four chromatographic sorbents.
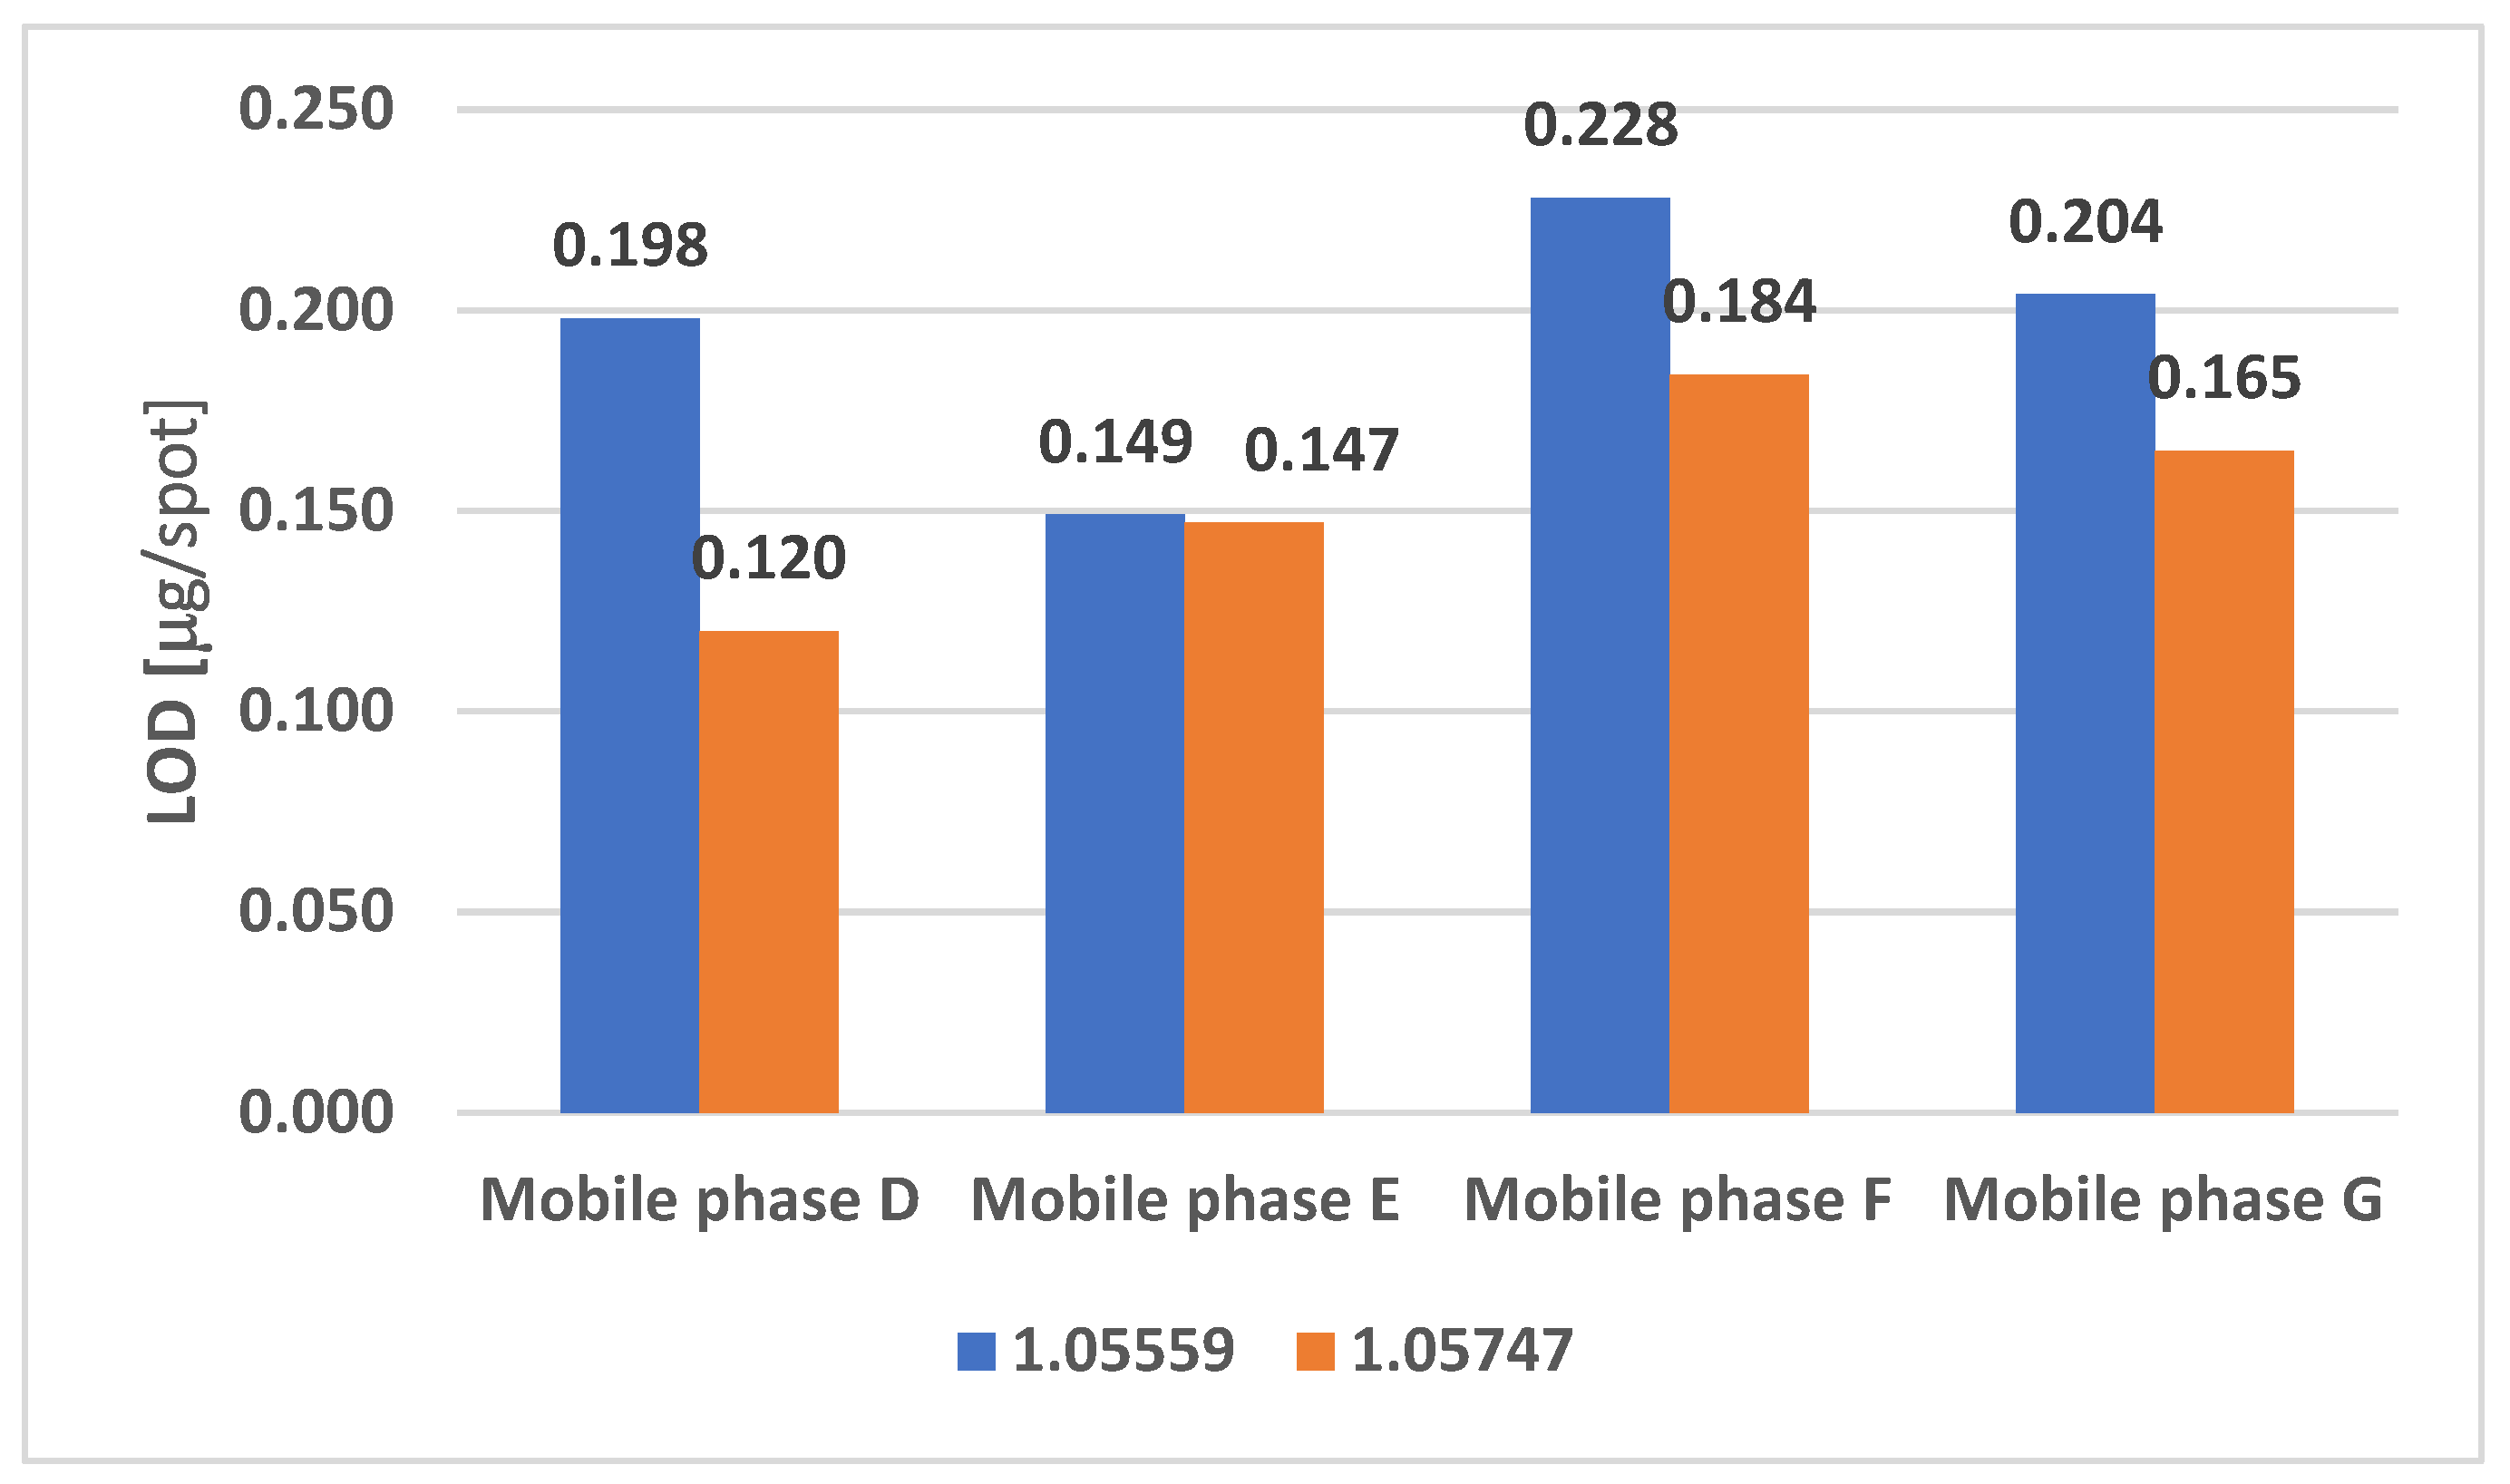
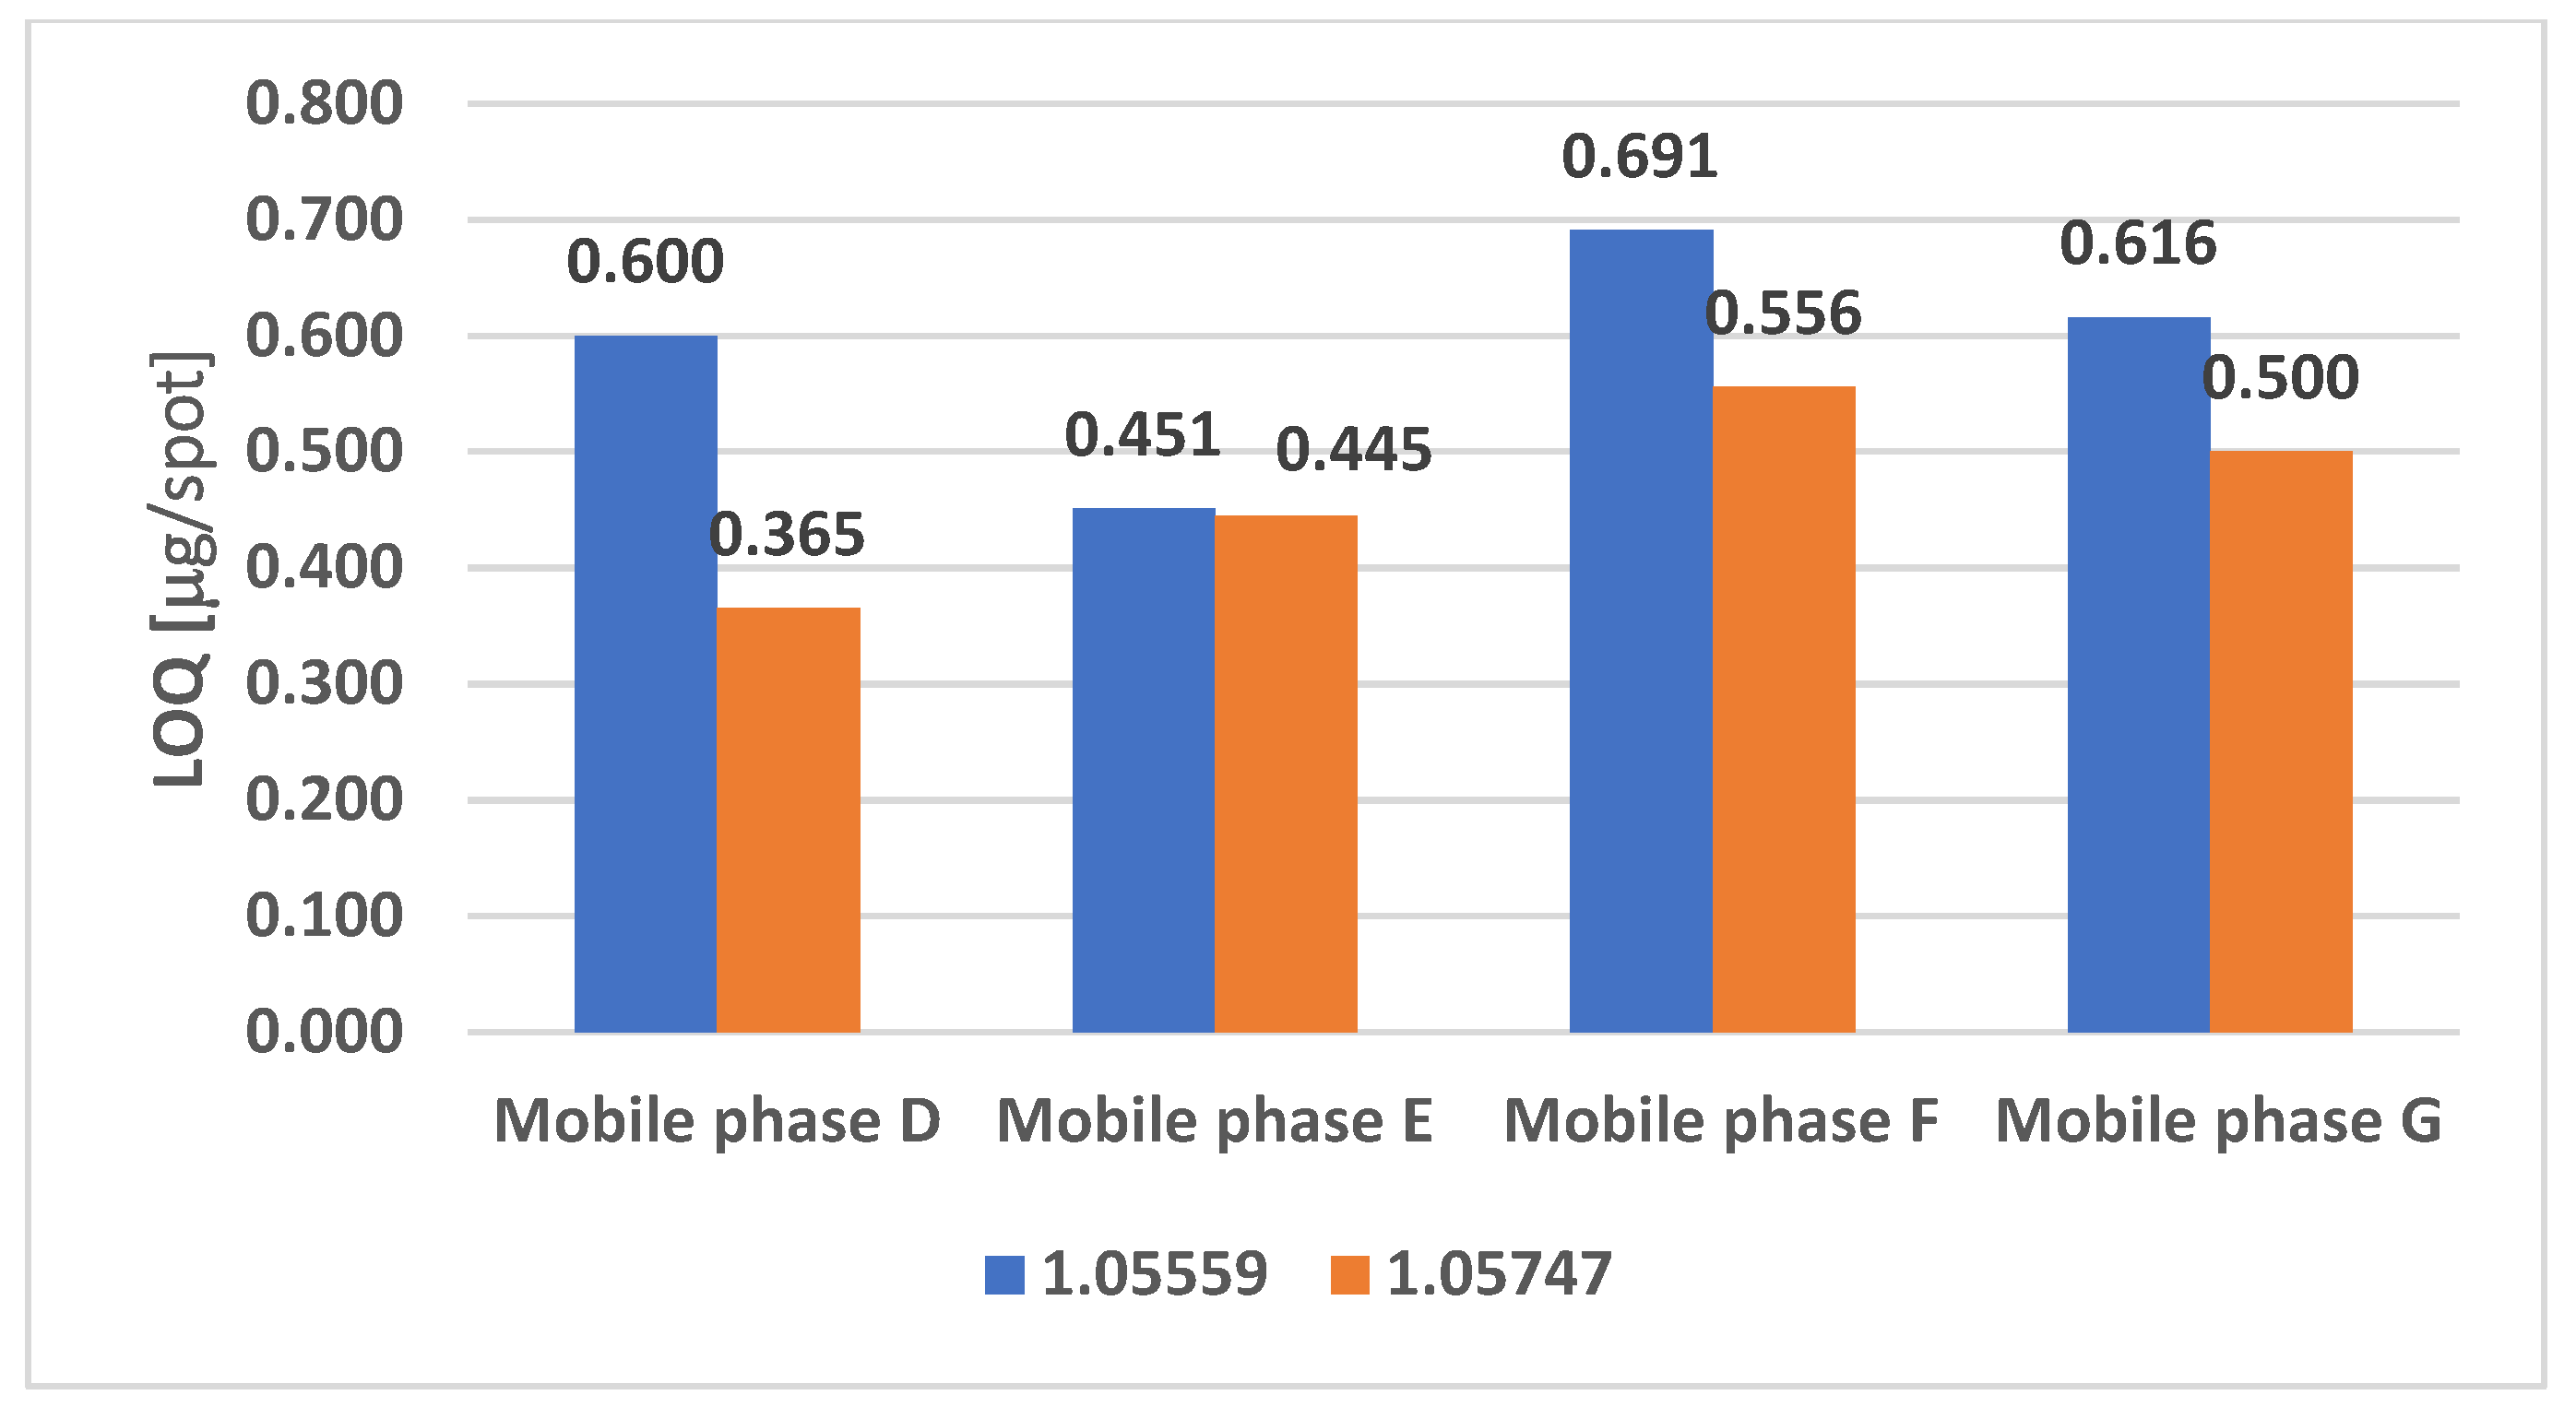
Figure 4 and Figure 5 show a successive comparison of the limits of detection and quantification of fluoxetine, obtained by partition thin-layer chromatography (RPTLC) using four mobile phases and two chromatographic sorbents.
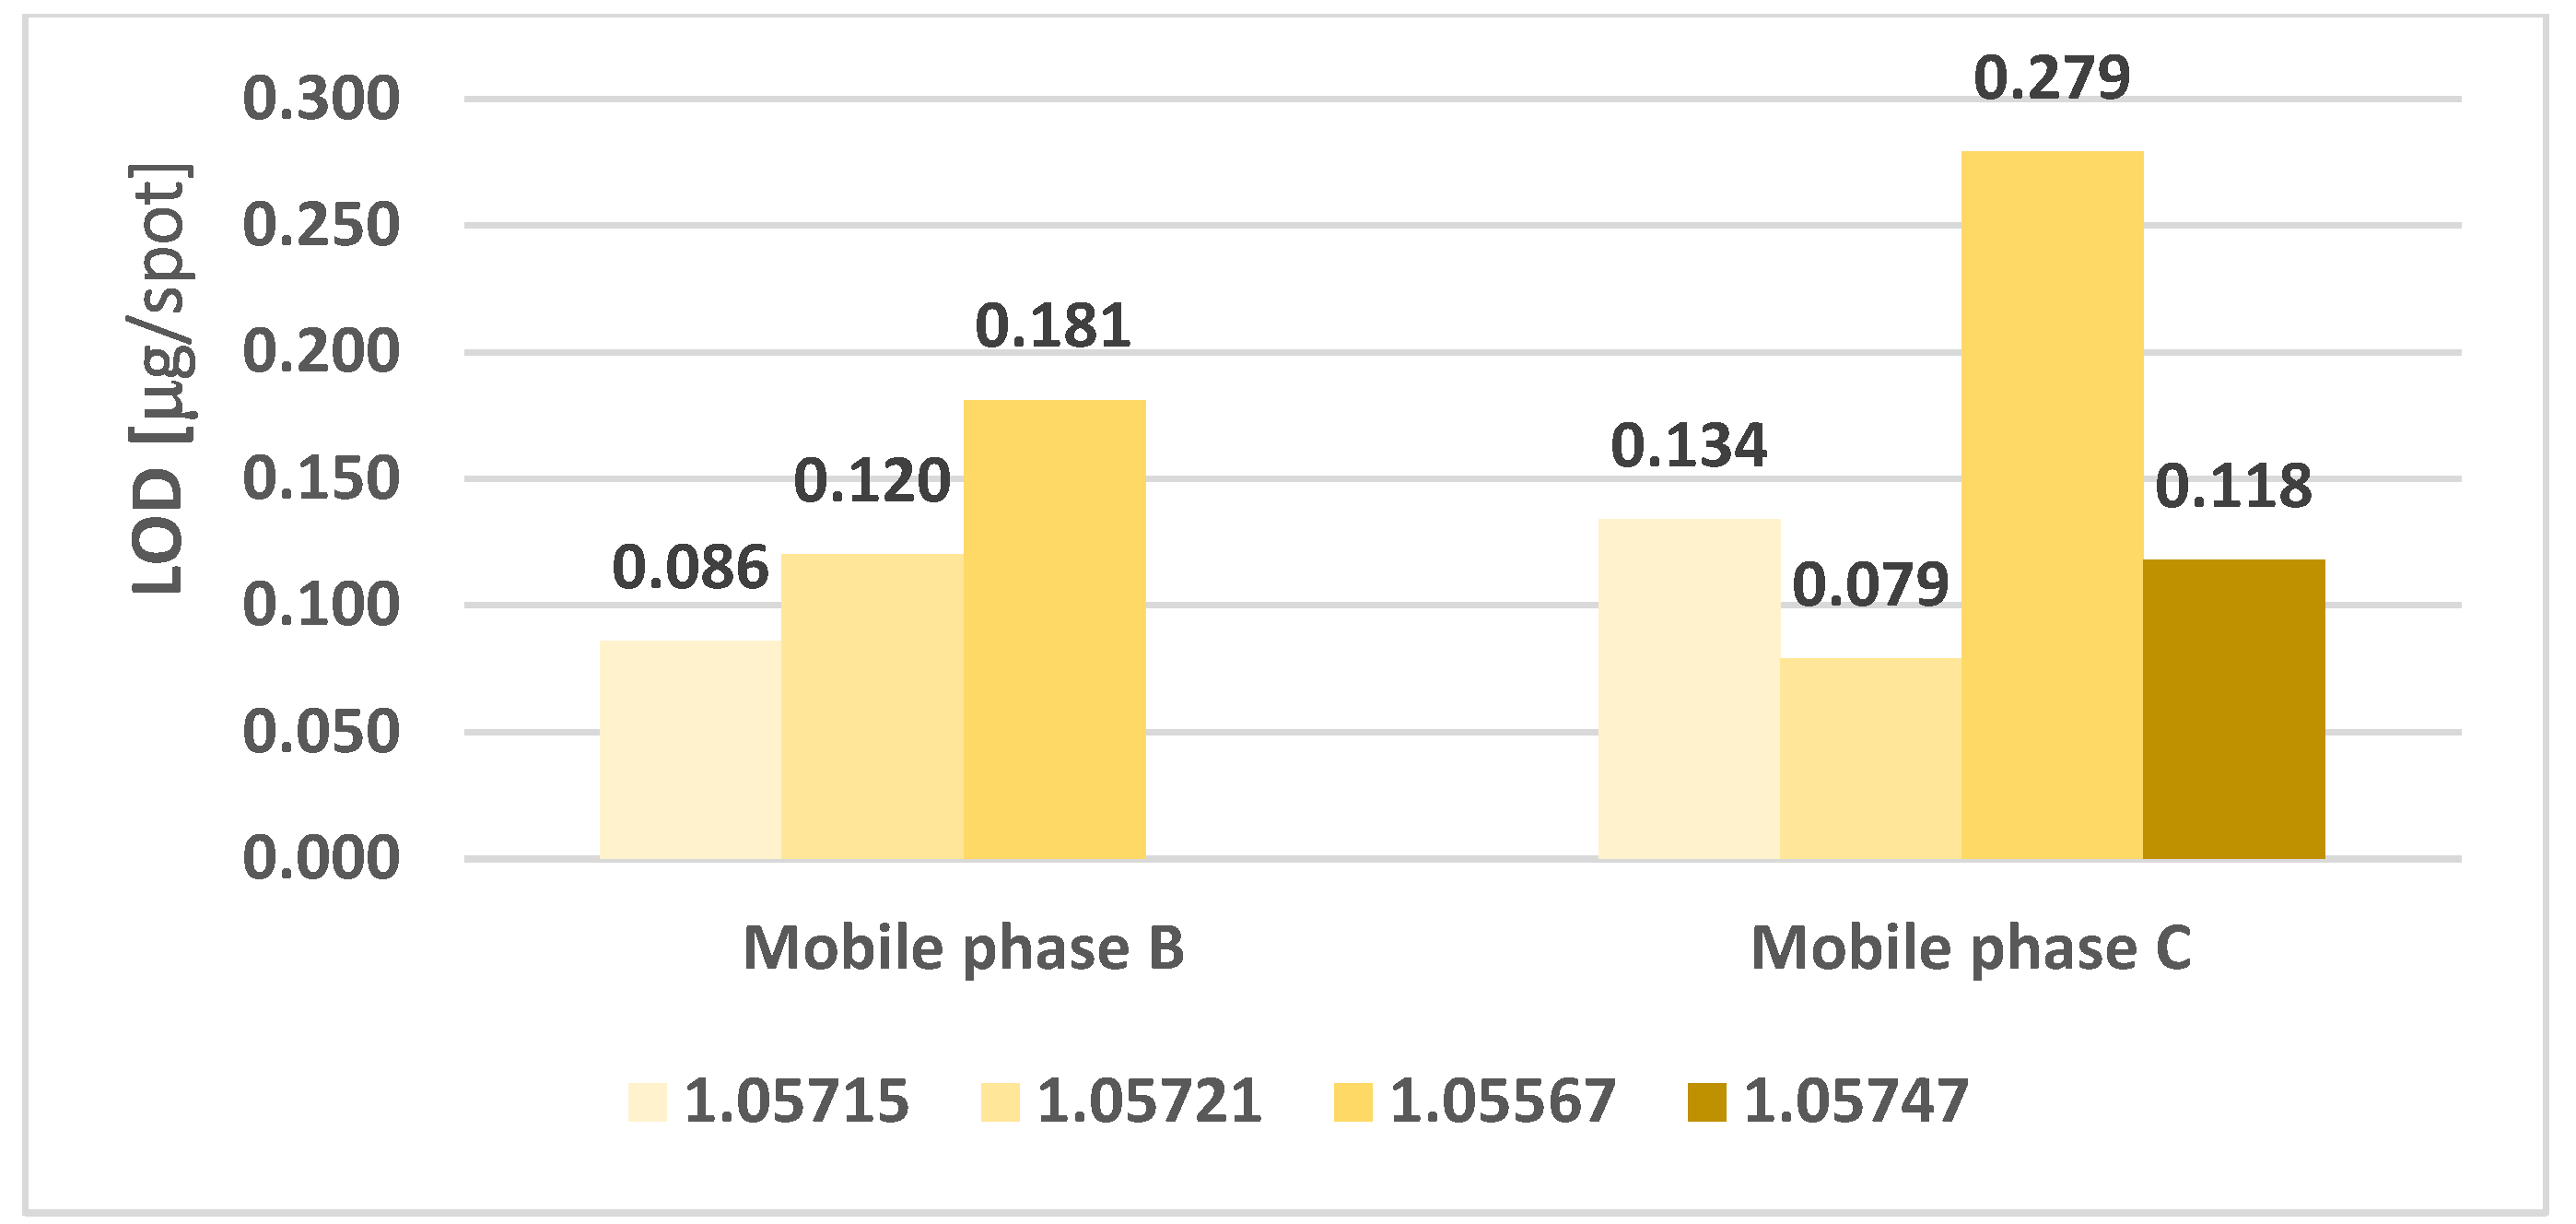
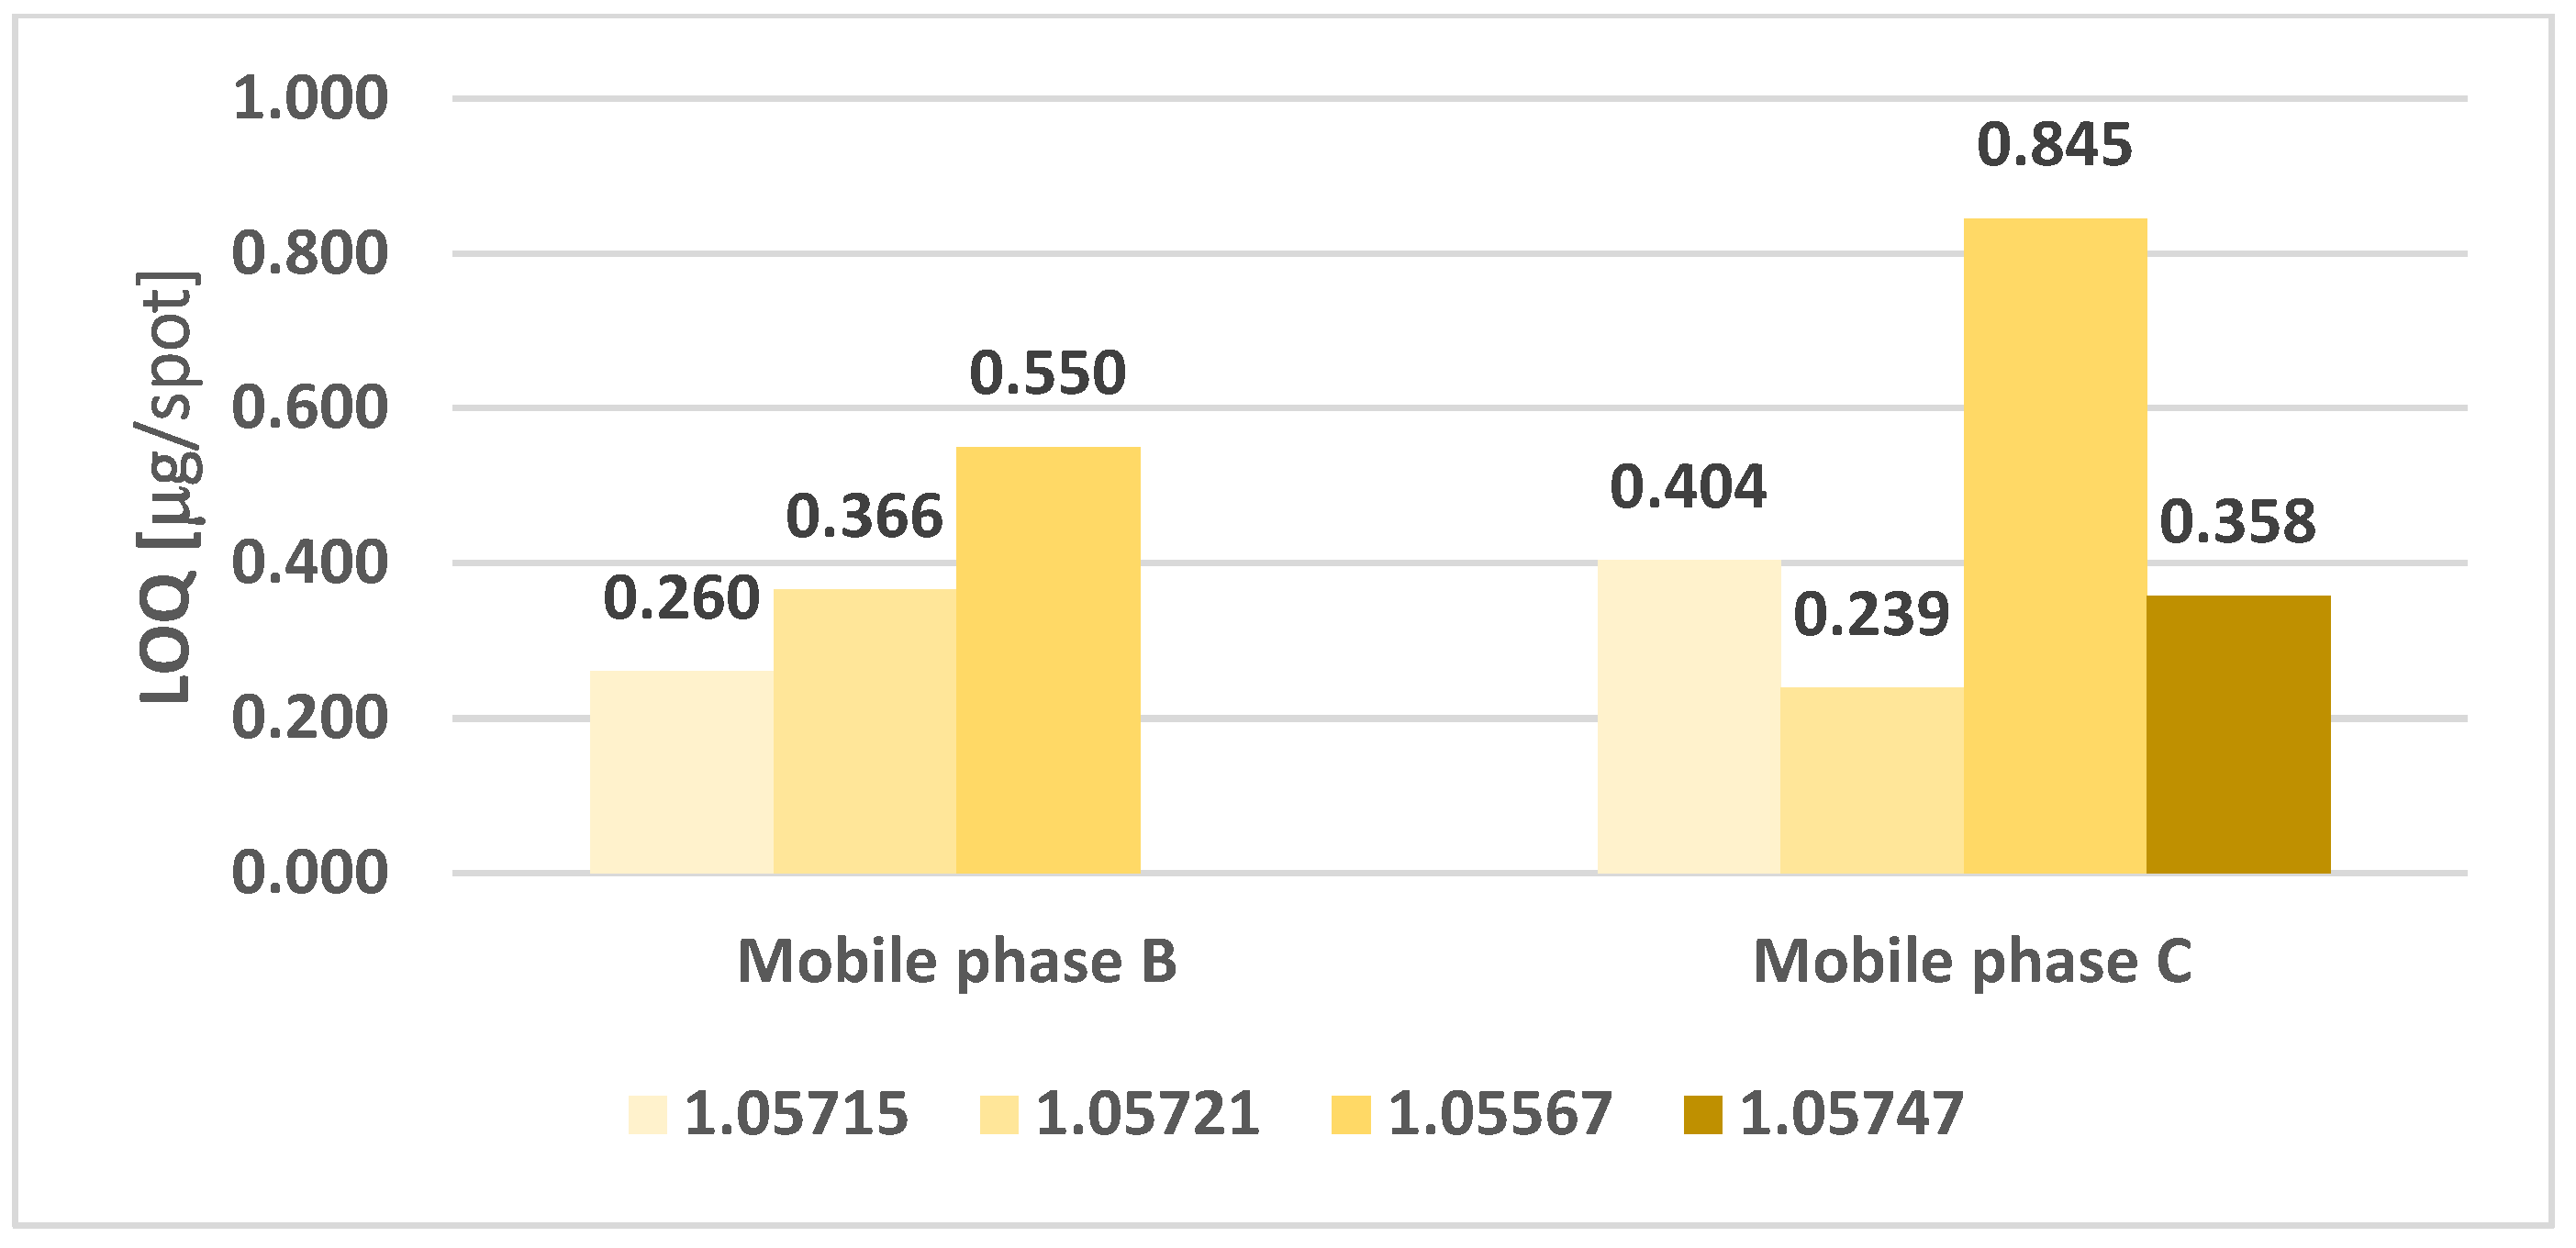
Figure 6 and Figure 7 show a successive comparison of the limits of detection and quantification of sertraline, obtained with adsorption thin-layer chromatography using two mobile phases and four chromatographic sorbents.
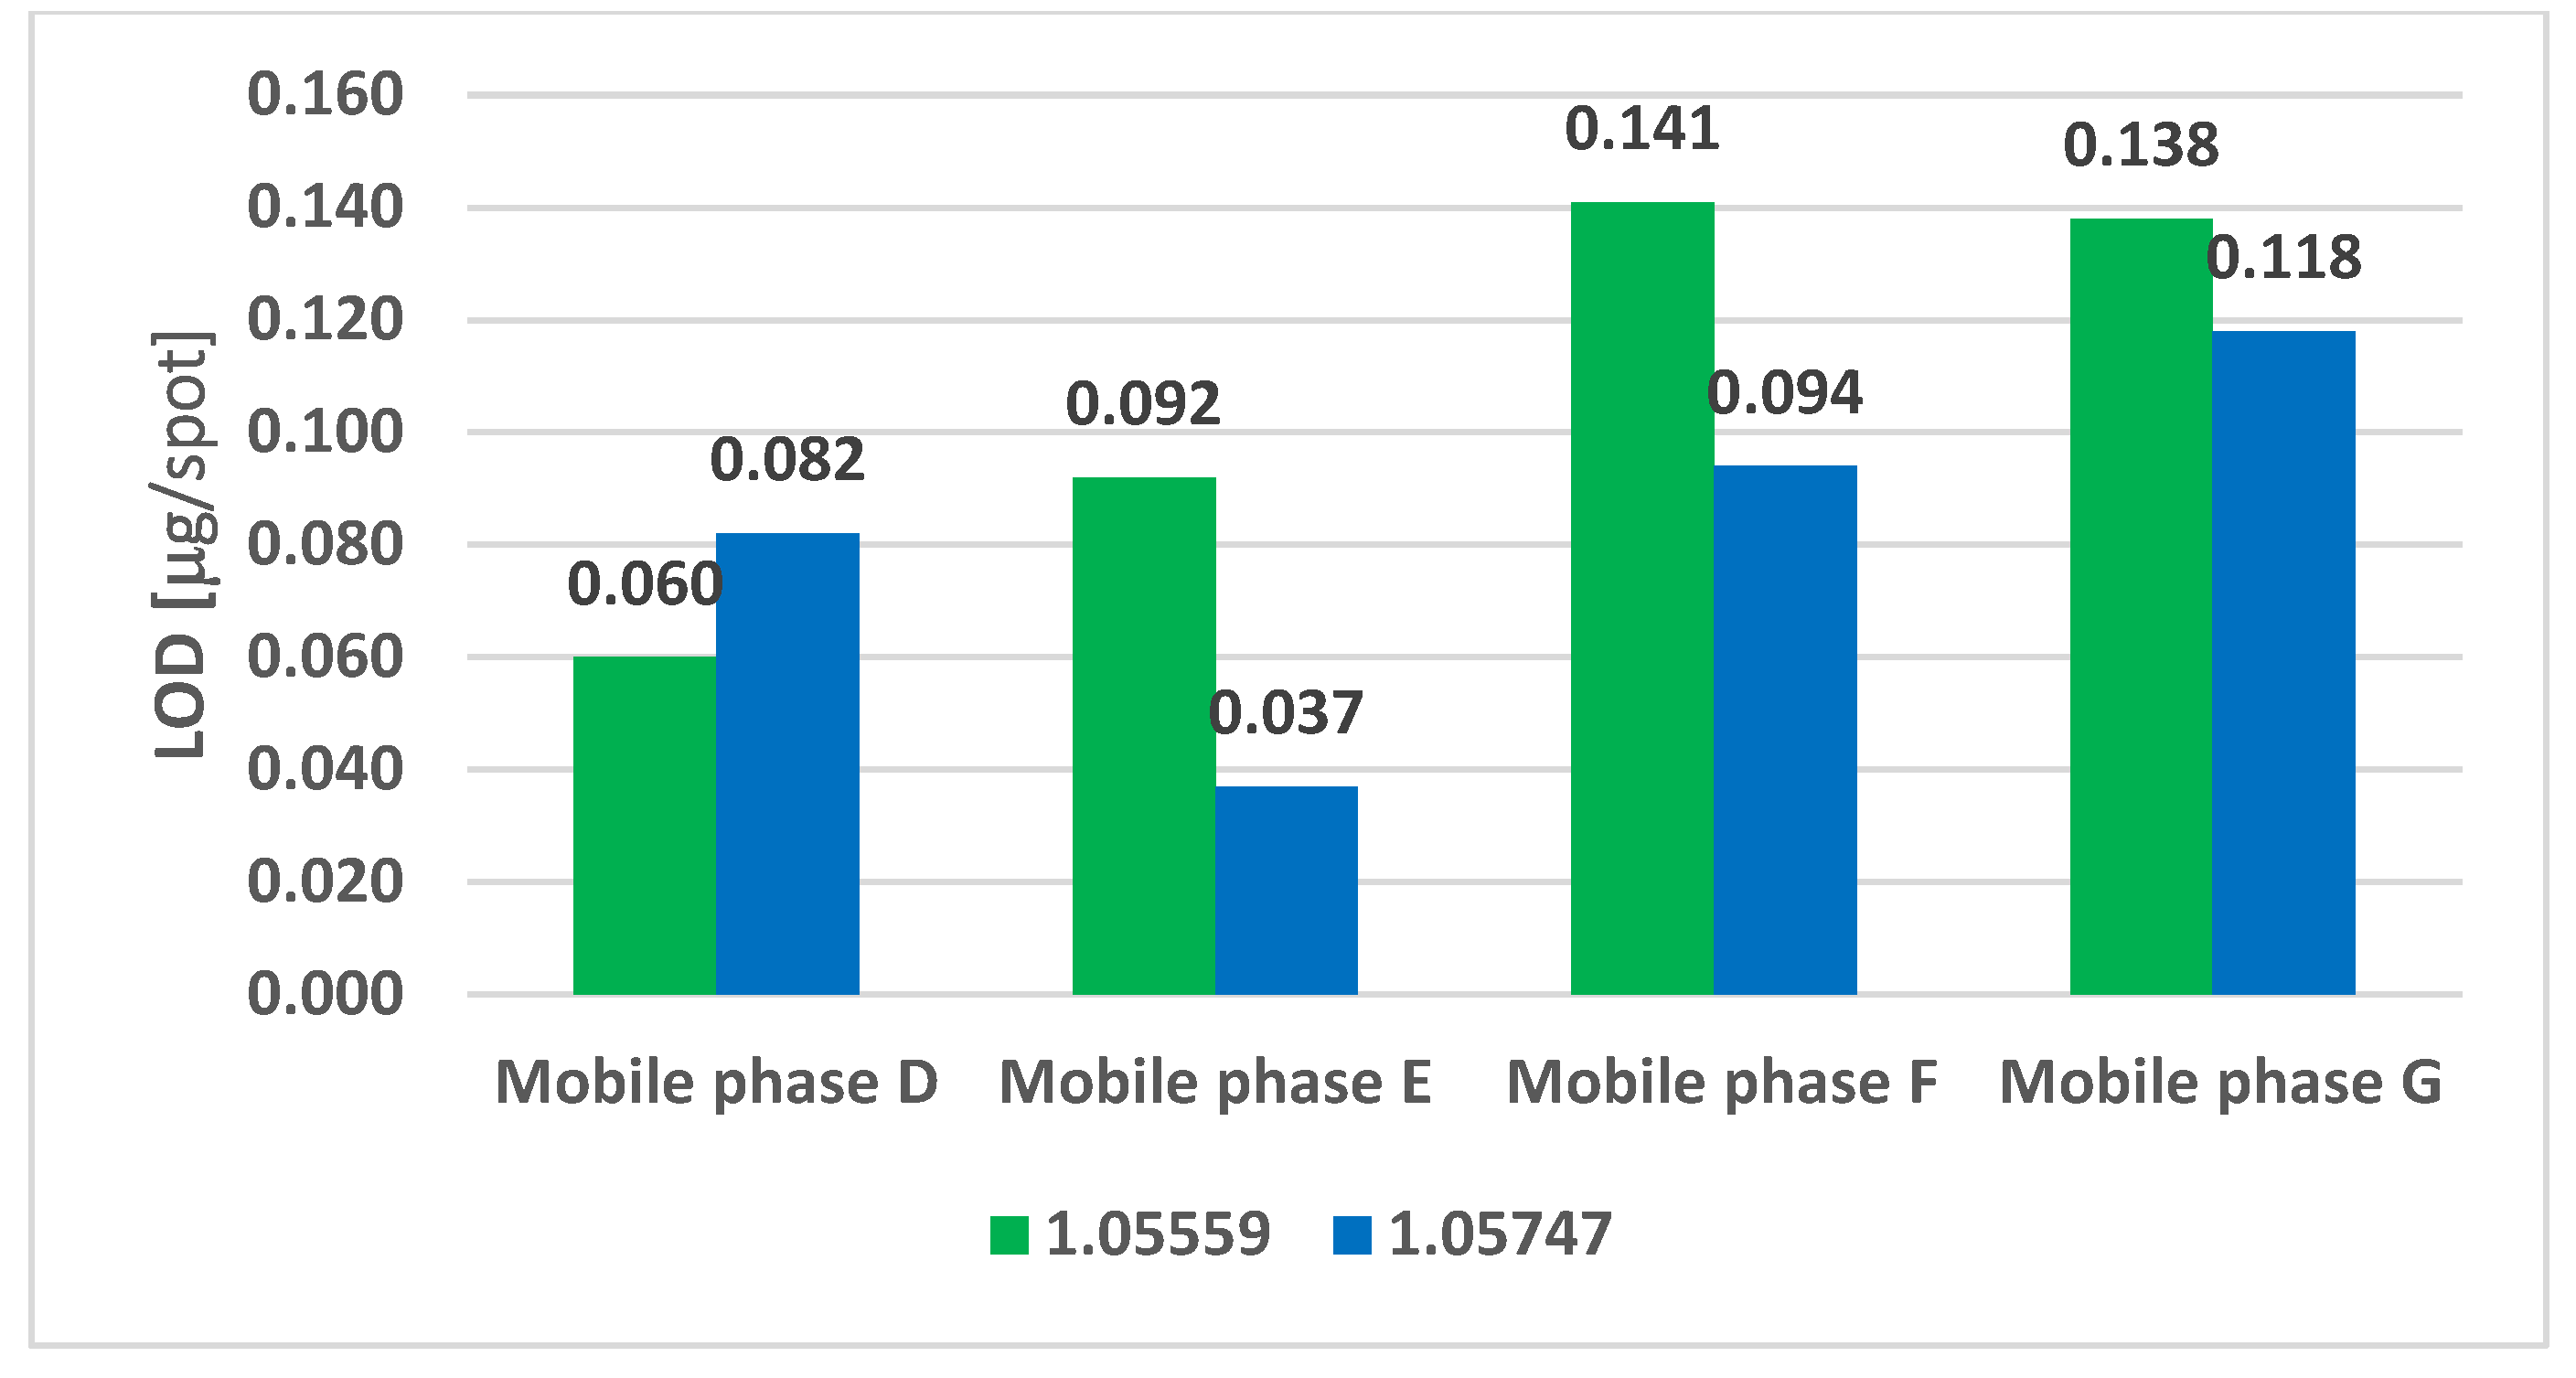
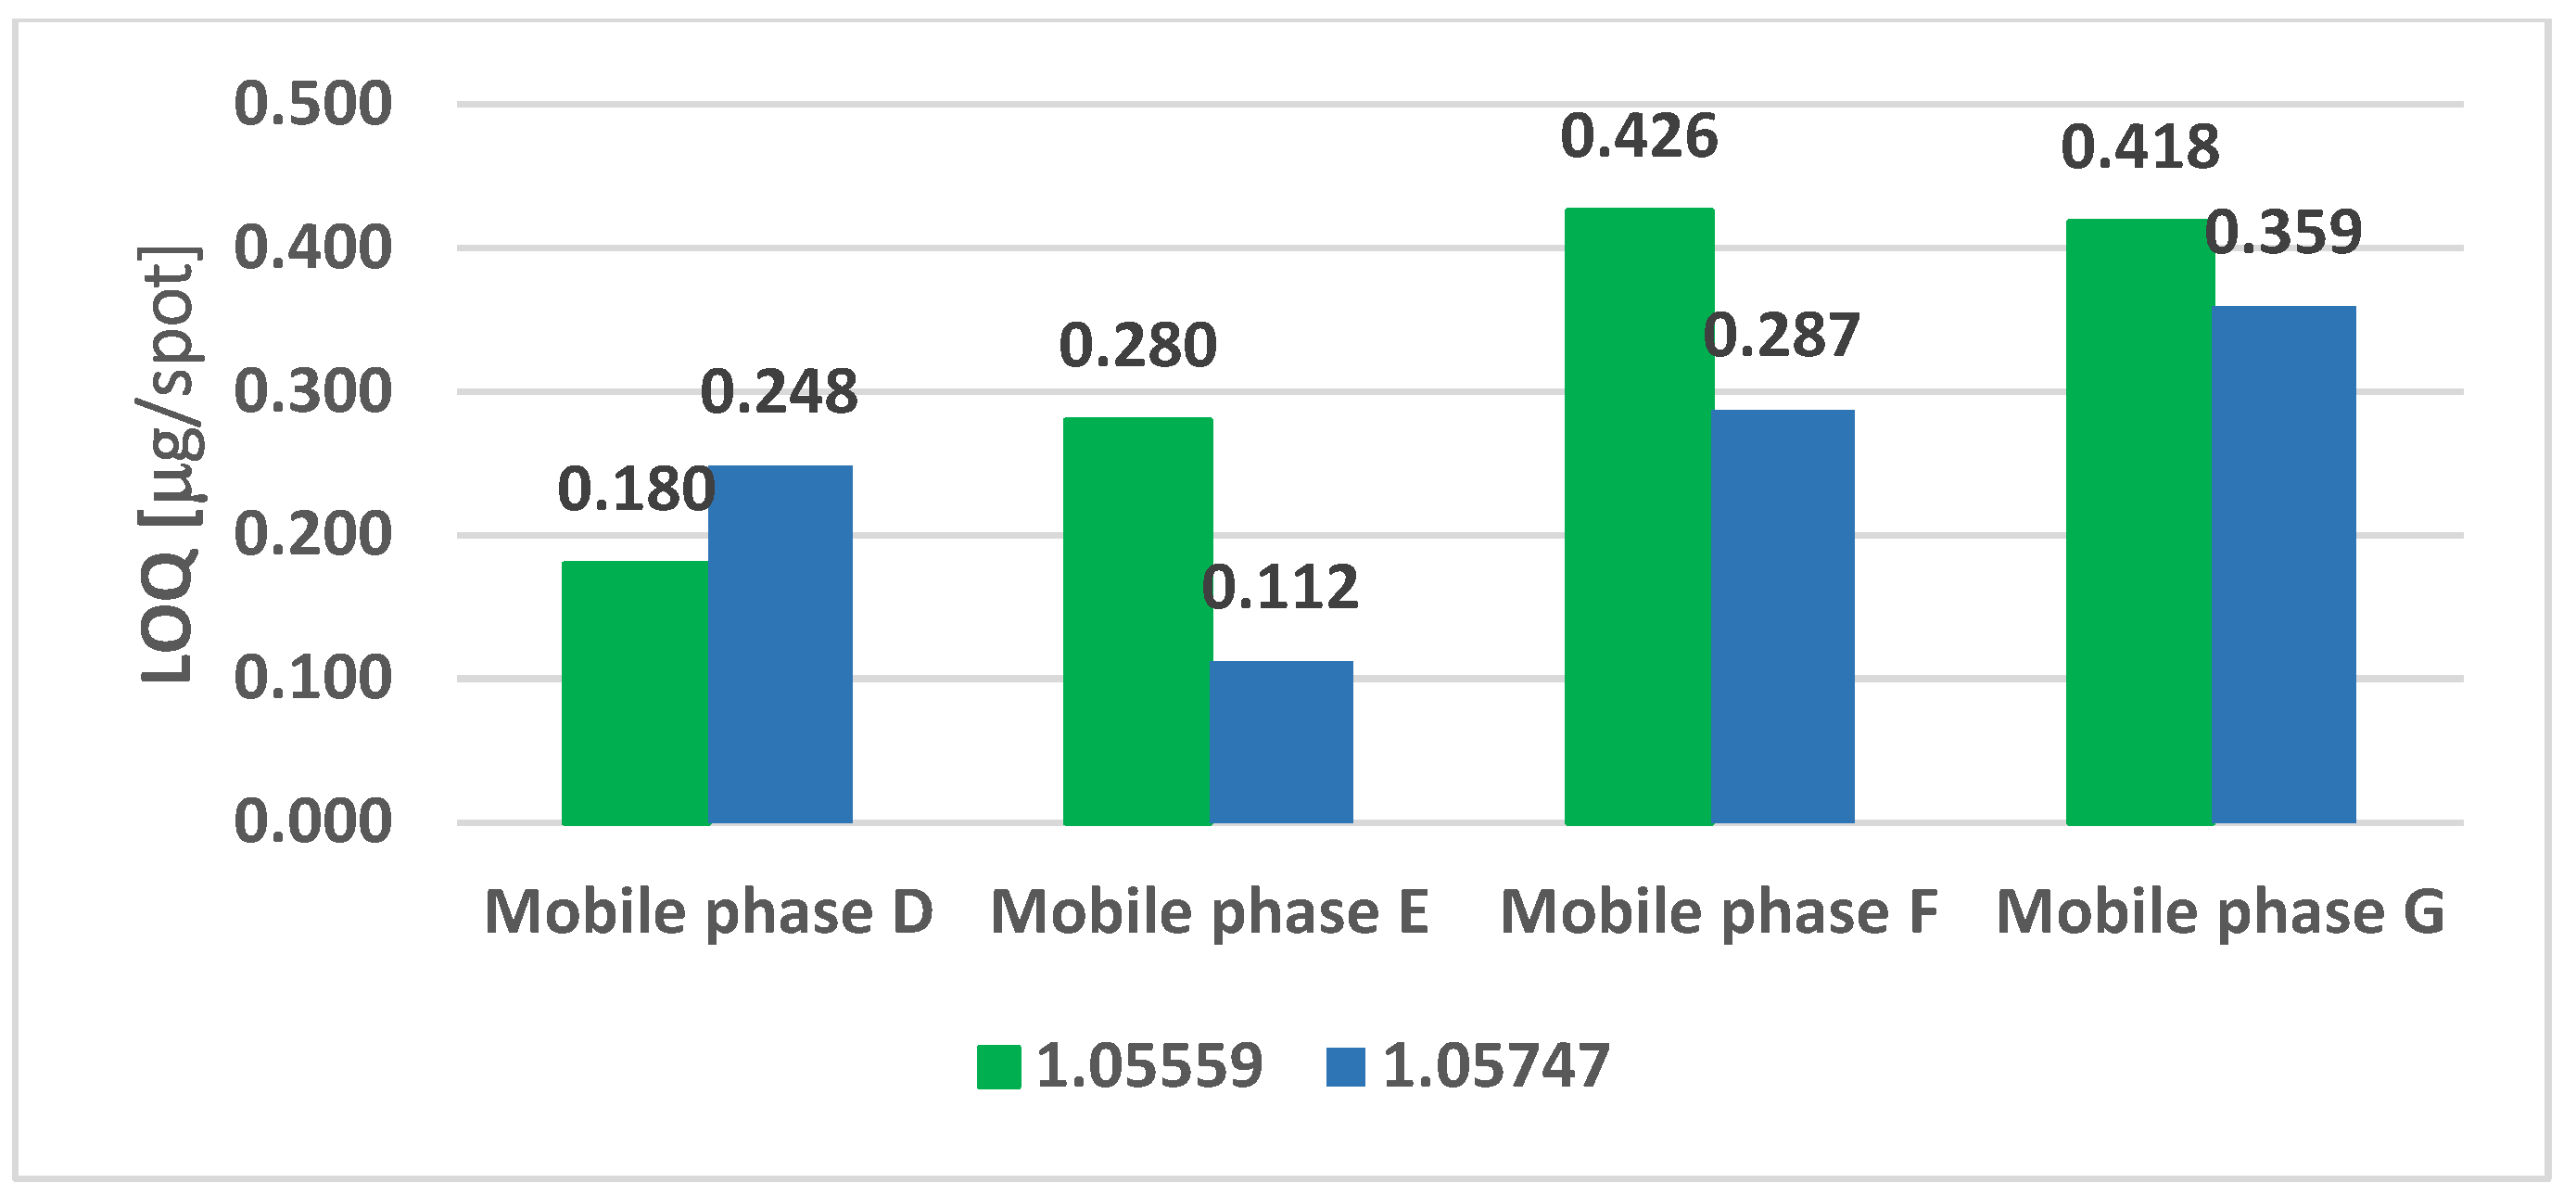
Figure 8 and Figure 9 show a successive comparison of the limits of detection and quantification of sertraline, obtained by partition thin-layer chromatography using four mobile phases and two chromatographic sorbents.
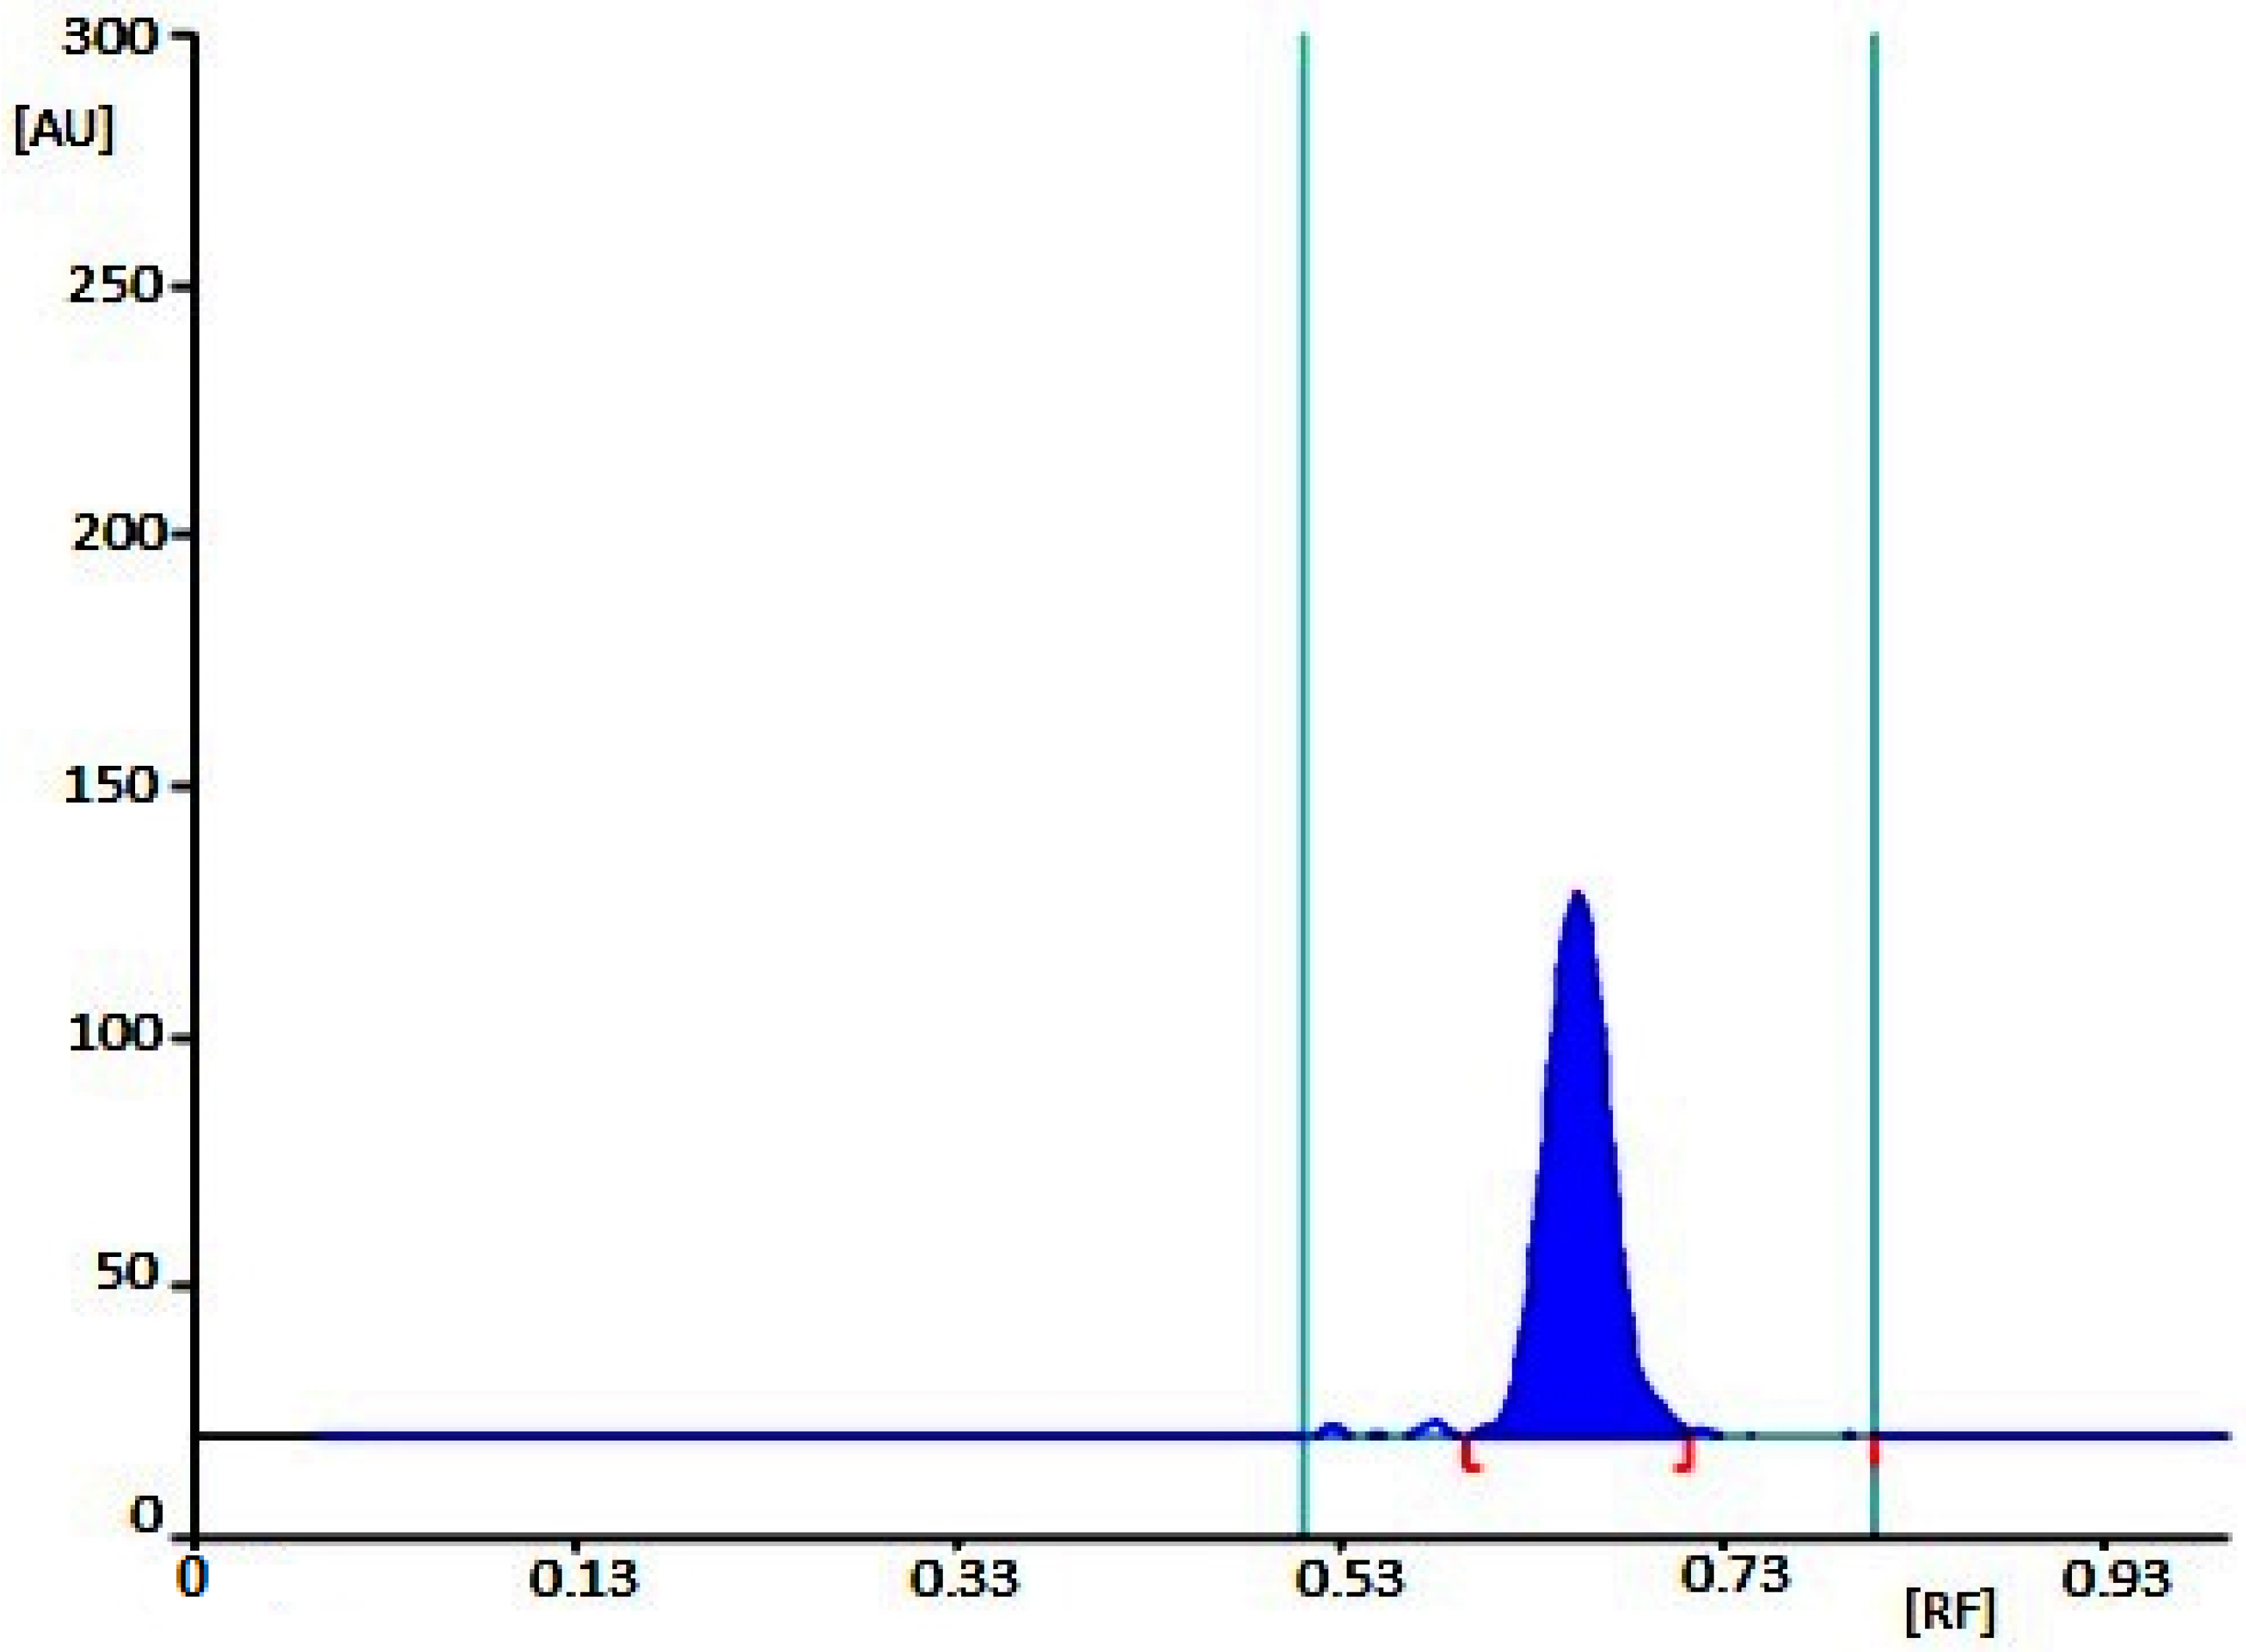
In addition, Figure 10 and Figure 11 as well as Figures S3–S22 show exemplary densitograms of fluoxetine and sertraline (fluoxetine can be separated from sertraline under these chromatographic conditions).
4. Discussion
Our research aimed to find new or modified chromatographic conditions compared to those previously described in the literature in order to indicate the sensitive NPTLC and RPTLC analyses of fluoxetine and sertraline.
Four types of chromatographic sorbents were tested in adsorption thin-layer chromatography (NPTLC), all for classical TLC analysis. More specifically, the analyses were performed on glass plates precoated with silica gel 60 without a fluorescent additive (#1.05721) and with the addition of fluorescent F254 (#1.05715), dimethylsilyl-modified silica gel 60F254 (these plates are also referred to as silanized or RP-2F254) (#1.05747), and on aluminum plates precoated with a mixture of silica gel 60 and kieselguhr F254 (#1.05567). Three mobile phases that were used in the studies proved to be effective for fluoxetine analysis. On the other hand, when the chloroform + methanol + ammonia 9:1:0.4 (v/v/v) mobile phase was used, sertraline migrated from the front of the mobile phase on all the above-mentioned chromatographic plates. Therefore, the results of sertraline only apply to the other two mobile phases, i.e., chloroform + methanol + glacial acetic acid 5:4:1 (v/v/v) and acetone + toluene + ammonia 10:9:1 (v/v/v).
Two types of sorbents were used in partition thin-layer chromatography (RPTLC). More specifically, glass plates precoated with silanized silica gel 60 F254 (#1.05747) and aluminum plates precoated with silica gel 60 F254 were modified with the octadecyl groups (these plates are also referred to as RP-18F254) (#1.05559). Four mobile phases were used in the research: methanol + water 10:0 (v/v), methanol + water 9:1 (v/v), acetone + water 10:0 (v/v), and acetone + water 9:1 (v/v).
4.1. Fluoxetine Analysis
The mean LOD and LOQ values were carefully analyzed to assess the effects of the type of chromatography plates used for NP-TLC and RP-TLC and the employed mobile phases on the detection and quantification of fluoxetine.
A comparison of the LOD and LOQ of fluoxetine tested with the NP-TLC technique (Figure 2 and Figure 3) using three mixtures as mobile phases: chloroform + methanol + ammonia 9:1:0.4 (v/v/v), chloroform + methanol + glacial acetic acid 5:4:1 (v/v/v), and acetone + toluene + ammonia 10:9:1 (v/v/v), and four types of chromatography plates (1.05715, 1.05721, 1.05747, 1.05567) indicated that the limit of detection (LOD) of fluoxetine for the three mobile phases was generally comparable, i.e., it was in the range of 0.066–0.211 µg/spot. The lowest LOD and LOQ values of 0.066 and 0.199 µg/spot, respectively, were obtained on the 1.05747 plate using the C mobile phase composed of acetone + toluene + ammonia 10:9:1 (v/v/v). The second lowest results, 0.089 µg/spot for LOD and 0.269 µg/spot for LOQ, were obtained with the 1.05721 plate and mobile phase A composed of chloroform + methanol + ammonia 9:1:0.4 (v/v/v). The third lowest results, 0.129 µg/spot for LOD and 0.389 µg/spot for LOQ, were obtained with the 1.05721 plate and the C mobile phase composed of acetone + toluene + ammonia 10:9:1 (v/v/v). The use of these sorbents in combination with certain mobile phases enabled the detection and determination of the lowest fluoxetine concentration. Therefore, these chromatographic conditions are the most sensitive.
A comparison of the LOD and LOQ of fluoxetine tested by RP-TLC (Figure 4 and Figure 5) using four mixtures as mobile phases: methanol + water 10:0 (v/v), methanol + water 9:1 (v/v), acetone + water 10:0 (v/v), acetone + water 9:1 (v/v), and two types of chromatography plates (1.05747, 1.05559) indicated that the limit of detection (LOD) of fluoxetine for the four mobile phases was generally comparable, i.e., it was in the range of 0.120–0.228 µg/spot. The lowest LOD and LOQ values, equal to 0.120 and 0.365 µg/spot, were obtained on the 1.05747 plate using mobile phase D with the following composition: methanol + water (10:0, v/v). The use of these chromatographic plates in conjunction with a given mobile phase makes it possible to detect and determine the lowest concentration of fluoxetine. The next lowest LOD and LOQ results were obtained on the 1.05559 (where LOD = 0.147 µg/spot, LOQ = 0.445 µg/spot) and 1.05747 (where LOD = 0.149 µg/spot, LOQ = 0.451 µg/spot) plates using mobile phase E composed of methanol + water (9: 1, v/v). The difference between the described results obtained with mobile phase E in combination with the mentioned plates is negligible. In all cases, lower LOD and LOQ values were achieved with carrier 1.05747, which can be attributed to better detectability and quantification of fluoxetine.
4.2. Sertraline Analysis
A comparison of the LOD and LOQ of sertraline tested with the NP-TLC technique (Figure 6 and Figure 7) using two mixtures as mobile phases: chloroform + methanol + glacial acetic acid 5:4:1 (v/v/v), acetone + toluene + ammonia 10:9:1 (v/v/v), and four types of chromatography plates (1.05715, 1.05721, 1.05747, 1.05567) indicated that the limit of detection (LOD) of sertraline was generally comparable for the two mobile phases, i.e., in the range of 0.079–0.279 µg/spot. The lowest LOD and LOQ values of 0.079 and 0.239 µg/spot, respectively, were obtained on the 1.05721 plate using the C mobile phase, composed of acetone + toluene + ammonia 10:9:1 (v/v/v). Another slightly higher result was obtained on the 1.05715 plate (LOD = 0.086 µg/spot, LOQ = 0.260 µg/spot) in combination with mobile phase B, composed of chloroform + methanol + glacial acetic acid 5:4:1, (v/v/v). The third, slightly higher than the second result, was obtained on the 1.05747 plate (LOD = 0.118 µg/spot, LOQ = 0.358 µg/spot) in combination with the C mobile phase, composed of acetone + toluene + ammonia 10:9:1 (v/v/v). The use of the above-mentioned sorbents and mobile phases made it possible to detect and determine the lowest concentration of sertraline. On the 1.05747 plate, using mobile phase B, sertraline migrated to the front of the mobile phase. Therefore, this sorbent prevents the detection and determination of sertraline with mobile phase B.
A comparison of the LOD and LOQ of sertraline tested by RP-TLC (Figure 8 and Figure 9) using four mixtures as mobile phases: methanol + water 10:0 (v/v), methanol + water 9:1 (v/v), acetone + water 10:0 (v/v), and acetone + water 9:1 (v/v), and two types of chromatographic plates (1.05747, 1.05559) indicated that the limit of detection (LOD) of sertraline is in the range of 0.037–0.141 µg/spot. Lower LOD and LOQ values were obtained for the methanol + water mobile phases (10:0 and 9:1, v/v). When these two mobile phases were used, the LOD of sertraline was in the range of 0.037–0.092 µg/spot. However, in the case of using the acetone + water mobile phases (10:0 and 9:1, v/v), the LOD of sertraline was in the range of 0.094–0.141 µg/spot. The lowest LOD and LOQ values, equal to 0.037 and 0.112 µg/spot, respectively, were obtained on the 1.05747 plate using the E mobile phase composed of methanol + water (9:1, v/v). The second lowest values for LOD (0.060 µg/spot) and LOQ (0.180 µg/spot) were obtained on the 1.05559 plate in combination with mobile phase D, which had the following composition: methanol + water (10:0, v/v). The third consecutive lowest LOD (0.082 µg/spot) and LOQ (0.248 µg/spot) results were obtained on the 1.05747 plate in combination with mobile phase D, with the following composition: methanol + water (10:0, v/v). The use of the mentioned sorbents together with the given mobile phases made it possible to detect and determine the lowest concentration of sertraline.
4.3. Comparison of the Detection of Fluoxetine and Sertraline as Well as Practical Utility of the Obtained Results
Under some of the chromatographic conditions used, it was possible to separate sertraline and fluoxetine. Figure 10 and Figure 11 as well as Figures S3–S22 show densitograms (chromatograms) of sertraline and fluoxetine. Under these chromatographic conditions, sertraline and fluoxetine have different RF values which allow for their separation. From a pharmaceutical point of view, chromatographic conditions are of particular importance as they allow for the separation of sertraline from fluoxetine and are characterized by high sensitivity (low LOD and LOQ) at the same time.
In general, when testing fluoxetine and sertraline, a very good chromatographic sorbent for both NPTLC and RPTLC is silanized silica gel 60 F254 (RP-2F254, #1.05747). Fluoxetine and sertraline can be analyzed on this chromatographic plate with very good sensitivity (low LOD and LOQ) using the following mobile phases: acetone + toluene + ammonia (10:9: 1, v/v/v), methanol + water (10:0, v/v), and methanol + water (9:1, v/v). These chromatographic conditions ensure the simultaneous determination of fluoxetine and sertraline because these chromatographic conditions ensure the separation of fluoxetine and sertraline, as shown by the RF values listed in Tables S38 and S39 and the densitograms shown in Figures S13–S16, S19 and S20. Fluoxetine and sertraline can also be analyzed with very good sensitivity (low LOD and LOQ) on chromatography plates precoated with silica gel 60 (#1.05721) and with the acetone + toluene + ammonia mobile phase (10:9:1, v/v/v). Again, it is possible to separate fluoxetine from sertraline (Figure 10 and Figure 11). Under these chromatographic conditions, the RF is 0.24 and 0.63 for fluoxetine and sertraline, respectively.
The obtained results are of practical use because, in accordance with pharmacopoeial recommendations, they allow the identity of fluoxetine and sertraline to be tested. The purpose of this test is to confirm that a given substance corresponds to the substance declared in a pharmaceutical preparation. The identity is most often tested by comparing the RF value of the standard substance with the RF value of the biologically active substance present in the drug. However, in complex mixtures, the retention parameters of a substance may be a criterion, but not the only one, for compound identification. Then, it is assumed that the substance is the same as the standard if the retention values (in the case of TLC—the RF retardation factor) are the same for the three chromatographic systems with different stationary and mobile phases. On the other hand, the determination of the limit of detection allows for the discernment of the concentration in the given chromatographic conditions (chromatographic carrier, i.e., chromatographic plate and mobile phase) at which its presence can be detected on the chromatographic plate. Thus, the RF values presented in Tables S38 and S39 for fluoxetine and sertraline, respectively, allow for the selection of three different chromatographic conditions to test the identity of fluoxetine and sertraline. The LODs for fluoxetine and sertraline in particular chromatographic conditions given in this work are an indication of the lowest possible concentrations of fluoxetine and sertraline that can be detected under given chromatographic conditions.
4.4. Comparison of the Obtained Values for the Limit of Detection (LOD) of Fluoxetine and Sertraline with the Literature Values
Table 1 shows the LOD results for fluoxetine and sertraline using the different methods for the stationary and mobile phases. The lowest LOD values obtained in this study are marked in red in this table.
During the experiment, Gondová et al. [39] performed a simultaneous analysis of four antidepressants: fluoxetine, sertraline, fluvoxamine, and citalopram. They used the technique of adsorption thin-layer chromatography. The stationary phase employed glass plates precoated with silica gel 60 F254, while the mobile phase consisted of acetone, benzene, and 25% ammonia (50:45:5, v/v/v). After developing the chromatograms, the plates were subjected to densitometric analysis. The results were determined on the basis of a calibration curve [39]. The literature LOD value for both fluoxetine and sertraline in this case is 0.050 µg/spot. Skibiński et al. [40] analyzed fluoxetine and paroxetine by NPTLC using silica gel 60 F254 and benzene + acetone + ethanol + 25% aqueous ammonia (9:7:2:1, v/v/v/v). The limit of detection for fluoxetine was equal to 0.05 µg/spot. These values are lower than the lowest results obtained by this study during the test performed with adsorption thin-layer chromatography (Table 1). This means that the tested chromatographic conditions are characterized by worse detection and quantification properties as compared to the test conditions described in the publication by Gondová et al. [39] and Skibiński et al. [40]. This is because lower levels of fluoxetine and sertraline may be detected and quantified. However, the mobile phases proposed by Gondová et al. [39] and Skibiński et al. [40] cannot be recommended for use at present due to the fact that it contains benzene, which has carcinogenic properties.
Another method used, inter alia, to analyze the limit of detection was high-performance adsorption thin-layer chromatography (HPTLC). This method was used by Shah et al. [41] in a publication aimed at the simultaneous determination of fluoxetine and olanzapine. During the tests, the stationary phase made use of aluminum sheets precoated with silica gel 60 F254 and the mobile phase methanol + toluene (40:20, v/v). The LOD value for fluoxetine was 0.132 µg/spot, and it was calculated using Formulas (1) and (2) [41]. Researchers using the adsorption HPTLC technique obtained a higher LOD result, equal to 0.132 µg/spot, as compared to the LOD values obtained by this study using the TLC adsorption technique (0.066 µg/spot). The same team of researchers, Shah et al. [42], again performed a study involving the simultaneous determination of fluoxetine and olanzapine using the same stationary and mobile phases (aluminum sheets precoated with silica gel 60 F254, mobile phase—methanol + toluene (40:20, v/v)), but with a different concentration of the standard solutions. The LOD of fluoxetine obtained in this study was 0.300 µg/spot, which is higher than the previous one [42].
Gondová et al. [43] used RPTLC to quantify fluoxetine and citalopram. During the research, RP-18 F254s TLC on an aluminum plate and methanol + 0.05 M phosphate buffer (pH 5) + triethylamine (68:27:5, v/v) were used. The limit of detection for fluoxetine was 0.100 µg/spot. This result is lower than the result of our partition TLC analysis (0.120 µg/spot).
Rao et al. [44] used the HPTLC adsorption technique to quantify sertraline hydrochloride. During the research, aluminum sheets for HPTLC precoated with silica gel 60 F254 and the mobile phase toluene + ethyl acetate + ethanol + ammonia (8:2:0.5:0.1, v/v/v/v) were used. The limit of detection for sertraline was 0.670 µg/spot. This result is much higher than the result of our TLC adsorption analysis (0.079 µg/spot). This means that the chromatographic conditions used by Rao et al. [44] are characterized by lower detectability, i.e., lower sensitivity.
Hussain et al. [45], in a study that determined the content of sertraline in the lipid nanosystem, used aluminum plates for TLC adsorption, precoated with silica gel 60 F254. The mobile phase consisted of the following solvents: toluene + ethyl acetate + ammonia (1:5:0.1, v/v/v). The LOD of sertraline was 0.015 µg/spot. This is the lowest value as compared to the results obtained by this study and the literature results that were previously mentioned. The chromatographic conditions used ensure that the lowest concentrations of sertraline can be detected.
Vahora et al. [46] analyzed brexpiprazole and sertraline HCl in bulk and synthetic mixtures. The stationary phase selected was a pre-coated silica gel aluminum plate 60 F254, and n-propanol + hexane + toluene + triethylamine (7:2:1:0.1, v/v/v/v) was used as the developing mobile phase. The LOD of sertraline was 0.163 µg/spot. This result is much higher than the result of our TLC adsorption analysis (0.079 µg/spot).
In our previous work [53,54,55,56,57], we assessed the effect of stationary and mobile phases in NPTLC and RPTLC on the LOD and LOQ of hydrocortisone acetate, estradiol hemihydrate, nicotinamide, and ibuprofen. Dołowy [57] conducted similar research on spironolactone. Compared to other drugs, fluoxetine and sertraline as well as hydrocortisone acetate have a relatively narrow LOD range. Therefore, it should be assumed that the LOD of a compound depends on its chemical structure and the applied chromatographic analysis conditions, i.e., the type of chromatographic sorbent and the composition of the mobile phase.
5. Conclusions
The qualitative and quantitative composition of the mobile phase and the type of the stationary phase used affect the limits of detection and quantification of both fluoxetine and sertraline obtained by the technique of adsorption and partition thin-layer chromatography. It was also observed that generally lower LOD and LOQ values were obtained for sertraline as compared to fluoxetine. Therefore, the chemical structure of the detected and determined compound also affects the sensitivity of the analysis. The results of the detection and quantification of fluoxetine and sertraline under the proposed chromatographic conditions confirmed the usefulness of silica gel 60 plates and silanized silica gel 60 F254 plates (RP-2 plates) for the sensitivity analysis of fluoxetine and sertraline. Using the adsorption thin-layer chromatography technique, the smallest amount of fluoxetine was detected and determined using silanized silica gel 60 F254 (RP-2, #1.05747) in combination with a mobile phase composed of acetone + toluene + ammonia (10:9:1, v/v/v). The limit of detection (LOD) for fluoxetine was 0.066 µg/spot, and the limit of quantification (LOQ) for fluoxetine was 0.199 µg/spot. Using the partition thin-layer chromatography technique, the least amount of fluoxetine was detected and determined using silanized silica gel 60 F254 (RP-2, #1.05747) in combination with the mobile phase methanol + water (10:0, v/v). The LOD of fluoxetine was 0.120 µg/spot and the LOQ of fluoxetine was 0.365 µg/spot. Using the adsorption thin-layer chromatography technique, the smallest amount of sertraline was detected and determined using silica gel 60 (#1.05721) in combination with a mobile phase composed of acetone + toluene + ammonia (10:9:1, v/v/v). The LOD of sertraline was 0.079 µg/spot, and the LOQ of sertraline was 0.239 µg/spot. Using the partition thin-layer chromatography technique, the smallest amount of sertraline was detected and determined using silanized silica gel 60 F254 (RP-2, #1.05747) in combination with the mobile phase methanol + water (9:1, v/v). The LOD of sertraline was 0.037 µg/spot, and the LOQ of sertraline was 0.112 µg/spot. These chromatographic conditions allow both the lowest LOD and LOQ values to be obtained and the separation of fluoxetine from sertraline. The obtained results are of practical use because, in accordance with pharmacopoeial recommendations, they allow for the identity of fluoxetine and sertraline to be tested. The purpose of this test is to confirm that a given substance corresponds to the substance declared in a pharmaceutical preparation. The LODs for fluoxetine and sertraline in particular chromatographic conditions given in this work are an indication of the lowest possible concentrations of fluoxetine and sertraline that can be detected under given chromatographic conditions. The obtained results provide important information that can give a good basis and set the direction for further, more detailed research as well as for other researchers who analyze fluoxetine and sertraline using the TLC technique in model systems (testing standards) and also in drug samples and biological samples.
Supplementary Materials
The following are available online on https://www.mdpi.com/article/10.3390/pr10050971/s1. Figure S1: Spectrum of fluoxetine. Figure S2: Spectrum of sertraline. Table S1: Concentrations of fluoxetine standard solutions used for the determination of LOD and LOQ. Table S2: Concentrations of sertraline standard solutions used for the determination of LOD and LOQ. Table S3: Results for fluoxetine obtained by NP-TLC technique using silica gel 60 F254 on glass plates (#1.05715) and chloroform + methanol + ammonia (9:1:0.4, v/v/v) as the mobile phase. Table S4: Results for fluoxetine obtained by NP-TLC technique using silica gel 60 on glass plates (#1.05721) and chloroform + methanol + ammonia (9:1:0.4, v/v/v) as the mobile phase. Table S5: Results for fluoxetine obtained by NP-TLC technique using a mixture of silica gel 60 and kieselguhr F254 on aluminum plates (#1.05567) and chloroform + methanol + ammonia (9:1:0.4, v/v/v) as the mobile phase. Table S6: Results for fluoxetine obtained by NP-TLC technique using silanized silica gel 60 F254 (RP-2) on glass plates (#1.05747) and chloroform + methanol + ammonia (9:10.4, v/v/v) as the mobile phase. Table S7: Results for fluoxetine obtained by NP-TLC technique using silica gel 60 F254 on glass plates (#1.05715) and chloroform + methanol + glacial acetic acid (5:4:1, v/v/v) as the mobile phase. Table S8: Results for fluoxetine obtained by NP-TLC technique using silica gel 60 on glass plates (#1.05721) and chloroform + methanol + glacial acetic acid (5:4:1, v/v/v) as the mobile phase. Table S9: Results for fluoxetine obtained by NP-TLC technique using a mixture of silica gel 60 and kieselguhr F254 on aluminum plates (#1.05567) and chloroform + methanol + glacial acetic acid (5:4:1, v/v/v) as the mobile phase. Table S10: Results for fluoxetine obtained by NP-TLC technique using silanized silica gel 60 F254 (RP-2) on glass plates (#1.05747) and chloroform + methanol + glacial acetic acid (5:4:1, v/v/v) as the mobile phase. Table S11: Results for fluoxetine obtained by NP-TLC technique using silica gel 60 F254 on glass plates (#1.05715) and acetone + toluene + ammonia (10:9:1, v/v/v) as the mobile phase. Table S12: Results for fluoxetine obtained by NP-TLC technique using silica gel 60 on glass plates (#1.05721) and acetone + toluene + ammonia (10:9:1, v/v/v) as the mobile phase. Table S13: Results for fluoxetine obtained by NP-TLC technique using a mixture of silica gel 60 and kieselguhr F254 on aluminum plates (#1.05567) and acetone + toluene + ammonia (10:9:1, v/v/v) as the mobile phase. Table S14: Results for fluoxetine obtained by NP-TLC technique using silanized silica gel 60 F254 (RP-2) on glass plates (#1.05747) and acetone + toluene + ammonia (10:9:1, v/v/v) as the mobile phase. Table S15: Results for fluoxetine obtained by RP-TLC technique using silica gel RP-18F254 on aluminum plates (#1.05559) and methanol+water (10:0, v/v/v) as the mobile phase. Table S16: Results for fluoxetine obtained by RP-TLC technique using silanized silica gel 60 F254 (RP-2) on glass plates (#1.05747) and methanol+water (10:0, v/v/v) as the mobile phase. Table S17: Results for fluoxetine obtained by RP-TLC technique using silica gel RP-18F254 on aluminum plates (#1.05559) and methanol+water (9:1, v/v/v) as the mobile phase. Table S18: Results for fluoxetine obtained by RP-TLC technique using silanized silica gel 60 F254 (RP-2) on glass plates (#1.05747) and methanol+water (9:1, v/v/v) as the mobile phase. Table S19: Results for fluoxetine obtained by RP-TLC technique using silica gel RP-18F254 on aluminum plates (#1.05559) and acetone+water (10:0, v/v/v) as the mobile phase. Table S20: Results for fluoxetine obtained by RP-TLC technique using silanized silica gel 60 F254 (RP-2) on glass plates (#1.05747) and acetone+water (10:0, v/v/v) as the mobile phase. Table S21: Results for fluoxetine obtained by RP-TLC technique using silica gel RP-18F254 on aluminum plates (#1.05559) and acetone+water (9:1, v/v/v) as the mobile phase. Table S22: Results for fluoxetine obtained by RP-TLC technique using silanized silica gel 60 F254 (RP-2) on glass plates (#1.05747) and acetone+water (9:1, v/v/v) as the mobile phase. Table S23: Results for sertraline obtained by NP-TLC technique using silica gel 60 on glass plates (#1.05721) and chloroform + methanol + glacial acetic acid (5:4:1, v/v/v) as the mobile phase. Table S24: Results for sertraline obtained by NP-TLC technique using silica gel 60 on glass plates (#1.05721) and chloroform + methanol + glacial acetic acid (5:4:1, v/v/v) as the mobile phase. Table S25: Results for sertraline obtained by NP-TLC technique using a mixture of silica gel 60 and kieselguhr F254 on aluminum plates (#1.05567) and chloroform + methanol + glacial acetic acid (5:4:1, v/v/v) as the mobile phase. Table S26: Results for sertraline obtained by NP-TLC technique using silica gel 60 F254 on glass plates (#1.05715) and acetone + toluene + ammonia (10:9:1, v/v/v) as the mobile phase. Table S27: Results for sertraline obtained by NP-TLC technique using silica gel 60 on glass plates (#1.05721) and acetone + toluene + ammonia (10:9:1, v/v/v) as the mobile phase. Table S28: Results for sertraline obtained by NP-TLC technique using a mixture of silica gel 60 and kieselguhr F254 on aluminum plates (#1.05567) and acetone + toluene + ammonia (10:9:1, v/v/v) as the mobile phase. Table S29: Results for sertraline obtained by NP-TLC technique using silanized silica gel 60 F254 (RP-2) on glass plates (#1.05747) and acetone + toluene + ammonia (10:9:1, v/v/v) as the mobile phase. Table S30: Results for sertraline obtained by RP-TLC technique using silica gel RP-18F254 on aluminum plates (#1.05559) and methanol+water (10:0, v/v/v) as the mobile phase. Table S31: Results for sertraline obtained by RP-TLC technique using technique using silanized silica gel 60 F254 (RP-2) on glass plates (#1.05747) and methanol+water (10:0, v/v/v) as the mobile phase. Table S32: Results for sertraline obtained by RP-TLC technique using silica gel RP-18F254 on aluminum plates (#1.05559) and methanol+water (9:1, v/v/v) as the mobile phase. Table S33: Results for sertraline obtained by RP-TLC technique using silanized silica gel 60 F254 (RP-2) on glass plates (#1.05747) and methanol+water (9:1, v/v/v) as the mobile phase. Table S34: Results for sertraline obtained by RP-TLC technique using silica gel RP-18F254 on aluminum plates (#1.05559) and acetone+water (10:0, v/v/v) as the mobile phase. Table S35: Results for sertraline obtained by RP-TLC technique using silanized silica gel 60 F254 (RP-2) on glass plates (#1.05747) and acetone+water (10:0, v/v/v) as the mobile phase. Table S36: Results for sertraline obtained by RP-TLC technique using silica gel RP-18F254 on aluminum plates (#1.05559) and acetone + water (9:1, v/v/v) as the mobile phase. Table S37: Results for sertraline obtained by RP-TLC technique using silanized silica gel 60 F254 (RP-2) on glass plates (#1.05747) and acetone+water (9:1, v/v/v) as the mobile phase. Table S38: Detection limit values and RF values for fluoxetine obtained in different chromatographic systems. Table S39: Detection limit values and RF values for sertraline obtained in different chromatographic systems. Table S40: Quantification limit values for fluoxetine obtained in different chromatographic systems. Table S41: Quantification limit values for sertraline obtained in different chromatographic systems. Figure S3: Densitogram of sertraline analyzed on silica gel 60 F₂₅₄ (1.05715) using the chloroform + methanol + glacial acetic acid- 5:4:1 (v/v/v) mobile phase. Figure S4: Densitogram of fluoxetine analyzed on silica gel 60 F₂₅₄ (1.05715) using the chloroform + methanol + glacial acetic acid- 5:4:1 (v/v/v) mobile phase. Figure S5: Densitogram of sertraline analyzed on silica gel 60 (1.05721) using the chloroform + methanol + glacial acetic acid- 5:4:1 (v/v/v) mobile phase. Figure S6: Densitogram of fluoxetine analyzed on silica gel 60 (1.05721) using the chloroform + methanol + glacial acetic acid- 5:4:1 (v/v/v) mobile phase. Figure S7: Densitogram of sertraline analyzed on a mixture of silica gel 60 and kieselguhr F₂₅₄ (1.05567) using the chloroform + methanol + glacial acetic acid- 5:4:1 (v/v/v) mobile phase. Figure S8: Densitogram of fluoxetine analyzed on a mixture of silica gel 60 and kieselguhr F₂₅₄ (1.05567) using the chloroform + methanol + glacial acetic acid- 5:4:1 (v/v/v) mobile phase. Figure S9: Densitogram of sertraline analyzed on silica gel 60 F₂₅₄ (1.05715) using the acetone + toluene + ammonia- 10:9:1 (v/v/v) mobile phase. Figure S10: Densitogram of fluoxetine analyzed on silica gel 60 F₂₅₄ (1.05715) using the acetone + toluene + ammonia- 10:9:1 (v/v/v) mobile phase Figure S11: Densitogram of sertraline analyzed on a mixture of silica gel 60 and kieselguhr F₂₅₄ (1.05567) using the acetone + toluene + ammonia- 10:9:1 (v/v/v) mobile phase. Figure S12: Densitogram of sertraline analyzed on a mixture of silica gel 60 and kieselguhr F₂₅₄ (1.05567) using the acetone + toluene + ammonia- 10:9:1 (v/v/v) mobile phase. Figure S13: Densitogram of sertraline analyzed on silanized silica gel 60 (RP-2) (1.05747) using the acetone + toluene + ammonia- 10:9:1 (v/v/v) mobile phase. Figure S14: Densitogram of fluoxetine analyzed on silanized silica gel 60 (RP-2) (1.05747) using the acetone + toluene + ammonia- 10:9:1 (v/v/v) mobile phase. Figure S15: Densitogram of sertraline analyzed on silanized silica gel 60 (RP-2) (1.05747) using the methanol+water 10:0 (v/v) mobile phase. Figure S16: Densitogram of fluoxetine analyzed on silanized silica gel 60 (RP-2) (1.05747) using the methanol+water 10:0 (v/v) mobile phase. Figure S17: Densitogram of sertraline analyzed on silanized silica gel 60 (RP-2) (1.05747) using the acetone+water 10:0 (v/v) mobile phase. Figure S18: Densitogram of fluoxetine analyzed on silanized silica gel 60 (RP-2) (1.05747) using the acetone+water 10:0 (v/v) mobile phase. Figure S19: Densitogram of sertraline analyzed on silanized silica gel 60 (RP-2) (1.05747) using the methanol+water 9:1 (v/v) mobile phase. Figure S20: Densitogram of fluoxetine analyzed on silanized silica gel 60 (RP-2) (1.05747) using the methanol+water 9:1 (v/v) mobile phase. Figure S21: Densitogram of sertraline analyzed on silica gel RP-18F₂₅₄ (1.05559) using the methanol + water 9:1 (v/v) mobile phase. Figure S22: Densitogram of fluoxetine analyzed on silica gel RP-18F₂₅₄ (1.05559) using the methanol + water 9:1 (v/v) mobile phase.
Author Contributions
Conceptualization, W.P. and A.P.-P.; methodology, A.P.-P.; software, A.P.-P.; investigation, W.P. and A.P.-P.; writing—original draft preparation, W.P. and A.P.-P.; writing—review and editing, W.P. and A.P.-P. All authors have read and agreed to the published version of the manuscript.
Funding
This research was funded by Medical University of Silesia, grant number PCN-1-020/N/1/F.
Institutional Review Board Statement
Not applicable.
Informed Consent Statement
Not applicable.
Data Availability Statement
Not applicable.
Acknowledgments
Not applicable.
Conflicts of Interest
The authors declare that there are no conflict of interest regarding the publication of this paper.
Sample Availability
Samples of the compounds are available from the authors.
References
- Durà-Vilà, G.; Littlewood, R.; Leavey, G. Depression and the medicalization of sadness: Conceptualization and recommended help-seeking. Int. J. Soc. Psychiatry 2013, 59, 165–175. [Google Scholar] [CrossRef] [PubMed] [Green Version]
- Perez-Caballero, L.; Torres-Sanchez, S.; Bravo, L.; Mico, J.A.; Berrocoso, E. Fluoxetine: A case history of its discovery and preclinical development. Expert Opin. Drug Discov. 2014, 9, 567–578. [Google Scholar] [CrossRef] [PubMed] [Green Version]
- Alves, V.; Gonçalves, J.; Conceição, C.; Câmara, H.M.T.; Câmara, J.S. An improved analytical strategy combining microextraction by packed sorbent combined with ultra high pressure liquid chromatography for the determination of fluoxetine, clomipramine and their active metabolites in human urine. J. Chromatogr. A 2015, 1408, 30–40. [Google Scholar] [CrossRef] [PubMed]
- Ali, E.A.; Adawy, A.M.; El-Shahat, M.F.; Amin, A.S. Simple spectrophotometric methods for determination of fluoxetine and clomipramine hydrochlorides in dosage forms and in some post-mortem biological fluids samples. Egypt. J. Forensic Sci. 2016, 6, 370–380. [Google Scholar] [CrossRef] [Green Version]
- Lotfi, A.; Manzoori, J.L. Determination of fluoxetine in pharmaceutical and biological samples based on the silver nanoparticle enhanced fluorescence of fluoxetine-terbium complex. Luminescence 2016, 31, 1349–1357. [Google Scholar] [CrossRef]
- Lotfi, A.; Manzoori, J.L.; Mohagheghi, A. Determination of sertraline in pharmaceutical and biological samples using 1, 10-phenanthroline-terbium probe and silver nanoparticles enhanced fluorescence. J. Lumin. 2017, 185, 132–140. [Google Scholar] [CrossRef]
- Khosrokhavar, R.; Motaharian, A.; Hosseini, M.R.M.; Mohammadsadegh, S. Screen-printed carbon electrode (SPCE) modified by molecularly imprinted polymer (MIP) nanoparticles and graphene nanosheets for determination of sertraline antidepressant drug. Microchem. J. 2020, 159, 105348. [Google Scholar] [CrossRef]
- Alizadeh, T.; Azizi, S. Graphene/graphite paste electrode incorporated with molecularly imprinted polymer nanoparticles as a novel sensor for differential pulse voltammetry determination of fluoxetine. Biosens. Bioelectron. 2016, 81, 198–206. [Google Scholar] [CrossRef]
- Wang, Z.R.; Hsieh, M.M. Ultrasound-assisted dispersive liquid-liquid microextraction coupled with field-amplified capillary electrophoresis for sensitive and quantitative determination of fluoxetine and norfluoxetine enantiomers in biological fluids. Anal. Bioanal. Chem. 2020, 412, 5113–5123. [Google Scholar] [CrossRef]
- Murtada, K.; de Andrés, F.; Ríos, A.; Zougagh, M. Determination of antidepressants in human urine extracted by magnetic multiwalled carbon nanotube poly(styrene-co-divinylbenzene) composites and separation by capillary electrophoresis. Electrophoresis 2018, 39, 1808–1815. [Google Scholar] [CrossRef]
- Zilfidou, E.; Kabir, A.; Furton, K.G.; Samanidou, V. An improved fabric phase sorptive extraction method for the determination of five selected antidepressant drug residues in human blood serum prior to high performance liquid chromatography with diode array detection. J. Chromatogr. B 2019, 1125, 121720. [Google Scholar] [CrossRef]
- Feng, Y.; Zheng, M.; Zhang, X.; Kang, K.; Kang, W.; Lian, K.; Yang, J. Analysis of four antidepressants in plasma and urine by gas chromatography-mass spectrometry combined with sensitive and selective derivatization. J. Chromatogr. A 2019, 1600, 33–40. [Google Scholar] [CrossRef]
- Rosetti, A.; Ferretti, R.; Zanitti, L.; Casulli, A.; Villani, C.; Cirilli, R. Single-run reversed-phase HPLC method for determining sertraline content, enantiomeric purity, and related substances in drug substance and finished product. J. Pharm. Anal. 2020, 10, 610–616. [Google Scholar] [CrossRef]
- Jairoun, A.A.; Al-Hemyari, S.S.; Shahwan, M.; Zyoud, S.H. Adulteration of weight loss supplements by the illegal addition of synthetic pharmaceuticals. Molecules 2021, 26, 6903. [Google Scholar] [CrossRef]
- Maciel, E.V.S.; Toffoli, A.L.; Alves, J.D.S.; Lanças, F.M. Multidimensional liquid chromatography employing a graphene oxide capillary column as the first dimension: Determination of antidepressant and antiepileptic drugs in urine. Molecules 2020, 25, 1092. [Google Scholar] [CrossRef] [Green Version]
- Odore, R.; Rendini, D.; Badino, P.; Gardini, G.; Cagnotti, G.; Meucci, V.; Intorre, L.; Bellino, C.; D’Angelo, A. Behavioral therapy and fluoxetine treatment in aggressive dogs: A case study. Animals 2020, 10, 832. [Google Scholar] [CrossRef]
- Nałęcz-Jawecki, G.; Wawryniuk, M.; Giebułtowicz, J.; Olkowski, A.; Drobniewska, A. Influence of selected antidepressants on the ciliated protozoan spirostomum ambiguum: Toxicity, bioaccumulation, and biotransformation products. Molecules 2020, 25, 1476. [Google Scholar] [CrossRef] [Green Version]
- Nair, A.B.; Singh, B.; Shah, J.; Jacob, S.; Aldhubiab, B.; Sreeharsha, N.; Morsy, M.A.; Venugopala, K.N.; Attimarad, M.; Shinu, P. Formulation and evaluation of self-nanoemulsifying drug delivery system derived tablet containing sertraline. Pharmaceutics 2022, 14, 336. [Google Scholar] [CrossRef]
- Jiménez-Holgado, C.; Sakkas, V.; Richard, C. Phototransformation of three psychoactive drugs in presence of sedimental water extractable organic matter. Molecules 2021, 26, 2466. [Google Scholar] [CrossRef]
- Oh, J.M.; Ji, M.; Lee, M.J.; Jeong, G.S.; Paik, M.J.; Kim, H.; Suh, J.W. Antidepressant-like effects of ethanol extract of ziziphus jujuba mill seeds in mice. Appl. Sci. 2020, 10, 7374. [Google Scholar] [CrossRef]
- Marasca, C.; Protti, M.; Mandrioli, R.; Atti, A.R.; Armirotti, A.; Cavalli, A.; De Ronchi, D.; Mercolini, L. Whole blood and oral fluid microsampling for the monitoring of patients under treatment with antidepressant drugs. J. Pharm. Biomed. Anal. 2020, 188, 113384. [Google Scholar] [CrossRef]
- Luiz Oenning, A.; Birk, L.; Eller, S.; Franco de Oliveira, T.; Merib, J.; Carasek, E. A green and low-cost method employing switchable hydrophilicity solvent for the simultaneous determination of antidepressants in human urine by gas chromatography—Mass spectrometry detection. J. Chromatogr. B 2020, 1143, 122069. [Google Scholar] [CrossRef]
- Ntoupa, P.A.; Armaos, K.P.; Athanaselis, S.A.; Spiliopoulou, C.A.; Papoutsis, I.I. Study of the distribution of antidepressant drugs in vitreous humor using a validated GC/MS method. Forensic Sci. Int. 2020, 317, 110547. [Google Scholar] [CrossRef]
- Soares, S.; Rosado, T.; Barroso, M.; Gallardo, E. New method for the monitoring of antidepressants in oral fluid using dried spot sampling. Pharmaceuticals 2021, 14, 1284. [Google Scholar] [CrossRef]
- Malyshev, A.V.; Sukhanova, I.A.; Ushakova, V.M.; Zorkina, Y.A.; Abramova, O.V.; Morozova, A.Y.; Zubkov, E.A.; Mitkin, N.A.; Pavshintsev, V.V.; Doronin, I.I.; et al. Peptide LCGA-17 attenuates behavioral and neurochemical deficits in rodent models of PTSD and depression. Pharmaceuticals 2022, 15, 462. [Google Scholar] [CrossRef]
- Gómez-Ruiz, L.M.; Marchei, E.; Rotolo, M.C.; Brunetti, P.; Mannocchi, G.; Acosta-López, A.; Ramos-Gutiérrez, R.Y.; Varela-Busaka, M.B.; Pichini, S.; Garcia-Algar, O. Prevalence of licit and illicit drugs use during pregnancy in Mexican women. Pharmaceuticals 2022, 15, 382. [Google Scholar] [CrossRef]
- Gomes, I.; Rodrigues, H.; Rodrigues, C.; Marques, M.; Paíga, P.; Paiva, A.; Simões, P.; Fernandes, V.C.; Vieira, M.; Delerue-Matos, C.; et al. Evaluation of the biological potential of Himanthalia elongata (L.) S.F.Gray and Eisenia bicyclis (Kjellman) Setchell subcritical water extracts. Foods 2022, 11, 746. [Google Scholar] [CrossRef] [PubMed]
- Almeida-González, M.; Boada, L.D.; Henríquez-Hernández, L.A.; Luzardo, O.P.; Zaragoza, E.; Burillo-Putze, G.; Quintana-Montesdeoca, M.P.; Zumbado, M. Medical psychotropics in forensic autopsies in European countries: Results from a three-year retrospective study in Spain. Toxics 2022, 10, 64. [Google Scholar] [CrossRef]
- Denmark, D.; Ruhoy, I.; Wittmann, B.; Ashki, H.; Koran, L.M. Altered plasma mitochondrial metabolites in persistently symptomatic individuals after a GBCA-assisted MRI. Toxics 2022, 10, 56. [Google Scholar] [CrossRef]
- Austin-Zimmerman, I.; Wronska, M.; Wang, B.; Irizar, H.; Thygesen, J.H.; Bhat, A.; Denaxas, S.; Fatemifar, G.; Finan, C.; Harju-Seppänen, J.; et al. The influence of CYP2D6 and CYP2C19 genetic variation on diabetes mellitus risk in people taking antidepressants and antipsychotics. Genes 2021, 12, 1758. [Google Scholar] [CrossRef]
- Shigei, M.; Assayed, A.; Hazaymeh, A.; Dalahmeh, S.S. Pharmaceutical and antibiotic pollutant levels in wastewater and the waters of the Zarqa river, Jordan. Appl. Sci. 2021, 11, 8638. [Google Scholar] [CrossRef]
- D’Ovidio, C.; Bonelli, M.; Rosato, E.; Tartaglia, A.; Ulusoy, H.İ.; Samanidou, V.; Furton, K.G.; Kabir, A.; Ali, I.; Savini, F.; et al. Novel applications of microextraction techniques focused on biological and forensic analyses. Separations 2022, 9, 18. [Google Scholar] [CrossRef]
- Park, Y.S.; Jang, S.; Lee, H.; Kang, S.; Seo, H.; Yeon, S.; Lee, D.; Yun, C.W. Identification of the antidepressant function of the edible mushroom Pleurotus eryngii. J. Fungi 2021, 7, 190. [Google Scholar] [CrossRef] [PubMed]
- Moni, J.N.R.; Adnan, M.; Tareq, A.M.; Kabir, M.I.; Reza, A.S.M.A.; Nasrin, M.S.; Chowdhury, K.H.; Sayem, S.A.J.; Rahman, M.A.; Alam, A.K.; et al. Therapeutic potentials of Syzygium fruticosum fruit (seed) reflected into an array of pharmacological assays and prospective receptors-mediated pathways. Life 2021, 11, 155. [Google Scholar] [CrossRef]
- Montesdeoca-Esponda, S.; Palacios-Díaz, M.d.P.; Estévez, E.; Sosa-Ferrera, Z.; Santana-Rodríguez, J.J.; Cabrera, M.D.C. Occurrence of pharmaceutical compounds in groundwater from the Gran Canaria Island (Spain). Water 2021, 13, 262. [Google Scholar] [CrossRef]
- Wang, X.; Zhou, H.; Wang, X.; Lei, K.; Wang, S. Design, synthesis, and in vivo and in silico evaluation of coumarin derivatives with potential antidepressant effects. Molecules 2021, 26, 5556. [Google Scholar] [CrossRef]
- Lagu, S.B.; Yejella, R.P.; Bhandare, R.R.; Shaik, A.B. Design, synthesis, and antibacterial and antifungal activities of novel trifluoromethyl and trifluoromethoxy substituted chalcone derivatives. Pharmaceuticals 2020, 13, 375. [Google Scholar] [CrossRef]
- Ali, I.; Hussain, A.; Saleem, K.; Aboul-Enein, H. Separation and identification of antidepressant drugs in human plasma by solid-phase extraction-thin-layer chromatography. J. Planar Chromatogr. Mod. TLC 2013, 26, 349–353. [Google Scholar] [CrossRef]
- Gondová, T.; Halamová, D.; Špacayová, K. Simultaneous analysis of new antidepressants by densitometric thin-layer chromatography. J. Liq. Chromatogr. Relat. Technol. 2008, 31, 2429–2441. [Google Scholar] [CrossRef]
- Skibiński, R.; Misztal, G.; Kudrzycki, M. Determination of fluoxetine and paroxetine in pharmaceutical formulations by densitometric and videodensitometric TLC. J. Planar Chromatogr. Mod. TLC 2003, 16, 19–22. [Google Scholar] [CrossRef]
- Shah, C.R.; Shah, N.J.; Suhagia, B.N.; Patel, N.M. Simultaneous assay of olanzapine and fluoxetine in tablets by column high-performance liquid chromatography and high-performance thin-layer chromatography. J. AOAC Int. 2007, 90, 1573–1578. [Google Scholar] [CrossRef] [Green Version]
- Shah, C.R.; Suhagia, B.N.; Shah, N.J.; Patel, D.R.; Patel, N.M. Stability-indicating simultaneous HPTLC method for olanzapine and fluoxetine in combined tablet dosage form. Indian J. Pharm. Sci. 2008, 70, 251–255. [Google Scholar] [CrossRef] [Green Version]
- Gondová, T.; Amar, I. RP TLC analysis of new antidepressants in pharmaceutical preparations. J. Planar Chromatogr. Mod. TLC 2011, 24, 40–43. [Google Scholar] [CrossRef]
- Rao, J.; Kumar, M.; Lohidasan, S.; Yadav, S.; Yadav, V. Application of a stability-indicating HPTLC method for quantitative analysis of sertraline hydrochloride in pharmaceutical dosage forms. J. Planar Chromatogr. Mod. TLC 2011, 24, 140–144. [Google Scholar] [CrossRef]
- Hussain, A.; Rahman, A.; Hussain, S.; Mirza, M.A.; Iqbal, Z.; Harwansh, R.; Singh, L.R. HPTLC method for analysis of sertraline in pure bulk drug and lipidic nano delivery system: Stress degradation studies. J. Liq. Chromatogr. Relat. Technol. 2013, 36, 700–716. [Google Scholar] [CrossRef]
- Vahora, S.; Chhalotiya, U.K.; Kachhiya, H.; Tandel, J.; Shah, D. Simultaneous quantification of brexpiprazole and sertraline HCl in synthetic mixture by thin-layer chromatography method. J. Planar. Chromatogr. Mod. TLC 2021, 34, 549–557. [Google Scholar] [CrossRef]
- Ivanova, S.; Todorova, V.; Dyankov, S.; Ivanov, K. High-Performance Thin-Layer Chromatography (HPTLC) method for identification of meloxicam and piroxicam. Processes 2022, 10, 394. [Google Scholar] [CrossRef]
- USP. The United States Pharmacopeia, 43rd ed.; United States Pharmacopeial Convention: Rockville, MD, USA, 2020. [Google Scholar]
- USP. The United States Pharmacopeia, 44th ed.; United States Pharmacopeial Convention: Rockville, MD, USA, 2021. [Google Scholar]
- TSO. European Pharmacopoeia, 10th ed.; The Stationery Office: Strasbourg, France, 2019. [Google Scholar]
- European Medicines Agency. Validation of Analytical Procedures: Text and Methodology, Q2(R1). In ICH Harmonised Tripartite Guideline; ICH: Geneva, Switzerland, 2005; Available online: https://database.ich.org/sites/default/files/Q2%28R1%29%20Guideline.pdf (accessed on 21 January 2022).
- Konieczka, P.; Namiesnik, J. Validation of analytical procedures. In Evaluation and Quality Control of Analytical Measurement Results; Konieczka, P., Namiesnik, J., Eds.; WNT: Warsaw, Poland, 2007. (In Polish) [Google Scholar]
- Dołowy, M.; Maryszczak, J.; Pyka, A. Comparison of the detection and quantitative limits of hydrocortisone acetate in different chromatographic conditions in TLC. J. Liq. Chromatogr. Relat. Technol. 2014, 37, 2929–2941. [Google Scholar] [CrossRef]
- Dołowy, M.; Pyka, A.; Pluta, M. Comparison of the detection limit and the quantification limit of nicotinamide on different chromatographic sorbents in TLC. Austin Chromatogr. 2015, 2, 1034. [Google Scholar]
- Dołowy, M.; Pyka-Pająk, A. Comparison of the limits of detection and quantification of estradiol hemihydrate determined by thin-layer chromatography using different chromatographic conditions. J. Liq. Chromatogr. Relat. Technol. 2016, 39, 264–270. [Google Scholar] [CrossRef]
- Jampilek, J.; Dołowy, M.; Pyka-Pająk, A. Estimating limits of detection and quantification of ibuprofen by TLC-densitometry at different chromatographic conditions. Processes 2020, 8, 919. [Google Scholar] [CrossRef]
- Dołowy, M. Influence of different chromatographic conditions on the level of detection and quantitation of spironolactone by means of TLC-densitometry. J. Anal. Methods Chem. 2019, 2019, 8792783. [Google Scholar] [CrossRef] [PubMed]
Figure 1.
Chemical structures of sertraline (a) and fluoxetine (b).

Figure 2.
Mean values of the limit of detection of fluoxetine obtained by adsorption thin-layer chromatography, where the mobile phases were as follows: A—chloroform + methanol + ammonia, 9:1:0.4 (v/v/v); B—chloroform + methanol + glacial acetic acid, 5:4:1 (v/v/v); C—acetone + toluene + ammonia, 10:9:1 (v/v/v). The chromatographic plates were: 1.05715—silica gel 60 F254 on glass plates; 1.05721—silica gel 60 on glass plates; 1.05567—mixture of silica gel 60 and kieselguhr F254 on aluminum plates; 1.05747—silanized silica gel 60 F254 (RP-2) on glass plates.

Figure 3.
Mean values of the limit of quantification of fluoxetine obtained by NPTLC, where the mobile phases were as follows: A—chloroform + methanol + ammonia, 9:1:0.4 (v/v/v); B—chloroform + methanol + glacial acetic acid, 5:4:1 (v/v/v); C—acetone + toluene + ammonia, 10:9:1 (v/v/v). The chromatographic plates were: 1.05715—silica gel 60 F254 on glass plates; 1.05721—silica gel 60 on glass plates; 1.05567—mixture of silica gel 60 and kieselguhr F254 on aluminum plates; 1.05747—silanized silica gel 60 F254 (RP-2) on glass plates.

Figure 4.
Mean values of the limit of detection for fluoxetine, obtained by partition thin-layer chromatography, where the mobile phases were as follows: D—methanol + water, 10:0 (v/v); E—methanol + water, 9:1 (v/v); F—acetone + water, 10:0 (v/v); G—acetone + water, 9:1 (v/v). The chromatographic plates were: 1.05747—silanized silica gel 60 F254 (RP-2) on glass plates; 1.05559—silica gel RP-18F254 on aluminum plates.

Figure 5.
Mean values of the limit of quantification of fluoxetine, obtained by partition thin-layer chromatography, where the mobile phases were as follows: D—methanol + water, 10:0 (v/v); E—methanol + water, 9:1 (v/v); F—acetone + water, 10:0 (v/v); G—acetone + water, 9:1 (v/v). The chromatographic plates were: 1.05747—silanized silica gel 60 F254 (RP-2) on glass plates; 1.05559—silica gel RP-18F254 on aluminum plates.

Figure 6.
Mean values of the limit of detection of sertraline, obtained by adsorption thin-layer chromatography, where the mobile phases were as follows: B—chloroform + methanol + glacial acetic acid, 5:4:1 (v/v/v); C—acetone + toluene + ammonia, 10:9:1 (v/v/v). The chromatographic plates were: 1.05715—silica gel 60 F254 on glass plates; 1.05721—silica gel 60 on glass plates; 1.05567—mixture of silica gel 60 and kieselguhr F254 on aluminum plates; 1.05747—silanized silica gel 60 F254 (RP-2) on glass plates.

Figure 7.
Mean values of the limit of quantification of sertraline, obtained by adsorption thin-layer chromatography, where the mobile phases were as follows: A—chloroform + methanol + ammonia, 9:1:0.4 (v/v/v); B—chloroform + methanol + glacial acetic acid, 5:4:1 (v/v/v); C—acetone + toluene + ammonia, 10:9:1 (v/v/v). The chromatographic plates were: 1.05715—silica gel 60 F254 on glass plates; 1.05721—silica gel 60 on glass plates; 1.05567—mixture of silica gel 60 and kieselguhr F254 on aluminum plates; 1.05747—silanized silica gel 60 F254 (RP-2) on glass plates.

Figure 8.
Mean values of the limit of detection of sertraline, obtained by the method of partition thin-layer chromatography, where the mobile phases were as follows: D—methanol + water, 10:0 (v/v); E—methanol + water, 9:1 (v/v); F—acetone + water, 10:0 (v/v); G—acetone + water, 9:1 (v/v). The chromatographic plates were: 1.05747—silanized silica gel 60 F254 (RP-2) on glass plates; 1.05559—silica gel RP-18F254 on aluminum plates.

Figure 9.
Mean values of the limit of quantification of sertraline, obtained by the method of partition thin-layer chromatography, where the mobile phases were as follows: D—methanol + water, 10:0 (v/v); E—methanol + water, 9:1 (v/v); F—acetone + water, 10:0 (v/v); G—acetone + water, 9:1 (v/v). The chromatographic plates were: 1.05747—silanized silica gel 60 F254 (RP-2) on glass plates; 1.05559—silica gel RP-18F254 on aluminum plates.

Figure 10.
Chromatogram (densitogram) of sertraline (RF = 0.63), analyzed on silica gel 60 (1.05721) using the acetone + toluene + ammonia, 10:9:1 (v/v/v) mobile phase.
Figure 10.
Chromatogram (densitogram) of sertraline (RF = 0.63), analyzed on silica gel 60 (1.05721) using the acetone + toluene + ammonia, 10:9:1 (v/v/v) mobile phase.

Figure 11.
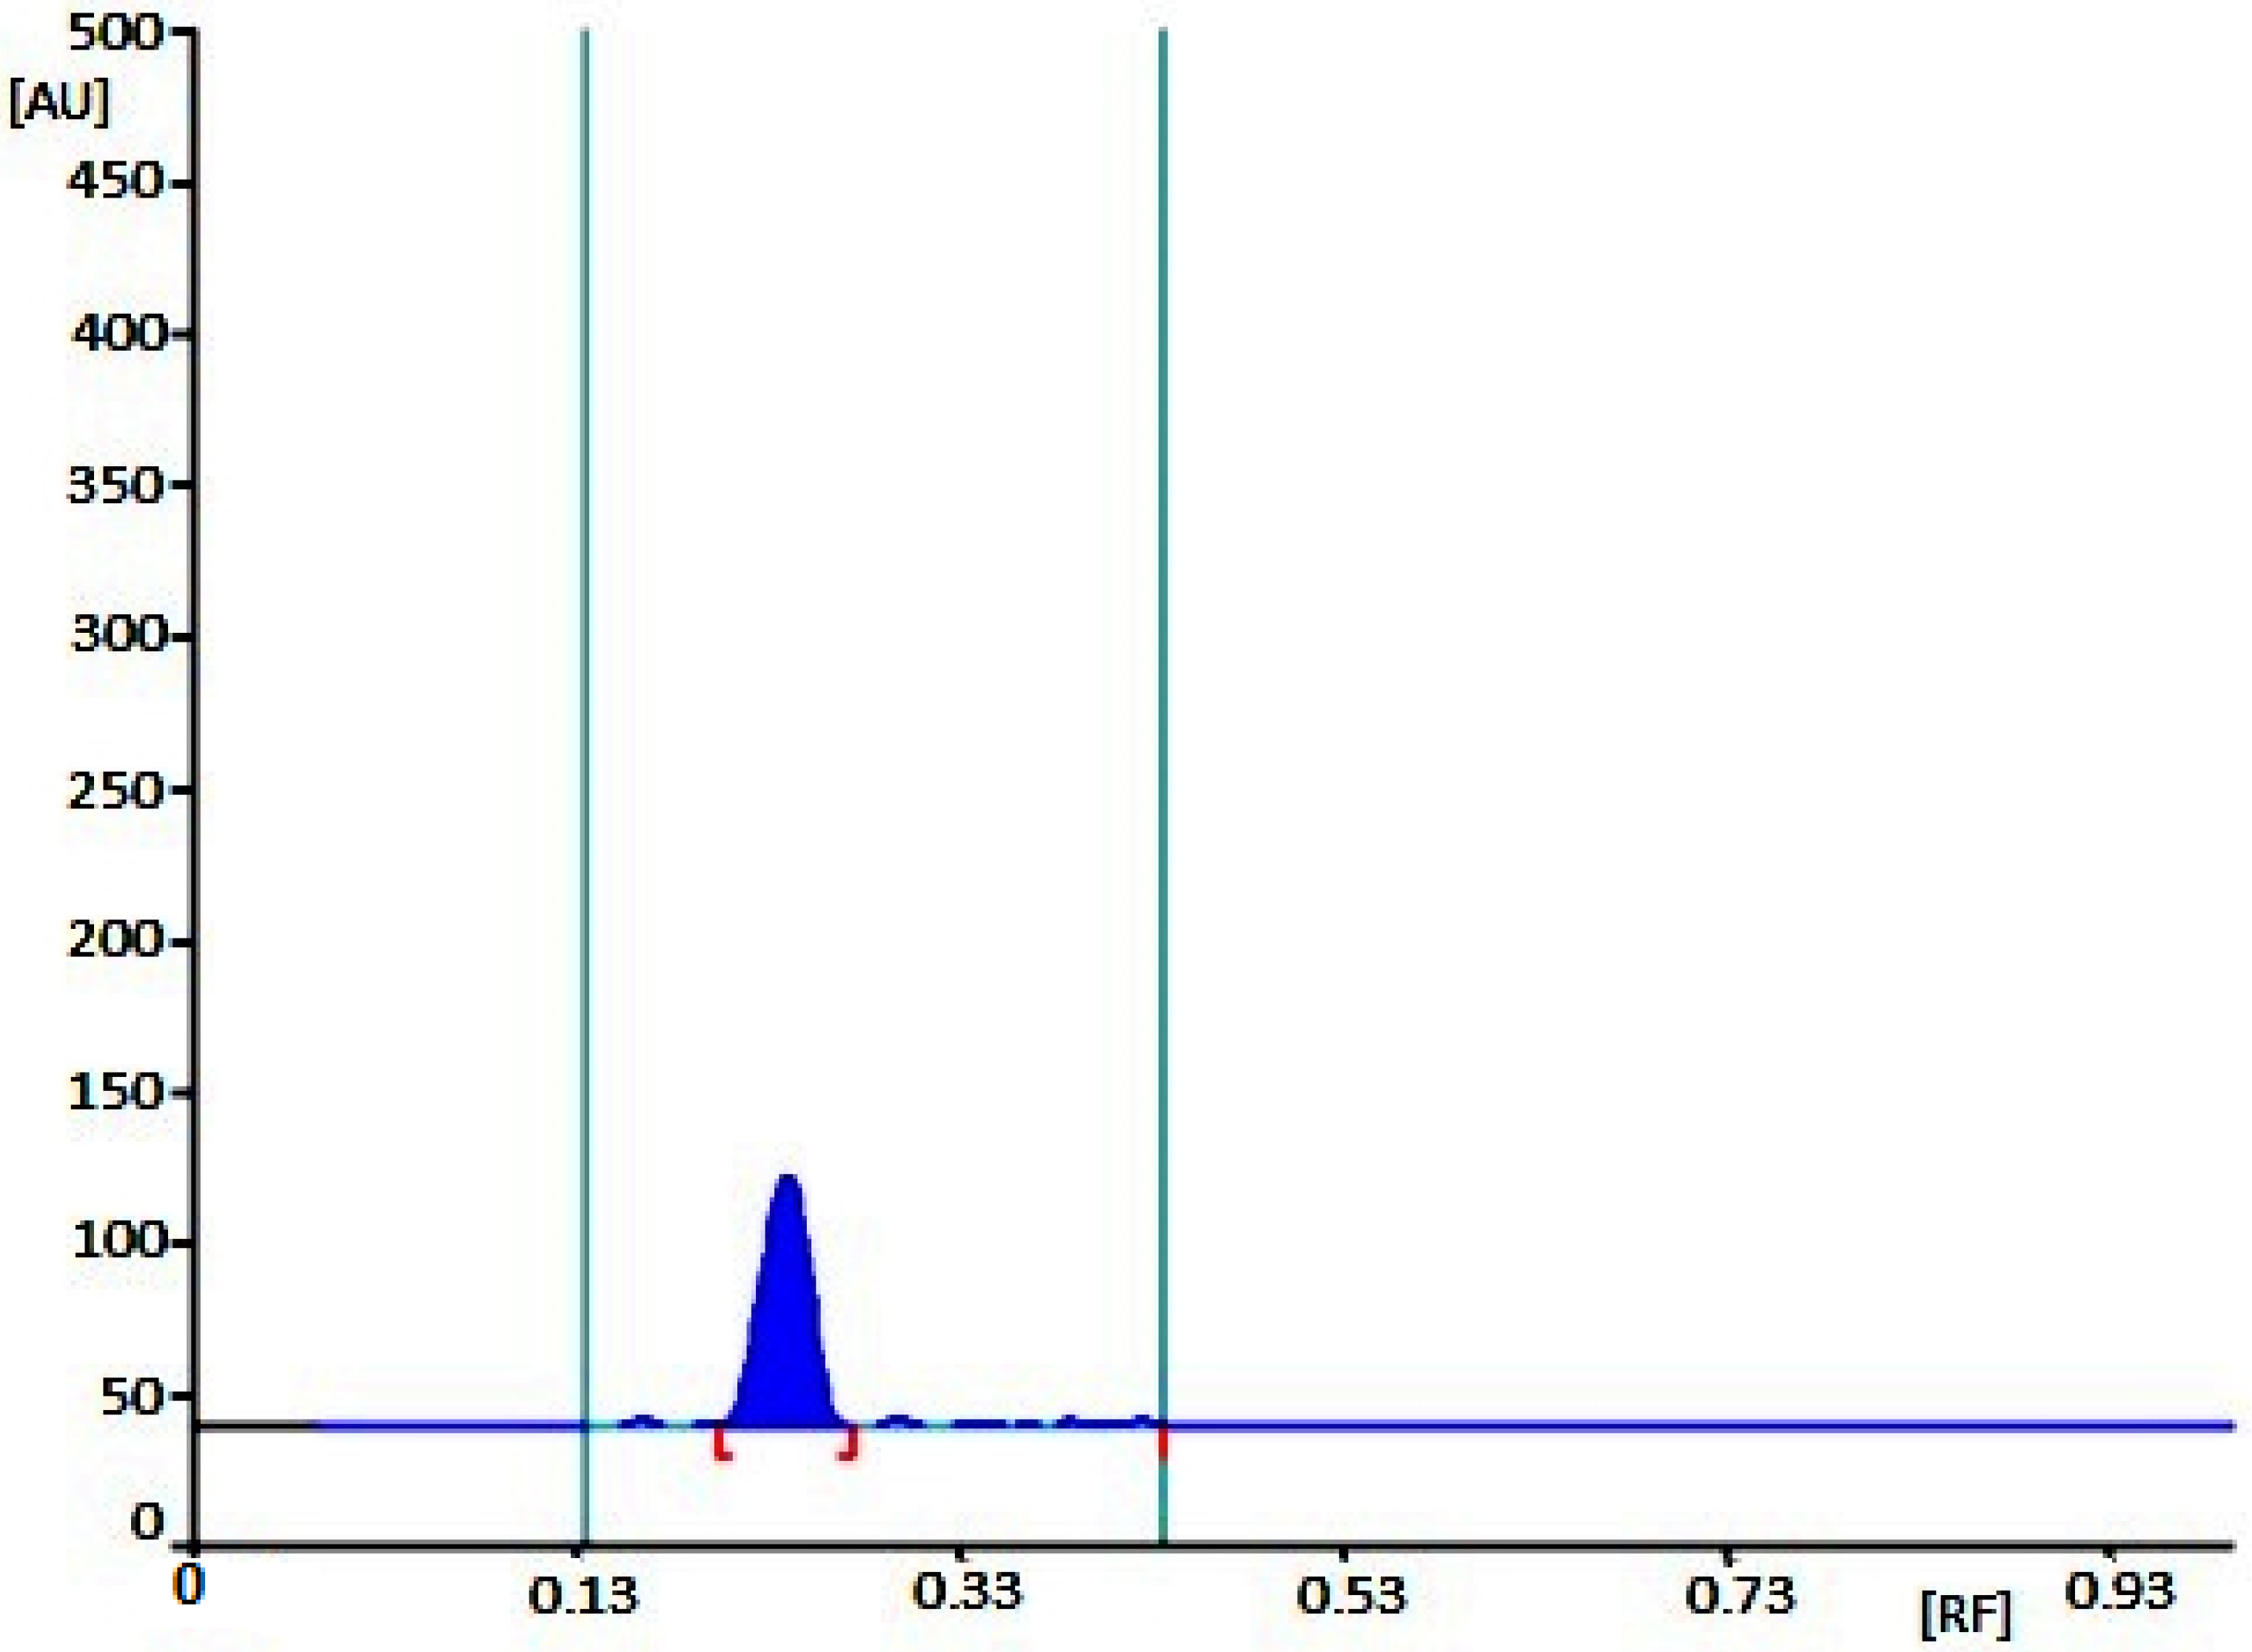
Chromatogram (densitogram) of fluoxetine (RF = 0.24), analyzed on silica gel 60 (1.05721) using the acetone + toluene + ammonia, 10:9:1 (v/v/v) mobile phase.
Figure 11.
Chromatogram (densitogram) of fluoxetine (RF = 0.24), analyzed on silica gel 60 (1.05721) using the acetone + toluene + ammonia, 10:9:1 (v/v/v) mobile phase.


Table 1.
Summary of the lowest LOD values of fluoxetine and sertraline (marked in red) obtained during the study using the NPTLC and RPTLC techniques with the literature values.
Table 1.
Summary of the lowest LOD values of fluoxetine and sertraline (marked in red) obtained during the study using the NPTLC and RPTLC techniques with the literature values.
| Method | Stationary Phase | Mobile Phase | LOD of Fluoxetine (µg/Spot) | LOD of Sertraline (µg/Spot) | Ref. |
| NPTLC | Silanized silica gel 60 F254 (RP-2 F₂₅₄, 1.05747) on glass plate | acetone + toluene + ammonia (10:9:1, v/v/v) | 0.066 | 0.118 | in this work |
| NPTLC | silica gel 60 F254 (1.05721) on glass plate | acetone + toluene + ammonia (10:9:1, v/v/v) | 0.129 | 0.079 | in this work |
| RPTLC | Silanized silica gel 60 F254 (RP-2 F₂₅₄, 1.05747) on glass plate | methanol + water (10:0, v/v) | 0.120 | 0.082 | in this work |
| RPTLC | Silanized silica gel 60 F254 (RP-2 F₂₅₄, 1.05747) on glass plate | methanol + water (9:1, v/v) | 0.147 | 0.037 | in this work |
| NPTLC | silica gel 60 F254 on glass plate | acetone + benzene + 25% ammonia (50: 45: 5, v/v/v) | 0.050 | 0.050 | [39] |
| NPTLC | silica gel 60 GF254 | benzene + acetone + ethanol + 25% aqueous ammonia (9:7:2:1, v/v/v/v) | 0.05 | - | [40] |
| HPTLC | silica gel 60 F254 on aluminum plate | methanol + toluene (40:20, v/v) | 0.132 | - | [41] |
| HPTLC | silica gel 60 F254 on aluminum plate | methanol + toluene (4:2, v/v) | 0.300 | - | [42] |
| RPTLC | RP-18 F254S TLC on aluminum plate | methanol + 0.05 M phosphate buffer (pH = 5) + triethylamine (68:27:5, v/v/v) | 0.100 | - | [43] |
| HPTLC | silica gel 60 F254 on aluminum plate | toluene + ethyl acetate + ethanol + ammonia (8:2:0.5: 0.1, v/v/v/v) | - | 0.670 | [44] |
| HPTLC | silica gel 60 F254 on aluminum plate | toluene + ethyl acetate + ammonia (1:5:0.1, v/v/v) | - | 0.015 | [45] |
| HPTLC | silica gel 60 F254 on aluminum plate | n-propanol + hexane + toluene + triethylamine (7:2:1:0.1, v/v/v/v) | - | 0.163 | [46] |
Publisher’s Note: MDPI stays neutral with regard to jurisdictional claims in published maps and institutional affiliations. |
© 2022 by the authors. Licensee MDPI, Basel, Switzerland. This article is an open access article distributed under the terms and conditions of the Creative Commons Attribution (CC BY) license (https://creativecommons.org/licenses/by/4.0/).
Share and Cite
MDPI and ACS Style
Parys, W.; Pyka-Pająk, A. Influence of Chromatographic Conditions on LOD and LOQ of Fluoxetine and Sertraline Analyzed by TLC-Densitometric Method. Processes 2022, 10, 971. https://doi.org/10.3390/pr10050971
AMA Style
Parys W, Pyka-Pająk A. Influence of Chromatographic Conditions on LOD and LOQ of Fluoxetine and Sertraline Analyzed by TLC-Densitometric Method. Processes. 2022; 10(5):971. https://doi.org/10.3390/pr10050971
Chicago/Turabian StyleParys, Wioletta, and Alina Pyka-Pająk. 2022. "Influence of Chromatographic Conditions on LOD and LOQ of Fluoxetine and Sertraline Analyzed by TLC-Densitometric Method" Processes 10, no. 5: 971. https://doi.org/10.3390/pr10050971
Note that from the first issue of 2016, this journal uses article numbers instead of page numbers. See further details here.