Article

Heat Pump Drying of Kelp (Laminaria japonica): Drying Kinetics and Thermodynamic Properties

1
College of Food Science and Technology, Huazhong Agricultural University, Wuhan 430070, China
2
Technology Innovation Center of Marine Fishery Equipment in Liaoning, Dalian Ocean University, Dalian 116023, China
3
Key Laboratory of Environment Controlled Aquaculture Ministry of Education, Dalian Ocean University, Dalian 116023, China
*
Authors to whom correspondence should be addressed.
Processes 2022, 10(3), 514; https://doi.org/10.3390/pr10030514
Submission received: 13 February 2022 / Revised: 25 February 2022 / Accepted: 2 March 2022 / Published: 4 March 2022
(This article belongs to the Special Issue Drying Kinetics and Quality Control in Food Processing)

Abstract

:
The main objective of this research is the study of the drying kinetics and thermodynamic properties of kelp using heat pump drying technology. The effects of the independent variables of temperature (20–50 °C), air velocity (0.3–1.3 m/s), humidity (20–50%), and thickness (0.8–4.2 mm) on the drying time, moisture uniformity, effective moisture diffusivity (Deff), activation energy (Ea), enthalpy (ΔH), entropy (ΔS), and Gibbs free energy (ΔG) were investigated. The results show that the Page model was effective in describing the moisture content change of kelp during heat pump drying. The Deff varied from 1.00 × 10⁻¹¹ to 13.00 × 10⁻¹¹ m2/s and the temperature, air velocity, humidity, and thickness had significant effects on drying time and moisture uniformity. Higher temperature and air velocity with proper humidity shortened the drying time and lessened the influence of thickness on moisture uniformity. The Ea (16.38–26.66 kJ/mol) and ΔH (13.69–24.22 kJ/mol) were significantly increased by thickness. When the temperature was 40 °C, air velocity 1.3 m/s, and air humidity 40%, the moisture content was reduced to 18% in 5 h, with a homogeneous moisture content. This study clarifies the regularity of moisture change inside kelp and provides a theoretical reference for the development of macroalgae drying technology.

1. Introduction

Trade in aquatic plants increased from USD 65 million in 1976 to more than USD 1.3 billion in 2018 [1]. Kelp (Laminaria japonica) accounts for more than 50% of macroalgae production, and is rich in iodine, vitamins, minerals, proteins, fatty acids, and other physiologically active ingredients [2,3]. These nutrients provide kelp with high edible value and special efficacy in lowering blood pressure, as well as possessing anti-tumor, anti-radiation, and anti-virus properties. They can also improve immune function and so on [4]. However, kelp’s moisture content is generally above 90%, which shortens its shelf-life to only 2–5 days [5]. Currently, drying is an important method to extend kelp’s shelf-life and provide added value. The major dehydration method of kelp is nature drying, which is time-consuming and negatively affects the quality. Foscarini et al. [6] found that drying Eucheuma seaweed took 3–5 days with approximately 8–9 h of sunshine per day. Ling et al. [7] also reported that drying Kappaphycus alvarezii in sunlight took 3–4 days and significantly reduced the total phenolic, flavonoid, anthocyanin, and carotenoid content compared with seaweeds dried in ovens.
Heat pump drying offers obvious advantages in terms of drying efficiency and product quality [8]. The heat pump system consists of a compressor, evaporator, condenser, and expansion valve, etc. The refrigerant, such as R134a, R410, R717, or R744 [9], is evaporated into gas in the evaporator, driven by a compressor, which absorbs a large amount of heat energy from the air. The gaseous refrigerant is compressed into a high-temperature, high-pressure gas, which then enters the condenser to release heat to the drying medium (air), repeating the cycle until the material is dried. Heat pump drying is suitable for the large-scale processing of aquatic products [10] and has been successfully applied to kelp knot [11], scallop adductors [12], squid fillets [13], banana slices [14], grape pomace [15], and lignite [16].
In recent years, studies on kelp drying have mainly focused on its physical characteristics and nutrients [17,18], while only a few studies have investigated the heat pump drying kinetics and thermodynamic properties, which explain the inner mechanism of heat and mass transfer and offer necessary theoretical parameters for drying technology and product quality improvement [19]. Kelp plants are generally 2–5 m in length and 20–50 cm in width [20]; the huge leaves are uneven in thickness and the moisture content of different parts is inconsistent. Therefore, drying non-uniformity and quality degradation under improper drying processes are likely, but the uniformity of the moisture content and the effect of thickness on the drying characteristics have rarely been reported. Hu et al. [11] studied the heat pump drying kinetics characteristics of kelp knot and found that the Page model could effectively fit the changing rule of moisture content with time, but the drying of spreading kelp leaves and their kinetics and thermodynamic properties were unclear. Tunckal et al. [14] fitted the moisture ratio of banana slices during heat pump drying with the Midilli and Kucuk model, and the effective moisture diffusivity values were calculated to be between 1.12 × 10⁻¹⁰ and 1.64 × 10⁻¹⁰ m2/s over a temperature range of 37–42 °C. Almeida et al. [21] calculated the effective moisture diffusivity, activation energy, and the thermodynamic properties of Achachairu (Garcinia humilis) peels under the drying process. Their results provided important information about the moisture migration and the required energy during the process. A heat pump-assisted drying process can reduce the energy demand by 84% compared to traditional drying using fossil fuels, but possibly results in up to a 69% longer drying time due to the higher humidity [9]. To produce consistent-quality seaweed and shorten the drying time, Sarbatly et al. [8] studied the heat pump drying kinetic and thermodynamic properties of Eucheuma spinosum, and found that the difference in algae enthalpy values used in each experiment was up to 1.74 times, but the reason was not explained. Silva et al. [22] recommended standardizing and specifying the leaf thickness measuring points in the thermodynamic properties and drying kinetics of Bauhinia forficata leaves. Nadi et al. [23] also reported that the thickness of an apple slice affected the values of effective moisture diffusivity, enthalpy, entropy, and Gibbs free energy. All the above studies imply that the thickness of kelp may be one of the most important factors affecting the drying kinetics and thermodynamic characteristics, and a major cause of non-uniform moisture content.
Therefore, this work aimed to shorten the drying time, on the premise of uniform moisture content, by studying the kinetics and thermodynamics of the heat pump drying of kelp. The effects of different temperatures, air velocities, and humidity on the drying characteristics of kelp with different thicknesses were explored. A mathematical model was built to reveal the moisture migration law and the thermodynamic properties’ parameters were calculated to improve product quality with consistent moisture content. This work explains the reason for the difference in final moisture content, from a material nature point of view, and provides a theoretical basis for the thermodynamic calculation of a macroalgae heat pump drying system.

2. Materials and Methods

2.1. Materials

Fresh kelp was harvested from Xiapu County, Ningde. The thickness of each part was determined with a Vernier caliper and the initial moisture content was measured in an electric oven (BPJ-9123-a, Shanghai Instrument Manufacturing Co., Ltd., Shanghai, China), as shown in Table 1 (n = 8). Before drying, the kelp was cut carefully into 20 cm × 10 cm slices and divided into 33 groups with 10 slices in each.

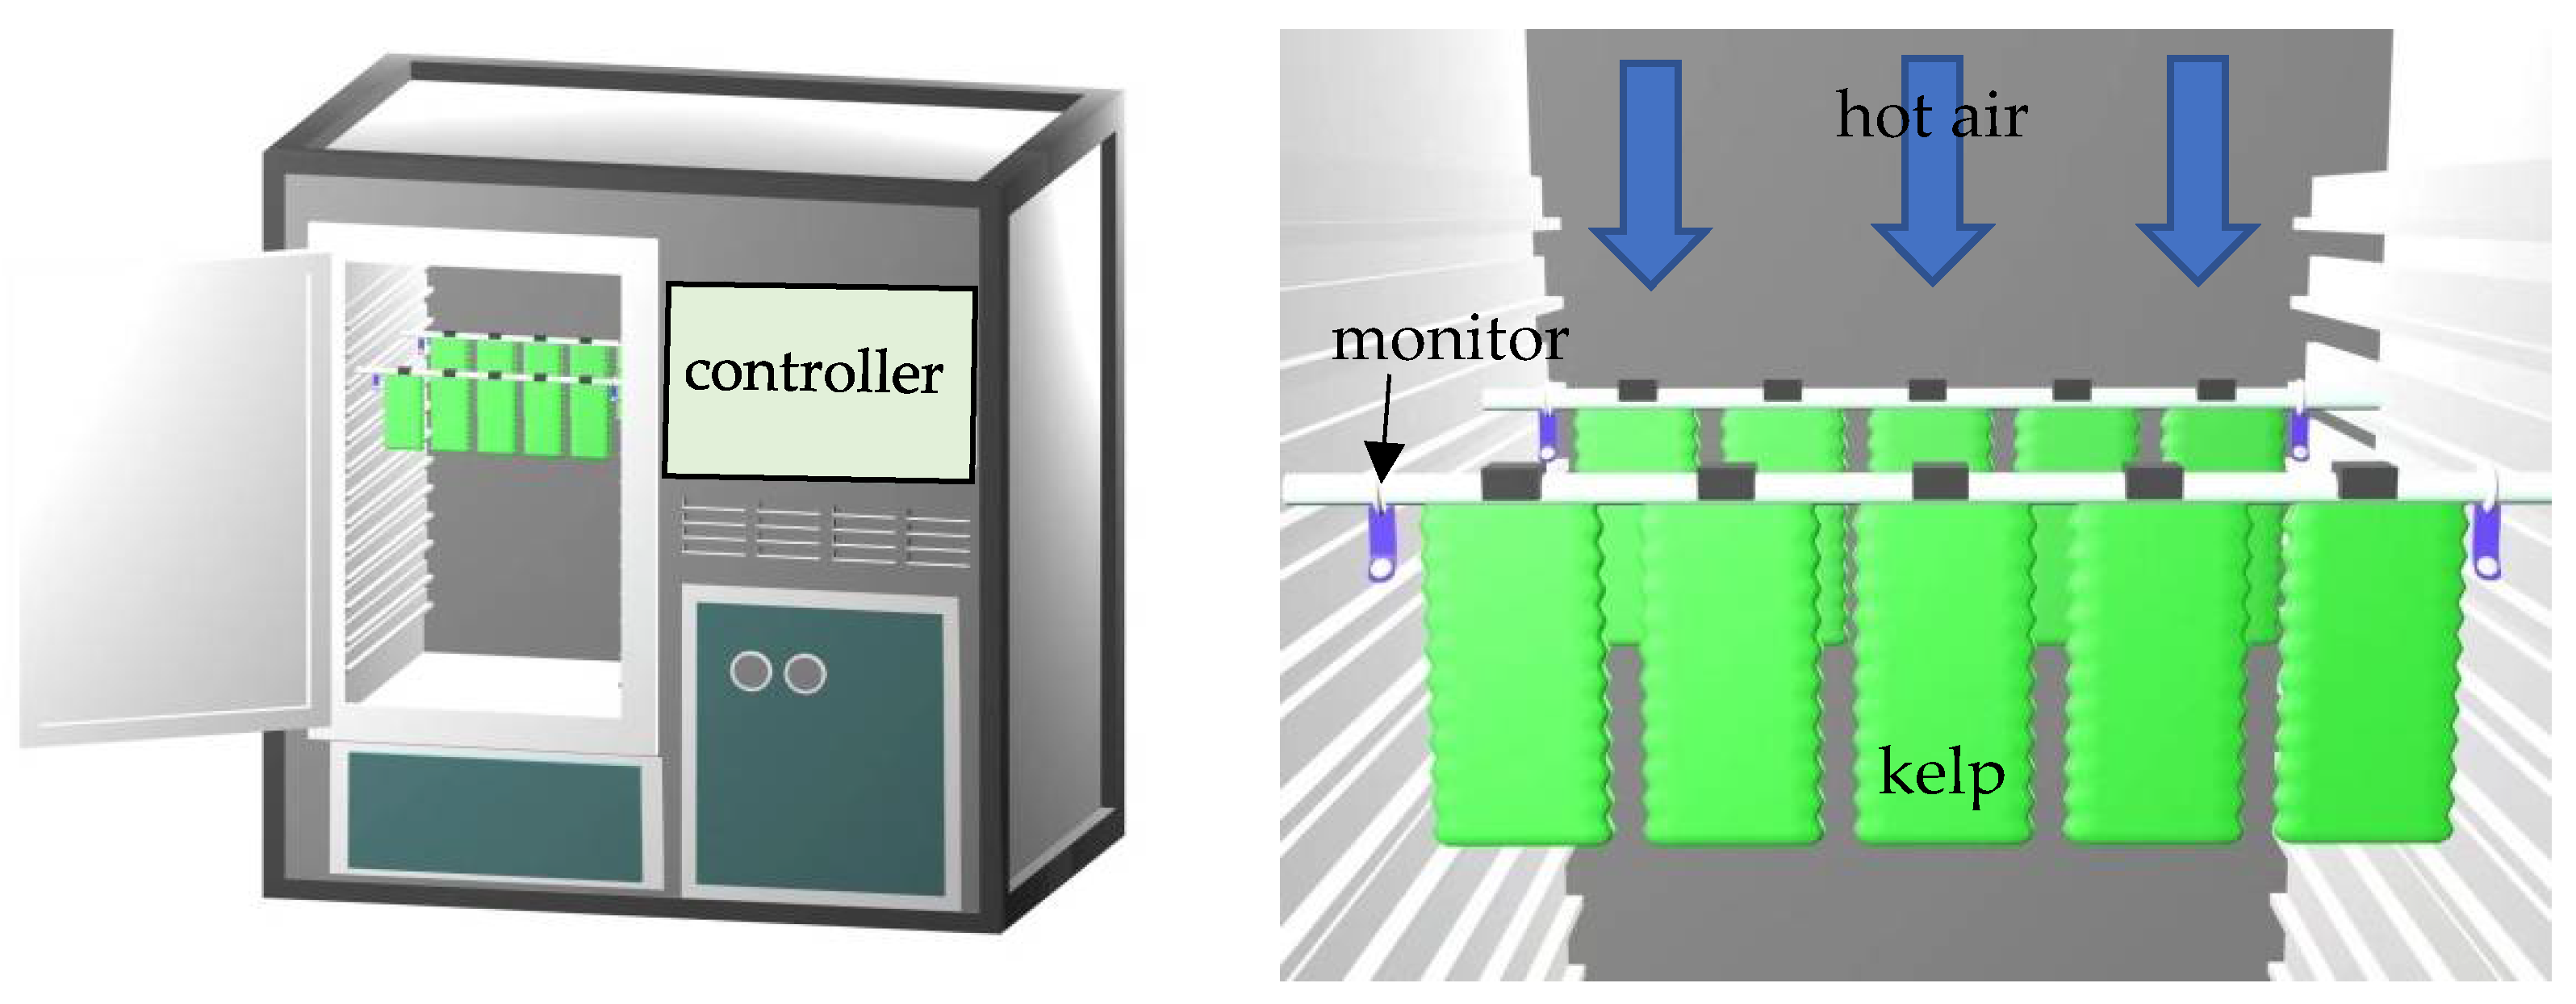
2.2. Heat Pump Dryer

A heat pump dryer (YCFZD-2HP, Hangzhou Emant Technology Co., Ltd.,Hangzhou, China) was used for the drying experiments (Figure 1). It consisted of a drying chamber (60 cm × 90 cm) and a heat pump system with control devices and a centrifugal air blower.
The temperature, air velocity, humidity, and thickness were taken as the four main influencing factors affecting kelp heat pump drying. In addition to the equipment temperature, humidity, and air velocity controller, 4 monitoring points were set around the kelp area in the chamber, and the parameters of different positions were measured by temperature–humidity recorders (DS1923, Shanghai Wodisen Electronic Technology Co., Ltd.,Shanghai, China) and a hand-held thermal anemometer (MODEL6004, Shenyang Jianye Max Instrument Co., Ltd., Shenyang, China). The temperature, humidity, and air velocity accuracy among the 4 monitoring points were within ±1.67 °C, ±2.97%, and ±0.04 m/s, respectively. All parameters were stable before the drying experiments.

2.3. Drying Procedure

The experiments were conducted according to Table 2. During the drying process, as shown in Figure 1, two rigid PVC pipes were suspended on the internal bracket, and the kelp slices were hung vertically in 2 rows of 5 slices using small stainless-steel clamps. The blower provided air from top to bottom through the kelp in parallel. The kelp weight was recorded hourly during the drying process using an electronic balance (ME4002E, METTLER TOLEDO, Shanghai, China). When the moisture content (wet base) fell to below 18%, the experiment was terminated. The total drying duration was 4–16 h, depending on the drying conditions and kelp thickness. The experiment was repeated 3 times for each group.

2.4. Moisture Content and Moisture Ratio

Moisture content (Mdb) was calculated as follows:
M w b = m t m 0 ( 1 M 0 ) m t × 100 %
M d b = M w b 1 M w b × 100 %
where Mwb indicates the wet basis moisture content at a particular drying time t, g H2O/g w.b.; Mdb indicates the dry basis moisture content at a particular drying time t, g H2O/g d.b.; mt indicates the sample weight at a particular drying time t, g; m0 indicates the initial weight of the sample, g; M0 indicates the initial moisture content, g H2O/g w.b.
The moisture ratio (MR) was calculated as follows:
M R = M t M e M o M e
where Me indicates the equilibrium moisture content, g H2O/g d.b.
Sappati et al. [24] measured the equilibrium moisture content (Me) of kelp at temperatures of 40–70 °C and 25–50% humidity, and the Me value varied from 0.0707 to 0.1270 kg H2O/kg dry solids, without any significant difference. Since the Me was far less than the M0 and Mt, Formula (2) could be simplified as [25,26,27,28]
M R = M t M 0

2.5. Mathematical Modeling of Drying Curves

Henderson–Pabis, Page, and Lewis models are commonly used mathematic models of for most thin-layer drying of organic and biological materials [14,29]. These models are effective over the specific ranges of temperature, air velocity, and humidity for which they are developed. Linearization was conducted on each model (Table 3).

2.6. Effective Moisture Diffusivity

Fick’s unsteady second law equation was adopted [23,27], and the water diffusion of kelp in the heat pump drying process is given as follows:
M R = 8 π 2 n = 0 1 ( 2 n + 1 ) 2 exp ( ( 2 n + 1 ) 2 π 2 D e f f t L 2 )
where Deff is the effective moisture diffusivity of the material, m2/s; L is the material thickness of the kelp, m; n is the positive integer; t is the drying time, s. Page [31] approximated the 8 π 2 ratio as being equal to unity, and n is taken as 1 for longer drying times [27,33]. Thus, the equation was further simplified to the first term of the series and expressed in logarithmic form as follows:
ln   M R = ln ( 8 π 2 ) ( π 2 D e f f L 2 t )

2.7. Thermodynamic Property Parameters

Drying activation energy Ea is calculated according to the formula
D e f f = D 0 exp [ E a R ( T + 273.15 ) ]
where D0 indicates the diffusion base in the material, m2/s; Ea indicates the drying activation energy of the material, J/mol; R is the molar constant of gas, whose value is 8.314 J/(mol·K); T is the drying temperature of kelp, °C.
The drying rate constant k (s−1) can be expressed as [23]
k = ( k B T abs h p ) exp ( Δ S R ) exp ( Δ H R T abs )  
Transferred into logarithmic form, it is
Δ S = R [ ln D 0 ln ( k B h p ) ln T abs ]
Δ H = E a R T abs
Δ G = Δ H T abs Δ S
where Δ H is the enthalpy change, J/mol; Δ S is the entropy change, J/mol·K;   Δ G is the Gibbs free energy change, J/mol; k B is the Boltzmann constant (1.380 × 10⁻²³ J/K), hp is the Planck’s constant (6.626 × 10⁻³⁴ J·s), R is the universal gas constant (8.314 J/mol·K), and Tabs is the absolute temperature (K).

2.8. Statistical Analyses

Data were analyzed using IBM SPSS Statistics 22 (SPSS Lnc., Chicago, IL, USA) and presented as mean values from triplicate samples. The coefficient of determination (R2) of the model was calculated via the following equations [19].
R 2 = 1 i = 1 n ( M R p r e , i M R e x p , i ) 2 i = 1 n ( M R ¯ p r e , i M R e x p , i ) 2
where MRpre,i and MRexp,i represent the predicted value and the experimental value, respectively; and n is the number of data.
The residual distribution was evaluated to check the randomness between predicted values and the experimental data.

3. Results

3.1. Effect of Heat Pump Drying on Dehydration Characteristics

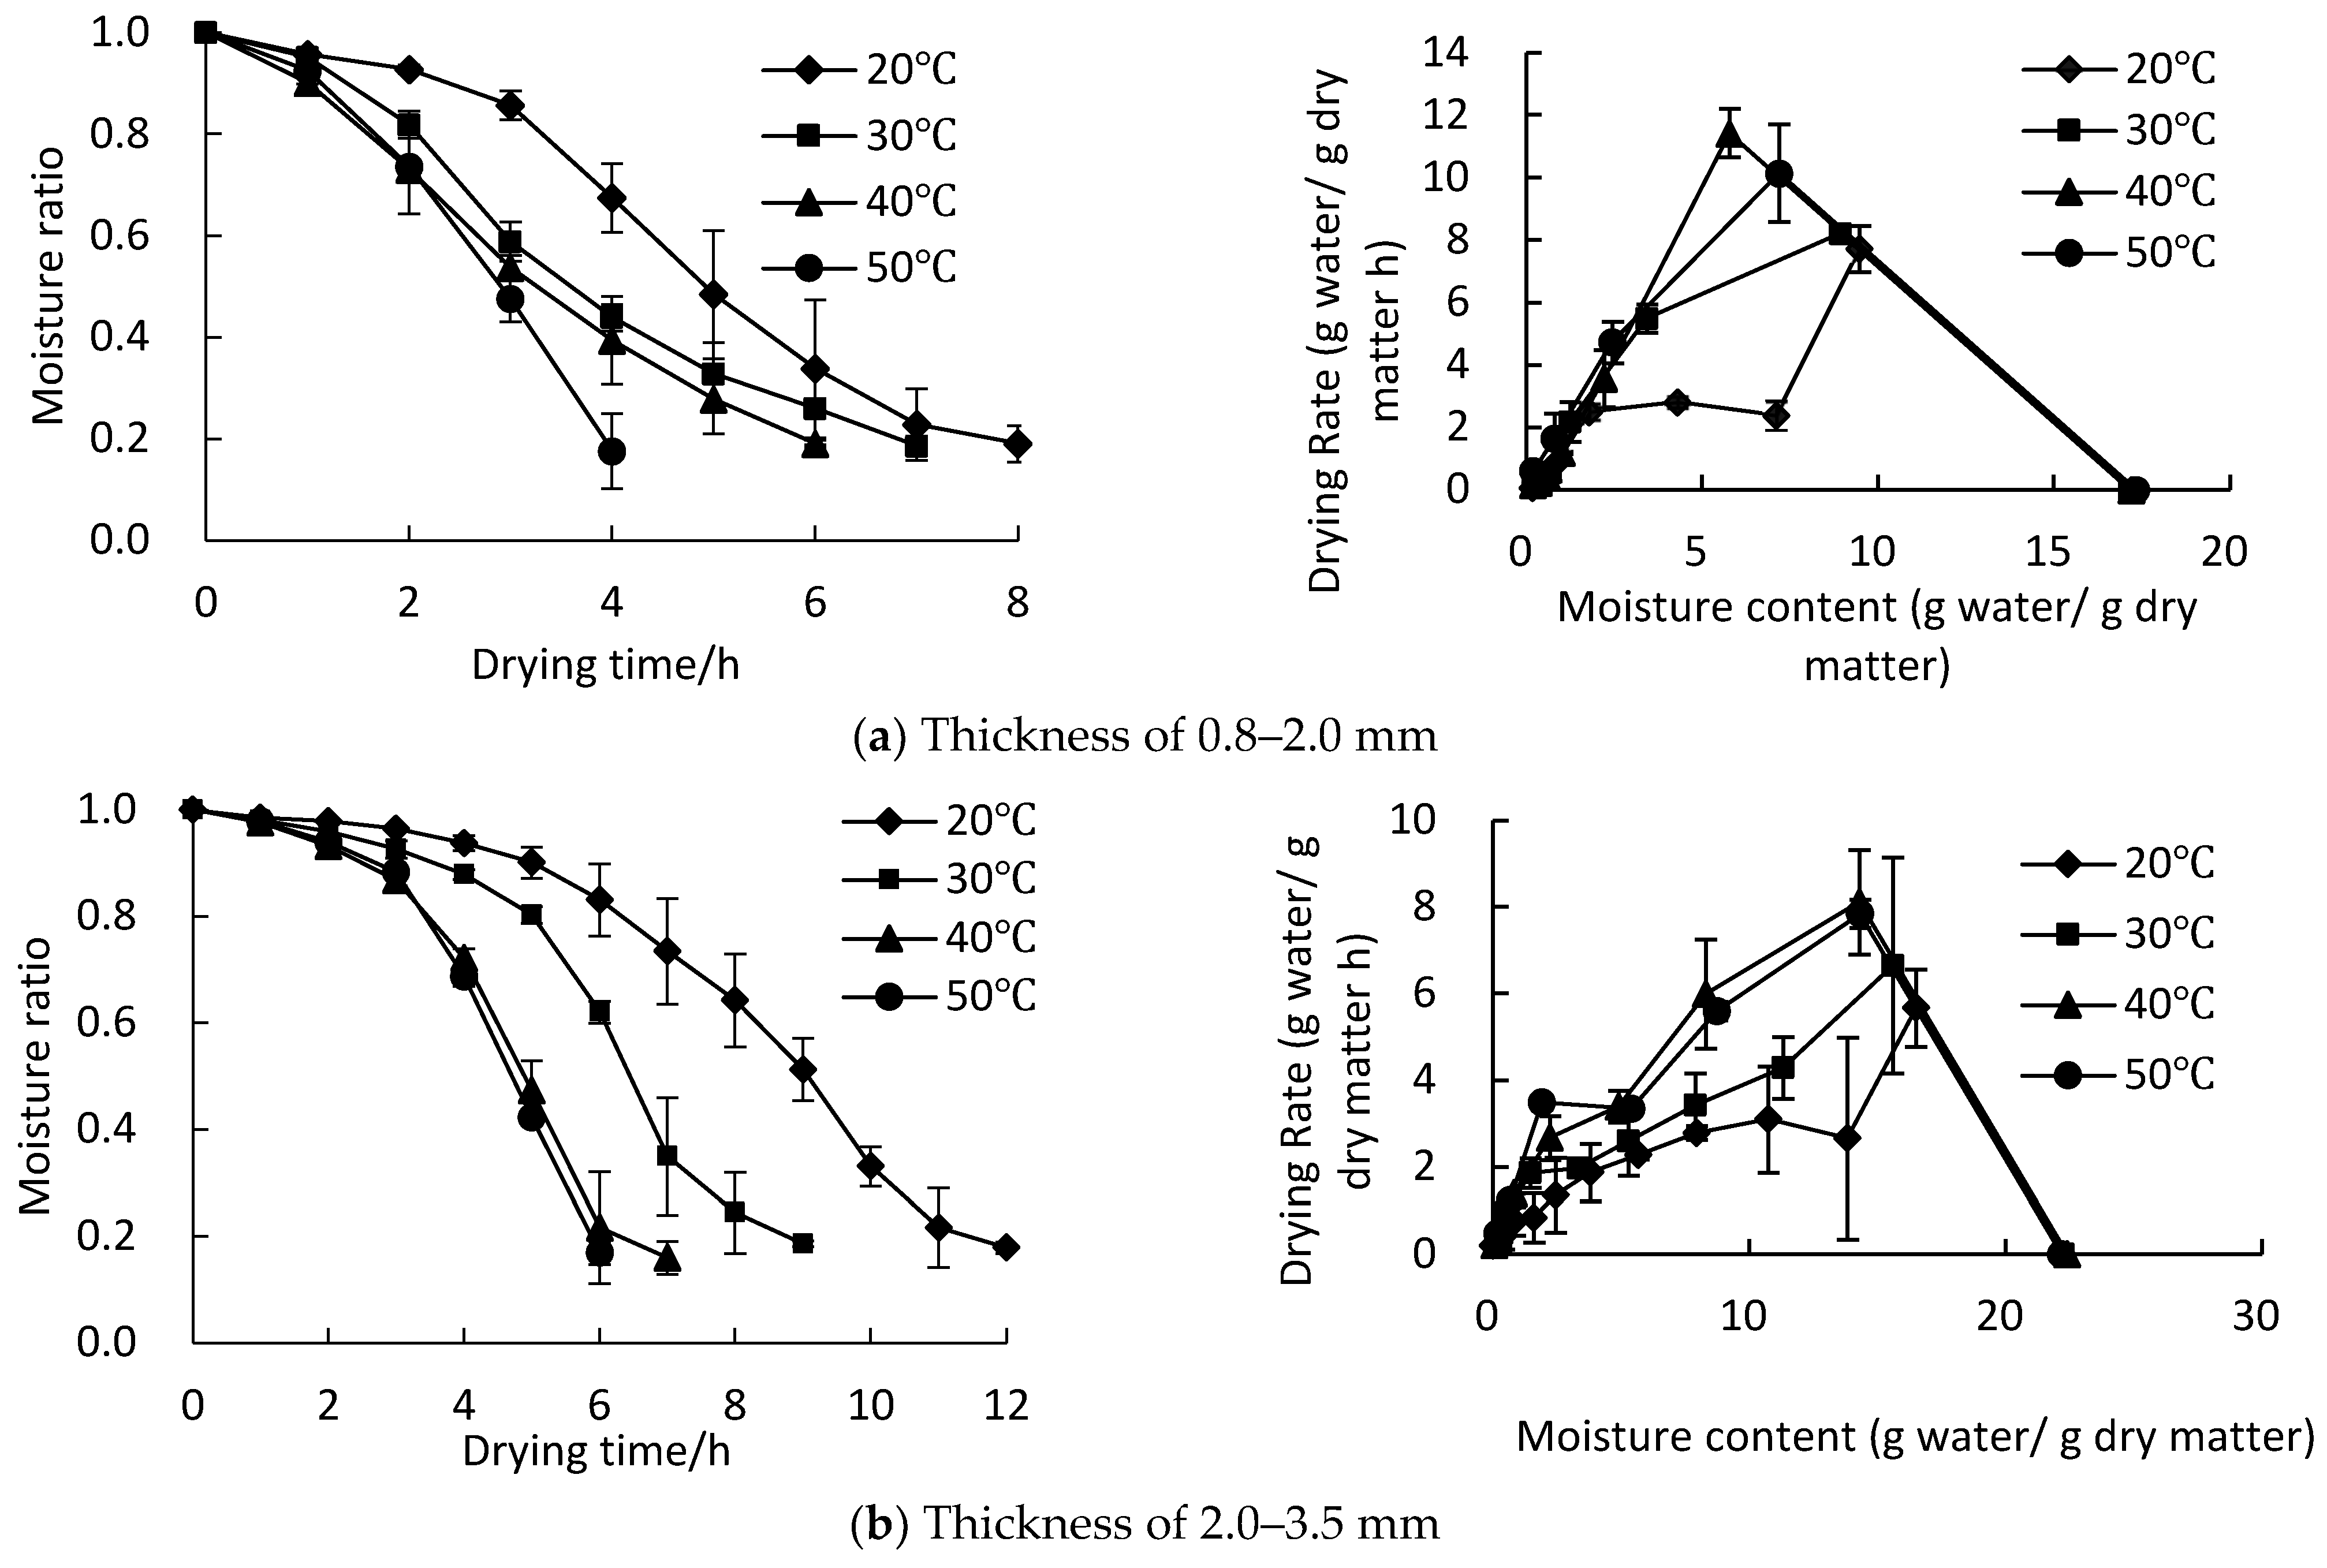
3.1.1. Effect of Temperature on Drying Characteristics

The change in the moisture ratio (MR) and drying rate under different drying temperatures and kelp thickness is shown in Figure 2. The moisture content reduced to 18% within 4–16 h, and increasing the drying temperature and decreasing the kelp thickness could shorten the drying time. The drying times of the 30 °C, 40 °C, and 50 °C groups were reduced by 22.5%, 39.2%, and 55.6%, respectively, compared with the 20 °C group. The average drying time with a thickness of 0.8–2 mm was 26.5%, 41.9% shorter than that of 2–3.5 mm and 3.5–4.2 mm, respectively. This is consistent with Chen et al. [34], who found that drying temperature and kelp extract thickness could significantly affect the drying rate by 40–50%.
The kelp moisture ratio decreased with the extension of drying time, while the drying rate slowed down in the latter part of the drying period. This is because the parenchyma cells and spaces between the cells were fully filled with moisture in the early stages, and cells could stretch freely, allowing moisture to escape through the loose passageway. Although there was moisture transfer resistance inside the material at this time, the drying rate was mainly affected by material surface evaporation [35], but, along with the heat pump drying, moisture within the kelp declined significantly. The drying limiting factor gradually changed from being surface evaporation control to internal diffusion control. Of course, this transition was related to many factors. From Figure 2, both temperature and thickness had an impact on this transition. The decelerated drying stage was obviously longer with thin kelp leaves and lower temperatures. This is because the thin leaves contained less moisture and the low-temperature group offered a smaller temperature gradient, which prolonged the decelerated drying process.

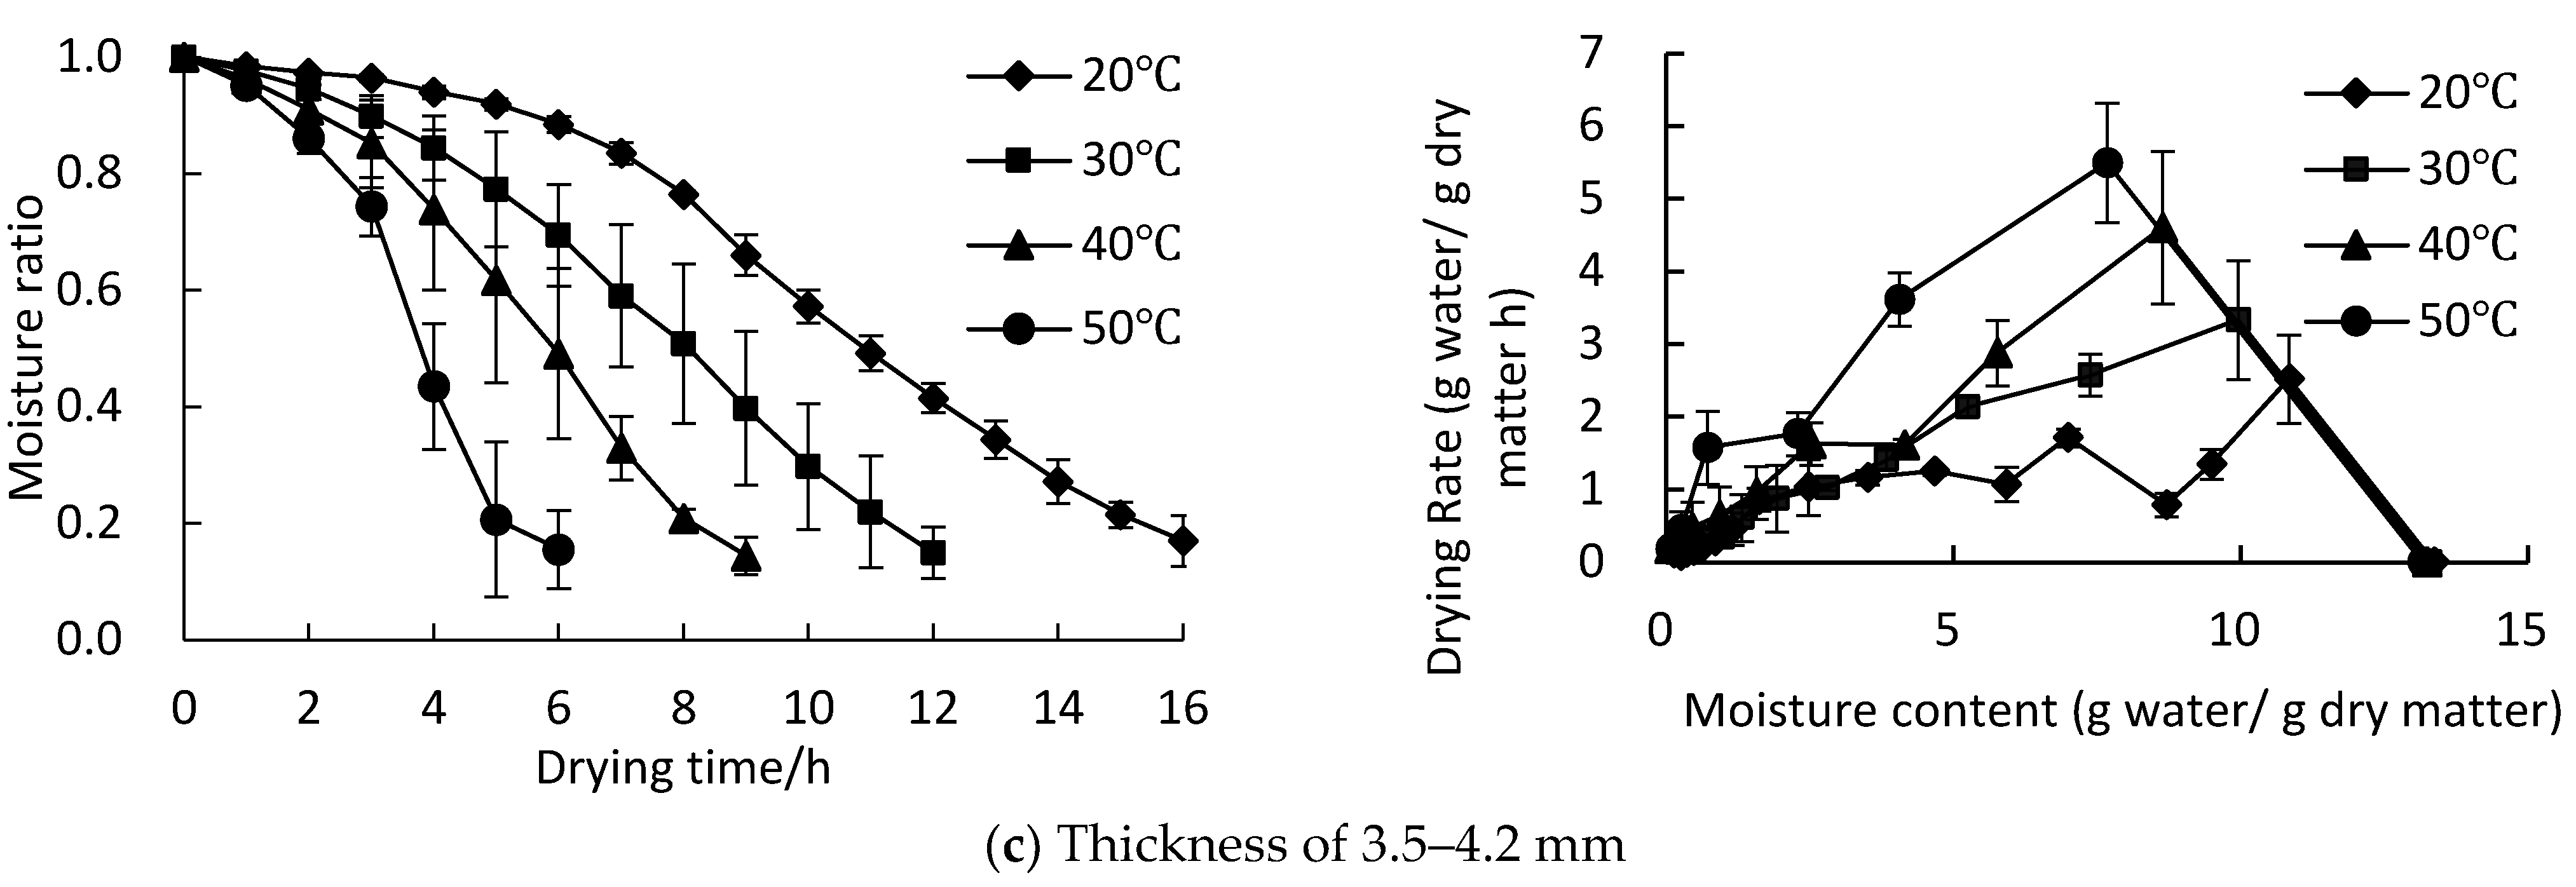
3.1.2. Effect of Air Velocity on Drying Characteristics

Figure 3 shows the change in moisture ratio (MR) and drying rate under different drying air velocities and thicknesses. It can be seen from Figure 3 that the drying time was shorter with an increase in air velocity and decrease in thickness. The average kelp drying time in 3.5–4.2 mm and 2.0–3.5 mm was 47.4%, 37.0% longer than that of 0.8–2.0 mm. When the air velocity was 1.3 m/s, the kelp drying time reduced by 50.0% (0.8–2.0 mm), 64.3% (2.0–3.5 mm), and 53.8% (3.5–4.2 mm), respectively, compared with a 0.3 m/s air velocity. As the air velocity increased, the kelp surface heat and mass transfer improved, and the water vapor escaping from the materials was rapidly removed and replaced by fresh dry air, accelerating the surface moisture evaporation and shortening the drying time. This was consistent with the findings of both the hot air drying of yam slices [33] and of pepper leaves [29].

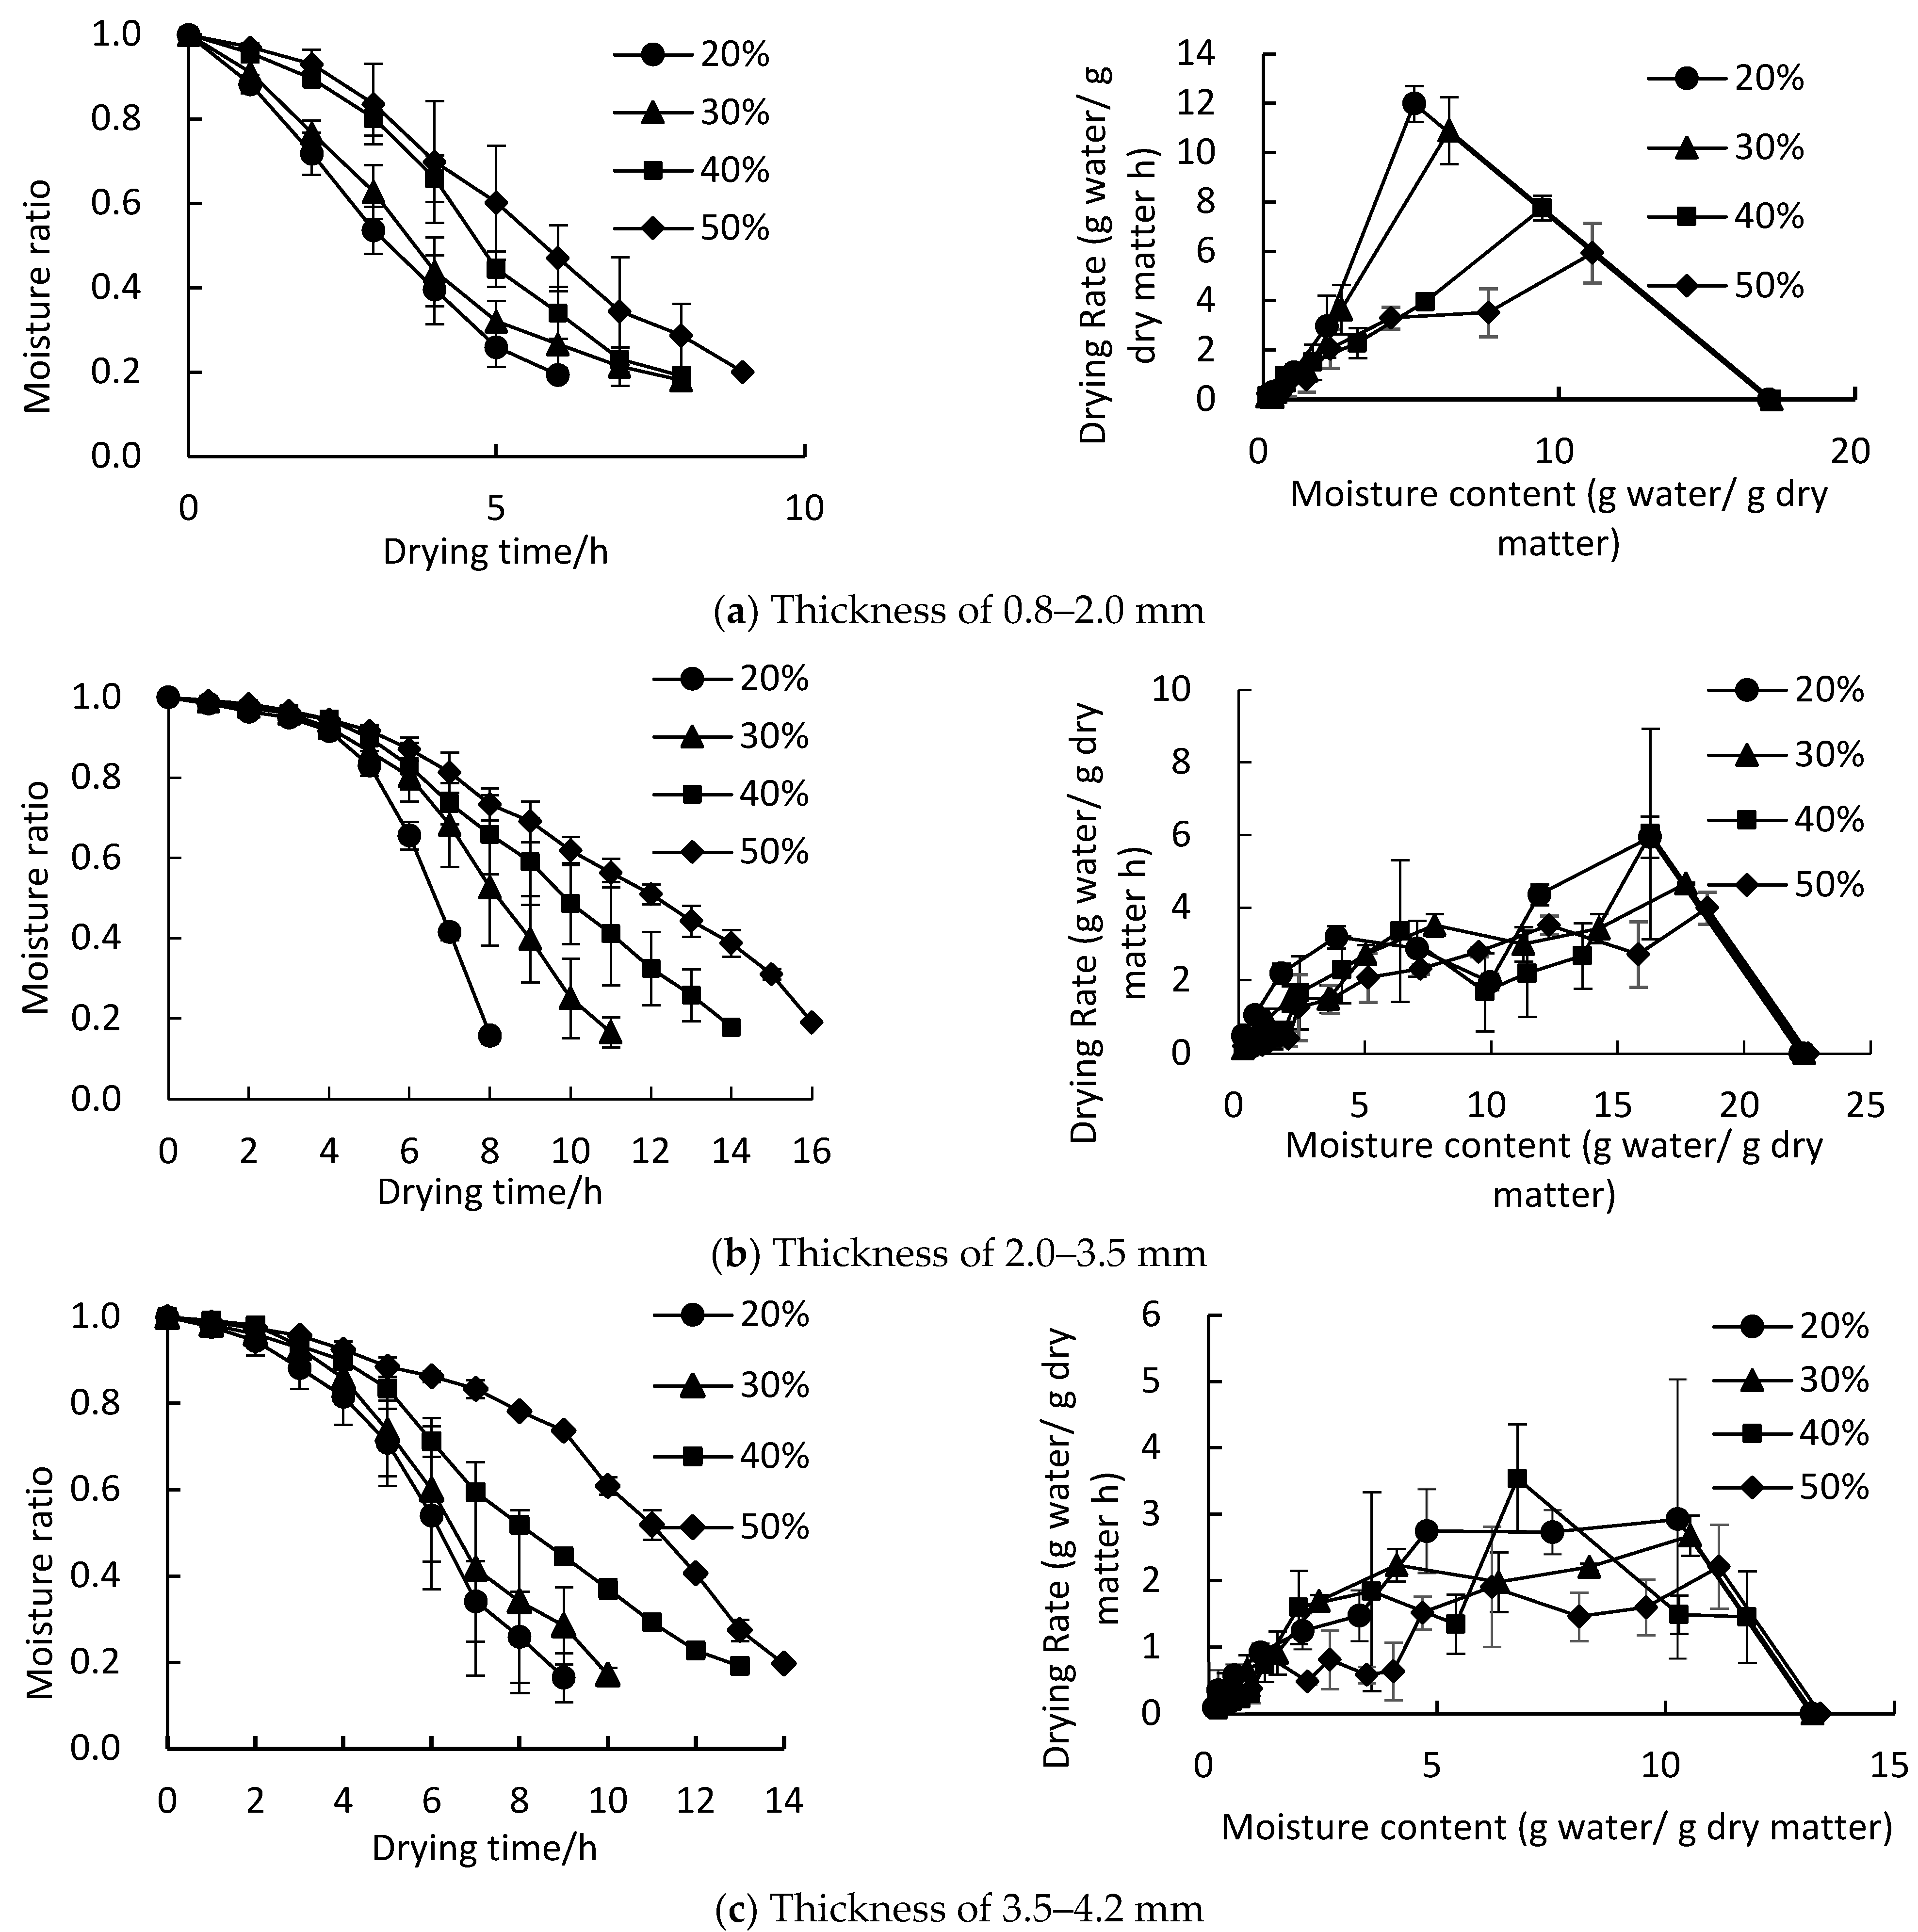
3.1.3. Effect of Humidity on Drying Characteristics

Figure 4 illustrates the change in the moisture ratio (MR) and drying rate under different drying humidity levels and thicknesses. It can be seen that when the drying temperature, air velocity, and thickness are constant, a reduction in dry humidity shortens the drying time. When the humidity was reduced from 50% to 20%, the kelp drying time was shortened by 41.0% on average. This is similar to the findings of a study by Xu et al. [36] on the hot air drying of finger citron slices. When the humidity was 40% and 50%, the final wet base moisture content of kelp (3.5–4.2 mm) terminated at 19.2% and 19.7%, respectively, and prolonged drying could not remove any more moisture. This is consistent with the conclusion drawn by Namkanisorn and Murathathunyaluk [37] in the equilibrium moisture content of galangal. This is due to the intracellular and entrapped water dominating in the latter drying period, which is already difficult to migrate outwards, particularly at low humidity gradients.

3.1.4. Effect of Kelp Thickness on Drying Time

Figure 5 shows the kelp drying time under different drying conditions and thicknesses. The difference in the drying time caused by thickness was between 2 h and 10 h, with a full drying duration of 4–16 h. In the T20, V0.3, and H50 groups, the kelp drying time varied dramatically with different thicknesses. The top part (3.5–4.2 mm) took 10 h, 9 h, and 8 h, respectively, longer than the tail part (0.8–2.0 mm). This indicates that the moisture content of the whole kelp varied greatly after the same drying time under such conditions. When the kelp moisture content was below 18%, the edges could become over-dried, while there was still excessive moisture in the top part. By contrast, the effect of thickness on drying time was less obvious under higher temperatures, air velocity, and lower humidity. This phenomenon was similar to that observed by Tham et al. [25], who reported that drying air at a high temperature and low humidity can reduce the inhomogeneity of air temperature and humidity and improve drying efficiency. The optimal values for the heat pump drying process were determined as a temperature of 40 °C, air velocity of 1.3 m/s, and humidity of 40%. The moisture content could reach 18% within 5 h with improved uniformity in moisture content. This corresponds with the conclusion drawn by Hu et al. [11], who claimed that the optimum temperature for kelp knot heat pump drying was 45 °C, with a drying time of 260 min.

3.2. Determination of Drying Model

Heat pump drying is a complex heat and mass transfer drying process. The experimental data of kelp drying at different temperatures, air velocities, humidity, and thicknesses were represented by the moisture ratio and fitted to three models (Table 4). The correlation coefficient of the Page model was 0.9663–0.9993, and the high fitting degree indicated that the Page model can accurately describe the drying kinetics of kelp.

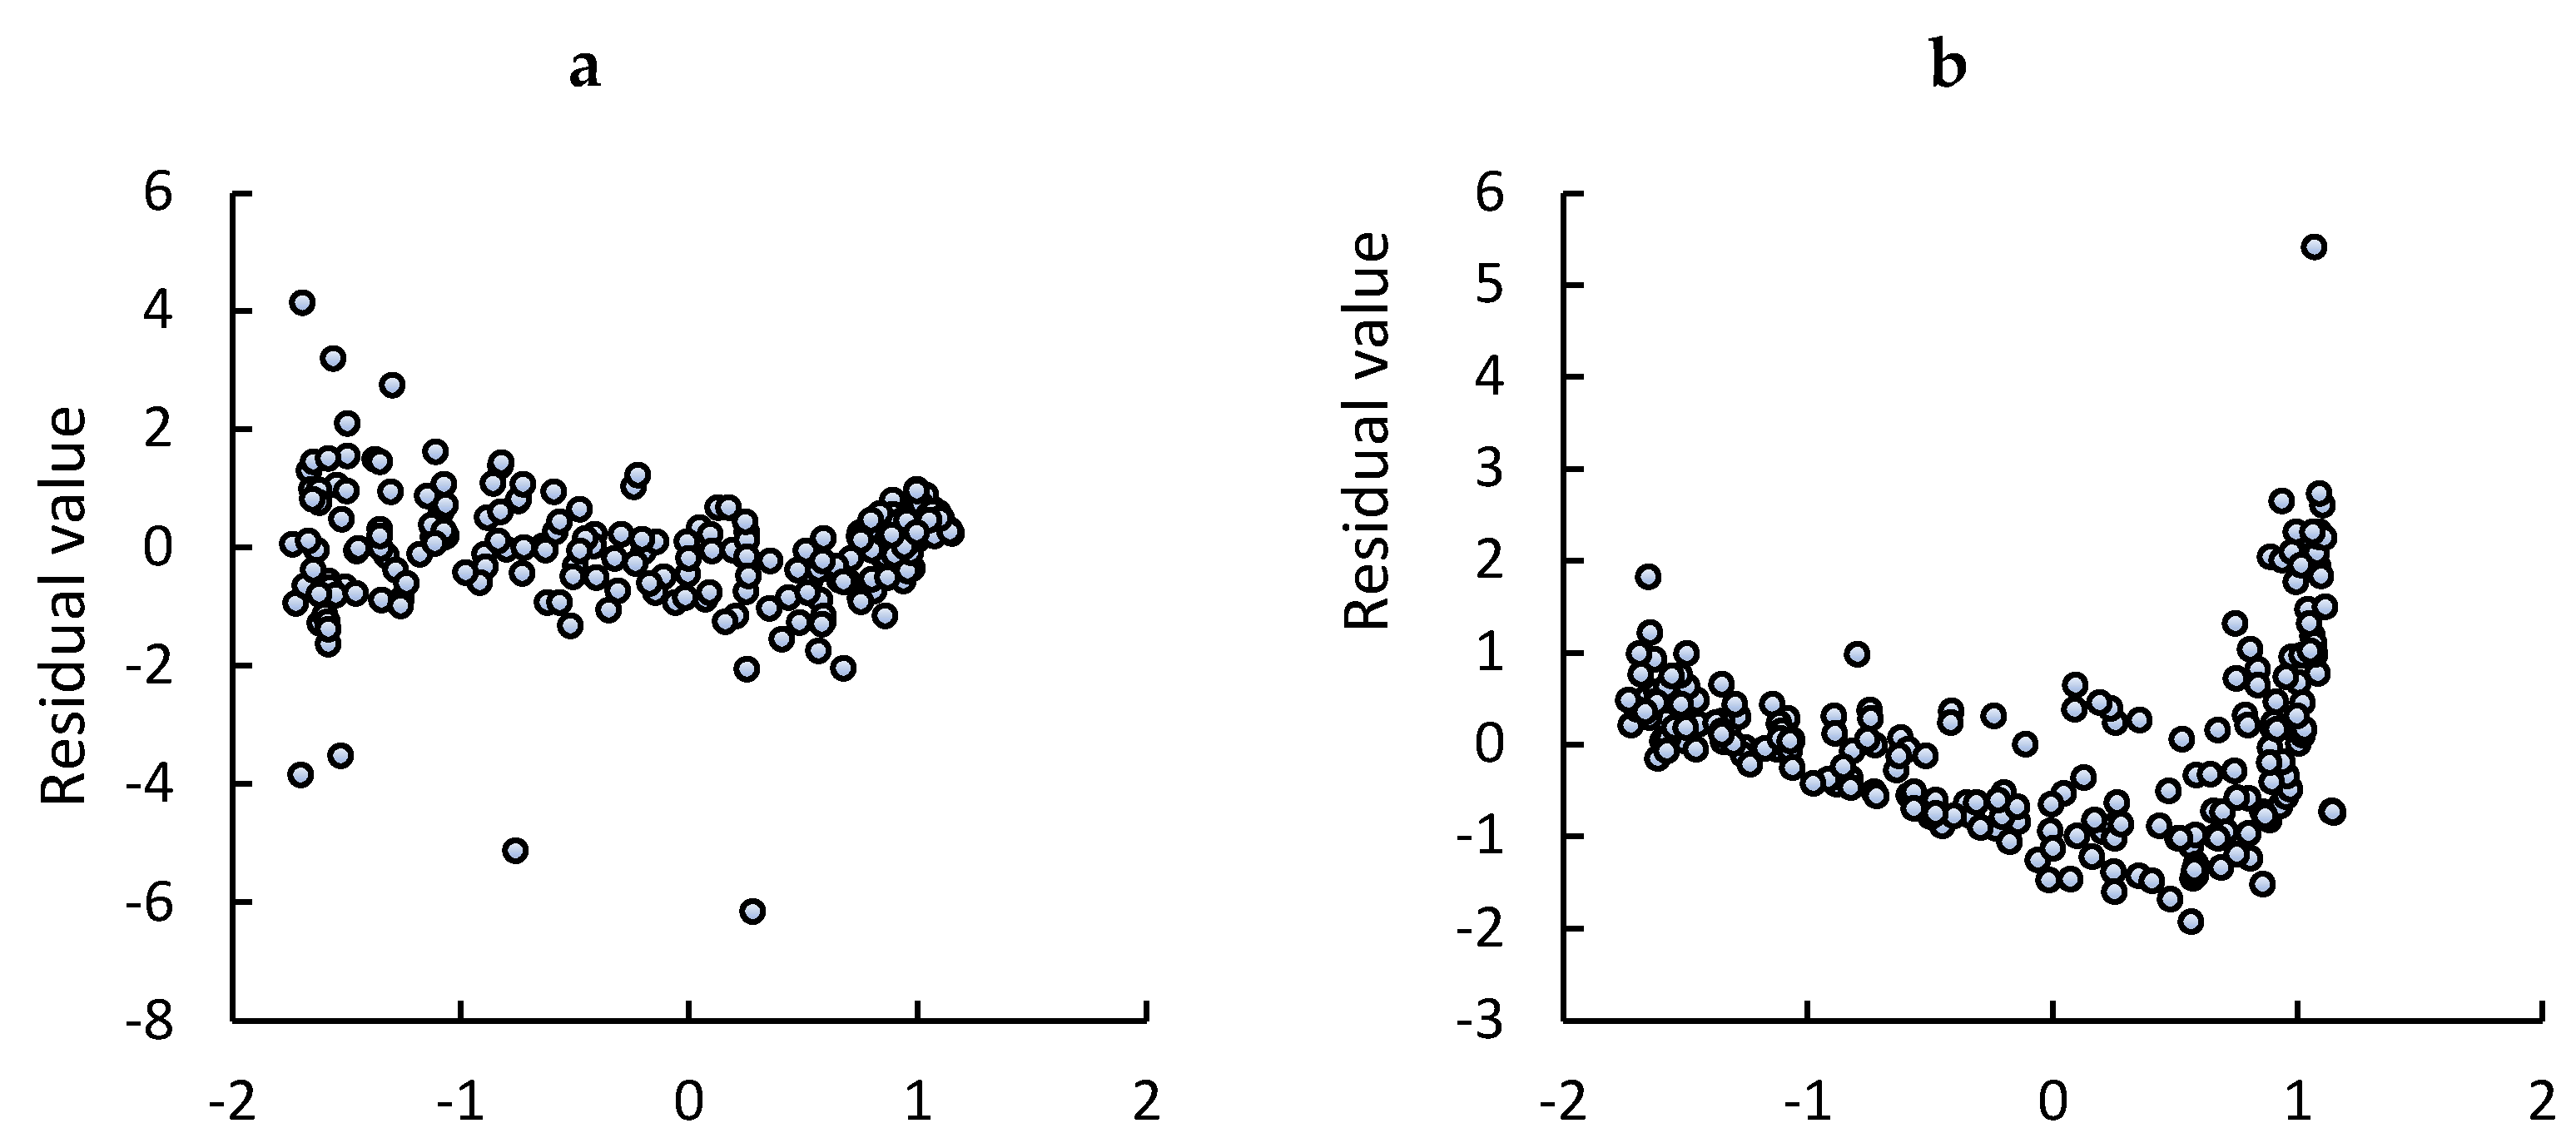
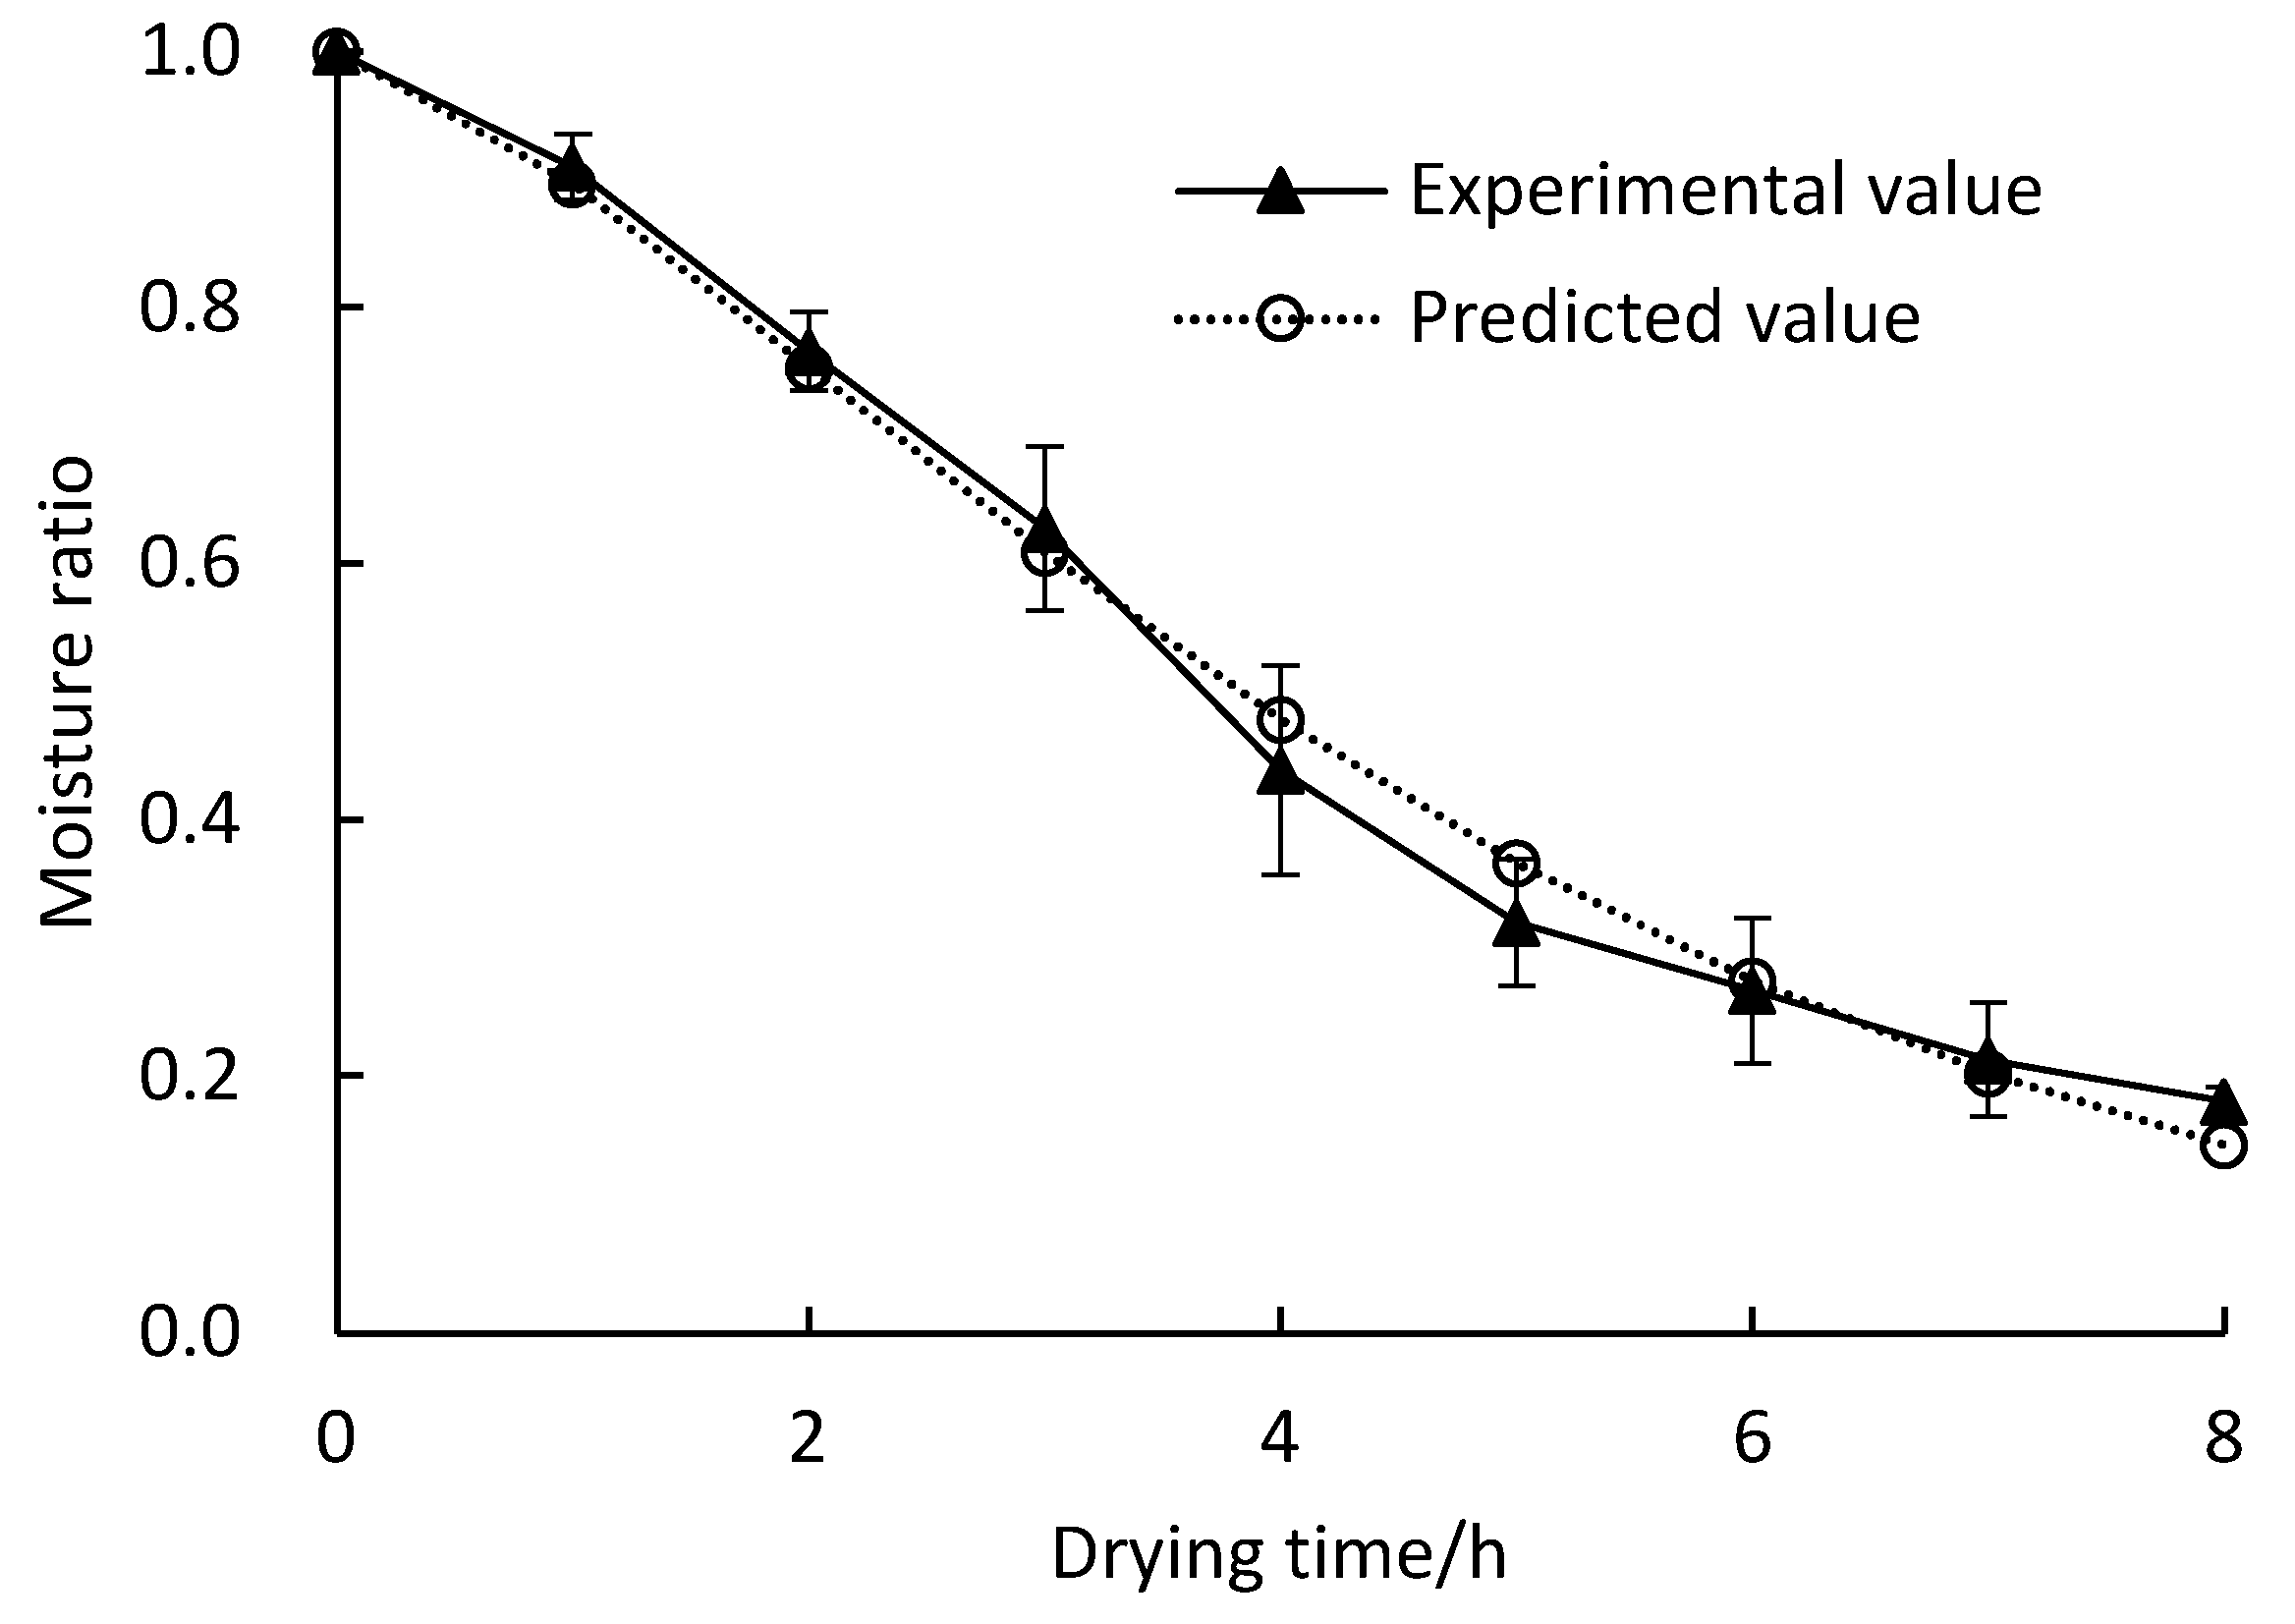
3.3. Verification of Kinetic Model

The fitting accuracy of the mathematical drying model and experimental data was further evaluated by residual analysis (Figure 6) and verified (Figure 7). Figure 6 depicts the residual graph of the Page (A) and Henderson–Pabis (B) models for all groups (total experimental points = 248). The residual distribution for the Page model varied from −0.246 to 0.165, while for the Henderson–Pabis model, the residual values ranged from −0.262 to 0.736 in a U pattern, indicating that the Page model represents more accurately the drying mechanism in comparison with the Henderson–Pabis model.
The predicted and experimental values were compared at 40 °C, 0.3 m/s, and 30%, as shown in Figure 7. The actual value curve of the test and the predicted value curve of the Page model fit well. Similar findings were reported by Singhanat [38], Hao et al. [39], and Almeida et al. [21], who also found that the Page model was most effective in describing the heat pump drying characteristics of ginger, lemon slices, and Achachairu peels. However, the Page model does not fit all the products; for instance, the Midilli and Kucuk model was selected to represent the drying kinetics of banana slices [14] and yacon slices [27], while B. forficata link leaves were described by the Valcam model [22].

3.4. Effective Moisture Diffusivity

The effective moisture diffusivity (Deff) was calculated (Table 5) in order to explore the moisture transfer characteristics of kelp in heat pump drying. It showed obviously that the Deff of heat-pump-dried kelp increased from 4.4307 × 10⁻¹¹ to 12.9957 × 10⁻¹¹ m2/s when the temperature rose from 20 to 50 °C (3.5–4.2 mm). When the air velocity rose from 0.3 to 1.3 m/s, the Deff increased from 5.9216 × 10⁻¹¹ to 12.2649 × 10⁻¹¹ m2/s (3.5–4.2 mm). When the humidity was increased from 20% to 50%, the Deff reduced from 8.2601 × 10⁻¹¹ to 4.1134 × 10⁻¹¹ m2/s (3.5–4.2 mm). When the thickness was increased from 0.8–2 mm to 3.5–4.2 mm, the Deff was improved from 1.2314 × 10⁻¹¹ to 7.1409 × 10⁻¹¹ m2/s (40 °C, 30 %, 0.3 m/s). This indicates that the temperature, air velocity, and thickness exert positive effects on the Deff value; conversely, humidity exerts a negative effect on the Deff increase. This is consistent with the findings of Bauhinia forficata link leaves [22], apple slices [23], and pepper leaves [29]. By contrast, the Deff of kelp is lower than that of Achachairu peels [21] and banana slices [14], but higher than that of Bauhinia forficata link leaves [22] and Piper umbellatum L. leaves [29] at the same drying temperature. The Deff value was related to the physicochemical properties and moisture content, as well as temperature. On the one hand, the kelp initial moisture content was up to 92.4–95.7%, which contributed to the Deff value. However, on the other hand, the kelp surface was compact and leathery, retarding the free diffusion of moisture. In addition, kelp is rich in dietary fiber, which has a strong water-holding capacity and inhibits the migration of water molecules.

3.5. Thermodynamic Parameters of Kelp with Different Thicknesses

The thermodynamic parameters of kelp were calculated and are shown in Table 6.
The activation energy (Ea) is an important index to reflect the moisture bonding ability of materials, indicating the energy required for water molecules to change from a normal to an active state that is prone to dehydration. The Ea of kelp with a thickness of 0.8–2.0 mm, 2.0–3.5 mm, and 3.5–4.2 mm were calculated to be 16.38 kJ/mol, 18.21 kJ/mol, and 26.66 kJ/mol, respectively. The Ea values of various food materials range from 12.7 to 110 kJ/mol [40]. The energy threshold of the top part was 62.76% higher than that of the tail part, indicating that tail parts can start the dehydration process with lower energy supplied in the initial heating-up period. The Ea difference was in line with the effective moisture diffusivity of kelp with different thicknesses, and this is the intrinsic reason for the faster drying of thinner kelp leaves.
The enthalpy (ΔH) in the drying process represents the energy required by moisture to be removed from kelp. The ΔH values were positive and decreased with drying temperature, which illustrates that the drying process is endothermic and requires less energy at higher drying temperatures. This is consistent with Costa et al. [41] on the thermodynamic characteristics of fruit peel drying at different temperatures. Compared with the drying temperature, the thickness of kelp exhibited a more obvious effect on the ΔH. The ΔH of kelp with a thickness of 3.5–4.2 mm was 174.54% and 154.09% for the ΔH of 0.8–2.0mm and 2.0–3.5 mm, respectively. The results showed that the energy required by the top section of the kelp was 54.09%–74.54% higher than in other parts of kelp.
Entropy plays a definitive role in the chaos of the materials, the change in energy, and the stability of the process. The results showed that the entropy decreased significantly during kelp drying, signifying that heat pump drying improved the intermolecular order of the kelp, which stabilized the dried kelp tissue.. In addition, both temperature and air velocity exerted negative effects on the ΔS value, but thickness had a positive effect. Similar results were found with apple slices [23], but the results with Bauhinia forficata link leaves differed [22].
The Gibbs free energy (ΔG) assesses the spontaneity of moisture desorption [42] and provides a better view on the thermodynamic driving forces influencing reactions [23]. When the phenomenon occurs spontaneously, ΔG is negative, meaning that no external energy is required, while the results showed that ΔG remained positive under all the investigated conditions, meaning that the process did not occur spontaneously. This corresponds with the ΔH result, suggesting that kelp drying is an endergonic process that requires energy from the environment for the reaction to occur. Furthermore, the ΔG value was increased with drying temperature and thickness, which is consistent with studies by Nadi et al. in terms of apple slice drying [23] and Corrêa et al. in terms of coffee drying [42]. However, the results differed from Costa et al. [41] and Silva et al. [22], who found that the ΔG decreased with increments in the drying temperature and thickness of the materials, respectively. These findings reflect the complex characteristics of internal energy reactions.

4. Conclusions

This study elucidated the kinetics and thermodynamics of heat pump drying for kelp, and mapped the apparent drying non-uniformity with the inner mechanism of heat and mass transfer, which gave an insight into the drying efficiency and quality improvement.
The temperature, air velocity, humidity, and thickness affected the kinetic characteristics of heat pump drying for kelp. With the increase in temperature and air velocity and a decrease in humidity, the effect of thickness on moisture uniformity reduced.
The Page model was established to predict the moisture migration principle of kelp. The kelp Deff was calculated as 1.00 × 10⁻¹¹–13.00 × 10⁻¹¹ m2/s, increasing with drying temperature, air velocity, and thickness but decreasing with humidity.
The thermodynamic parameters of kelp heat pump drying were calculated. The kelp thickness had a significant effect on the thermodynamic characteristics. The kelp Ea was 16.38–26.66 kJ/mol. Meanwhile, ΔH was 13.69–24.22 kJ/mol, ΔS was −403.60–−349.92 J/(mol·K), and ΔG was 127.42–142.50 kJ/mol. These results provide a theoretical basis for the thermodynamic calculation of a heat pump drying system for kelp and for improvements in macroalgae drying technology.
To shorten the drying time on the premise of uniformity in moisture content, the optimal drying parameters were determined as a temperature of 40 °C, air velocity of 1.3 m/s, and humidity of 40%.

Author Contributions

Conceptualization, Q.Z., G.Z. and S.X.; methodology, Q.Z. and M.Z.; software, S.L.; validation, M.Z.; resources, G.Z.; writing—original draft preparation, Q.Z.; writing—review and editing, G.M., X.L. and S.X.; project administration, G.Z. All authors have read and agreed to the published version of the manuscript.

Funding

This research was funded by National Key R&D Program of China (2019YFD0901800); Education Department of Liaoning Province (JL202011); Ocean Research Center of Liaoning Province (DL201908); Ocean and Fisheries Department of Liaoning Province (201722); Key Laboratory of Environment Controlled Aquaculture (Dalian Ocean University) Ministry of Education (202203); National Key R&D Program of China (2020YFD0900600); Natural Science Foundation of Liaoning Province (2020-BS-214).

Institutional Review Board Statement

Not applicable.

Informed Consent Statement

Not applicable.

Data Availability Statement

All data that support the findings of this study are included within the article.

Conflicts of Interest

The authors declare no conflict of interest.

References

  1. FAO. The State of World Fisheries and Aquaculture 2020; Sustainability in Action; FAO: Rome, Italy, 2020. [Google Scholar]
  2. Wells, M.L.; Potin, P.; Craigie, J.S.; Raven, J.A.; Merchant, S.S.; Helliwell, K.E.; Smith, A.G.; Camire, M.E.; Brawley, S.H. Algae as nutritional and functional food sources: Revisiting our understanding. J. Appl. Phycol. 2017, 29, 949–982. [Google Scholar] [CrossRef]
  3. Christine, D.; Rainer, S.; Gerhard, J. Amino acids, fatty acids, and dietary fibre in edible seaweed products. Food Chem. 2007, 103, 891–899. [Google Scholar]
  4. Déléris, P.; Nazih, H.; Bard, J.M. Seaweeds in human health. In Seaweed in Health and Disease Prevention; Academic Press: Cambridge, MA, USA, 2016; pp. 319–367. [Google Scholar]
  5. Ali, M.K.M.; Fudholi, A.; Sulaiman, J.; Ruslan, M.H.; Yasir, S.M. Sauna technique, drying kinetic modeling and effectiveness on solar drying compared with direct drying in drying process of Kappaphycus striatum in Selakan Island Malaysia. Energy Power Eng. 2014, 06, 303–315. [Google Scholar] [CrossRef] [Green Version]
  6. Foscarini, R.; Prakash, J. Handbook on Eucheuma Seaweed Cultivation; FAO: Rome, Italy, 1990. [Google Scholar]
  7. Ling, A.L.M.; Yasir, S.; Matanjun, P.; Abu Bakar, M.F. Effect of different drying techniques on the phytochemical content and antioxidant activity of Kappaphycus alvarezii. J. Appl. Phycol. 2015, 27, 1717–1723. [Google Scholar] [CrossRef]
  8. Sarbatly, R.; Wong, T.; Bono, A.; Krishnaiah, D. Kinetic and thermodynamic characteristics of seaweed dried in the convective air drier. Int. J. Food Eng. 2010, 6, 1–16. [Google Scholar] [CrossRef]
  9. Jokiel, M.; Bantle, M.; Kopp, C.; Verpe, E.H. Modelica-based modelling of heat pump-assisted apple drying for varied drying temperatures and bypass ratios. Therm. Sci. Eng. Prog. 2020, 19, 100575–100582. [Google Scholar] [CrossRef]
  10. Andriy, R.; Oleksandr, R.; Ronald, D. Heat Pumps in the Drying Industry; Academic Press: Cambridge, MA, USA, 2020; pp. 135–175. [Google Scholar]
  11. Hu, Z.Q.H.; Bao, Q.; Ge, F.; Gao, X. Study on drying characteristics and mathematical model of S. japonica knot heat pump. J. Jiangsu Univ. 2019, 40, 649–654. [Google Scholar]
  12. Zhu, Z.; Zhao, Y.; Zhang, Y.; Wu, X.; Liu, J.; Shi, Q.; Fang, Z. Effects of ultrasound pretreatment on the drying kinetics, water status and distribution in scallop adductors during heat pump drying. J. Sci. Food Agric. 2021, 101, 6239–6247. [Google Scholar]
  13. Deng, Y.; Liu, Y.; Qian, B.; Su, S.; Wu, J.; Song, X.; Yang, H. Impact of far-infrared radiation-assisted heat pump drying on chemical compositions and physical properties of squid (Illex illecebrosus) fillets. Eur. Food Res. Technol. 2011, 232, 761–768. [Google Scholar] [CrossRef]
  14. Tunckal, C.; Doymaz, İ. Performance analysis and mathematical modelling of banana slices in a heat pump drying system. Renew. Energy 2020, 150, 918–923. [Google Scholar]
  15. Aktaş, M.; Taşeri, L.; Şevik, S.; Gülcü, M.; Uysal Seçkin, G.; Dolgun, E.C. Heat pump drying of grape pomace: Performance and product quality analysis. Dry. Technol. 2019, 37, 1766–1779. [Google Scholar]
  16. Ming, L.; Shan, W.; Rongtang, L.; Yan, J. Energy, exergy and economic analyses on heat pump drying of lignite. Dry. Technol. 2019, 37, 1688–1703. [Google Scholar]
  17. Stévant, P.; Indergård, E.; Ólafsdóttir, A.; Marfaing, H.; Larssen, W.E.; Fleurence, J.; Roleda, M.Y.; Rustad, T.; Slizyte, R.; Nordtvedt, T.S. Effects of drying on the nutrient content and physico-chemical and sensory characteristics of the edible kelp Saccharina latissima. J. Appl. Phycol. 2018, 30, 2587–2599. [Google Scholar] [CrossRef]
  18. Chapman, A.S.; Stévant, P.; Larssen, W.E. Food or fad? Challenges and opportunities for including seaweeds in a Nordic diet. Bot. Mar. 2015, 58, 423–433. [Google Scholar] [CrossRef]
  19. Chang, A.; Zheng, X.; Xiao, H.; Yao, X.; Liu, D.; Li, X.; Li, Y. Short- and medium-wave infrared drying of cantaloupe (Cucumis melon L.) slices: Drying kinetics and process parameter optimization. Processes 2022, 10, 114–132. [Google Scholar]
  20. Pereira, R.; Yarish, C. Encyclopedia of Ecology; Elsevier: Amsterdam, The Netherlands, 2008. [Google Scholar]
  21. Almeida, R.L.J.; Santos, N.C.; Alves, I.L.; André, A.M.M. Evaluation of thermodynamic properties and antioxidant activities of Achachairu (Garcinia humilis) peels under drying process. Flavour Fragr. J. 2020, 36, 213–222. [Google Scholar]
  22. Silva, F.P.D.; Siqueira, V.C.; Martins, E.A.; Miranda, F.; Melo, R.M. Thermodynamic properties and drying kinetics of Bauhinia forficata Link leaves. Rev. Bras. Eng. Agrícola Ambient. 2017, 21, 61–67. [Google Scholar]
  23. Nadi, F.; Tzempelikos, D. Vacuum drying of apples (cv. Golden Delicious): Drying characteristics, thermodynamic properties, and mass transfer parameters. Heat Mass Transf. 2018, 54, 1853–1866. [Google Scholar]
  24. Sappati, P.K.; Nayak, B.; Van Walsum, G.P. Effect of glass transition on the shrinkage of sugar kelp (Saccharina latissima) during hot air convective drying. J. Food Eng. 2017, 210, 50–61. [Google Scholar] [CrossRef]
  25. Tham, T.C.; Ng, M.X.; Gan, S.H.; Chua, L.S.; Aziz, R.; Chuah, L.A.; Hii, C.K.; Ong, S.P. Effect of ambient conditions on drying of herbs in solar greenhouse dryer with integrated heat pump. Dry. Technol. 2017, 35, 1721–1732. [Google Scholar] [CrossRef]
  26. Doymaz, I.; Pala, M. Hot-air drying characteristics of red pepper. J. Food Eng. 2002, 55, 331–335. [Google Scholar] [CrossRef]
  27. Shi, Q.; Zheng, Y.; Zhao, Y. Mathematical modeling on thin-layer heat pump drying of yacon (Smallanthus sonchifolius) slices. Energy Convers. Manag. 2013, 71, 208–216. [Google Scholar] [CrossRef]
  28. Dadalı, G.; Kılıç Apar, D.; Özbek, B. Microwave drying kinetics of Okra. Dry. Technol. 2007, 25, 917–924. [Google Scholar] [CrossRef]
  29. Dorneles, L.D.N.S.; Goneli, A.L.D.; Cardoso, C.A.L.; da Silva, C.B.; Hauth, M.R.; Oba, G.C.; Schoeninger, V. Effect of air temperature and velocity on drying kinetics and essential oil composition of Piper umbellatum L. leaves. Ind. Crops Prod. 2019, 142, 111846–111853. [Google Scholar] [CrossRef]
  30. Henderson, S.M.; Pabis, S. Grain drying theory II: Temperature effects on drying coefficients. J. Agric. Eng. Res. 1961, 6, 169–174. [Google Scholar]
  31. Page, G.E. Factors Influencing the Maximum Rates of Air-Drying of Shelled Cron in Thin Layers. Master Thesis, Purdue University, West Lafayette, IN, USA, 1949. [Google Scholar]
  32. Lewis, W.K. The rate of drying of solid materials. J. Ind. Eng. Chem. 1921, 13, 427–432. [Google Scholar] [CrossRef]
  33. Ojediran, J.O.; Okonkwo, C.E.; Adeyi, A.J.; Adeyi, O.; Olaniran, A.F.; George, N.E.; Olayanju, A.T. Drying characteristics of yam slices (Dioscorea rotundata) in a convective hot air dryer: Application of ANFIS in the prediction of drying kinetics. Heliyon 2020, 6, e03555. [Google Scholar] [CrossRef]
  34. Chen, Z.; Zhou, Y.; Fan, Y.; Chen, Y.; Chen, Y. Study on drying technology of S. japonica extract. Food Sci. Technol. 2011, 36, 221–224. [Google Scholar]
  35. Xiao, M.; Zhu, Y.; Liu, H. Moisture diffusion from thin layer media during drying process. J. Huaqiao Univ. 2003, 2, 184–188. [Google Scholar]
  36. Xu, W.; Islam, M.N.; Cao, X.; Tian, J.; Zhu, G. Effect of relative humidity on drying characteristics of microwave assisted hot air drying and qualities of dried finger citron slices. LWT 2021, 137, 110413–110422. [Google Scholar] [CrossRef]
  37. Namkanisorn, A.; Murathathunyaluk, S. Sustainable drying of galangal through combination of low relative humidity, temperature and air velocity. Energy Rep. 2020, 6, 748–753. [Google Scholar] [CrossRef]
  38. Singhanat, P.; Supawinee, S. Effect of two stage, tray and heat pump assisted-dehumidified drying on drying characteristics and qualities of dried ginger. Food Bioprod. Processing 2011, 89, 429–437. [Google Scholar]
  39. Hao, W.; Zhang, H.; Liu, S.; Mi, B.; Lai, Y. Mathematical modeling and performance analysis of direct expansion heat pump assisted solar drying system. Renew. Energy 2021, 165, 77–87. [Google Scholar] [CrossRef]
  40. Maroulis, Z.B.; Saravacos, G.D.; Panagiotou, N.M.; Krokida, M.K. Moisture diffusivity data compilation for foodstuffs: Effect of material moisture content and temperature. Int. J. Food Prop. 2001, 4, 225–237. [Google Scholar] [CrossRef]
  41. Costa, C.F.; Corrêa, P.C.; Vanegas, J.D.B.; Baptestini, F.M.; Campos, R.C.; Fernandes, L.S. Mathematical modeling and determination of thermodynamic properties of jabuticaba peel during the drying process. Rev. Bras. Eng. Agrícola Ambient. 2016, 20, 576–580. [Google Scholar] [CrossRef] [Green Version]
  42. Corrêa, P.C.; Oliveira, G.H.H.; Botelho, F.M.; Goneli, A.L.D.; Carvalho, F.M. Mathematical modeling and determination of thermodynamic properties of coffee (Coffea arabica L.) during the drying process. Rev. Ceres 2010, 57, 595–601. [Google Scholar] [CrossRef]
Figure 1. Schematic diagram of the heat pump drier and the geometric arrangement of kelp slices.
Processes 10 00514 g001
Figure 2. Drying curves of kelp under different drying temperatures and thicknesses.
Processes 10 00514 g002aProcesses 10 00514 g002b
Figure 3. Drying curves of kelp under different drying air velocities and thicknesses.
Processes 10 00514 g003
Figure 4. Drying curves of kelp under different drying humidity levels and thicknesses.
Processes 10 00514 g004
Figure 5. Drying time of kelp with different thicknesses under different drying conditions (T: temperature; V: air velocity; H: humidity; *: extremum value).
Processes 10 00514 g005
Figure 6. Residual plot distributions of (a) Page model, (b) Henderson-Pabis model for all groups.
Processes 10 00514 g006
Figure 7. Page model validation.
Processes 10 00514 g007
Table 1. The thickness and moisture content of different parts of kelp.
SpecimenTop PartMain PartTail Part
Thickness (mm)3.5–4.22.0–3.50.8–2.0
Moisture content (%)94.595.792.4
Table 2. Arrangement of heat pump drying of kelp.
Group Temperature (°C)Air Velocity (m/s)Humidity (%)Thickness (mm)
1200.8400.8–2.0(A)
2.0–3.5(B)
3.5–4.2(C)
2300.840
3400.840
4500.840
5400.340
6400.840
7401.340
8400.320
9400.330
10400.340
11400.350
Table 3. Mathematical model of kelp heat pump drying.
Model NameModel After LinearizationReference
Henderson–Pabis M R = A exp ( K t ) ln M R = ln A + K t [30]
Page model M R = exp ( K t n ) ln [ ln ( M R ) ] = ln K + n ln t [31]
Lewis model M R = exp ( K t ) ln M R = K t [32]
Note: MR is the water ratio; t is the drying time; K is the change rate constant; n is a shape parameter; A is an undetermined rate coefficient.
Table 4. Curve-fitting results under different drying conditions.
No. ln M R t ln [ ln ( M R ) ] ln t
lnAKR2lnKnR2
1A0.46720.20960.9479−4.283 2.381 0.966
1B0.46620.13130.8826 −6.137 2.618 0.945
1C0.43530.10610.8749 −5.711 2.209 0.964
2A0.41240.24870.9837 −2.591 1.646 0.977
2B0.54700.18670.8537−5.378 2.648 0.959
2C0.42140.16470.9128 −4.433 1.983 0.994
3A0.39280.26350.9857−2.170 1.503 0.993
3B0.55830.23530.8132 −4.797 2.790 0.958
3C0.47500.19340.8849−3.991 2.085 0.987
4A0.67500.41390.8849 −2.941 2.484 0.995
4B0.85620.26140.7441−5.176 3.110 0.948
4C0.59980.31120.8842−3.704 2.476 0.978
5A0.48330.22520.9334−3.666 2.059 0.989
5B0.40790.11110.8973−5.658 2.295 0.956
5C0.47400.14180.9288-5.399 2.350 0.989
6A0.39280.26350.9857−2.170 1.503 0.993
6B0.55830.23530.8132−4.797 2.790 0.958
6C0.47500.19340.8849−3.991 2.085 0.987
7A0.68240.41350.9216−2.330 1.894 0.984
7B0.62040.30230.6865−5.104 3.380 0.921
7C0.60770.29370.8461−4.185 2.664 0.967
8A0.43150.28500.977−2.112 1.475 0.999
8B0.57190.19790.6182−5.849 2.849 0.885
8C0.52680.19780.8614−4.658 2.356 0.984
9A0.33390.22300.985−2.219 1.381 0.989
9B0.51920.15430.7807−5.993 2.653 0.955
9C0.48180.17100.8853−5.105 2.461 0.984
10A0.48330.22520.9334−3.666 2.059 0.989
10B0.40790.11110.8973−5.658 2.295 0.956
10C0.47400.14180.9288−5.399 2.350 0.989
11A0.41760.18080.9366−3.964 2.043 0.995
11B0.34400.08730.8544−5.787 2.187 0.986
11C0.38650.09850.7726−5.428 2.084 0.976
Table 5. Effective moisture diffusivity under different drying conditions.
No.Linear Regression Fitting FormulaDeff
(10−11 m2·s−1)
R2No.Linear Regression Fitting FormulaDeff
(10−11 m2·s−1)
R2
1A ln M R = 5.822 × 10 5 t + 0.4672 1.15740.94797A ln M R = 1.148 × 10 4 t + 0.6824 2.28330.9216
1B ln M R = 3.647 × 10 5 t + 0.4662 2.79750.88267B ln M R = 8.397 × 10 5 t + 0.6204 6.44080.6865
1C ln M R = 2.947 × 10 5 t + 0.4353 4.43070.87497C ln M R = 8.158 × 10 5 t + 0.6077 12.26490.8461
2A ln M R = 6.908 × 10 5 t + 0.4124 1.37330.98378A ln M R = 7.916 × 10 5 t + 0.4315 1.57380.977
2B ln M R = 5.186 × 10 5 t + 0.547 3.97780.85378B ln M R = 5.497 × 10 5 t + 0.5719 4.21650.6182
2C ln M R = 4.575 × 10 5 t + 0.4214 6.87790.91288C ln M R = 5.494 × 10 5 t + 0.5268 8.26010.8614
3A ln M R = 7.319 × 10 5 t + 0.3928 1.45500.98579A   ln M R = 6.194 × 10 5 t + 0.3339 1.23140.985
3B ln M R = 6.536 × 10 5 t + 0.5583 5.01330.81329B ln M R = 4.286 × 10 5 t + 0.5192 3.28750.7807
3C ln M R = 5.972 × 10 5 t + 0.4750 8.07640.88499C ln M R = 4.75 × 10 5 t + 0.4818 7.14090.8853
4A ln M R = 1.149 × 10 4 t + 0.675 2.28550.844910A ln M R = 6.255 × 10 5 t + 0.4833 1.24350.9334
4B ln M R = 7.261 × 10 5 t + 0.5862 5.56940.744110B ln M R = 3.086 × 10 5 t + 0.4079 2.36710.8973
4C ln M R = 8.644 × 10 5 t + 0.5998 12.99570.884210C ln M R = 3.938 × 10 5 t + 0.4740 5.92160.9288
5A ln M R = 6.255 × 10 5 t + 0.4833 1.24350.933411A ln M R = 5.022 × 10 5 t + 0.4176 0.99840.9366
5B ln M R = 3.086 × 10 5 t + 0.4079 2.36710.897311B ln M R = 2.425 × 10 5 t + 0.3440 1.86000.8544
5C ln M R = 3.938 × 10 5 t + 0.4740 5.92160.928811C ln M R = 2.736 × 10 5 t + 0.3865 4.11340.7726
6A ln M R = 7.319 × 10 5 t + 0.3928 1.45500.9857
6B ln M R = 6.536 × 10 5 t + 0.5583 5.01330.8132
6C ln M R = 5.372 × 10 5 t + 0.4750 8.07640.8849
Table 6. Thermodynamic parameters of kelp with different thicknesses.
ThicknessDrying
Conditions
Ea (kJ/mol)ΔH (kJ/mol)ΔS (J/mol·K)ΔG (kJ/mol)
0.8–2.0 mm20 °C16.3813.94−398.26130.69
30 °C13.86−398.96134.8
40 °C13.78−400.47139.18
50 °C13.69−398.6142.5
0.3 m/s13.78−401.78139.59
0.8 m/s13.78−400.47139.18
1.3 m/s13.78−396.72138.01
20%13.78−399.82138.98
30%13.78−401.86139.62
40%13.78−401.78139.59
50%13.78−403.6140.16
2.0–3.5 mm20 °C18.2115.77−384.68128.54
30 °C15.69−384.08132.12
40 °C15.61−384.34135.96
50 °C15.52−385.53140.11
0.3 m/s15.61−390.58137.92
0.8 m/s15.61−384.34135.96
1.3 m/s15.61−382.26135.31
20%15.61−385.78136.41
30%15.61−387.85137.06
40%15.61−390.58137.92
50%15.61−392.58138.54
3.5–4.2 mm20 °C26.6624.22−352.03127.42
30 °C24.14−351.65130.74
40 °C24.06−353.39134.72
50 °C23.97−352.33137.83
0.3 m/s24.06−355.97135.53
0.8 m/s24.06−353.39134.72
1.3 m/s24.06−349.92133.63
20%24.06−353.21134.66
30%24.06−354.42135.04
40%24.06−355.97135.53
50%24.06−359136.48
Publisher’s Note: MDPI stays neutral with regard to jurisdictional claims in published maps and institutional affiliations.

