Review

Modern Sensor Tools and Techniques for Monitoring, Controlling, and Improving Cell Culture Processes

1
Department of Chemical Engineering, Polytechnique Montreal, Montreal, QC H3T 1J4, Canada
2
Human Health Therapeutics Research Center, National Research Council of Canada, Montreal, QC H4P 2R2, Canada
3
Department of Biochemistry and Molecular Medicine, University of Montreal, Montreal, QC H3T 1J4, Canada
*
Author to whom correspondence should be addressed.
Processes 2022, 10(2), 189; https://doi.org/10.3390/pr10020189
Submission received: 12 November 2021 / Revised: 10 January 2022 / Accepted: 11 January 2022 / Published: 18 January 2022

Abstract

:
The growing biopharmaceutical industry has reached a level of maturity that allows for the monitoring of numerous key variables for both process characterization and outcome predictions. Sensors were historically used in order to maintain an optimal environment within the reactor to optimize process performance. However, technological innovation has pushed towards on-line in situ continuous monitoring of quality attributes that could previously only be estimated off-line. These new sensing technologies when coupled with software models have shown promise for unique fingerprinting, smart process control, outcome improvement, and prediction. All this can be done without requiring invasive sampling or intervention on the system. In this paper, the state-of-the-art sensing technologies and their applications in the context of cell culture monitoring are reviewed with emphasis on the coming push towards industry 4.0 and smart manufacturing within the biopharmaceutical sector. Additionally, perspectives as to how this can be leveraged to improve both understanding and outcomes of cell culture processes are discussed.

1. Introduction

The global biotechnology market was valued at 752 million USD in 2020 with a significant portion of the market size belonging to the biopharmaceutical industry [1,2]. This key sector is expected to be valued at 526 million USD by 2025 [3], with a compounded annual growth rate of 13.8% [3]. The relevant value-added products include monoclonal antibodies, interferons, hormones, growth and coagulation factors, vaccines, and others. Monoclonal antibodies have dominated the global biopharmaceuticals market, due to their use in the treatment of chronic diseases, such as cancer [3]. An increase in R&D with respect to oncology drug development is also expected to increase the growth of monoclonal antibody production and market size [3]. It is important to note that as the biopharmaceutical industry matures, older patents of approved biologics expire. Thus, non-brand companies can begin to manufacture generic versions of the biotherapeutic. Within the biopharmaceutical industry, these non-brand drugs are called biosimilars and are analogous to generic drugs in the pharmaceutical industry [4,5]. This market is expected to grow at high compounded annual growth rates (24–34%) by 2025 [4,5]. Importantly, the COVID-19 pandemic has acted as a catalyst for biopharmaceutical growth given that numerous biological compounds have been produced with the purpose of tackling the virus and reducing its strain on healthcare systems. This includes the development of monoclonal antibody treatments and novel vaccine platforms [6,7]. Biopharmaceutical production needs large manufacturing capacities that must be designed with cost and time efficiency in mind because antibody therapies require long periods of time to be effective [6]. Mammalian cells, which are employed in the manufacturing of antibodies, have historically been associated with low yield and manufacturing complexity since the cells are shear sensitive and require specialized media additives to be able to grow properly [6]. However, recent advances in process optimization and cell line engineering have allowed antibody production to generate high yields of up to 10–20 g/L in fed-batch mode [6]. As a consequence of increased manufacturing capability, 570 therapeutic monoclonal antibodies (mAbs) have been approved for clinical trials by biopharma companies [7]. Of those tested, 79 mAbs have been approved by the Food and Drug Administration (FDA) for commercial use. A substantial majority of the approved mAbs are used in treatments of cancer and autoimmune disorders [7]. Considering that between 2008 and 2021, 48 of the currently approved 79 antibodies have been developed, it is possible to assert that increased understanding in mammalian cell platforms have allowed for such increase in antibody manufacturing capability. This is especially true bearing in mind that the first antibody approved for commercial use was murine IgG2a CD3 in 1986 [7].
To guide the biomanufacturing sector towards better production efficiencies while still ensuring maximum process safety within a timely manner, the Quality by Design (QbD) and Process Analytical Technologies (PAT) initiatives were established. Lot-to-lot variation indicated that the established processes were not as robust as imagined [8,9,10,11,12]. Since these inefficiencies also caused fewer products to be commercialized, drug manufacturing became more costly. Additionally, due to globalization, quality control guidelines became fragmented, making it difficult for pharmaceutical companies to meet all regulatory requirements [11]. Due to this regulatory difficulty, the FDA created an initiative, denominated current Good Manufacturing Practices (cGMP) for the 21st century [11]. This placed emphasis in a Quality by Design approach rather than relying on post quality control batch testing. QbD is a scientific, risk-based holistic approach that relies on defining and identifying the Critical Quality Attributes (CQA) of a product as well as defining an appropriate design space [11]. By designing and formulating production processes and product formulations around these CQA, the pharmaceutical company can continually monitor and update its manufacturing platform to assure consistent product quality [12]. These CQAs are generally defined thanks to in vitro and animal studies that help characterize the pharmaceutical compound. Once the CQA have been defined, developing a manufacturing process that will yield the desired product with the appropriate attributes is needed [12]. Because of this, the design space is developed early during each study. For example, during cell culture development, study ranges for temperature, pH, and feed timing are characterized [12]. With the help of design of experiments, characterization is done to evaluate the impact of multiple variables (Critical Process Parameters, CPPs) and how changes in these variables can affect the product quality or lack thereof. This allows the manufacturer to define the acceptable operating conditions in which the product maintains regulatory-approved quality [12]. However, it must be stated that a biopharmaceutical production platform deploys multiple steps that may be serial or parallel in nature. Because of this, the development of the design space must be evaluated in a big picture manner that takes into account various possible process conditions [8,9,10,11,12].
Since characterizing the design space and controlling the CQA are the fundamental pillars of QbD, Process Analytical Technologies have become important tools [12]. PAT analyze the CQA during various stages of biomanufacturing. These analyses are often conducted on-line to yield large amounts of data that can then be analyzed in order to make real-time adjustments to the process parameters [10,11,12]. Ideally, this would be employed at every stage of the manufacturing process, from the cell culture to the final purification and formulation steps [11,12]. Once the design space is established, the regulatory filing includes the acceptable ranges for the CQA. These parameters are then monitored to ensure that the process is performing within the specified design space [11,12]. This entails that an appropriately defined, expanded design space allows for a more flexible approach by regulatory agencies. Thus, process changes within the design space do not require additional regulatory filing and approval. This is in stark contrast to operating outside the design space where changes in the process or raw materials require formal filings and approval from regulatory agencies [12]. This flexibility is incredibly advantageous since process improvements can take place during the production cycle and, as such, the operating space can be revised within the design space without needing approval from regulators. In this way, a historically conservative industry is encouraged to innovate and improve its production platforms by adopting new technologies as they emerge to enhance process monitoring without additional regulatory burden. This concept can be visualized by Figure 1. Here, the knowledge space is a non-design space that requires regulatory approval before being ready for human use. The design space is the approval process by the FDA while the control space is the process configuration of the biomanufacturing process. Approval of a design space is key since it gives the manufacturer the flexibility of changing certain process parameters without additional regulatory requirements.
In this review, we first present an overview of biotherapeutic production modes. We then discuss why key metabolite accumulation and substrate consumption need to be routinely monitored to generate the appropriate environment within the bioreactors to maximize protein yield. The main technological tools used for bioprocess monitoring are then presented and we also describe recent advances on how data driven, mechanistic, or hybrid models can be used in tandem with technological tools to indirectly estimate additional parameters.

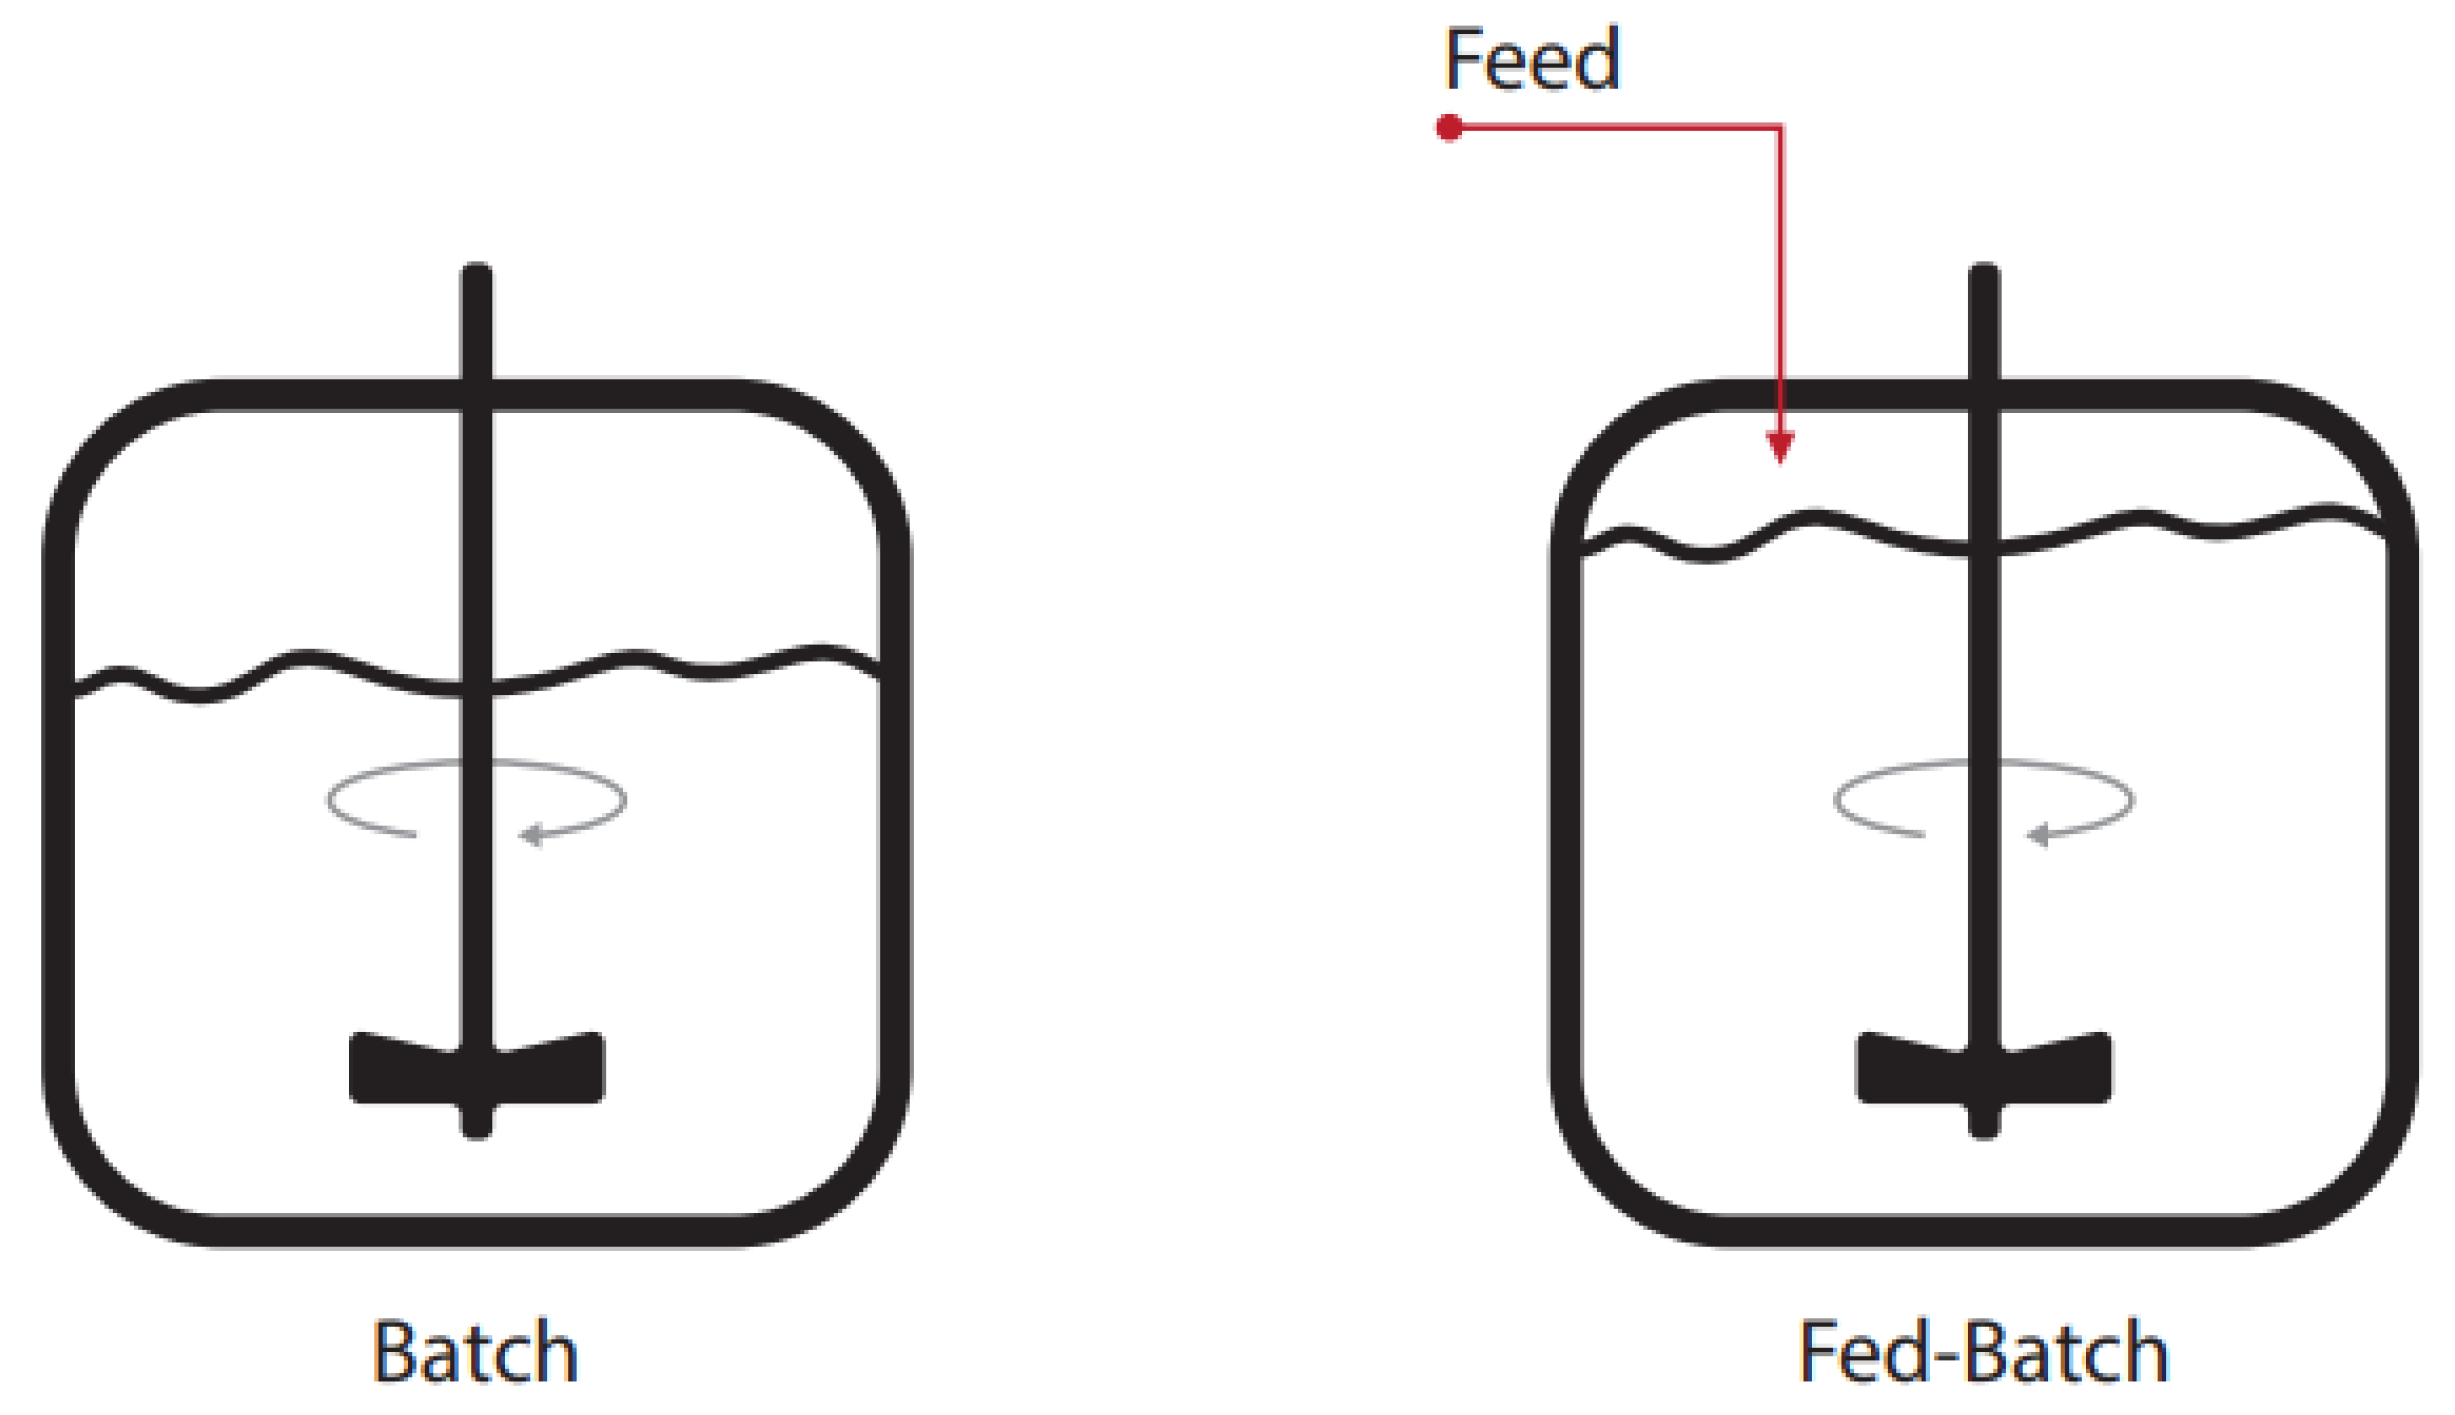
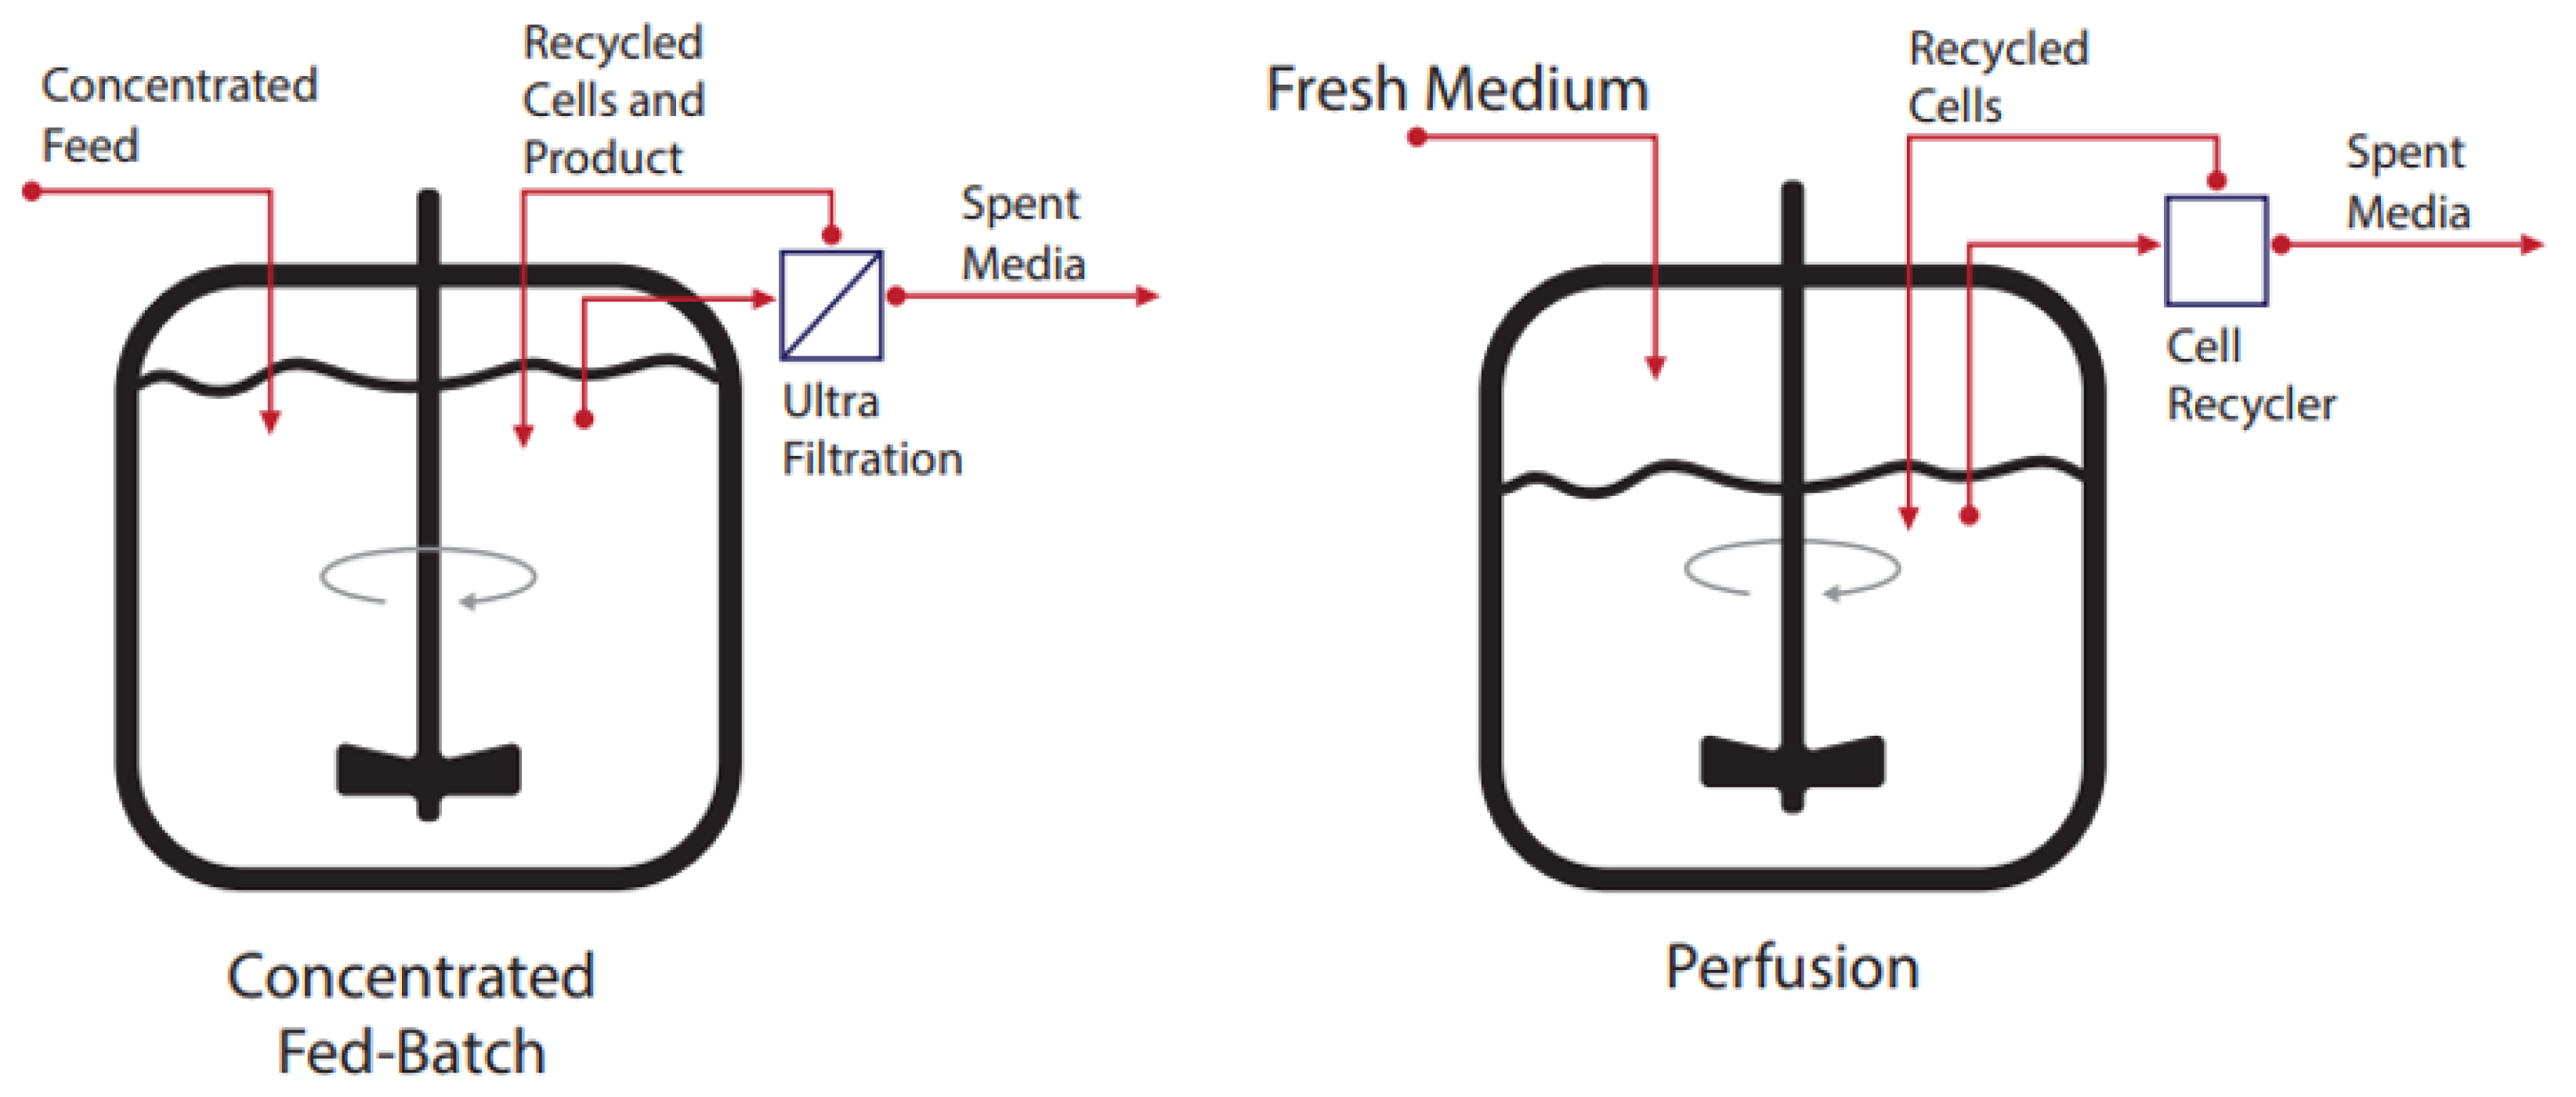
2. Bioreactor Modes of Operation

In the production of biologics, there are several types of cell culture modes such as batch, fed-batch, concentrated fed-batch, and continuous (perfusion or chemostat). Batch production refers to the culturing of cells within a vessel that are grown with an initial known concentration of feed source and medium [13,14]. No further nutrition addition or removal is performed on the system. As the biomass within the vessel grows, the initial feed source begins to be depleted while metabolic waste and product are accumulated in the medium [13]. Even though this form of cultivation has drawbacks, such as limiting the maximum cellular density that can be achieved and limiting the culture run time due to accumulation of metabolic waste, it is a relatively simple arrangement that does not require complex control loops in order to manage subsequent feeding or removal of waste [15]. In a fed-batch operation, nutrients are fed continuously or periodically (bolus) to the system to supplement reactor contents and control overall substrate concentrations [13,15,16,17,18,19]. Constant measurement of relevant metabolic products and feed source concentrations is needed to have knowledge of the relevant feed additives that are critical for the cell culture. This mode is widely used in the industry since it is excellent for the production of non-growth-associated products as well as providing a strong alternative to complex continuous feeding regimens [13,15,16,17,18,19]. Additionally, it is used to control substrate concentrations since high levels can be inhibitory or can cause shifts in the metabolic pathways [14]. It is important that space is allowed in the system to permit medium addition. Two main methods exist for fed-batch: the constant feeding strategy and the constant substrate concentration strategy [14]. With the constant substrate concentration strategy, a constant growth rate can be initially maintained and the number of cells in the bioreactor will, thus, increase exponentially as a function of time. However, it also means that the system must be supplied exponentially with substrates. Even with concentrated feed, this can cause significant volume changes in the systems. Because of this, maintaining the feed rate constant is used as a viable alternative even though the system rapidly may become substrate limited [14]. Practically, industry often uses periodic feeding (bolus) due to its simplicity and high efficiency [14,15,16,17]. The batch and fed-batch modes are depicted in Figure 2.
Given that the culture environment changes throughout the bioreactor run, because of cellular growth, substrate consumption and metabolite and product formation, continuous processes that replenish fresh nutrient medium while at the same time withdrawing the spent media from the system have been developed [14,15,18]. With these continuous processes, cell growth and product formation may be prolonged for longer periods, when compared to batch and fed-batch modes. For example, in a chemostat, the balance of feed addition and removal can be controlled so as to attain a steady state where nutrient, product, and cell concentrations are held constant [13,14,18]. An important characteristic of the chemostat is that a time-invariant growth environment is created and, thus, the net growth rate is equal to the dilution rate, which is determined by the flow rate into the vessel [14,18]. Consequently, the growth rate can be directly manipulated, making this a valuable tool to conduct kinetic studies. However, product dilution, resulting in large purification volumes, makes it generally unattractive for industrial biomanufacturing. In order to limit biomass loss in the outflow, cell recycling mechanisms can be employed [13,14,18]. The retention of cells can be achieved through the use of membranes, screens, or centrifuges. Perfusion systems have the advantage of removing toxic or inhibitory metabolic by-products that can be detrimental to either cellular growth or product formation [13,14,18]. Additionally, the protein of interest has a hydraulic residence time much shorter than the cells, reducing its exposition to varying culture conditions such as pH fluctuations or proteolytic enzymes. Cell concentrations in the range of 50–100 million cells/mL, which are comparatively much higher than batch or fed-batch modes, can be achieved [18]. Thus, high per unit volumetric productivity can be attained [14]. Importantly, given the continuous addition of nutrients and removal of toxic metabolic waste, perfusion cultures can maintain biomanufacturing operations for longer periods of time [13,14,18]. However, given the additional complexity of cell retention and recycling, as well as the constant addition of fresh medium, the increase in volumetric productivity may not be enough to merit the increase in operational costs and its implementation is largely dependent on the economic feasibility of the process [13,14]. It must also be noted that this mode of operation also adds burden on downstream processing given the large volumes of continuous fluids that must be handled. Recently, the concentrated fed-batch mode was developed; it is a hybrid system between perfusion and fed-batch [20]. Here, cell recycling is also used. However, an ultrafiltration module is employed and, thus, the protein product and the cells are recycled back into the reactor while still removing the spent media and waste by-products. Concentrated fed-batch systems can achieve high densities, above 100+ million cells/mL, and product yields of 25–30 g/L [20]. An important characteristic of this system is that the active protein of interest is retained within the reactor and, consequently, harvest day signifies the end of the fed-batch culture [20]. Because of this simplicity in harvesting and increases in both product yield and cell concentration, the concentrated fed-batch is being increasingly used within the biopharmaceutical industry, especially in companies that have well-established fed-batch facilities as it serves as a good nexus point to be able to begin implementing perfusion style manufacturing [20]. In Figure 3, a schematic of concentrated fed-batch and perfusion systems can be visualized. Such arrangements are the most prominent continuous systems in biomanufacturing.

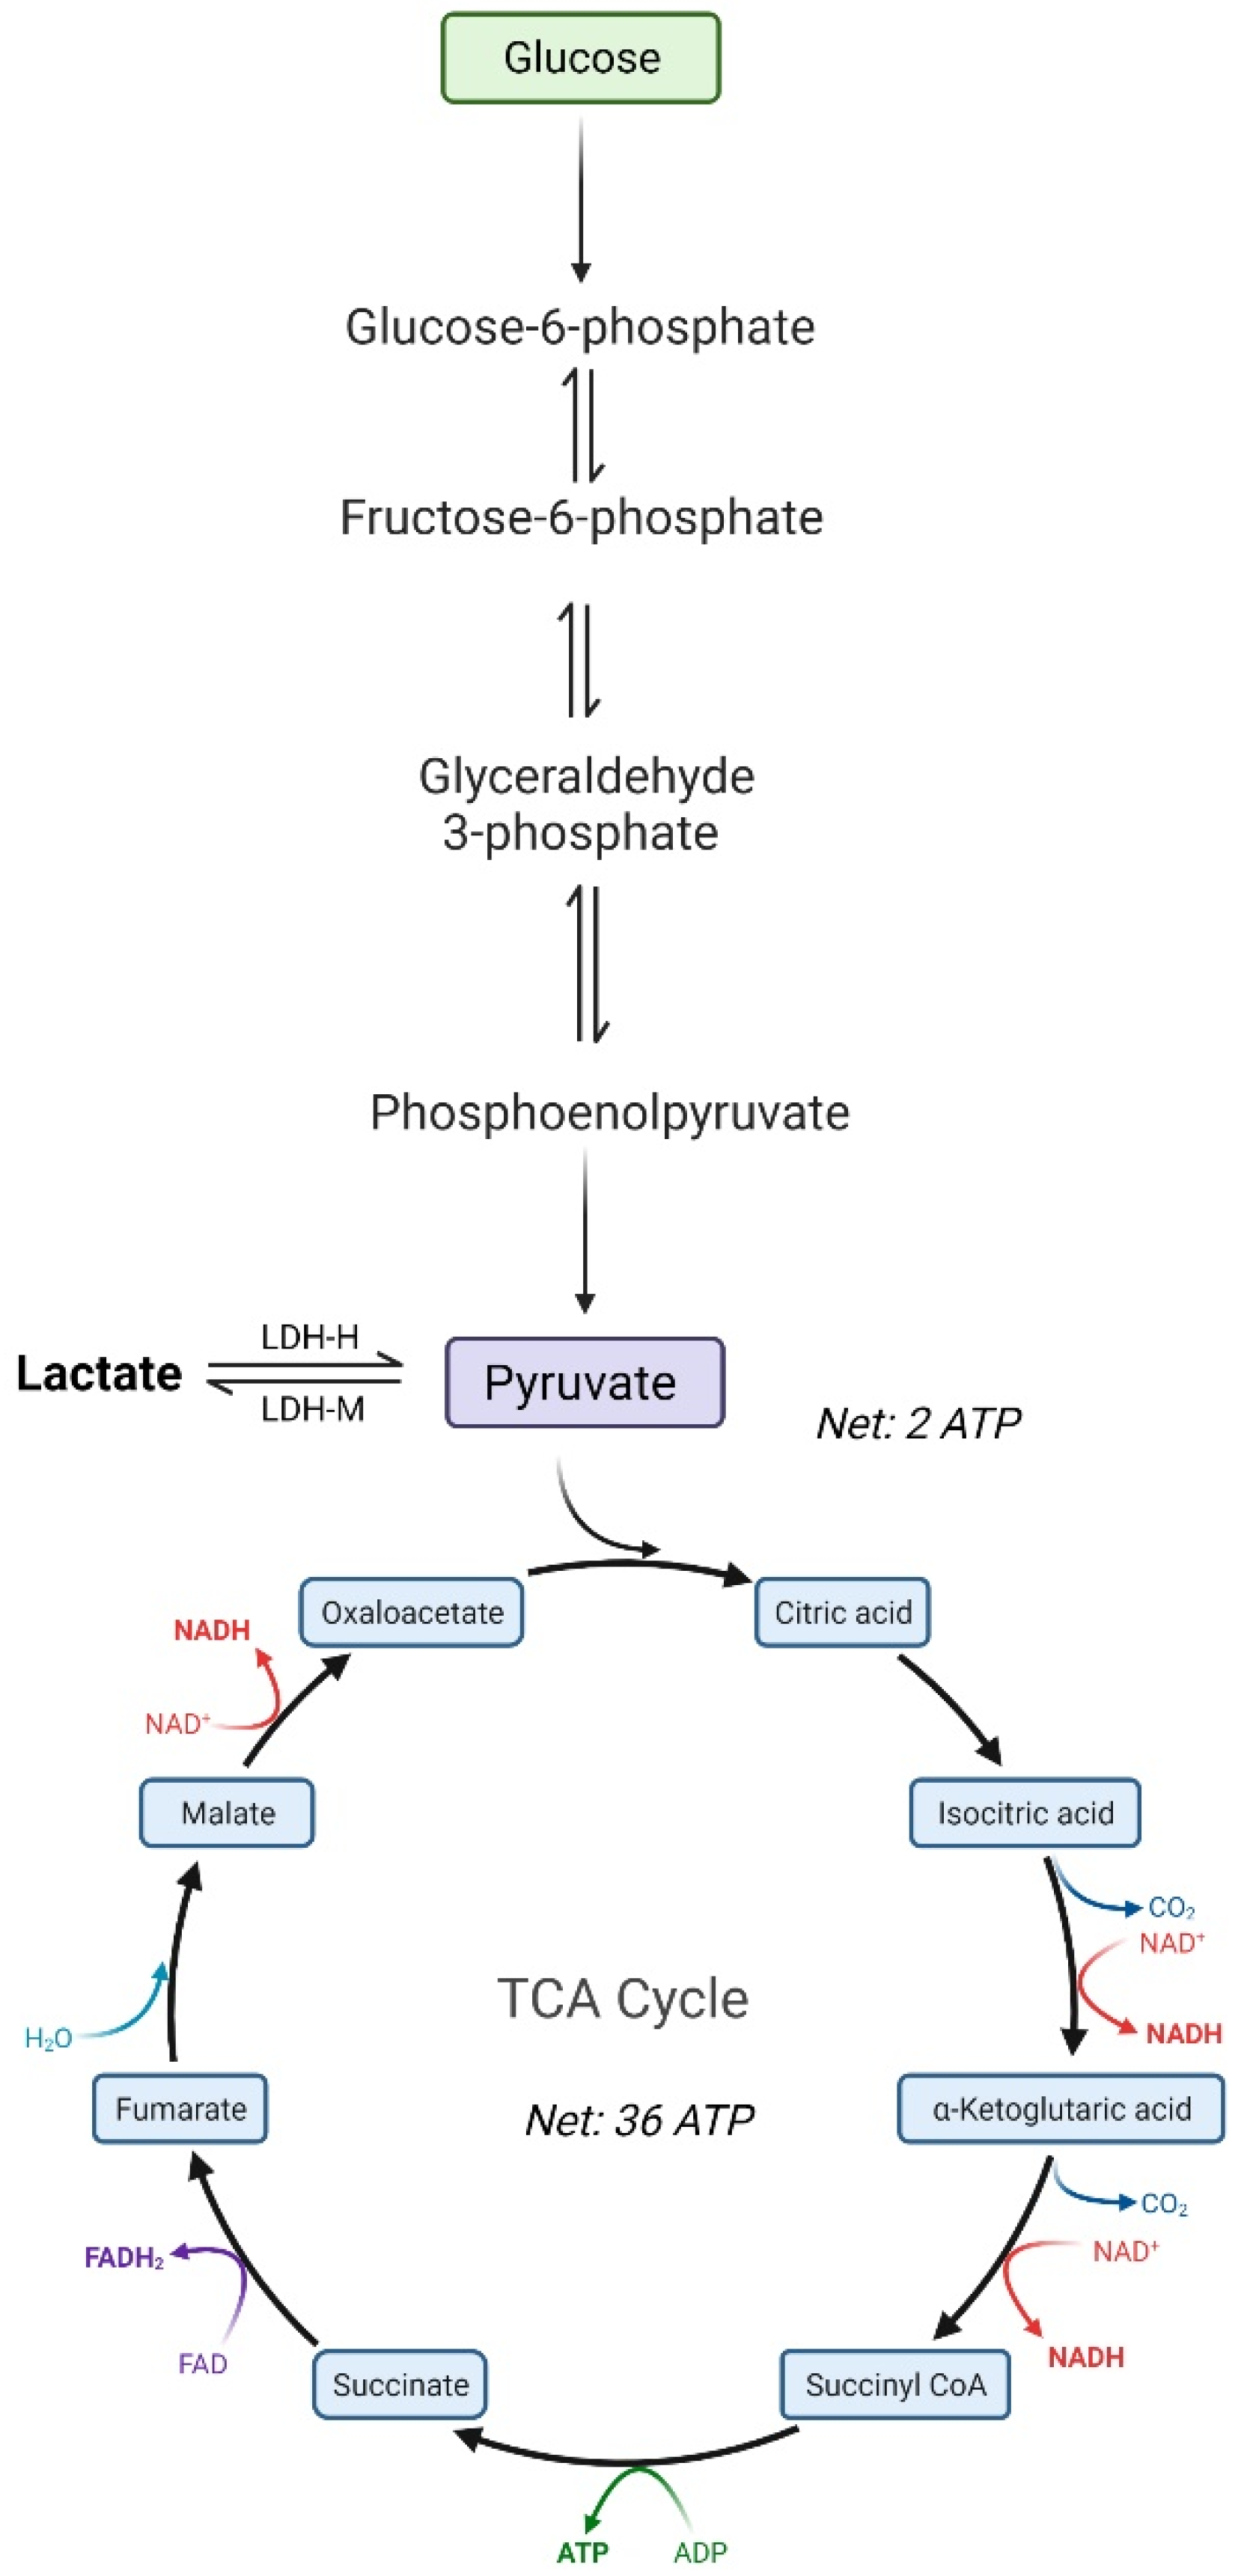
3. Mammalian Cell Metabolism in Culture

The metabolism of mammalian cells during biomanufacturing runs is known to vary depending on nutrient availability. Mammalian cells use substrates as carbon and nitrogen sources and their metabolism can be either mostly glycolytic or oxidative [21,22,23]. Through the glycolytic pathway, glucose is consumed at a high rate and only two adenosine triphosphate (ATP) are produced with lactate being generated as a by-product (Figure 4). Lactate is a key metabolite resulting from the conversion of pyruvate by the lactate dehydrogenase (LDH) enzyme even in the presence of oxygen. The conversion of pyruvate to lactate limits the full oxidation of glucose to carbon dioxide and water in aerobic conditions [21,22,23] and causes a carbon flux away from the tricarboxylic acid (TCA) cycle. The corresponding flux lessens energy production and instead allows the carbon backbones to be used for biomass formation. This is a phenomenon commonly observed in cancer cells and it is denominated the Warburg effect, aerobic glycolysis, or overflow metabolism [22,24,25]. In cancerous cells, the rate of glucose uptake in rapidly growing cells is generally many orders of magnitude larger when compared to cells that make up non-growing differentiated tissue [24]. Given that mammalian cells used in bioprocess are derived from immortalized cell lines, it is logical to see metabolic similitudes with cancerous cells.
The two ATPs formed by this glycolytic pathway are in stark contrast to the 36 ATPs that are generated through the oxidative pathway [21,22,23]. Given the low energy efficiency of the glycolytic pathway, mammalian cells in bioprocesses are also known to use oxidative phosphorylation for the production of ATP and, thus, for their energy requirements. In the TCA cycle, pyruvate, which is generated at the end of the glycolytic pathway, is used as the primary substrate. Amino acid catabolism is another substrate source for the TCA cycle, for example, glutamine is readily catabolized as a source of energy to form glutamate and ammonia [21,22,23]. Changes from the glycolytic pathway to oxidative pathway can vary throughout culture run and can even be controlled through mediating process conditions. For instance, cells grown in low-glucose environments are able to upregulate the oxidative pathway and, thus, maximize ATP synthesis [22].
The metabolism of cells during the production process is regarded as inefficient and suboptimal because the nutrients supplied in the media and/or feeds at given concentrations can lead to accumulation of toxic by-products, intermediates, and metabolites [21,22,23]. Substrates are not fully used for production of recombinant proteins or biomass. For instance, 35 to 70 % of the glucose consumed can be diverted into the formation of by-products [22]. This hints at the existence of metabolic bottlenecks in relevant pathways as well as inefficient flux distribution. These metabolic inefficiencies that lead to compound accumulation can cause decreases in cell growth and product titer, as well as alter the product glycosylation profile [21,22,23]. Lactate is one of the main toxic metabolites that is accumulated in cell culture processes [21,22,26,27]. It has been reported to inhibit cell growth and to induce apoptosis, as well as to reduce the productivity of recombinant protein production because of osmolality increase and changes in the pH [21]. Interestingly, within a Chinese Hamster Ovary (CHO) cell culture process, two distinct phases regarding lactate metabolism have been described: (1) lactate production at the start of the culture as a consequence of glucose uptake through the glycolytic pathway and (2) lactate consumption following rapid cell growth [21,22,26,27]. It is worth noting that concomitant consumption of glucose and lactate has also been observed [22]. There are two important LDH genes: LDHA and LDHB. The LDHB gene encodes the LDH-H protein while the LDHA gene encodes the LDH-M protein; together they make the important subunits of the LDH enzyme [21]. Given that the LDH enzyme is tetrameric, it can be found in five different isoforms, which differ in the ratio of the subunits (LDH-H and LDH-M). The LDH-M has a higher affinity for pyruvate; thus, isoenzymes with a majority of this subunit will catalyze the reaction of pyruvate to lactate [21]. Conversely, the LDH-H protein has a higher affinity for lactate and isoenzymes with the majority of this subunit catalyzing the reaction of lactate to pyruvate. A link has been established between lactate consumption and increased recombinant protein productivity [22,28]. The lactate consumption phase is observed in cells that are in a stationary phase of their growth. In this way, the consumption of lactate reduces its own accumulation and thus limits the negative effects on cell behavior [21,22,26,27]. It is thought that the lactate shift is originated by an upregulation, which causes lactate to be converted into pyruvate; the latter is then incorporated into either the TCA cycle or to monocarboxylate transporters (MCT) through which lactate can enter and exit the cell in co-transport with H+ ions [21].
Important metabolic intermediates that accumulate during the bioprocess include citrate, succinate, fumarate, and malate [22]. This particularly happens during oxidative metabolism and has been observed to occur after the addition of feed, which indicates the existences of bottlenecks [21,22,23]. Amino acids also play an important role in mammalian cell culture and are either supplied in the medium and feed or some can be produced through biosynthetic pathways by the cells. The amino acids support cell growth and are used for the synthesis of protein. Through the catabolism of amino acids, the formation of TCA cycle intermediates can be used to support energy production [21,22,23]. However, if the amino acids are supplied in excess, accumulation of the TCA cycle intermediates can lead to the formation of ammonium thanks to a series of transamination and deamination reactions that terminate in the release of an ammonium ion [22]. Ammonia is mainly formed as a result of glutamine breakdown, but other amino acids such as serine and threonine can also produce ammonia through direct deamination [22]. Accumulation of ammonia can negatively impact cell growth and recombinant protein productivity [27,29,30]. One hypothesis for this is that, as the ammonia concentration increases, it alters the electrochemical gradient and acidifies the intracellular compartments. Thus, normal enzymatic activity is impaired and apoptosis is induced [22,27,31]. Defined amino acid concentrations at different phases of the bioprocess have been correlated to cellular inhibition and apoptosis. Asparagine depletion has been determined to have a negative effect on cell growth while the production of alanine has been determined to inhibit the TCA cycle as well as contributing towards ammonium accumulation [32]. Alanine has been shown to accumulate during the first days of culture and then will either continue to build up or be consumed in a similar way as observed with lactate (our internal data not shown). Excess lysine has been observed to be associated with cell death. The catabolism of phenylalanine, tyrosine, tryptophan, methionine, leucine, serine, threonine, and glycine has been determined to produce intermediates that inhibit cellular growth [22,33,34]. The accumulation of intermediates is a direct consequence of non-optimally regulated pathways and, as a result, formulation of defined amino acid concentrations in the media and feed can improve cell growth and recombinant protein yields [22,34]. During the production phase, the metabolism is shifted towards the TCA cycle and, thus, the cells are subjected to higher levels of oxidative stress [22]. To counteract this, glutathione is biosynthesized de novo and interacts with reactive oxygen species, which in turn limits the toxic effect of the oxidative stress [22]. Glutathione has also been determined to function as a marker for productivity given that its presence indicates adequate recombinant protein production [35]. Recently, it has been determined that the accumulation of phenylalanine-tyrosine by-products, which are caused by secondary branching pathways when the key enzymes in the main catabolic pathway are under expressed, can also lead to growth inhibition [36].
Cellular respiration is another important component of metabolism given that oxygen requirements and carbon dioxide production are closely linked to cell growth. Thus, oxygen in the culture can be understood as a substrate while carbon dioxide can be conceptualized as a metabolic by-product. Oxygen must be monitored and routinely controlled as it is a crucial nutrient for aerobic mammalian cell survival. Additionally, it has been observed that dissolved oxygen can impact glycosylation profiles, which are key in determining the protein pharmacodynamics [37]. Very high dissolved oxygen (DO) levels can cause the formation of superoxides or peroxides, which have a detrimental effect on the cell membrane; thus, finding the optimal operating range for dissolved oxygen (DO) is instrumental [37]. Conversely, dissolved CO2 is also quickly becoming recognized as a critical process parameter (CPP) [38,39]. This is partially because high CO2 concentrations have been found to impact glycosylation profiles. Cell growth and protein productivity can also be significantly reduced if dissolved CO2 values exceed a certain threshold (68 mmHg at bench scale to 179 mmHg at pilot scale) [38]. This is thought to be due to detrimental effects on internal pH and cellular metabolism [38,39]. This effect can be counteracted with the addition of base into the medium to maintain a constant pH. However, this can generate its own set of problems as progressive increases in osmolality can also negatively impact cell culture performance [38,39]. It has been observed that at higher dissolved carbon dioxide concentrations, in insect cells cultures, reduced glutamine consumption occurs [40]. This is interesting because even though low glutamine consumption was observed, glucose consumption remained unchanged [40]. This could suggest that ammonia and lactate were probably produced from the metabolism of non-glutamine amino acids because the TCA cycle was not efficient [40]. Thus, dissolved carbon dioxide measurement can be used to directly correlate with other metabolic fluxes and consequently we can gain a deeper understanding of the cell culture process. Given that low pH by itself does not have the same impact on cell metabolism, CO2 is an important parameter to control on its own and not only in conjunction with pH. The latter is generally accomplished through double-sided pH control loops [40].

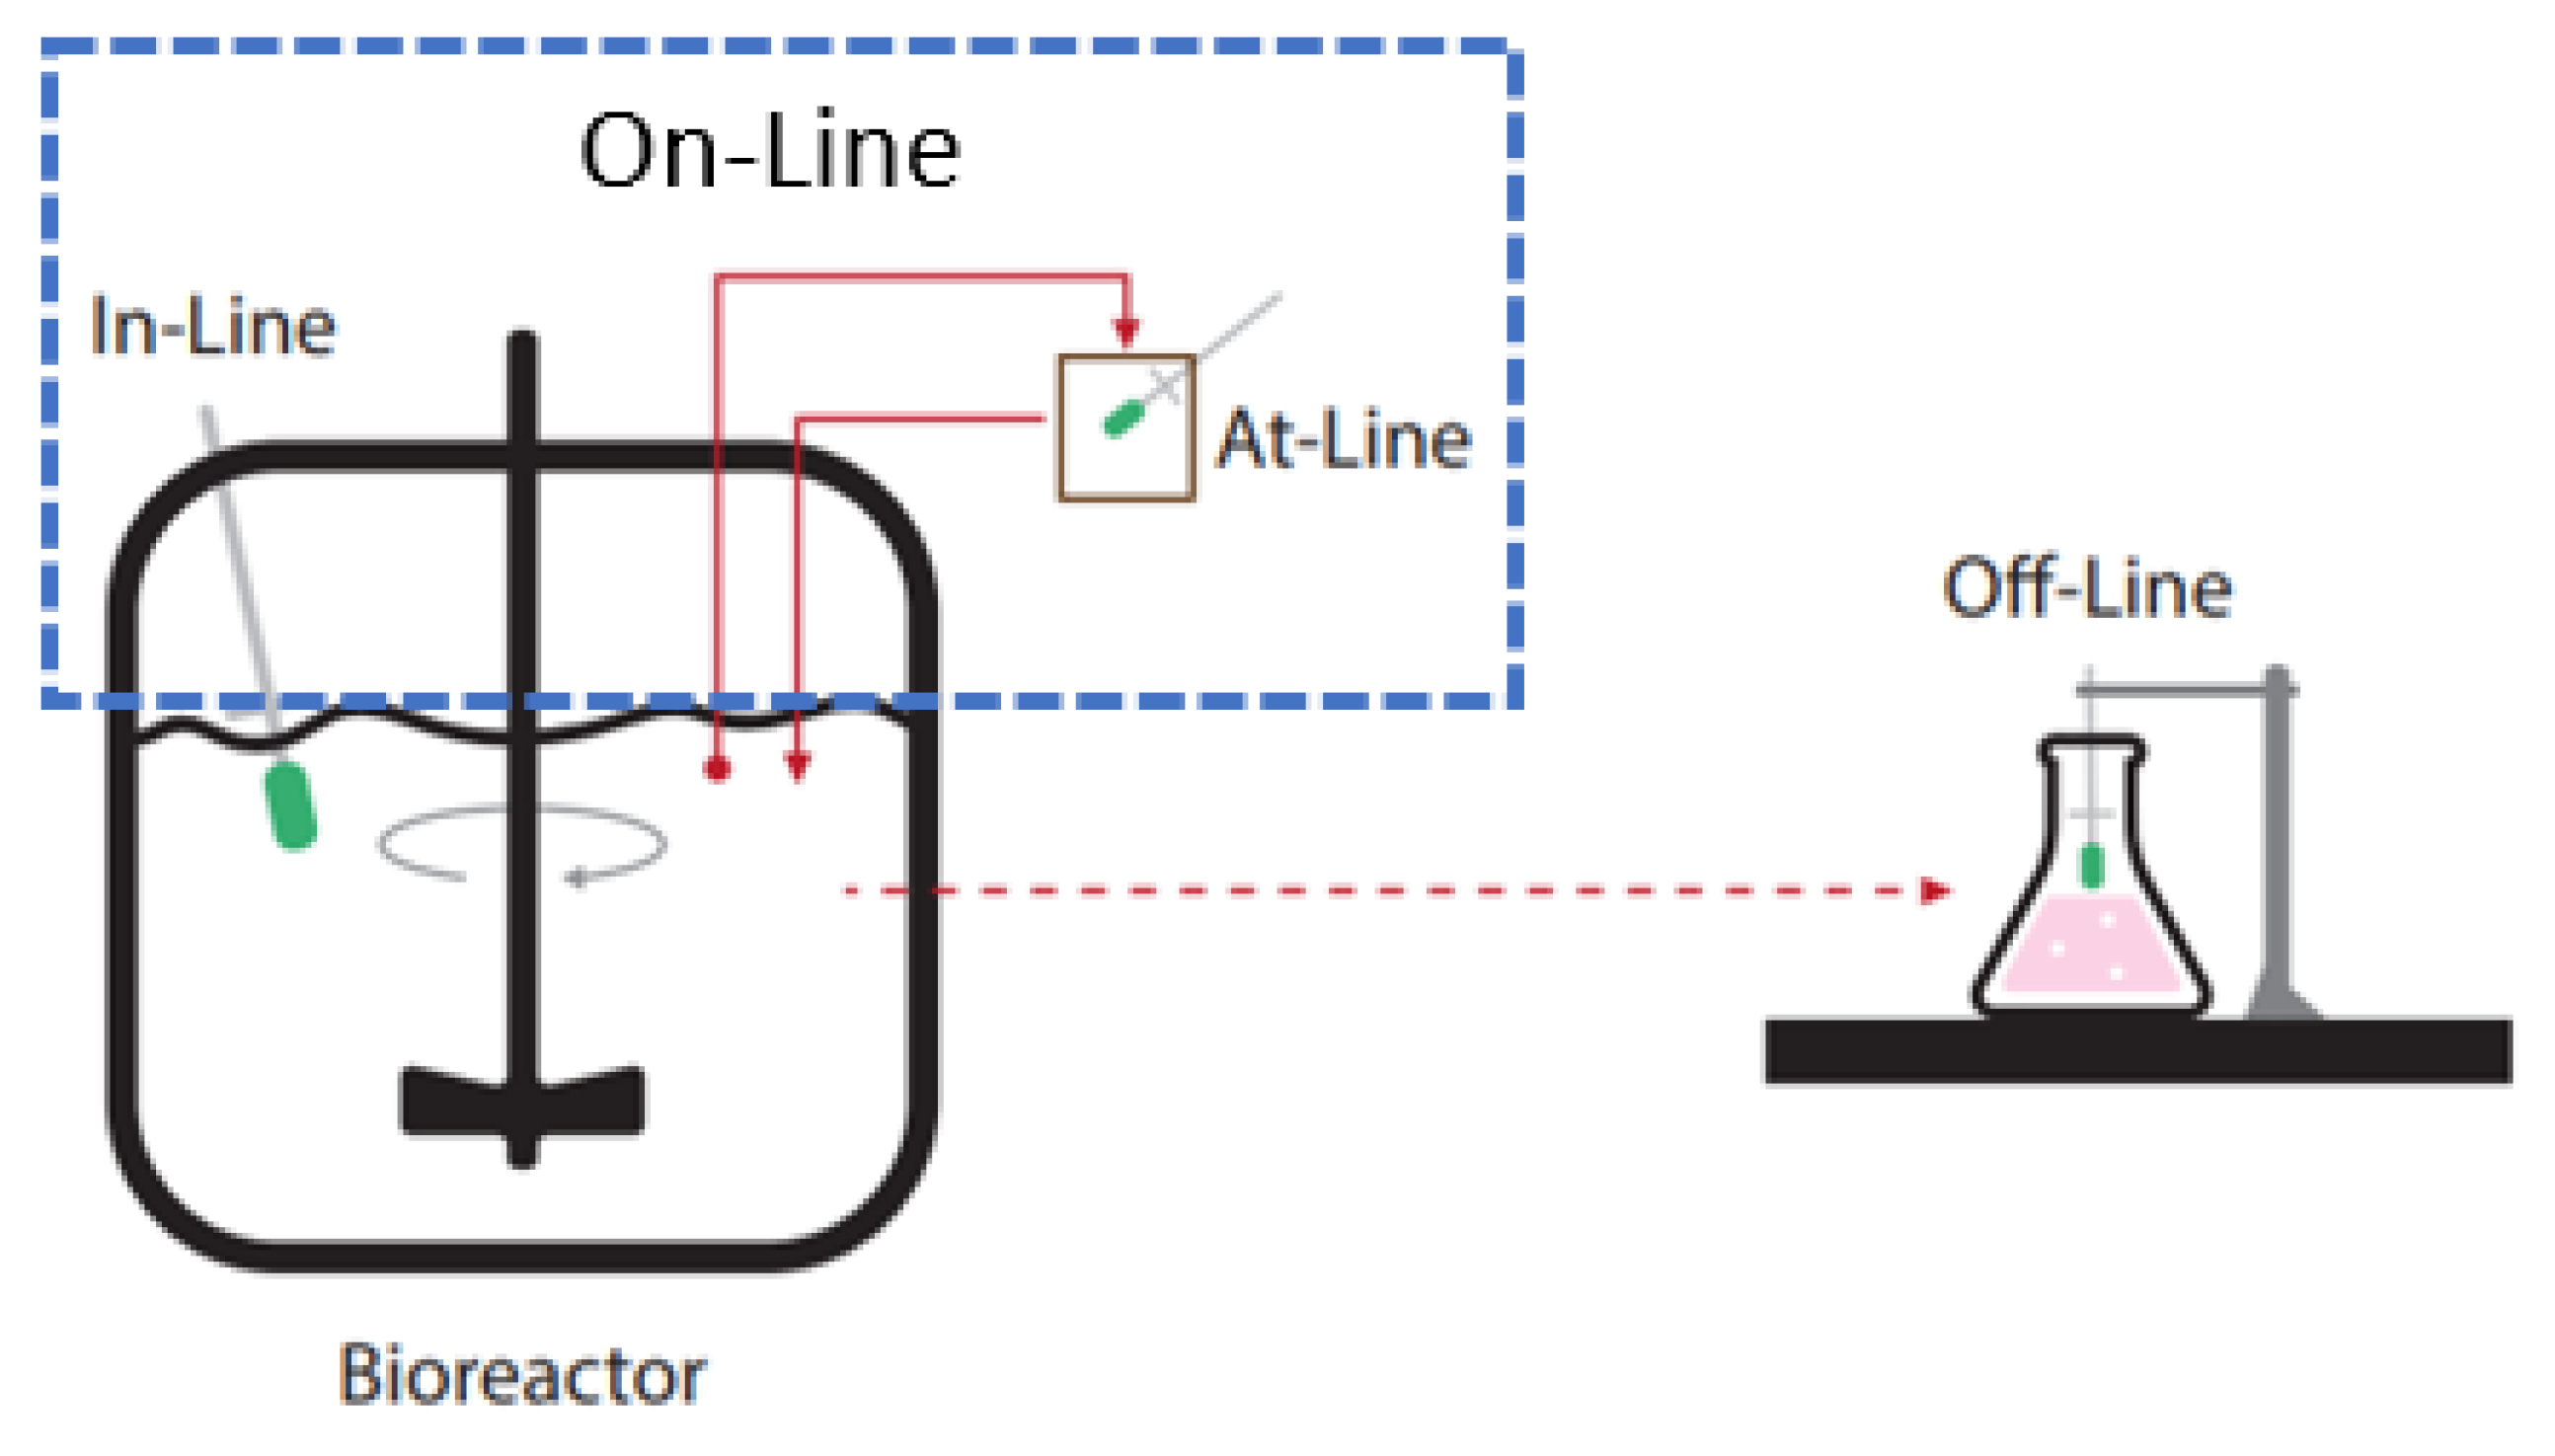
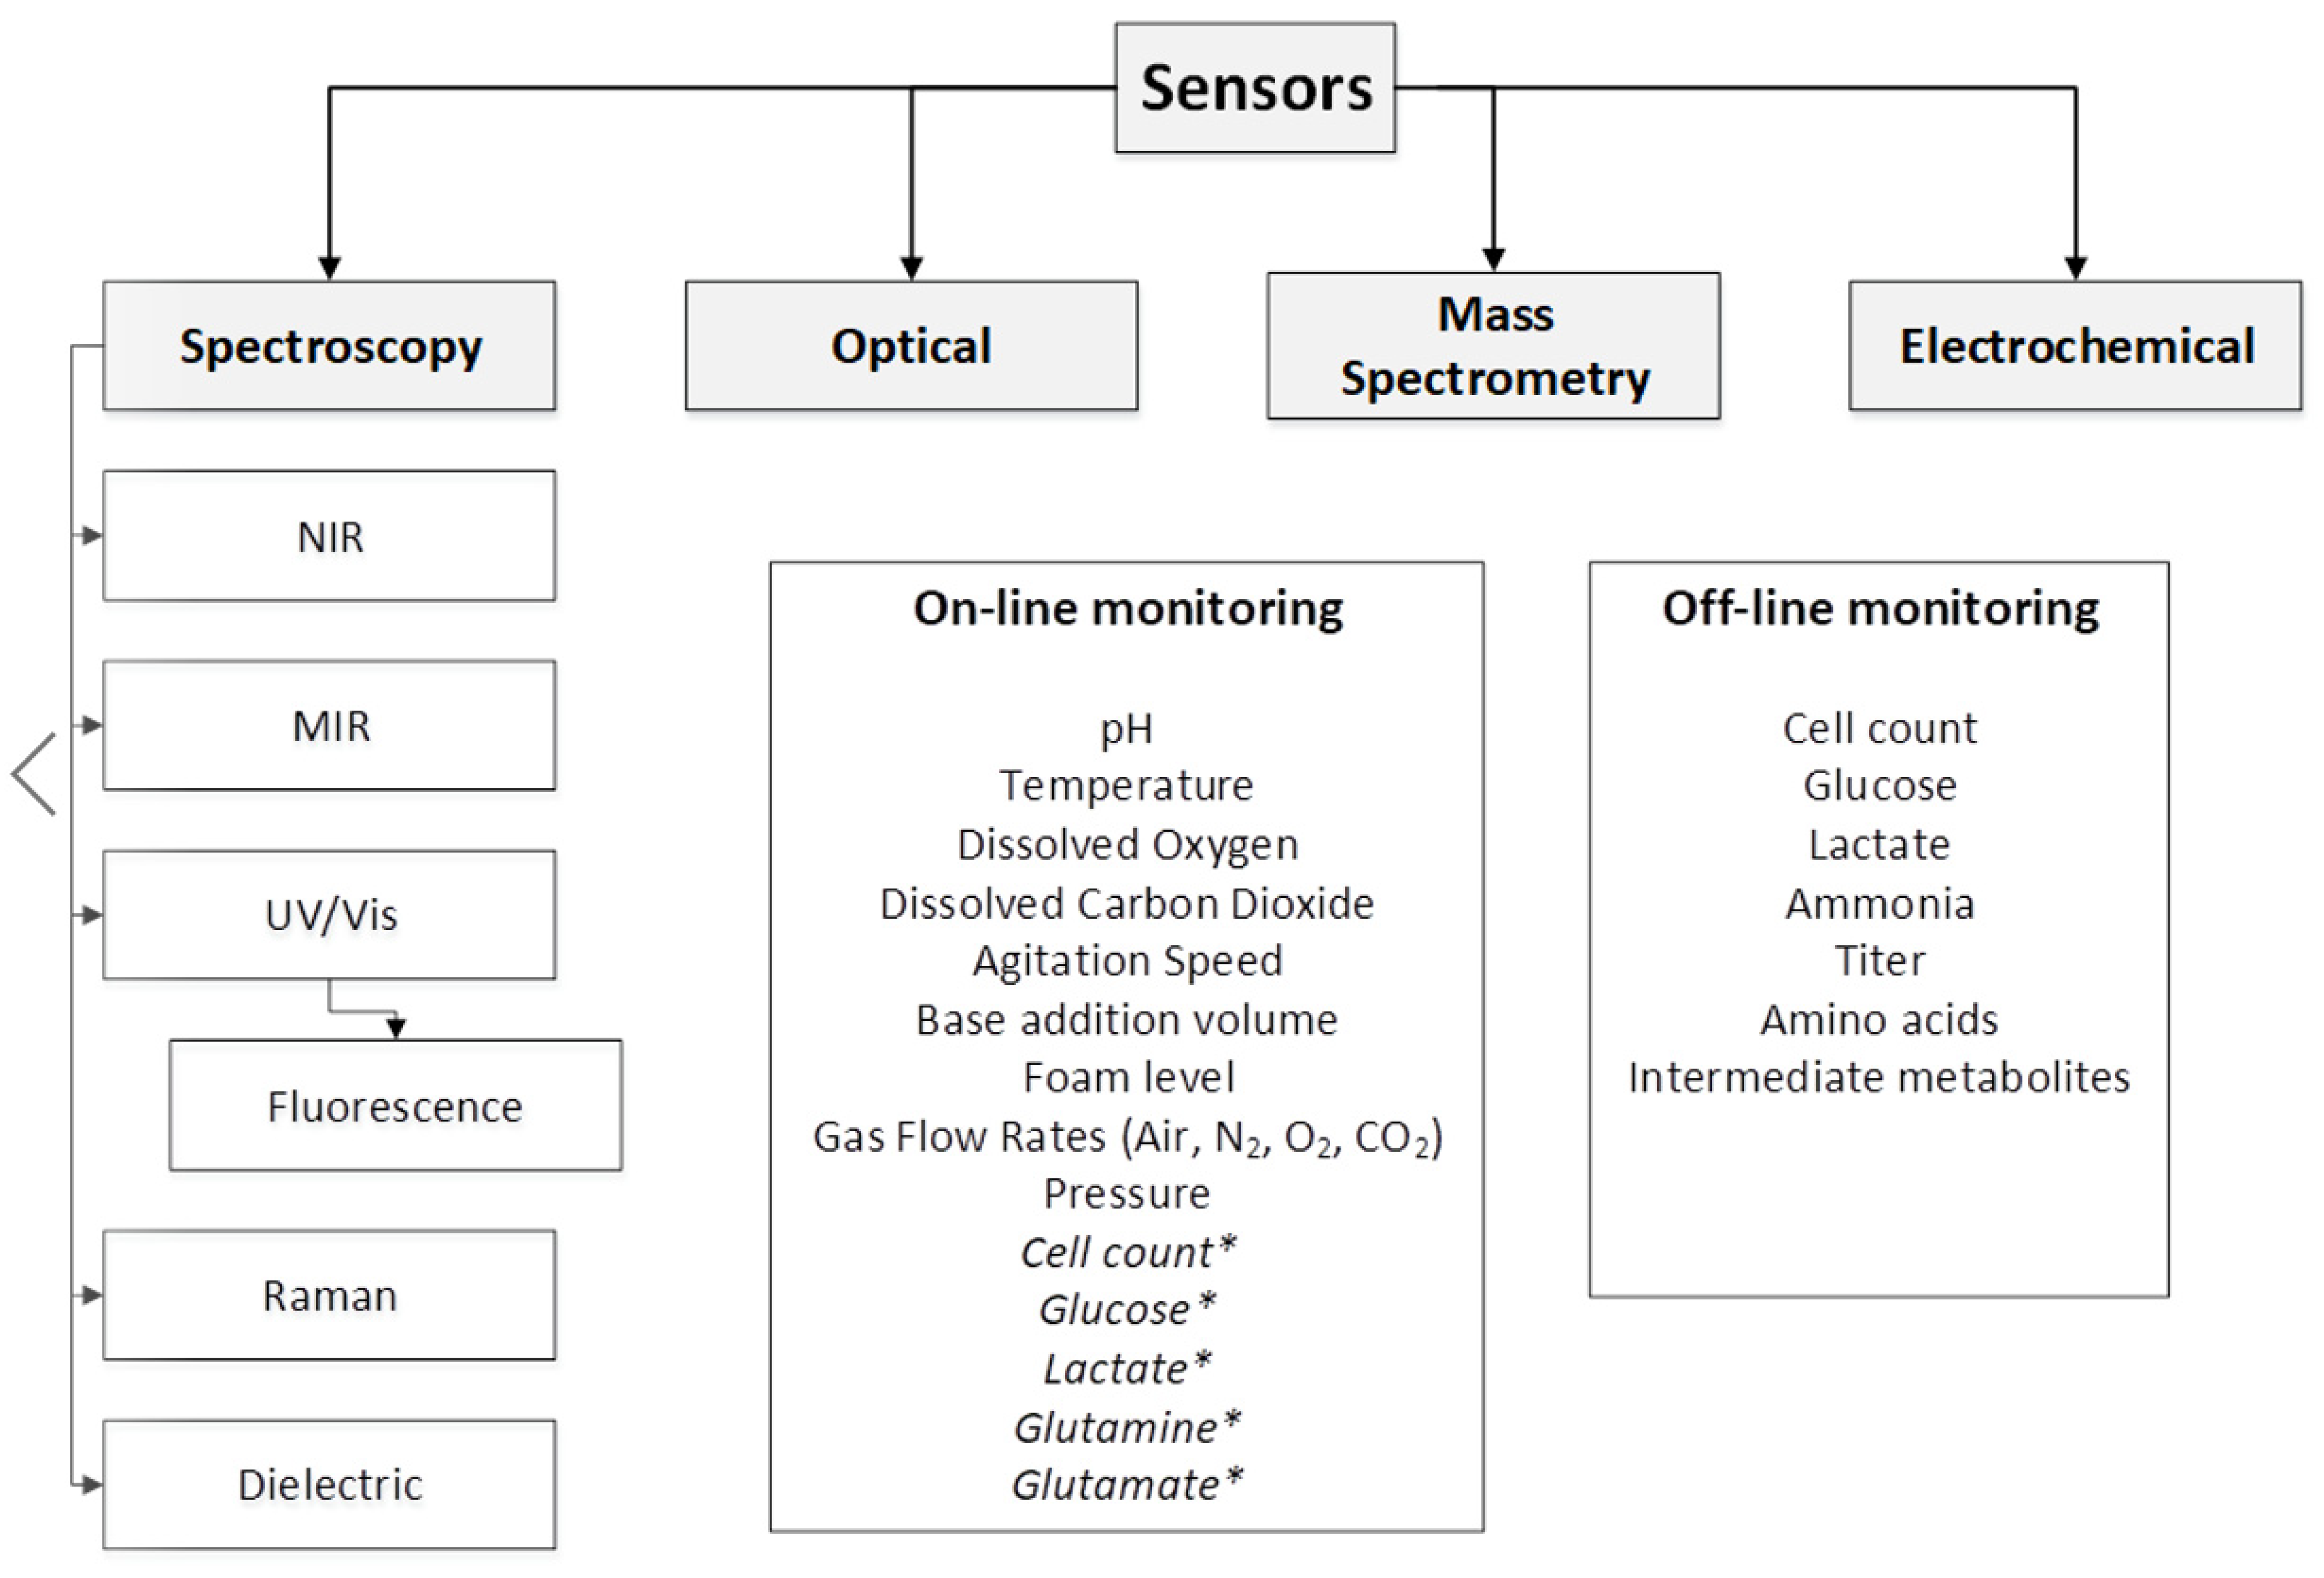
4. Sensor Types and Characteristics

Sensors are commonly used to control and measure the aforementioned relevant metabolic parameters as well as to control pertinent process variables (Table 1). They can be used to directly measure the main metabolites (e.g., lactate and ammonia), detect changes in substrate (e.g., glucose), or measure metabolism indirectly through cellular respiration by detecting changes in gas composition (e.g., oxygen and carbon dioxide). Through the continuous measurement of these parameters, feeding strategies, process conditions, and scale-up procedures can be rationally established. This is important for maintaining an optimal environment in which the cells can grow, and it can also be used as a way to construct dynamic feeding strategies (feed on-demand), which are automatically triggered after it is determined through the sensor measurements that important nutrients are becoming limiting. Broadly speaking, sensors in the upstream monitoring of the bioprocess require the measurement of three different types of variables: (1) Physical variables such as temperature, stir speed, and foam level; (2) Biological variables such as cell count, product concentration, and cell metabolism [41]; and (3) Chemical variables such as nutrient concentration, pH, dissolved oxygen, and dissolved carbon dioxide concentrations [41].
These sensors vary in application depending on how they are connected to the bioprocess (Figure 5). If they share a direct interface with the culture, they are denominated in-line sensors [41,42,43,44]. These sensors are also referred to as in situ sensors and do not require any type of manual or autonomous sampling. If the sensor module lies in close proximity to the production process and manual or automatic sampling is required to analyze the predetermined variables, then the sensors are denominated at-line [41,42,43,44]. If the data are analyzed in a continuous fashion, the sensors are determined to be on-line sensors [41]. The continuity of the measurement depends on the response time of the signal and the flow rate of the sampling procedures, which must be small when compared to the dynamics of the process. Thus, if the data points generated from the sensor occur at spaced-out time intervals, the sensor is determined to be quasi on-line [41]. Alternatively, if a sample is required to be taken off the system and analyzed in the laboratory after proper pre-treatments (e.g., dilution, filtration, or digestion), the employed sensor is determined to be off-line [44]. These sampling events, whether at-line or off-line, need to maintain rigorous sterility standards to prevent contamination and protect the cell culture [44]. Given that the isolated sterile bioreactor compartment has to be opened and a sample has to be withdrawn, cell-free sampling is usually assured by sterile barriers, such as microporous filters [44]. For the purpose of process control, on-line measurements are desirable given the fact that the data can be readily used in feedback control loops that regulate the process [41,42]. For the sensor to be considered on-line, the sensed variable must be measured more frequently than it can change in the process. In the case of mammalian cell culture, metabolic rates are slower when compared to microbial cultures. Thus, it is expected that substrate concentrations or metabolic by-products are subjected to low variations within a 1-h period. Consequently, a sensor capable of detecting metabolite concentrations every 30 min can be considered to be on-line because enough time is given to the system to gather and act on the received data through the established control loop [42].
These distinctions are important because, depending on the proximity of the sensor to the culture, varying degrees of sterility must be taken to protect the bioprocess as well as considerations as to the true representation of the data with respect to the bioprocess. For example, in-line sensors that are in direct contact with the bioprocess must be subjected to varying sterilization techniques. If steam heat sterilization is used, as in the case of glass or stainless steel vessels, the sensor must be resistant to high temperatures and varying pressures. Conversely, in the case of single-use reactors, gamma radiation is used and, thus, the sensor must remain in working condition after prolonged exposure [41,42,43,44]. Therefore, the sensor must be manufactured with the fore knowledge of the sterilization procedures that will be employed. Additionally, since the sensor forms an interface with the bioprocess, the sensor must be resistant to fouling and it should not interfere in any way with the medium components, the cells, or the product. Off-line or at-line sensors run the risk of not being completely representative of the process, given that a small volume is sampled [41,42,43,44]. Table 2 provides a list of critical characteristics that should guide sensor selection.
Figure 6 summarizes different sensor techniques available on the market together with various process parameters monitored online and offline.
Table 3 provides a summary of selected studies demonstrating the use of the various sensing techniques that can provide direct or indirect assessment of culture performance. Single-use sensors have seen strong use with the surge of single-use bioreactors (SUB). These sensors are sterilized together with the SUB by γ-radiation [48,49]. These single-use sensors can be of a wide variety, such as electrochemical pH sensors, ion selective field effect transistors (ISFETs), optical CO2, optical O2, optical pH, and chemo/biosensors [48,49]. The last type of single-use sensors are of interest given that they can be used for the detection of metabolite concentrations [48,49].
Another interesting development is that of free floating wireless sensors, which can measure temperature, conductivity, pH, pressure, and turbidity [49]. Since the sensor is floating in the cultivation broth, its movement follows the fluid flow, thus giving a true representation of the concentration within the bioreactor [49].
Because the on-line monitoring technologies can generate a data point every few seconds, a systematic methodology for storing and handling the large quantity of generated data is key. While developing custom-made IT infrastructure that can handle and store the data is feasible, plug-and-play platforms already exist. For example, SynTQ® from Optimal Industrial Automation, SIPAT® from Siemens, BioPAT SIMCA® from Sartorius, and Unscrambler Process Pulse II® from Camo are some of the most popular platforms in the market [106]. These platforms do not only allow for the handling of data from analytical instruments, they can also realize aspects of data preprocessing, multivariate data analysis, and visualization [106].

5. Spectroscopy-Based Techniques

Sensing devices that are not in direct contact with the bioprocess interface are regarded as non-invasive sensors. One important example is spectroscopic sensors. Such sensors rely on the interaction of electromagnetic waves and the analyte of interest [107,108]. The electromagnetic waves interact through absorption, emission, or scattering. The wavelength that can be employed exists within a wide range such as ultraviolet–visible (UV/Vis), near-infrared (NIR), mid-infrared (MIR), far-infrared (FIR), Raman, terahertz, and nuclear magnetic resonance (NMR) [107,108].

5.1. Applications of Near-Infrared (NIR) and Mid-Infrared (MIR) Spectroscopy Techniques

The two types of infrared spectroscopy are often used differently. MIR is more sensitive when compared to NIR and can detect functional groups of molecules. However, NIR devices are known to be more stable against interference and are cheaper to implement. The IR light is able to incite specific vibrational modes in different molecules [41,107,108,109,110]. As such, each organic or inorganic compound has its own unique spectral signal. Most excitation of unique molecular vibrations exists within the MIR range while vibration combinations and overtones exist within the NIR region [41,107,108,109,110]. Because of the higher energy of the near-infrared region, the spectra are less defined and, thus, spectrometers with high signal-to-noise ratios are required. Conversely, MIR spectroscopy has high absorption capacity and well-defined peaks. The greater resolution of MIR spectroscopy allows it to be employed in the detection of components in aqueous solutions at low concentrations and, thus, has been applied to measure glucose, lactate, fructose, ammonia, acetic acid, and antibodies in bioprocess [41,107,108,109,110]. Given the large complexity of data gathered through NIR and MIR spectroscopy, multivariate analysis (MVA) is often used. For qualitative variance analysis, principal component analysis (PCA) is commonly employed [109,111]. Alternatively, quantitative analysis requires a reference dataset to calibrate a model that can be used to correlate signals with relevant process variables. For this purpose, artificial neural networks (ANN), partial least squares regression (PLS), and multiple least squares regression (MLS) are often used to correlate the absorption of NIR/MIR data to the analytical data [109,111].
NIR spectroscopy can be used for in situ measurement of bioprocess with an optical probe; the ex situ approach can also be realized by using a flow-through cell, by employing a reflectance probe on the glass wall of the reactor or by utilizing fiber-optic cables that allow the sensor to be used within the reactor. Given the much less defined spectra in NIR spectroscopy, it is more used as a qualitative monitoring of the bioprocess [41,107,108,109,110]. Importantly, it has been applied in the monitoring of glucose, lactate, ammonium, and biomass [109]. NIR has been found to be able to monitor seven different parameters in parallel and on-line, including osmolality, glucose concentration, product titer, packed cell volume (PCV), integrated viable packed cell volume (ivPCV), viable cell density (VCD), and integrated viable cell density (iVCD), by using PCA and PLS in order to relate off-line measurements with the spectral data that were acquired on-line [50]. When comparing NIR to MIR, it has additionally been determined that, although MIR has a higher accuracy regarding the prediction of single analytes, NIR is better at predicting concentration of multiple analytes [51]. This is because absorption coefficients and absorption bands are much lower and wider (respectively) in NIRs than they are in MIRs. Thus, analyte concentrations for glucose and lactate can be detected with higher accuracy and in lower concentrations with MIRs. However, due to the low penetration depth in MIR spectroscopy, total cell concentration cannot be measured directly while NIR can employ light-scattering effects to measure cell density and cellular viability. It was also determined that ammonia, glutamate, and glutamine could not be adequately detected by NIR or MIR techniques. It was concluded that NIR spectrometers are inherently more robust and better suited for production processes when compared to MIR spectrometers because they have the added benefit of predicting cellular viability parameters as well as the concentration of single analytes [51]. Low-cost MIR probes have been applied in the monitoring of cell viability, lactate dehydrogenase, secreted antibodies, and lactate and glutamate concentrations in an at-line arrangement [54]. Glutamate could be predicted with high accuracy, but antibody concentration could only be achieved with good results at concentrations above 0.4 mg/L. Additionally, lactate dehydrogenase (LDH) activity could not be accurately predicted in low-activity regimes. Lactate prediction was determined to be deficient while viability could be determined with an error of 8.8% at ranges between 20 and 95% [54]. Another application where MIR is gaining increased interest relates to the monitoring of product quality and impurity. This is commonly done with spectral acquisition (Bruker Matrix MF®, Mettler Toledo ReactIR®) [106]. Furthermore, NIR has been applied in raw material characterization so as to generate a qualitative analysis of cell culture media components through spectral fingerprinting. This is particularly useful in terms of diminishing lot-to-lot variability [106].

5.2. Applications of Ultraviolet-Visible (UV/Vis) Spectroscopy

Ultraviolet-Visible spectroscopy is a sensitive method that employs ultraviolet and visible light with wavelengths in the range of 200–780 nm [107,111,112]. The absorbance of UV/Vis light is restricted to molecular function groups, known as chromophores, whose electrons are excited. Thus, unique absorption spectra can be obtained for molecules with chromophore groups and the correlation between light absorption, light path of the sample, and concentration of the absorbing molecules can be realized through the Beer–Lambert law. With the absorption measurement, the concentration of the analyte of interest can be determined. Differentiation of proteins through UV spectra is difficult and quantification is realized after purification procedures [107,111,112]. However, a method has been reported that is capable of selective protein quantification in protein mixtures, which would bypass the need for chromatography or electrophoresis as purification steps, by using PCA for cluster analysis and based on spectral similarity [56]. Mid-UV (200–300 nm) absorption spectroscopy is used for protein quantification. This range offers an advantage given that there is low impact of water vibration at these wavelengths. Within this range, peptide bonds and a few amino acid residues are responsible for the absorption. The aromatic structures of phenylalanine, tyrosine, and tryptophan contribute to the mid-UV absorption [107,111,112]. Cysteine residues and peptide bonds also absorb mid-UV light, mainly below 260 nm. However, high-energy molecules such as saturated hydrocarbons and sugars cannot be detected through UV-Vis spectroscopy. UV spectroscopy is also used for biomass concentration estimation as a function of turbidity in the sample [113]. These applications correlate linearly at the start of cell culture where cell density is low. Correlation is poor in later stages of cell culture when optical density cannot be used to differentiate between viable and dead cells [112,114]. ANN have been used along with UV spectroscopy to develop off-line monitoring of glutamine, glutamate, and viable cell concentrations on the basis of spectra monitoring [57].
Fluorescence spectroscopy exists within the UV-Vis range and it is another relevant tool for bioprocess monitoring, given that a lot of biological components within the culture media have fluorescence properties including amino acids, enzymes, cofactors, and vitamins [115]. When a fluorescent compound absorbs a photon, it is transferred to a higher energy state. As the energy of the molecule drops to a lower energy state, it emits a photon at a different frequency than the one that was used for excitation. Thus, by analyzing the range of frequencies of emitted photons from the original excitation frequency, an emission spectrum can be developed. Historically, in situ fluorescence sensors were based on a single wavelength pair, thus limiting analysis to a single fluorophore [107,108]. Nicotinamide adenine dinucleotide (NAD) and nicotinamide adenine dinucleotide phosphate (NADP) are the most used fluorophores given that they are cofactors involved in several metabolic pathways. For instance, they can be employed as indirect measurements for biomass estimation [116]. However, several secondary effects disturb fluorescence analyses such as inner filter effects that occur when non-fluorescent compounds absorb the exciting radiation, cascade effects that occur when the emission of a fluorophore excites another, and quenching effects that cause a decrease in fluorescence intensity [115]. Recently, 2D fluorescence spectroscopy was developed, whereby several excitation and emission wavelengths are employed. More elements can be analyzed at the same time over the course of the bioprocess [116]. These spectrometers can be used in situ and non-invasively with fiber-optical probes just as NIR/MIR spectroscopic sensors [116]. When compared to MIR or NIR, fluorescence spectroscopy is better suited for monitoring bioprocesses that require the measurement of species at low concentrations [108].
In mammalian cells, none of the fluorescent amino acids (tryptophane, tyrosine, phenylalanine) is synthesized by the cells and must be added to the medium. During the cell culture, these amino acids are taken up by the cells and incorporated into proteins. Once this happens, a quenching effect is observed where the fluorescence is diminished by neighboring protonated acid groups such as aspartate and glutamate [117]. When a direct linear correlation is not possible, multivariate techniques may be employed. For example, 2D fluorometry has been applied in a Baby Hamster Kidney (BHK) cell culture for determination of viable cell count and recombinant protein production by using PCA and PLS regression [61]. A similar method was developed for CHO cell lines expressing glutamine synthetase (GS) where the authors captured data on multiple fluorophores present in animal cell culture bulks in a single scan [62,63]. Modelling of viable cell density and antibody titers was realized through PCA and PLS regression. The 2-D fluorescence spectrometry has been used along with multivariate data analysis to differentiate between viable, dead, and lysed cell populations in mammalian cell culture. This is of value given that, with standard methodologies, it can be problematic to differentiate between populations with high resolution and accuracy [64].

5.3. Applications of Raman Spectroscopy

Raman spectroscopy is centered on the detection of inelastic scattering of monochromatic light that occurs when incident light interacts with the molecules of a sample [65,107,111,112,118]. When the light interacts with the vibrational frequencies of the molecules, most of it scattered without a change in frequency. This is known as Rayleigh scattering. However, a small fraction of the scattered electromagnetic energy is shifted from its original wavelength, and this is known as Raman scattering. The wavelength shift between the original monochromatic light and the scattered light is linearly dependent on the chemical bonds that caused the Raman scattering in the first place [65,112]. Thus, the detected light can give information regarding vibrational and rotational characteristics of the molecule. Importantly, this can give both qualitative and quantitative information about the sample composition. Raman spectroscopy has been applied for in situ bioprocess monitoring through the use of fiber optics as the delivery and collection system. Raman spectra are not sensitive to water, which is advantageous in cell culture monitoring. One of the drawbacks for its implementation is that biological molecules fluoresce in the Raman spectra region, generating interference. Thus, the selection of an appropriate laser wavelength that can maximize Raman signal and minimize fluorescence is a critical parameter when implementing Raman spectroscopy for bioprocess monitoring [65,107,111,112,118].
This technology has been applied to real-time in-line monitoring of glucose, glutamine, glutamate, lactate, ammonia, and viable cell density by coupling the technique with PLS modelling [66]. This is a promising move towards process monitoring and control as, previously, Raman spectroscopy had been applied to off-line monitoring of nutrients/metabolites in supernatants [67]. Raman spectroscopy along with PLS was also used as an in situ monitoring technique of glucose, glutamine, lactate, ammonia, glutamate, and total cell density in a CHO cell fed-batch process [68]. This technique was proven to be transferable across scales as it was tested at 3-L and 15-L scales with similar results.
Raman spectra analysis has also been used in a study to test changes in developmental scales (3-L, 200-L) and clinical manufacturing scale (2000-L) [69]. It was determined that glucose, lactate, and osmolality could be adequately modelled regardless of scale, while viable cell density and total cell density could achieve accurate predictive models but some scale-dependent variations limited across-scale predictions. Raman spectroscopy has also been applied in the prediction of glycoprotein yield at every stage, from small scale up to the final 5000-L bioreactor of a CHO cell process, demonstrating accurate predictions with relative errors between 2.1% and 3.3% [70]. In a similar research endeavor, Raman spectroscopy spectra were employed to build generic PLS models capable of predicting glucose, lactate, glutamate, ammonia, viable cell concentration, and total cell concentration values in a CHO cell culture process at 5-L and 10-L scales [71]. These models were in accordance with the off-line measurement error. The built models were found to be independent of cell line, given that model calibration and model validation were done with different cell lines [71]. However, glutamate and product yield could not be properly monitored in the process and it is thought that more sensitive off-line methods and the inclusion of more data could improve the estimation [71]. Similar problems have also been found in other CHO cell lines where adequate glucose and lactate models are readily built but issues arise in the development of glutamine and product titer models that fail to be specific and accurate enough in validation tests [72]. Automated feeding strategies that automatically maintain glucose at a low set point in order to limit lactate accumulation have seen difficulties when developed with Raman spectroscopy given that the measurement error is generally around 0.3–0.5 g/L [73]. However, to get around this problem, closed loop control schemes that measured both lactate and glucose concentrations have been developed. With this strategy, when lactate concentrations in the culture exceeded a predetermined set point, glucose addition was stopped [73]. Conversely, glucose was automatically fed (up to a maximum desired set point) when lactate levels were beneath a predetermined set point. By successfully limiting lactate accumulation, this approach increased cell counts and viability when compared to historical fed-batch cultures with the same cell line. This led to an 84% increase in final titer, thus demonstrating that real-time monitoring of cultures with spectroscopic techniques, along with feedback control loops, can be utilized to improve the production process [73]. Given that some critical parameters, such as glucose concentration, do not need high-precision and accuracy measurements, maintaining glucose levels within a predefined range has been determined to be a good strategy. Consequently, applying Raman spectroscopy in the domain of feedback control in order to maintain the glucose concentration autonomously has been explored [74]. This strategy allowed for the production of a target protein in a glucose concentration range that was not possible to achieve under daily bolus feeding strategies. Interestingly, glycation profiles were observed to be diminished from 9% to 4%, demonstrating that product quality attributes could be controlled with appropriate feedback controls [74].
From the aforementioned studies, it is clear that spectroscopic techniques are not so much in competition with one another but must be viewed as complementary in nature. However, it is important to highlight that Raman spectroscopy has seen more applicability when compared to NIR, MIR, and UV-VIS, given its unique ability to measure various types of compounds of interest by analyzing its spectral signal.

5.4. Applications of Dielectric Spectroscopy

Dielectric spectroscopy is another widely used method to monitor relevant variables in bioprocesses. The technique centers around the measurement of the passive dielectric properties of cells within a conductive medium. This is done by detecting the permittivity, which is the measurement of polarization, and the conductance. The method can be used on-line with a sterilizable permittivity probe [75,119,120,121]. This is possible because the cell is encapsulated by a lipid layer that is not conductive, while the cytoplasm is a complex, highly conductive medium containing water, salts, proteins, nucleic acids, and organelles. When an electric field is applied to cells in a suspension medium, cellular polarization occurs because the intracellular and extracellular ions move towards the electrode with the opposite charge but are stopped by the lipid layer [75,119,120,121]. Consequently, cells that have an intact membrane exhibit capacitance behavior and, thus, permittivity values, while cells with compromised membrane structure are unable to polarize. Because of this, the technique can be employed to measure cell density in a culture. However, since not all cells have the same diameter, in reality, permittivity is a measurement of biovolume (or biomass). When this measurement is used to get an estimate of cell concentration, it is under the assumption that all cells have the same diameter. Alternatively, solids or fragments, which are not part of the biomass, are unable to polarize given that they lack a nonconductive lipid layer.
Interestingly, it was determined that changes in capacitance relative to frequency could be related to cellular morphology. Indeed, a PLS regression allowed estimating the median cell diameter with a measurement error of only 2% [76]. It was also found that nutrient availability can be monitored by the permittivity signal because, immediately after a feeding event, signal values were observed to suddenly increase, while declines in permittivity values were correlated to states of nutrient depletion [76]. When the cell radius remained constant, as is mostly the case in the exponential phase, good correlations between oxygen uptake rate (OUR) and permittivity values were obtained, indicating that metabolic activity could be at least partly assessed via dielectric spectroscopy [76]. It should be noted that linear models used in conjunction with dielectric spectroscopy data were only accurate in the early phase of cell culture, while they failed to predict viable cell density during the decline phase [75]. In contrast, multivariate approaches such as PLS or alternative modelling techniques like Cole–Cole models were shown to predict viable cell density with high accuracy throughout the whole culture process [75]. In insect cell cultures using the baculovirus expression system, dielectric spectroscopy was able to estimate cellular growth and determine an appropriate time of infection (TOI) for the production of β galactosidase [77]. Furthermore, dielectric spectroscopy allowed for intimate process tracking of the progress of infection. Given that cell infection is characterized by a significant increase in cell biovolume, the capacitance signal is able to capture this phenomenon. Additionally, it has also been proposed that on-line dielectric spectroscopy estimation of adherent cells in microcarriers was a more accurate alternative than using off-line protein estimation as it is usually performed [121].
Given the variation in cell size distribution during cell culture, biocapacitance data can decouple from viable cell density data towards the end of a fed-batch cycle [78]. However, by analyzing the complex scanning data with multivariate data analysis (MVA) and constructing non-linear models with PLS or OPLS (orthogonal partial least squares), prediction of viable cell density instead of viable cell volume can be accomplished [78]. An on-line multivariate model resulted in viable cell density estimations that were a better fit to the death phase of the fed-batch cycle. To test the robustness of the model for real-time estimation of viable cell density, the fed-batch culture was subjected to dilutions (30 vol%) of the culture broth at various stages in the process. It was determined that the dilution steps were detectable in the on-line signal and correlated with the off-line cell counts [78]. Work has been done towards the development of a single, universal model that can be easily transferred across scales or clones without negatively impacting viable cell density prediction, especially in the declining phase of the fed-batch culture [82]. This is important because PLS models of multivariate signals generally result in low errors (when compared to viable cell density measurements) when created off-line after the process is finalized [82]. However, the same model quickly becomes unreliable for estimating the viable cell concentration of a new process with different operating parameters or cell line [82].
On-line biocapacitance measurements can be used as a surrogate for cell growth estimation in order to dynamically adjust feed rates [80]. This is of great importance given that it simplifies its integration into feed algorithms. Thanks to cell growth estimation, constant recalculation of growth rates was done automatically and used as a parameter to determine bolus feeding frequency [80]. When compared to manual bolus feeding, the results demonstrated that the dynamic feeding strategy had equal or better performance in terms of maximum viable cell concentration and maximum titer and metabolite accumulation [80]. Dynamic feeding strategies that are coupled with feedback control can avoid overfeeding and underfeeding throughout a fed-batch process [80]. This technology has gained great interest within the biomanufacturing industry given that the signal is independent of scale, as proved by Biogen when comparing biocapacitance trends of cultures of production cell lines at 5-L, 200-L, 315-L, and 15,000-L scales [79]. Interestingly, given this consistency across scales, it was possible to automate seeding trains within the production floor [79]. Additionally, with the generated data, it is possible to develop dynamic feeding strategies that calculate and add a volume feed as needed, as opposed to calculating a feed volume daily and feeding that bolus. The resulting feed strategy was responsive to actual culture performance and this reduced the risk of process failures caused by underfeeding [79].
Additional Biogen studies found that integrated cumulative integral of cell growth can be directly related to integrated biocapacitance (IBC) [122]. A linear correlation between the IBC and total feed amount was found in the entire process and, thus, it was possible to directly use biocapacitance data to control feed addition [122]. Based on the hypothesis that biocapacitance-based auto feeding could mitigate underfeeding/overfeeding phenomena in fed-batch culture process, bioreactors were intentionally seeded at low seeding densities. The fixed feed strategy caused overfeeding, which consequently caused cell growth inhibition. Alternatively, the biocapacitance-based feeding strategy automatically reduced the feed accordingly to biomass need. This led to lower ammonium and lactate levels when compared to the fixed process that was intentionally seeded at lower cell densities. It also led to higher titers and higher product purities given that the fixed process affected glycation and trisulfide formation [122]. Consequently, it was determined that capacitance data can improve process robustness by providing consistency in both productivity and product quality regardless of process variation. This simplified application is encouraging as it does not require complex multivariate analysis models, which run the risk of being overfit for a certain process to develop dynamic feeding strategies in the manufacturing floor.
Alternative strategies include biocapacitance data and glucose measurements to determine glucose uptake rates, which can then be used to feed the cultures as needed. Thus, by setting up a strict, target-specific glucose consumption rate for the whole process runtime of a fed-batch, the culture can be fed optimally [81]. It was shown that feeding based on specific glucose consumption and not on glucose itself can improve lactic acid profiles.

6. Optical Sensing Techniques

Optical chemosensors, also known as optodes, work thanks to the interaction of an analyte and a matrix-embedded indicator that is immobilized at the sensor tip [41,87,118,123]. The indicator is illuminated by a diode through optical fiber, and a change in optical properties that are detected by a photodiode is correlated with the concentration of the analyte of interest. The change in optical properties that is directly correlated to the variable of interest can be photoluminescence intensity, absorption, or reflection. These sensor types can be used in situ in stainless-steel bioreactors through standard ports or in small-scale systems such as deep well plates and shake flasks through patches. This application is of interest in systems with low volume where in situ sensors are not possible or would directly impact the hydrodynamics of the system in question, such as the case of systems at the millimeter scale [118]. Optical sensors in patch form have also been applied extensively in single-use bioreactors to monitor dissolved oxygen, carbon dioxide, and pH, given their ease of use and disposability and because they can be readily sterilized by using gamma radiation [41,118]. They have several advantages over standard electrochemical sensors, namely, that no direct electrical contact between analyte and electronics is required [87]. Moreover, contrary to amperometry sensors, no analyte is consumed, thus there is no net change in the concentration of the variable of interest. One interesting example is the electrochemical oxygen sensors, which actively consume oxygen in the process of measurement, which may influence the measurement especially in miniaturized systems [124].
Dissolved oxygen (DO) is commonly measured using optical sensors through fluorescence quenching of an immobilized fluorescence dye by molecular oxygen [41,87,118]. The oxygen-sensitive indicator is an organometallic dye that is immobilized in an oxygen-permeable polymer matrix. These optical oxygen sensors can be readily miniaturized as opposed to Clark electrode sensors and, thus, measurements with high spatial resolution in small volumes are practicable [41,118]. A published study was able to compare optical oxygen sensors with respect to their electrochemical counterparts and determined that their Pearson correlation was of 98.7%, thus demonstrating that both sensors were in agreement with the measure values [125]. They also highlighted that the accuracy of the optical probes demonstrated an ability to detect parameters shifts that could impact cell growth, production kinetics, and protein quality in a significant way [125]. It has been postulated that the electrochemical oxygen sensors and optical oxygen sensors may be complementary rather than competitive, given that electrochemical sensors perform best at high oxygen concentrations, while optical sensors have an optimal sensitivity at low concentrations (<50% of air saturation) [124,126]. By employing the same mechanism as an optical dissolved oxygen sensor, disposable optical in-line glucose monitoring sensors have been developed [127]. Here, a PreSens oxygen sensor is coated with a cross-linked glucose oxidase layer. Thus, the oxygen partial pressure within the crosslinked enzyme layer is monitored non-invasively and its signal is inversely proportional to the glucose concentration within the sample [127]. The dynamic range of the biosensor could be tuned for specific purposes by covering the enzyme layer with different hydrophilic perforated membranes [127].
Optical carbon dioxide sensors work relatively like their electrochemical counterparts, whereby a change in pH of a bicarbonate buffer system due to carbon dioxide presence is measured [41,118,124]. In this buffer system, fluorometric or colorimetric pH sensitive indicators are added, and the system is isolated from the bioprocess broth by a carbon dioxide permeable membrane. From the pH bicarbonate system equilibrium, it is possible to calculate the carbon dioxide partial pressure from a change in pH in the medium. The response time is within the range of minutes given that it is diffusion dependent. Frequent buffer solution change is required because the optical measurement is dependent on ionic strength of the buffer [41,118,124]. These sensors can be used to study dissolved carbon dioxide concentrations within the media to estimate the carbon evolution rate (CER), which can serve as a proxy for cellular respiration estimation. Optical pH sensitive sensors function in a very similar way to carbon dioxide sensors given that a change of pH is the variable of interest. They can be constructed based on absorbance or on fluorescent dyes, which are covalently immobilized on cellulose matrixes [41,87,118]. Optical pH and DO sensors have become standard equipment for single-use vessels given that they can monitor non-invasively the bioreactor. Importantly, these sensors are connected to a readout unit through a reusable fiber optic [49].

7. Mass Spectrometry Techniques

Mass spectrometry can be a powerful analytical tool given its high specificity, selectivity, sensitivity, dynamic range, and resolution, as well as mass accuracy [91]. Thanks to this, on-line application of mass spectrometry can contribute to the analysis of numerous components as well as various attributes of heterogeneous biological compounds. The most important component in mass spectrometry is the generation of a high vacuum that is below 10−5 mbar [91]. The samples are commonly introduced to the system through thermospray, electrospray, or direct liquid inlet. The samples are consequently ionized through electron impact, chemical ionization, or desorption ionization. The data gathered by mass spectrometers are quantitative, can be assigned to specific compounds, and, when analyzed with multivariate statistical tools, they can be used to build models that predict variables of interest.
On-line mass spectrometry is readily applied for the analysis of gas phase samples from bioreactor exhaust gas. It has been used to detect oxygen uptake rate and carbon dioxide production rates from cell culture runs in 10-L bioreactors. It was possible to correlate oxygen uptake rate to viable cell growth throughout the course of the bioprocess [92]. Additionally, it was also determined that changes in the oxygen uptake rate during the cell culture indicated occurrences of limitation of nutrients within the medium. Thus, an on-line mass spectrometry gas analyzer can be useful in timing important events such as splits or harvest time [93]. Interestingly, mass spectrometry gas analysis has been realized for fed-batch cultivation of mammalian cell cultures in 5-L and 50-L vessels to measure its application in scale-up systems. Correlation between viable cell concentration and oxygen concentration of the inlet gas into the bioreactor was high, irrespective of scale for a CHO-GS cell line that expressed chimeric IgG4 monoclonal antibodies [94]. Additionally, the oxygen mass transfer coefficient (kLa) could also be identified throughout the culture with the mass spectrometer, and an impact of antifoam on kLa was found [94]. The respiratory quotient (RQ), defined as carbon dioxide evolution rate (CER)/oxygen uptake rate (OUR), was also estimated and a distinct correlation between RQ and the metabolic state of the cell culture was established; when a cell culture was determined to be in the lactate production phase, the average RQ was above 1. Conversely, when the culture was determined to be in a lactate consumption phase, the average RQ was below 1 [94,95].
Liquid chromatography mass spectrometry (LC-MS) has been used for the monitoring of glycan profiles and charge variants as well as purity. Given its multi-attribute monitoring, it has the potential to replace current electrophoretic and chromatographic tools that are used in quality control [96]. Another important technique for biological mass spectrometry is matrix-assisted laser desorption/ionization time-of-flight mass spectrometry, which has been used to determine process consistency and suitability of the cell line used for production [92]. When mass spectrometry is coupled with at-line liquid chromatography, simultaneous analysis of glycosylation patterns, heavy chain/light chain dimers, and C-terminal lysine residues is possible at the time of harvest [92]. Liquid phase measurement can be realized through membrane-inlet mass spectrometry because it allows the analytes to be moved from a complex aqueous solution to the ionic source thanks to a semi-permeable membrane [91]. This is specially used for the monitoring of metabolites that are released by the cells during the culture process, particularly volatile or semi-volatile organic compounds. Volatile organic compounds, within the context of cell culture, participate in a variety of biological functions such as growth inhibiting/promoting agents or cellular communication between cells [97]. Proton transfer reaction mass spectrometry (PTR-MS) was recently applied to monitor a recombinant CHO cell culture process [98]. In total, eight volatile organic compounds that showed high relevance to cultivation conditions could be identified: Methanol; Acetaldehyde; Methanethiol; Ethanthiol; Isoprene; Ester organic acid; α, γ-Butyrolacton, pentanal, 2-pentanon, and 3-methyl-3-buten-1-on; and 4-Methylpentan-2-on and 3-methylpentan-2-on. Among these, methanethiol could be directly correlated to metabolic shifts or nutrient limitation. In conjunction with PLS modelling, this technique was able to predict physiological cell culture parameters such as specific glutamine uptake rate and viable cell density.
Because of its multi-utility, this tool has also gained popularity in bioprocess development given that it can be utilized as a platform quality control method during the establishment of a manufacturing process [99]. With LC-MS, it was possible to demonstrate correlation between specific process parameters (pH, DO, glucose, temperature, seeding density) and the levels of glycosylated and glycated species [100]. LC-MS could thus be incorporated into an automated platform capable of monitoring, in real time, quality attribute outcomes for feedback control [100]. A multi-attribute method using non-reduced peptide mapping with quadrupole Dalton (QDa) detection has been reported in the literature [101]. QDa is a single quadrupole mass detector with an electrospray ionization source [101]. As opposed to other mass spectrometers, it is cost effective and relatively easy to maintain. The method was tested in upstream and downstream process development in order to monitor fucosylation, deamidation, and glycosylation in the Fc region, as well as disulfide bond-related modifications, such as trisulfide, thioether, free thiols, and cysteinylation [101]. The monitoring of glycosylation profiles of monoclonal antibody in cell culture samples through microfluidic chips has also been reported in the literature [102]. The method characterizes the sample through charge-based separation using microfluidic capillary electrophoresis and high-resolution mass spectrometry. It is suggested that this method can detect undesired shifts in product quality and, thus, has potential for at-line and in-line cell culture monitoring [102]. Thus, even though spectroscopic techniques can determine concentration of analytes in a cell culture process, they lack the sensitivity and specificity to measure post-translational modifications such as deamination and oxidation [103]. Consequently, mass spectrometry has shown great promise in being able to measure increasingly important product quality attributes. This is clear when looking at therapeutic proteins’ license applications between 2000–2015. Of 80 therapeutic proteins, 79 employed mass spectrometry in their workflows to determine protein and purity characterization [103].

8. Electrochemical Sensing Techniques

This family of sensors can detect variations in electrical properties or charged species through chemical reactions. These sensors can be classified as potentiometric, conductometric, voltametric, and amperometric. Conductometric sensors measure variations in conductance while potentiometric sensors measure differences in electrical potential with respect to a reference electrode. Voltametric sensors measure changes in charge transport when the applied potential is varied. Importantly, amperometric sensors rely on the same principle but measure changes in charge transport while the potential is kept constant [118,128]. The standard electrochemical sensors routinely used in bioprocessing are pH and dissolved oxygen probes. These parameters are important to measure and control to ensure that cells remain in a favorable environment. The pH must be controlled to a range that is optimal for a specific cell line while dissolved oxygen must be maintained, usually within a range of 20–60%, to allow for cellular respiration. Process-induced shifts such as temperature (growth arrest) or pH shifts (lactate consumption trigger) have been explored in optimizing the productivity of a bioprocess; thus, the reliance of accurate in-line sensors is important [21,129]. More sophisticated sensors that use electrochemical enzymatic arrangements have been developed to monitor glucose and lactate on-line [130]. These sensors are advantageous in that they diminish the need for sampling and increase the real-time knowledge within the reactors regarding substrate consumption and accumulation of lactate. The drawback, however, is that these sensors are usable for up to 21 days, meaning that they can only be used for the fed-batch mode and not in perfusion reactors where the process can be maintained for longer [130]. Electrochemical single-use biosensors for on-line measurement of glucose and glutamate are also available. These sensors employ enzymatic oxidation processes that direct electron transfer from the measured substrate to an electrode. Such sensors are delivered ready to use and can be integrated to shake flask or disposable bioreactors [49].
In the case of pH sensors, potentiometric sensors are generally used while, for dissolved oxygen sensors, Clark electrodes are considered the standard. Of importance, Clark electrodes are amperometric in nature [41]. However, the drawback is that oxygen is consumed during the measurement, which means that the utility of such probes is limited in situations where oxygen can be depleted, such as in small-scale models. Additionally, dissolved carbon dioxide can also be measured by using Severinghaus electrodes [118,128]. Given that dissolved CO2 has been determined to have a significant impact on quantity and quality of final product titer, tight control of dissolved CO2 has been hypothesized to benefit fed-batch cell culture productivity. In one investigation, two equivalent CHO fed-batch cultures were realized [88], one with CO2 tightly controlled at 10% and one where the CO2 was let freely to accumulate up to 20%. The tightly CO2-controlled cell culture resulted in a longer productive phase and higher protein yield. Interestingly, the pH between both reactors was equivalent [88]. Monitoring and controlling CO2 with dedicated feedback control loops that have optimized sparging/CO2 stripping strategies could benefit the overall cell culture process. It has been reported that batch-to-batch reproducibility can also be increased if pH control is managed without base addition. Because of this, strategies towards pH regulation without base addition (only using gas sparging) has been tested across varying scales with great success [38].
Dissolved carbon dioxide probes have also proved to be extremely useful for the scale-up of bioreactors. For example, strategies focused around the kLa ratio of kLa (O2)/kLa (CO2) have been proposed [90]. This scale-up criterion has the benefit that CO2 does not tend to accumulate in larger vessels. When this ratio is kept constant, it is highly likely that the dissolved CO2 profile during cultivation will be similar across different bioreactor scales, hence helping to maintain product and process consistency. This strategy has been suggested to be especially useful for technology transfer of large stainless steel tanks or single-use reactors, where accurate knowledge regarding the geometry of the vessel may be lacking and, thus, the standard Power/Volume (P/V) scale-up strategy may be deficient [90]. During scale-up procedures, dissolved CO2 probes are also useful in determining removal rates of dissolved carbon dioxide in large reactors. This can help to assess the impact of sparging and headspace purging strategies. For example, it was found that headspace air flow rates do not have a significant impact on carbon dioxide removal, while sparging and varying specific power inputs were determined to be more effective for stripping [89].
DO sensor can be employed in the estimation of oxygen uptake rate through the dynamic method, which is inherently discrete given that it requires the DO to fluctuate within a range of 70–20% after turning off aeration. The decrease in DO can then be directly related to the amount of oxygen that is being consumed by the cells. With this method, it has been observed that the oxygen uptake rate (OUR) is directly proportional to viable cell concentration during the exponential growth phase [83]. Importantly, the end of the exponential growth phase also correlated with OUR measurements. By estimating cell concentration in the bioreactor through the OUR, feeding of substrates could be predicted. This requires the assumption that, during the exponential growth phase, the specific oxygen consumption is constant [83]. This feeding control strategy resulted in cell growth maintained at the exponential phase. It was found that the glucose concentration in the bioreactor was kept between 0.9 and 1.2 mM, indicating that the control strategy could maintain a desired set point. The OUR estimation was able to detect the start of the cell death phase just before maximum cell concentration was achieved, which served as an early warning in order to avoid glucose accumulation from this moment on [83]. Alternatively, given the cumbersome nature of OUR estimation through the dynamic method, oxygen transfer rate (OTR) measurements can also be utilized to indirectly measure metabolic activity [84]. With this measurement, it was possible to relate cumulative glucose consumption with cumulative OTR. Based on this correlation, it was possible to generate an on-line prediction of glucose that can be incorporated into a control algorithm that manipulates the glucose feed rate [84]. It was then determined that the advanced process control strategy could adequately maintain glucose concentration at an adjustable set point. In a similar study, a DO control system was used to provide a measure of the culture gas phase partial pressure of oxygen to calculate OUR from an oxygen balance in the liquid phase and relating it to the head space with Henry’s constant [85]. It was determined that the OUR could predict viable cell density in uninfected growing insect cell cultures. Interestingly, it was also determined that the OUR could follow the progress of baculovirus infection and that it could pinpoint the onset of the death phase of infected cell cultures [85]. This is key given that the best time for product harvest occurs within a relatively narrow interval imposed by cell lysis at the end of the infection cycle [85]. Consequently, determining the optimal time of product harvest could ensure better product yields [85]. Researchers have proposed adequate OUR estimation through OTR measurements by characterizing kLa values throughout the cell culture cycle [86]. Thanks to a two-segment linear model, it was determined that the OUR can be directly associated with viable biomass of the system [86]. This correlation was done directly with capacitance measurements given that capacitance data can be correlated with biomass. The segmented model was necessary due to a metabolic transition in which the specific consumption of oxygen changed [86]. The metabolic shifts could also be observed in the system when OUR and capacitance measurements were analyzed together given that changes in specific oxygen consumption could be observed [86].
It is clear that even the industry standard sensors, which are employed to control the environment within the bioreactor, can be used to gather more in-depth information about the metabolic activity or respiratory profile of the cells. This information can also be applied for scale-up purposes or feedback control algorithms, which in turn will optimize cell culture processes. Thus, sensors can be used beyond controlling the environment of the reactor to maintain physiologically relevant conditions in the interest of maximizing the production process.

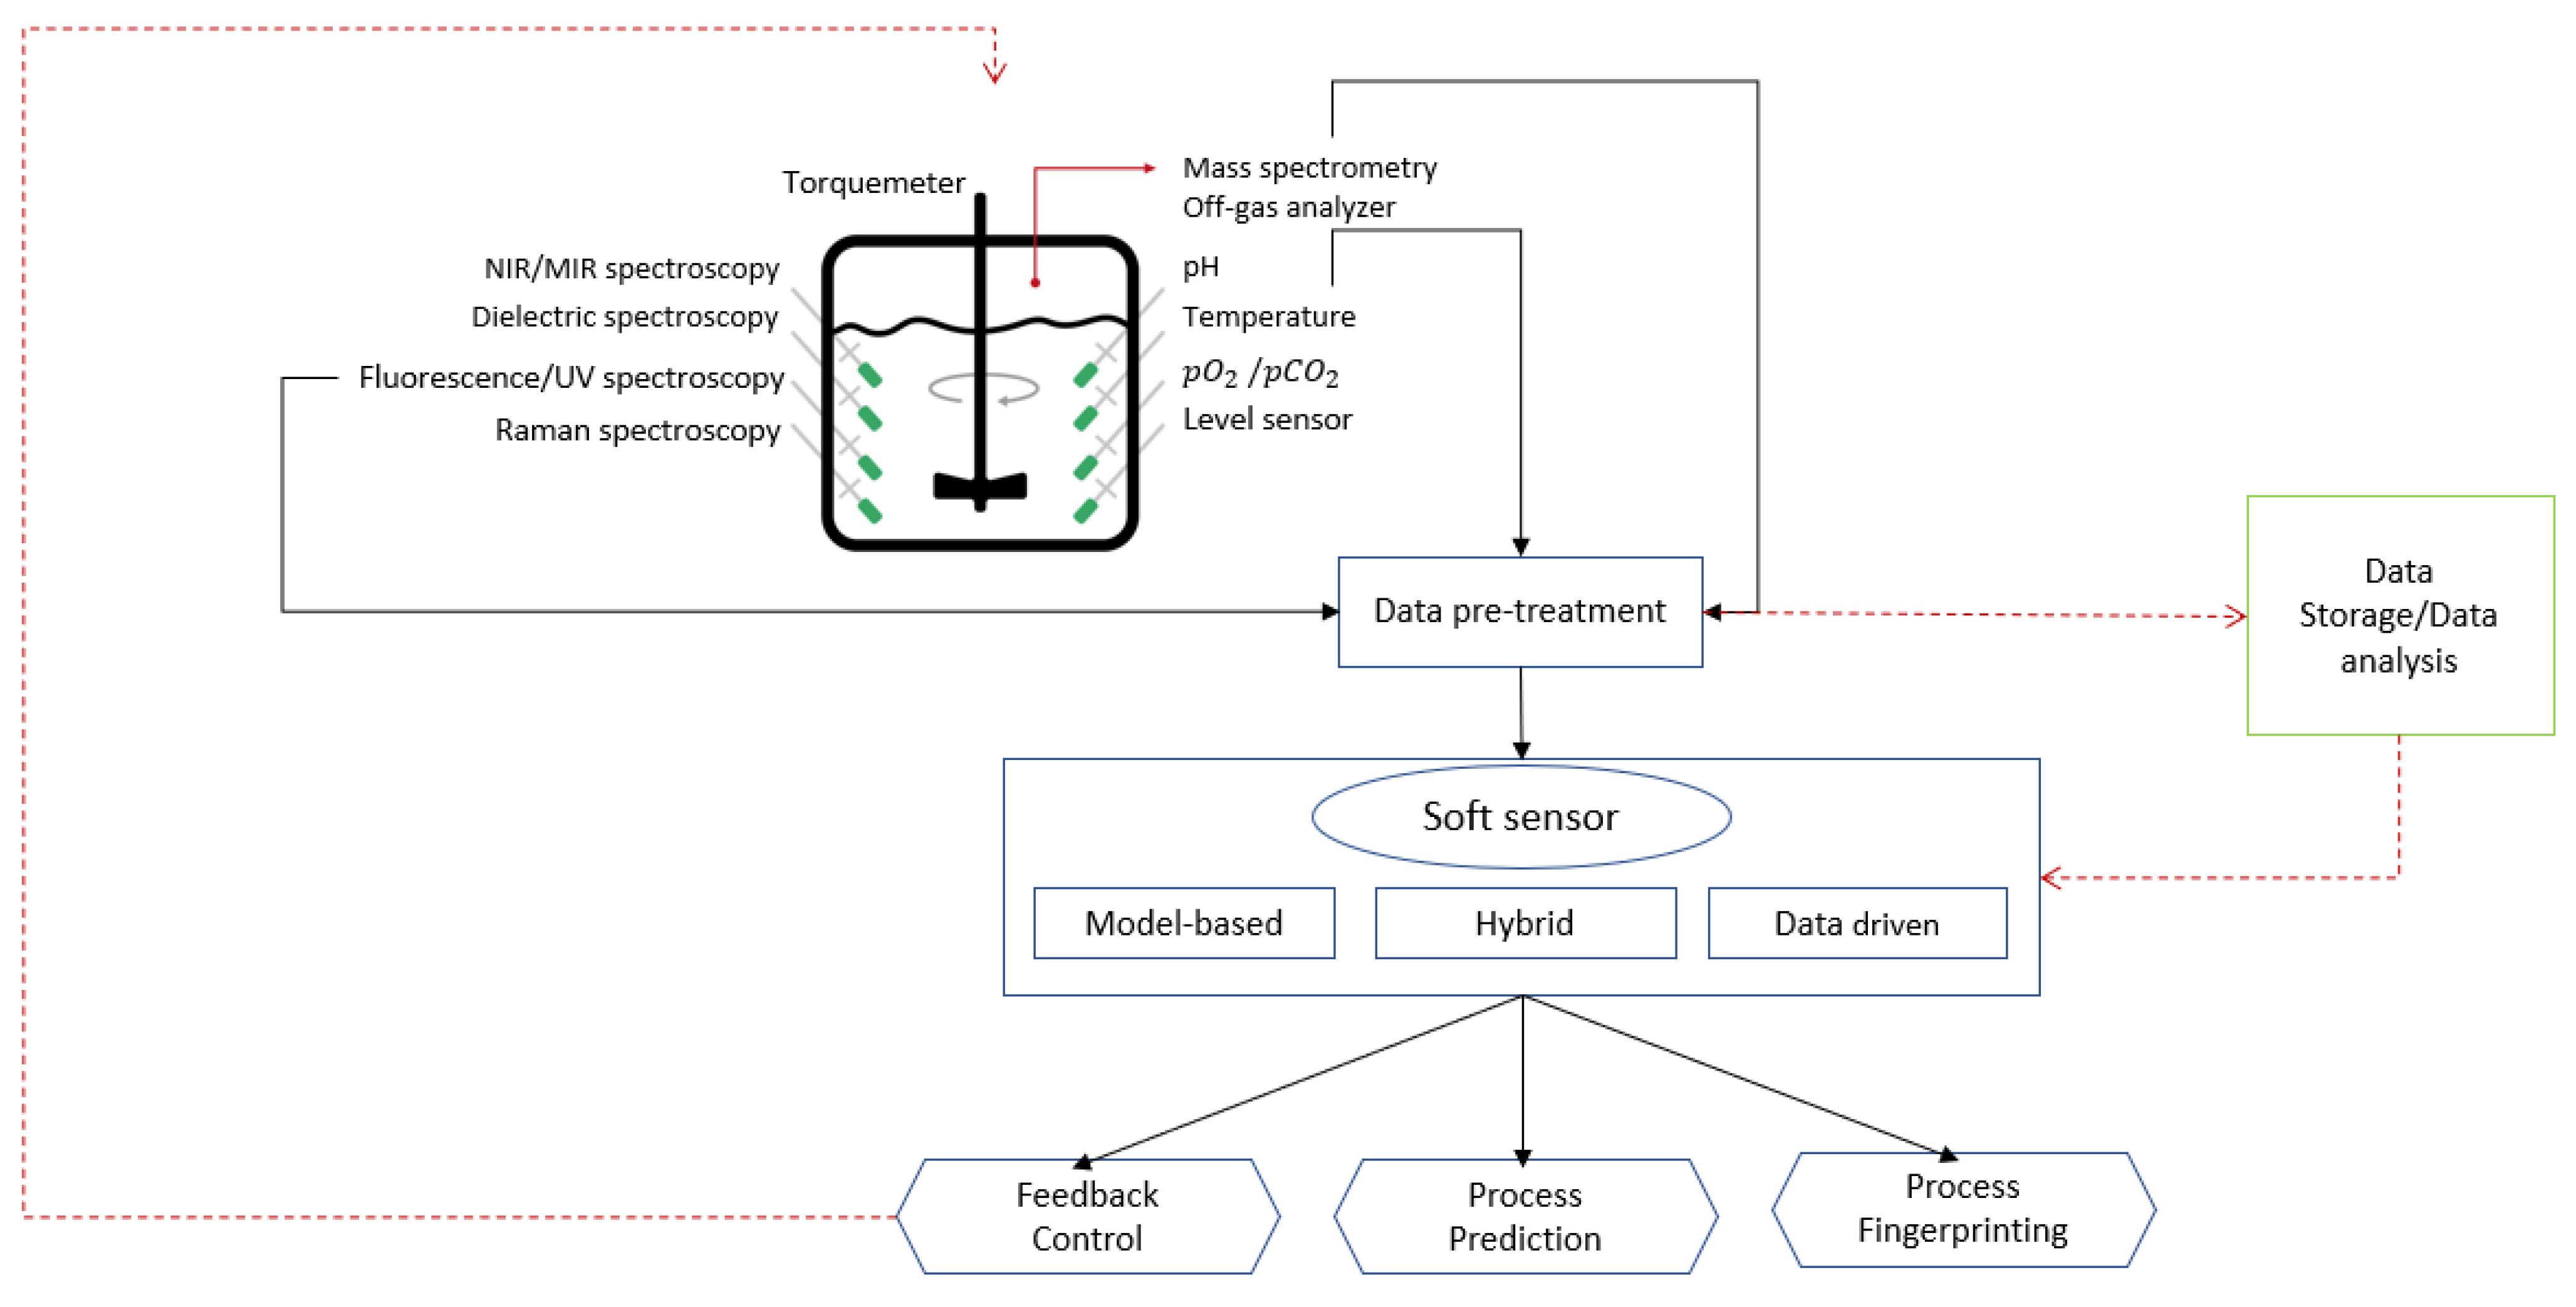
9. Soft Sensors for Cell Culture Monitoring

A soft sensor is a term used to describe an approach that employs hardware devices and software-implemented models to gather new information about the process that would otherwise be impossible to derive exclusively with hardware sensor measurements [131,132,133,134]. In essence, these novel arrangements are employed with the purpose of using easily accessible on-line data to infer quantitative information about process variables that are difficult to measure directly or can only be measured at low sampling frequency [135]. Soft sensors can, thus, become useful for both monitoring and control applications in the bioprocessing industry if they are demonstrated to be robust and easy to implement [131,132,133,134]. In theory, a soft sensor should result in reduced need for extensive operational surveillance and educed maintenance work and should increase the interpretability of the results given the capacity of the models to relate various key variables. Because of this, soft sensors are perfect candidates for the PAT initiative and to contribute towards automated control [135]. Broadly speaking, soft sensors can be split into three global categories: data-driven sensors, model-driven sensors, and hybrid models [116].

9.1. Data-Driven Soft Sensors

Data-driven soft sensors employ common chemometric techniques such as PLS, PCA, and other complex non-linear regressions such as ANN and fuzzy logic [131,132,133,134]. ANN can be used as multi-input, single-output systems or multi-input, multi-output systems. Importantly, fuzzy logic sets are based on general rules that have also been shown to be capable of describing unknown state variables from known measurements [131,132,133,134]. This is particularly useful in mammalian cell cultures where a lot of the interactions between metabolism and process conditions remain unknown or highly cell line specific. Another widely used method is the PLS regression that is frequently applied in soft sensors [116]. This is notably the case with mass and optical spectral data, which are used as inputs to PLS or ANN models linked to outputs such as media analyte concentrations, cell count, cell viability, or expressed proteins [131,132,133,134]. Thus, it must be stressed that, when these methods are applied separately or in combination, they can predict critical process parameters that are not immediately available through the spectral signals or multi-sensor data but arise from the deconvolution of the datasets. Because of this, data-driven models do not provide further mechanistic understanding of the physical and biological processes and they require extensive calibration within operational ranges to make the correlation valid [116].

9.2. Model-Driven Soft Sensors

Model-driven sensors involve mechanistic models that are based on engineering principles and biological insights, such as mass or energy balances that provide an understanding of the transformation processes in the organism [116]. These models can incorporate culture conditions such as media composition and/or culture performance (cell growth, production yield) in order to build explicatory models. As such, these models exploit existing knowledge with kinetic equations to capture dynamic changes of important variables [131,132,133,134]. These types of soft sensors are generally built by incorporating reaction kinetics, transport phenomena, and thermodynamic constraints into the model [116]. Such models must be accompanied by parameter identification, uncertainty analysis, and sensitivity analysis to validate the model. Mechanistic models require extensive experimental data to be verified. However, if the model is reproducible and reliable, it can provide biologically interpretable information and simultaneously proven and increased understanding of the production process [116]. Model-driven sensors can be split into steady-state and dynamic models. The steady-state models are developed from mass and component balances or from mass and heat transfer laws, while dynamic models employ dynamic balances along with kinetic assumptions to describe rate expressions as functions of the state variables [136]. Flux balance analysis (FBA) and metabolic flux analysis (MFA) are two stoichiometric-based methods commonly employed to characterize cell metabolism and estimate intracellular fluxes by using extracellular metabolite consumption or production rates as constraints. Since quasi-steady state for intracellular metabolites is a critical assumption applied in stoichiometric-based models, these approaches are static in nature [136]. Kinetic models are generally expressed as a series of ordinary differential equations (ODEs) and consequently describe dynamic changes in metabolite concentrations, cell density, and product formation by describing its rate of change with respect to time during the cell culture process [131,132,133,134]. Thus, cell growth and death can be linked to critical nutrients and metabolic by-products, while the protein production is usually linked to cell growth and amino acid metabolism [136]. Kinetic/dynamic models can be structured with varying levels of complexity depending on the assumptions made regarding the culture system and intracellular processes. For example, a model can add complexity by considering the heterogeneity in a cell population or by taking into account the different cellular compartments. Models can also be simplified by lumping reactions to rate-limiting steps [136]. These model-driven sensors are complex to develop and, as such, in the biopharmaceutical industry, data-driven sensors, which rely on historic data or small-scale process development runs, tend to be more used [116].

9.3. Hybrid Models

Grey-box models are another important category of soft sensors, which can be considered as a combination of mechanistic models and data-driven models. They have the advantage of maximizing the benefits of each method while avoiding some of the disadvantages inherent to each approach [131,132,133,134]. To limit the shortcomings of black box models (lack of extrapolation capabilities within trained range) and white box models (large uncertainty over parameters estimation and susceptibility to noise), recursive state observers can be used to combine dynamic metabolic modelling and data-driven modelling by updating state estimates derived from noisy measurement and gradually reducing the estimation error covariance on the specific assumption of linear process and Gaussian distribution for the error terms. For this purpose, a Kalman filter can be used. Importantly, given that the process dynamics within a bioprocess are highly non-linear, the extended Kalman filter can be applied to non-linear systems, thanks to piecewise linearization of the process around the time trajectories of the variables through the estimation of Jacobian matrixes [137]. Another popular version of the Kalman filter for non-linear systems is the unscented Kalman filter, which uses a Taylor series expansion to linearize the model [138]. Since the accuracy of a hybrid soft sensor is significantly impacted by the accuracy of the mechanistic model, the latter must be extensively validated to ensure it can successfully represent the process [137].
In grey box/hybrid models, the biological system is described by a mechanistic framework but the cell-specific rates are defined by statistical expressions [131,132,133,134]. Thus, the material balance constrains the solution space for the model and the statistical cell-specific rate expressions can be automated [139]. For example, if multi-wavelength spectra are analyzed with PLS or an ANN and the resulting predictions are used as an input in a mechanistic model, this can be considered a grey box model. By mixing material balances with statistical models, direct links between data and physical bioprocess systems can be generated. This is because, within the hybrid model structure, the Kalman filter uses the prediction from the mechanistic model and the data gained from the data-driven model to recursively update the state estimators, thus synthesizing the information gained from both types of models [138,140]. In such a way, it is possible to imagine numerous applications where multivariate models generated from spectroscopic data or other on-line measurements and mechanistic models are used in tandem to develop models that use historical data while also describing the dynamics of the system. Some studies have demonstrated improved protein yield when employing hybrid models for adaptive feeding when compared to relying exclusively on data-driven models for adaptive feeding [137]. Kalman filtering can be used with both on-line and off-line data. For example, biocapacitance measurements used to estimate biomass on-line and infrequent sampling of ammonia and lactate can be coupled along with process dynamic equations to continuously estimate glucose and glutamine concentrations [141]. A similar study was realized with Raman measurements that were combined with dynamic metabolic models through adaptive, constrained, extended Kalman filters for the purpose of metabolite concentration tracking, which could then be applied in setpoint tracking of glucose [142].

9.4. Applications of Soft Sensors in Bioprocessing

It is clear from the aforementioned definitions that soft sensors are dependent on both the mathematical framework and the measurement device to be successfully merged into a single functional entity. The state-of-the-art techniques used to generate a soft sensor include many of the measurement devices that have been covered in the previous sections, ranging from NIR/MIR spectroscopy, fluorescence spectroscopy, dielectric spectroscopy, and Raman spectroscopy to mass spectrometry. Soft sensors can employ either in-line measurements or at-line measurements. They have been applied to non-invasive on-line spectroscopic methods such as NIR/MIR, 2D fluorescence, and Raman spectral data given the multidimensional complexity of the signal and the need of multivariate data analysis to relate the data to relevant process parameters [131,132,133,134]. While in situ sensors may be more attractive than at-line sensors given the higher sampling rates, on the other hand, precision, calibration, and stability generally often favor the at-line alternatives [131,132,133,134]. For example, a soft sensor capable of monitoring biomass subpopulations (viable cells, dead cells, and lysed cells) in a cell culture process was developed through the use of permittivity and turbidity sensors in conjunction with mechanistic models that describe the dynamics of the subpopulations [143]. This is of great value given that estimating lysed cell concentrations is difficult, generally requiring indirect methods such as the measurement of process-related impurities like DNA and host cell proteins in the supernatant.
By combining mechanistic metabolic modelling and multi-wavelength fluorescence spectroscopic data, it was proposed that the resulting soft sensor could filter noise in the data and produce estimates of culture variables in between fluorescent data samples. More precisely, a metabolic flux model capable of relating the main nutrients to by-products was combined with a PLS regression of fluorescent data. It was concluded that the dynamic model was capable of improving the accuracy of the data-driven fluorescence-based predictions [137]. Additionally, the extended Kalman filter model could generate accurate predictions of the temporal evolution of the culture variables in between sampling instances. This study is in addition to another publication by the same authors where a PLS model of fluorescent data was built [144]. Here, viable cell, glucose, recombinant protein, and ammonia concentrations were predicted accurately throughout the culture progress of CHO cells [144]. However, such soft sensor arrangements work as black box models and, thus, are inherently limited in their capacity to predict key process variables in discrete space or extrapolating the results for varying processes. As such, they are not able to accommodate the dynamic evolution of the variables in between measurement instances [144].
Recently, efforts have been made to develop data-driven models that aim to integrate varying 2-D fluorescence datasets into calibration phase, regardless of the process strategy-dependent diversity [145]. For this, special attention was directed towards the nutrient rich and, consequently, fluorescent feeding solutions that are suspected to hamper the generation of reliable chemometric models given that they alter the evolution of fluorescent components during cell culture cultivation [145]. It was determined that calibration of soft sensors was generally possible regardless of the process strategy. It was suggested that calibration of soft sensors with data that adequately incorporate process variations can facilitate the transfer of soft sensors from one production process to another [145]. This is an important improvement for data-driven applications within bioprocessing given that most developed models tend to be over fitted for their application, making model transferability difficult.
As mentioned previously, another spectroscopic technique that is readily applied to data-driven soft sensors is Raman spectroscopy. It has been proven to be a reliable way to attain in situ, real-time measurements of relevant process parameters while at the same time being translatable across different scales without the need of model recalibration [68]. A comparison of multivariate linear regression (MLR), principal component regression (PCR), and PLS regression (PLSR) algorithms for the creation of a data-driven model using Raman spectroscopic data has been performed. It was determined that PLSR, the most advanced algorithm of the three, delivered the lowest root mean square error prediction, indicating that it was the model that most accurately represented the empirical measurements [146]. This is doubly advantageous given that PLSR is the most available algorithm in commercial, multivariate data-analyzing software. Raman spectroscopic data have also been used to indirectly measure changes in pH [147]. This method was proposed as an in situ, real-time method for pH estimation given that standard electrochemical pH probes suffer from drifts that require correction by off-line measurement methods. Given that pH in a bioprocess is influenced by controller inputs (base and carbon dioxide additions) and cell culture metabolism (lactate, ammonia), a method capable of relating spectroscopic (X variables) to pH (Y variable) data in fed-batch mammalian cell cultures was developed. The model conveyed errors of 0.035 and 0.034 pH for two different CHO cell lines. This can be explained by the fact that the Raman spectroscopy model is not being directly correlated to pH; instead, it is correlated to bonds and molecules that influence pH within the bioprocess [147]. The advances in soft sensor modelling for data-driven sensors have been so vast that variables beyond routine measurements like glucose, lactate, and viable cell density have been suggested. Chemometric models for tyrosine, tryptophan, phenylalanine, and methionine have been developed with good correlation metrics. This, in turn, suggests that real-time monitoring and control of amino acids in cell culture is feasible and can help in the process of optimizing yields and product quality [148]. Historically, ultraviolet-visible spectroscopy has provided poor information of bioprocesses because of wide and unspecified bands, spectral interferences, and deficiency in detection of higher energy electronic levels in molecules. To circumvent this, ANN have been proposed to predict glutamine, glutamate, glucose, lactate, and viable cell concentrations [57].
In Figure 7, it is possible to observe how the different sensors covered can be used as varying sources of data streams to feed into a soft sensor. These soft sensors bifurcate in the methodology used (mechanistic mode, data-driven, and hybrids) but always have the goal of generating information that cannot be measured directly and individually with each hardware sensor. It is clear that soft sensors have an important role to play in the future of bioprocess monitoring. Black box-based sensors can combine information of newly applied spectroscopy data to gather information directly from the media without the need of repeated sampling, while mechanistic-based sensors can estimate information regarding the process dynamics and intracellular metabolic rates. This is of great value as well, as it can serve to develop control algorithms that take into account real-time data regarding the metabolic profile. Alternatively, hybrid-based sensors could be considered the best of both worlds given that they can integrate the large amount of data available with knowledge-based models.

9.5. Soft Sensor Implementation

To build the soft sensors, a variety of programming environments can be employed such as Matlab and Python [149]. These programming environments are popular for the development of soft sensors because they provide libraries and tool boxes for signal processing, data analysis, model calibration, and model validation [149]. Alternatively, in an industrial setting, commercial software systems for chemometrics are generally used, such as SIMCA (Sartorius AG) or Unscrambler (Aspen Technology Inc., Bedford, MA, USA) [150]. With these software systems, the flexibility of the programming environment offered by Python/Matlab is exchanged for streamlined platform. Vendors of on-line analytical tools also offer software modules for soft sensor development such as the OPUS suite by Bruker Corp., iC suite by Mettler Toledo Inc., Columbus, OH, USA, and GRAMS suite by Thermo Fisher Scientific Inc., Waltham, MA, USA, [150]. Finally, soft sensors can also be developed as internet of things such as Predix, MindSphere, and Sentience. Alternatively, cloud infrastructure can be used for soft sensor integration within a manufacturing plant by using Amazon web services, Microsoft Azure, Google cloud, or IBM’s Watson IoT [151].

9.6. Soft Sensors for Bioprocess Control

Soft sensors are of increasing interest in order to develop non-linear control strategies. Control strategies in bioprocessing have the objective of supervising key parameters in a dynamically changing process in order to maintain the key variables within the desired design space. These control strategies are developed early in the process development cycle in order to work around unforeseen consequences of alternative control strategies. Robust control strategies must be built on top of in-depth understandings of the process. Thus, mechanistic models, data-driven models, or hybrid models can be used to develop successful control strategies, which can be split up into open-loop strategies, closed-loop (or feedback) strategies, fuzzy control, and model predictive control [152,153].
Open loop strategies, for example, are used when applying predefined feed rates into the process, which are entirely dependent on the initial conditions and the predetermined process conditions. Such control strategy does not require any on-line monitoring. One large drawback of these strategies is that they require precomputed knowledge profiles of growth kinetics, which is difficult in non-linear systems with a dynamically changing metabolism, as in the case of mammalian cells. Additionally, open-loop control strategies are unable to perform corrective measures when the system has deviated from the designed space as a result of disturbances impacting the process [152,153].
Closed loop control systems were designed to overcome the largest disadvantage of open loop systems, namely, the inability to provide feedback on the process as regulatory control. These controllers are of standard use for pH control, temperature control, and dissolved oxygen control [153]. Cascade control involves two feedback controllers and is used to improve the dynamic response of the controllers by distributing the disturbance over a secondary loop where corrective measures are taken without affecting the primary loop. This type of controller has been successfully applied in bioprocessing, particularly to control dissolved oxygen [154].
More sophisticated techniques involve model predictive control, where the controller response is based on a process model, which can be mechanistic, hybrid, or data-driven in origin. The model is capable of forecasting process events given process conditions and measurements from various input sensors [133]. Thus, the model is key for successful prediction and accurate response to process variations. These control methods are more computationally expensive than standard control techniques, given that various inputs must be analyzed within the model function to generate an output.
Another promising control technique for the bioprocessing industry is fuzzy control [152,153,155]. This technique does not require a complex mathematical description of the process since fuzzy logic does not require initial knowledge of the system dynamics. Fuzzy control is centered on the transformation of quantitative data into qualitative parameters. This is done by converting numerical data into a membership function, which is a value between 0 and 1 that defines the degree to which a certain variable fits a given fuzzy set. The values in the 0–1 scale are dependent on a predetermined knowledge of the range of possible values. With this information, fuzzy rules can be enacted based on experience with the process by employing conditional statements [152,153,155]. This inherently incorporates process experience into the controller by combining user knowledge and trends with past data. However, this strategy differs from data-driven models given that they can only operate within the range of the specific datasets that were used to train the model [152,153,155].

10. Concluding Remarks

Given that bioreactor modes of operation, such as fed-batch, concentrated fed-batch, and perfusion, are gaining more application within the biopharmaceutical industry, the push towards sensors that are capable of monitoring the process beyond its immediate environment (temperature, pH, DO, stirring) is gathering strength. This is because most current research is also focused on understanding the complex metabolism of mammalian cells in order to gauge what additional parameters should be monitored in order to assess what is driving/hampering the protein production. Because of this, it has been understood that amino acid concentrations in the media must be monitored as to not cause metabolic bottlenecks. The trend for increased bioprocess monitoring applies both to small-scale and large-scale bioreactors since most of the technologies tend to be independent of scale. This is especially true for spectroscopic, biochemical, and optical sensors, which are now being used at all stages of process development and biomanufacturing. Importantly, the capacity to monitor metabolic activity routinely at different vessel sizes makes it easier to transfer processes across scales. Other methods such as off-gas analyzers generally work better at higher scales given their low resolution, but work is being done in order to reduce this limitation [156].
It has also been understood that dissolved carbon dioxide should be decoupled from standard pH control and optimized on its own. It is noteworthy that, given the importance of understanding the bioprocess, standard sensors have also been applied, with the help of mechanistic models, in the development of measuring in-depth parameters such as OUR and CER. This should allow better control of the extracellular space and, in turn, enable a favorable intracellular environment. The latter is what really determines the quality and quantity of the end product. Moreover, soft sensors can play an integral role in developing process models that are able to feed back into the system dynamics to maintain culture conditions within a desired design space. For this reason, process analytical technologies (PAT) in conjunction with multivariate data analysis (MVA) and mechanistic models such as the ones covered in this review can be used alone or in conjunction to gain understanding about the system. This will help develop outcome predictions and process optimization or support the development of new control strategies that are needed to automate certain critical steps in biomanufacturing. Another aspect in which PAT monitoring technologies in conjunction with soft sensors will play a key role in the future of biomanufacturing is in the development of digital twins. These digital twins can be thought of as the simulation of bioprocess in silico. This, in turn, means that the entire bioprocess could be simulated at different scales (metabolic models, genome-based models, first principles models), which can then be used to test out various predictive control techniques before implementing changes at the bench scale and before reaching the manufacturing floor. Thus, understanding of process variation can be obtained through digital twins, which could then allow for prediction of productivity, product quality, and process attributes and forecasting of costs of future physical experiments. This itself feeds into the wider push towards industry 4.0 where advanced autonomous manufacturing systems and infrastructure can improve product output. Within this framework, performance data can be stored and mined into big data structures that can consequently be readily analyzed with the help of both artificial intelligence algorithms and mechanistic models. This maximizes the use of both historical and real-time data in order to understand what is happening in the process and how it can be leveraged to improve the manufacturing process. Hence, given the trend in the biopharmaceutical industry towards biologization of manufacturing and at the same time a wider trend of digitalization of manufacturing, the canalization of monitoring technologies should be harnessed to improve both understanding and outcomes.

Author Contributions

S.J.R., P.L.P. and O.H. were responsible for conceptualizing and editing the manuscript. Y.D. provided mentorship and valuable comments on the manuscript. All authors have read and agreed to the published version of the manuscript.

Funding

This research received funding from NRC’s Pandemic Response Challenge Program and the Natural Sciences and Engineering Research Council (RGPIN-2021-04048).

Informed Consent Statement

Not applicable.

Data Availability Statement

Not applicable.

Acknowledgments

Not applicable.

Conflicts of Interest

The authors declare no conflict of interest.

References

  1. Research, G.V. Biotechnology Market Size, Share & Trends Analysis Report by Technology (DNA Sequencing, Nanobiotechnology), by Application (Health, Bioinformatics), by Region, and Segment Forecasts, 2021–2028. Available online: https://www.grandviewresearch.com/industry-analysis/biotechnology-market (accessed on 24 July 2021).
  2. Intelligence, M. Biopharmaceuticals Market—Growth, Trends, COVID-19 Impact, and Forecasts (2021–2026). Available online: https://www.mordorintelligence.com/industry-reports/global-biopharmaceuticals-market-industry (accessed on 24 July 2021).
  3. Markets, R.A. Biopharmaceuticals Market by Type and Application—Global Opportunity Analysis and Industry Forecast, 2018–2025. Available online: https://www.researchandmarkets.com/reports/4612776/biopharmaceuticals-market-by-type-and-application (accessed on 24 July 2021).
  4. Research, G.V. Biosimilars Market Size, Share & Trends Analysis Report by Product, by Application (Oncology, Growth Hormone, Blood Disorders, Chronic & Autoimmune Disorders), by Region, and Segment Forecasts, 2018–2025. Available online: https://markets.businessinsider.com/news/stocks/biosimilars-market-size-worth-61-47-billion-by-2025-cagr-34-2-grand-view-research-inc-1027561345 (accessed on 24 July 2021).
  5. Intelligence, M. Biosimilars Market—Growth, Trends, COVID-19 Impact, and Forecasts (2021–2026). Available online: https://www.mordorintelligence.com/industry-reports/global-biosimilars-market-industry (accessed on 24 July 2021).
  6. Li, F.; Vijayasankaran, N.; Shen, A.Y.; Kiss, R.; Amanullah, A. Cell culture processes for monoclonal antibody production. mAbs 2010, 2, 466–479. [Google Scholar] [CrossRef] [PubMed] [Green Version]
  7. Lu, R.M.; Hwang, Y.C.; Liu, I.J.; Lee, C.C.; Tsai, H.Z.; Li, H.J.; Wu, H.C. Development of therapeutic antibodies for the treatment of diseases. J. Biomed. Sci. 2020, 27, 1. [Google Scholar] [CrossRef] [PubMed]
  8. Lustri, J. How to Implement Process Analytical Technology in Pharmaceutical Manufacturing. Available online: https://blog.isa.org/how-to-implement-process-analytical-technology-in-pharmaceutical-manufacturing (accessed on 27 July 2021).
  9. Uwe Kirschner, R.E.C.; Vangenechten, R.; François, K. Process Analytical Technology: An Industry Perspective. Available online: https://www.europeanpharmaceuticalreview.com/article/3643/process-analytical-technology-pharma-industry/ (accessed on 29 July 2021).
  10. John, D.O.; George, L.; Reid, I. An Introduction To Process Analytical Technology. Available online: https://www.pharmaceuticalonline.com/doc/an-introduction-to-process-analytical-technology-0001 (accessed on 28 July 2021).
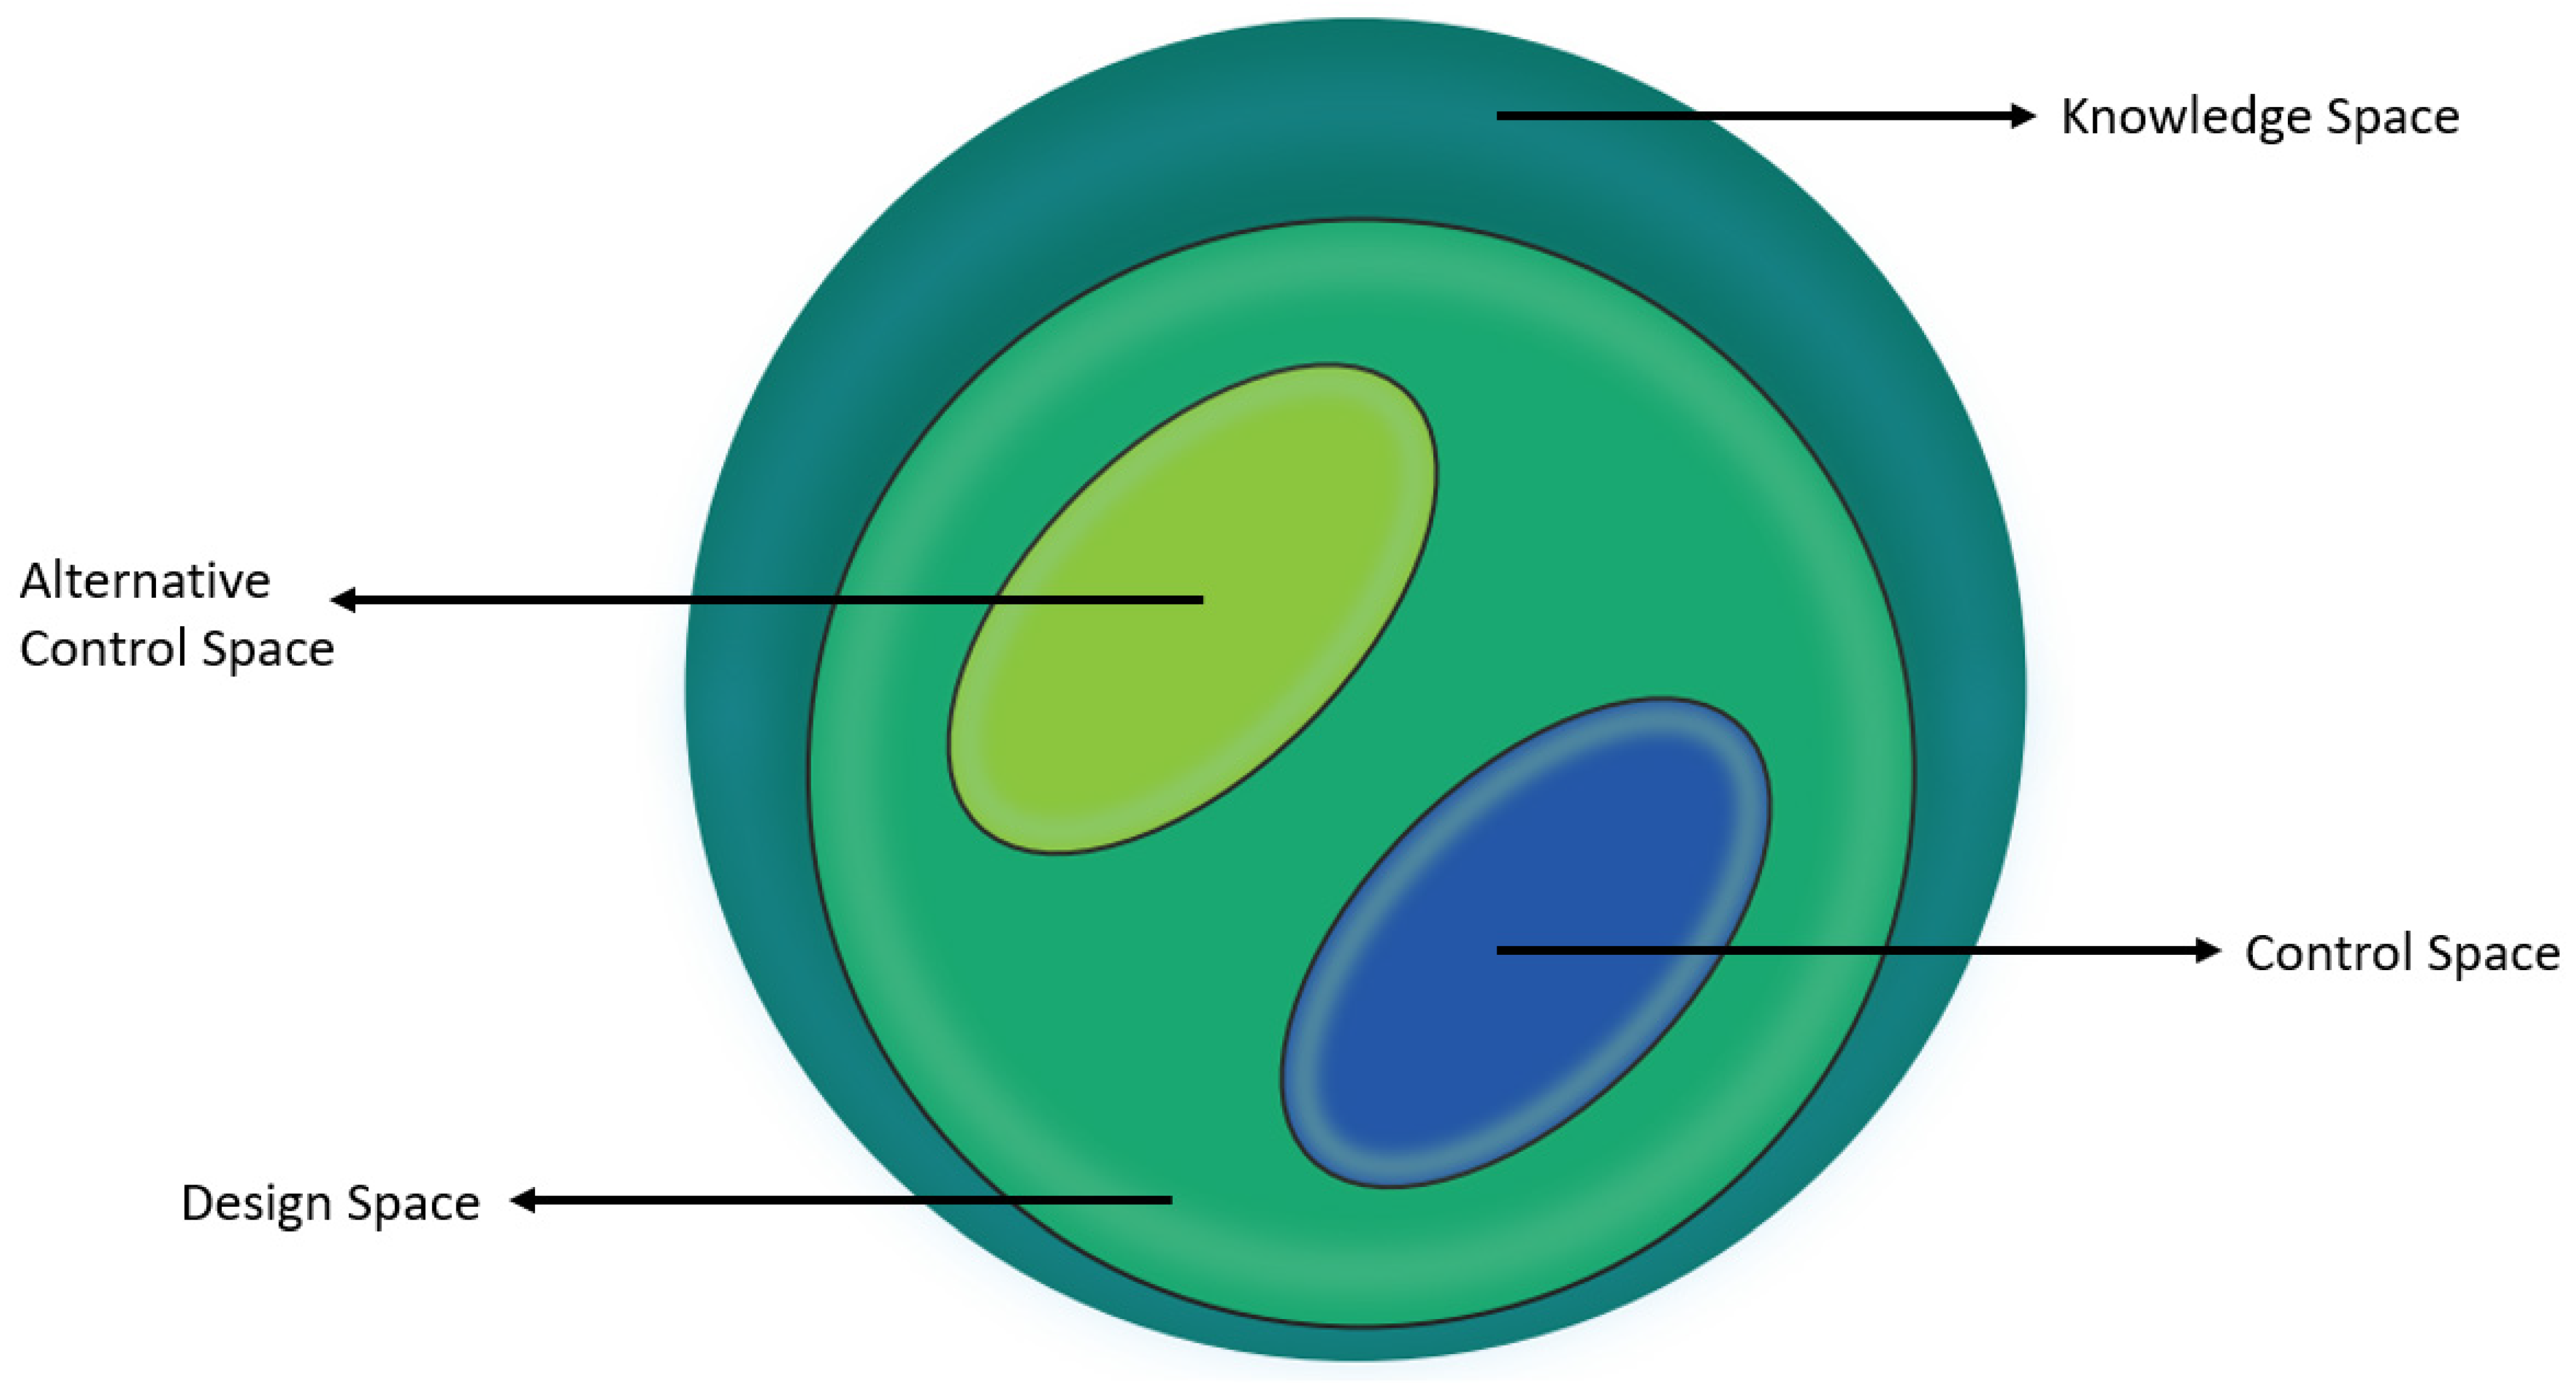
  11. Mhatre, R.; Rathore, A.S. Quality by Design: An Overview of the Basic Concepts. Qual. By Des. Biopharm. 2009, 1–8. [Google Scholar]
  12. Rathore, A.S.; Winkle, H. Quality by design for biopharmaceuticals. Nat. Biotechnol. 2009, 27, 26–34. [Google Scholar] [CrossRef] [PubMed]
  13. Doran, P.M. Bioprocess Engineering Principles; Academic Press: London, UK, 1995. [Google Scholar]
  14. Shuler, M.L.; Kargı, F.; DeLisa, M. Bioprocess Engineering: Basic Concepts; Prentice Hall: Hoboken, NJ, USA, 2017. [Google Scholar]
  15. O’Flaherty, R.; Bergin, A.; Flampouri, E.; Mota, L.M.; Obaidi, I.; Quigley, A.; Xie, Y.; Butler, M. Mammalian cell culture for production of recombinant proteins: A review of the critical steps in their biomanufacturing. Biotechnol. Adv. 2020, 43, 107552. [Google Scholar] [CrossRef]
  16. Wiegmann, V.; Giaka, M.; Martinez, C.B.; Baganz, F. Towards the development of automated fed-batch cell culture processes at microscale. BioTechniques 2019, 67, 238–241. [Google Scholar] [CrossRef] [PubMed]
  17. Chen, C.; Wong, H.E.; Goudar, C.T. Upstream process intensification and continuous manufacturing. Curr. Opin. Chem. Eng. 2018, 22, 191–198. [Google Scholar] [CrossRef]
  18. Bielser, J.-M.; Wolf, M.; Souquet, J.; Broly, H.; Morbidelli, M. Perfusion mammalian cell culture for recombinant protein manufacturing—A critical review. Biotechnol. Adv. 2018, 36, 1328–1340. [Google Scholar] [CrossRef]
  19. Wlaschin, K.F.; Hu, W.S. Fedbatch culture and dynamic nutrient feeding. Adv. Biochem. Eng. Biotechnol. 2006, 101, 43–74. [Google Scholar] [CrossRef]
  20. Yang, W.C.; Minkler, D.F.; Kshirsagar, R.; Ryll, T.; Huang, Y.M. Concentrated fed-batch cell culture increases manufacturing capacity without additional volumetric capacity. J. Biotechnol. 2016, 217, 1–11. [Google Scholar] [CrossRef] [PubMed]
  21. Hartley, F.; Walker, T.; Chung, V.; Morten, K. Mechanisms driving the lactate switch in Chinese hamster ovary cells. Biotechnol. Bioeng. 2018, 115, 1890–1903. [Google Scholar] [CrossRef] [PubMed]
  22. Pereira, S.; Kildegaard, H.F.; Andersen, M.R. Impact of CHO Metabolism on Cell Growth and Protein Production: An Overview of Toxic and Inhibiting Metabolites and Nutrients. Biotechnol. J. 2018, 13, 1700499. [Google Scholar] [CrossRef] [PubMed] [Green Version]
  23. Galleguillos, S.N.; Ruckerbauer, D.; Gerstl, M.P.; Borth, N.; Hanscho, M.; Zanghellini, J. What can mathematical modelling say about CHO metabolism and protein glycosylation? Comput. Struct. Biotechnol. J. 2017, 15, 212–221. [Google Scholar] [CrossRef] [PubMed]
  24. Locasale, J.W.; Cantley, L.C. Metabolic flux and the regulation of mammalian cell growth. Cell Metab. 2011, 14, 443–451. [Google Scholar] [CrossRef] [Green Version]
  25. Mulukutla, B.C.; Khan, S.; Lange, A.; Hu, W.-S. Glucose metabolism in mammalian cell culture: New insights for tweaking vintage pathways. Trends Biotechnol. 2010, 28, 476–484. [Google Scholar] [CrossRef]
  26. Mulukutla, B.C.; Gramer, M.; Hu, W.-S. On metabolic shift to lactate consumption in fed-batch culture of mammalian cells. Metab. Eng. 2012, 14, 138–149. [Google Scholar] [CrossRef]
  27. Ozturk, S.S.; Riley, M.R.; Palsson, B.O. Effects of ammonia and lactate on hybridoma growth, metabolism, and antibody production. Biotechnol. Bioeng. 1992, 39, 418–431. [Google Scholar] [CrossRef] [PubMed] [Green Version]
  28. Zagari, F.; Jordan, M.; Stettler, M.; Broly, H.; Wurm, F.M. Lactate metabolism shift in CHO cell culture: The role of mitochondrial oxidative activity. New Biotechnol. 2013, 30, 238–245. [Google Scholar] [CrossRef]
  29. Fan, Y.; Jimenez del Val, I.; Müller, C.; Wagtberg Sen, J.; Rasmussen, S.K.; Kontoravdi, C.; Weilguny, D.; Andersen, M.R. Amino acid and glucose metabolism in fed-batch CHO cell culture affects antibody production and glycosylation. Biotechnol. Bioeng. 2015, 112, 521–535. [Google Scholar] [CrossRef] [Green Version]
  30. Schneider, M.; Marison, I.W.; von Stockar, U. The importance of ammonia in mammalian cell culture. J. Biotechnol. 1996, 46, 161–185. [Google Scholar] [CrossRef]
  31. Martinelle, K.; Häggström, L. Effects of NH4+ and K+ on the energy metabolism in Sp2/0-Ag14 myeloma cells. Cytotechnology 1999, 29, 45–53. [Google Scholar] [CrossRef]
  32. Duarte, T.M.; Carinhas, N.; Barreiro, L.C.; Carrondo, M.J.T.; Alves, P.M.; Teixeira, A.P. Metabolic responses of CHO cells to limitation of key amino acids. Biotechnol. Bioeng. 2014, 111, 2095–2106. [Google Scholar] [CrossRef]
  33. Mohmad-Saberi, S.E.; Hashim, Y.Z.; Mel, M.; Amid, A.; Ahmad-Raus, R.; Packeer-Mohamed, V. Metabolomics profiling of extracellular metabolites in CHO-K1 cells cultured in different types of growth media. Cytotechnology 2013, 65, 577–586. [Google Scholar] [CrossRef] [Green Version]
  34. Mulukutla, B.C.; Kale, J.; Kalomeris, T.; Jacobs, M.; Hiller, G.W. Identification and control of novel growth inhibitors in fed-batch cultures of Chinese hamster ovary cells. Biotechnol. Bioeng. 2017, 114, 1779–1790. [Google Scholar] [CrossRef] [PubMed]
  35. Templeton, N.; Dean, J.; Reddy, P.; Young, J.D. Peak antibody production is associated with increased oxidative metabolism in an industrially relevant fed-batch CHO cell culture. Biotechnol. Bioeng. 2013, 110, 2013–2024. [Google Scholar] [CrossRef]
  36. Mulukutla, B.C.; Mitchell, J.; Geoffroy, P.; Harrington, C.; Krishnan, M.; Kalomeris, T.; Morris, C.; Zhang, L.; Pegman, P.; Hiller, G.W. Metabolic engineering of Chinese hamster ovary cells towards reduced biosynthesis and accumulation of novel growth inhibitors in fed-batch cultures. Metab. Eng. 2019, 54, 54–68. [Google Scholar] [CrossRef]
  37. O’Mara, P.; Farrell, A.; Bones, J.; Twomey, K. Staying alive! Sensors used for monitoring cell health in bioreactors. Talanta 2018, 176, 130–139. [Google Scholar] [CrossRef] [PubMed]
  38. Hoshan, L.; Jiang, R.; Moroney, J.; Bui, A.; Zhang, X.; Hang, T.-C.; Xu, S. Effective bioreactor pH control using only sparging gases. Biotechnol. Prog. 2019, 35, e2743. [Google Scholar] [CrossRef] [PubMed] [Green Version]
  39. Xing, Z.; Lewis, A.M.; Borys, M.C.; Li, Z.J. A carbon dioxide stripping model for mammalian cell culture in manufacturing scale bioreactors. Biotechnol. Bioeng. 2017, 114, 1184–1194. [Google Scholar] [CrossRef]
  40. Meghrous, J.; Khramtsov, N.; Buckland, B.C.; Cox, M.M.J.; Palomares, L.A.; Srivastava, I.K. Dissolved carbon dioxide determines the productivity of a recombinant hemagglutinin component of an influenza vaccine produced by insect cells. Biotechnol. Bioeng. 2015, 112, 2267–2275. [Google Scholar] [CrossRef]
  41. Biechele, P.; Busse, C.; Solle, D.; Scheper, T.; Reardon, K. Sensor systems for bioprocess monitoring. Eng. Life Sci. 2015, 15, 469–488. [Google Scholar] [CrossRef]
  42. Zhao, L.; Fu, H.Y.; Zhou, W.; Hu, W.S. Advances in process monitoring tools for cell culture bioprocesses. Eng. Life Sci. 2015, 15, 459–468. [Google Scholar] [CrossRef]
  43. Company, H. Bioprocess Monitoring and Control (Off-Line, At-Line, On-Line, In-Line/In-Situ). Available online: https://www.hamiltoncompany.com/process-analytics/process-analytical-technology/bioprocess-monitoring-and-control (accessed on 27 July 2021).
  44. Gargalo, C.L.; Udugama, I.; Pontius, K.; Lopez, P.C.; Nielsen, R.F.; Hasanzadeh, A.; Mansouri, S.S.; Bayer, C.; Junicke, H.; Gernaey, K.V. Towards smart biomanufacturing: A perspective on recent developments in industrial measurement and monitoring technologies for bio-based production processes. J. Ind. Microbiol. Biotechnol. 2020, 47, 947–964. [Google Scholar] [CrossRef]
  45. Hub, E. Introduction to Sensors and Transducers. Available online: https://www.electronicshub.org/sensors-and-transducers-introduction/ (accessed on 30 July 2021).
  46. Bhalla, N.; Jolly, P.; Formisano, N.; Estrela, P. Introduction to biosensors. Essays Biochem. 2016, 60, 1–8. [Google Scholar] [CrossRef] [Green Version]
  47. Kisaalita, W.S. Biosensor standards requirements. Biosens. Bioelectron. 1992, 7, 613–620. [Google Scholar] [CrossRef]
  48. Steinwedel, T.; Dahlmann, K.; Solle, D.; Scheper, T.; Reardon, K.F.; Lammers, F. Sensors for disposable bioreactor systems. In Single-Use Technology in Biopharmaceutical Manufacture; John Wiley & Sons Inc.: Hoboken, NJ, USA, 2019; pp. 69–82. [Google Scholar]
  49. Busse, C.; Biechele, P.; de Vries, I.; Reardon, K.F.; Solle, D.; Scheper, T. Sensors for disposable bioreactors. Eng. Life Sci. 2017, 17, 940–952. [Google Scholar] [CrossRef] [PubMed]
  50. Clavaud, M.; Roggo, Y.; von Daeniken, R.; Liebler, A.; Schwabe, J.O. Chemometrics and in-line near infrared spectroscopic monitoring of a biopharmaceutical Chinese hamster ovary cell culture: Prediction of multiple cultivation variables. Talanta 2013, 111, 28–38. [Google Scholar] [CrossRef]
  51. Sandor, M.; Rüdinger, F.; Bienert, R.; Grimm, C.; Solle, D.; Scheper, T. Comparative study of non-invasive monitoring via infrared spectroscopy for mammalian cell cultivations. J. Biotechnol. 2013, 168, 636–645. [Google Scholar] [CrossRef] [PubMed]
  52. Riley, M.R.; Crider, H.M.; Nite, M.E.; Garcia, R.A.; Woo, J.; Wegge, R.M. Simultaneous measurement of 19 components in serum-containing animal cell culture media by fourier transform near-infrared spectroscopy. Biotechnol. Prog. 2001, 17, 376–378. [Google Scholar] [CrossRef]
  53. Hakemeyer, C.; Strauss, U.; Werz, S.; Jose, G.E.; Folque, F.; Menezes, J.C. At-line NIR spectroscopy as effective PAT monitoring technique in Mab cultivations during process development and manufacturing. Talanta 2012, 90, 12–21. [Google Scholar] [CrossRef]
  54. Capito, F.; Zimmer, A.; Skudas, R. Mid-infrared spectroscopy-based analysis of mammalian cell culture parameters. Biotechnol. Prog. 2015, 31, 578–584. [Google Scholar] [CrossRef]
  55. Rosa, F.O.P.; Cunha, B.; Carmelo, J.G.; Fernandes-Platzgummer, A.; da Silva, C.L.; Calado, C.R.C. Mid-infrared spectroscopy: A groundbreaking tool for monitoring mammalian cells processes. In Proceedings of the 2017 IEEE 5th Portuguese Meeting on Bioengineering (ENBENG), Coimbra, Portugal, 16–18 February 2017; pp. 1–6. [Google Scholar]
  56. Hansen, S.K.; Jamali, B.; Hubbuch, J. Selective high throughput protein quantification based on UV absorption spectra. Biotechnol. Bioeng. 2013, 110, 448–460. [Google Scholar] [CrossRef] [PubMed]
  57. Takahashi, M.B.; Leme, J.; Caricati, C.P.; Tonso, A.; Fernández Núñez, E.G.; Rocha, J.C. Artificial neural network associated to UV/Vis spectroscopy for monitoring bioreactions in biopharmaceutical processes. Bioprocess Biosyst. Eng. 2015, 38, 1045–1054. [Google Scholar] [CrossRef] [PubMed]
  58. Drieschner, T.; Ostertag, E.; Boldrini, B.; Lorenz, A.; Brecht, M.; Rebner, K. Direct optical detection of cell density and viability of mammalian cells by means of UV/VIS spectroscopy. Anal. Bioanal. Chem. 2020, 412, 3359–3371. [Google Scholar] [CrossRef]
  59. Leme, J.; Fernández Núñez, E.G.; de Almeida Parizotto, L.; Chagas, W.A.; dos Santos, E.S.; Tojeira Prestia Caricati, A.; de Rezende, A.G.; da Costa, B.L.V.; Ventini Monteiro, D.C.; Lopes Boldorini, V.L.; et al. A multivariate calibration procedure for UV/VIS spectrometric monitoring of BHK-21 cell metabolism and growth. Biotechnol. Prog. 2014, 30, 241–248. [Google Scholar] [CrossRef] [PubMed]
  60. Li, M.; Ebel, B.; Chauchard, F.; Guédon, E.; Marc, A. Parallel comparison of in situ Raman and NIR spectroscopies to simultaneously measure multiple variables toward real-time monitoring of CHO cell bioreactor cultures. Biochem. Eng. J. 2018, 137, 205–213. [Google Scholar] [CrossRef]
  61. Teixeira, A.P.; Portugal, C.A.; Carinhas, N.; Dias, J.M.; Crespo, J.P.; Alves, P.M.; Carrondo, M.J.; Oliveira, R. In situ 2D fluorometry and chemometric monitoring of mammalian cell cultures. Biotechnol. Bioeng. 2009, 102, 1098–1106. [Google Scholar] [CrossRef] [PubMed]
  62. Teixeira, A.P.; Duarte, T.M.; Oliveira, R.; Carrondo, M.J.T.; Alves, P.M. High-throughput analysis of animal cell cultures using two-dimensional fluorometry. J. Biotechnol. 2011, 151, 255–260. [Google Scholar] [CrossRef]
  63. Teixeira, A.P.; Duarte, T.M.; Carrondo, M.J.T.; Alves, P.M. Synchronous fluorescence spectroscopy as a novel tool to enable PAT applications in bioprocesses. Biotechnol. Bioeng. 2011, 108, 1852–1861. [Google Scholar] [CrossRef] [PubMed]
  64. Claßen, J.; Graf, A.; Aupert, F.; Solle, D.; Höhse, M.; Scheper, T. A novel LED-based 2D-fluorescence spectroscopy system for in-line bioprocess monitoring of Chinese hamster ovary cell cultivations—Part II. Eng. Life Sci. 2019, 19, 341–351. [Google Scholar] [CrossRef] [Green Version]
  65. Esmonde-White, K.A.; Cuellar, M.; Uerpmann, C.; Lenain, B.; Lewis, I.R. Raman spectroscopy as a process analytical technology for pharmaceutical manufacturing and bioprocessing. Anal. Bioanal. Chem. 2017, 409, 637–649. [Google Scholar] [CrossRef] [Green Version]
  66. Abu-Absi, N.R.; Kenty, B.M.; Cuellar, M.E.; Borys, M.C.; Sakhamuri, S.; Strachan, D.J.; Hausladen, M.C.; Li, Z.J. Real time monitoring of multiple parameters in mammalian cell culture bioreactors using an in-line Raman spectroscopy probe. Biotechnol. Bioeng. 2011, 108, 1215–1221. [Google Scholar] [CrossRef] [PubMed]
  67. Xu, Y.; Ford, J.; Mann, C.; Vickers, T.; Brackett, J.; Cousineau, K.; Robey, W. Raman Measurement of Glucose in Bioreactor Materials; SPIE: Bellingham, WA, USA, 1997; Volume 2976. [Google Scholar]
  68. Whelan, J.; Craven, S.; Glennon, B. In situ Raman spectroscopy for simultaneous monitoring of multiple process parameters in mammalian cell culture bioreactors. Biotechnol. Prog. 2012, 28, 1355–1362. [Google Scholar] [CrossRef]
  69. Berry, B.; Moretto, J.; Matthews, T.; Smelko, J.; Wiltberger, K. Cross-scale predictive modeling of CHO cell culture growth and metabolites using Raman spectroscopy and multivariate analysis. Biotechnol. Prog. 2015, 31, 566–577. [Google Scholar] [CrossRef] [PubMed]
  70. Li, B.; Ray, B.H.; Leister, K.J.; Ryder, A.G. Performance monitoring of a mammalian cell based bioprocess using Raman spectroscopy. Anal. Chim. Acta 2013, 796, 84–91. [Google Scholar] [CrossRef] [PubMed] [Green Version]
  71. Webster, T.A.; Hadley, B.C.; Hilliard, W.; Jaques, C.; Mason, C. Development of generic Raman models for a GS-KOTM CHO platform process. Biotechnol. Prog. 2018, 34, 730–737. [Google Scholar] [CrossRef]
  72. Santos, R.M.; Kessler, J.M.; Salou, P.; Menezes, J.C.; Peinado, A. Monitoring mAb cultivations with in-situ raman spectroscopy: The influence of spectral selectivity on calibration models and industrial use as reliable PAT tool. Biotechnol. Prog. 2018, 34, 659–670. [Google Scholar] [CrossRef] [PubMed]
  73. Matthews, T.E.; Berry, B.N.; Smelko, J.; Moretto, J.; Moore, B.; Wiltberger, K. Closed loop control of lactate concentration in mammalian cell culture by Raman spectroscopy leads to improved cell density, viability, and biopharmaceutical protein production. Biotechnol. Bioeng. 2016, 113, 2416–2424. [Google Scholar] [CrossRef]
  74. Berry, B.N.; Dobrowsky, T.M.; Timson, R.C.; Kshirsagar, R.; Ryll, T.; Wiltberger, K. Quick generation of Raman spectroscopy based in-process glucose control to influence biopharmaceutical protein product quality during mammalian cell culture. Biotechnol. Prog. 2016, 32, 224–234. [Google Scholar] [CrossRef]
  75. Párta, L.; Zalai, D.; Borbély, S.; Putics, Á. Application of dielectric spectroscopy for monitoring high cell density in monoclonal antibody producing CHO cell cultivations. Bioprocess Biosyst. Eng. 2014, 37, 311–323. [Google Scholar] [CrossRef]
  76. Justice, C.; Brix, A.; Freimark, D.; Kraume, M.; Pfromm, P.; Eichenmueller, B.; Czermak, P. Process control in cell culture technology using dielectric spectroscopy. Biotechnol. Adv. 2011, 29, 391–401. [Google Scholar] [CrossRef] [Green Version]
  77. Zeiser, A.; Bédard, C.; Voyer, R.; Jardin, B.; Tom, R.; Kamen, A.A. On-line monitoring of the progress of infection in Sf-9 insect cell cultures using relative permittivity measurements. Biotechnol. Bioeng. 1999, 63, 122–126. [Google Scholar] [CrossRef]
  78. Metze, S.; Blioch, S.; Matuszczyk, J.; Greller, G.; Grimm, C.; Scholz, J.; Hoehse, M. Multivariate data analysis of capacitance frequency scanning for online monitoring of viable cell concentrations in small-scale bioreactors. Anal. Bioanal. Chem. 2020, 412, 2089–2102. [Google Scholar] [CrossRef] [PubMed]
  79. Moore, B.; Sanford, R.; Zhang, A. Case study: The characterization and implementation of dielectric spectroscopy (biocapacitance) for process control in a commercial GMP CHO manufacturing process. Biotechnol. Prog. 2019, 35, e2782. [Google Scholar] [CrossRef]
  80. Lu, F.; Toh, P.C.; Burnett, I.; Li, F.; Hudson, T.; Amanullah, A.; Li, J. Automated dynamic fed-batch process and media optimization for high productivity cell culture process development. Biotechnol. Bioeng. 2013, 110, 191–205. [Google Scholar] [CrossRef]
  81. Konakovsky, V.; Clemens, C.; Müller, M.M.; Bechmann, J.; Berger, M.; Schlatter, S.; Herwig, C. Metabolic Control in Mammalian Fed-Batch Cell Cultures for Reduced Lactic Acid Accumulation and Improved Process Robustness. Bioengineering 2016, 3, 5. [Google Scholar] [CrossRef] [Green Version]
  82. Konakovsky, V.; Yagtu, A.C.; Clemens, C.; Müller, M.M.; Berger, M.; Schlatter, S.; Herwig, C. Universal Capacitance Model for Real-Time Biomass in Cell Culture. Sensors 2015, 15, 22128–22150. [Google Scholar] [CrossRef] [PubMed] [Green Version]
  83. Casablancas, A.; Gámez, X.; Lecina, M.; Solà, C.; Cairó, J.J.; Gòdia, F. Comparison of control strategies for fed-batch culture of hybridoma cells based on on-line monitoring of oxygen uptake rate, optical cell density and glucose concentration. J. Chem. Technol. Biotechnol. 2013, 88, 1680–1689. [Google Scholar] [CrossRef]
  84. Goldrick, S.; Lee, K.; Spencer, C.; Holmes, W.; Kuiper, M.; Turner, R.; Farid, S.S. On-Line Control of Glucose Concentration in High-Yielding Mammalian Cell Cultures Enabled Through Oxygen Transfer Rate Measurements. Biotechnol. J. 2018, 13, e1700607. [Google Scholar] [CrossRef] [PubMed] [Green Version]
  85. Kamen, A.A.; Bédard, C.; Tom, R.; Perret, S.; Jardin, B. On-line monitoring of respiration in recombinant-baculovirus infected and uninfected insect cell bioreactor cultures. Biotechnol. Bioeng. 1996, 50, 36–48. [Google Scholar] [CrossRef]
  86. Pappenreiter, M.; Sissolak, B.; Sommeregger, W.; Striedner, G. Oxygen Uptake Rate Soft-Sensing via Dynamic kLa Computation: Cell Volume and Metabolic Transition Prediction in Mammalian Bioprocesses. Front. Bioeng. Biotechnol. 2019, 7. [Google Scholar] [CrossRef] [Green Version]
  87. Lam, H.; Kostov, Y. Optical instrumentation for bioprocess monitoring. Adv. Biochem. Eng. Biotechnol. 2009, 116, 125–142. [Google Scholar] [CrossRef]
  88. Becker, M.; Junghans, L.; Teleki, A.; Bechmann, J.; Takors, R. The Less the Better: How Suppressed Base Addition Boosts Production of Monoclonal Antibodies with Chinese Hamster Ovary Cells. Front. Bioeng. Biotechnol. 2019, 7, 76. [Google Scholar] [CrossRef] [PubMed]
  89. Xing, Z.; Kenty, B.M.; Li, Z.J.; Lee, S.S. Scale-up analysis for a CHO cell culture process in large-scale bioreactors. Biotechnol. Bioeng. 2009, 103, 733–746. [Google Scholar] [CrossRef]
  90. Doi, T.; Kajihara, H.; Chuman, Y.; Kuwae, S.; Kaminagayoshi, T.; Omasa, T. Development of a scale-up strategy for Chinese hamster ovary cell culture processes using the kLa ratio as a direct indicator of gas stripping conditions. Biotechnol. Prog. 2020, 36, e3000. [Google Scholar] [CrossRef]
  91. Heinzle, E. Present and potential applications of mass spectrometry for bioprocess research and control. J. Biotechnol. 1992, 25, 81–114. [Google Scholar] [CrossRef]
  92. Lyubarskaya, Y.; Kobayashi, K.; Swann, P. Application of mass spectrometry to facilitate advanced process controls of biopharmaceutical manufacture. Pharm. Bioprocess. 2015, 3, 313–321. [Google Scholar] [CrossRef]
  93. Behrendt, U.; Koch, S.; Gooch, D.D.; Steegmans, U.; Comer, M.J. Mass spectrometry: A tool for on-line monitoring of animal cell cultures. Cytotechnology 1994, 14, 157–165. [Google Scholar] [CrossRef] [PubMed]
  94. Goh, H.-Y.; Sulu, M.; Alosert, H.; Lewis, G.L.; Josland, G.D.; Merriman, D.E. Applications of off-gas mass spectrometry in fed-batch mammalian cell culture. Bioprocess Biosyst. Eng. 2020, 43, 483–493. [Google Scholar] [CrossRef] [PubMed] [Green Version]
  95. Floris, P.; Dorival-García, N.; Lewis, G.; Josland, G.; Merriman, D.; Bones, J. Real-time characterization of mammalian cell culture bioprocesses by magnetic sector MS. Anal. Methods 2020, 12, 5601–5612. [Google Scholar] [CrossRef]
  96. Rogers, R.S.; Nightlinger, N.S.; Livingston, B.; Campbell, P.; Bailey, R.; Balland, A. Development of a quantitative mass spectrometry multi-attribute method for characterization, quality control testing and disposition of biologics. mAbs 2015, 7, 881–890. [Google Scholar] [CrossRef] [PubMed]
  97. Luchner, M.; Gutmann, R.; Bayer, K.; Dunkl, J.; Hansel, A.; Herbig, J.; Singer, W.; Strobl, F.; Winkler, K.; Striedner, G. Implementation of proton transfer reaction-mass spectrometry (PTR-MS) for advanced bioprocess monitoring. Biotechnol. Bioeng. 2012, 109, 3059–3069. [Google Scholar] [CrossRef] [PubMed]
  98. Schmidberger, T.; Gutmann, R.; Bayer, K.; Kronthaler, J.; Huber, R. Advanced online monitoring of cell culture off-gas using proton transfer reaction mass spectrometry. Biotechnol. Prog. 2014, 30, 496–504. [Google Scholar] [CrossRef]
  99. Rogers, R.S.; Abernathy, M.; Richardson, D.D.; Rouse, J.C.; Sperry, J.B.; Swann, P.; Wypych, J.; Yu, C.; Zang, L.; Deshpande, R. A View on the Importance of “Multi-Attribute Method” for Measuring Purity of Biopharmaceuticals and Improving Overall Control Strategy. AAPS J. 2017, 20, 7. [Google Scholar] [CrossRef] [PubMed] [Green Version]
  100. Dong, J.; Migliore, N.; Mehrman, S.J.; Cunningham, J.; Lewis, M.J.; Hu, P. High-Throughput, Automated Protein A Purification Platform with Multiattribute LC–MS Analysis for Advanced Cell Culture Process Monitoring. Anal. Chem. 2016, 88, 8673–8679. [Google Scholar] [CrossRef] [PubMed]
  101. Xu, W.; Jimenez, R.B.; Mowery, R.; Luo, H.; Cao, M.; Agarwal, N.; Ramos, I.; Wang, X.; Wang, J. A Quadrupole Dalton-based multi-attribute method for product characterization, process development, and quality control of therapeutic proteins. mAbs 2017, 9, 1186–1196. [Google Scholar] [CrossRef] [PubMed]
  102. Wang, Y.; Feng, P.; Sosic, Z.; Zang, L. Monitoring glycosylation profile and protein titer in cell culture samples using ZipChip CE-MS. J. Anal. Bioanal. Tech. 2017, 8, 2. [Google Scholar] [CrossRef]
  103. Rogstad, S.; Faustino, A.; Ruth, A.; Keire, D.; Boyne, M.; Park, J. A Retrospective Evaluation of the Use of Mass Spectrometry in FDA Biologics License Applications. J. Am. Soc. Mass Spectrom. 2017, 28, 786–794. [Google Scholar] [CrossRef]
  104. Bauer, I.; Poggendorf, I.; Spichiger, S.; Spichiger-Keller, U.E.; John, G. Novel single-use sensors for online measurement of glucose. BioProcess Int. 2012, 10, 56–60. [Google Scholar]
  105. Spichiger, S.; Spichiger-Keller, U.E. New single-use sensors for online measurement of glucose and lactate: The answer to the PAT Initiative. In Single-Use Technology in Biopharmaceutical Manufacture; Eibl, R., Eibl, D., Eds.; Wiley: Hoboken, NJ, USA, 2010; pp. 295–299. [Google Scholar]
  106. Wasalathanthri, D.P.; Rehmann, M.S.; Song, Y.; Gu, Y.; Mi, L.; Shao, C.; Chemmalil, L.; Lee, J.; Ghose, S.; Borys, M.C.; et al. Technology outlook for real-time quality attribute and process parameter monitoring in biopharmaceutical development—A review. Biotechnol. Bioeng. 2020, 117, 3182–3198. [Google Scholar] [CrossRef] [PubMed]
  107. Claßen, J.; Aupert, F.; Reardon, K.F.; Solle, D.; Scheper, T. Spectroscopic sensors for in-line bioprocess monitoring in research and pharmaceutical industrial application. Anal. Bioanal. Chem. 2017, 409, 651–666. [Google Scholar] [CrossRef]
  108. Kara, S.; Mueller, J.J.; Liese, A. Online analysis methods for monitoring of bioprocesses. Chim. Oggi-Chem. Today 2011, 29, 38–41. [Google Scholar]
  109. Landgrebe, D.; Haake, C.; Höpfner, T.; Beutel, S.; Hitzmann, B.; Scheper, T.; Rhiel, M.; Reardon, K.F. On-line infrared spectroscopy for bioprocess monitoring. Appl. Microbiol. Biotechnol. 2010, 88, 11–22. [Google Scholar] [CrossRef] [PubMed]
  110. Scarff, M.; Arnold, S.A.; Harvey, L.M.; McNeil, B. Near infrared spectroscopy for bioprocess monitoring and control: Current status and future trends. Crit. Rev. Biotechnol. 2006, 26, 17–39. [Google Scholar] [CrossRef] [PubMed]
  111. Rolinger, L.; Rüdt, M.; Hubbuch, J. A critical review of recent trends, and a future perspective of optical spectroscopy as PAT in biopharmaceutical downstream processing. Anal. Bioanal. Chem. 2020, 412, 2047–2064. [Google Scholar] [CrossRef] [Green Version]
  112. Lourenço, N.D.; Lopes, J.A.; Almeida, C.F.; Sarraguça, M.C.; Pinheiro, H.M. Bioreactor monitoring with spectroscopy and chemometrics: A review. Anal. Bioanal. Chem. 2012, 404, 1211–1237. [Google Scholar] [CrossRef]
  113. Ude, C.; Schmidt-Hager, J.; Findeis, M.; John, G.T.; Scheper, T.; Beutel, S. Application of an online-biomass sensor in an optical multisensory platform prototype for growth monitoring of biotechnical relevant microorganism and cell lines in single-use shake flasks. Sensors 2014, 14, 17390–17405. [Google Scholar] [CrossRef] [Green Version]
  114. Edlich, A.; Magdanz, V.; Rasch, D.; Demming, S.; Aliasghar Zadeh, S.; Segura, R.; Kähler, C.; Radespiel, R.; Büttgenbach, S.; Franco-Lara, E.; et al. Microfluidic reactor for continuous cultivation of Saccharomyces cerevisiae. Biotechnol. Prog. 2010, 26, 1259–1270. [Google Scholar] [CrossRef]
  115. Teixeira, A.P.; Oliveira, R.; Alves, P.M.; Carrondo, M.J.T. Advances in on-line monitoring and control of mammalian cell cultures: Supporting the PAT initiative. Biotechnol. Adv. 2009, 27, 726–732. [Google Scholar] [CrossRef] [PubMed]
  116. Randek, J.; Mandenius, C.-F. On-line soft sensing in upstream bioprocessing. Crit. Rev. Biotechnol. 2018, 38, 106–121. [Google Scholar] [CrossRef]
  117. Ghisaidoobe, A.B.T.; Chung, S.J. Intrinsic tryptophan fluorescence in the detection and analysis of proteins: A focus on Förster resonance energy transfer techniques. Int. J. Mol. Sci. 2014, 15, 22518–22538. [Google Scholar] [CrossRef] [PubMed]
  118. Beutel, S.; Henkel, S. In situ sensor techniques in modern bioprocess monitoring. Appl. Microbiol. Biotechnol. 2011, 91, 1493–1505. [Google Scholar] [CrossRef]
  119. Flores-Cosío, G.; Herrera-López, E.J.; Arellano-Plaza, M.; Gschaedler-Mathis, A.; Kirchmayr, M.; Amaya-Delgado, L. Application of dielectric spectroscopy to unravel the physiological state of microorganisms: Current state, prospects and limits. Appl. Microbiol. Biotechnol. 2020, 104, 6101–6113. [Google Scholar] [CrossRef] [PubMed]
  120. Cannizzaro, C.; Gügerli, R.; Marison, I.; von Stockar, U. On-line biomass monitoring of CHO perfusion culture with scanning dielectric spectroscopy. Biotechnol. Bioeng. 2003, 84, 597–610. [Google Scholar] [CrossRef]
  121. Yardley, J.E.; Kell, D.B.; Barrett, J.; Davey, C.L. On-Line, Real-Time Measurements of Cellular Biomass using Dielectric Spectroscopy. Biotechnol. Genet. Eng. Rev. 2000, 17, 3–36. [Google Scholar] [CrossRef] [PubMed] [Green Version]
  122. Zhang, A.; Tsang, V.L.; Moore, B.; Shen, V.; Huang, Y.M.; Kshirsagar, R.; Ryll, T. Advanced process monitoring and feedback control to enhance cell culture process production and robustness. Biotechnol. Bioeng. 2015, 112, 2495–2504. [Google Scholar] [CrossRef]
  123. Ulber, R.; Frerichs, J.-G.; Beutel, S. Optical sensor systems for bioprocess monitoring. Anal. Bioanal. Chem. 2003, 376, 342–348. [Google Scholar] [CrossRef] [PubMed]
  124. Harms, P.; Kostov, Y.; Rao, G. Bioprocess monitoring. Curr. Opin. Biotechnol. 2002, 13, 124–127. [Google Scholar] [CrossRef]
  125. Hanson, M.A.; Ge, X.; Kostov, Y.; Brorson, K.A.; Moreira, A.R.; Rao, G. Comparisons of optical pH and dissolved oxygen sensors with traditional electrochemical probes during mammalian cell culture. Biotechnol. Bioeng. 2007, 97, 833–841. [Google Scholar] [CrossRef]
  126. Stine, J.M.; Beardslee, L.A.; Sathyam, R.M.; Bentley, W.E.; Ghodssi, R. Electrochemical Dissolved Oxygen Sensor-Integrated Platform for Wireless In Situ Bioprocess Monitoring. Sens. Actuators B Chem. 2020, 320, 128381. [Google Scholar] [CrossRef]
  127. Tric, M.; Lederle, M.; Neuner, L.; Dolgowjasow, I.; Wiedemann, P.; Wölfl, S.; Werner, T. Optical biosensor optimized for continuous in-line glucose monitoring in animal cell culture. Anal. Bioanal. Chem. 2017, 409, 5711–5721. [Google Scholar] [CrossRef] [PubMed]
  128. Vojinović, V.; Cabral, J.M.S.; Fonseca, L.P. Real-time bioprocess monitoring: Part I: In situ sensors. Sens. Actuators B Chem. 2006, 114, 1083–1091. [Google Scholar] [CrossRef]
  129. Xu, J.; Tang, P.; Yongky, A.; Drew, B.; Borys, M.C.; Liu, S.; Li, Z.J. Systematic development of temperature shift strategies for Chinese hamster ovary cells based on short duration cultures and kinetic modeling. mAbs 2019, 11, 191–204. [Google Scholar] [CrossRef] [PubMed] [Green Version]
  130. KDBIO. Flow Cell Biosensor for Glucose and/or Lactate. Available online: https://www.kdbio.com/products/glucose-lactate-flow-cell-biosensor/ (accessed on 22 August 2021).
  131. Luttmann, R.; Bracewell, D.G.; Cornelissen, G.; Gernaey, K.V.; Glassey, J.; Hass, V.C.; Kaiser, C.; Preusse, C.; Striedner, G.; Mandenius, C.-F. Soft sensors in bioprocessing: A status report and recommendations. Biotechnol. J. 2012, 7, 1040–1048. [Google Scholar] [CrossRef]
  132. Carrondo, M.J.T.; Alves, P.M.; Carinhas, N.; Glassey, J.; Hesse, F.; Merten, O.-W.; Micheletti, M.; Noll, T.; Oliveira, R.; Reichl, U.; et al. How can measurement, monitoring, modeling and control advance cell culture in industrial biotechnology? Biotechnol. J. 2012, 7, 1522–1529. [Google Scholar] [CrossRef]
  133. Sommeregger, W.; Sissolak, B.; Kandra, K.; von Stosch, M.; Mayer, M.; Striedner, G. Quality by control: Towards model predictive control of mammalian cell culture bioprocesses. Biotechnol. J. 2017, 12, 1600546. [Google Scholar] [CrossRef] [Green Version]
  134. Luo, Y.; Kurian, V.; Ogunnaike, B.A. Bioprocess systems analysis, modeling, estimation, and control. Curr. Opin. Chem. Eng. 2021, 33, 100705. [Google Scholar] [CrossRef]
  135. Mandenius, C.-F.; Gustavsson, R. Mini-review: Soft sensors as means for PAT in the manufacture of bio-therapeutics. J. Chem. Technol. Biotechnol. 2015, 90, 215–227. [Google Scholar] [CrossRef]
  136. Sha, S.; Huang, Z.; Wang, Z.; Yoon, S. Mechanistic modeling and applications for CHO cell culture development and production. Curr. Opin. Chem. Eng. 2018, 22, 54–61. [Google Scholar] [CrossRef]
  137. Ohadi, K.; Legge, R.L.; Budman, H.M. Development of a soft-sensor based on multi-wavelength fluorescence spectroscopy and a dynamic metabolic model for monitoring mammalian cell cultures. Biotechnol. Bioeng. 2015, 112, 197–208. [Google Scholar] [CrossRef]
  138. Narayanan, H.; Behle, L.; Luna, M.F.; Sokolov, M.; Guillén-Gosálbez, G.; Morbidelli, M.; Butté, A. Hybrid-EKF: Hybrid model coupled with extended Kalman filter for real-time monitoring and control of mammalian cell culture. Biotechnol. Bioeng. 2020, 117, 2703–2714. [Google Scholar] [CrossRef]
  139. Tsopanoglou, A.; Jiménez del Val, I. Moving towards an era of hybrid modelling: Advantages and challenges of coupling mechanistic and data-driven models for upstream pharmaceutical bioprocesses. Curr. Opin. Chem. Eng. 2021, 32, 100691. [Google Scholar] [CrossRef]
  140. Simutis, R.; Lübbert, A. Hybrid Approach to State Estimation for Bioprocess Control. Bioengineering 2017, 4, 21. [Google Scholar] [CrossRef] [Green Version]
  141. Amribt, Z.; Dewasme, L.; Wouwer, A.V.; Bogaerts, P. Parameter Identification for State Estimation: Design of an Extended Kalman Filter for Hybridoma Cell Fed-Batch Cultures. IFAC Proc. Vol. 2014, 47, 1170–1175. [Google Scholar] [CrossRef] [Green Version]
  142. Hille, R.; Brandt, H.; Colditz, V.; Classen, J.; Hebing, L.; Langer, M.; Kreye, S.; Neymann, T.; Krämer, S.; Tränkle, J.; et al. Application of Model-based Online Monitoring and Robust Optimizing Control to Fed-Batch Bioprocesses. IFAC-Pap. 2020, 53, 16846–16851. [Google Scholar] [CrossRef]
  143. Kroll, P.; Stelzer, I.V.; Herwig, C. Soft sensor for monitoring biomass subpopulations in mammalian cell culture processes. Biotechnol. Lett. 2017, 39, 1667–1673. [Google Scholar] [CrossRef] [PubMed] [Green Version]
  144. Ohadi, K.; Aghamohseni, H.; Legge, R.L.; Budman, H.M. Fluorescence-based soft sensor for at situ monitoring of chinese hamster ovary cell cultures. Biotechnol. Bioeng. 2014, 111, 1577–1586. [Google Scholar] [CrossRef] [PubMed]
  145. Schwab, K.; Amann, T.; Schmid, J.; Handrick, R.; Hesse, F. Exploring the capabilities of fluorometric online monitoring on chinese hamster ovary cell cultivations producing a monoclonal antibody. Biotechnol. Prog. 2016, 32, 1592–1600. [Google Scholar] [CrossRef] [PubMed]
  146. Kozma, B.; Salgó, A.; Gergely, S. Comparison of multivariate data analysis techniques to improve glucose concentration prediction in mammalian cell cultivations by Raman spectroscopy. J. Pharm. Biomed. Anal. 2018, 158, 269–279. [Google Scholar] [CrossRef]
  147. Rafferty, C.; O’Mahony, J.; Burgoyne, B.; Rea, R.; Balss, K.M.; Latshaw II, D.C. Raman spectroscopy as a method to replace off-line pH during mammalian cell culture processes. Biotechnol. Bioeng. 2020, 117, 146–156. [Google Scholar] [CrossRef]
  148. Bhatia, H.; Mehdizadeh, H.; Drapeau, D.; Yoon, S. In line monitoring of amino acids in mammalian cell cultures using Raman spectroscopy and multivariate chemometrics models. Eng. Life Sci. 2018, 18, 55–61. [Google Scholar] [CrossRef] [PubMed] [Green Version]
  149. Chen, Y.; Yang, O.; Sampat, C.; Bhalode, P.; Ramachandran, R.; Ierapetritou, M. Digital Twins in Pharmaceutical and Biopharmaceutical Manufacturing: A Literature Review. Processes 2020, 8, 1088. [Google Scholar] [CrossRef]
  150. Brunner, V.; Siegl, M.; Geier, D.; Becker, T. Challenges in the Development of Soft Sensors for Bioprocesses: A Critical Review. Front. Bioeng. Biotechnol. 2021, 9, 730. [Google Scholar] [CrossRef] [PubMed]
  151. Kabugo, J.C.; Jämsä-Jounela, S.-L.; Schiemann, R.; Binder, C. Industry 4.0 based process data analytics platform: A waste-to-energy plant case study. Int. J. Electr. Power Energy Syst. 2020, 115, 105508. [Google Scholar] [CrossRef]
  152. Mears, L.; Stocks, S.M.; Sin, G.; Gernaey, K.V. A review of control strategies for manipulating the feed rate in fed-batch fermentation processes. J. Biotechnol. 2017, 245, 34–46. [Google Scholar] [CrossRef]
  153. Rathore, A.S.; Mishra, S.; Nikita, S.; Priyanka, P. Bioprocess Control: Current Progress and Future Perspectives. Life 2021, 11, 557. [Google Scholar] [CrossRef]
  154. Velez-Suberbie, M.L.; Betts, J.P.J.; Walker, K.L.; Robinson, C.; Zoro, B.; Keshavarz-Moore, E. High throughput automated microbial bioreactor system used for clone selection and rapid scale-down process optimization. Biotechnol. Prog. 2018, 34, 58–68. [Google Scholar] [CrossRef]
  155. Honda, H.; Kobayashi, T. Fuzzy control of bioprocess. J. Biosci. Bioeng. 2000, 89, 401–408. [Google Scholar] [CrossRef]
  156. Anderlei, T.; Schulte, A.; Laidlaw, D. Kuhner TOM for off-gas analysis in shake flasks. In Proceedings of the Recent Advances in Fermentation Technology (RAFT 13), Bonita Springs, FL, USA, 27–30 October 2019. [Google Scholar]
Figure 1. Knowledge, design, and control spaces. The knowledge space is a non-design space that requires regulatory approval. The design space is the pre-approved process by the regulatory body, while the control space is the process configuration of the biomanufacturing process.
Processes 10 00189 g001
Figure 2. Batch and fed-batch bioreactor operations. During fed-batch operation, nutrients are fed continuously or periodically (bolus) to the system to control overall substrate concentration. Conversely, during a batch cultivation, no feed is added to the system nor is any medium extracted.
Processes 10 00189 g002
Figure 3. Concentrated fed-batch and perfusion modes of operation. Perfusion systems continuously replenish medium into the reactor while spent media are continually extracted. Cells are separated from the extracted media and recycled back into the stirred tank reactor. In a concentrated fed-batch system, concentrated feed formulations are added while extracting spent media. However, an ultrafiltration module is used to recycle back both cells and product into the system.
Processes 10 00189 g003
Figure 4. Schematic of the glycolysis pathway and TCA cycle. Two ATPs are formed in the glycolytic pathway while 36 ATPs are generated through the oxidative pathway.
Processes 10 00189 g004
Figure 5. Different sensor types used in cell culture monitoring. In-line sensors are also referred to as in situ sensors because they are sterilized and placed within the reactor. At-line sensors require an alternative flow loop to realize measurements; this alternate flow is closed off from the environment to ensure sterility. Off-line sensors require sampling from the reactor and specialized lab equipment to analyze. Within this definition, both in-line and at-line sensors can be considered to be on-line.
Processes 10 00189 g005
Figure 6. Sensor techniques and their application in process monitoring on-line and off-line. * Italic text shows the desirable online measurements that are currently estimated offline.
Processes 10 00189 g006
Figure 7. Outline of how different hardware sensor data are integrated into soft sensors and how historical data storage can further intensify cell culture processes.
Processes 10 00189 g007
Table 1. Measured process variables.
Variable TypeBioprocess ParameterSensor Type
PhysicalTemperature Thermostat, thermistor
Foam Conductance
Viscosity Viscometer
Pressure Capacitance
Stirring Torque
ChemicalOxygen Optical, electrochemical
pH Electrochemical, optical
Lactate Spectroscopic,
biochemical
Glucose Spectroscopic, biochemical
Carbon Dioxide Optical, electrochemical
BiologicalCell count (viable cell density, total cell density, viability, cell size, aggregation)Microscopy, spectroscopic
Protein Spectroscopy
Cellular morphology Flow cytometry, spectroscopic
Intermediate metabolites Spectroscopy
Table 2. Important sensor characteristics [41,45,46,47].
Characteristic Definition Remarks
Selectivity Ability to detect analyte of interest or a group of analytes.One example of selectivity in a biosensor is the interaction of an antigen with the antibody.
Reproducibility Capacity of the sensor to generate identical responses in separate experimental runs.This is usually characterized by measuring variance, standard deviation, or coefficient of variation. This is important in bioprocess, given that manufacturing runs depend on specific sensors that are reused as in the case of stainless-steel or glass bioreactors.
AccuracyAbility of the sensor to determine a mean value similar to the true value when the analyte is measured more than once.It is generally expressed as a percentage of full-range output. If the accuracy of the sensor is high, the difference between the measured analyte value and the real analyte value is small.
StabilityCapacity of the sensor to produce an identical output for a constant input over a certain period of time.It represents the degree of susceptibility that the sensor has to environmental disturbances. Over compounded time, such disturbances can generate a drift in output signals.
Sensitivity Magnitude of output signal per unit change in the variable of interest. It is the relationship between the input physical signal and the output electrical signal.The sensitivity can also be described as the Limit Of Detection (LOD) of the sensor, which is the concentration at which the mean output signal value is equal to two standard deviations. If a sensor possesses both high selectivity and high sensitivity, it is able to detect and quantify small concentrations of the analyte of interest in the presence of various substances.
Resolution Smallest change in variable that is sufficient to elicit a response from the sensor.This is key in metabolite monitoring where concentrations within the cell culture broth can be very low and, thus, differentiating slight changes of small concentrations is critical.
Linearity Accuracy of the output response with respect to a straight line.Non-linearity is an indication of deviation of the measurements from the curve of ideal measurement.
Response time Speed of change in an output signal relative to a stepwise change of the input variable. Response time should be small relative to the measured process dynamics given that long response times complicate efficient control of the process.
Robustness Durability of the sensor when subjected to varying environmental conditions. This is key in sensors that undergo sterilization and sensors that will be used on-line for long periods.
Table 3. Overview of available sensors and techniques for process monitoring and control.
TechniqueSensing AttributesReferencesDeveloper
NIR spectroscopy Glucose, lactate,
glutamine, and ammonia
[50,51,52,53]Matrix F FT-NIR, Bruker, Billerica, MA, USA
Fossanalytics, Hillerød, Denmark
FossNIRSystems Inc., Silver Spring, MD, USA
ABB Bomem FT-NIR spectrophotometer, Quebec City, QC, Canada
Antaris II MX, Thermo Fisher Scientific, Madison, WI, USA
Sartorius Stedim Biotech GmbH, Göttingen, Germany
MIR spectroscopyCell density, cell viability, lactate dehydrogenase (LDH), secreted antibody, glutamate, lactate, glucose, glutamine, ammonia. [54,55]Merck Millipore, Danvers, MA, USA
MATRIX-MF, Bruker Optik GmbH, Ettlingen, Germany
Mettler Toledo AutoChem, Inc., Columbia, SC, USA
UV-Vis spectroscopy Cell density, viability, glutamine, glutamate, glucose, lactate. [56,57,58,59,60]J&M Analytik AG, Esslingen, Germany
Thermo Fisher Scientific, Waltham, MA, USA
Fluorescence spectroscopy Cell density, cell viability, recombinant protein, glucose, and ammonia concentrations.[61,62,63,64]J&M Analytik AG, Essingen, Germany
LabX, Midland, ON, Canada
Cary Eclipse CA, USA
BioView, Delta Light and Optics, Denmark
Horiba Jobin Yvon Fluoromax-4, Kyoto, Japan
Raman spectroscopyGlycoprotein yield,
Glucose, glutamine, lactate, ammonia, glutamate, cell density and viability
[65,66,67,68,69,70,71,72,73,74]VALON Instruments Ltd., Belfast, United Kingdom
Kaiser Optical Instruments, Ann Arbor, MI, USA.
Perkin-Elmer, Waltham, MA, USA
Dielectric spectroscopy Cell density and viability, viable cell volume[75,76,77,78,79,80,81,82]Aber instruments, Aberystwyth, United Kingdom
Hamilton, NV, USA
* Optical sensors: O2Dissolved oxygen (DO) [83,84,85,86]Ocean Insight, Orlando, FL, USA
Presens, Regensburg, Germany
Mettler Toledo, Greifensee, Switzerland.
Hamilton, NV, USA
* Optical sensors: pHpH[41,87]Pyroscience, Aachen, Germany
Presens, Regensburg, Germany
Mettler Toledo, Greifensee, Switzerland
Hamilton, NV, USA
* Optical sensors: CO2Dissolved CO2[38,88,89,90]Presens, Regensburg, Germany
Mettler Toledo, Greifensee, Switzerland
Hamilton, NV, USA
Mass spectrometry CO2, O2
Volatile organic compounds
Aglycosylation, glycosylation, and glycation profiles
[91,92,93,94,95,96,97,98,99,100,101,102,103]Q Exactive, Thermo Fisher Scientific, Winsford, UK
Ionimed Analytik, Innsbruck, Austria
Xevo G2-XS Q-TOF, Waters, Milford, CT, USA
Free-floating wireless sensorsTemperature, conductivity, pH, pressure, and turbidity[49]smartCAPS, smartINST, Lyon, France
BiosensorsGlucose, lactate, glutamate[104,105]C-CIT Sensors AG, Switzerland
* These technologies are available as single-use sensors.
Publisher’s Note: MDPI stays neutral with regard to jurisdictional claims in published maps and institutional affiliations.

