Article

Velocity String Drainage Technology for Horizontal Gas Wells in Changbei

College of Petroleum Engineering, Xi’an Shiyou University, No. 18, Electronic Second Road, Yanta District, Xi’an 710065, China
*
Authors to whom correspondence should be addressed.
Processes 2022, 10(12), 2640; https://doi.org/10.3390/pr10122640
Submission received: 8 November 2022 / Revised: 1 December 2022 / Accepted: 5 December 2022 / Published: 8 December 2022

Abstract

:
The Changbei gas field is dominated by wells with large horizontal displacement, which have exhibited high gas production performance at an early stage of development. With the decrease in reservoir pressure, the liquid loading in the gas well is relatively high and gas production rapidly decreases. Therefore, suitable drainage measures are required to maintain stable gas production. Based on the characteristics of the unconnected oil jacket of gas wells in Changbei, a velocity string was used for drainage. A critical liquid-carrying model was established to determine the location of liquid loading in horizontal gas wells in Changbei. First, the coefficients of the liquid-carrying model were determined through theoretical analysis of the characteristics of the gas well formation. Then, the depth setting of the velocity string was analyzed. The critical liquid-carrying model was employed to calculate the liquid-carrying flow rate of each section; the calculated flow rates were compared with the actual flow rates to determine whether fluid accumulation occurred in each section of the gas well. Thereafter, with the help of the oil and casing position, the suitable setting position of the velocity string was determined. The formation fluid was driven from the tubing into the casing owing to the increase in the overflow area, based on the principle of reducer fluid mechanics. The fluid velocity in the larger overflow cross-section decreased, thereby reducing the drainage capacity of the gas well and resulting in liquid loading. Finally, a timing analysis was performed. After the formation pressure decreased, the well production and flow rate changes were analyzed by placing two velocity strings of different sizes at different wellhead pressures in the gas well with fluid accumulation. The results indicated that although the velocity string was set at a position suitable for fluid drainage, fluid accumulation still occurred after a production period, thus necessitating replacement deliquification.

1. Introduction

The Changbei block is situated in the northcentral part of the Ordos Basin, which is rich in natural gas and is a low-permeability and low-porosity gas reservoir. The study area is currently dominated by horizontal wells with open hole completions. The initial production performance of a gas wells was high; however, after years of exploitation, the formation energy considerably decreased, the pressure declined [1], and the gas volume decreased. Natural gas cannot carry liquids normally, resulting in fluid accumulation and even depleted production in serious cases [2,3,4]. Thus, determining the drainage scheme is a crucial step.
The commonly used drainage solutions include the gas lift, plunger lift, foam drainage, optimizing string (velocity string), and other processes. Gas lifting is an effective method to solve gas well liquid loading, and this process has achieved great success in the former Soviet Union, Romania, the United States, Canada, and other countries [5,6,7]. In China, the gas lift process has been widely used in various gas fields, and 416 water-producing gas wells in the ChuanNan gas field produced 61.52 × 10⁸ m3 of additional natural gas by applying the gas lift process [8]. Based on the gas lift process, the plunger lift process uses a plunger as a gas–liquid partition interface to achieve efficient discharge of accumulated fluid; this has been used in gas wells with high gas–liquid ratios to achieve reproduction with only the gas energy stored in the well itself. Avery and Evans et al. proposed a general plunger lift model to match the production capacity of the reservoir with the plunger dynamics and maximize the fluid production [9]. Chen Kegui et al. optimized the plunger lift construction tools and procedures according to the special well structure of the directional wells in the Sugri gas field and the liquid loading characteristics of the gas wells to guarantee the smooth passage of the tool string through the deflecting section [10]. With reference to a well in Kazakhstan, Nurkas discussed the conditions for well selection and the benefits of applying the plunger lift process and found that installing a plunger lift system is a more economical choice [11]. However, the plunger lift process is often ineffective for wells with low gas production and high liquid loading, and the high failure rate of the surface control system also affects the normal production of gas wells [12]. The foam drainage is another widely used measure, which was first applied in the Krasnodar gas field in the former Soviet Union and then in the Oklahoma and Kansas gas fields in the United States, with an efficiency rate of over 90% [13,14,15]. Ge Lei and Busahmin et al. thoroughly discussed the mechanism of increasing the production of the foam drainage agent [16,17]. However, there is still a lack of theoretical basis and in-depth research on the temperature resistance and the foam stability of the drainage agents [18]. Most gas produced in Changbei block percolates into the permanent packers with the tubing, and the oil jacket is not connected. Thus, the casing pressure cannot be monitored, and processes such as the annular injection of the foam drainage agent or gas lift cannot be employed. The velocity string technique is relatively simple, requires a short construction period, is convenient to maintain, and thus exhibits favorable adaptability in the block [19].
The velocity string method has been analyzed by several scholars from different perspectives. Zhao binbin et al. investigated the applicable conditions for velocity string drainage and gas recovery technology [20]. Goedmoed et al. discovered that operational parameters, such as the production formation pressure, liquid and gas production, diameter of coiled tubing, setting depth, wellhead, and bottomhole flow pressure, influence the production performance of the velocity string [21]. Wang haoru et al. assessed the cost and economics of velocity string installation in gas wells under different stages of gas production decline [22]. Bagis et al. analyzed the relationship between the reservoir inflow performance relationship (IPR) curves and the tubing outflow performance curves (J curves) to determine whether the different velocity string design schemes could sustain gas well production [23]. However, several factors influence the effectiveness of the velocity string method in the Changbei block. First, the position of the liquid loading in horizontal wells is unclear, resulting in the poor setting position of the velocity string. Second, with the implementation of the drainage measure, the productivity decreases and wellbore liquid loading occurs. To address these problems, this study explored methods used domestically and internationally for determining liquid loading in gas wells and selected the critical liquid-carrying method [24,25] to determine the location of the liquid loading in gas wells. This study also designed a method to determine the relevant coefficients in the liquid-carrying model for the casing program of the gas wells in the Changbei block. The results can enhance the understanding of the fluid-prone location of horizontal wells and the velocity of the tubular column entry of gas wells in the Changbei block.

2. Horizontal Gas Well Liquid-Carrying Theory

2.1. Critical Liquid-Carrying Model Coefficient

Common critical liquid-carrying models include the Turner [26], Coleman [27], Li Min [28], and Fernando models [29]. These models are based on different assumptions and different critical fluid-carrying flow rate models, as listed in Table 1.
As displayed in Table 1, the calculation model is formally the same formula, but the coefficients of the critical liquid-carrying flow rate are different. The different liquid-carrying model coefficients reflect improvements in the critical liquid-carrying model of gas wells in the following ways: (1) adding correction coefficients to the model or subtracting them from the model according to the actual measured data of the gas wells (Coleman model); (2) analyzing the shape and size of the droplets and the drag coefficient (Li Min model); (3) adding the correction of the tilt angle to the model according to the well type (Fernando model).

2.2. Method for Determining Model Coefficient

The critical liquid-carrying models for gas wells face several problems [30,31,32]. First, these models are applicable to specific well types (vertical or inclined), whereas most wells in the Changbei block have large-displacement horizontal wells. The structure of a well comprises both inclined and vertical sections; those models do not consider the influence of the change of the whole wellbore structure on the wellbore flow pattern and the liquid carrying. The liquid accumulation should be judged by the increase in the liquid volume in the whole wellbore and the liquid fallback degree of the sections, and not simply by the liquid fallback of a section. In addition, most liquid-carrying models are based on theoretical assumptions and laboratory experiments, which have certain limitations. The well structures of the horizontal wells at different engineering sites in the Changbei block are slightly different. Therefore, the results obtained through the direct application of existing liquid-carrying models are largely different from the actual results.
To address the aforementioned problems, a critical liquid-carrying calculation model should be established to simulate the entire wellbore of a single horizontal well in the Changbei block, according to the measured data for the well structure in the Changbei block and the liquid-carrying models of inclined and vertical sections listed in Table 1. The basic process of calculation followed in this study is detailed as follows:
(1)
The data obtained from the period of the gas well accumulation were selected and then incorporated into the three liquid-carrying models of the vertical section to calculate the liquid-carrying flow rates in each section of the wellbore, and the calculated flow rates were compared with actual flow rates. If the actual flow rates were larger than the flow rates calculated by the Turner, Coleman, and Li Min models, a judgment factor M was selected based on the Kd value for the inclined section.
v c = M σ ρ l ρ g ρ g 2 0.25
M is the coefficient with values 5.48, 4.45, and 2.5 for the Turner, Coleman, and Li Min models, respectively.
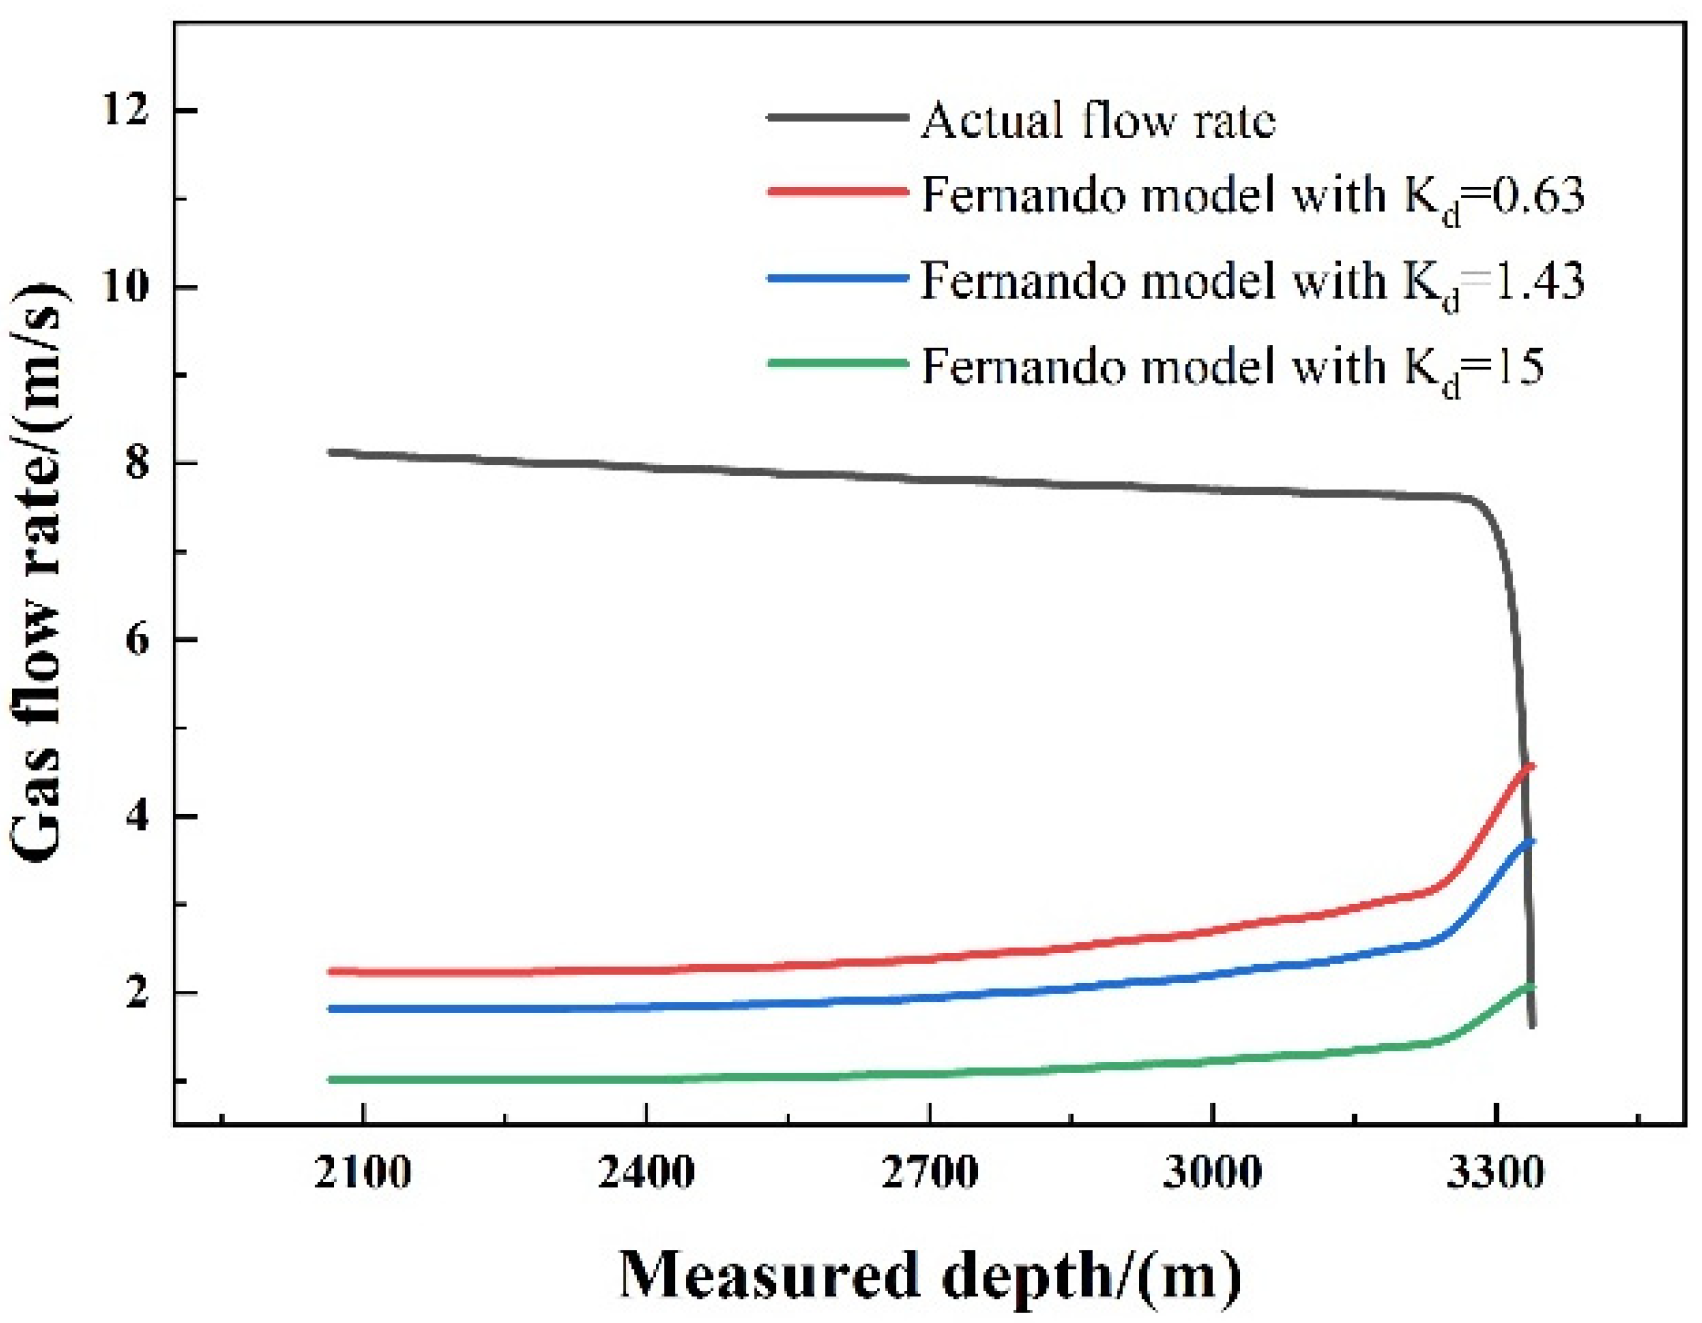
(2)
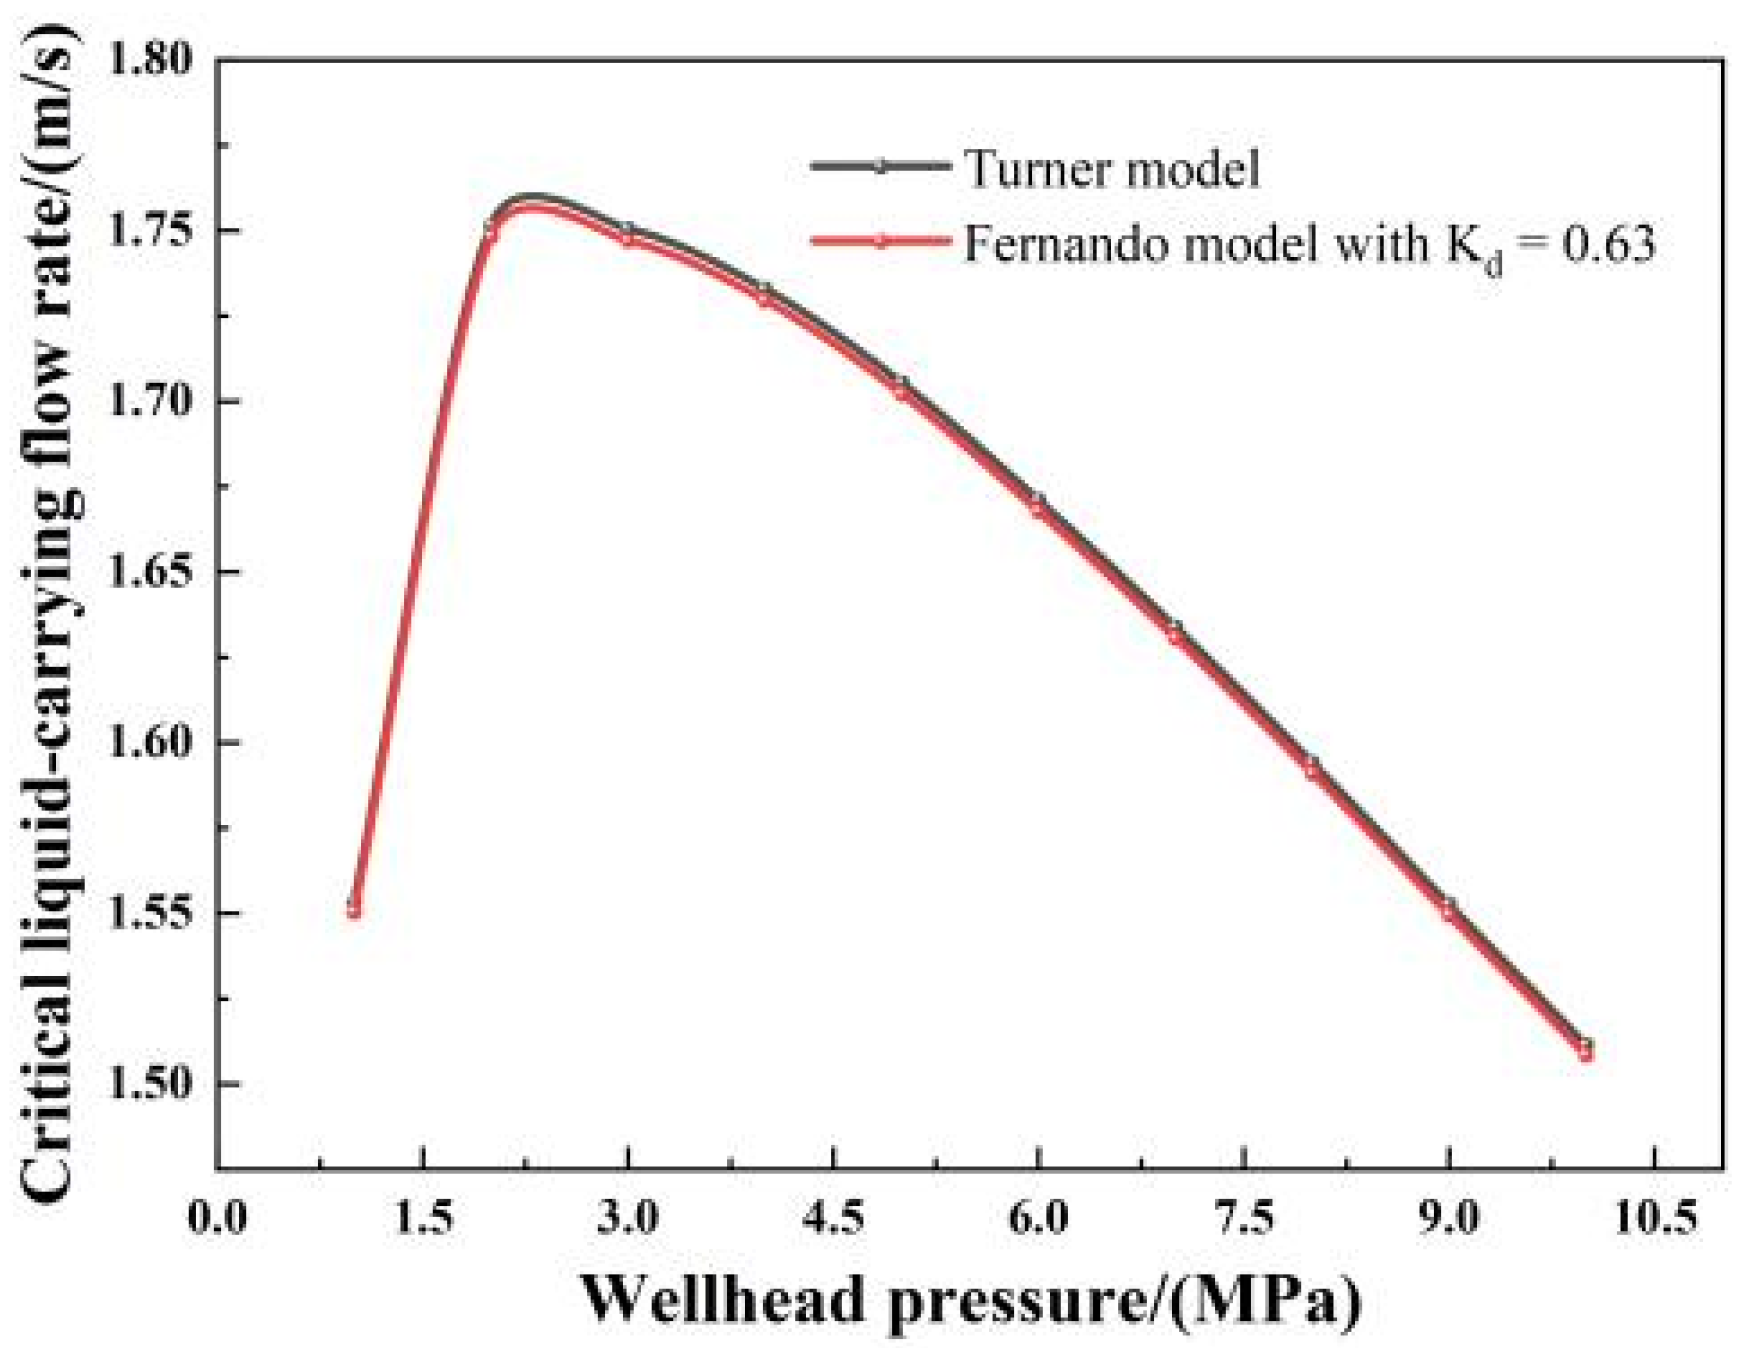
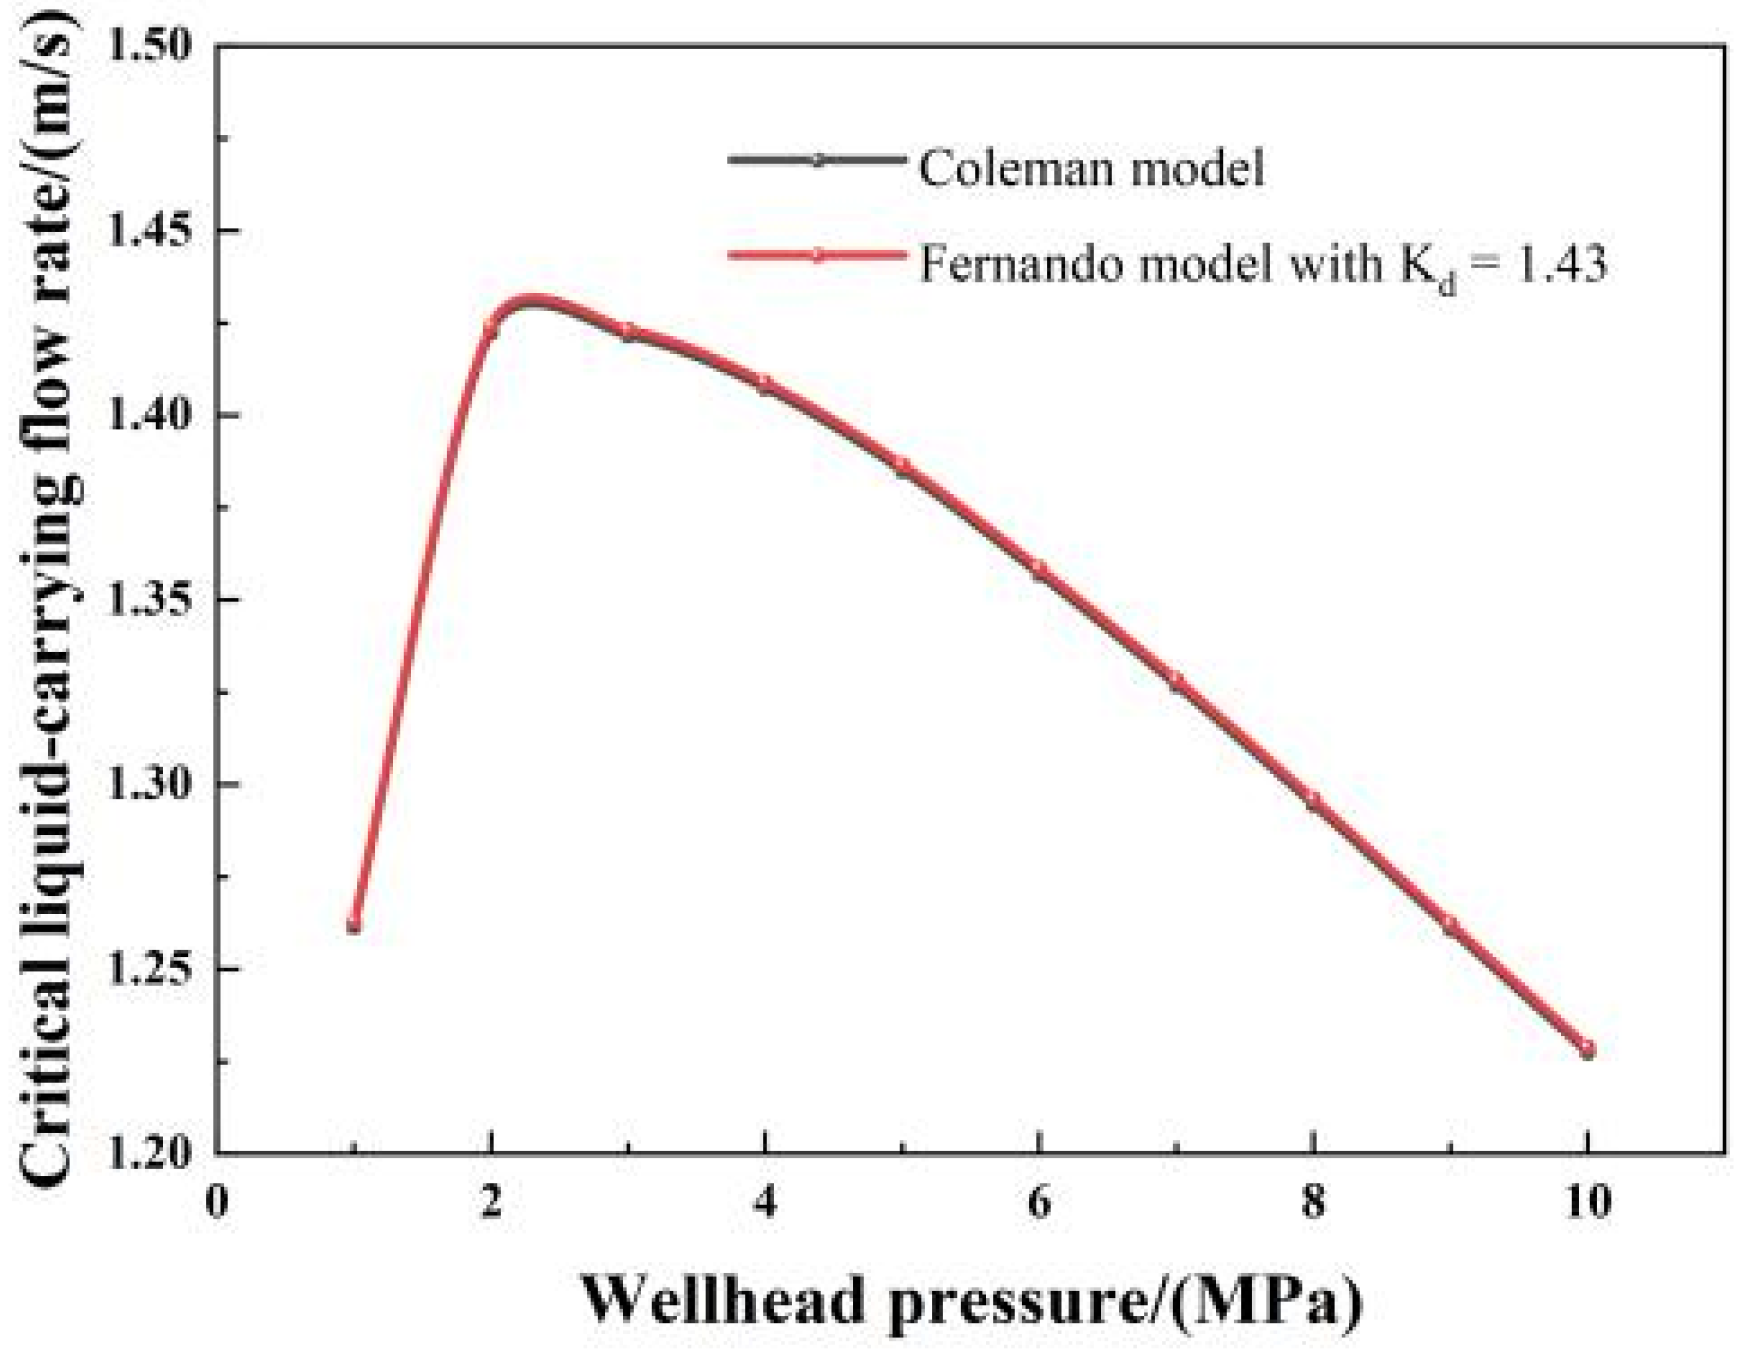
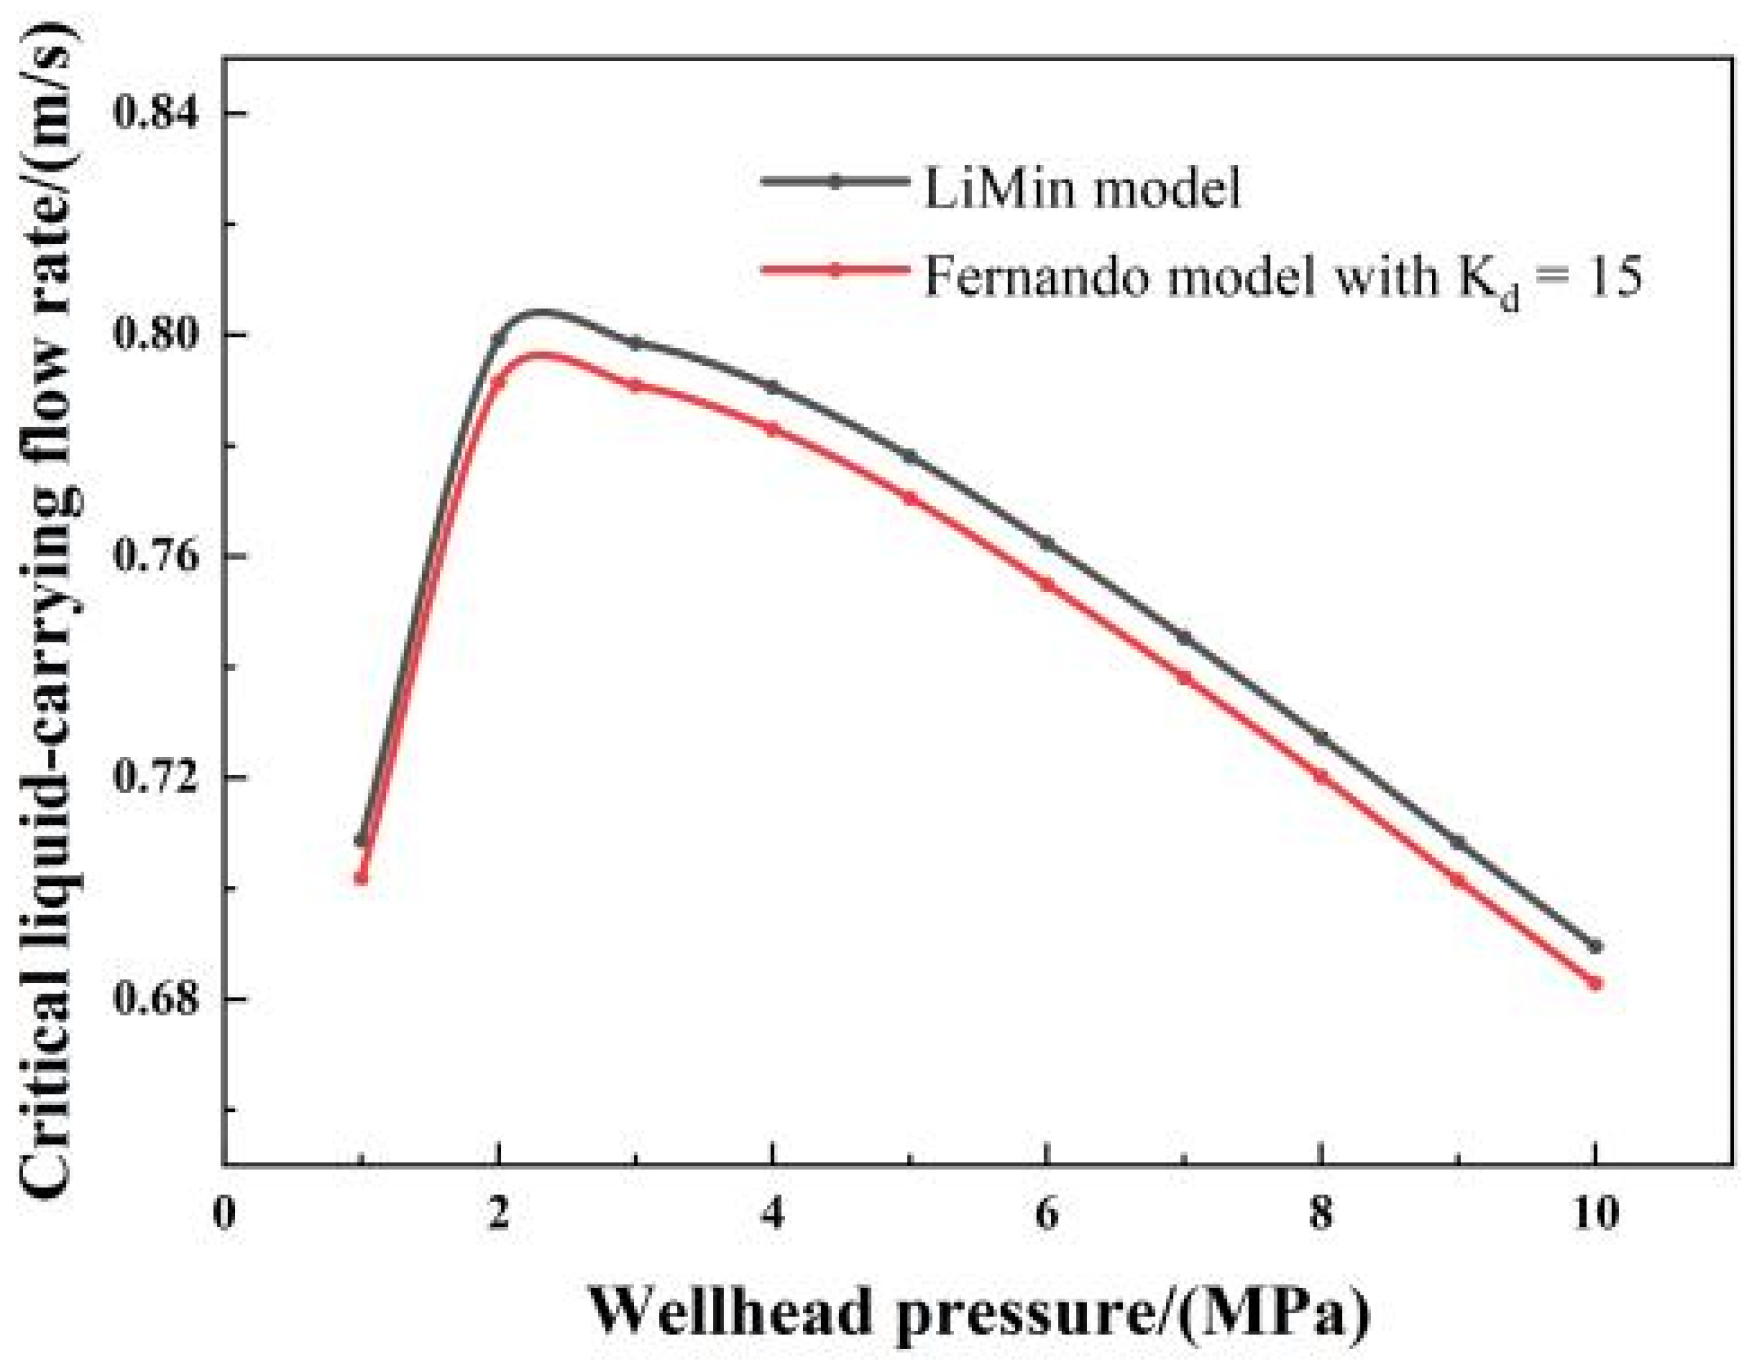
The kickoff point [33] was selected to match the critical liquid-carrying capacity of both the vertical and inclined sections. The wellhead was varied to calculate the flow rates using the Turner, Coleman, and Li Min models under the original formation pressure. Furthermore, the Fernando model was fitted to the flow rates. The different values of Kd were obtained according to the fitting.
v s c r i t = 4.86 σ ρ l ρ g K d c o s α ρ g 2 0.25
(3)
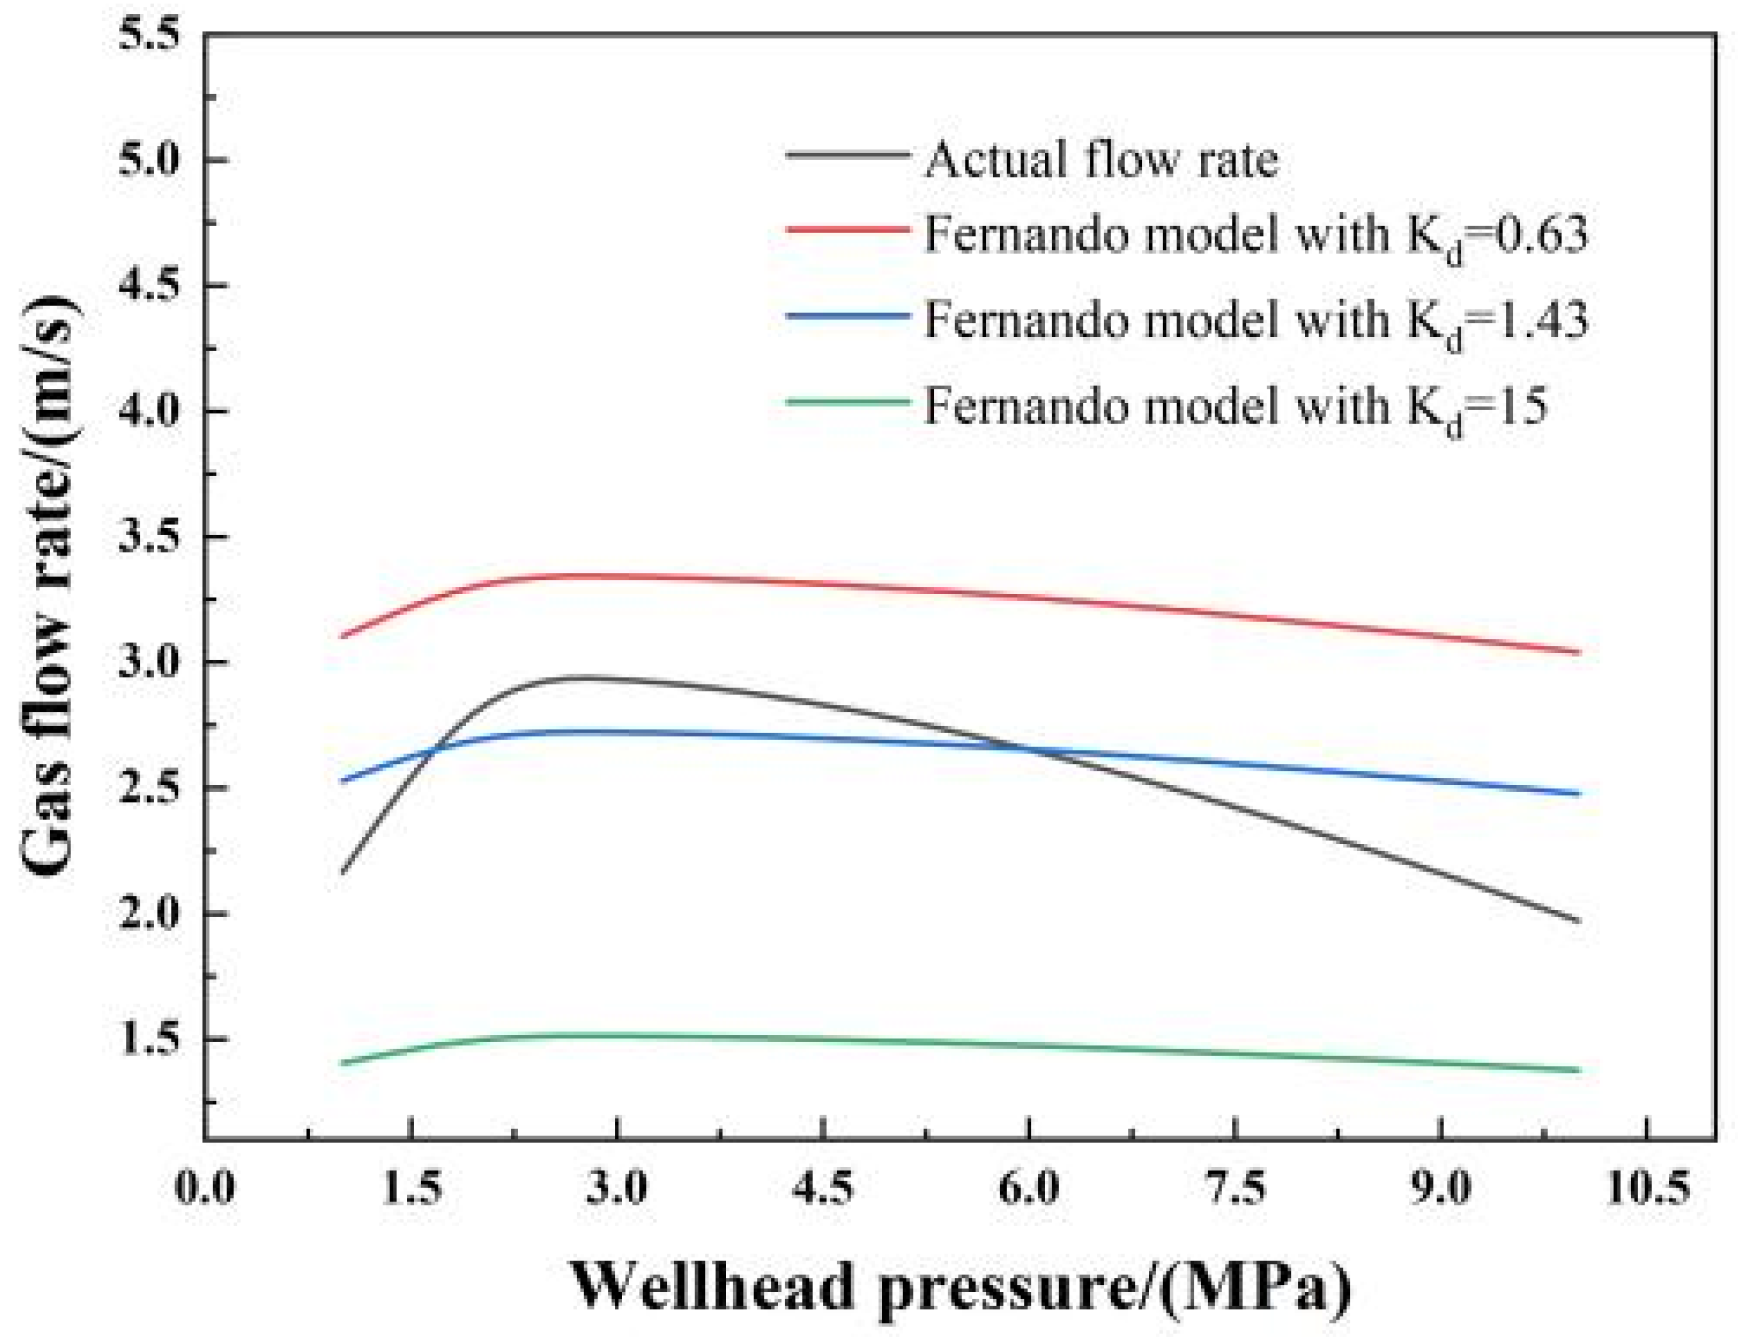
A point at the base of the inclined part was selected because fluid does not accumulate in gas wells under the original formation pressure. Critical liquid-carrying flow rates for different values of Kd under this condition were calculated and compared with actual flow rates to determine and analyze the most appropriate drag coefficient Kd and coefficient M.
(4)
The applicability of the drag coefficient Kd and the coefficient M was verified. The data of the initial liquid loading period was incorporated into the liquid-carrying model of the inclined part of the wellbore, and the liquid-carrying flow rate at each position of the inclined part of the wellbore was calculated and compared with actual flow rates to verify the accuracy of the coefficients.

3. Analysis of Velocity String Setting Depth

3.1. Method for Determining Setting Depth
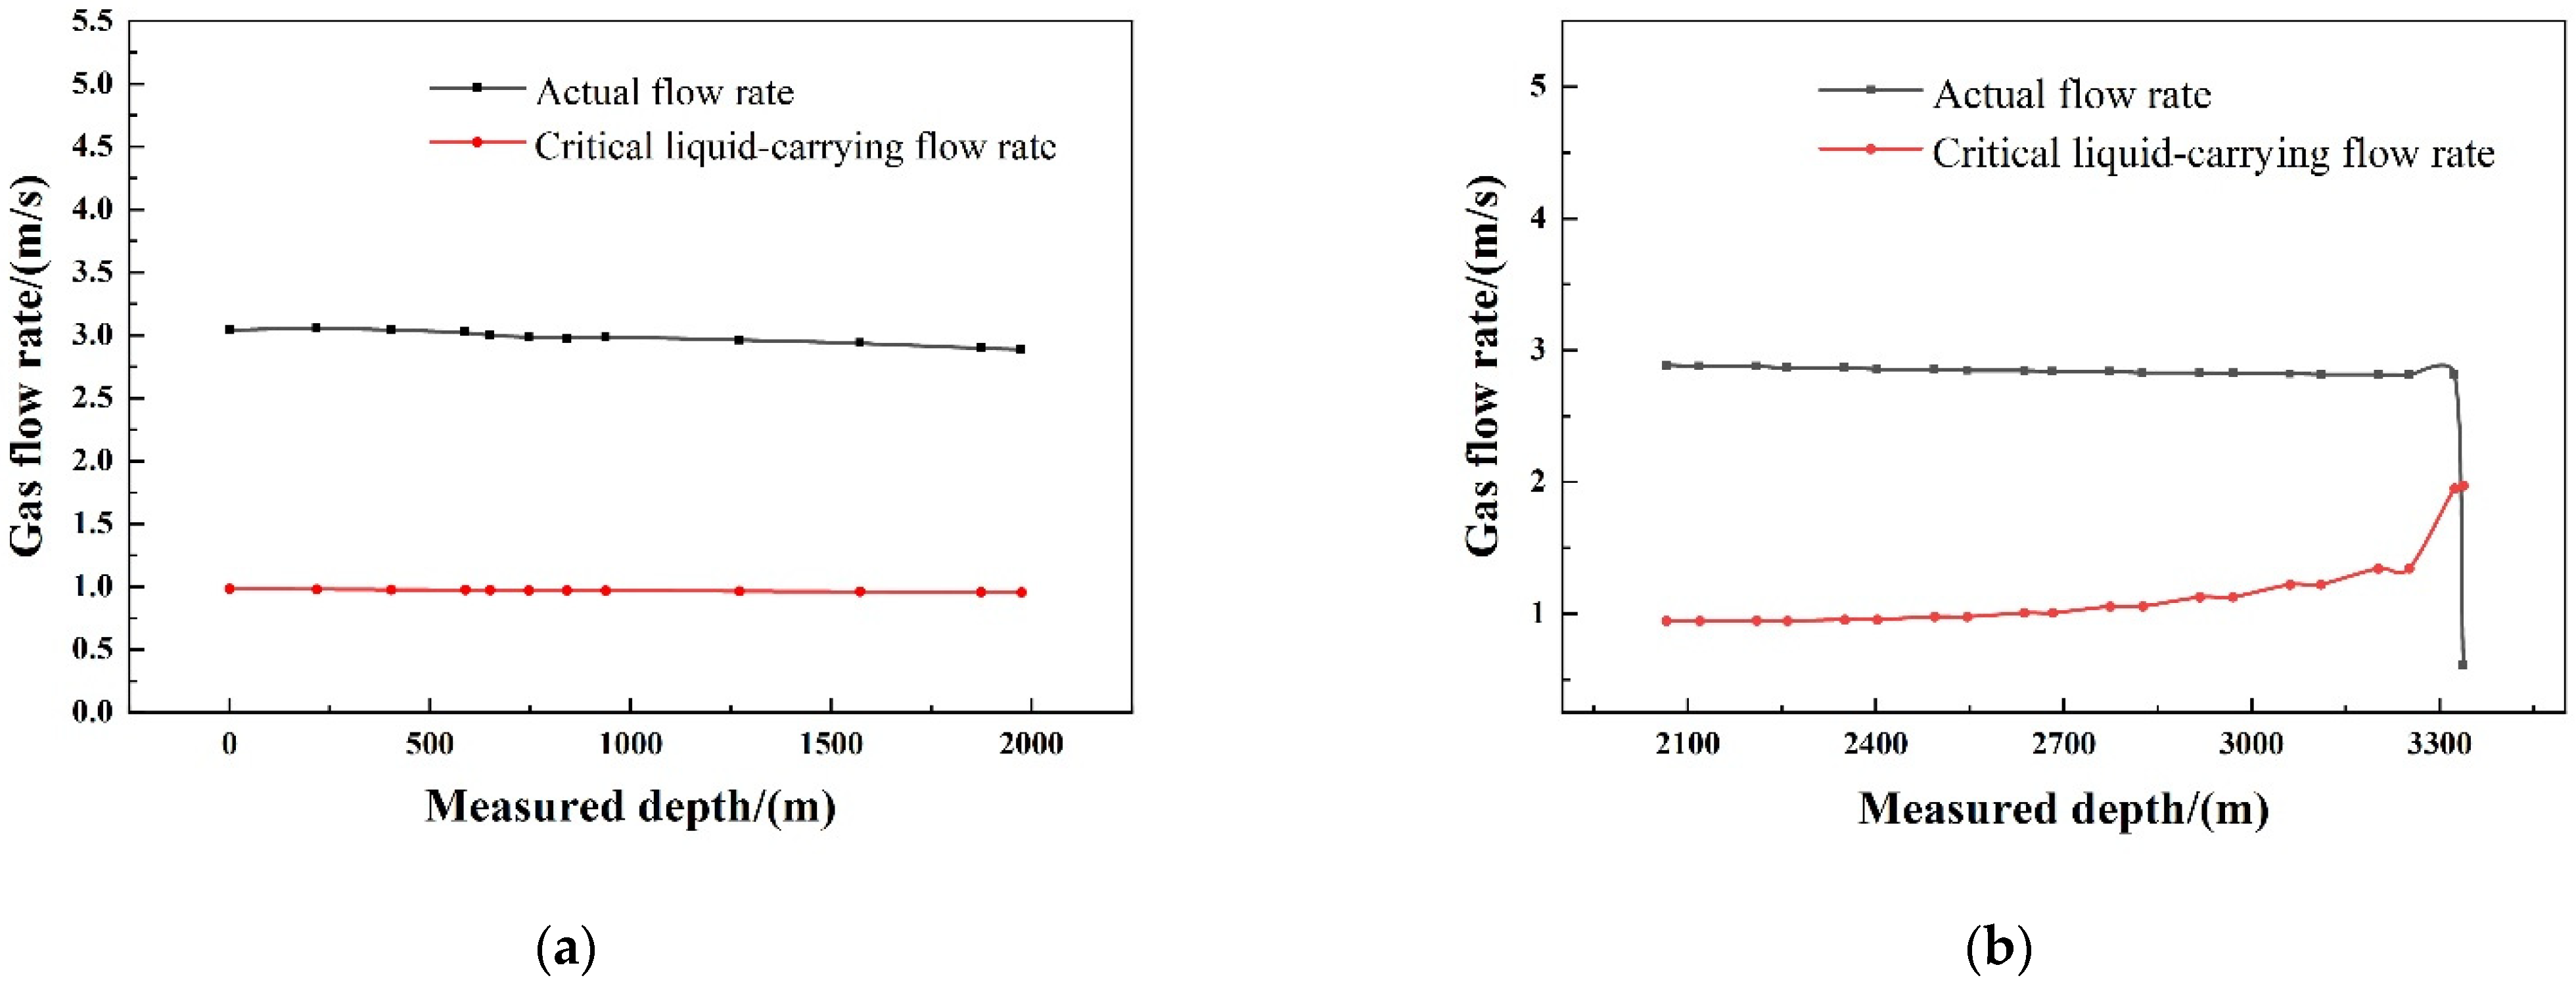
An inappropriate running depth of the velocity string may cause continued liquid loading [34,35]. Therefore, this study established a method for analyzing the running depth of the velocity string and a method for determining the coefficient of the fluid-carrying model.
(1)
Using the method for determining the coefficient of the proposed liquid-carrying model, a model suitable for each horizontal gas well was determined. Furthermore, the critical liquid-carrying flow rates of the vertical and inclined parts of the horizontal well were calculated. If the gas flow rate in the wellbore was higher than the calculated critical liquid-carrying flow rate [36], fluid accumulation did not occur in the gas well; by contrast, fluid accumulation occurred in the gas well if the flow rate was lower than the calculated value. By contrast, fluid accumulation occurred in the gas well if the flow rate was lower than the calculated value.
(2)
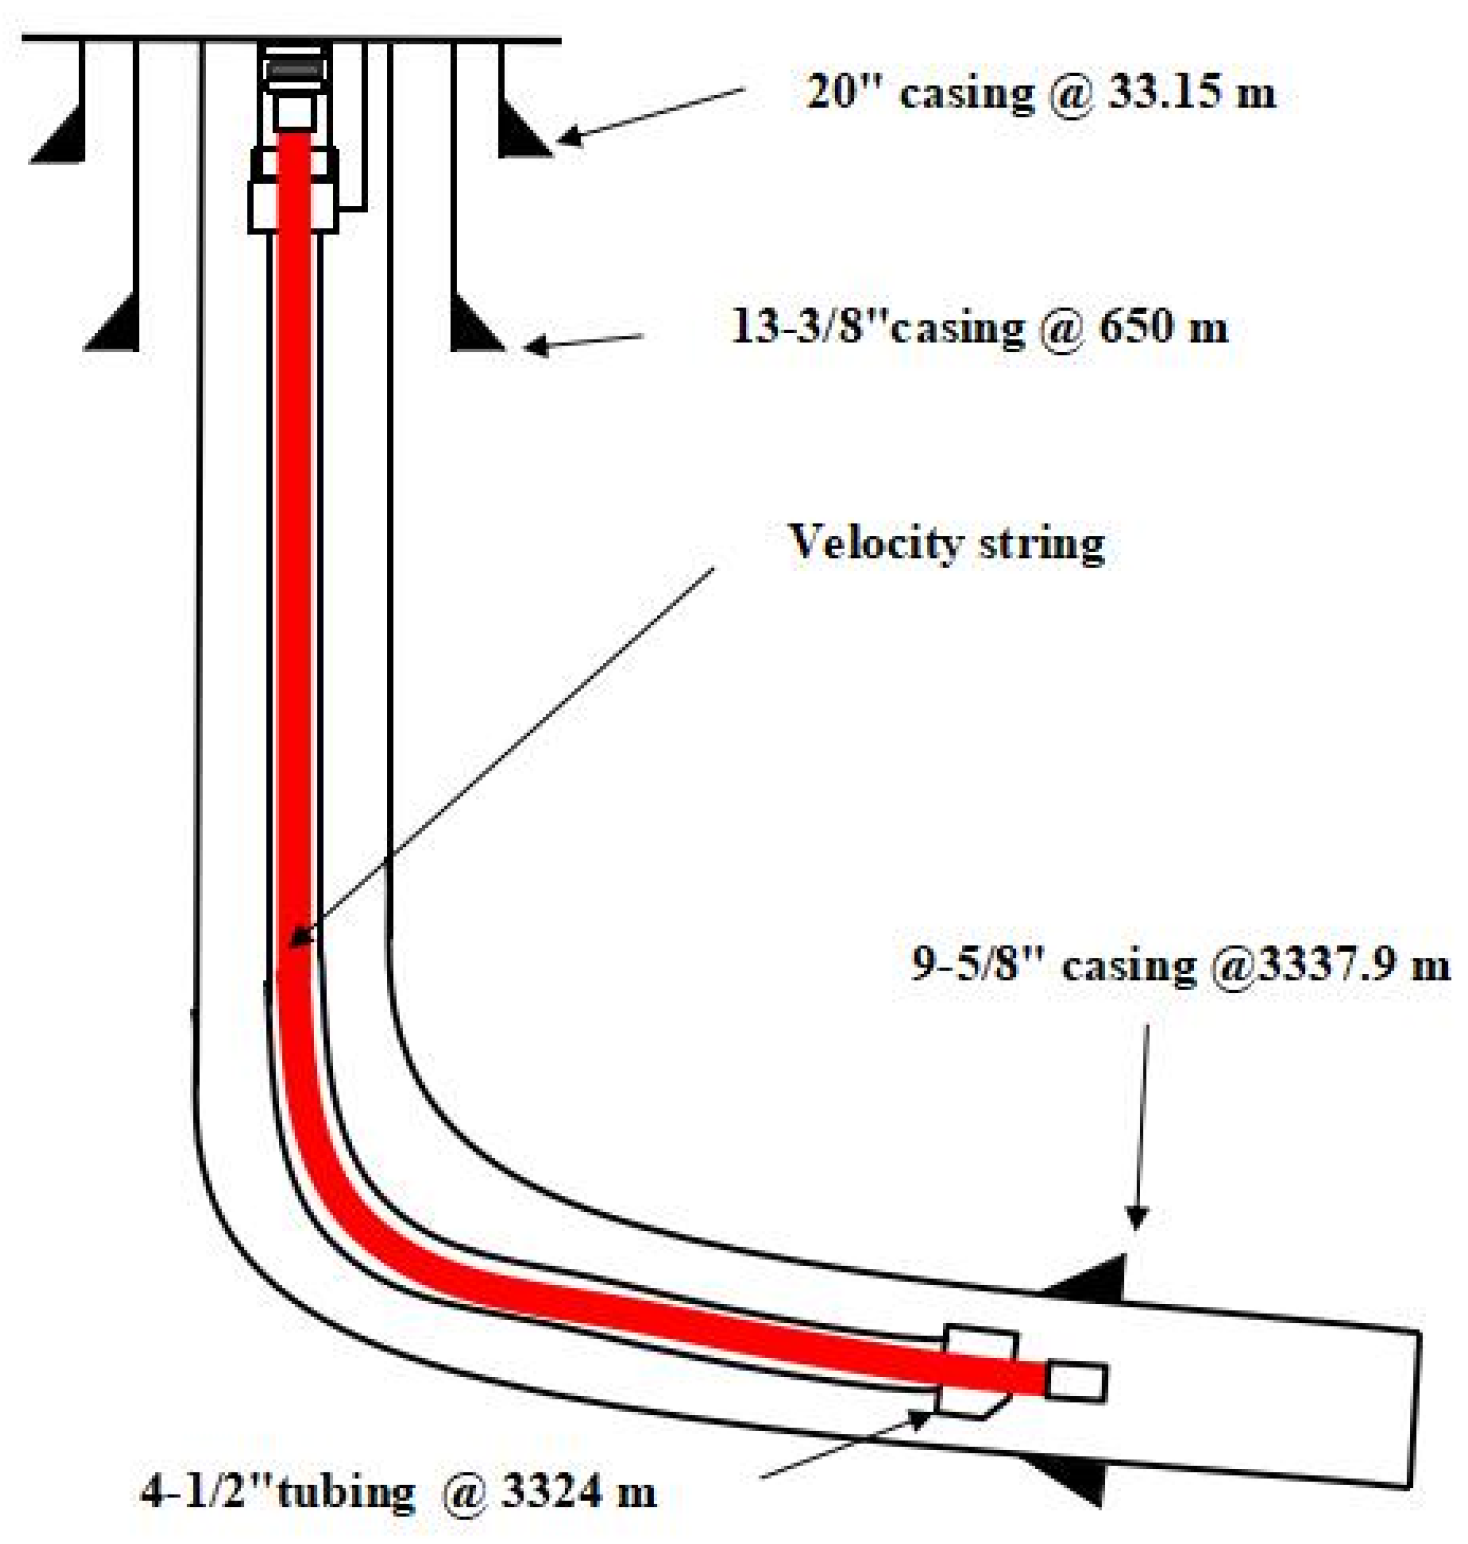
The location of liquid loading was determined according to the setting position of the tubing and casing in the well structure of horizontal wells.

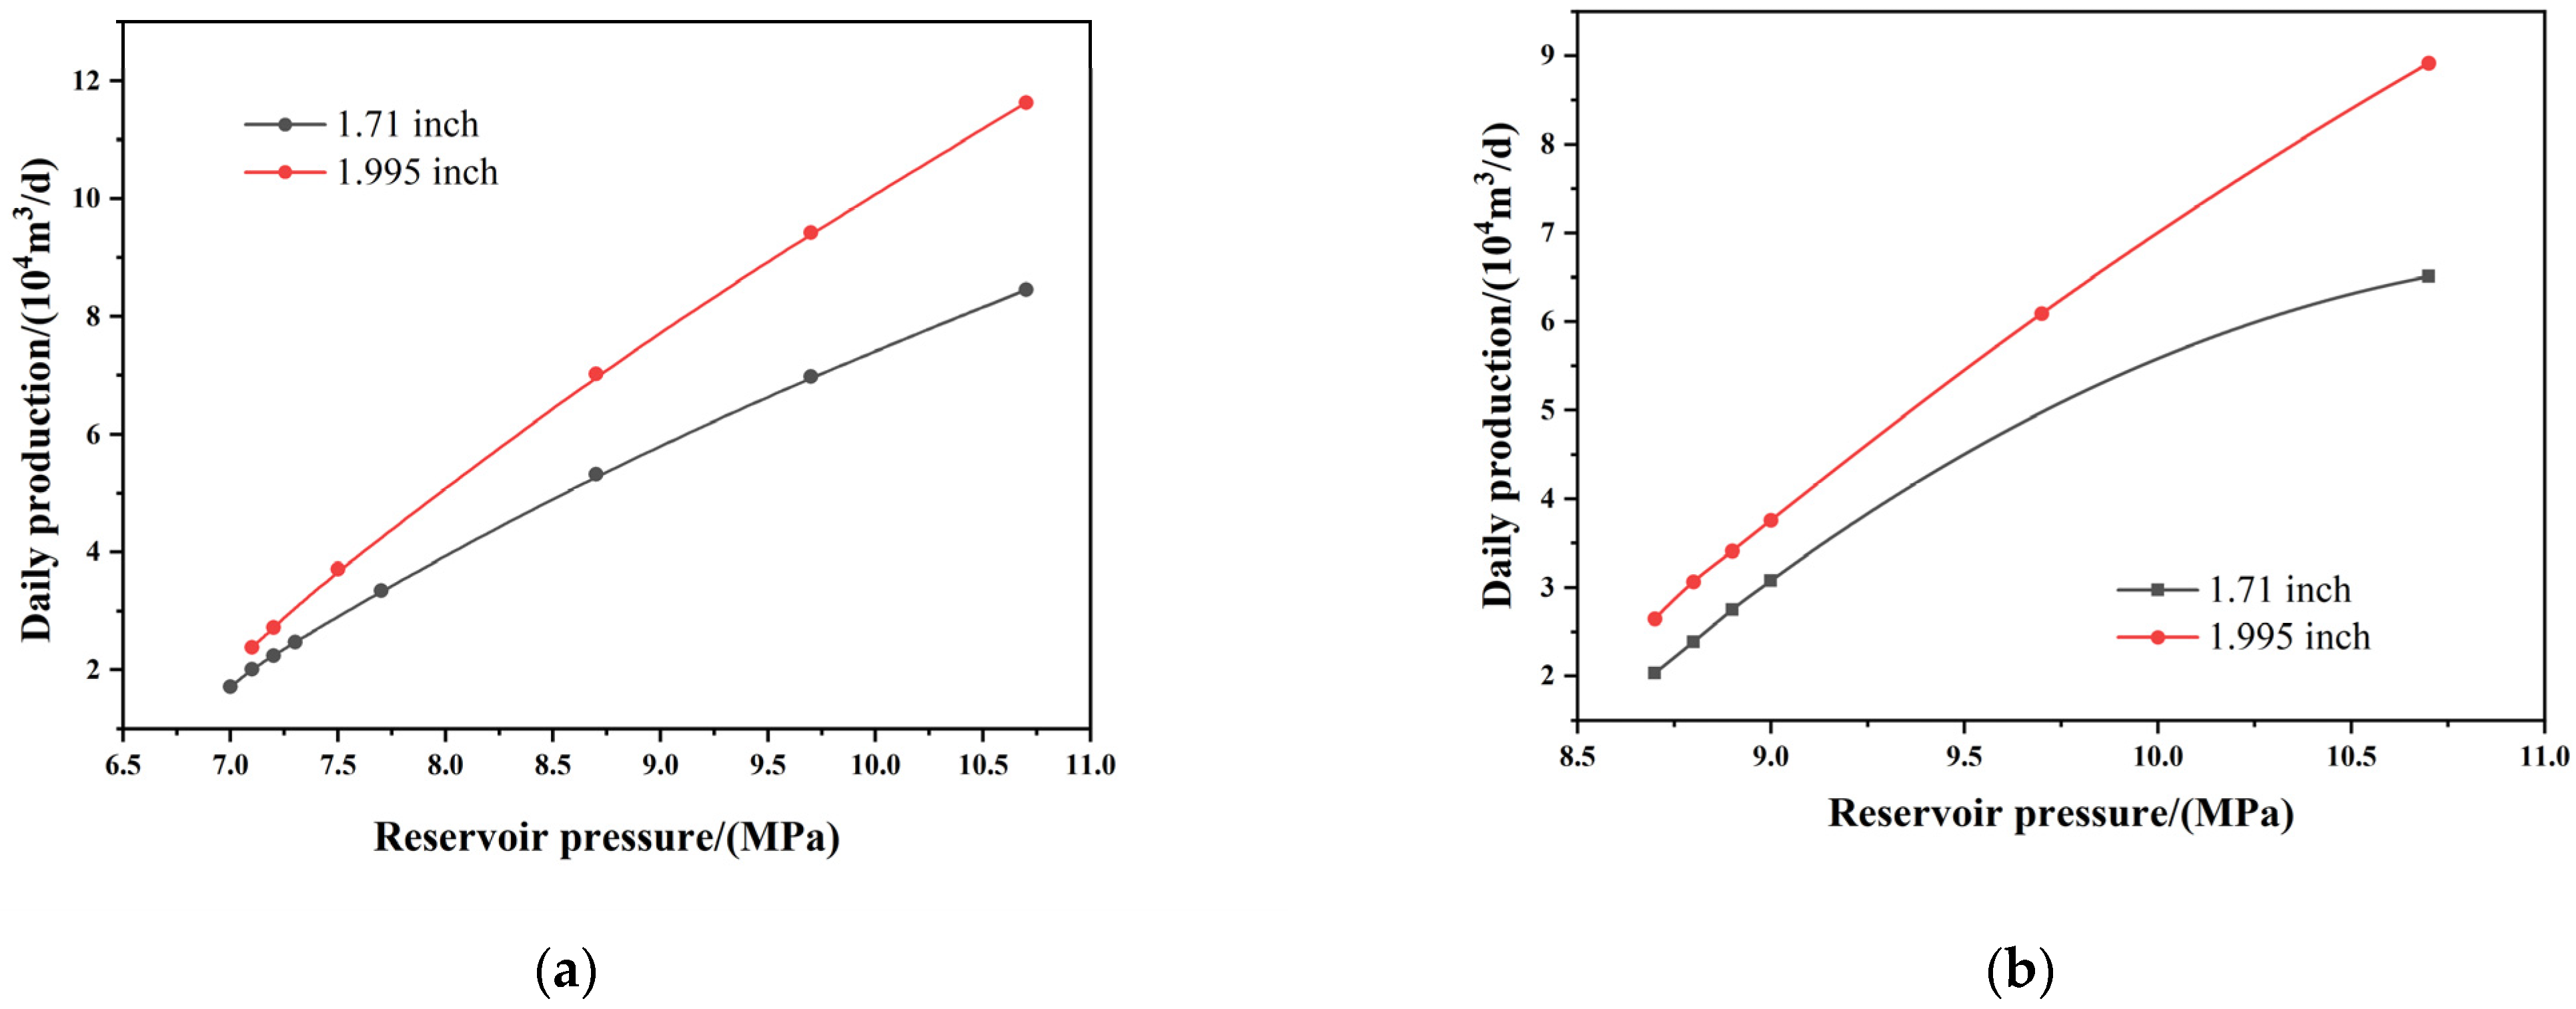
3.2. Application Examples

The horizontal gas well, CB-2, was used as an example for designing velocity string drainage. First, a suitable liquid-carrying model was determined. The gas flow rate for three types of liquid-carrying models in the vertical section were calculated and compared with the actual flow rate under a decreasing formation pressure of 10.7 MPa and a wellhead pressure of 6.26 MPa. Figure 1 depicts that the calculated flow rates for the vertical section were less than the actual flow rates, which means the gas well did not accumulate fluid in the vertical section. Meanwhile, the determination of whether the whole well accumulates fluid or not required the calculated flow rates for the inclined section, and the coefficient M was selected according to the relevant data from the inclined section.
The kickoff point of the well was measured at a depth of 2066 m, where the liquid-carrying model for the vertical part of the well and the liquid-carrying model for the inclined part were both valid. The results calculated using both formulas were similar. Therefore, the wellhead pressure was 1–10 MPa, and the drag coefficient was assigned different values so that the flow rate of the Fernando model in the inclined section was equal to that obtained using the Turner, Coleman, and Li Min models in the vertical section at the kickoff point. Three Kd values were calculated: 0.63, 1.43, and 15 (Figure 2, Figure 3 and Figure 4).
The Kd values obtained through the aforementioned calculation method were incorporated into the Fernando liquid-carrying model. Then, the liquid-carrying flow rates and the actual flow rates of the Fernando fluid-carrying model were calculated using different Kd values at the base of the inclined part of CB-2 at a measured depth of approximately 3337.9 m under a formation pressure of 26.5 MPa and a wellhead pressure of 1–10 MPa (Figure 5).
Under the original formation pressure, that is, when the gas well production was initiated, generating fluid accumulation was challenging. The actual flow rates at the base of the inclined part were less than the flow rates at the same location corresponding to the Fernando model at Kd = 0.63. Therefore, the critical liquid-carrying flow rates at the base of the inclined part for Kd = 0.63 were not applicable. When the wellhead pressure was higher than 6 MPa, the actual flow rates at the base of the inclined part were lower than the flow rates corresponding to those obtained using the Fernando model at Kd = 1.43 at the same location. Although the Coleman model is applicable to gas wells with wellhead pressures lower than 3.45 MPa, the actual production in the Changbei gas field has a wellhead pressure higher than 3.45 MPa; thus, the critical liquid-carrying model is also not applicable to the inclined section at Kd = 1.43. Therefore, the Fernando liquid-carrying model at Kd = 15 and the corresponding Li Min model for the vertical section were adopted to calculate the liquid-carrying flow rates of the horizontal gas well.
The initial liquid loading data were used to verify the applicability of the Fernando liquid-carrying model at Kd = 15. The model data for each position of the inclined part of the wellbore were calculated and compared with actual data under a decreasing formation pressure of 13.1 MPa and a wellhead pressure of 5 MPa (Figure 6). The actual gas flow rate at the base of the inclined part, that is, at the measured depth of 3337.9 m, was 1.63 m/s, and the liquid-carrying flow rates obtained using the Turner, Coleman, and Li Min models were 4.56, 3.72, and 2.07 m/s, respectively. The actual flow rates at the base of the inclined part in the initial stage of the liquid loading in the well CB-2 were less than the flow rates at this point of the inclined part of the liquid-carrying model corresponding to the three different values of Kd.
Because of the initial liquid loading phase, the liquid-carrying flow rates at this point should be closer to the actual flow rates, that is, the critical liquid-carrying flow rate at Kd = 15 corresponding to the Li Min model. The applicability of these two models to the horizontal gas well was verified.
The Li Min model and Fernando model for Kd = 15 were obtained for the given well. According to the production data of the target gas well during liquid loading, the flow rates of the fluid carried in the vertical and inclined part were calculated, and the liquid loading location was determined through comparison (Figure 7). As displayed in Figure 7, no fluid loading was observed in the vertical part, whereas liquid loading occurred at the base of the inclined part. The location of liquid loading was analyzed according to the running conditions of the oil and casing in the horizontal wells (Table 2).
The casing was set at a measured depth of 3337.9 m in the gas well, and the tubing was set at a measured depth of 3324 m; the inner diameter of the casing was considerably larger than that of the tubing. Therefore, the gas flow rate at the bottom of the casing was small and less than the critical liquid-carrying flow rate and continued to induce liquid accumulation.
After the gas entered the tubing, the inner diameter decreased, and the flow rate increased and was higher than the critical liquid-carrying flow rate. Therefore, the liquid-carrying capacity of the gas increased, allowing it to carry the liquid in the tubing out of the wellbore. Therefore, the liquid loading was generated in the casing at the bottom of the inclined section. This part of the casing and wellbore had a measured depth of 3324–3337.9 m.
The wellbore liquid loading was initiated from the bottom of the inclined part. The velocity string was set at a measured depth of 3324–3337.9 m to enhance the drainage ability and to restore production (Figure 8).

4. Determination of the Time of Velocity String Installation

The results for the velocity string process were favorable at the initial stage of implementation, but the capacity and liquid loading in the wellbore decrease over time. Only through relevant theoretical calculations, the critical liquid-carrying flow rates under the decay of formation pressure being determined, can we ensure continuous fluid discharge.
For the target gas well, the cumulative liquid-column height reached 39.6 m. Two velocity strings of different sizes were selected to calculate the critical liquid-carrying velocity at the bottom of the inclined part with the decrease in formation pressure. To determine the re-accumulation formation pressure, the calculated flow rates were compared with actual flow rates (Table 3).
Figure 9 depicts that under a wellhead pressure of 6.26 MPa, the liquid loading of the gas well initiates when daily production is less than 23,850 m3/d and a velocity string of 0.043 m is lowered. The liquid loading occurs again when daily production is lower than 30,630.1 m3/d and a velocity string of 0.051 m is lowered. Under a wellhead pressure of 5 MPa, the liquid loading of the gas well occurs again when daily production is lower than 20,111.2 m3/d and a velocity string of 0.043 m is lowered. The liquid loading of the gas well occurs when daily production rate is lower than 27,153.6 m3/d and a velocity string of 0.051 m is lowered.
A small difference in the formation pressure was observed at the beginning of the liquid loading between velocity strings of different sizes, and a velocity string having a size within this range was selected for deliquification of the target gas well. When the velocity string was lowered, the daily production decreased to 2 × 10⁴ m3/d and fluid accumulation occurred again; this is of practical significance and guides the field production of the target gas well.

5. Conclusions

This paper proposed a method to determine the liquid-carrying model coefficients for the structural characteristics of horizontal gas wells. The method can be used to calculate the critical liquid-carrying flow rate using a model that is applicable to individual wells in a gas field. The location of the liquid loading in the inclined part was determined according to the difference between flow rates calculated using the model and actual flow rates. The results indicated that the velocity string descended to the bottom of the inclined part. The CB-2 was used as an example to calculate the variation in the gas well production with the decrease in the formation pressure after the size of the different velocity strings was decreased under different wellhead pressures. The results suggested that the technique can help mitigate the problem of stable liquid-carrying production when the gas production is above 2 × 10⁴ m3/d.

Author Contributions

Conceptualization, W.C. and Z.H.; methodology, W.C.; software, H.Z.; validation, W.C., Z.H. and X.M.; formal analysis, H.Z.; investigation, W.C.; resources, W.C., Z.H. and X.M.; data curation, H.Z.; writing—original draft preparation, W.C. and Z.H.; writing—review and editing, W.C. and Z.H.; visualization, X.M.; supervision, H.Z.; project administration, W.C.; funding acquisition, W.C. All authors have read and agreed to the published version of the manuscript.

Funding

This research is supported by the Postgraduate Innovation and Practice Ability Development Fund of Xi’an Shiyou University (No.YCS22111005).

Data Availability Statement

The data that support the findings of this study can be provided by the corresponding author upon reasonable request.

Acknowledgments

We thank all the reviewers who participated in the review as well as MJEditor (www.mjeditor.com accessed on 29 July 2022) for providing English editing services during the preparation of this manuscript.

Conflicts of Interest

The authors declare no conflict of interest.

References

  1. Busahmin, B.; Saeid, N.H.; Alusta, G.; Zahran, E.S.M.M. Review on hole cleaning for horizontal wells. ARPN J. Eng. Appl. Sci. 2017, 12, 4697–4708. [Google Scholar]
  2. Zhao, X.; Lin, H.; Chen, L.; Tu, H.; Song, Y. Application of anti-sloughing drilling fluid technology to the long horizontal coalbed interval of well CB21-2, Changbei gas field. Nat. Gas Ind. 2012, 32, 81–85+131–132. [Google Scholar]
  3. Han, S.; Yang, H.; Wang, D.; Zhao, Y. Lithological seismic exploration for the sandstone reservoirs in shanxi formation of the lower permian at yulin region in eerduosi basin. Nat. Gas Ind. 1998, 18, 21–24+23. [Google Scholar]
  4. Dong, H.; Wu, M.; Cui, G.; Dong, H.; Jiang, Z.; Chen, L.; Xu, J. Analysis and countermeasures of CB3-3 well low production causes. Drill. Prod. Technol. 2015, 38, 38–40+38. [Google Scholar]
  5. Zheng, X.; Shi, J.; Cao, G.; Yang, N.; Cui, M.; JIia, D.; Liu, H. Progress and prospects of oil and gas production engineering technology in China. Pet. Explor. Dev. 2022, 49, 565–576. [Google Scholar] [CrossRef]
  6. Muñoz, E.A.; Quintero, N. Production Optimization Using a Dynamic Gas-Lift Simulator, History Case. In Proceedings of the SPE Western Regional Meeting, Anchorage, AK, USA, 26–28 May 1999. [Google Scholar]
  7. Edy, I.K.; Wicaksono, D.N.; Saputra, R.; Anantokusumo, F. Coiled Tubing Gas Lift Design and Troubleshooting—Case History. In Proceedings of the SPE/IATMI Asia Pacific Oil & Gas Conference and Exhibition, Nusa Dua, Indonesia, 20–22 October 2015. [Google Scholar]
  8. Ye, C.; Xiong, J.; Kang, L.; Peng, Y.; Chen, J. New progress in the R & D of water drainage gas recovery tools in Sichuan and Chongqing gas zones. Nat. Gas Ind. 2015, 35, 54–58. [Google Scholar]
  9. Avery, D.J.; Evans, R.D. Design Optimization of Plunger Lift Systems. In Proceedings of the International Meeting on Petroleum Engineering, Tianjin, China, 1 November 1988. [Google Scholar]
  10. Chen, K.; Tian, B.; Yu, J.; Fu, J.; Hou, X. Optimization design and application of plunger gas lift for water drainage and gas recovery in directional well. Fault-Block Oil Gas Field 2014, 21, 401–404. [Google Scholar]
  11. Nurkas, Z. Plunger Lift System Restores Production in Previously Abandoned Gas Condensate Well. In Proceedings of the SPE Annual Caspian Technical Conference & Exhibition, Astana, Kazakhstan, 1–3 November 2016. [Google Scholar]
  12. Hassouna, M. Plunger Lift Applications: Challenges and Economics. In Proceedings of the North Africa Technical Conference and Exhibition, Cairo, Egypt, 15–17 April 2013. [Google Scholar]
  13. Wang, X.; Wang, X.; Sadati, S.; Taylor, P.; Wang, K. A modified foam drainage test protocol for assessing incompatibility of admixture combinations and stability of air structure in cementitious systems. Constr. Build. Mater. 2019, 211, 174–184. [Google Scholar] [CrossRef]
  14. Huang, Y.; She, C.; Zhong, X.; Duan, F.; Yang, S.; Zhang, X. The Resent Situation and Development Tendency on the Foreign Technology of Dew Atering Gas Production. Drill. Prod. Technol. 2005, 28, 57–60+18. [Google Scholar]
  15. Etemad, S.; Kantzas, A.; Bryant, S. A systematic analysis of foam drainage: Experiment and model. Results Eng. 2022, 15, 100551. [Google Scholar] [CrossRef]
  16. Busahmin, B.; Maini, B.; Karri, R.R.; Sabet, M. Studies on the Stability of the Foamy Oil in Developing Heavy Oil Reservoirs. In Defect and Diffusion Forum; Trans Tech Publications Ltd.: Bäch, Switzerland, 2016; pp. 111–116. [Google Scholar]
  17. Ge, L.; Cui, H.; Li, Y.; Sui, X. Optimization and Performance Evaluation of Foam Discharge Agent for Deep Aquatic Condensate Gas Well. Front. Phys. 2022, 10, 350. [Google Scholar] [CrossRef]
  18. Jia, W.F.; Xian, C.G.; Wu, J.W. Temperature-sensitive foaming agent developed for smart foam drainage technology. RSC Adv. 2022, 12, 26657. [Google Scholar] [CrossRef] [PubMed]
  19. Arachman, F.; Singh, K.; Forrest, J.K.; Purba, M.O. Liquid Unloading in a Big Bore Completion: A Comparison Among Gas Lift, Intermittent Production, and Installation of Velocity String. In Proceedings of the SPE Asia Pacific Oil and Gas Conference and Exhibition, Perth, Australia, 18–20 October 2004. [Google Scholar]
  20. Zhao, B.; Bai, X.; Chen, D.; Li, X.; Zhao, W. Effect Assessment of Drainage Gas Recovery through Velocity String and Its New Application Area. China Pet. Mach. 2012, 40, 62–65. [Google Scholar] [CrossRef]
  21. Goedemoed, P.; Al Muselhi, F.K.; Al-Manji, A. Oman, 2 7/8\” Velocity Strings in Deep and Tight Gas Wells. In Proceedings of the SPE Deep Gas Conference and Exhibition, Manama, Bahrain, 24–26 January 2010. [Google Scholar]
  22. Wang, H.; Fu, D. Economic Evaluation for Application of Velocity String to Enhance Gas Production of Middle-Shallow Gas Wells in Western Sichuan Gas Field. Nat. Gas Oil 2020, 38, 144–148. [Google Scholar]
  23. Bagci, S.; Chang, T.; Hughes, B. URTeC: 157 Production Modeling for Velocity String Applications in Unconventional Wells. In Proceedings of the Uncoventional Resources Technology Conference, Denver, CO, USA, 22–24 July 2019. [Google Scholar]
  24. Adaze, E.; Al-Sarkhi, A.; Badr, H.M.; Elsaadawy, E. Current status of CFD modeling of liquid loading phenomena in gas wells: A literature review. J. Pet. Explor. Prod. Technol. 2019, 9, 1397–1411. [Google Scholar] [CrossRef] [Green Version]
  25. Wang, R.; Ma, Y.; Dou, L.; Cheng, J.; Zhang, N. Review of critical liquid unloading rate models and liquid loading models for gas well producing water. Sci. Technol. Eng. 2019, 19, 10–20. [Google Scholar]
  26. Turner, R.G.; Hubbard, M.G.; Dukler, A.E. Analysis and Prediction of Minimum Flow Rate for the Continuous Removal of Liquids from Gas Wells. J. Pet. Technol. 1969, 21, 1475–1482. [Google Scholar] [CrossRef]
  27. Coleman, S.B.; Clay, H.B.; McCurdy, D.G.; Norris, L.H., III. A New Look at Predicting Gas-Well Load-Up. J. Pet. Technol. 1991, 43, 329–333. [Google Scholar] [CrossRef]
  28. Li, M.; Guo, P.; Tan, G. New look on removing liquids from gas wells. Pet. Explor. Dev. 2001, 28, 105–106+110–100. [Google Scholar]
  29. Flores-Avila, F.S.; Smith, J.R.; Bourgoyne, A.T., Jr.; Bourgoyne, D.A. Experimental Evaluation of Control Fluid Fallback During Off-Bottom Well Control: Effect of Deviation Angle. In Proceedings of the IADC/SPE Drilling Conference, Dallas, TX, USA, 26–28 February 2002; p. SPE-74568-MS. [Google Scholar]
  30. Li, J.; Deng, D.; Shen, W.; Gao, Z.; Gong, J. Mechanism of gas well liquid loading and a new model for predicting critical gas velocity. Acta Pet. Sin. 2020, 41, 1266–1277. [Google Scholar]
  31. Liu, W.; Jiang, S.; Li, H.Z. Experimental study of liquid-carrying by swirling flow in a U-shaped tube. Exp. Therm. Fluid Sci. 2022, 130, 110479. [Google Scholar] [CrossRef]
  32. Wang, Z.; Bai, H.; Zhu, S.; Zhong, H.; Li, Y. An Entrained-Droplet Model for Prediction of Minimum Flow Rate for the Continuous Removal of Liquids From Gas Wells. SPE J. 2015, 20, 1135–1144. [Google Scholar] [CrossRef]
  33. Bashir, B.; Piaskowy, M.; Alusta, G. Overview on Directional Drilling Wells. ARPN J. Eng. Appl. Sci. 2021, 16, 2305–2316. [Google Scholar]
  34. Andrianata, S.; Allo, K.R.; Lukman, A.; Kramadibrata, A.T. Extending life of liquid loaded gas wells using velocity string application: Case study & candidate selection. In Proceedings of the SPE/IATMI Asia Pacific Oil and Gas Conference and Exhibition 2017, Jakarta, Indonesia, 17–19 October 2017. [Google Scholar]
  35. Kumar, A.; Bansal, R.; Chaubey, A.; Rajvanshi, S.; Devshali, S.; Mandal, T.K.; Malhotra, S.K.; Deuri, B. Optimal design of downhole pump, velocity string and plunger lift for gas well deliquification in Tripura using dynamic simulator OLGA. In Proceedings of the SPE Oil and Gas India Conference and Exhibition 2019, OGIC 2019, Mumbai, India, 9–11 April 2019. [Google Scholar]
  36. Busahmin, B.; Maini, B. A Potential Parameter for A Non-Darcy Form of Two-Phase Flow Behaviour, Compressibility Related. Int. J. Eng. 2018, 7, 126–131. [Google Scholar] [CrossRef]
Figure 1. Actual flow rates and liquid-carrying flow rates in the vertical part of the well.
Processes 10 02640 g001
Figure 2. Drag coefficient for the inclined section determined using the Turner and Fernando models.
Processes 10 02640 g002
Figure 3. Drag coefficient for inclined section determined using the Coleman and Fernando models.
Processes 10 02640 g003
Figure 4. Drag coefficient for inclined section determined using the Li Min and Fernando models.
Processes 10 02640 g004
Figure 5. Actual flow rates and liquid-carrying flow rates in the inclined part of the well.
Processes 10 02640 g005
Figure 6. Verification of model applicability.
Processes 10 02640 g006
Figure 7. (a) Actual gas flow rate and critical liquid-carrying flow rate in the vertical section. (b) Actual gas flow rate and critical liquid-carrying flow rate in the inclined section.
Processes 10 02640 g007
Figure 8. Diagram of casing program and velocity string setting position of well XX-2.
Processes 10 02640 g008
Figure 9. (a) Relationship between formation pressure and daily production for wellhead pressure of 6.26 MPa. (b) Relationship between formation pressure and daily production for wellhead pressure of 5 MPa.
Processes 10 02640 g009
Table 1. Common critical liquid-carrying models.
YearModelsDroplet ShapeCritical Liquid-Carrying ModelWell Type
1969Turner modelSphere v c = 5.48 σ ρ l ρ g ρ g 2 0.25 Vertical shaft
1991Coleman modelSphere v c = 4.45 σ ρ l ρ g ρ g 2 0.25 Vertical shaft
2001Li Min modelEllipsoidal v c = 2.5 σ ρ l ρ g ρ g 2 0.25 Vertical shaft
2002Fernando modelSphere v s c r i t = 4.86 σ ρ l ρ g K d c o s α ρ g 2 0.25 Inclined shaft
Table 2. Tubing, casing dimensions, and running depths.
Measured Depth/mOuter Diameter/mInner Diameter/m
Casing0–33.10.5080.476
Casing33.1–6500.3400.314
Casing650–3337.90.2450.217
Tubing0–33240.1140.101
Table 3. Formation pressure at which fluid began to accumulate at different wellhead pressures for different pipe diameters.
Wellhead Pressure/MPaPipe Size/mActual Gas Flow Rate/(m/s)Critical Gas Flow Rate/(m/s)Fluid Accumulation
Formation Pressure/MPa
6.260.0431.7501.7628.70
6.260.0511.7491.7628.70
5.000.0431.8491.9807.00
5.000.0511.9001.9837.10
Publisher’s Note: MDPI stays neutral with regard to jurisdictional claims in published maps and institutional affiliations.

