Article

Kinetic Model of Moisture Loss and Polyphenol Degradation during Heat Pump Drying of Soursop Fruit (Annona muricata L.)

1
Institute of Applied Technology and Sustainable Development, Nguyen Tat Thanh University, Ho Chi Minh City 700000, Vietnam
2
Faculty of Environmental and Food Engineering, Nguyen Tat Thanh University, Ho Chi Minh City 700000, Vietnam
3
Faculty of Chemical Engineering and Food Technology, Nong Lam University, Ho Chi Minh City 700000, Vietnam
4
Faculty of Chemical Engineering, Ho Chi Minh City University of Food Industry, Ho Chi Minh City 700000, Vietnam
*
Authors to whom correspondence should be addressed.
Processes 2022, 10(10), 2082; https://doi.org/10.3390/pr10102082
Submission received: 2 September 2022 / Revised: 18 September 2022 / Accepted: 20 September 2022 / Published: 14 October 2022
(This article belongs to the Special Issue Drying Kinetics and Quality Control in Food Processing)

Abstract

:
The aim of this study is to investigate the impact of time and temperature of the heat pump drying process of soursop slices at different levels on moisture content and total polyphenol content (TPC). Twelve types of classical kinetic models have been used in this work to describe the suitability of experimental data with models. The conformity is assessed based on statistical values (e.g., coefficient of determination (R2), Chi–square value (X2), etc.). The loss of moisture in the material is described in accordance with Fick’s diffusion law. Value of moisture rate (MR), and effective moisture diffusivities (Deff) have been identified. Experimental results show that MR value depends on the time and drying temperature, Deff increases when increasing the drying temperature from 20–50 °C with values of 1.24 × 10⁻⁹, 1.85 × 10⁻⁸, 7.69 × 10⁻⁸, and 5.54 × 10⁻⁷ m/s2. The Singh et al. model is the best option to describe the moisture of the sliced soursop drying process at 30 °C (R2 = 0.97815). The largest TPC decomposition occurs at a temperature of 50 °C. The ability to decompose TPC is proportional to the drying temperature. The TPC decomposition dynamic model follows a first–order reaction when drying at 20 °C with a determinant coefficient R2 = 0.9693.

1. Introduction

The soursop fruit (Annona muricata L.) is one of the fruits with high antioxidant content. The total polyphenol content (TPC) is representative of antioxidant compounds. A significant concentration of TPC in SSF (soursop fruit) ranged from 0.0104 to 1.86 g GAE/100 g DW (GAE: gallic acid equivalent; DW: dry weight) [1]. In addition, some other nutritional content in soursop is based on 100 g, such as protein (1000 mg), fat (970 mg), ascorbic acid (29.6 mg), carbohydrates (14.63 g), calcium, and iron, etc. [2]. One or more benzoic rings are characteristic of sensory elements (e.g., color, odor, taste). The nutritional values are also influenced by the number of benzoic rings [3]. Food processing causes many changes in biological activity, antioxidant capacity, nutritional content and organoleptic properties of color, odor, and taste of the product. Most of the processing processes have negative effects on the nutritional, organoleptic and biological activity of the raw materials. However, this variation is also dependent on processing conditions. Drying is a useful method of removing moisture from materials, in order to prevent microbial growth and reduce the rate of product spoilage. However, drying is one of the processing processes that negatively affects product quality [4]. This has proved the importance and necessity of the kinetic model to the processing processes. Antioxidant compounds such as polyphenols are easily transformed by the heating of the material and the presence of oxygen in the drying air [5,6]. However, some other studies suggested that an increase in TPC occurred after drying onion at 60–70 °C [7] and drying soursop at 40–60 °C [8]. Nowadays, people’s interest in natural products with high nutritional content is increasing, especially for products that are able to reduce the damage of cells that are caused by free radicals [9]. A previous study showed a close relationship between phenolic compounds and the ability to prevent some diseases (e.g., cancer, cardiovascular, and inflammation in humans) [10]. The construction of a kinetic model of total polyphenols decomposition is aimed at contributing to the control of drying stages and the design of processing equipment suitable for the group of materials. On the other hand, kinetic modeling can help predict the influence of variables on nutrient content and biological activities. From there, it is possible to adjust the appropriate parameters for optimal drying efficiency and product nutrition. A previous publication on the drying process of cashew apples had a negative effect on TPC when investigating the drying temperature range from 55 to 65 °C [4]. A similar report on the effect of drying temperature from 40 to 60 °C on polyphenols when drying cocoa beans [11]. The kinetic models of polyphenol degradation and moisture loss kinetics of some root vegetables have been studied previously. Kyi et al. studied the polyphenol degradation kinetics of cocoa beans under drying conditions from 40 to 60 °C. Research results show the compatibility of experimental data with first–order response (R2 > 0.96) [11]. As reported by Zhou et al., polyphenol degradation during bean drying follows a first–order dynamic model with R2 = 0.91 when drying at 80 °C by hot air [12]. The report of Si Tan et al. showed the compatibility of experimental data with Page model (R2 > 0.93) when investigating moisture loss during heat pump drying of tomato slices [13]. There have been many studies on the kinetic model of moisture loss and polyphenol degradation in various materials in the past. However, there have been no studies on polyphenol degradation kinetics and moisture loss kinetics in soursop slices. The twelve models represent three common groups of models including: theoretical, semi–theoretical and experimental groups of models which this study applied to the heat pump drying process of soursop slices. Simultaneous investigation between moisture loss efficiency and TPC degradation in the heat pump drying process thus serves as the basis for the selection of drying conditions to satisfy the concurrency between drying efficiency and post–drying product quality. This is different from previous studies. On the other hand, most of the previous studies have applied the convection, microwave and vacuum drying processes to investigate the drying kinetics of some foods such as lemons and limes [14], apples [15], and mushrooms [16]. However, the heat pump drying method is a method rarely applied in previous studies, especially for soursop raw materials. On the other hand, due to the influence of the structure and conditions of the soursop growing area in each country being different, the resulting properties of the raw materials are also different. The mechanism/degree of polyphenol degradation and the mechanism/degree of moisture loss over time in soursop in Vietnam were also affected. However, there have not been any studies to comprehensively evaluate the effect of heat pump drying on the efficiency of moisture removal and TPC degradation before this. The study was carried out on a device with a maximum drying capacity of 25 kg of soursop and the characteristic parameters stated in this study.
Therefore, the main aim of this work is to investigate the effect of four temperature levels from 20–50 °C on TPC and moisture content in the raw materials. Analysis of the TPC decomposition kinetic model and the moisture loss kinetic model of raw materials in the drying process by heat pump drying method will follow. The study will also show the required activation energy in this drying process through the Arrhenius equation. The results of the study are expected to optimize the economic efficiency and nutritional content of the product in the future drying of soursop.

2. Materials and Methods

2.1. Materials

This work used soursop fruit which were grown in Tan Phu Dong, Tien Giang province, Vietnam (coordinates 10°14′43″ N 106°41′54″ E). SSF were harvested after about 3 months when SSF were formed. The mass of the fruit ranges from 1.5–2 kg. The initial moisture content of SSF was 80.54 ± 2.59%. The pH value is 3.86 ± 0.04, total soluble solids are 14.2 ± 0.4, acidity (as malic acid) is 0.72 ± 0.03%, fiber is 0.85 ± 0.03%, dry matter is 15.9 ± 0.3%, pulp color is white.

2.2. Chemicals and Agents

Some chemicals were used this work such as Folin–Ciocalteu reagent 2N, gallic acid (purity > 97.5%) which were purchased from Sigma–Aldrich (St. Louis, MO, USA), Na2CO3 which were purchased from Shantou City, Guangdong Province, China (purity 99.8%), MB90 moisture drying scale (Ohaus Corporation, Waukegan, IL, USA).
Heat pump drying equipment is designed and installed in Vietnam with basic parameters such as: dimensions of drying tray with length x width x height, respectively (50 × 45 × 2 cm). The holes of the drying trays are designed in a square shape with a side size of 0.5 cm. The volume of the drying chamber is 0.484 m3 with dimensions of length × width × height, respectively (110 × 80 × 55 cm). The device is designed with a maximum drying temperature range of 20–50 °C. The allowable wind speed range for equipment operation is 40–60 Hz. Wind is blown horizontally from left to right. A drying chamber contains 20 drying trays and the distance between the drying trays is 5 cm.

2.3. Processing

SSF are cut into thin slices (thickness: 1–2 mm) and are de–nutted. Slice shape is triangular. Soursop slices, which are selected for further processing in the next stages, meet the requirements for uniformity in size, shape and no peeling phenomenon. Raw materials are blanched at 70 °C for 2 min [17], the ratio of blanching water and material weight is 5:1 (w/w). After the blanching process, the material is rapidly cooled with water, which reaches a temperature of 20 ± 3 °C, for 2 min. After the cooling process, the water deposited on the surface of the material is removed by a dry cloth before the drying process is carried out. The drying process is investigated for temperature factors in the range of 20–50 °C and the process is extended until the MC of the raw materials remains constant 3 times in succession. The wind speed during drying is 50 Hz. Layers of sliced soursop are stacked on drying trays with a total thickness of 4 mm, equivalent to 2 layers of ingredients. Each drying temperature in the survey range was evaluated for moisture content and TPC with 3 replicates on the same sample and continued to be repeated 3 times at 3 different drying times.

2.4. Determination of Total Polyphenol Content (TPC)

TPC is determined on the principle that the polyphenols in the feedstock reduce the phospho–wolfram and phospho–molybdate complexes in the Folin–Ciocalteu reagent to form a blue product. The procedure is followed as described by T.P. Dao et al., 2021 [17]. The sample is diluted with ethanol to obtain a solution of suitable dilution. Each 0.5 mL of the test sample is placed in each of the respective test tubes (5 mL). Folin–Ciocalteu reagent 10% (2.5 mL) is further added to the test tube under low–light conditions. Then, 2 mL of 7.5% Na2CO3 solution is added, and left for 60 min in the dark. The sample is measured for absorbance at 765 nm.

2.5. Determination of Moisture Content (MC)

MC is determined based on the principle of evaporating water in food. The results are calculated based on the difference in weight of materials before and after drying at 105 °C to constant weight. The method is carried out based on the description of A.P. Olalusi and O. Erinle 2019 [18]. MC in the raw materials is determined based on the support of the Ohaus MB120 moisture–weighing device operating according to the stated principle.

2.6. Mathematical Model of Kinetic Loss Moisture

The selection of the best drying model is based on statistical values and mathematical models (Table 1). The coefficient of determination (R2) is used to choose the best equation describing the experimental data of the drying process. In addition to the coefficient of determination, Chi–square value (X2) is used to determine the degree of compatibility with 7 types of experimental models. The rate constant (k) of the process is determined by a nonlinear regression equation based on experimental values based on the graph of moisture function and t.
The   coefficient   of   determination   R 2 = 1 i = 1 n A exp , i B pre , i 2 i = 1 n A exp , i A 2
where: n value is the total values A, i is at time i, A indicates the average value of the values obtained after the experiment, Bpre,i is the value predicted Ai by the fitted model at time i, Aexp,i is the value of A at time i [19].
Chi   square   X 2 = i = 1 n MR exp , i MR exp , i 2 N n
where: MRexp,i is the ith dimensionless experimental moisture rate, MRpre,i is the dimensionless predicted moisture rate, N and n represent the total value of the experimental data and the total the number of predicted moisture rate, respectively [20].
Dimensionless   moisture   rate   MR = MC t MC e MC 0 MC e = 8 π 2 exp π 2 D eff t L 2
Dimensionless   Ln MR = Ln 8 π 2 π 2 D eff t L 2
Effective   moisture   diffusivities   D eff = K L 2 π 2 = D 0 exp ( E a RT )
where: t represents the drying time (minutes), L represents the soursop slice thickness (m), K is the slope inferred from the linear regression between time and the logarithm of MR [13]. The constant corresponding to the diffusion coefficient (m2/s) is expressed as D0, Ea represents the activation energy (KJ/moL), and R = 8.314 KJ/moL represents the ideal gas constant, and T is the absolute temperature (K). Activation energy (Ea) and constant D0 were determined based on the graph of ln(Deff) vs. 1/T after linearizing Equation (5) [21]. MCt, MC0, MCe are the variables corresponding to the MC at a particular time, the initial MC and the equilibrium MC [14].
Drying   rate   DR = ( MC t + Δ t MC t ) Δ t
where: MC t + Δ t is the MC at any time increased by an amount of time Δ t [21,22].

2.7. Mathematical Model of Kinetic Polyphenol Degradation

During the drying process, various kinetic models are widely used to predict the changes in nutritional composition and color in fruits and vegetables. This change is normally found in the form of zero and first–order reactions [33].
Zero order   reaction :   dC A dt = k
First order   reaction :   dC A dt = k . C A
where: CA: concentration of nutrient A at any time t, k: reaction rate constant.

2.8. Statistical Analysis

Data in this work were calculated and determined using Microsoft Excel software (Redmond, WA, USA) and Origin Pro 9.0 software, version 90E (OriginLab, Roundhouse Plaza Northampton, USA) with statistical significance (p < 0.05), Statgraphics Centurion XV version 15.1.02 [34].

3. Result and Discussion

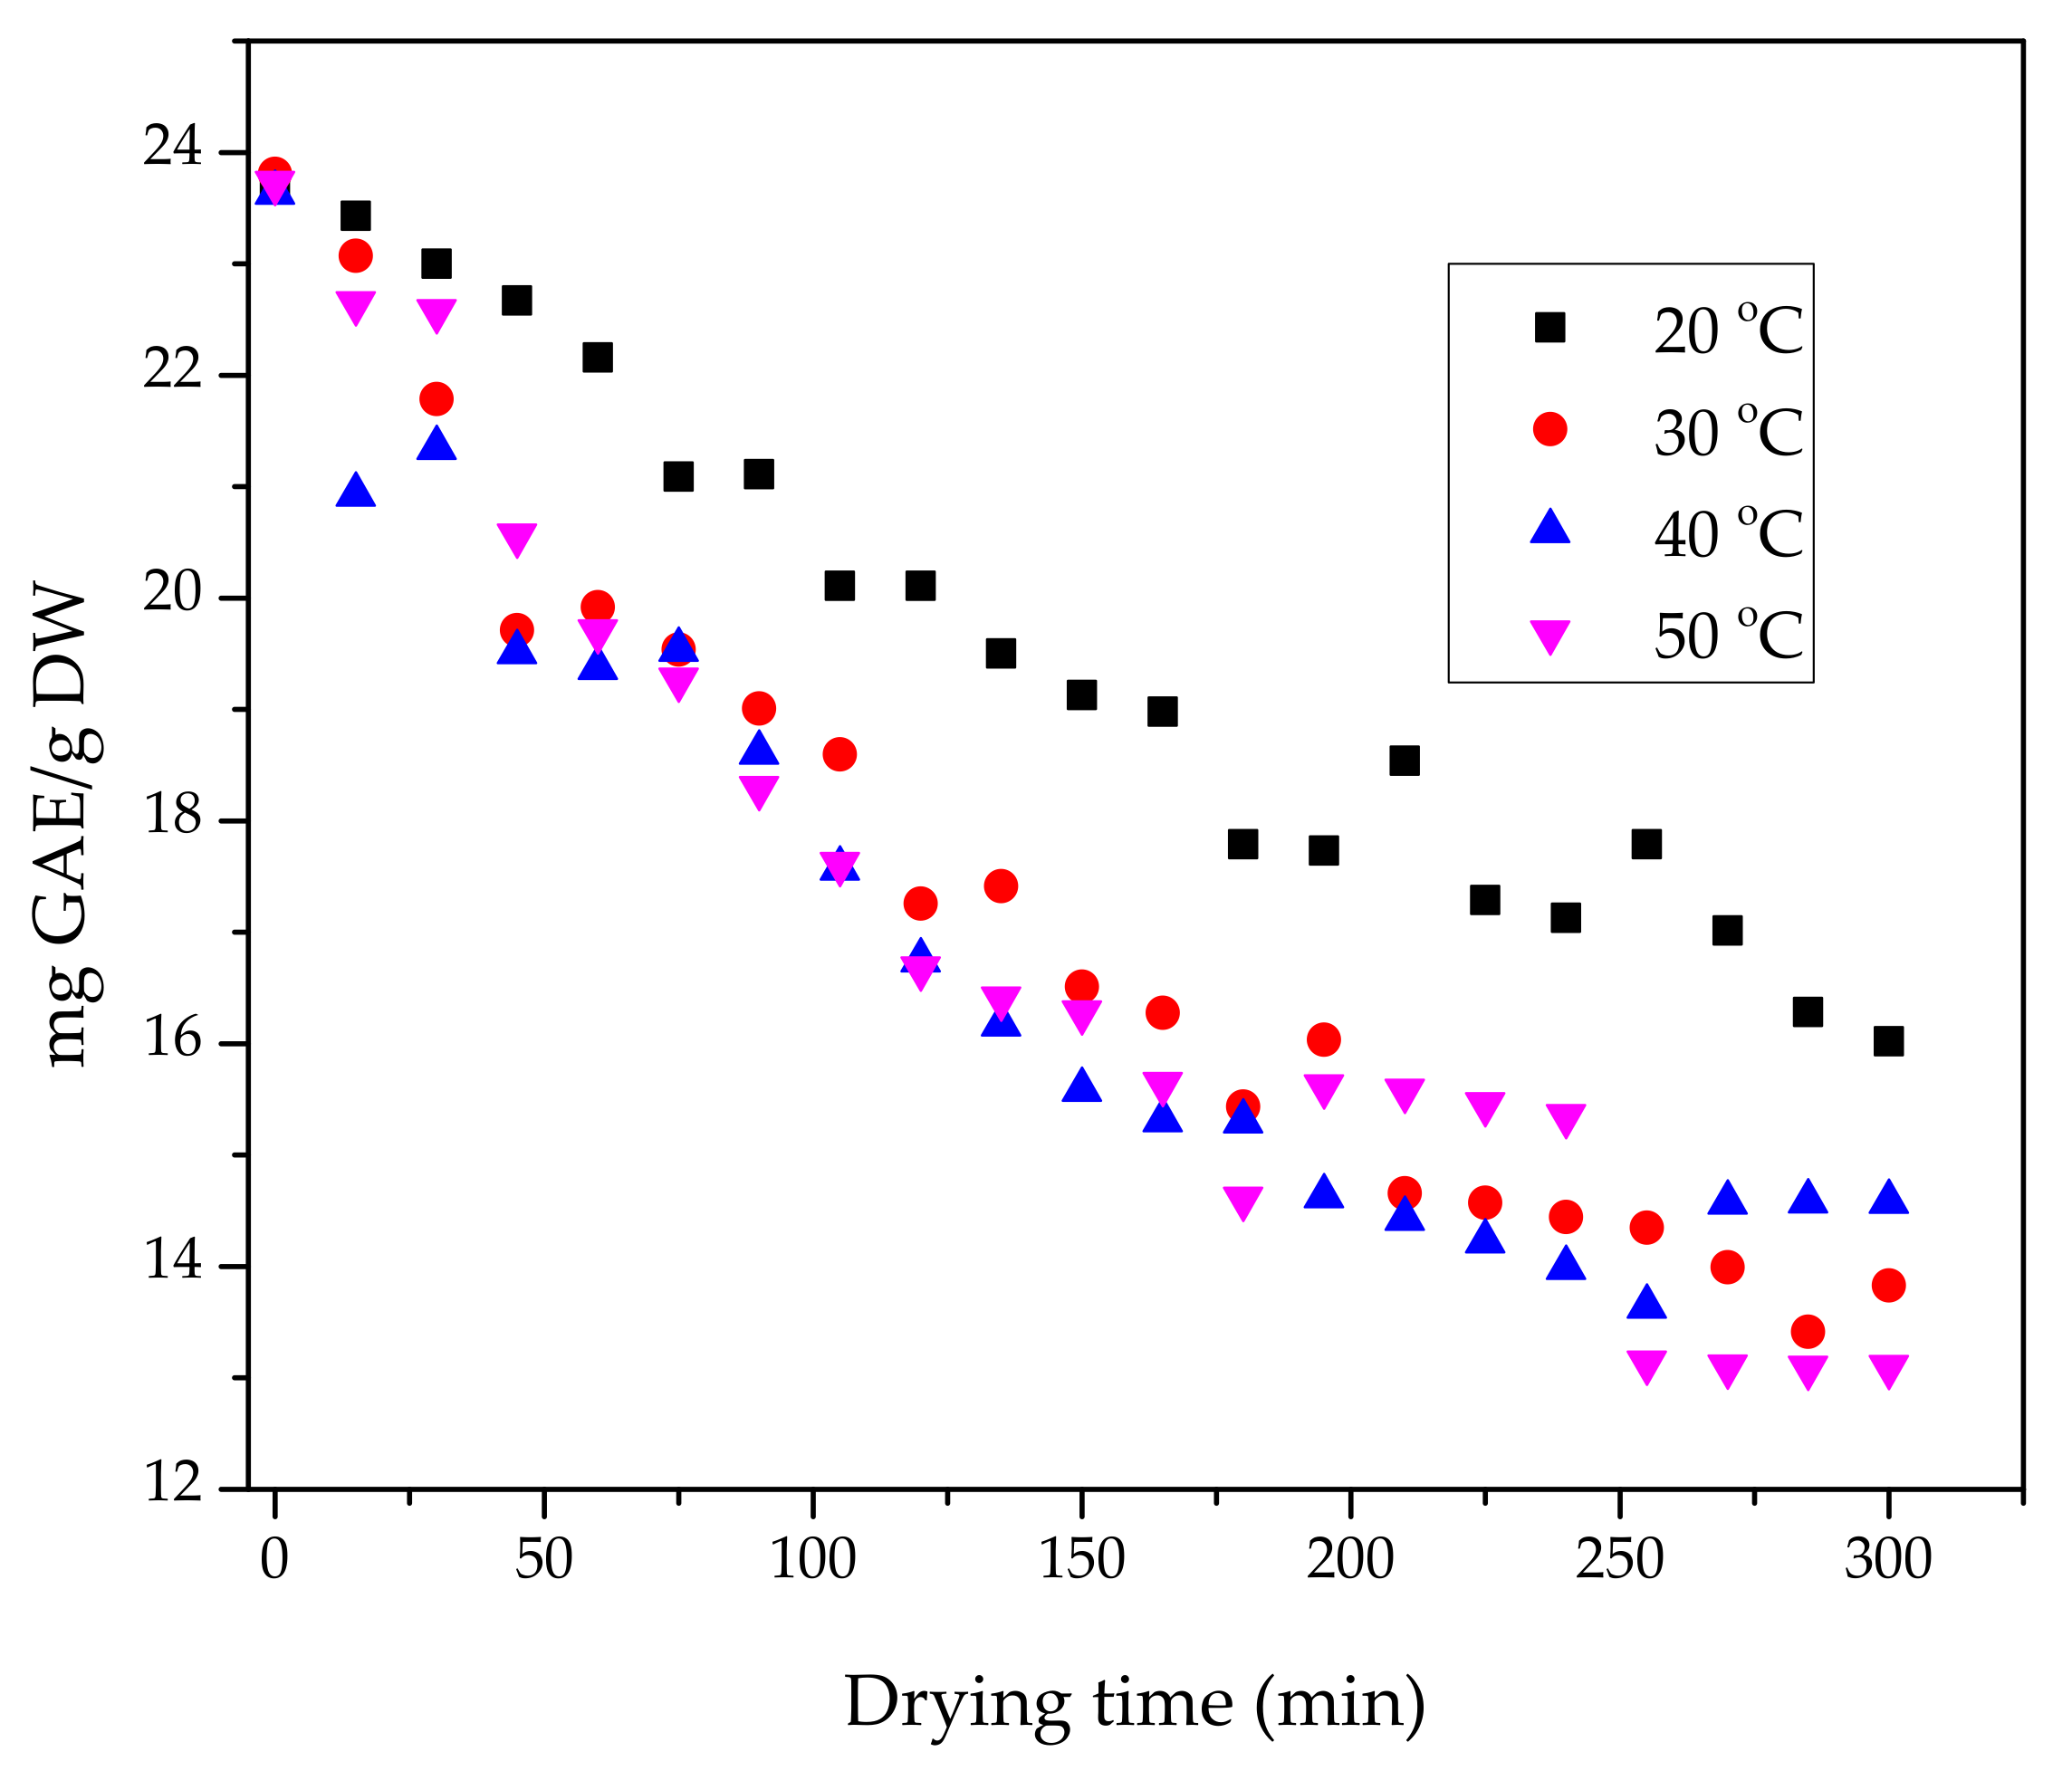
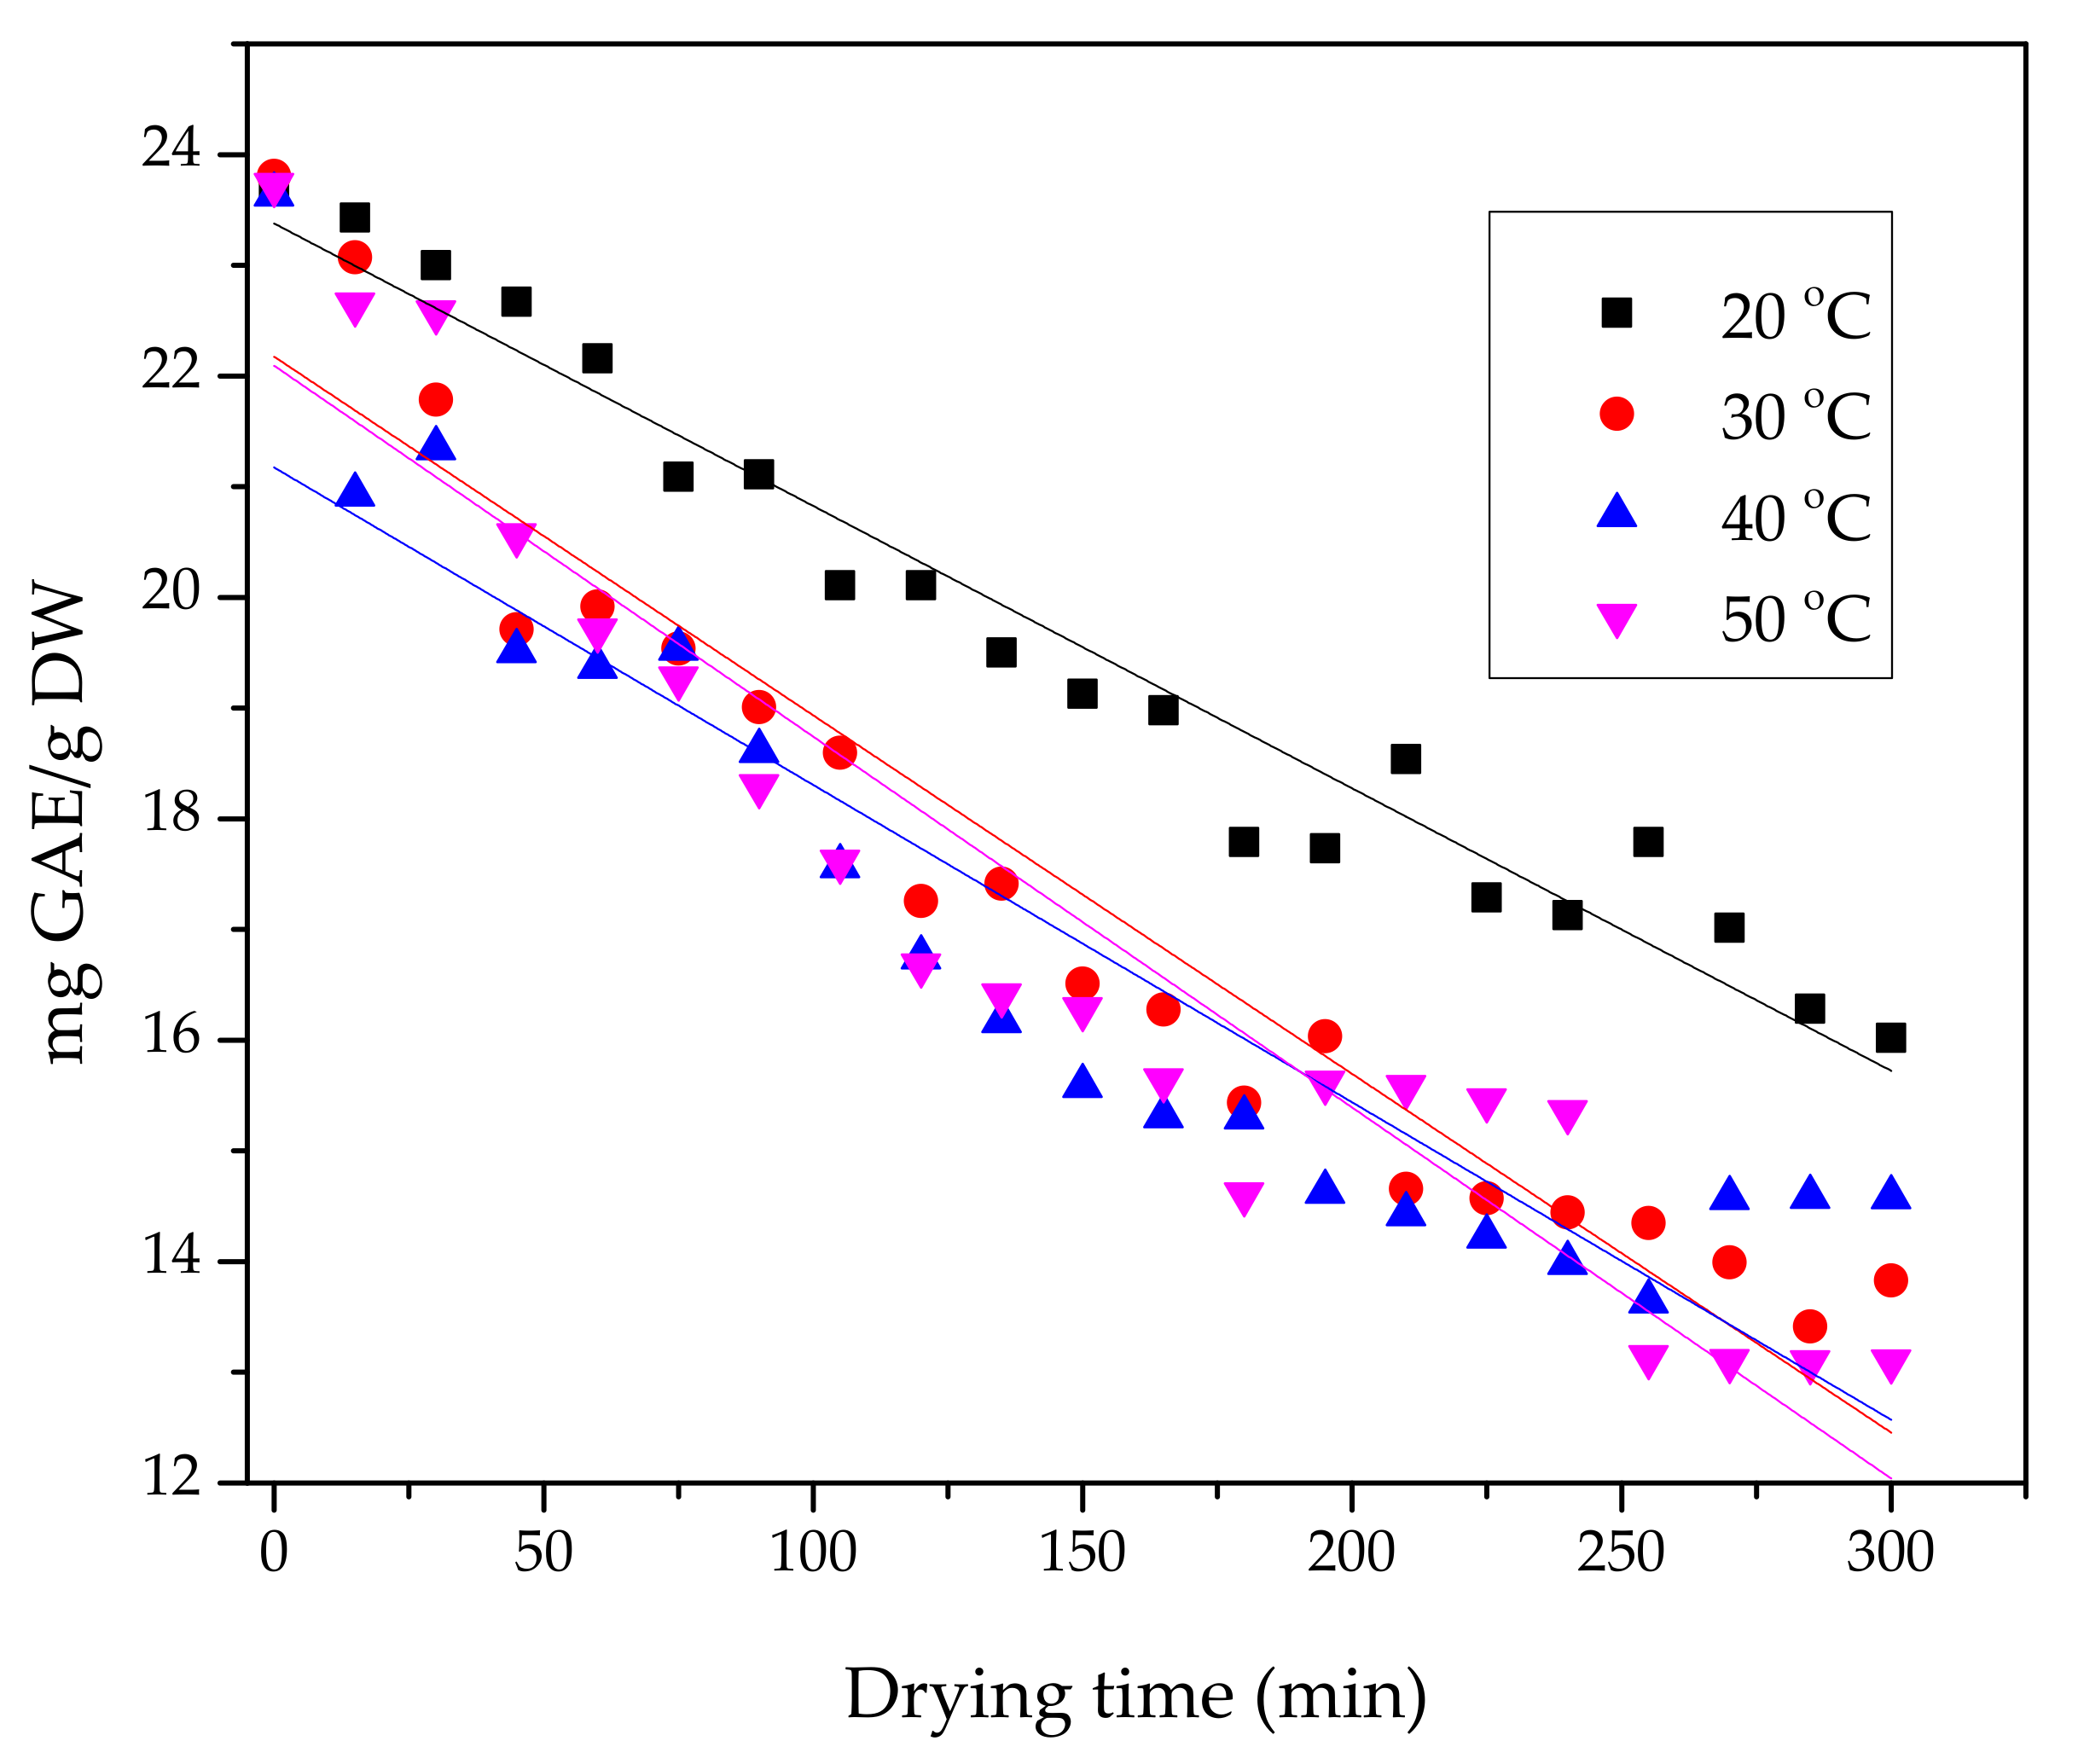
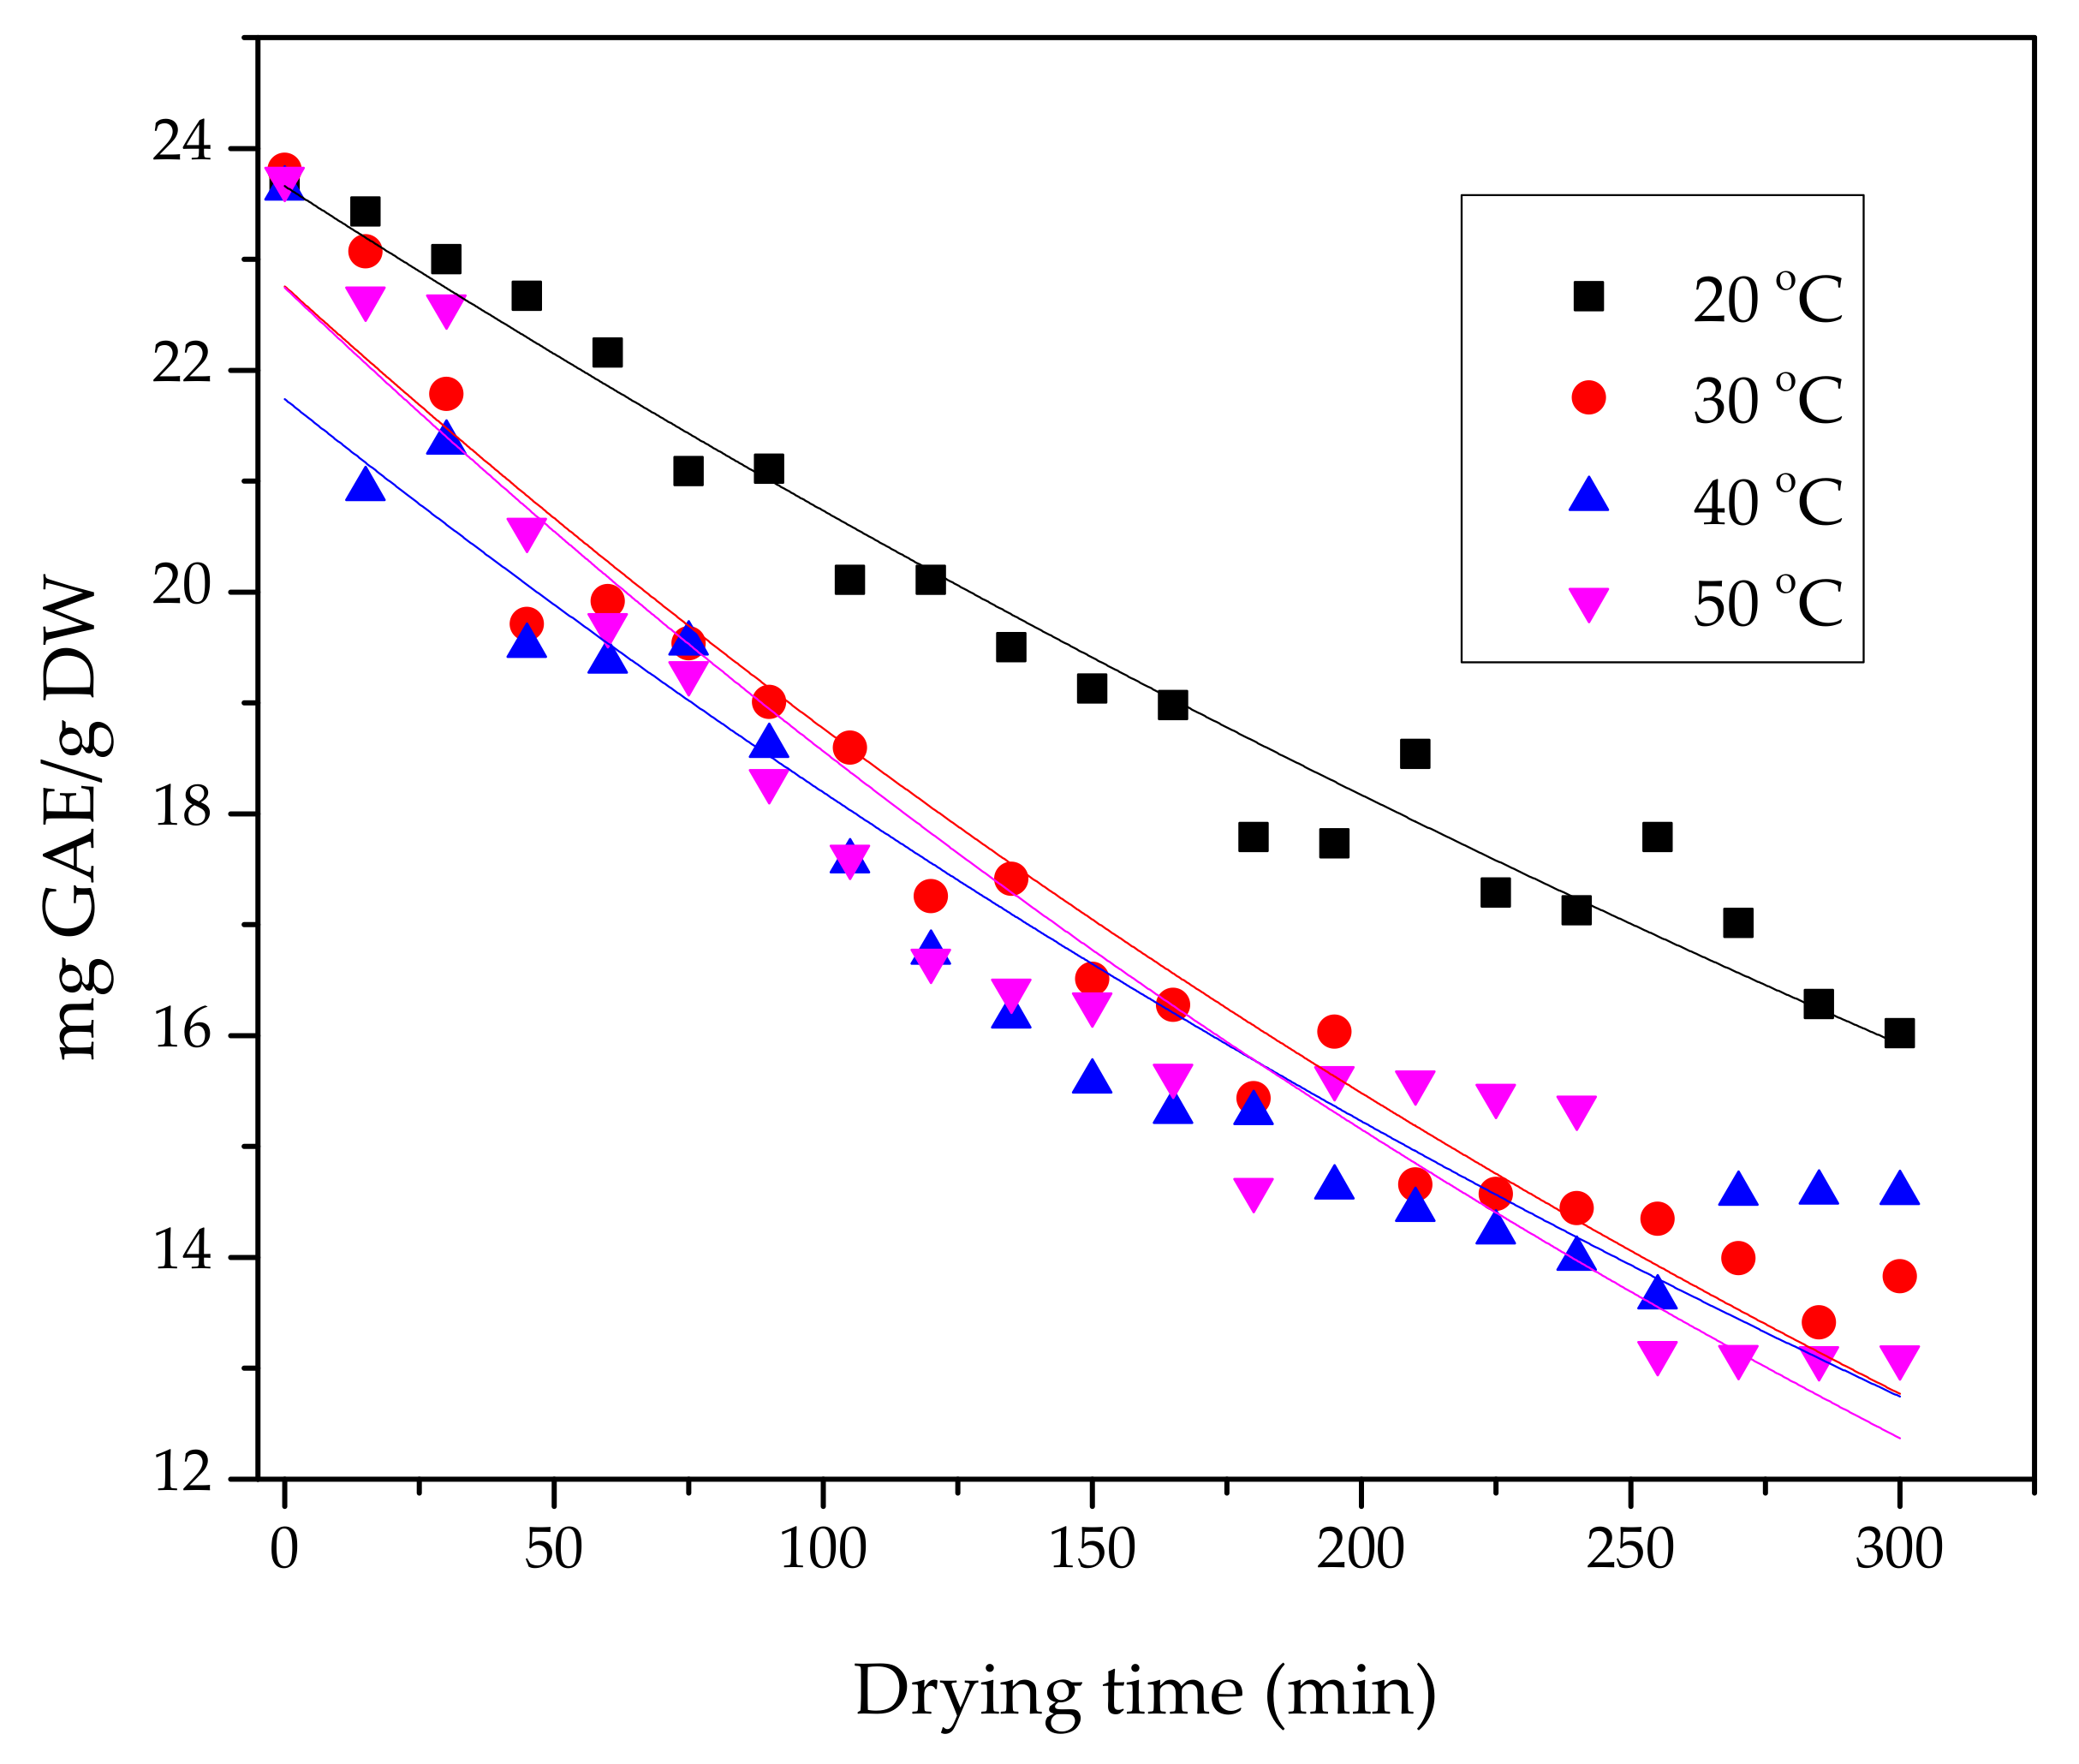
3.1. Variation of Total Polyphenol Content during Heat Pump Drying of Soursop Fruit

Most polyphenol compounds are structurally susceptible to oxidation. Therefore, this is the main cause for the decrease in TPC after processing. According to the results of ANOVA analysis, the effects of time and temperature on TPC in the drying process are statistically significant (p < 0.05). The drying time was gradually increased to 300 min at 20 °C. About 33% of TPC is degraded (Figure 1). Oxidation of polyphenol compounds normally occurs by two mechanisms (enzymatic and non–enzymatic) [35]. The increase in temperature during drying accelerates the reaction between amino groups and the degradation of sugars in the feedstock. After many stages of transformation into Schiff, ketose amino. Melanoidin are formed by condensation. The report of Vanzour et al., has shown that the oxidation of phenolic compounds is due to the occurrence of the Maillard reaction [36]. A similar report by Billaud et al., mentioned a high probability of Maillard reactions in environments with low humidity [37]. The higher the temperature supplied to the drying process, the greater the evaporation of water in the air. The rate of moisture transport from the material to the environment increases when the temperature is increased from 20–50 °C, corresponding to the increase in solids concentration in the raw material at the same drying time. This is what leads to enhanced interaction between sugars and amino acids. An inverse correlation between sugar/amino acid interactions and nutritional content has been shown in previous studies [37]. The results of the comparison of the four investigated temperature levels showed that there was a large difference in the degree of TPC degradation between the drying process at 20 °C and the drying processes at 30–50 °C. At 20 °C, TPC degraded less than TPC at the remaining investigated temperatures. The degradation of TPC slowed down with the gradual increase in the drying temperature to 50 °C. The investigation range of drying temperature from 40–50 °C did not have a significant difference in TPC in slices of soursop. This slow degradation of TPC can be explained based on the average kinetic energy of the molecules/atoms present in the medium. The greater the kinetic energy, the greater the effect on the components in the material. The kinetic energy of the atoms/molecules in the drying medium tends to increase slowly with increasing temperature—this was shown in a previous report when investigating with a hot air dryer [38]. On the other hand, the degradation of polyphenols is also affected by common enzymes, e.g., polyphenol oxidase (PPO), lipoxygenase (LOX) and peroxidase (POD). PPO has the ability to react with oxygen in the environment. Melanin is formed from the hydroxylation of monophenols to O–diphenol and the oxidation of O–diphenol to O–quinone [39]. The interaction of polyphenols with PPO leading to TPC degradation was also demonstrated in the report of Lopez–Nicholas and Garciacarmona [39,40]. TPC depletion in soursop can be influenced by LOX and POD enzymes. After the oxidation of metal ions in the enzyme, they act as an oxidation catalyst and participate in the oxidation of phenol [35,36,41]. The blanching process in the study did not completely inactivate the enzymes in soursop because of the thermal stability and high quantity of one enzyme (POD) in all other enzymes. A previous report confirmed that it was not possible to completely inactivate the enzyme [42]. Therefore, TPC degradation during drying is evident. On the other hand, the continuous increase in drying time leads to an increase in the contact time of enzymes and polyphenols with the air in the drying chamber, which leads to the increasing oxidation of phenol compounds over time. The influence of temperature on TPC was also shown in some previous reports (e.g., Zielinska et al. [43], C.L Hii et al. [22], S. Ong et al. [44]).

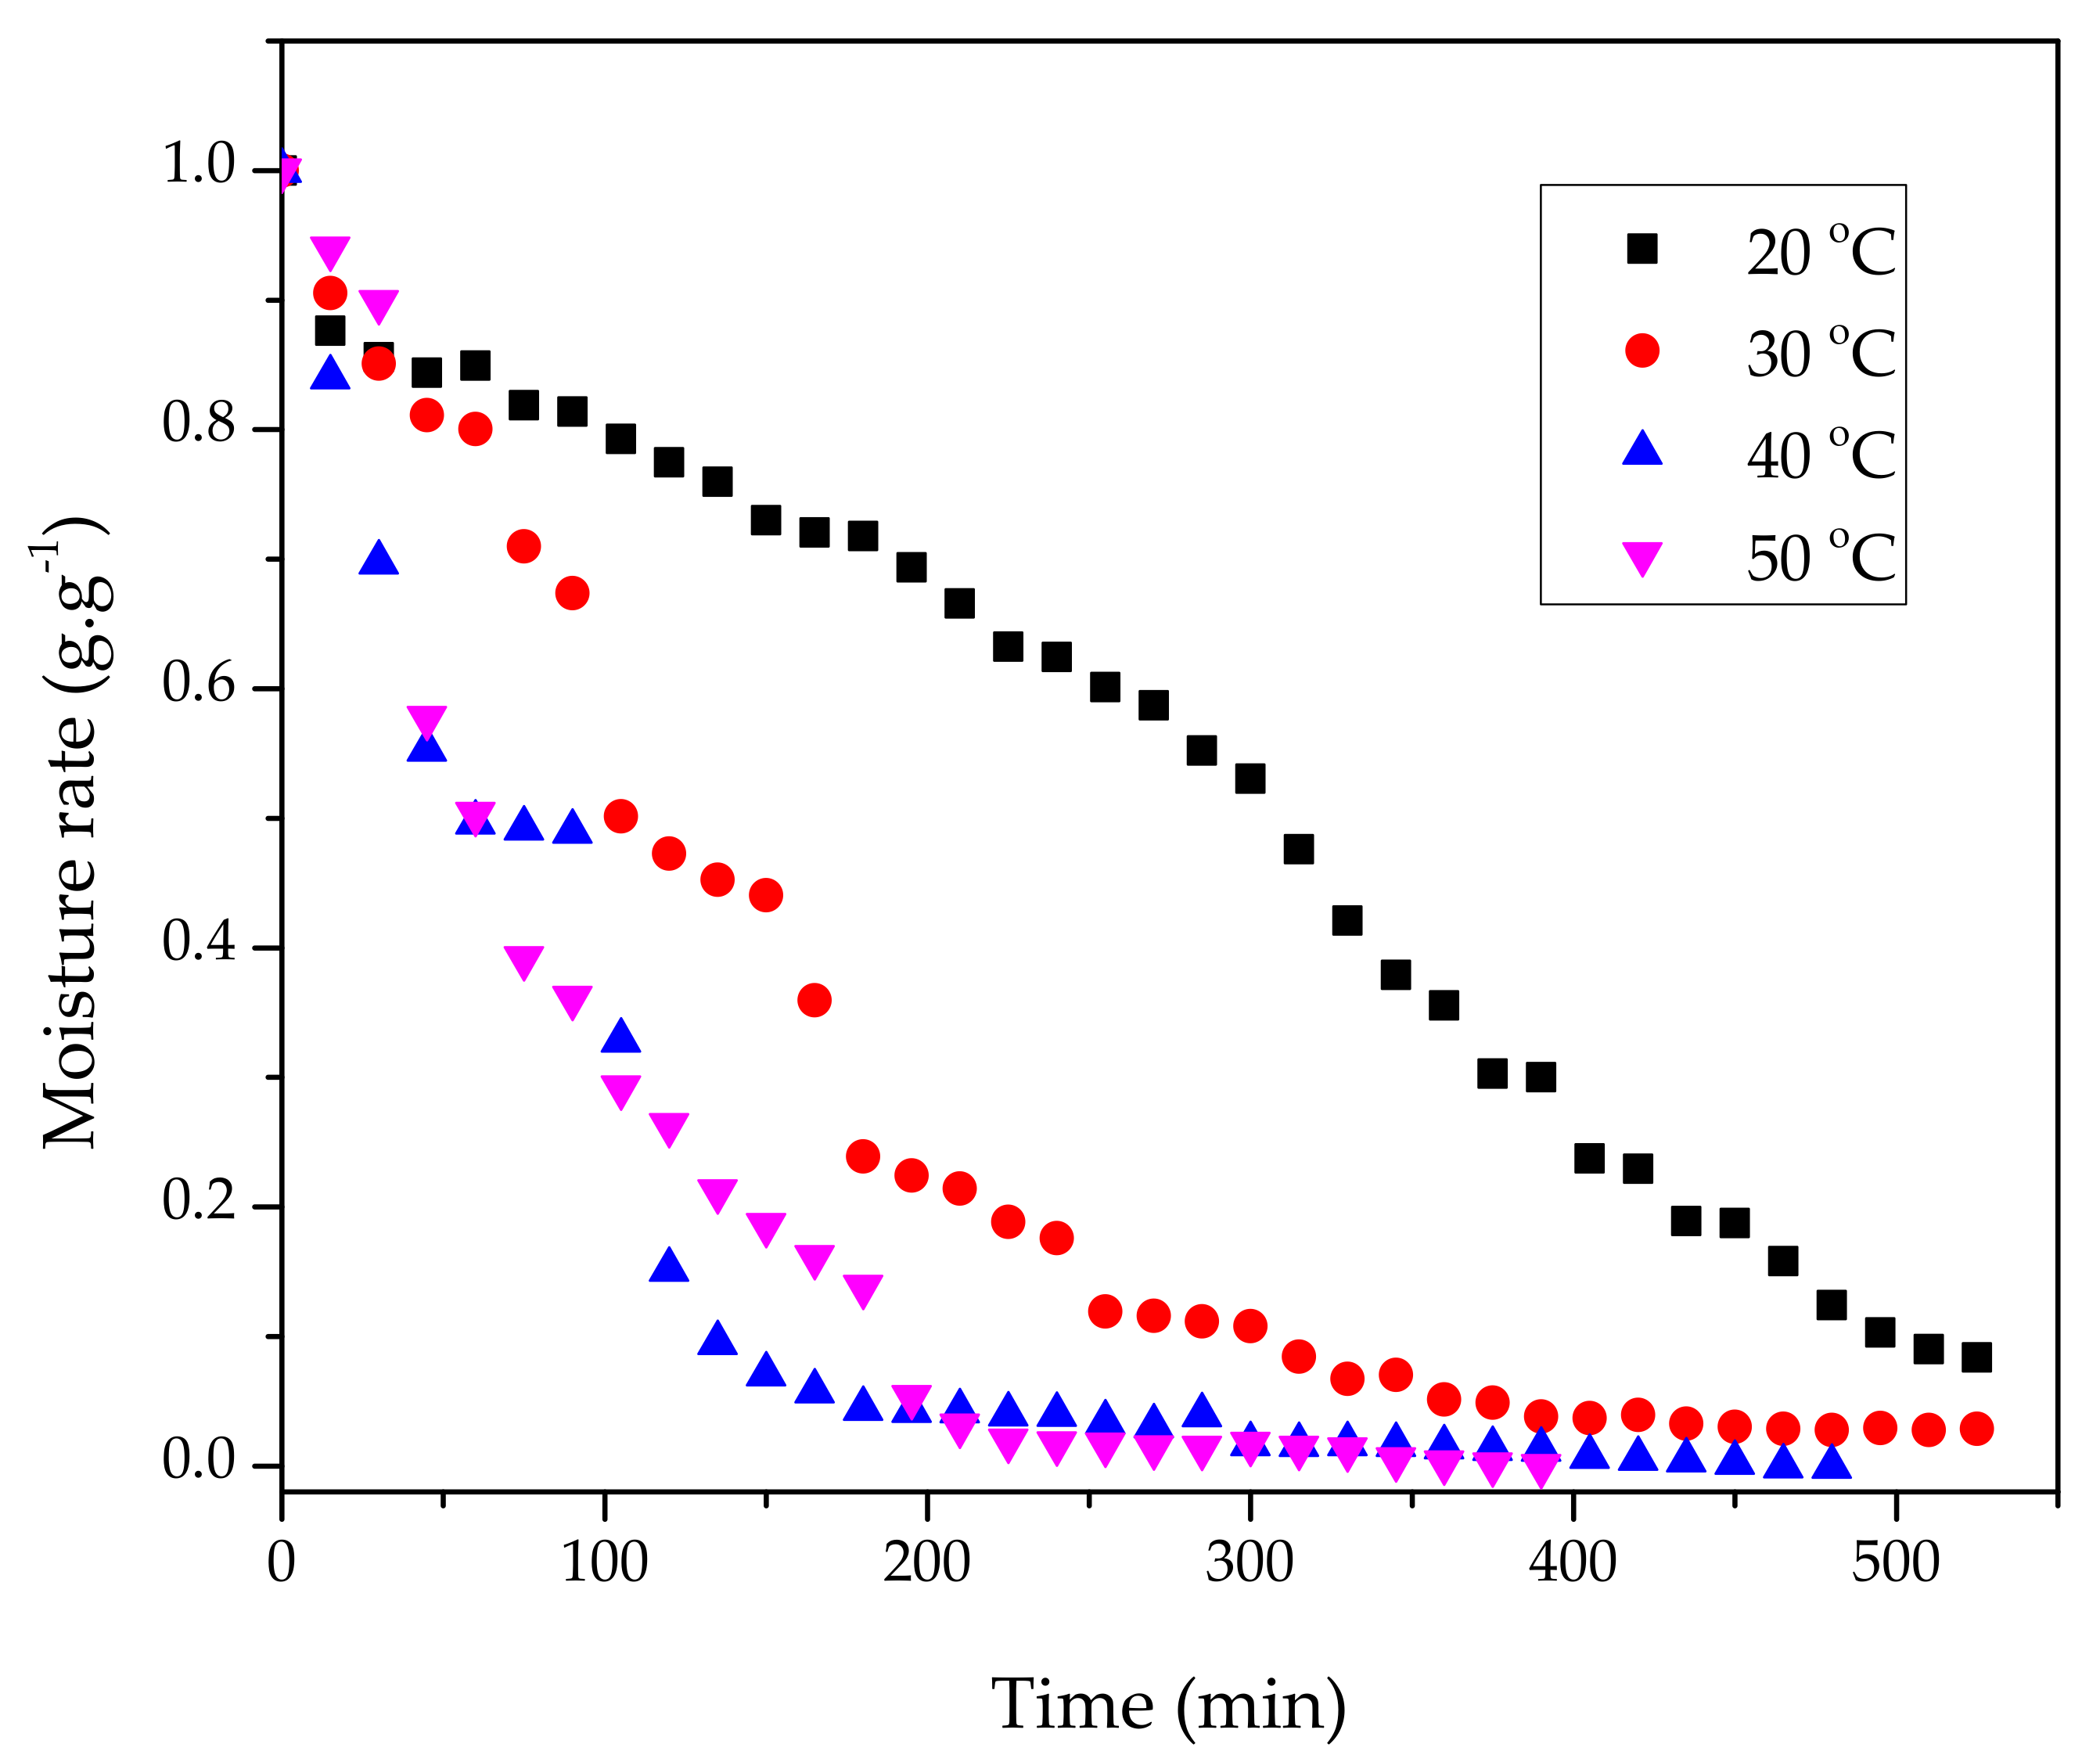
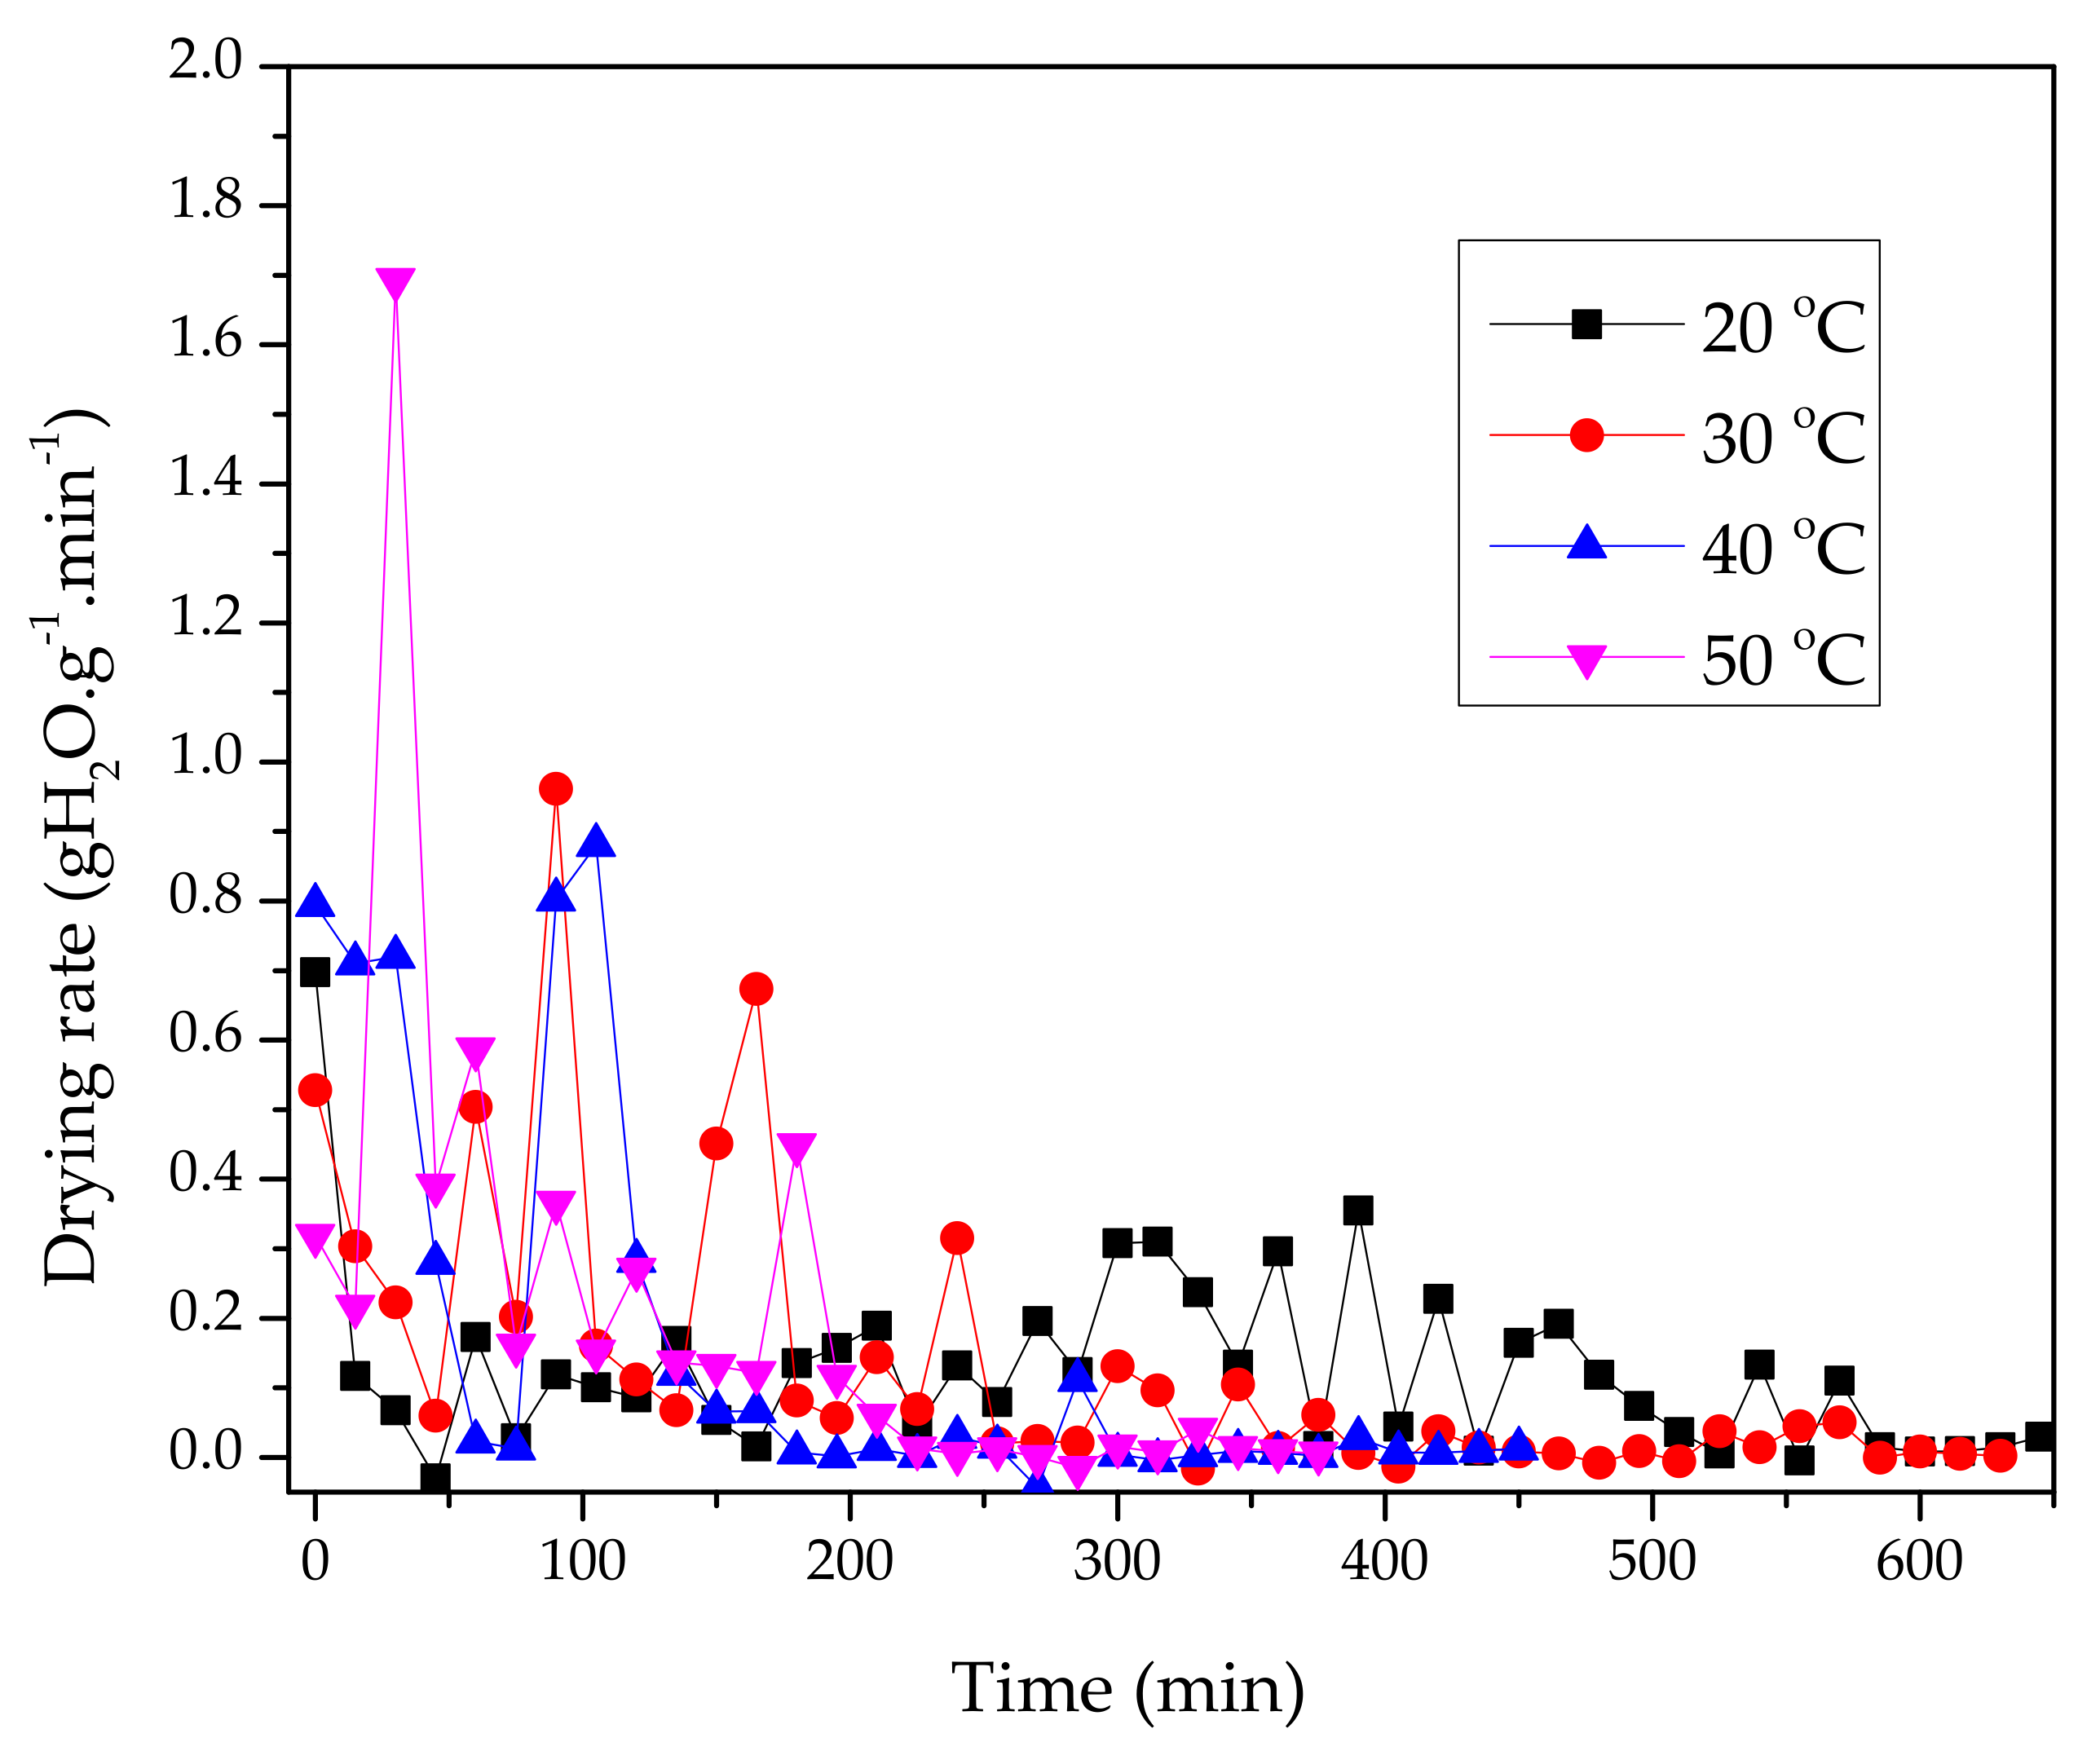
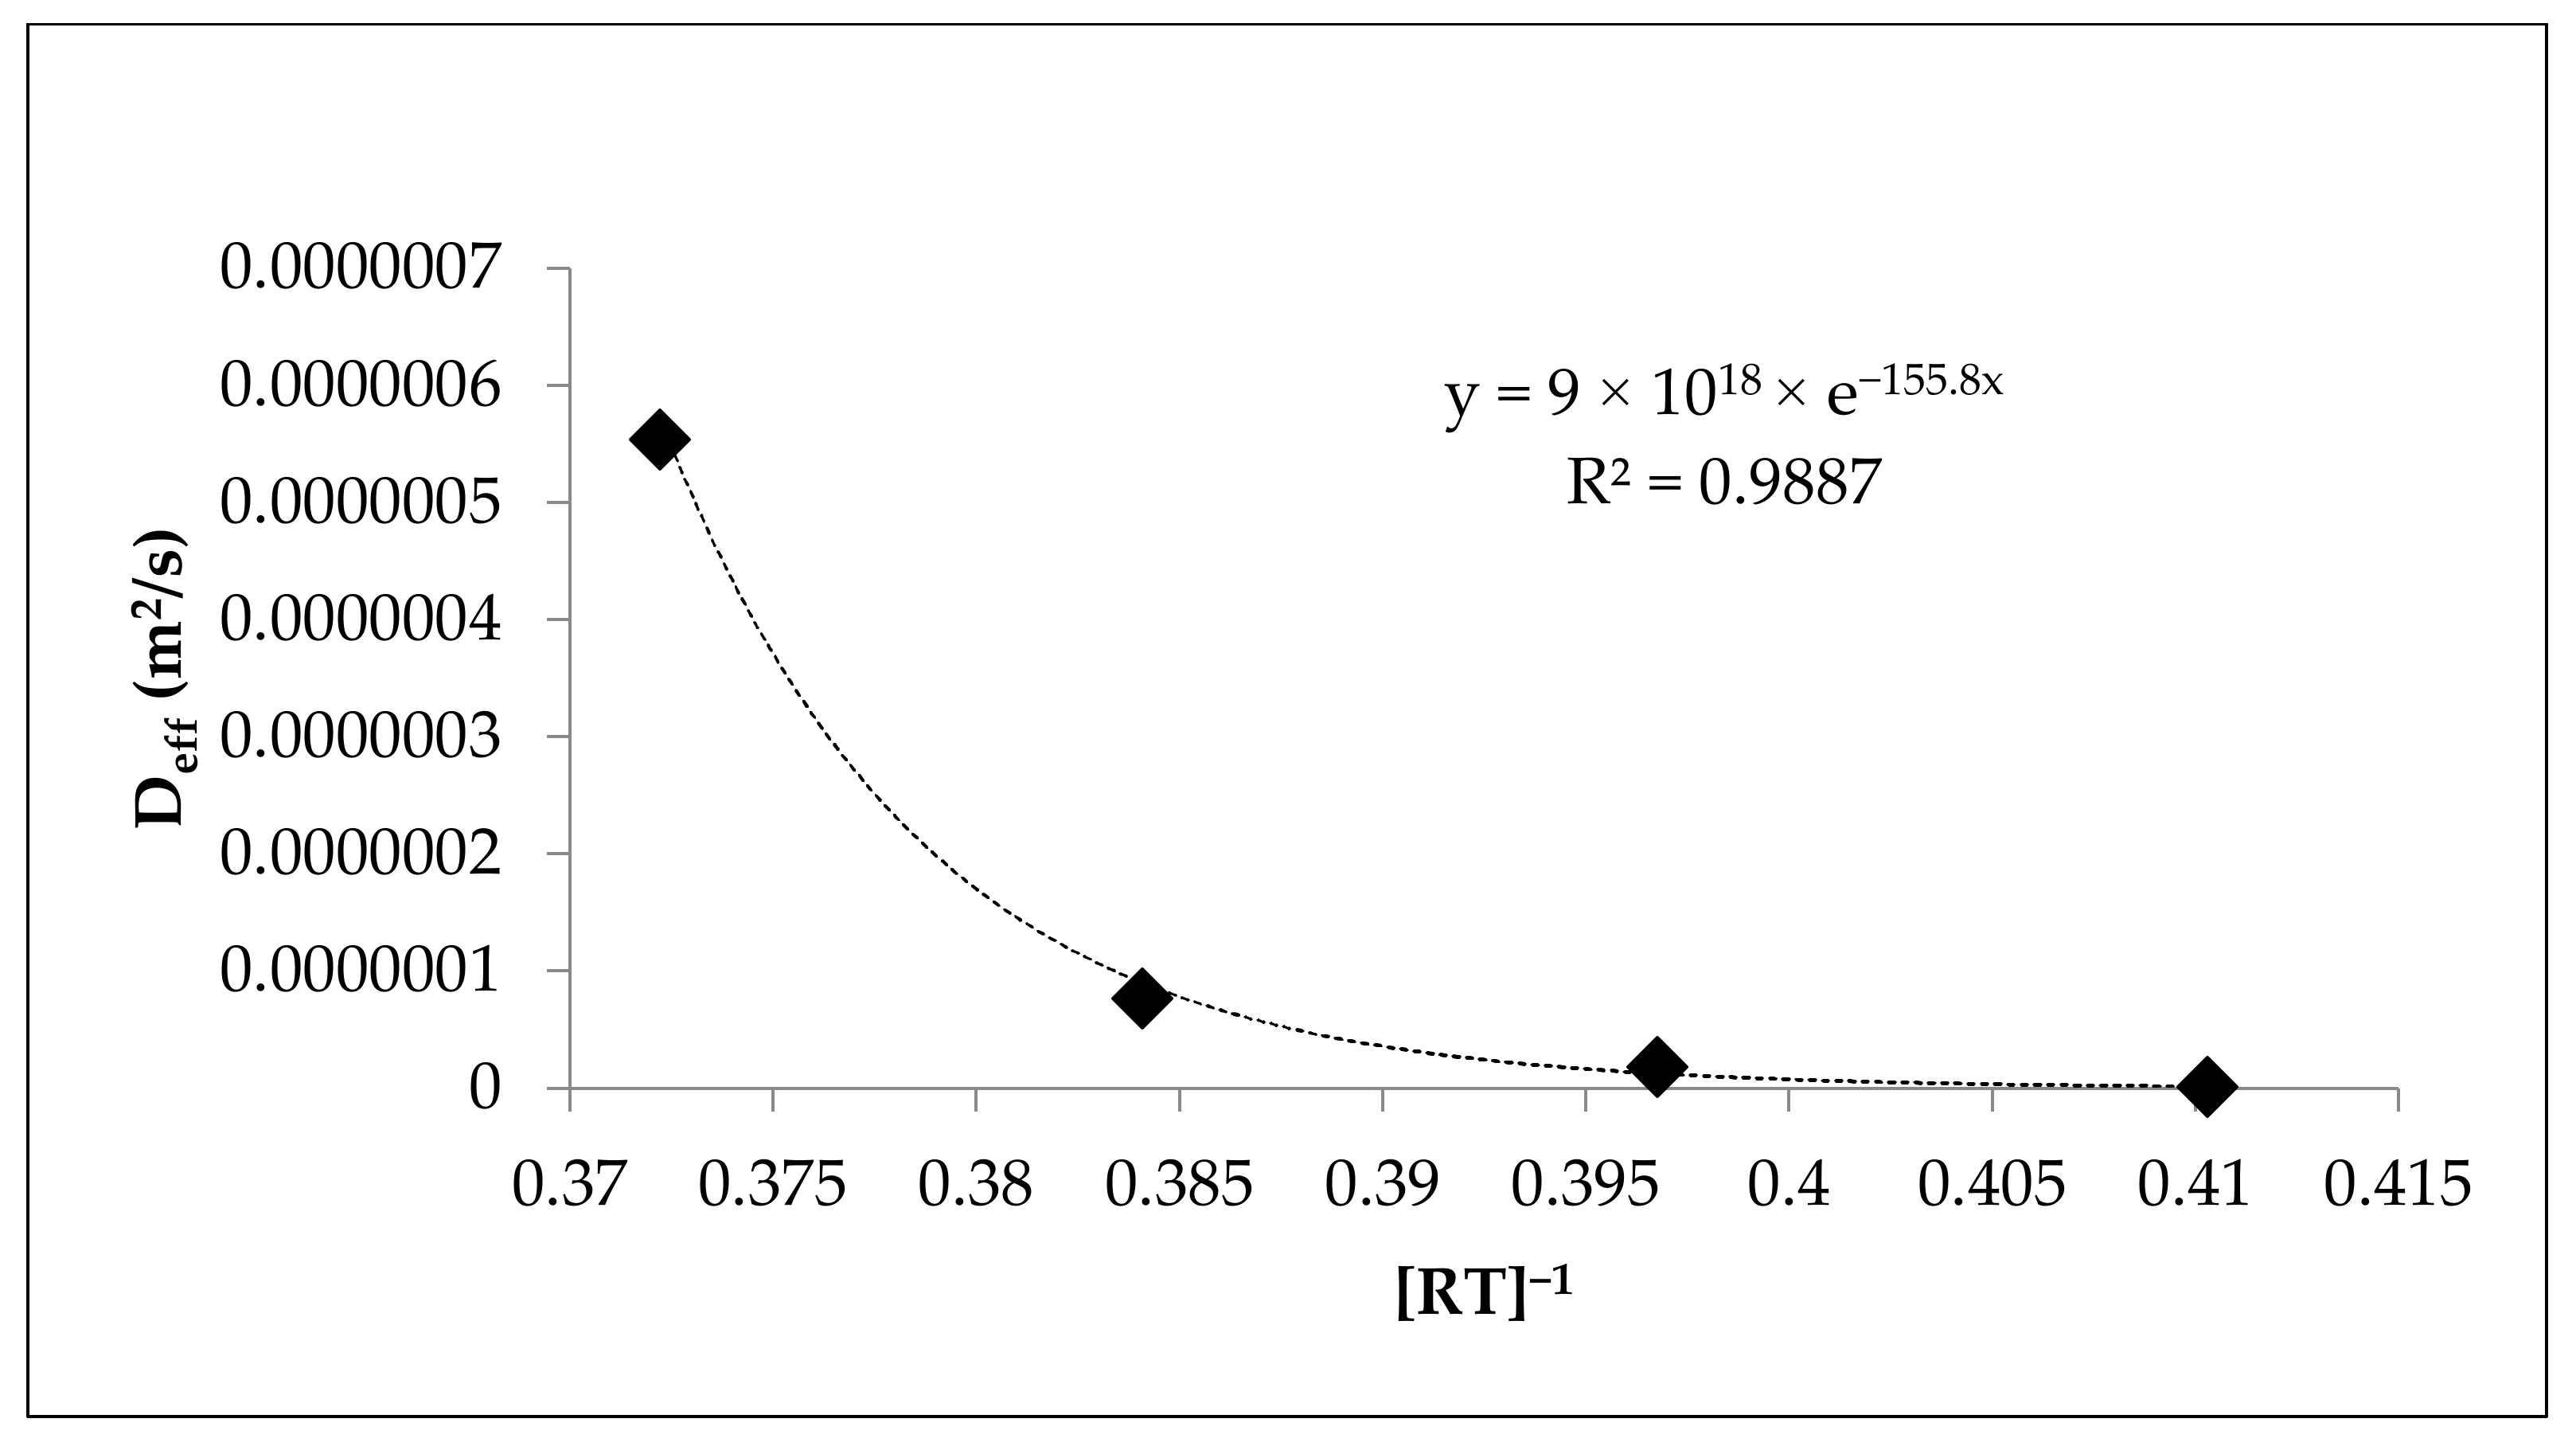
3.2. Kinetics of Moisture Loss during Heat Pump Drying

The heat pump drying process of soursop slices was investigated at a temperature range of 20–50 °C [45]. The effects of time and temperature on the MR in the material had a statistical significance (p < 0.05). The correlation between MC at specific time and MR is positive. The initial MC before drying of the raw material is 80.54 ± 2.59% [2]. Figure 2 has shown the correlation between MR and drying time. Increasing drying time leads to a decrease in MR, the investigated temperature range was from 30 to 50 °C and during the first 200 min of the drying process, there was a rapid decrease in the MR. This is due to the difference in MC between the inside of the raw material and the drying environment. The drying time is from 200 to 500 min, MR tends to decrease slowly to 0. At a temperature of 20 °C, the MR value decreased slowly with increasing time from 0 to 500 min. At low temperature, the difference between the MC in the raw material and the drying medium is small. Therefore, the process of moisture drainage of the material is slow. At different temperature conditions, different drying times are required to achieve a constant MC. Heat pump drying at 20 °C requires about 590 min to bring the MR of the material to constant. Similarly for three temperature milestones of 30 °C, 40 °C, 50 °C, the minimum time for MR to be constant is 375 min, 300 min, 250 min, respectively. The amount of drying time at 20 °C takes 2.2 times more than performing drying at 50 °C. The results show the close relationship of time and temperature in the drying process of raw materials. The higher the drying temperature, the less moisture in the air. The difference in MC inside and outside the raw material is large. This increases the rate of moisture conduction to the outside of the air based on the principle of transporting matter from an area of high concentration to an area of low concentration. Therefore, drying at high temperature shortens drying time more effectively than drying at low temperature [46]. These results are consistent with a previous study where increasing the air temperature reduced drying time [4,47]. During heat pump drying at temperatures of 30 and 40 °C, the drying curve tends to be steeper than that at 50 °C. In particular, in the period from 75–125 min for the drying process at 40 °C and 150–175 min for the drying process at 30 °C. At the drying temperature of 50 °C, the drying curve tends to decrease continuously and the MR does not have a sudden decrease. This can be explained by the energy and temperature provided for the drying process at 30 and 40 °C not being sufficient to move moisture continuously from the center of the material to the outside of the environment, the MC phase is diffused. inside the material and a large concentration of moisture in the cell layer near the surface before moving to the surface which is evident in the drying time of 50–75 min at 40 °C and 125–150 min at 30 °C. Moisture moves from the near–surface flesh to the surface of the material rapidly, and rapid moisture loss occurs as soon as a quantity of moisture is transferred to the surface with no or very little moisture being further displaced to the surface of the material. The energy provided for the drying process at 50 °C is large, the phenomenon of cell shrinkage facilitates the loss of moisture in the material and the diffusion rate occurs rapidly and continuously. The time for moisture diffusion in the material is negligible. Therefore, it is difficult to notice this stage.
The variation of the drying rate (DR) depends on the drying temperature and time. Drying at a high temperature (50 °C) during the first 50 min, the DR reached the highest value (1.7 gH2O.g−1.min−1) when investigating 4 temperature levels from 20–50 °C. Continuing to increase the drying time (>50 min), the DR was decreased rapidly (Figure 3). There is a large difference in MC inside and outside the material when drying at high temperature (50 °C), the MC in the material is quickly released. Continuing to increase the drying time at the same temperature, the MC difference between the raw materials and the drying medium decreases, resulting in a significantly reduced DR. On the other hand, in the early stages of the drying process, the MC on the product surface and its exposure to dry air is very large and there is no interference between this contact [24]. Therefore, a large loss of MC in the early stages is obvious [48]. During this drying period, the DR was continuously reduced until the balance between MC on the surface of the material and the air. The next drying time (from 75 to 220 min at a temperature of 50 °C), the MC on the surface of the material was gradually exhausted. Phase 2 of the drying process then begins to take place, the MC of the material is diffused within the internal material before moving out of the material surface. This interpretation is the same for the 20 °C, 30 °C and 40 °C temperature levels. However, this process often happens quickly, making it difficult to detect. In general, the higher the temperature, the greater the MR in the early stages of the drying process. The general trend for the temperature levels is a gradual decrease in DR with drying time. However, in the first time, the higher the DR, the lower the DR in the next time and quickly achieve a constant MC of the sample. This is evident during the drying process at a temperature of 30–50 °C. At the same time, in the first stage of the drying process, the higher the temperature, the higher the drying rate, and vice versa in the later stage of the drying process. At low drying temperature (20 °C), the MR of the material is very slow at all time points. The time for the MR to reach a constant state at 20 °C is 590 min. The gradual increase in the drying temperature leads to a decrease in time. The drying process at 50 °C takes about 250 min for the DR to reach a constant state.
The kinematics of the drying process are often described by various classical models. The coefficients of determination (R2) and Chi–square (X2) values are shown in Table 2. The fit of the classical models to the soursop drying curve is based on the R2 value. The higher the R2 value, the better the fit of the drying curve for the models. At different temperatures shows compatibility with different models. R2 value > 0.9 in the Newton/Lewis (1), Page (2), and Henderson and Pabis (3) models at drying temperature ranges. However, R2 > 0.9 is found in some models, such as the two–term (6) model at 40–50 °C, the Wang and Singh model (7) at 20, 30 and 50 °C and the Weibull model (8) at 30 and 50 °C. Based on the average of the statistical parameters (SP), the highest SP and the lowest Chi–square appear in the Singh et al., (11) model. This finding is suggested that the Singh et al., model best represents the heat pump drying of soursop slices. Moreover, recent studies also show that the Singh et al., model is effective in simulating the drying process of fruits. Therefore, this model was selected in the present study to represent the drying characteristics of soursop slices.
To predict the percentage of moisture at a specific time in this drying process, the parameters at the temperature levels of the Singh et al., model were applied and the equation was established. To demonstrate that the Singh et al., model is representative of the drying process of soursop slices, a comparison of the tested humidity ratio with predicted values at specific temperature levels is made. The effective diffusivity coefficients (Deff) at the temperatures of 20, 30, 40, and 50 °C are 1.24 × 10⁻⁹, 1.85 × 10⁻⁸, 7.69 × 10⁻⁸, and 5.54 × 10⁻⁷ m/s2, respectively. The results are consistent with a report by T.T.Y. Nhi et al., on an increase in the Deff value with the increasing drying temperature of soursop leaves [34]. Ln(Deff) is the inverse function of the absolute value of the drying temperature which is shown in Figure 4.
The slope of Deff is a straight line, representing the dependence of Arrhenius. The Deff values show that they fit perfectly in the linear regression. The results are similar to a previous report, where the logarithm of Deff was also used to demonstrate a linear relationship with [RT]−1 [8]. According to the results shown in Figure 4, R2 value = 0.9887. In addition, the Ea of moisture diffusion during the drying of soursop was estimated to be 155.8 kJ/mol. R2, Chi–square, and k values are three values used as the basis for choosing a model that is suitable for experimental data in the 12 models that are applied in this work. The SP value is the average value of all R2 values at the investigated temperatures. The SP value in the model by Singh et al., reached the highest value (SP = 0.97492). Based on R2 reaching the highest value and Chi–square reaching the lowest value, the Singh et al., model is the model of choice. The drying process at 30 °C showed that the moisture diffusion rate constant k increased by 36 times compared with the heat pump drying process at 20 °C and the k constant was only 1.789–2.02 times lower than the temperature 40–50 °C. On the other hand, the R2 value in the drying condition at 30 °C reached the highest value (R2 = 0.97815) and the Chi–square value reached the second lowest value only after the 20 °C temperature (Chi–square = 0.00204). This result clearly shows that the drying efficiency at 30 °C helps to optimize the drying process at 20, 40, and 50 °C in terms of energy used because it does not need too much energy to create the ambient temperature. At the same time, the low difference in efficiency when drying at 30–50 °C is indicated by the diffusion coefficient k (Table 3). Therefore, this model can be applied to describe the heat pump drying kinetics during the drying of soursop slices.
The kinetic equation for moisture loss from cashew fruit slices through heat pump drying at 30 °C is as follows:
MR = e 0.00613 × t 0.0171 × 0.00613 × t
where: t is drying time at any time.

3.3. Polyphenol Degradation Kinetics during Heat Pump Drying

The polyphenol degradation kinetic model was built in this study to generalize and predict the degradation level of polyphenols during the drying process of soursop by the heat pump drying method. The temperature range of 20 to 50 °C was investigated during the drying process. TPC was evaluated after every 15 min of drying at different temperatures. Experimental data were collected, processed, and the kinetics of the decomposition of polyphenol compounds were checked for compatibility of first–order and zero–order reactions (Figure 5 and Figure 6).
The results of the experimental process are processed by the software origin 9. The decomposition of polyphenols during the heat pump drying process follows the first–order reaction (Figure 6).
The first–order polyphenol degradation reaction model has the form:
dC A dt = k . C A C t = C 0 × e k × t
Under the influence of temperature and the activity of enzymes present in the raw materials. Phenolic compounds are readily broken down into colored compounds. Different drying conditions give the degradation of polyphenols with different constants. From the results shown in Figure 6, we determined the decomposition constant of polyphenol content corresponding to each different drying regime with descriptive coefficient when conducting nonlinear regression of experimental data.
R2 value and k value are two factors to be considered to select an appropriate model that describes the TPC degradation process during heat pump drying of soursop slices. The SP value is the average of the R2 values at the investigated temperatures. The SP value in the first–order kinetic model reached the highest value (SP = 0.9405) (Table 4). At the drying temperature condition of 20 °C, the R2 value reached the highest value (R2 = 0.9693). At the same time, the decomposition rate constant reached the lowest value (k = 0.0013). Therefore, the first–order reaction model was used to predict the residual TPC in the feedstock with the decomposition rate constant k = 0.0013 when drying the soursop slices at 20 °C. The lower the decomposition rate constant, the lower the TPC loss during heat pump drying. This helps to store maximum nutritional content after processing dried products from soursop slices. The equation to predict the remaining TPC in the raw materials is:
Ct = C0 × e−0.0013t
where: Ct: TPC at any time during the drying process, C0: the original TPC of the material, t: the time to perform the drying process at any time. Some previous reports have shown the reduction in polyphenols during the drying process of cocoa, and the author also shows that the kinetic model of TPC degradation of cocoa during drying follows a first–order reaction [3]. In the report of Jaiswal et al., it was shown that TPC in cabbage is affected by temperature during drying and the study data follows a first–order response with coefficient of determination (R2 > 0.94) [49].

4. Conclusions

In this study, we used the flesh and rind of soursop fruit to evaluate the effects of temperature and time on TPC, and to monitor the moisture loss in soursop slices. The results show that the influence of temperature on TPC increases with increasing drying temperature from 20–50 °C. During the drying process, at a temperature of 30–50 °C, the moisture content in the raw materials decreased sharply during the first 200 min. The rate of moisture reduction gradually slows down when drying is continued for > 200 min. The drying process at 20 °C has a very slow moisture rate. Moreover, the study has shown the compatibility of experimental data with the Singh et al., model (R2 = 0.97815) at the drying temperature of 30 °C. At this condition, it takes 375 min to dry the material and retain maximum TPC, while at the same time economically optimizing the production process. In addition, the study identified a first–order response model that predicted TPC degradation during the drying of soursop (R2 = 0.9693). The result is an important contribution to the field of food drying, especially fruit and vegetables, in predicting the TPC remaining in the dried product when similar studies on the model are found. The kinetics of nutrient breakdown have not been focused on.

Author Contributions

Conceptualization, N.D.V., L.B.H. and P.T.D.; methodology, N.D.V., T.D.L. and P.T.D.; software, N.D.V., T.D.L. and P.T.D.; validation, N.D.V. and P.T.D.; formal analysis, N.D.V., P.L.A.D. and N.T.M.P.; investigation, N.D.V., P.L.A.D. and N.T.M.P.; resources, P.T.D. and N.T.Y.T.; data curation, P.T.D. and N.T.Y.T.; writing—original draft preparation, N.D.V.; writing—review and editing, N.D.V.; visualization, P.T.D.; supervision, P.T.D.; project administration, N.D.V.; funding acquisition, N.D.V. and P.T.D. All authors have read and agreed to the published version of the manuscript.

Funding

The study was supported by The Youth Incubator for Science and Technology Programme, managed by Youth Development Science and Technology Center—Ho Chi Minh Communist Youth Union and Department of Science and Technology of Ho Chi Minh City, the contract number is “42/2021/HĐ–KHCNT–VƯ” signed on 8 December 2021.

Data Availability Statement

All the data is available within the manuscript.

Acknowledgments

Authors would like to thank for the research funding from The Youth Incubator for Science and Technology Programme, managed by Youth Development Science and Technology Center—Ho Chi Minh Communist Youth Union and Department of Science and Technology of Ho Chi Minh City and facility support from Nguyen Tat Thanh University, Ho Chi Minh City, Vietnam.

Conflicts of Interest

The authors declare no conflict of interest.

References

  1. González, E.M.; Fernández, A.E.L.; Sáyago-Ayerdi, S.G.; Estrada, R.M.V.; Vallejo, L.G.Z. In vitro antioxidant capacity of crude extracts and acetogenin fraction of soursop fruit pulp. Pharm. Anal. Acta 2017, 8, 6. [Google Scholar]
  2. Badrie, N.; Schauss, A.G. Soursop (Annona muricata L.): Composition, nutritional value, medicinal uses, and toxicology. Bioact. Foods Promot. Health 2010, 39, 621–643. [Google Scholar]
  3. Alean, J.; Chejne, F.; Rojano, B. Degradation of polyphenols during the cocoa drying process. J. Food Eng. 2016, 189, 99–105. [Google Scholar] [CrossRef]
  4. Dao, T.P.; Vu, D.N.; Nguyen, D.V.; Pham, V.T.; Tran, T.Y.N. Study of jelly drying cashew apples (Anacardium occidentale L.) processing. Food Sci. Nutr. 2021, 10, 363–373. [Google Scholar] [CrossRef]
  5. Tran, N.Y.; Nhan, N.P.; Thanh, V.T.; Chinh, N.D.; Tri, D.L.; Nguyen, D.V.; Vy, T.A.; Truc, T.T.; Thinh, P.V. Effect of storage condition on color, vitamin C content, polyphenol content and antioxidant activity in fresh soursop pulp (Annona muricata L.). IOP Conf. Ser. Mater. Sci. Eng. 2020, 736, 22065. [Google Scholar] [CrossRef]
  6. Garau, M.C.; Simal, S.; Rossello, C.; Femenia, A. Effect of air-drying temperature on physico-chemical properties of dietary fibre and antioxidant capacity of orange (Citrus aurantium v. Canoneta) by-products. Food Chem. 2007, 104, 1014–1024. [Google Scholar] [CrossRef]
  7. Roman, M.C.; Fabani, M.P.; Luna, L.C.; Feresin, G.E.; Mazza, G.; Rodriguez, R. Convective drying of yellow discarded onion (Angaco INTA): Modelling of moisture loss kinetics and effect on phenolic compounds. Inf. Process. Agric. 2020, 7, 333–341. [Google Scholar] [CrossRef]
  8. Tran, N.Y.; Nhan, N.P.; Thanh, V.T.; Nguyen, D.V.; Thinh, P.V.; Vy, T.A.; Lam, T.D.; Truc, T.T. Effects of drying conditions on total phenolic content and other parameters of soursop jelly (Annona muricata L.). IOP Conf. Ser. Mater. Sci. Eng. 2020, 736, 022064. [Google Scholar] [CrossRef]
  9. Jimenez, V.M.; Gruschwitz, M.; Schweiggert, R.M.; Carle, R.; Esquivel, P. Identification of phenolic compounds in soursop (Annona muricata) pulp by high-performance liquid chromatography with diode array and electrospray ionization mass spectrometric detection. Food Res. Int. 2014, 65, 42–46. [Google Scholar] [CrossRef]
  10. De Andrade, J.M.M.; Fasolo, D. Polyphenol antioxidants from natural sources and contribution to health promotion. Polyphen. Hum. Health Dis. 2014, 20, 253–265. [Google Scholar]
  11. Kyi, T.M.; Daud, W.R.W.; Mohammad, A.B.; Samsudin, M.W.; Kadhum, A.A.H.; Talib, M.Z.M. The kinetics of polyphenol degradation during the drying of Malaysian cocoa beans. Int. J. Food Sci. Technol. 2005, 40, 323–331. [Google Scholar] [CrossRef]
  12. Zhou, L.; Cao, Z.; Bi, J.; Yi, J.; Chen, Q.; Wu, X.; Zhou, M. Degradation kinetics of total phenolic compounds, capsaicinoids and antioxidant activity in red pepper during hot air and infrared drying process. Int. J. Food Sci. Technol. 2016, 51, 842–853. [Google Scholar] [CrossRef]
  13. Tan, S.; Miao, Y.; Xiang, H.; Tan, W.; Li, W. Effects of air-impingement jet drying on drying kinetics and quality retention of tomato slices. Food Sci. Biotechnol. 2021, 30, 691–699. [Google Scholar] [CrossRef]
  14. Salehi, F.; Kashaninejad, M. Modeling of moisture loss kinetics and color changes in the surface of lemon slice during the combined infrared-vacuum drying. Inf. Process. Agric. 2018, 5, 516–523. [Google Scholar] [CrossRef]
  15. Srikiatden, J.; Roberts, J.S. Moisture loss kinetics of apple during convective hot air and isothermal drying. Int. J. Food Prop. 2005, 8, 493–512. [Google Scholar] [CrossRef] [Green Version]
  16. Rodriguez, R.; Lombrana, J.I.; Kamel, M.; de Elvira, C. Kinetic and quality study of mushroom drying under microwave and vacuum. Dry. Technol. 2005, 23, 2197–2213. [Google Scholar] [CrossRef] [Green Version]
  17. Dao, T.P.; Nguyen, D.V.; Tran, T.Y.; Pham, T.N.; Nguyen, P.T.; Bach, L.G.; Nguyen, V.H.; Do, V.Q.; Nguyen, V.M.; Tran, T.T. Effects of tannin, ascorbic acid, and total phenolic contents of cashew (Anacardium occidentale L.) apples blanched with saline solution. Food Res. 2021, 5, 409–416. [Google Scholar] [CrossRef]
  18. Olalusi, A.P.; Erinle, O. Influence of drying temperature and pretreatment on the drying characteristics and quality of dried cashew (Anacardium occidentale L.) apple slices. Croat. J. Food Sci. Technol. 2019, 11, 97–103. [Google Scholar] [CrossRef]
  19. Di Bucchianico, A. Coefficient of determination (R2). Encycl. Stat. Qual. Reliab. 2008, 1. [Google Scholar] [CrossRef]
  20. Zarein, M.; Samadi, S.H.; Ghobadian, B. Investigation of microwave dryer effect on energy efficiency during drying of apple slices. J. Saudi Soc. Agric. Sci. 2015, 14, 41–47. [Google Scholar] [CrossRef] [Green Version]
  21. Guo, H.L.; Chen, Y.; Xu, W.; Xu, M.T.; Sun, Y.; Wang, X.C.; Wang, X.Y.; Luo, J.; Zhang, H.; Xiong, Y.K. Assessment of drying kinetics, textural and aroma attributes of mentha haplocalyx leaves during the hot air thin-layer drying process. Foods 2022, 11, 784. [Google Scholar] [CrossRef] [PubMed]
  22. Hii, C.L.; Law, C.L.; Suzannah, S. Drying kinetics of the individual layer of cocoa beans during heat pump drying. J. Food Eng. 2012, 108, 276–282. [Google Scholar] [CrossRef]
  23. Mishra, A.; Sharma, N. Mathematical modelling and tray drying kinetics of loquat (Eriobotrya japonica). J. Dairy Food Sci. 2014, 9, 272–284. [Google Scholar] [CrossRef]
  24. Page, G.E. Factors Influencing the Maximum Rates of Air Drying Shelled Corn in Thin Layers; Purdue University: West Lafayette, India, 1949. [Google Scholar]
  25. Doymaz, I. Sun drying of figs: An experimental study. J. Food Eng. 2005, 71, 403–407. [Google Scholar] [CrossRef]
  26. Midilli, A.; Kucuk, H. Mathematical modeling of thin layer drying of pistachio by using solar energy. Energy Convers. Manag. 2003, 44, 1111–1122. [Google Scholar] [CrossRef]
  27. Toğrul, İ.T.; Pehlivan, D. Mathematical modelling of solar drying of apricots in thin layers. J. Food Eng. 2002, 55, 209–216. [Google Scholar] [CrossRef]
  28. Henderson, S.M. Progress in developing the thin layer drying equation. Trans. ASAE 1974, 17, 1167–1168. [Google Scholar] [CrossRef]
  29. Murthy, D.N.P.; Xie, M.; Jiang, R. Weibull Models; John Wiley & Sons.: Hoboken, NJ, USA, 2004. [Google Scholar]
  30. Akpinar, E.; Midilli, A.; Bicer, Y. Single layer drying behaviour of potato slices in a convective cyclone dryer and mathematical modeling. Energy Convers. Manag. 2003, 44, 1689–1705. [Google Scholar] [CrossRef]
  31. Singh, F.; Katiyar, V.K.; Singh, B.P. Mathematical modeling to study drying characteristic of apple and potato. J. Food Sci. Technol. 2014, 52, 5442–5455. [Google Scholar] [CrossRef] [Green Version]
  32. Barroca, M.J.; Guiné, R. Study of drying kinetics of quince. In Proceedings of the International Conference of Agricultural Engineering CIGR-AgEng2012, Valencia, Spain, 8–12 July 2012. [Google Scholar]
  33. Dadali, G.; Demirhan, E.; Özbek, B. Color change kinetics of spinach undergoing microwave drying. Dry. Technol. 2007, 25, 1713–1723. [Google Scholar] [CrossRef]
  34. Nhi, T.T.; Thinh, P.V.; Vu, N.D.; Bay, N.T.; Tho, N.T.; Quyen, N.N.; Truc, T.T. Kinetic model of moisture diffusivity in soursop leaves (Annona muricata L.) by convection drying. IOP Conf. Ser. Mater. Sci. Eng. 2020, 991, 012107. [Google Scholar] [CrossRef]
  35. McSweeney, M.; Seetharaman, K. State of polyphenols in the drying process of fruits and vegetables. Crit. Rev. Food Sci. Nutr. 2015, 55, 660–669. [Google Scholar] [CrossRef]
  36. Vauzour, D.; Rodriguez-Mateos, A.; Corona, G.; Oruna-Concha, M.J.; Spencer, J.P.E. Polyphenols and human health: Prevention of disease and mechanisms of action. Nutrients 2010, 2, 1106–1131. [Google Scholar] [CrossRef]
  37. Billaud, C.; Maraschin, C.; Chow, Y.; Chériot, S.; Peyrat-Maillard, M.; Nicolas, J. Maillard reaction products as ‘natural antibrowning’ agents in fruit and vegetable technology. Mol. Nutr. Food Res. 2005, 49, 656–662. [Google Scholar] [CrossRef]
  38. Abbaspour-Gilandeh, Y.; Jahanbakhshi, A.; Kaveh, M. Prediction kinetic, energy and exergy of quince under hot air dryer using ANNs and ANFIS. Food Sci. Nutr. 2020, 8, 594–611. [Google Scholar] [CrossRef] [Green Version]
  39. Lopez-Nicolás, J.M.; García-Carmona, F. Enzymatic and nonenzymatic degradation of polyphenols. In Fruit and Vegetables Phytochemicals; Wiley-Blackwell Publishing: Ames, IA, USA, 2010; Volume 4, pp. 101–103. [Google Scholar]
  40. Sánchez-Ferrer, Á.; Rodríguez-López, J.N.; García-Cánovas, F.; García-Carmona, F. Tyrosinase: A comprehensive review of its mechanism. Biochim. Biophys. Acta (BBA)-Protein Struct. Mol. Enzymol. 1995, 1247, 1–11. [Google Scholar] [CrossRef]
  41. Baysal, T.; Demirdöven, A. Lipoxygenase in fruits and vegetables: A review. Enzym. Microb. Technol. 2007, 40, 491–496. [Google Scholar] [CrossRef]
  42. Eskin, N.A.M.; Grossman, S.; Pinsky, A.; Whitaker, J.R. Biochemistry of lipoxygenase in relation to food quality. Crit. Rev. Food Sci. Nutr. 1977, 9, 1–40. [Google Scholar] [CrossRef]
  43. Zielinska, M.; Michalska, A. Microwave-assisted drying of blueberry (Vaccinium corymbosum L.) fruits: Drying kinetics, polyphenols, anthocyanins, antioxidant capacity, colour and texture. Food Chem. 2016, 212, 671–680. [Google Scholar] [CrossRef]
  44. Ong, S.P.; Law, C.L. Drying kinetics and antioxidant phytochemicals retention of salak fruit under different drying and pretreatment conditions. Dry. Technol. 2011, 29, 429–441. [Google Scholar] [CrossRef]
  45. Pal, U.S.; Khan, M.K.; Mohanty, S.N. Heat pump drying of green sweet pepper. Dry. Technol. 2008, 26, 1584–1590. [Google Scholar] [CrossRef]
  46. Zheng, D.-J.; Cheng, Y.-Q.; Liu, H.-J.; Li, L.-T. Investigation of EHD-enhanced water evaporation and a novel empirical model. Int. J. Food Eng. 2011, 7, 11. [Google Scholar] [CrossRef]
  47. Chong, C.H.; Law, C.L.; Cloke, M.; Hii, C.L.; Abdullah, L.C.; Daud, W.R.W. Drying kinetics and product quality of dried Chempedak. J. Food Eng. 2008, 88, 522–527. [Google Scholar] [CrossRef]
  48. Taşeri, L.; Aktaş, M.; Şevik, S.; Gülcü, M.; Seckin, G.U.; Aktekeli, B. Determination of drying kinetics and quality parameters of grape pomace dried with a heat pump dryer. Food Chem. 2018, 260, 152–159. [Google Scholar] [CrossRef]
  49. Jaiswal, A.K.; Abu-Ghannam, N. Degradation kinetic modelling of color, texture, polyphenols and antioxidant capacity of York cabbage after microwave processing. Food Res. Int. 2013, 53, 125–133. [Google Scholar] [CrossRef]
Figure 1. Decomposition of total polyphenol content under the influence of time and temperature.
Processes 10 02082 g001
Figure 2. Variation of moisture rate (MR) over time at a temperature range of 20–50 °C.
Processes 10 02082 g002
Figure 3. Variation of drying rate over time at different temperatures (p < 0.05).
Processes 10 02082 g003
Figure 4. The Arrhenius equation and the relationship between Deff and temperature.
Processes 10 02082 g004
Figure 5. The zero–order kinetic model of polyphenols in the heat pump drying method.
Processes 10 02082 g005
Figure 6. The first–order kinetic model of polyphenols in the heat pump drying method.
Processes 10 02082 g006
Table 1. Several popular mathematical models were used in this study.
No.ModelsEquationsReferences
01Newton/Lewis M R = e k t [23]
02Page M R = e k t n [24]
03Henderson and Pabis M R = a . e k t [25]
04Midilli M R = a . e k t n + b t [26]
05Logarithmic M R = a . e k t + c [27]
06Two–term M R = a . e k 1 t + b . e k 2 t [28]
07Wang and Singh M R = 1 + a t + b t 2 [25]
08Weibull M R = α b e k 0 t n [29]
09Quadratic M R = a + bx + c x 2 [14]
10Verma M R = a . e k t + 1 a . e g t [30]
11Singh et al. M R = e kt a k t [31]
12Vega–Lemus M R = a + k t 2 [32]
Table 2. Statistical parameters of the different models.
No.ModelsValue20 °C30 °C40 °C50 °CStatistical Parameters
1Newton/LewisR20.892080.970000.969040.970000.95028
Chi–square0.008130.002000.002320.002000.00361
2PageR20.948670.991810.973650.984400.97463
Chi–square0.003870.000760.001980.001470.00202
3Henderson and PabisR20.893920.979000.968870.980000.95545
Chi–square0.008000.001000.002340.001000.00309
4MidilliR2−2.35181−0.58374−0.07385−0.26511No Fit
Chi–square0.252630.147680.080570.119130.15000
5LogarithmicR20.030770.112100.968520.190800.32555
Chi–square0.073050.082700.002360.076100.05855
6Two–termR2−3.87070−0.711320.967670.97848No Fit
Chi–square0.367110.159580.002430.002030.13279
7Wang and SinghR20.978370.986790.859740.955000.94498
Chi–square0.001630.001230.010520.004000.00435
8WeibullR20.000490.993110.220600.983960.54954
Chi–square0.075000.000640.058480.001510.03391
9QuadraticR20.987470.986420.908580.958360.96021
Chi–square0.000940.001270.006860.003920.00325
10VermaR20.888460.981460.967670.986410.95600
Chi–square0.008410.001730.002430.001280.00346
11Singh et al.R20.976420.978150.968450.976660.97492
Chi–square0.001780.002040.002370.00220.00210
12Vega–LemusR20.941950.986350.884070.95130.94092
Chi–square0.004380.001270.00870.00450.00471
Table 3. The kinematic parameters of the Singh et al., model at the temperature range of 20–50 °C.
Temp (°C)Model Parameters
kaR2Chi–Square
200.000179.390030.976420.00178
300.006130.01710.978150.00204
400.012380.001720.968450.00237
500.010960.008620.976660.00220
Table 4. Kinetic parameters of TPC decomposition in the heat pump drying method.
ModelsTemp (°C)k (min−1)C0Chi–SquareA (%)R2Statistical Parameters
Kinetic order 0200.025523.37700.24910.01260.95760.9106
300.032322.17400.65390.06860.9326
400.028621.17301.22530.10440.8521
500.033522.09201.00000.06890.9000
Kinetic order 1200.001323.65900.18030.00070.96930.9405
300.001922.75600.37760.04420.9611
400.001721.73900.87190.08040.8948
500.002022.74300.66200.04150.9370
A: Percentage deviation between the original C0 and C0 of the model.
Publisher’s Note: MDPI stays neutral with regard to jurisdictional claims in published maps and institutional affiliations.

