Article

Separation of Free Fatty Acid and Triglycerides by Molecular Distillation–Experimental and Simulation Approaches

by
Teetach Changwatchai
1,
Mitsutoshi Nakajima
2,*,
Lorena de Oliveira Felipe
3 and
Marcos A. Neves
4,*
1
School of Integrative and Global Majors, Tsukuba Life Science Innovation, University of Tsukuba, 1-1-1 Tennodai, Tsukuba 305-8577, Ibaraki, Japan
2
Alliance for Research on the Mediterranean and North Africa (ARENA), University of Tsukuba, Tsukuba 305-0006, Ibaraki, Japan
3
Graduate School of Life and Environmental Sciences, University of Tsukuba, 1-1-1 Tennodai, Tsukuba 305-0006, Ibaraki, Japan
4
Faculty of Life and Environmental Sciences, University of Tsukuba, 1-1-1 Tennodai, Tsukuba 305-0006, Ibaraki, Japan
*
Authors to whom correspondence should be addressed.
Processes 2022, 10(10), 2053; https://doi.org/10.3390/pr10102053
Submission received: 20 September 2022 / Revised: 5 October 2022 / Accepted: 6 October 2022 / Published: 11 October 2022

Abstract

:
Separation of free fatty acids and triglycerides is important in the edible oil industry. In this study, both experimental and simulation approaches were conducted using falling film molecular distillation. A binary mixture of oleic acid as free fatty acid with refined soybean oil as triglyceride was used. Evaporation temperature range tested was from 110 to 160 °C, while other parameters such as condensation temperature, feeding rate, and vacuum pressure were fixed. The free fatty acid content of retentate was gradually decreased as evaporation temperature increased, while the free fatty acid content of distillate was approximately 100 wt.%, regardless of temperature. Triglycerides had an extremely low vapor pressure compared to oleic acid; therefore, their fraction in distillate was negligible. The mass conservation and transport equations were selected to explain the evaporation mechanism, and analytical solutions were simply introduced under the conditions of low mass fraction of volatile compound in the feeding mixture. Some experimental data are re-quired to determine the coefficient of molecular distillation in the governing equation. Using this obtained parameter, the proposed model could simulate all mass amounts and fractions of each component in retentate and distillate with a good agreement between experimental and simulation data, indicating the reasonable accuracy of the model proposed.

Graphical Abstract

1. Introduction

Globally, most households consume edible vegetable oils. Since 2018, the production of edible vegetable oils has exceeded 200 million tons, and this trend is expected to continue in the coming years [1]. In general, triglycerides consist of more than 70 wt.% crude oil extracted from seeds [2]. It is a complete structure of glycerol bound by three molecules of fatty acids, thus, the remaining components in crude oil could be diglycerides, monoglycerides, and free fatty acids (FFA). For instance, the composition of diglycerides, monoglycerides, and FFA in crude palm oil is 6.3, 0.3, and 3.8 wt.%, respectively [3]. FFA are volatile compounds, may cause an unpleasant odor in edible vegetable oil [4]. Moreover, the increasing FFA content in vegetable oil reduces the oxidative stability of vegetable oil [5]. Therefore, FFA content is an indicator of edible oil quality and refining process is required to reduce FFA content to an acceptable level [6]. The recommended limit for FFA content in refined edible oil is 0.3 wt.% (as oleic acid) [7]. In contrast, the most-valued edible vegetable oil is extra virgin olive oil and is obtained by the first cold-press in mechanical extraction from olive fruits. The limit for FFA content in this oil is up to 0.8 wt.% [8]. Then, subsequential cold-pressing products are considered as virgin oil, and FFA content is allowed up to 2.0 wt.% [7]. The pleasant aromatic flavor of virgin oil is preferred by customers; however, the FFA removal process also affects the valued aromatic compounds as well [9].
The traditional method to remove FFA from crude oil is chemical refining. Almost all FFA are neutralized with sodium hydroxide in the alkali neutralizing step, and then the remaining FFA are removed with hot steam under vacuum pressure in the deodorization step [10]. For instance, chemical refining was applied to neutralize FFA in rapeseed oil, and then steam was used to remove the remaining in the deodorization step at a temperature of 240 °C, vacuum pressure of 100 Pa, and residence time of 1 h [11]. Crude rapeseed oil originally contained 0.83 wt.% FFA. After neutralization and deodorization, the FFA content dropped to 0.11 and 0.07 wt.%, respectively. Chemical refining, however, resulted in significant oil losses and wastewater contamination. The noticeable drawback of chemical refining was chemically contaminated wastewater and a considerable amount of oil product loss [6]. As a means of minimizing chemical additions and the disadvantages of chemical refining, a physical refining process has been investigated. These two processes differ in one major way: alkali neutralization. The other steps, such as degumming, washing, bleaching, and dewaxing, remain unchanged [10,12]. Steam refining is a conventional physical refining process that uses superheated steam temperatures between 220 and 270 °C and vacuum pressures between 133 and 667 Pa to remove FFA from crude oil [13]. In a physical refining process, maize and sunflower oils were successfully marketed by reducing FFA content from 5.24 to 0.3 wt.% without adding alkalizes when evaporated at 260 °C under pressures 400–667 Pa [14]. The noticeable disadvantage of the physical refining by using superheated steam is the degradation or removal of valuable volatile compounds such as tocopherol or carotenoids [10,13].
The evaporation phenomena depend on pressure and temperature; therefore, lowering operating pressure and temperature may be a solution to improve product quality. Two types of evaporators have been used in high-vacuum conditions [15]. The thin film evaporator had a separated condenser unit, and the short-path evaporator had a condenser unit placed near the evaporator surface. The operating pressure of the thin film evaporator was approximately 100 Pa, while the short-path evaporator was operated under vacuum pressure at 0.1 Pa. Under the extremely low vacuum pressure, the mean free path of evaporated compounds could be extended until it reached the distance between evaporator and condenser surface, this being called molecular distillation [16,17]. Molecular distillator can be classified as centrifugal (Figure 1a) or falling-film distillator (Figure 1b) [18]. For the centrifugal distillator, a feeding mixture is pumped to the center of the evaporator. The evaporator rotates to spread mixture over the surface, and then retentate exits at the rim of evaporator. In contrast, the falling-film distillator consists of a cylindrical evaporator and internal condenser. A feeding mixture is fed at the top of the distillator, and then separated as retentate and distillate.
The falling-film molecular distillation was used to refine cold-pressed rapeseed and sunflower oils with evaporation temperature at 210 °C, and vacuum pressure at 40 Pa [19]. The process was able to reduce FFA content and peroxide value of rapeseed oil to 0.05 wt.% and 0.35 mmol kg−1, respectively. Sunflower oil was also processed to low FFA content and peroxide value at 0.04 wt.% and 0.17 mmol kg−1, respectively. The centrifugal molecular distillation was used to recover decanoic acid from cuphea fatty acids, using evaporation temperatures of lower than 110 °C and pressures of 0.08–0.40 Pa [20]. The fatty acid could be recovered in distillate steam, and the purity increased from 96.0 to 99.8 wt.%, by two passes. The optimization of molecular distillation in food processing have been recently discussed to improve its performance. The conjunction of the response surface method and an artificial neural network was utilized to optimize the enrichment process of terpene alcohol by molecular distillation [21] under the conditions of evaporation temperature between 60 and 110 °C, condensation temperature from 2 to 18 °C, and wiper rotational speed of 100 to 600 rpm as optimization targets. The wiper rotational speed showed less influence, compared to evaporation and condensation temperature. Another approach to explain the mechanism of molecular distillation is a mathematical model and simulation. The Direct Simulation Monte Carlo method was used to simulate a vapor flow in molecular distillation, which emphasized the importance of the difference between evaporation and condensation temperature [22]. A binary mixture of ethylhexyl phthalate and ethylhexyl sebacate was studied with evaporation temperature between 80 and 100 °C and condensation temperature from 0 to 20 °C to simulate vapor flow in a distance between evaporator and condenser surface ranging from 10 to 30 mm. The evaporation temperature, which was correlated with vapor pressure, showed more influence in the model as compared to condensation temperature. The model developed in ASPEN HYSYS was investigated to study the influence of evaporation temperature, vacuum pressure, and feeding rate [23]. Beta-carotene, tocopherol, and FFA in palm oil were the target compounds. The authors suggested a significantly higher influence of the temperature and pressure over the feeding rate. Then, the response surface method was applied to optimize the process; the optimized temperature, pressure, and feeding rate were 147 °C, 0.7 Pa, and 1291 kg h−1, respectively.
To the best of our knowledge, the analysis of evaporation rate and mechanism of molecular distillation for edible oil processing have not been clarified yet. Therefore, in this study, a binary mixture of two components, soybean oil and oleic acid, was employed, and falling-film molecular distillation was investigated. A model to elucidate the evaporation mechanism was proposed, and simulation was performed in order to compare with the experimental results.

2. Materials and Methods

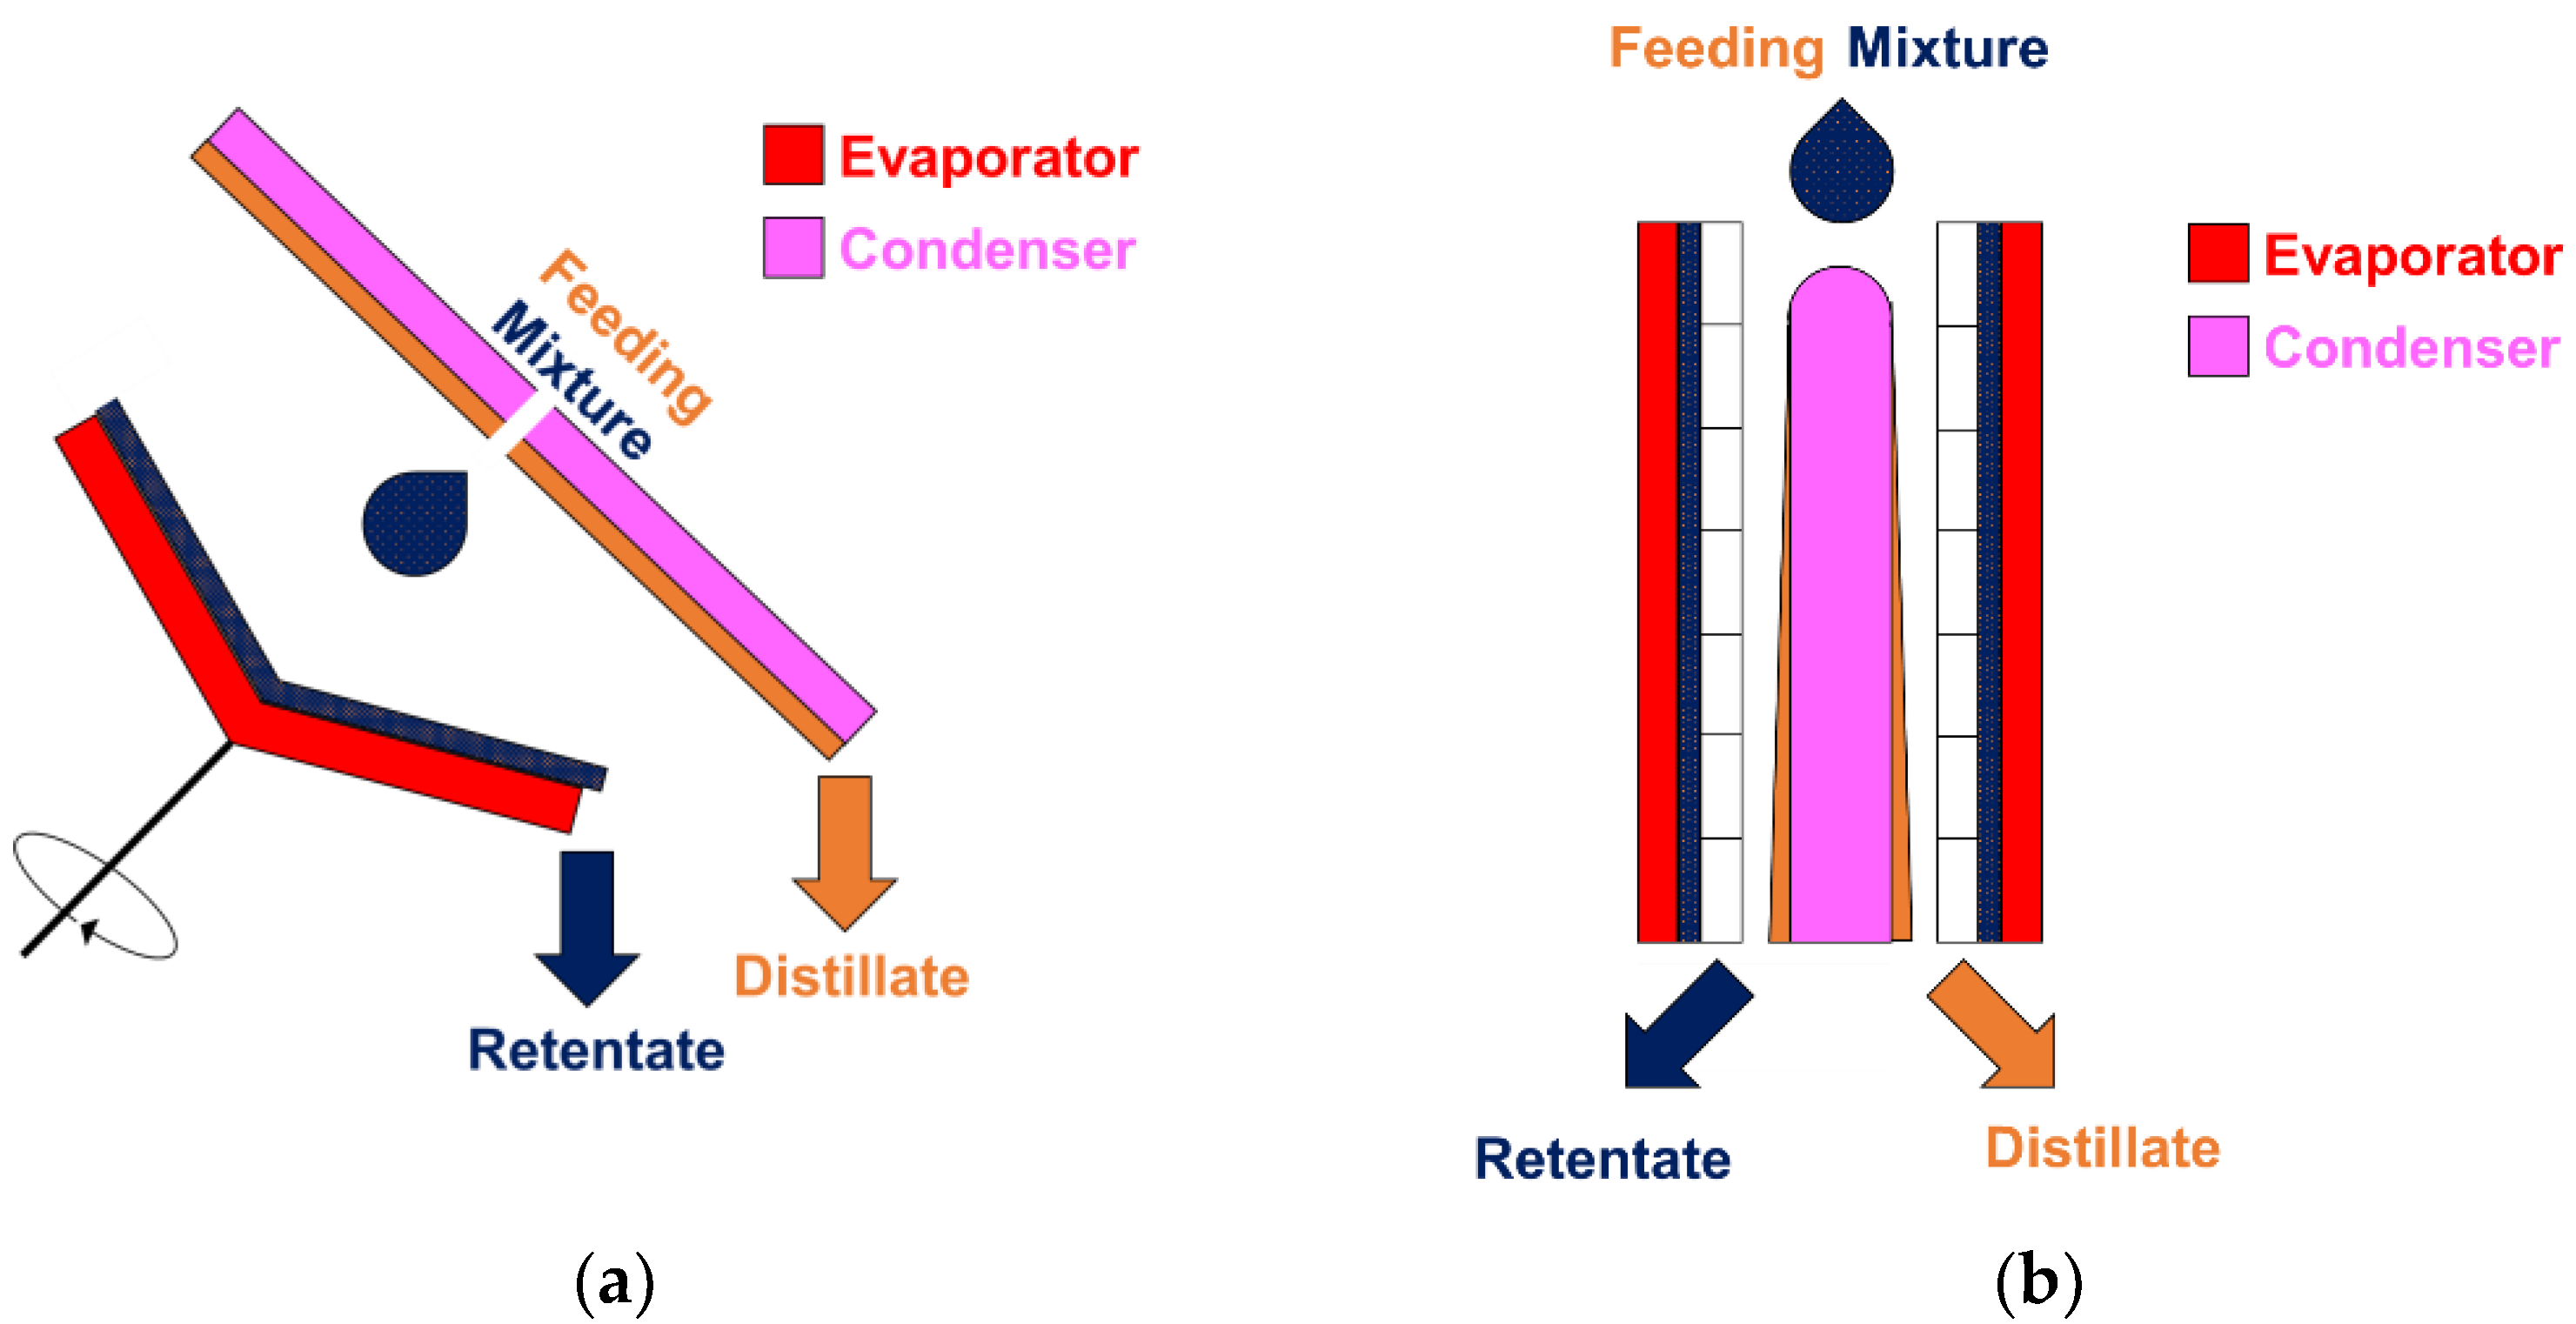
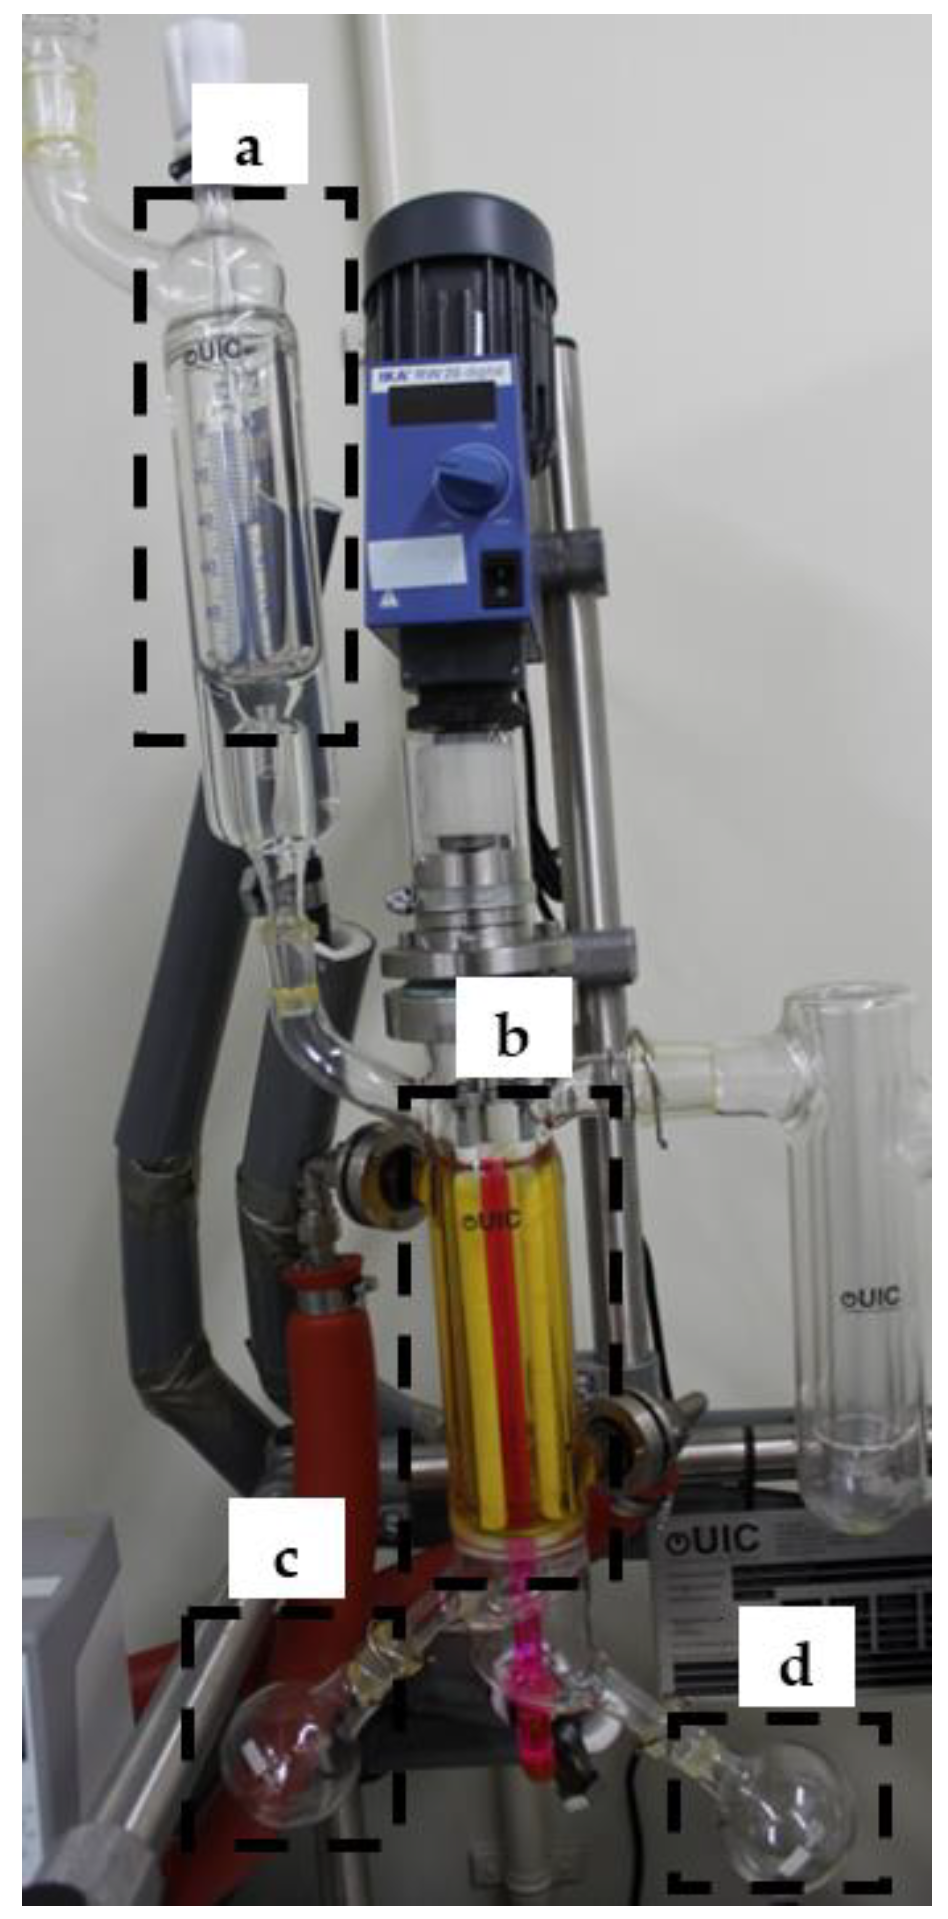
2.1. Sample Preparation and FFA Separation

Refined soybean oil and oleic acid (both of reagent grade) were purchased from FUJIFILM Wako, Osaka, Japan. Samples were blended using a magnetic stirrer for at least 2 h at room temperature, forming a complete oil mixture. Refined soybean oil was used as triglyceride fraction in the binary mixture since FFA content was negligible; oleic acid was selected as FFA fraction in mixture. The mass of FFA in oil mixture was in the range of 1–10 wt.%. The mixture was added to a short-path molecular distillation apparatus (KDL-1, UIC GmbH, Germany), as shown in Figure 2. The pre-heat chamber (Figure 2a) was heated at a fixed temperature of 50 °C, and each sample was held in this chamber for at least 10 min. The separation process was initiated by a manually adjusting feeding rate to 0.300 kg h−1, and pressure in the apparatus (Figure 2b) was maintained at 0.1 Pa. The condenser temperature was set to 20 °C, and the wiper rotational speed was set at 400 rpm. Evaporation temperature varied from 110 to 160 °C. The condenser area was 0.007 m2, while the evaporator length and surface areas were 0.160 m and 0.018 m2, respectively. Retentate (Figure 2c) and distillate (Figure 2d) were collected separately and weighted.

2.2. FFA Content Determination

To begin, 1-3 drops of the sample were mixed into 50 mL of preheated ethanol (Purity 99.5%, FUJIFILM Wako, Osaka, Japan) at 50 °C, with phenolphthalein (FUJIFILM Wako, Osaka, Japan) as an indicator. Then, the mixture was neutralized with 0.1 M NaOH solution (FUJIFILM Wako, Osaka, Japan), yielding a faint pink mixture. The sample was precisely weighted with 0.01 g precision in a range of 1 to 5 g before being added to the neutralized mixture, yielding a colorless mixture. Finally, the colorless mixture was titrated with 0.1 M NaOH solution until it produced the same faint pink color, indicating that the pH had returned to neutral. FFA content (wt.%) was calculated based on the volume of 0.1 M NaOH that could neutralize the FFA in oil [24]. The efficiency of FFA removal was calculated using the difference between the FFA content in feeding and retentate. As a result, FFA that remained in retentate of various amounts of FFA in the feeding mixture could be compared.

2.3. Statistical Analysis

All the distillation experiments were performed at least in duplicate, and the FFA content determinations were performed in triplicate. The experimental data were subjected to one-way analysis of variance to search for significant difference in the mass and FFA content of retentate and distillate, followed by Duncan test to identify between which pairs of means those differences might be [25]. The bivariate correlation of experimental and simulation results was analyzed by Pearson correlation coefficient and a two-tailed test of significance [26]. All mentioned statistical analyses were performed using IBM SPSS Statistic version 24 (SPSS Inc., Chicago, IL, USA).

3. Experimental Results

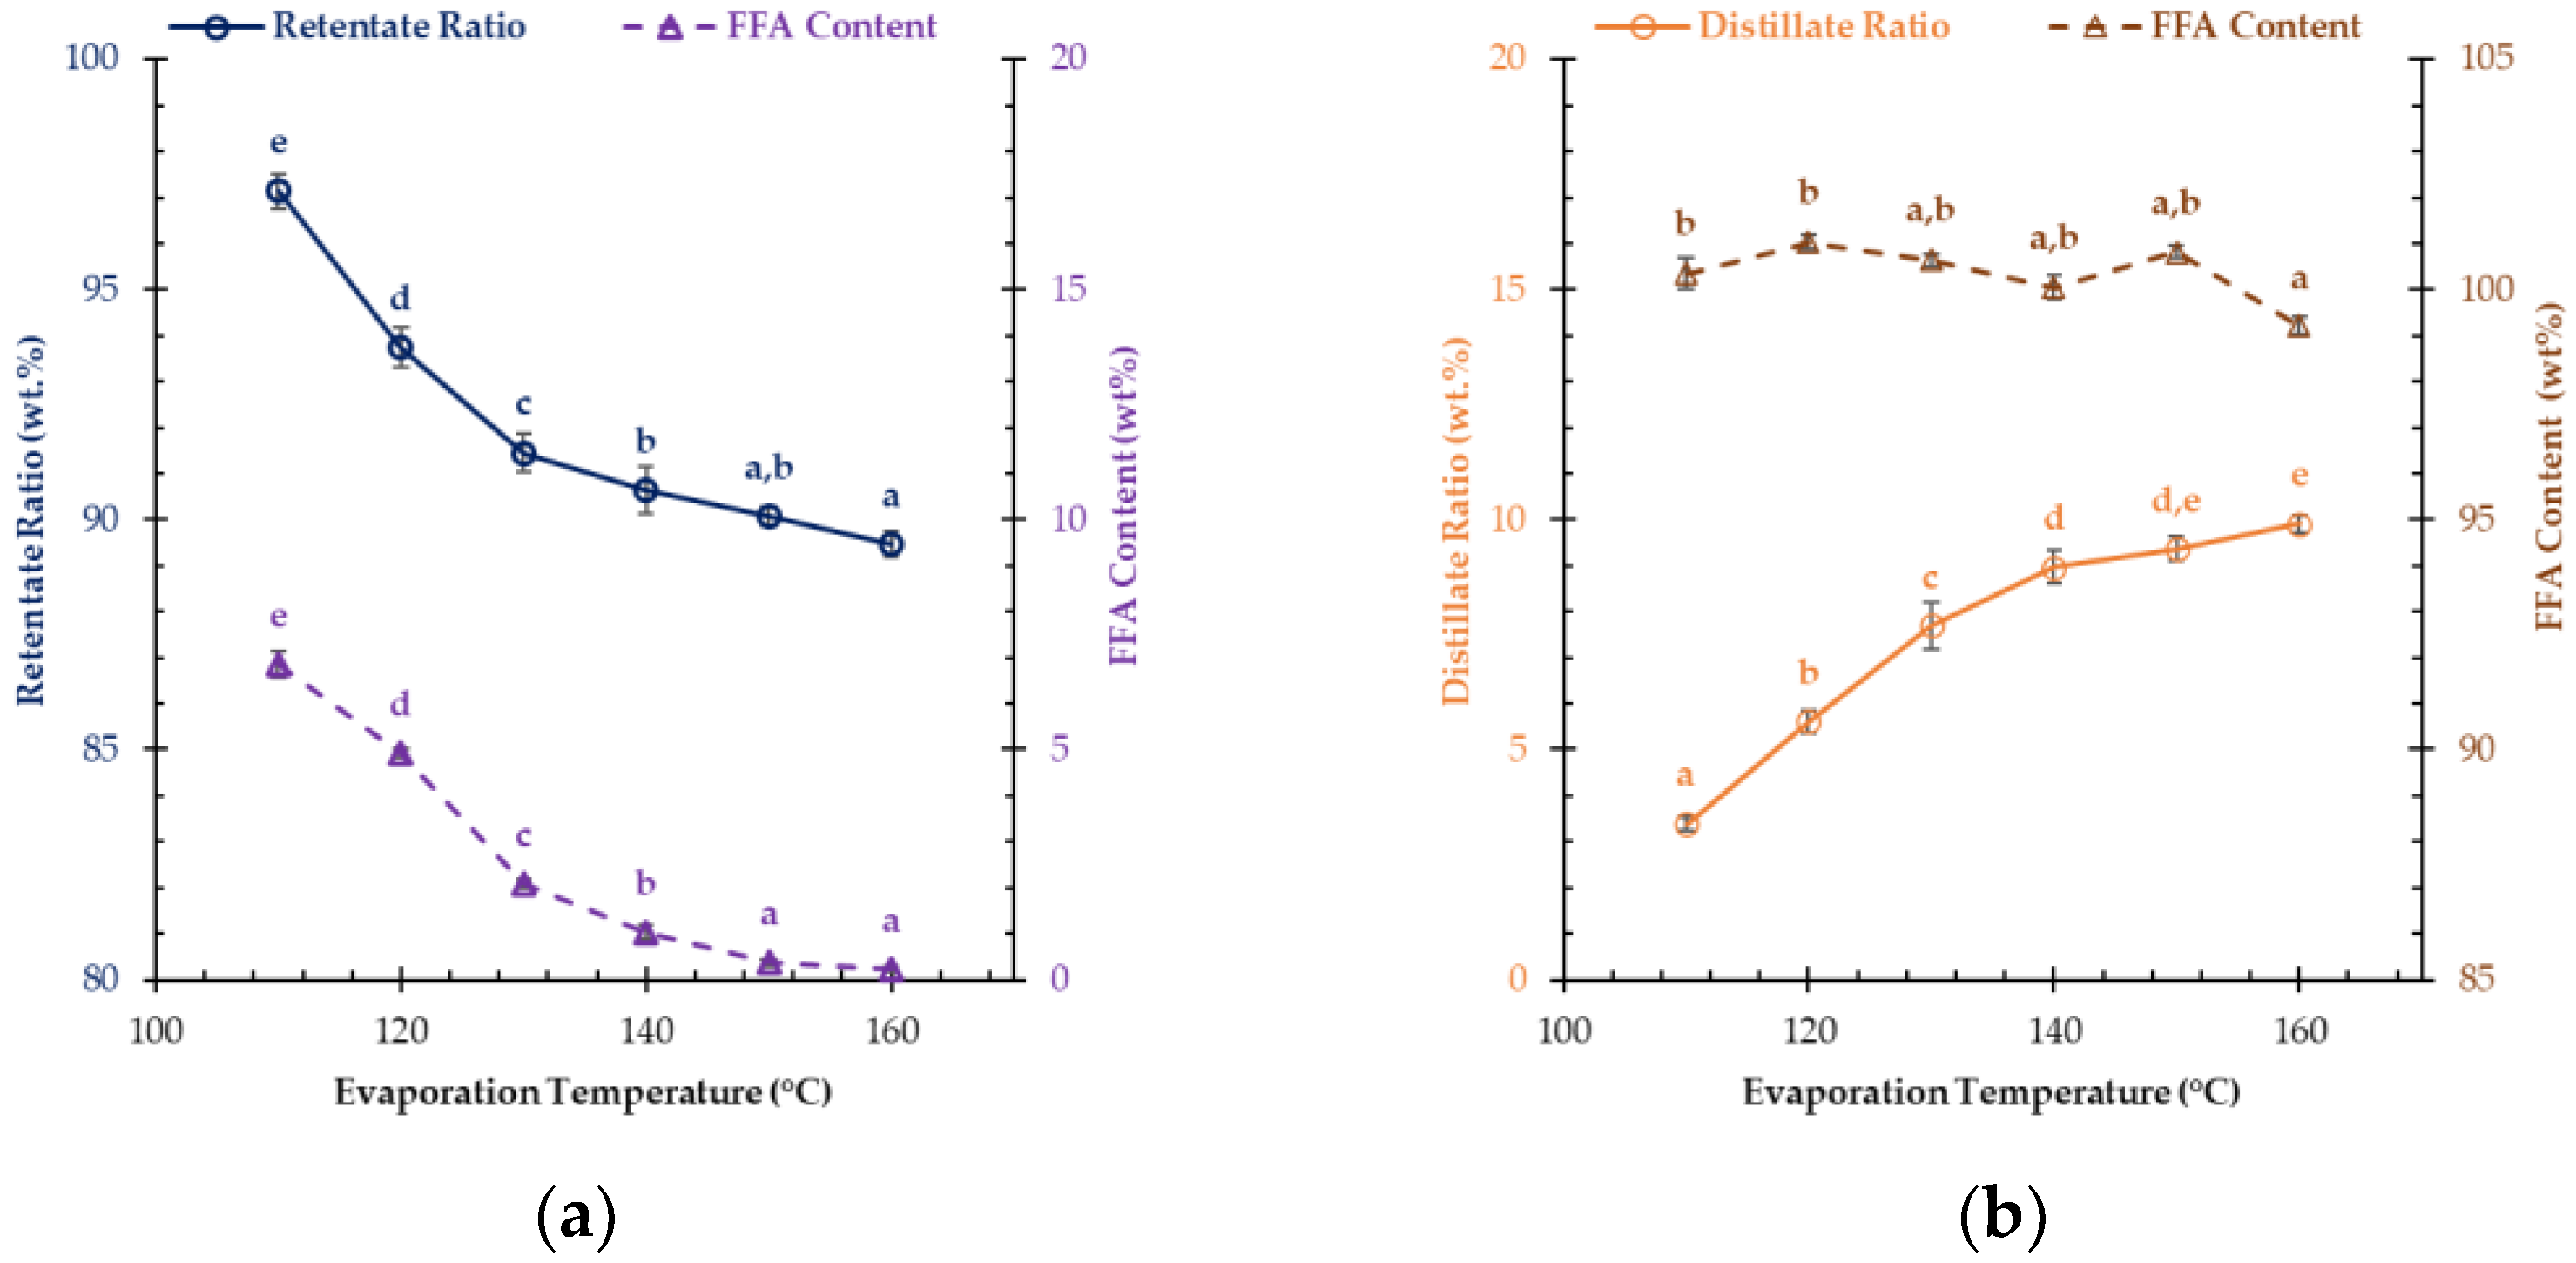
3.1. Mass Ratio and FFA Content

Both retentate and distillate were recovered when the feeding mixture with 10 wt.% of oleic acid was treated with molecular distillation. Retentate and distillate ratios (wt.%) were calculated on using Equations (1) and (2), respectively.
R e t e n t a t e   r a t i o = m a s s   o f   R e t e n t a t e   ( kg ) m a s s   o f   f e e d i n g   m i x t u r e   ( kg ) × 100
D i s t i l l a t e   r a t i o = m a s s   o f   D i s t i l l a t e   ( kg )   m a s s   o f   f e e d i n g   m i x t u r e   ( kg ) × 100
The retentate and FFA content decreased as the evaporation temperature increased in the range of 110 to 140 °C, in contrast, those parameters at 150 to 160 °C reached a plateau (Figure 3a). The retentate ratio decreased from 97.1 to 90.6 wt.%, while FFA content decreased from 6.9 to 1.0 wt.%. At 150 °C, the retentate ratio and FFA content were 90.7 wt.% and 0.37 wt.%, respectively, which were not much different from the retentate ratio and FFA content at 160 °C (89.5 wt.% and 0.23 wt.%, respectively). The distillate ratio was inversely proportional to retentate ratio, as shown in Figure 3b. Moreover, the distillate ratio was increased proportionally to the evaporation temperature, until it reached a plateau at 150 °C. The distillate ratio at 150 °C (9.36 wt.%) was similar to 160 °C (9.91 wt.%), which was the highest mass that could be recovered as distillate in this condition. The summation of retentate and distillate ratio in every condition was at least 99.1 wt.%, showing a good mass balance in the experiments.
As shown in Figure 3b, FFA content of distillate was approximately 100%, regardless of evaporation temperature, which will be also discussed from the point of vapor pressure in the next paragraph. The reduction in mass was an FFA, due to the feeding mixture. FFA was removed due to low molecular weight compared to other compounds such as triglycerides [27,28].

3.2. Effect of Vapor Pressure

The driving force that let FFA evaporate from the feeding mixture film is the vapor pressure, P0 (Pa) which is dependent on temperature T (°C). Antoine equation is commonly utilized for calculating P0 [29].
log P 0 = A B C + T
where A, B, and C are constant. These constant values for oleic acid are as follows: A = 12.95, B = 5380.57, C = 324.11 [30]. In our study, the experiments were performed using evaporation temperature within the range of 110 to 160 °C. The calculated vapor pressure of oleic acid ranged from 3.6 to 68.0 Pa. The vapor pressure of triglycerides could be also determined with the chemical constituent fragment as described in Equation (4) [31].
log P 0 = Δ G θ v a p R ¯ ( θ + 273 ) ln 10 + Δ H 0 v a p R ¯ ln 10 ( 1 θ 1 ( T + 273 ) )
where θ is the reference temperature, 25 °C; R ¯ is the gas constant; Δ G θ v a p is the Gibbs free energy of vaporization at the reference temperature, and Δ H 0 v a p is the enthalpy of vaporization at the reference temperature. Δ G θ v a p and Δ H 0 v a p of triglycerides could be calculated by the summation of fragment constant reported by the same authors. The major fatty acids that bound to glycerol in soybean were linoleic acid, oleic acid, and palmitic acid [32]. The similarities between fragments constant across those fatty acids were reported [31]. Δ G θ v a p and Δ H 0 v a p of soybean oil were estimated as 7.9 × 10⁷ and 1.7 × 10⁸ J kmol−1, respectively. The calculated vapor pressure of soybean oil at temperatures from 110 to 160 °C were between 5.9 × 10⁻⁸ and 2.7 × 10⁻⁵ Pa. Regarding Raoult’s laws, vapor pressure of individual compound P (Pa) in ideal liquid mixture at certain temperature T (°C) could be determined as described in Equation (5) [33].
P = x P 0  
where x is the mol fraction of individual compound. The mol fractions of oleic acid and triglycerides in the 10 wt.% mixture were 0.27 and 0.73, respectively. Vapor pressure of oleic acid ranged from 0.96 to 1.81 Pa at 110 to 160 °C and those of triglycerides were from 1.6 × 10⁻⁸ to 7.2 × 10⁻⁵ Pa, respectively. The vapor pressure values of triglycerides were much lower than those of FFA. It was difficult to evaporate triglycerides at this level of evaporation temperature as suggested by numerous studies [34,35,36]. From these results, distillate could contain only FFA, whereas triglycerides were considered as negligible.

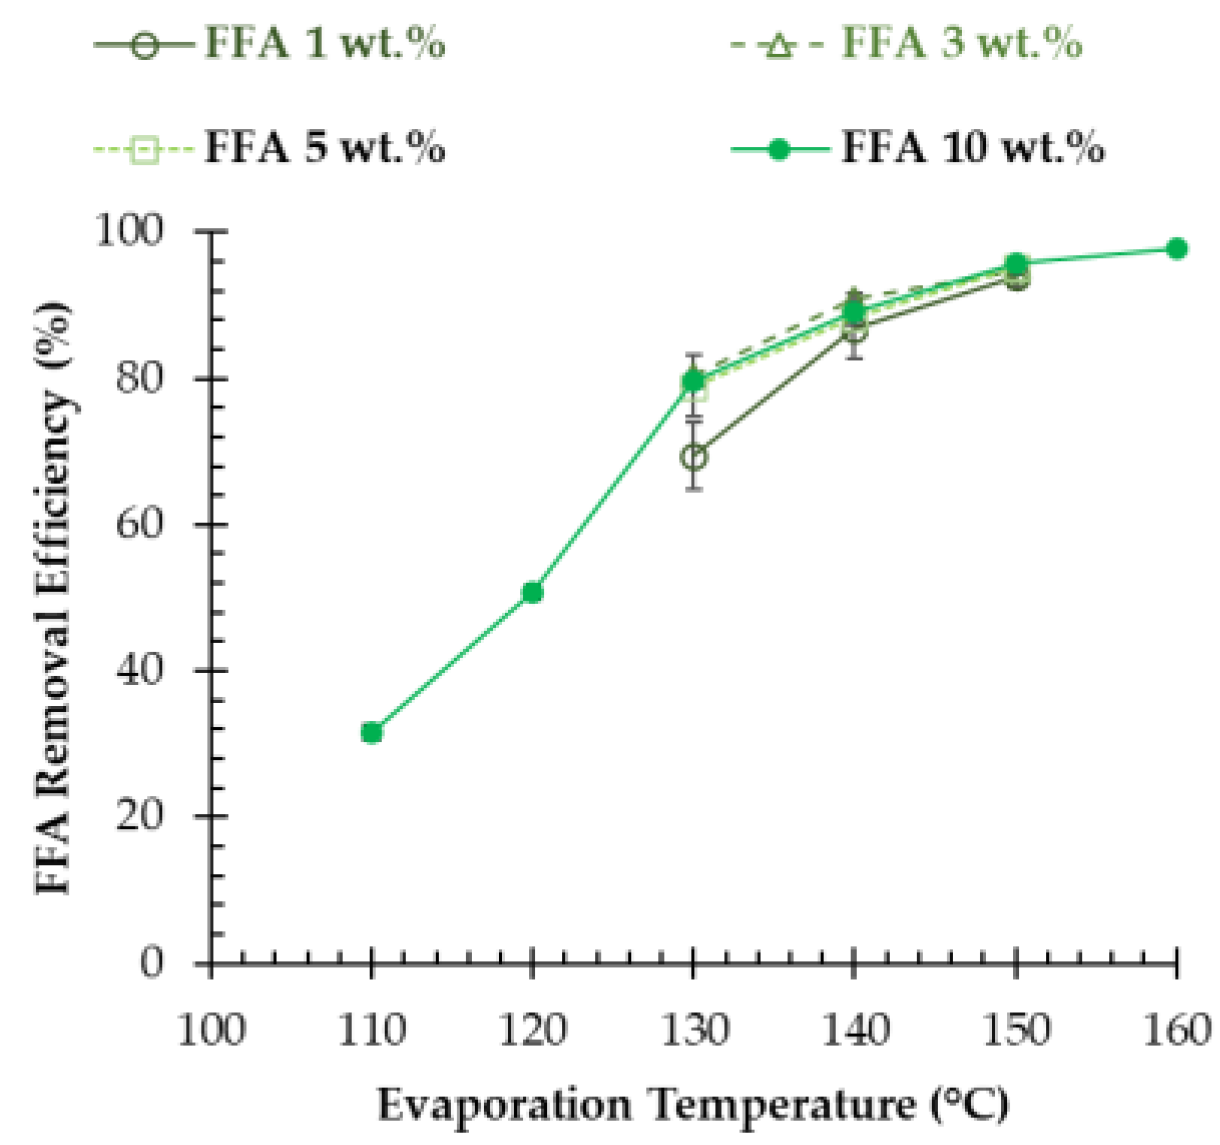
3.3. Effects of FFA Content and Temperature on FFA Removal from Triglycerides Mixture

Feeding mixture samples with 1, 3, or 5 wt.% FFA contents were treated by molecular distillation with evaporation temperature in range of 130 to 150 °C. FFA removal efficiency (%) can be determined as described in Equation (6).
F F A   r e m o v a l   e f f i c i e n c y = F F A   c o n t e n t F e e d i n g F F A   c o n t e n t R e t e n t a t e F F A   c o n t e n t F e e d i n g × 100
The experimental data from the previous section on 10% FFA content in feeding mixtures were also used to calculate their FFA removal efficiency and compared with lower FFA content in feeding mixture, as shown in Figure 4. The FFA removal efficiency increased proportionally with evaporation temperature, regardless of FFA content in feeding rate. The efficiency increased almost linearly with the temperature from 110 to 140 °C. Then, a plateau was observed from 150 to 160 °C. The highest efficiency was 97.7% at 160 °C. The FFA removal efficiency depended on evaporation temperature, while FFA content in feeding mixture had little influence on the efficiency.
Martins et al. reported that soybean oil deodorizer distillate with 57.8 wt.% FFA content had the FFA removal efficiency at 96.2 wt.% with evaporation temperature at 140 °C [25], in which the feeding rate of 0.344 kg h−1 and the efficiency of their study were similar to those of this study.

4. Modeling Discussion

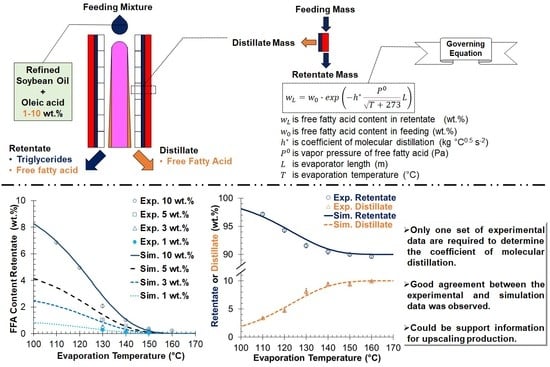
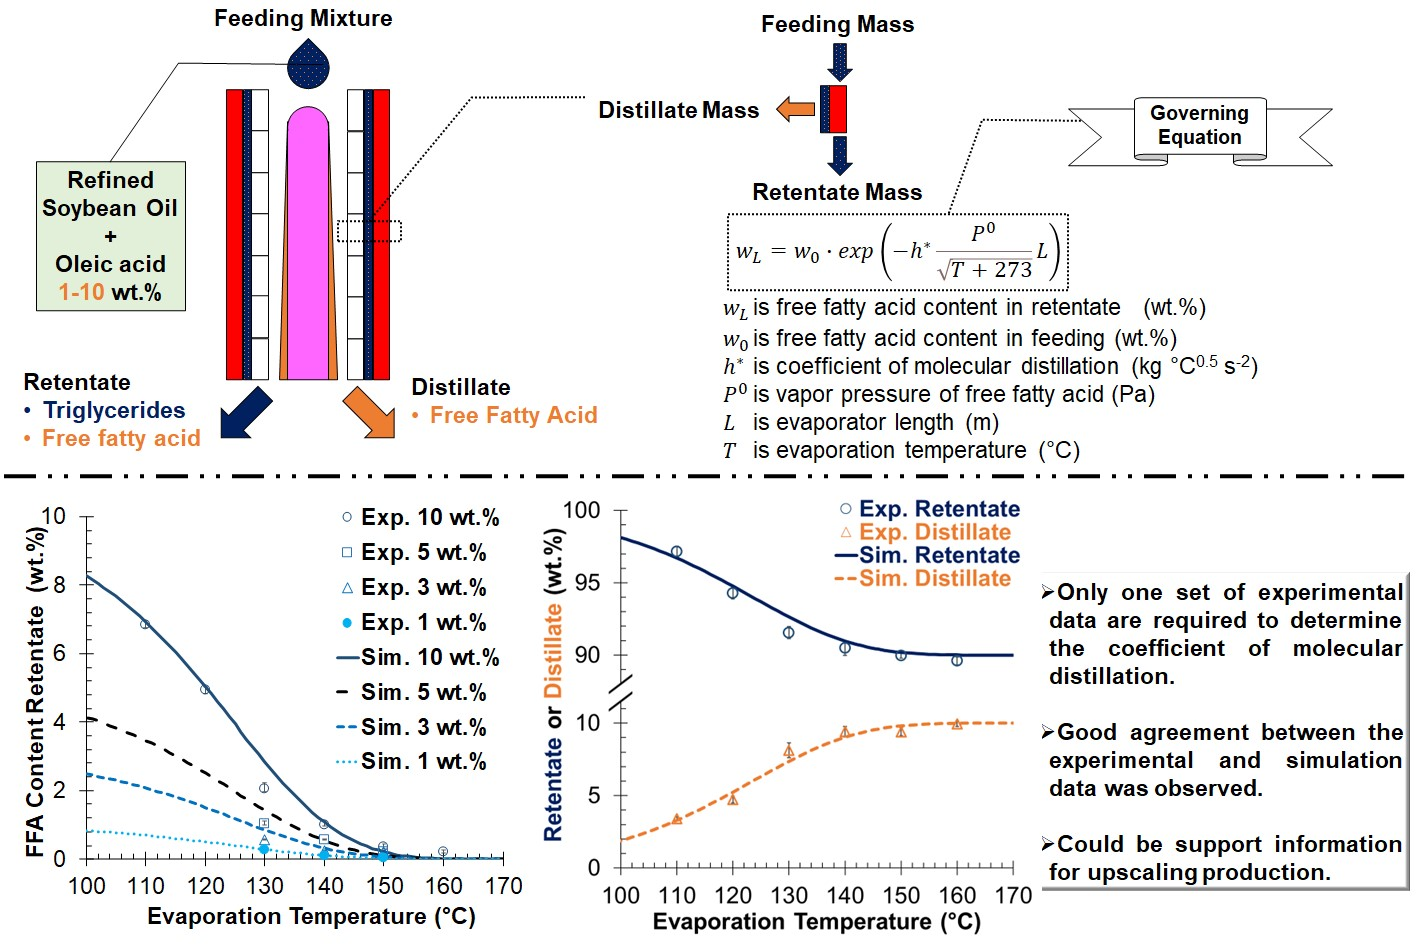
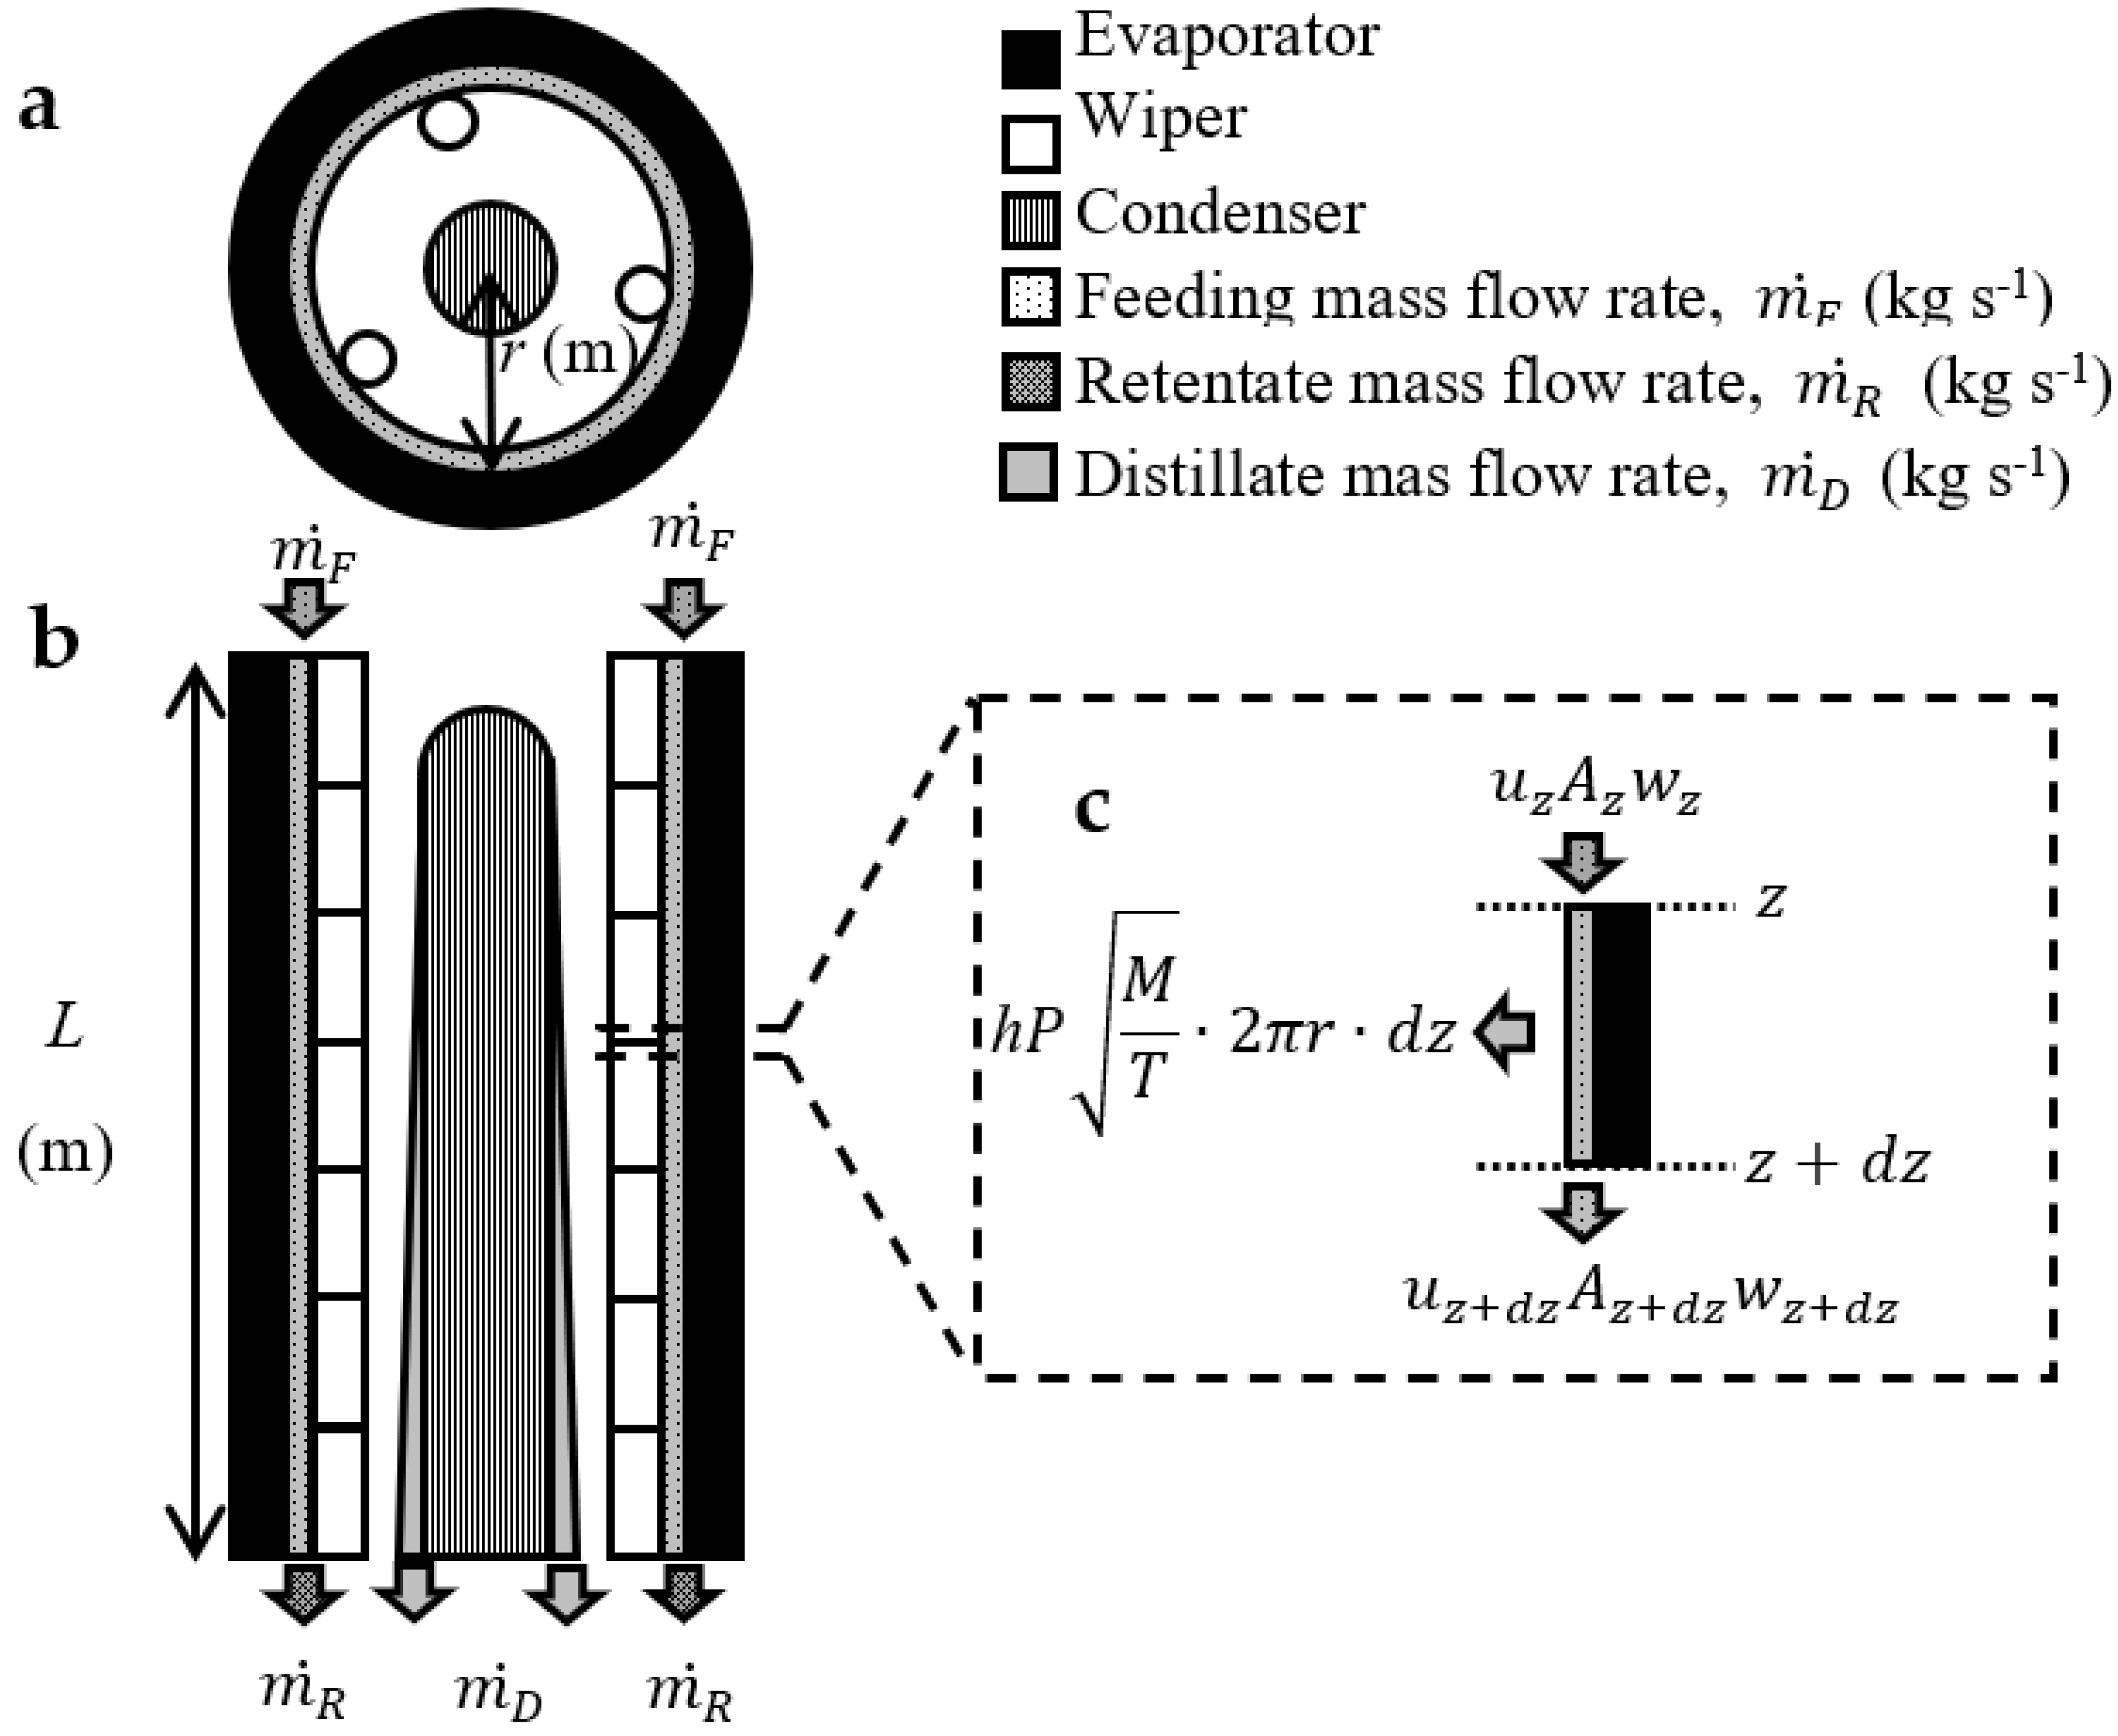
4.1. Mathematical Model Approach

The mass conservation and transport equations were applied to explain the evaporation mechanism by molecular distillation. The cross-sectional view perspective from top of evaporation chamber is shown in Figure 5a. The wiper was continuously spinning to distribute the feeding mixture as a thin film to create a cross-sectional area of falling film, Az (m2). The cross-sectional view from front perspective (Figure 5b) indicates a falling-film characteristics of the feeding mixture, m F ˙ (kg h−1), which separates into retentate, m R ˙ (kg h−1) and distillate, m D ˙ (kg h−1). The mass balance was calculated as described in Equation (7).
m F ˙ = m R ˙ + m D ˙
The volatile solvent was reported to evaporate under vacuum pressure by following Langmuir equation [37]. The evaporate flux of solvent, J (kg m−1 s−1) was calculated using Equation (8).
J = h   P 0 M ( T + 273 )    
where h is the evaporation coefficient, and M is the molecular weight of volatile compound (kg kmol−1). In the case of solution, vapor pressure of volatile compound is discussed in Equation (5), and it is modified to express as described in Equation (9).
P = M t o t M w P 0
where Mtot is the average molecular weight of solution (kg kmol−1), and w is the mass fraction of volatile compound. The mass balance scheme at small displacement is shown in Figure 5c. Volatile compound enters with the fraction of wz and falling velocity uz (m s−1) over the cross-sectional area Az (m2) at position z (m), flows along small displacement dz, and then leaves at position z+dz with mass fraction wz+dz, falling velocity uz+dz, and cross-sectional area Az+dz (m2). From the mass balance, the following Equation (10) is given.
u z A z w z u z + d z A z + d z w z + d z h P z M ( T + 273 ) · 2 π r · d z = 0
where r is evaporator radius (m) shown in Figure 5a. Equation (10) could be arranged to differential equation as described in Equation (11).
d ( u z w z A z ) d z = h 2 π r M t o t P 0 M ( T + 273 ) w z
If the mass fraction of volatile compound is small enough, falling velocity and the cross-sectional area of mixture solution can be assumed as constant. Then, Equation (11) is expressed as Equations (12) and (13).
d w z d z = h * P 0 ( T + 273 ) w z
h * = h 2 π r M t o t M  
where h* is the coefficient of molecular distillation (kg °C0.5 s−2). Considering the boundary condition at entrance of evaporator until any length z (m), the Equation (13) could be solved analytically, resulting in Equation (14).
w z = w 0 · e x p ( h * P 0 T + 273 z )
where w0 is mass fraction of the volatile compound (FFA) in the feed. Considering over the evaporator length, L (m), Equation (14) could be expressed as a simple governing equation for molecular distillation as described in Equation (15).
w L = w 0 · e x p ( h * P 0 T + 273 L )
where wL is mass fraction of the volatile compound at the bottom of evaporator, which is equal to the fraction of FFA in the retentate.
Considering parameters in Equation (15), P 0 could be calculated by Antoine equation, and other known parameters are categorized into equipment parameter, L, and experimental parameters, w0 and T. The remaining unknown parameter is h*. If h* is known, wL (FFA mass fraction in retentate) and all other data such as triglycerides mass fraction in retentate, mass values of retentate and distillate can be calculated. The value of h* was calculated using Equation (16), if one set of experiments was done at certain temperature.
h * = T + 273 L   P 0 ln w 0 w L
Then, wL, which is the FFA mass fraction of retentate, could be simulated using the governing equation. As previously discussed, triglycerides are unable to evaporate and remain in retentate. A mass balance of triglycerides could be applied to calculate the mass of retentate m R ˙ (kg h−1) using Equation (17).
m R ˙ = ( 1 w 0 )   ( 1 w L ) m F ˙
Finally, m D ˙ can be calculated using Equation (5). A single or a few experiments might be enough to determine suitable h* for the simple mathematical model.

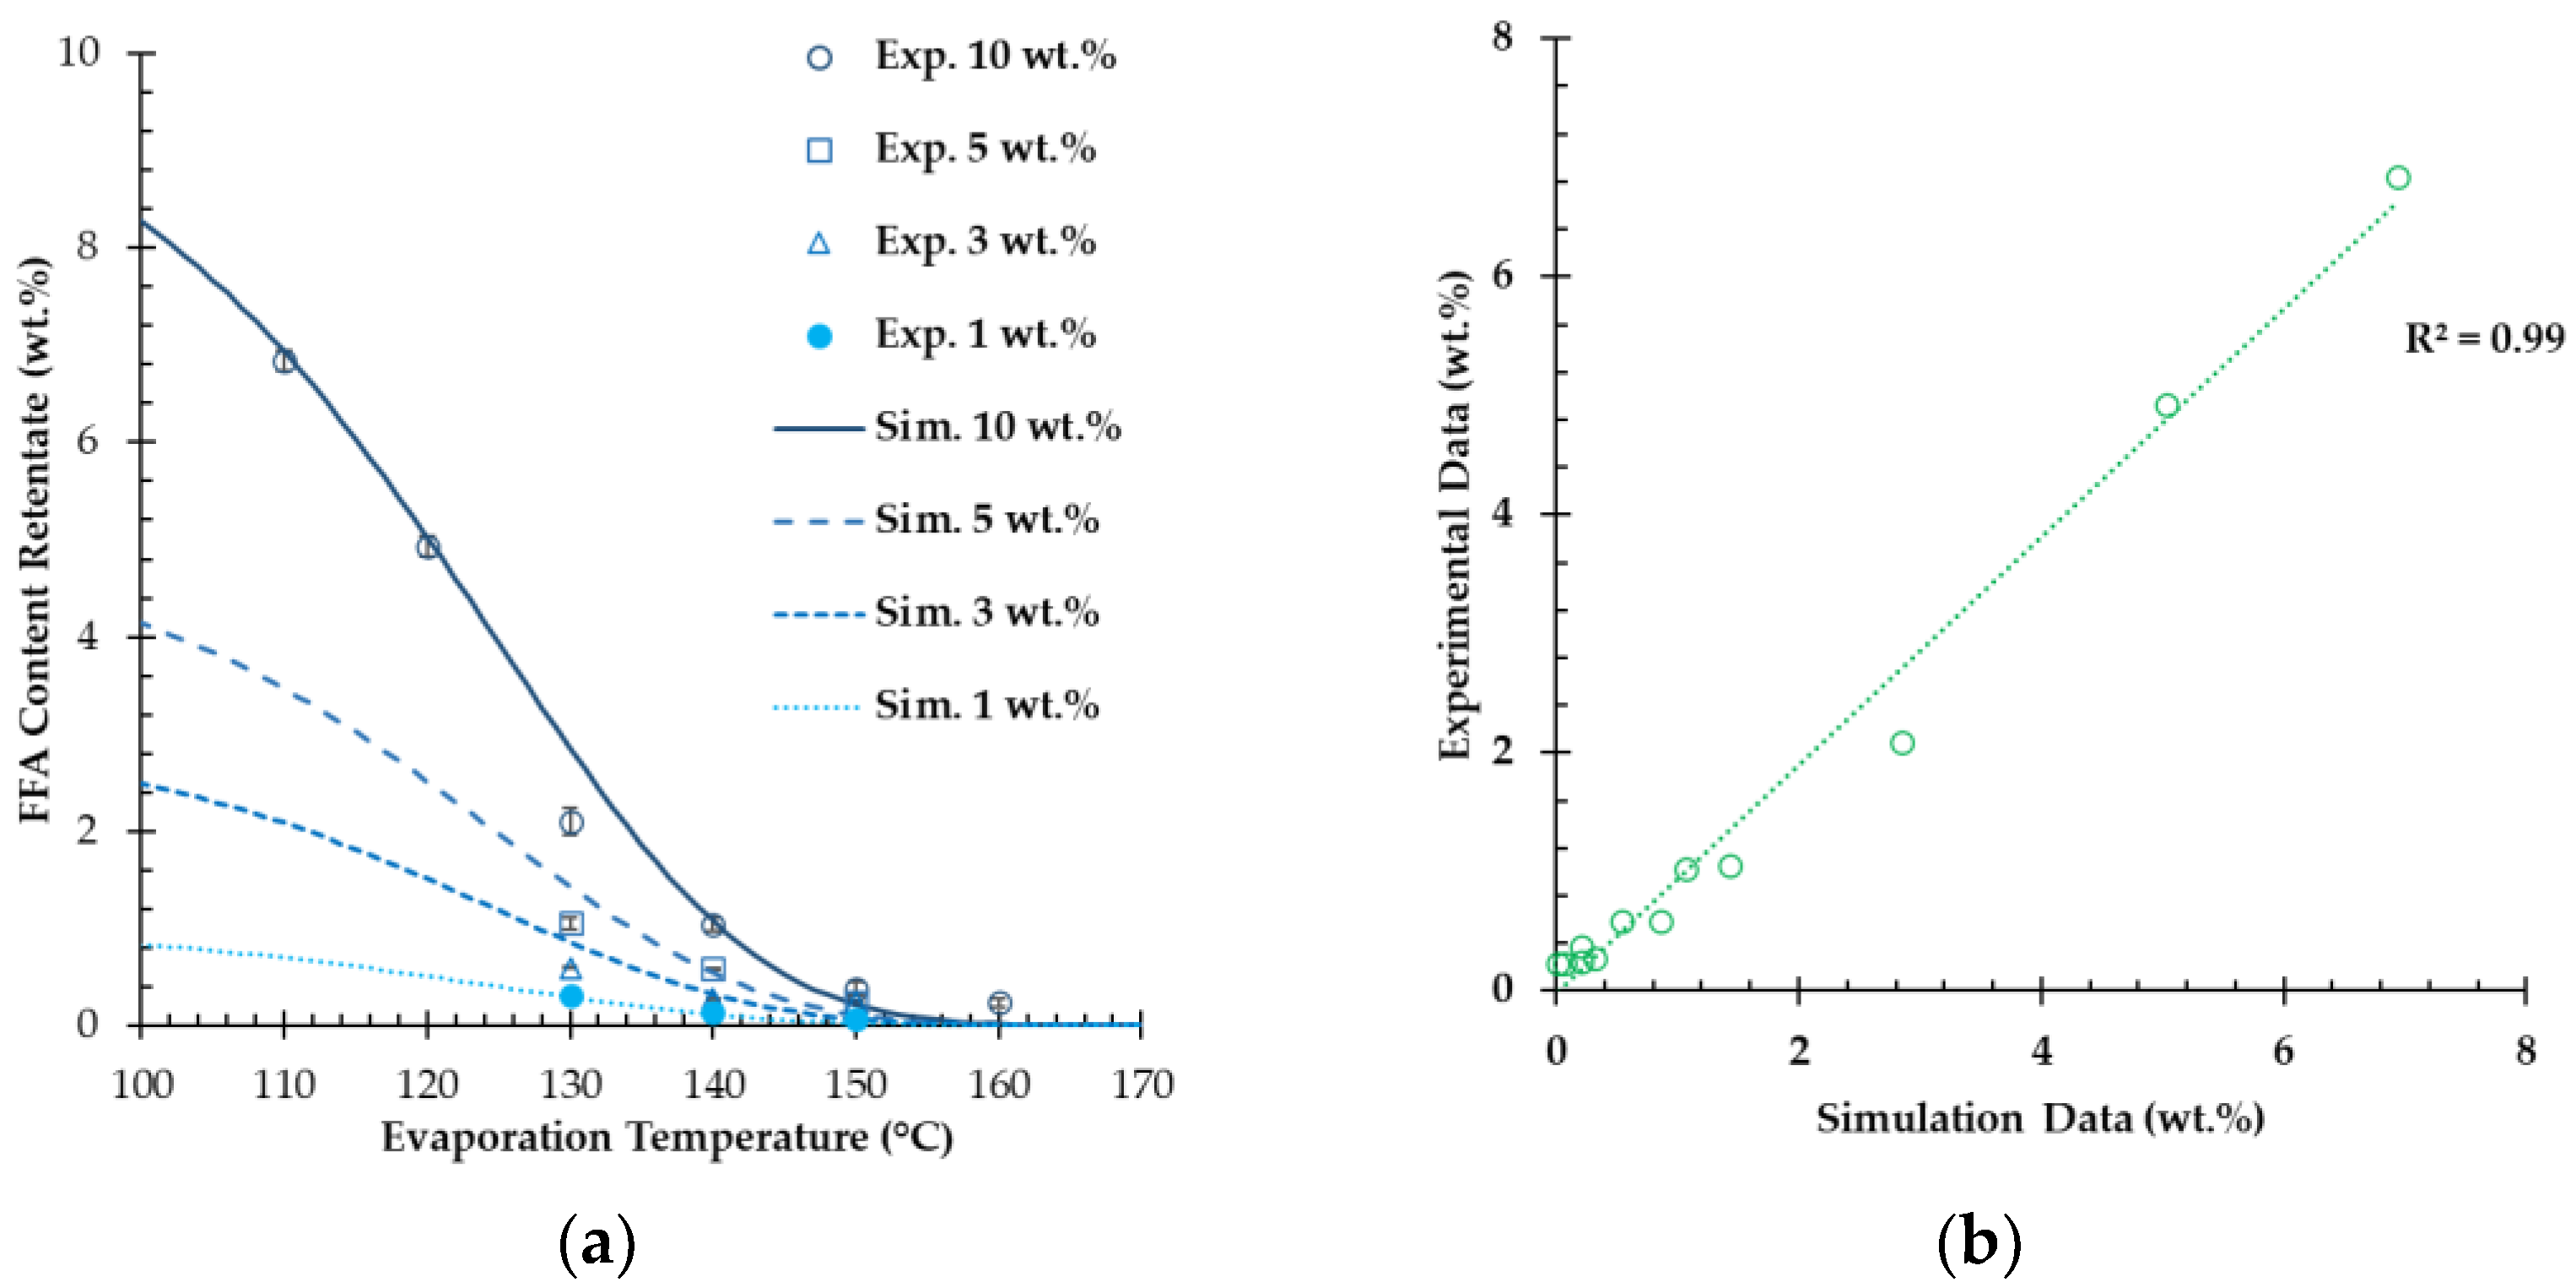
4.2. Comparison between the Experimental and Simulation Results

The coefficient of molecular distillation h* was calculated from an experiment conducted using 1 wt.% FFA in the oil mixture, with evaporation temperature of 130 °C. and evaporator length, L was 0.16 m. A replicate of this experiment was performed, and h* was determined as 12.6 kg °C0.5 s−2. The simulation wL data (shown as wt.%) from the model compared with experimental data are shown in Figure 6a. The good agreement between experimental and simulation data was observed in every condition. Moreover, a Pearson correlation was conducted, which showed a significant correlation between experimental and simulation data (r = 0.97, n = 47, p < 0.01). To investigate a linear regression of this set of data, the experimental data are shown against simulation data in Figure 6b, indicating reliable linear regression correlation equal to 0.99.
To compare the mass flows of retentate and distillate between experiment and simulation, ratios of retentate and distillate to feed (wt.%) could be calculated from Equations (18) and (19).
R e t e n t a t e   r a t i o = m R   ˙ m F   ˙ × 100
D i s t i l l a t e   r a t i o = m D   ˙ m F   ˙ × 100
Retentate and distillate ratios from the experiment are shown in Figure 3a,b, and both experimental and simulation data are shown in Figure 7. Both mass ratio results showed a good agreement, and the Pearson correlation shows a significant correlation as well (r = 0.94, n = 12, p < 0.01) (r = 0.99, n = 12, p < 0.01). The proposed model was found very effective to explain the mechanism and can be used for prediction or optimization of the experimental conditions. Due to the assumption in Equation (11), a possible limitation of this model could be an FFA content in the feeding mixture. So far, up to 10 wt.% of those mass fraction could be simulated by the proposed model, which is fit for FFA removal from crude edible oil. Previous research compared the cost per mass of deacidified oil between alkali neutralization and deacidification with falling-film molecular distillation on a micro-pilot scale [38]. The optimized molecular distillation process is less expensive than alkali neutralization, and our proposed model required only a few experiments and simple calculations, potentially resulting in even lower investment costs.
A possible utilization of the proposed model is to predict the removal of squalene or tocopherol from vegetable oil with falling-film molecular distillation. One example of this is squalene removal from olive pomace oil, which was reported to maintain tocopherol olive pomace oil [39]. The other is tocopherol recovery from soybean oil deodorizer distillate [40,41].

5. Conclusions

This study aimed to understand the separation behavior using falling-film molecular distillation for free fatty acid removal from vegetable oil. Soybean oil and oleic acid mixture were used as model substances. The effects of temperature and FFA content up to 10 wt.% on the molecular distillation process were investigated. The FFA removal was characterized from the mass balance and chemical analysis of FFA. The FFA removal ratio depended on temperature but did not depend on FFA content. In order to characterize the separation process, a mathematical model was introduced based on mass balance and transport phenomena. If the FFA content in feeding mixture is small enough, analytical solution of differential equation can be obtained as a simple governing equation. This simple governing equation had experimental parameters of temperature and FFA content, equipment parameters such as evaporator length and evaporator radius, and one unknown parameter, the coefficient of molecular distillation, h*. The coefficient h* is a process parameter, which could be obtained by one set of experiments. After calculating h* value, simulations under all other experimental conditions were carried out. Good agreement was found in all the data between experiment and simulation, regardless of evaporation temperature and FFA content in feeding mixture up to 10 wt.%. The prediction and optimization can be done for scaling up and industrialization with the proposed model. It was developed for FFA removal from vegetable oil, but it could be used for other volatile component removal systems such as squalene or tocopherol recovery, and so on. The approach is a simple and required minimal investment to simulate the volatile compound separation from mixture. However, the model limitation is the initial mass fraction of volatile compounds. Investigation on feeding rate and vacuum pressure might be required to improve this model for more varieties of simulation.

Author Contributions

Conceptualization: M.N.; Investigation: T.C.; Visualization: T.C.; Data curation: L.d.O.F.; Writing—original draft preparation: T.C.; Writing—review and editing: M.N., M.A.N. and L.d.O.F.; Supervision: M.N. and M.A.N. All authors have read and agreed to the published version of the manuscript.

Funding

This research was partially funded by the Program for Promoting Grant-in-Aid for Scientific Research Applications FY 2021 from the Faculty of Life and Environmental Sciences, University of Tsukuba (Recipient: MAN).

Institutional Review Board Statement

Not applicable.

Informed Consent Statement

Not applicable.

Data Availability Statement

Relevant data can be made available upon request.

Conflicts of Interest

The authors declare no conflict of interest.

References

  1. United States Department of Agriculture. Oilseeds: World Markets and Trade; United States Department of Agriculture Foreign Agricultural Service: Washington, DC, USA, 2022; Available online: https://usda.library.cornell.edu/concern/publications/tx31qh68h?locale=en (accessed on 14 February 2022).
  2. Pizzo, J.S.; Cruz, V.H.M.; Santos, P.D.S.; Silva, G.R.; Souza, P.M.; Manin, L.P.; Santos, O.O.; Visentainer, J.V. Instantaneous Characterization of Crude Vegetable Oils via Triacylglycerols Fingerprint by Atmospheric Solids Analysis Probe Tandem Mass Spectrometry with Multiple Neutral Loss Scans. Food Control 2022, 134, 108710. [Google Scholar] [CrossRef]
  3. Goh, E.M.; Timms, R.E. Determination of Mono- and Diglycerides in Palm Oil, Olein and Stearin. J. Am. Oil Chem. Soc. 1985, 62, 730–734. [Google Scholar] [CrossRef]
  4. Belitz, H.D.; Grosch, W.; Schieberle, P. Lipids. In Food Chemistry, 3rd ed.; Burghagen, M., Ed.; Springer: Berlin/Heidelberg, Germany, 2004; pp. 157–242. [Google Scholar]
  5. Frega, N.; Mozzon, M.; Lercker, G. Effects of Free Fatty Acids on Oxidative Stability of Vegetable Oil. J. Am. Oil Chem. Soc. 1999, 76, 325–329. [Google Scholar] [CrossRef]
  6. Vaisali, C.; Charanyaa, S.; Belur, P.D.; Regupathi, I. Refining of Edible Oils: A Critical Appraisal of Current and Potential Technologies. Int. J. Food Sci. Technol. 2015, 50, 13–23. [Google Scholar] [CrossRef]
  7. Codex Alimentarius: International Food Standards. Available online: https://www.fao.org/fao-who-codexalimentarius/codex-texts/list-standards/en/ (accessed on 11 September 2022).
  8. Tarhan, İ.; Ismail, A.A.; Kara, H. Quantitative Determination of Free Fatty Acids in Extra Virgin Olive Oils by Multivariate Methods and Fourier Transform Infrared Spectroscopy Considering Different Absorption Modes. Int. J. Food Prop. 2017, 20 (Suppl. S1), S790–S797. [Google Scholar] [CrossRef] [Green Version]
  9. Belitz, H.D.; Grosch, W.; Schieberle, P. Edible Fat and Oils. In Food Chemistry, 3rd ed.; Burghagen, M., Ed.; Springer: Berlin/Heidelberg, Germany, 2009; pp. 643–671. [Google Scholar]
  10. Gibon, V.; De Greyt, W.; Kellens, M. Palm Oil Refining. Eur. J. Lipid Sci. Technol. 2007, 109, 315–335. [Google Scholar] [CrossRef]
  11. Franke, K.; Strijowski, U.; Fleck, G.; Pudel, F. Influence of Chemical Refining Process and Oil Type on Bound 3-Chloro-1,2-Propanediol Contents in Palm Oil and Rapeseed Oil. LWT-Food Sci. Technol. 2009, 42, 1751–1754. [Google Scholar] [CrossRef]
  12. Gharby, S. Refining Vegetable Oils: Chemical and Physical Refining. Sci. World J. 2022, 2022, 6627013. [Google Scholar] [CrossRef]
  13. Čmolík, J.; Pokorný, J. Physical Refining of Edible Oils. Eur. J. Lipid Sci. Technol. 2000, 102, 472–486. [Google Scholar] [CrossRef]
  14. Forster, A.; Harper, A.J. Physical Refining. J. Am. Oil Chem. Soc. 1983, 60, 265–271. [Google Scholar] [CrossRef]
  15. Ketenoglu, O.; Tekin, A. Applications of molecular distillation technique in food products. Ital. J. Food Sci. 2015, 27, 277–281. [Google Scholar]
  16. Biehler, R.M.; Hickman, K.C.D.; Perry, E.S. Small Laboratory Centrifugal Molecular Still. Anal. Chem. 1949, 21, 638–640. [Google Scholar] [CrossRef]
  17. Lutisan, J.; Cvengros, J. Mean Free Path of Molecules on Molecular Distillation. J. Chem. Eng. 1995, 56, 39–50. [Google Scholar] [CrossRef]
  18. Batistella, C.B.; Wolf Maciel, M.R. Recovery of Carotenoids from Palm Oil by Molecular Distillation. Comput. Chem. Eng. 1998, 22, S53–S60. [Google Scholar] [CrossRef]
  19. Cvengros, J. Physical Refining of Edible Oils. J. Am. Oil Chem. Soc. 1995, 72, 1193–1196. [Google Scholar] [CrossRef]
  20. Cermak, S.C.; John, A.L.; Evangelista, R.L. Enrichment of Decanoic Acid in Cuphea Fatty Acids by Molecular Distillation. Ind. Crops Prod. 2007, 26, 93–99. [Google Scholar] [CrossRef]
  21. Dantas, T.N.C.; Cabral, T.J.O.; Dantas Neto, A.A.; Moura, M.C.P.A. Enrichmnent of Patchoulol Extracted from Patchouli (Pogostemon Cablin) Oil by Molecular Distillation Using Response Surface and Artificial Neural Network Models. J. Ind. Eng. Chem. 2020, 81, 219–227. [Google Scholar] [CrossRef]
  22. Li, Y.; Xu, S.-L. DSMC Simulation of Vapor Flow in Molecular Distillation. Vacuum 2014, 110, 40–46. [Google Scholar] [CrossRef]
  23. Tehlah, N.; Kaewpradit, P.; Mujtaba, I.M. Development of Molecular Distillation Based Simulation and Optimization of Refined Palm Oil Process Based on Response Surface Methodology. Processes 2017, 5, 40. [Google Scholar] [CrossRef] [Green Version]
  24. AOAC International. AOAC Official Method 940.28; AOAC International: Rockville, MD, USA, 2000. [Google Scholar]
  25. Bewick, V.; Cheek, L.; Ball, J. Statistics review 9: One-way analysis of variance. Crit. Care 2004, 8, 130–136. [Google Scholar] [CrossRef] [Green Version]
  26. Weaver, B.; Wuensch, K.L. SPSS and SAS Programs for Comparing Pearson Correlations and OLS Regression Coefficients. Behav. Res. 2013, 45, 880–895. [Google Scholar] [CrossRef] [PubMed]
  27. Martins, P.F.; Ito, V.M.; Batistella, C.B.; Maciel, M.R.W. Free Fatty Acid Separation from Vegetable Oil Deodorizer Distillate Using Molecular Distillation Process. Sep. Purif. Technol. 2006, 48, 78–84. [Google Scholar] [CrossRef]
  28. Tan, C.-H.; Ghazali, H.M.; Kuntom, A.; Tan, C.-P.; Ariffin, A.A. Extraction and Physicochemical Properties of Low Free Fatty Acid Crude Palm Oil. Food Chem. 2009, 113, 645–650. [Google Scholar] [CrossRef]
  29. Thomson, G.W. The Antoine Equation for Vapor-Pressure Data. Chem. Rev. 1946, 38, 1–39. [Google Scholar] [CrossRef]
  30. Matricarde Falleiro, R.M.; Akisawa Silva, L.Y.; Meirelles, A.J.A.; Krähenbühl, M.A. Vapor Pressure Data for Fatty Acids Obtained Using an Adaptation of the DSC Technique. Thermochim. Acta 2012, 547, 6–12. [Google Scholar] [CrossRef]
  31. Zong, L.; Ramanathan, S.; Chen, C.-C. Predicting Thermophysical Properties of Mono- and Diglycerides with the Chemical Constituent Fragment Approach. Ind. Eng. Chem. Res. 2010, 49, 5479–5484. [Google Scholar] [CrossRef]
  32. Wada, S.; Koizumi, C.; Nonaka, J. Analysis of Triglycerides of Soybean Oil by High-Performance Liquid Chromatography in Combination with Gas Liquid Chromatography. J. Jpn. Oil Chem. Soc. 1977, 26, 95–99. [Google Scholar] [CrossRef]
  33. Himmelblau, D.M.; Riggs, J.B. Multiphase Equilibrium. In Basic Principles and Calculation in Chemical Engineering, 8th ed.; Pearson Education: Bergen, NJ, USA, 2012; pp. 411–466. [Google Scholar]
  34. Wang, Y.; Zhao, M.; Song, K.; Wang, L.; Han, X.; Tang, S.; Wang, Y. Separation of Diacylglycerols from Enzymatically Hydrolyzed Soybean Oil by Molecular Distillation. Sep. Purif. Technol. 2010, 75, 114–120. [Google Scholar] [CrossRef]
  35. Saliu, F.; Longhin, E.; Salanti, A.; Degano, I.; Della Pergola, R. Sphingoid Esters from the Molecular Distillation of Squid Oil: A Preliminary Bioactivity Determination. Food Chem. 2016, 201, 23–28. [Google Scholar] [CrossRef]
  36. Rodriguez, N.E.; Martinello, M.A. Molecular Distillation Applied to the Purification of Biodiesel from Ethanol and Soybean Oil. Fuel 2021, 296, 120597. [Google Scholar] [CrossRef]
  37. Holland, L.; Steckelmacher, W.; Yarwood, J. Basic data. In Vacuum Manual, 1st ed.; E. & F. N. Spon: London, UK, 1974; pp. 1–83. [Google Scholar]
  38. Ştefan, N.G.; Iancu, P.; Pleșu, V.; Călinescu, I.; Ignat, N.D. Highly Efficient Deacidification Process for Camelina Sativa Crude Oil by Molecular Distillation. Sustainability 2021, 13, 2818. [Google Scholar] [CrossRef]
  39. Ketenoglu, O.; Sahin Ozkan, K.; Yorulmaz, A.; Tekin, A. Molecular Distillation of Olive Pomace Oil—Multiobjective Optimization for Tocopherol and Squalene. LWT 2018, 91, 198–202. [Google Scholar] [CrossRef]
  40. Shimada, Y.; Nakai, S.; Suenaga, M.; Sugihara, A.; Kitano, M.; Tominaga, Y. Facile Purification of Tocopherols from Soybean Oil Deodorizer Distillate in High Yield Using Lipase. J. Am. Oil Chem. Soc. 2000, 77, 1009–1013. [Google Scholar] [CrossRef]
  41. Martins, P.F.; Batistella, C.B.; Maciel-Filho, R.; Wolf-Maciel, M.R. Comparison of Two Different Strategies for Tocopherols Enrichment Using a Molecular Distillation Process. Ind. Eng. Chem. Res. 2006, 45, 753–758. [Google Scholar] [CrossRef]
Figure 1. Simple schematic figure of (a) centrifugal distillator (b) falling film distillator.
Processes 10 02053 g001
Figure 2. Molecular distillation apparatus including: (a) pre-heat chamber, a major component; (b) evaporation chamber; (c) collected retentate; and (d) collected distillate.
Processes 10 02053 g002
Figure 3. Mass ratio and FFA content in (a) retentate and (b) distillate recovered from 10 wt.% FFA in feeding mixture at various evaporation temperatures. Different letters indicate significant differences at p < 0.05.
Processes 10 02053 g003
Figure 4. FFA removal efficiency of feeding mixture with 1–10 wt.% FFA content as affected by evaporation temperature.
Processes 10 02053 g004
Figure 5. A simple drawing of evaporation chamber in (a) top view and (b) cross-sectional view to explain a mass flowing during the distillation. (c) Assumption of the proposed mathematical model in small boundary area at evaporator.
Processes 10 02053 g005
Figure 6. (a) Comparison of experimental and simulated FFA contents in retentate against evaporation temperature (FFA contents in feed: 1, 3, 5, or 10 wt.%). (b) Experimental FFA content data in retentate plotted against simulation data.
Processes 10 02053 g006
Figure 7. A comparison of mass ratio of retentate and distillate (wt.%) between experiment and simulation under condition of 10 wt.% FFA added to feeding mixture.
Processes 10 02053 g007
Publisher’s Note: MDPI stays neutral with regard to jurisdictional claims in published maps and institutional affiliations.

