Article

Modelling for the Efficient Effluent Dye Removal to Reuse Water and Salt

by
Valentina Buscio
1,
Víctor López-Grimau
1,
Bettina Vallés
1,
Montserrat Pepió
2 and
Carmen Gutiérrez-Bouzán
1,*
1
Institute of Textile Research (INTEXTER), Universitat Politècnica de Catalunya-Barcelona Tech, Carrer Colom 15, 08222 Terrassa, Spain
2
Department of Statistics and Operations Research, Universitat Politècnica de Catalunya-Barcelona Tech, Carrer Colom 11, 08222 Terrassa, Spain
*
Author to whom correspondence should be addressed.
Processes 2022, 10(10), 2024; https://doi.org/10.3390/pr10102024
Submission received: 14 September 2022 / Revised: 2 October 2022 / Accepted: 3 October 2022 / Published: 7 October 2022

Abstract

:
The objective of this work was to determine the optimal conditions for the electrooxidation treatment in order to decolourise the effluents that contain reactive dyes. According to the results, when Na2SO4 is used as an electrolyte, the decolouration reactions follow first-order kinetics. However, when NaCl is present in the effluent, the first-order kinetics is stabilised after applying a minimal electric current value. The models obtained from the results show that the higher the concentration of NaCl, the lower the energy consumption. On the other hand, an increase in dye concentration leads to an increase in electrical consumption. In relation to the pH, the results show that it is not a key factor in the decolouration efficiency. Finally, the obtained model was applied to two real effluents. The feasibility of individually treating the effluents from the dyeing process and those from the subsequent wash-off process was evaluated. From an industrial application point of view, it is recommended to mix both effluents before treatment, especially when the dye concentration is high.

1. Introduction

Cotton is the most important natural fibre in the textile sector. Annually, 25 million tons of cotton are produced in the world [1]. Cellulosic fibres such as cotton can be dyed with four different types of dyes (direct, sulphur, vat, and reactive dyes). Among them, about 60% of cellulosic fibres are dyed with reactive dyes [2].
The popularity of reactive dyes is mainly due to their high wash fastness and wide colour spectrum [3,4]. Its main disadvantage is that the dyeing process must be carried out in an alkaline medium by adding NaOH or Na2CO3 [2]. Moreover, to promote the reaction between the fibre and the dye, a large amount of electrolyte (NaCl or Na2SO4) must be added to the dyebath. The amount of electrolyte can be up to 100 g/L, depending on the colour intensity to be obtained [5]. It should be noted that the dyeing process with reactive dyes is associated with an intrinsic inefficiency due to the reaction of the dye with water (hydrolysed dye). It is estimated that between 30 and 50% of the dye initially added to the bath reacts with water and is discharged with the wastewater [2,4]. In addition, after the dyeing process, a wash-off stage is required to remove the unfixed dye.
Taking into account the above, from an environmental point of view, the dyeing process with reactive dyes and the subsequent wash-off stage can represent a serious problem for the aquatic environment, since this process produces effluents characterised by a high colouration, high salt content, and an alkaline pH. For this reason, the correct treatment of these effluents is a crucial process within the textile industry.
In general, effluents from the reactive dyeing process are treated by means of a combination of physical-chemical and biological processes [6]. Coagulation treatment is a simple process that provides good colour removal, but its efficiency decreases in the removal of soluble dyes [7,8]. On the other hand, the aromatic rings present in the dye molecules give them resistance to microbiological attacks. As a consequence, conventional biological treatments by activated sludge show low colour removal efficiencies, being a combination of membrane technologies or the application of specific tertiary treatments for decolouration [9]. These tertiary treatments are based on the addition of decolourising agents, and most of them are derived from tertiary and quaternary amines. The production of these amines entails a high impact in the category of climate change, due to the high energy consumption of amine synthesis [10]. It is important to highlight that none of these treatments allow the reuse of water. Considering the growth of the current population and the increase in the demand for water, a correct management of wastewater and its reuse is essential for the coming years [11].
Advanced purification processes are extensively studied for the treatment of effluents containing reactive dyes [7,12,13,14]. Electrochemical oxidation has shown its efficiency in the removal of reactive dyes. The results show a colour removal between 66% and 100%. In addition, the uncoloured effluents have been successfully reused in new dyeing processes, leading to the reuse of the salts present in the water (up to 72% savings) [15]. This type of treatment has several advantages over conventional treatments, such as no generation of waste and no addition of reagents since the treatment is carried out with the salts already present in the effluent. Despite the clear advantages of electrochemical processes, it is still necessary to optimise working conditions in order to obtain the maximum colour removal with the lowest energy consumption.
The aim of this work was to determine the influence of factors such as pH, conductivity, and dye concentration on the electrical consumption required to achieve a certain decolourisation. For this purpose, statistical models were formulated and analysed. These models related the factors and all their interactions with consumption and colour removal, in order to determine the working conditions that guarantee the maximum decolourisation with the minimum consumption. From an industrial application point of view, this work also studied the possibility of treating exhausted dye baths individually or mixing them with the effluents generated in the wash-off stages.

2. Materials and Methods

The experimental study was performed with solutions of the reactive dye Procion MX-2R (DyStar, Barcelona, Spain), which belongs to a range of commercial dyes widely used in the dyeing of cellulosic fibres. The Colour Index classifies this dye as C.I. Reactive Orange 4, which contains one azo group as chromophore and one dichlorotriazine reactive group (Figure 1).
The treatments were carried out in an undividable electrolytic cell with a capacity of 2 L. The electrodes were made of Ti/PtOx, with 44.8 cm2 of active surface. In all the experiments, the current intensity was fixed at 2 A, with the power supply being Grelco GVD310 0-30 Vcc/0-10 A.
The experimental work was initially carried out with a factorial design 23 (8 experiments), and the control factors were pH, conductivity, and dye concentration. Once these 8 experiments were performed and analysed, a new factor was introduced: the conductivity due only to the NaCl added as the dyeing electrolyte. Then, the experimental work was increased to 34 points.
To simulate industrial wastewater conditions, synthetic solutions of the dye (from 0.1 to 2.0 g/L) were prepared with different salt contents (the total conductivity was from 10 to 50 mS/cm) and pH values (from 5 to 11), as Table 1 indicates. The values fixed for dye concentration and conductivity corresponded to the maximum and minimum values usually found for reactive dye textile wastewater. The range of pH values was defined by considering the following considerations: (i) the usual value of pH in real reactive dye effluents (9–11), (ii) the optimal working range of electrodes (>5), and (iii) the equilibrium of the oxidant species generated from the chloride ion.
The different factors are defined as: pH; CNaCl: conductivity due to the NaCl added (mS/cm); Ctotal: total conductivity of the experiment adjusted with NaCl + Na2SO4 (mS/cm); and d: dye concentration (g/L).
The references of the tests are indicated by the value of the different factors in the following order: pH-CNaCl-Ctotal-di.
The kinetics of colour removal was studied for the 34 experiments. In all cases, the tests were monitored until reaching a degree of decolouration of 85%. All kinetics were adjusted to a first-order reaction, according to Equation (1).
−ln(dQ/di) = k × Q
where k is the reaction rate, and di and dQ are, respectively, the initial dye concentration and the dye concentration at current value Q (in A·L·h−1). The dye concentration was determined by absorbance measurements, performed with a UV-visible spectrophotometer (Shimadzu UV-2401PC, Barcelona, Spain) at 489 nm, the wavelength of maximum absorption of the studied dye. The calibration curve used was y = 0.0239x + 0.001 (R2 = 1).

3. Results and Discussion

3.1. Decolouration Kinetics

The kinetics of decolouration was studied for the 34 electrochemical tests. All kinetics were adjusted to a first-order kinetic reaction, as is indicated in experimental section (Equation (1)).
Figure 2 shows three examples of the kinetic adjustment carried out. The rest of the decolouration kinetics are presented in the supplementary information.
As can be seen in the examples of Figure 2, some of the kinetics studied followed a first-order tendency from the beginning of the reaction, whereas other kinetics were adjusted to a first-order kinetic reaction, but only after discarding the first points. This indicates that, depending on the experimental conditions, the reaction of decolouration requires a certain amount of applied current to acquire a stable first-order behaviour. For this reason, the model of k should be adjusted, taking into account this phenomenon (Equation (2)).
−ln(dQ/di) = y0 + k × Q
where y0 is the y-intercept.
This behaviour is consistent with an indirect oxidation of the dye, where the decolouration process proceeds through the reaction of the dye molecules with oxidant species generated in the anode, according to Equations (3) and (4) [17,18,19,20]:
Generation of oxidants:
2Cl + 2H2O − 2e → 2ClO + 4H+
Indirect dye oxidation:
ClO + dye → uncoloured dye fragments + Cl
Thus, the chloride anion has two functions: it acts as an electrolyte, increasing the conductivity of water in the same way as other anions, and it acts as an indirect oxidant. For this reason, kinetics with the same conductivity and different amounts of Cl were studied, as described in the next section.

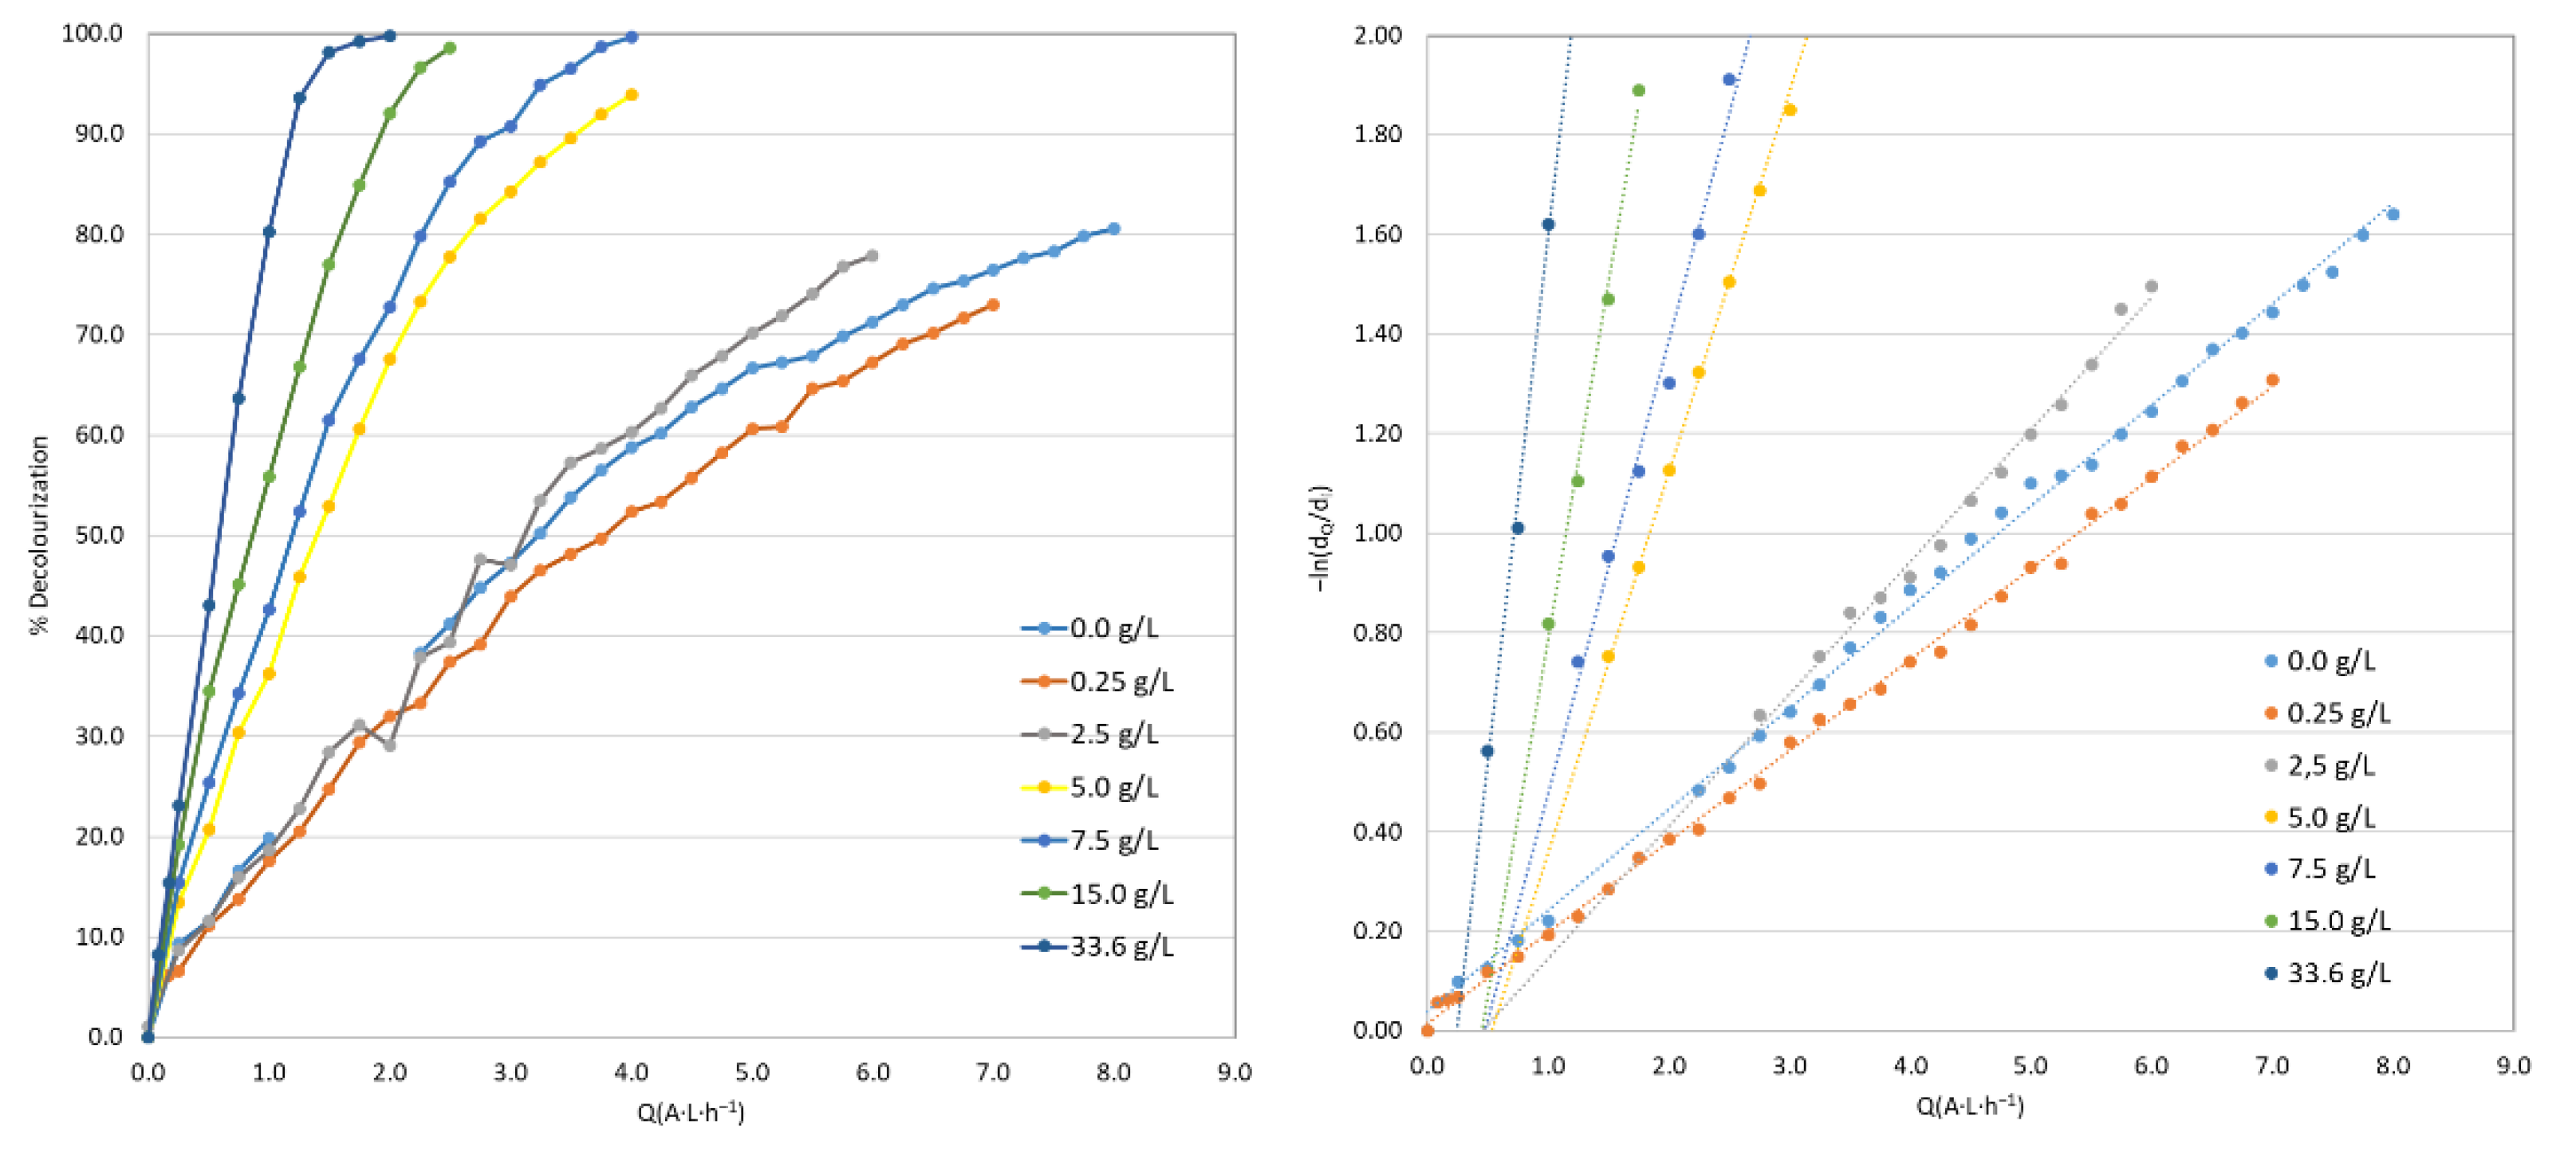
3.2. Influence of NaCl Concentration

According to Equations (3) and (4), NaCl acts in two ways: (1) as a reagent to generate oxidants and (2) as an electrolyte to increase the conductivity of the solution. To study both effects separately, seven kinetics with the same conductivity and different concentrations of NaCl were carried out (trials 19–25).
All of them were performed at pH 5 and a dye concentration of 2 g/L. Different amounts of NaCl were added to each solution: 0, 0.25, 2.50, 5.00, 7.50, 15.00, and 33.60 g/L (which correspond to CNaCl: 0–1.71 −5.74–9.95–13.98–25.40 and 50.00 mS/cm, respectively). In all cases, the Ctotal of the solutions was adjusted 50.00 mS/cm with Na2SO4, which is an inert electrolyte. The kinetic curves obtained for these experiments are compared in Figure 3.
As can be seen, at the same conductivity value, when the amount of NaCl increases, the kinetics become much faster. For this reason, the conductivity due to the NaCl is included as a specific factor in the model study section, in addition to the total conductivity of the solution. The results of the kinetic adjustments are detailed in the next section.

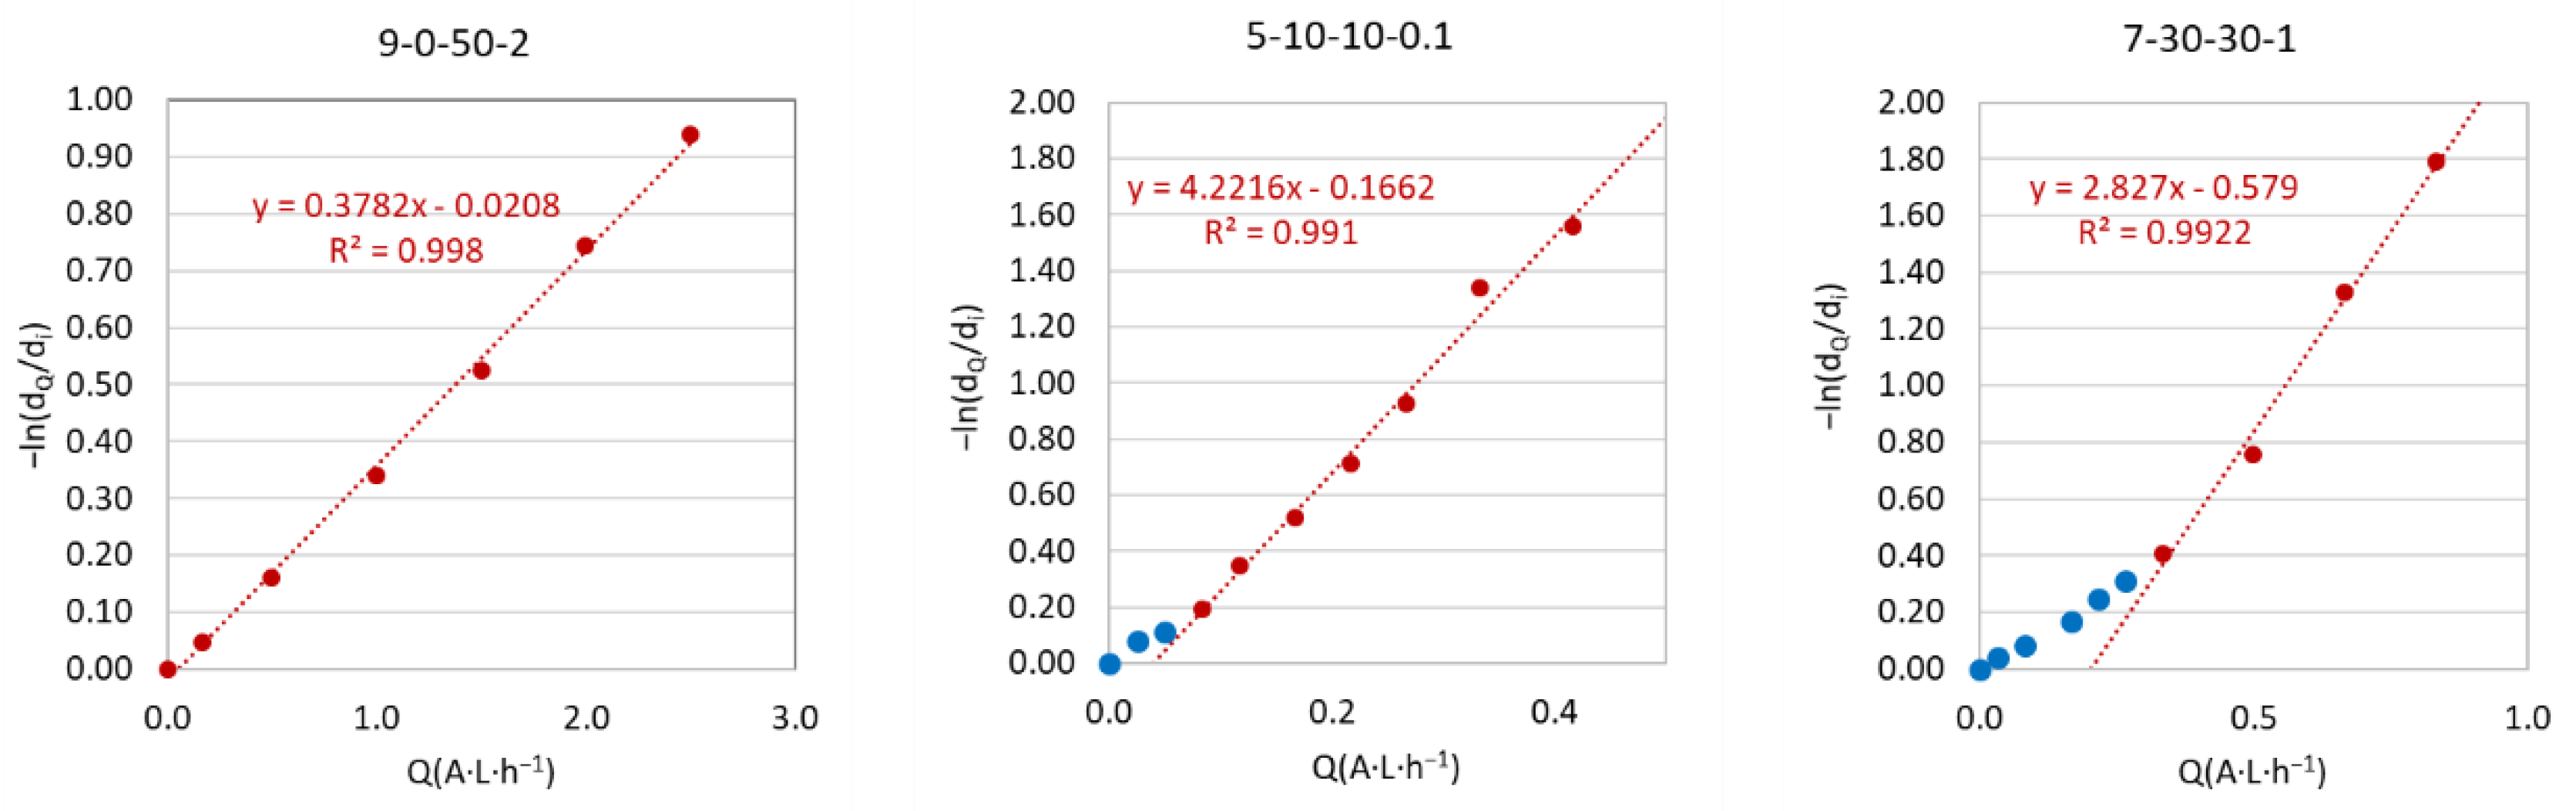
3.3. Kinetic Adjustments

The kinetic curves were adjusted for the 34 trials, using only the points obtained once a stable first-order behaviour was observed according to Equation (2).
The kinetic constant (k), the y-intercept (y0), and the determination coefficient (R2) obtained for each adjustment are indicated in Table 2. k is the slope of the adjusted curve, whereas y0 is used as a tool for modelling purposes.

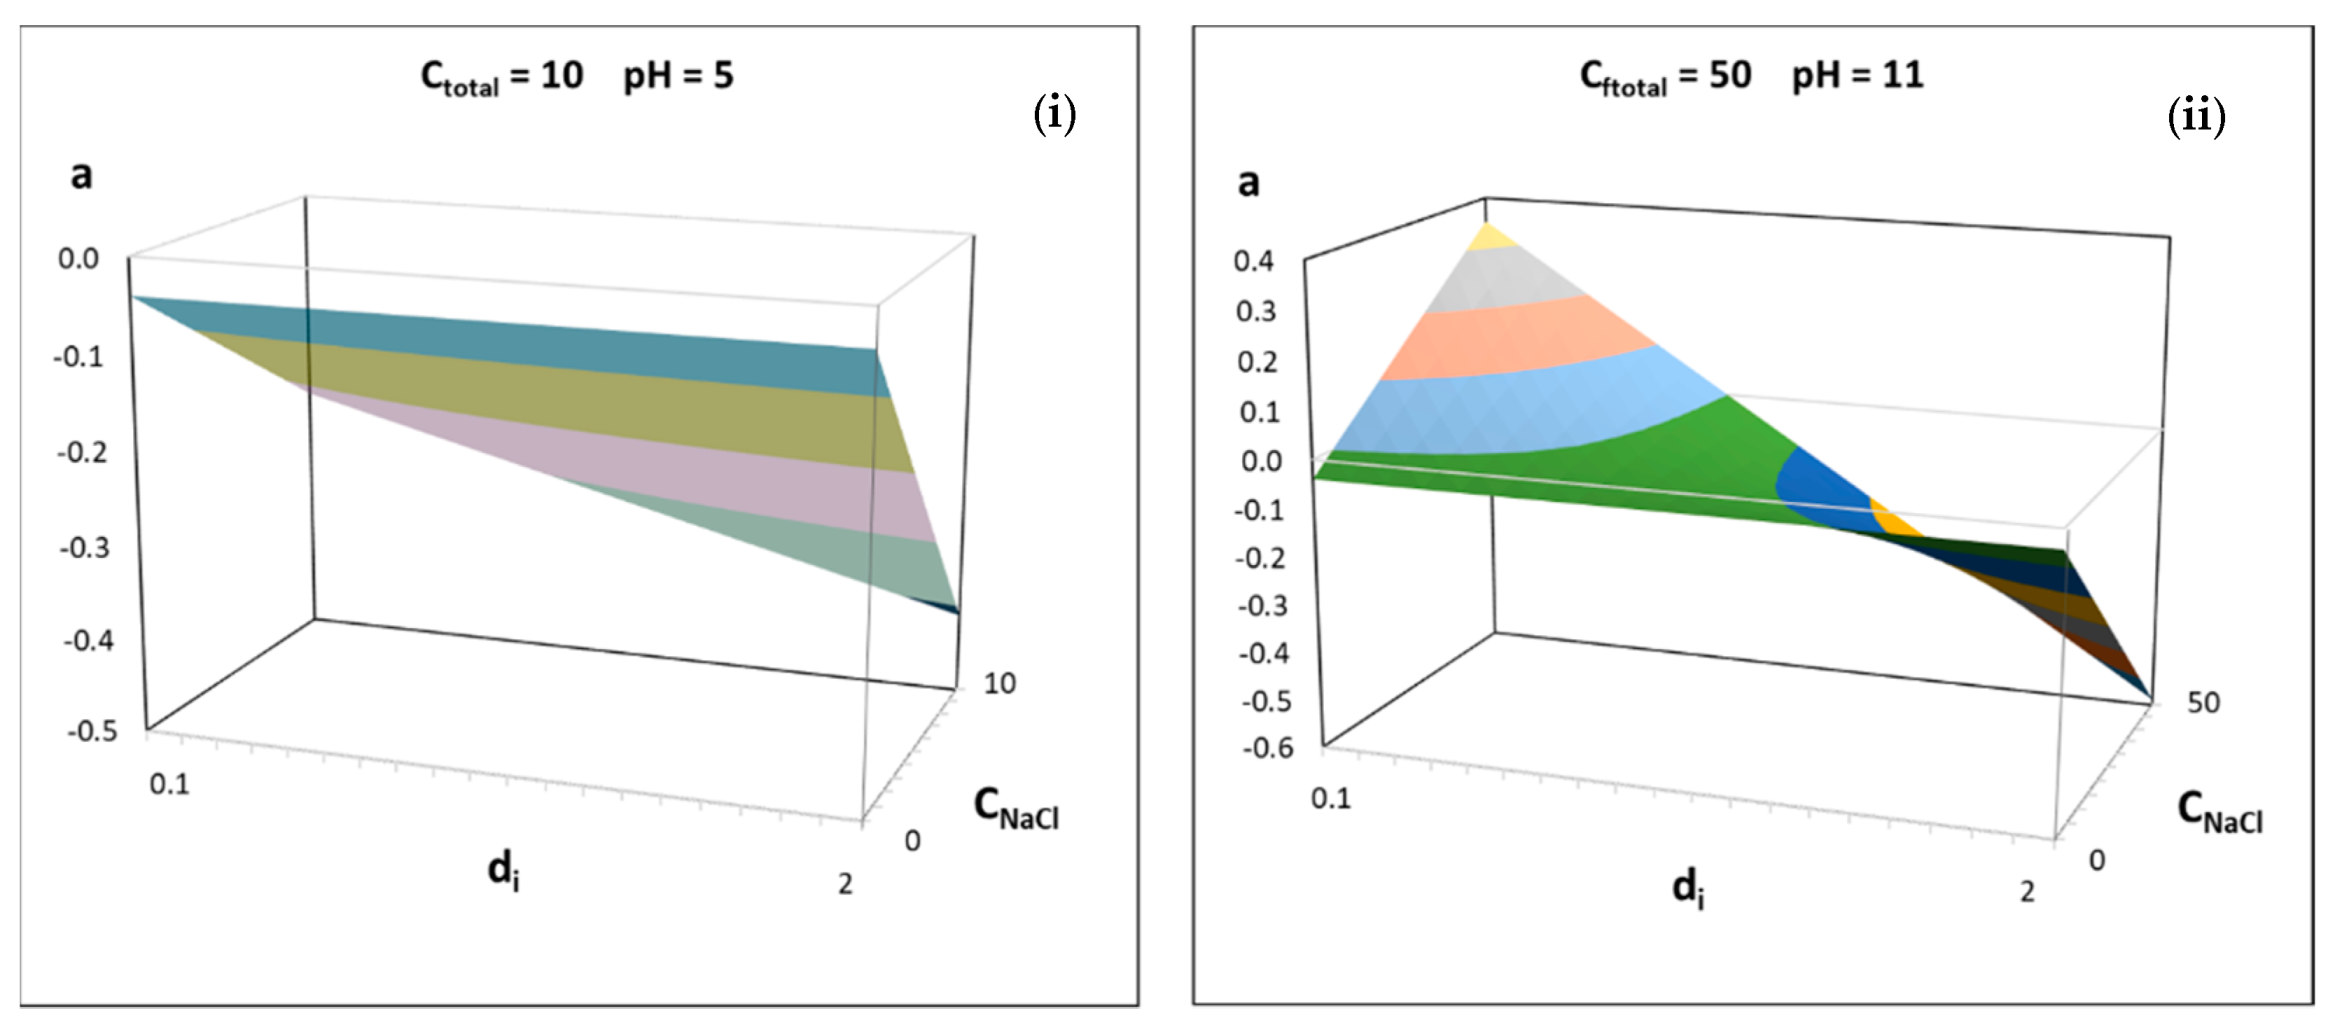
3.4. Models of Kinetic Parameters

The parameters y0 and k were modelized according to the control factors of the process (pH, CNaCl, Ctotal, and di) and their interactions. The results are expressed in the following Equations (5) and (6):
k = 1.1150 − 0.5015 di + 0.1593 CNaCl − 0.0215 di·CNaCl − 0.0016 CNaCl·Ctotal   (R2 = 0.8365)
y0 = −0.401 − 0.0280 CNaCl + 0.0010 pH·CNaCl − 0.0098 di·CNaCl + 0.0005 CNaCl·Ctotal (R2 = 0.8318)
According to the results, the k value depends directly on the initial dye concentration and on the conductivity due to NaCl. It also depends on the interaction between di and CNaCl, as well as between CNaCl and Ctotal. Although the pH was not found significant on the k value, it is important to underline that this factor has an influence on the y0 value through its interaction with CNaCl. Moreover, the initial dye concentration does not have a direct effect on the y0 value; it influences only the interaction with the conductivity due to NaCl.
The adjustment of both models to the experimental values is shown in Figure 4.
As can be seen, overall, a good concordance of experimental and calculated points was observed. This indicates that the obtained models could be applied to the prediction of the dye decolouration behaviour in the defined range of study. Surface responses are useful tools for a better understanding of models. Figure 5 shows the different response surfaces plotted for the model of k (Equation (5)).
It can be noticed that all response surfaces of Figure 5 show a significant increase in k when the amount of NaCl increases. Therefore, the lower k is obtained in the absence of NaCl (CNaCl = 0), and the maximum k value corresponds to the experiment with the total conductivity due to NaCl (CNaCl = Ctotal).
On the other hand, the surfaces Figure 5(i,ii) do not show any influence of pH on k, as it can be seen that the decolouration rate is constant along the pH axis.
The surfaces Figure 5(iii,iv) show evidence that, when the dye concentration (di) increases, the k value decreases. The more significant decrease is obtained when CNaCl = Ctotal.
Finally, when comparing response surfaces Figure 5(iii,iv), it can be stated that the higher the total conductivity (from Ctotal = 10 to Ctotal = 50), the faster the reaction.
With respect to the parameter y0, which was obtained from the adjustment of the decolouration curves once they were stabilised as first-order kinetics, it does not have a real technical interpretation. However, from a practical point of view, its model is necessary to calculate the current required to achieve a certain decolouration level (Figure 6).
Figure 6 shows evidence that, in the absence of NaCl (CNaCl = 0), the dye concentration does not have an influence on the y0 value, and its value is almost zero. This fact agrees with the kinetics obtained when using Na2SO4 as the only electrolyte. In those cases, all tests were found to be first-order kinetics from the beginning (Figure 3)
When CNaCl is close to Ctotal, the value of y0 decreases when the initial dye concentration increases. This effect becomes more evident for high pH values.
As indicated, the parameter y0 by itself does not provide clear technical information, but it is useful to calculate the x-intercept, which is an indicator of the current required to achieve a first-order reaction (Qfo). The Qfo values are obtained by substituting Equations (5) and (6) into Equation (2).
Qfo = (0.401 + 0.0280*CNaCl − 0.0010*pH*CNaCl + 0.0098*di*CNaCl − 0.0005*CNaCl*Ctotal)/(1.1150 − 0.5015*di + 0.1593*CNaCl − 0.0215*di*CNaCl − 0.0016*CNaCl*Ctotal)
According to Equation (7), the higher Qfo, the bigger the current required to stabilise the decolouration in a first-order reaction. As the first-order step is faster than the initial step, it can also be stated that the lower the Qfo value, the higher the current efficiency.
The equation of Qfo is complex, and it is difficult to evaluate the influence of di, CNaCl, or Ctotal, as they are present in several terms in the numerator and the denominator. Instead, it provides a clear tendency with respect to the pH, which is present in the interaction with CNaCl. This is consistent with the equilibrium of chlorine species, as they are dependent on the pH. In addition, it can be noticed that the pH has an inverse effect. This implies that, for a fixed concentration of NaCl, the higher the pH, the lower the value of Qfo. Therefore, at an alkaline pH, the treatment is more efficient, as lower current values are required to achieve first-order kinetics.

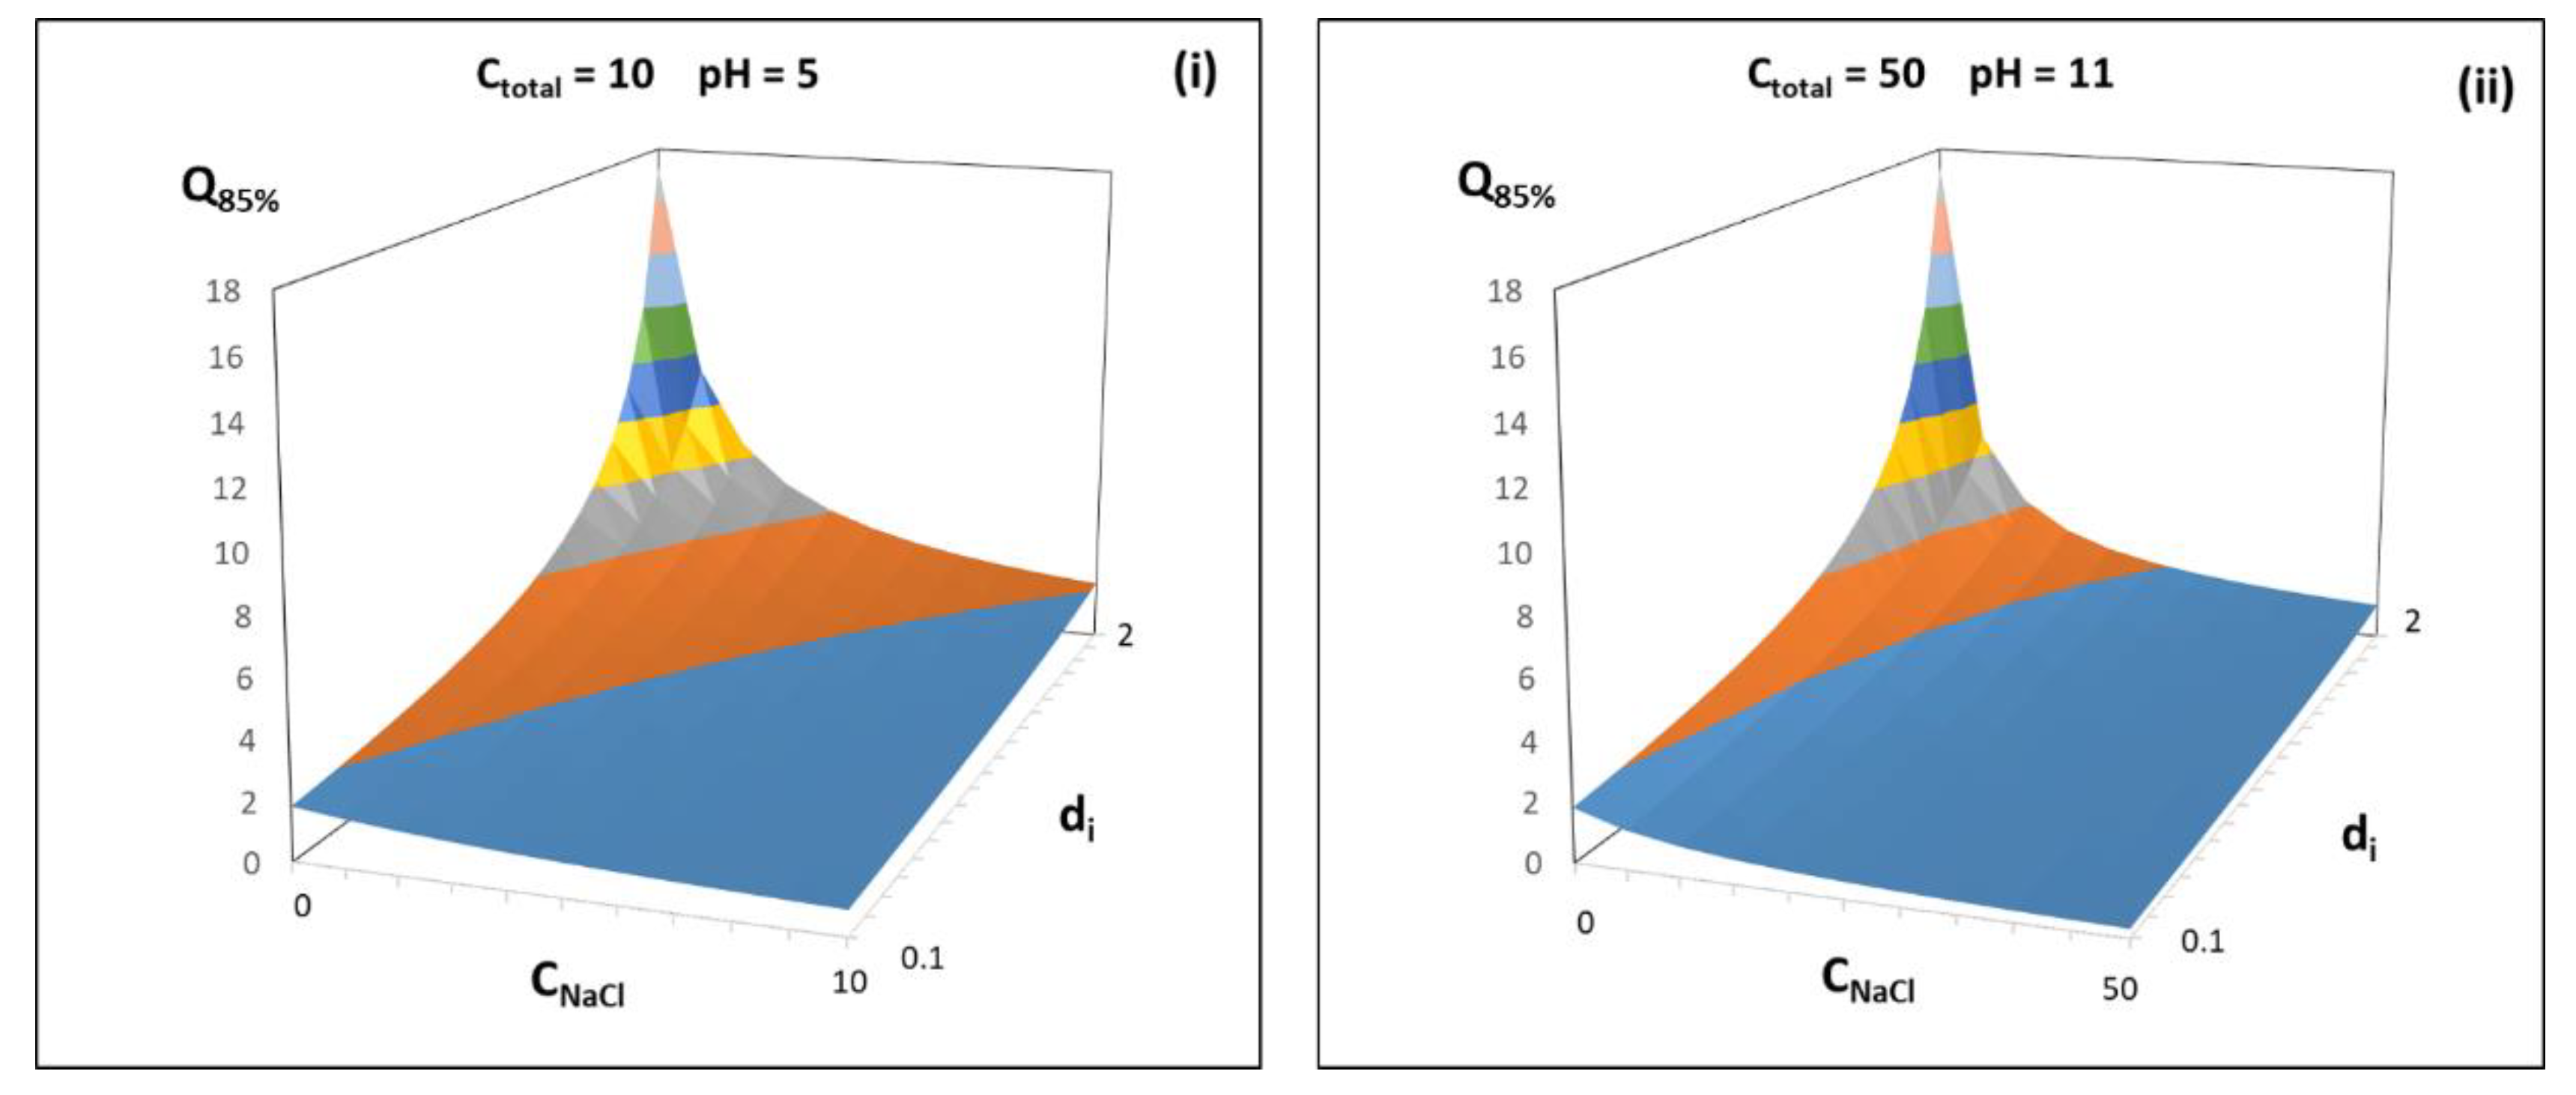
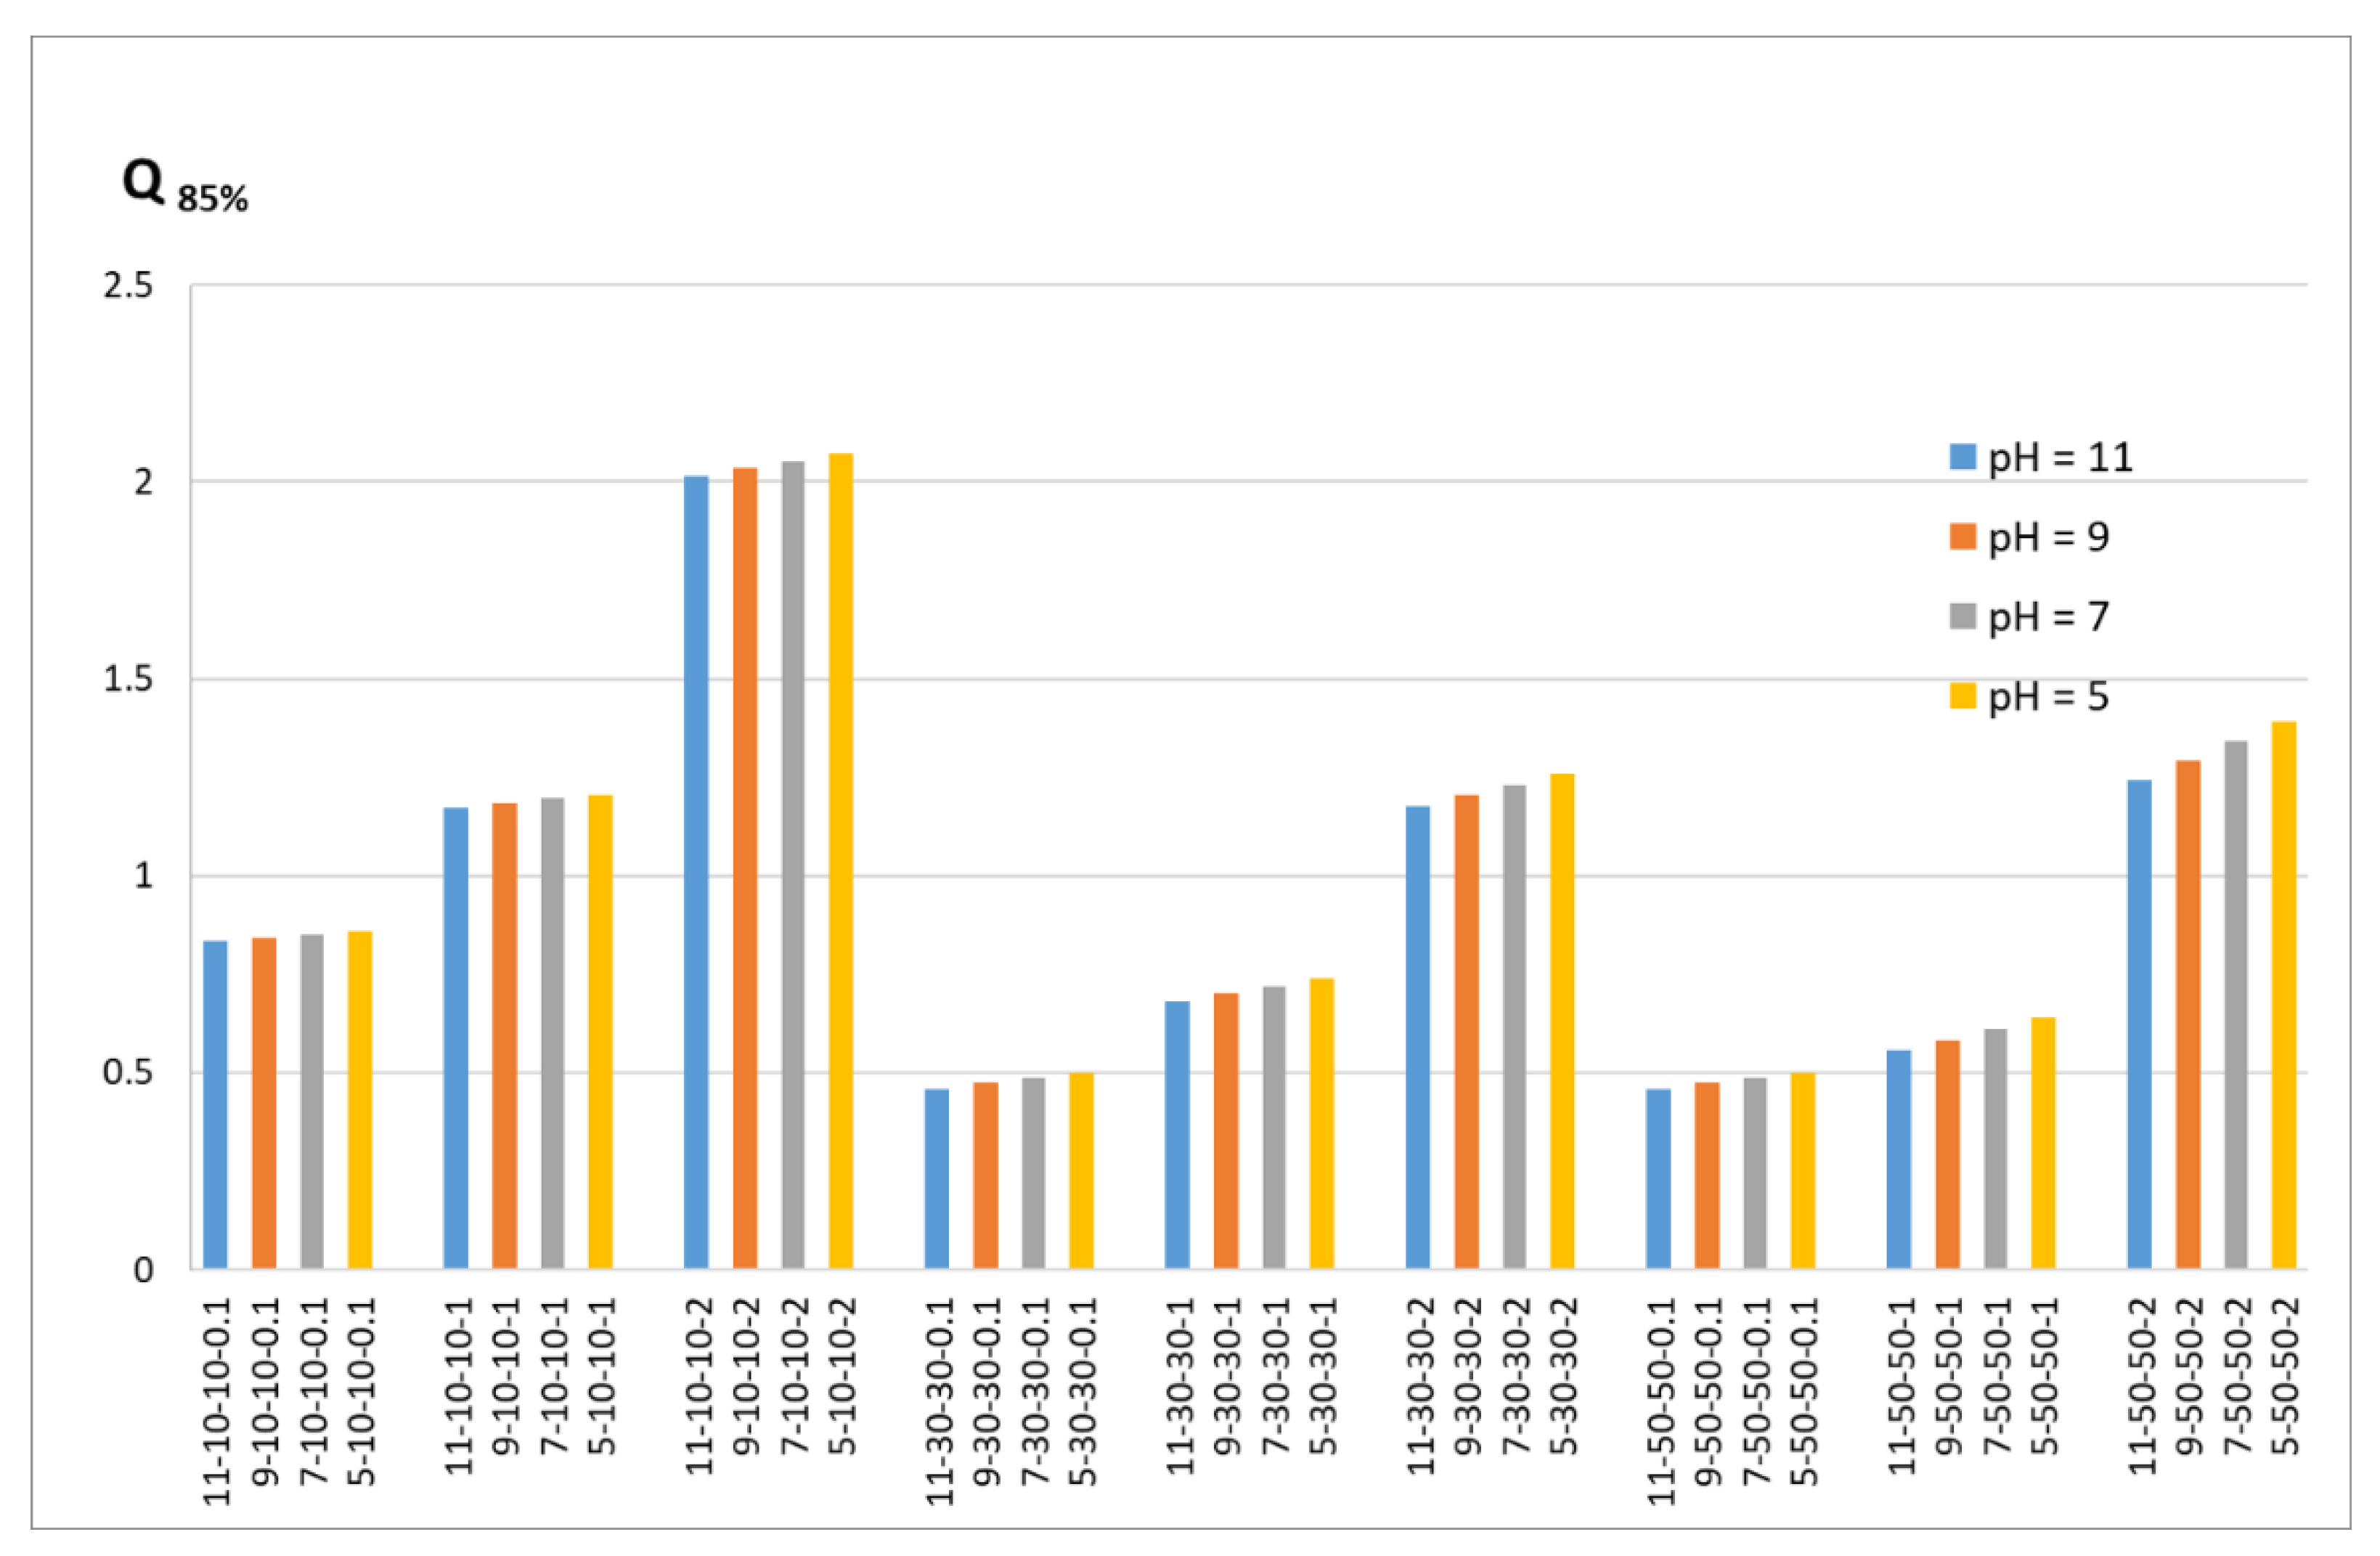
3.5. Optimisation of the Industrial Working Conditions

From the practical point of view, in addition to the influence of the factors on the kinetic rate, it is also interesting to know the influence of the factors on the current required to achieve a fixed decolouration value.
This current value is calculated by means of Equation (8):
Q = (−ln (1 − decolouration value) − y0)/k
Figure 7 shows the evolution of the current required to obtain 85% colour removal under different working conditions.
Figure 7 shows evidence that, for high dye concentrations, when the conductivity due to NaCl is close to zero, high current values are required to reach 85% colour removal. However, when CNaCl is close to Ctotal, the current values decrease dramatically, showing a slow increase with the dye concentration and a slight decrease with the pH. A slightly lower electric current value is required at pH 11 than at pH 5. It is important to underline that reactive dyeing effluents have an alkaline pH, which confirms that it is not necessary to modify the pH to improve the treatment efficiency.
Beyond the treatment, the pH is important in wastewater reuse. When the treated effluents are used in new dyeing processes, it is always necessary to neutralise the treated effluents [21]. In this sense, it is interesting to elucidate if it is more advantageous to neutralise them before or after the electrochemical treatment.
Figure 8 shows that, although the required current increases slightly when the pH is reduced, when it comes to practical effects, the influence is very low. Then, it does not matter if the neutralisation required for the reuse of the effluent is performed before or after the decolouration process, being slightly more efficient than the electrochemical treatment at an alkaline pH.
Finally, two case studies were evaluated. As mentioned above, the dyeing process with reactive dyes requires a subsequent wash-off process. As can be observed, the effluent generated in the wash-off stage also has a high colouration, conductivity, and an alkaline pH. Therefore, it must also be treated properly.
Case 1:
(1a) Residual dyebath:
d = 1.00 g·L−1    CNaCl = Ctotal = 50.00 mS·cm−1   pH= 11.3
(1b) First wash-off effluent:
d = 0.72 g·L−1   CNaCl = Ctotal = 10.91 mS·cm−1   pH= 10.2
(1c) Mixture of the same volume of the two effluents.
Case 2:
(2a) Residual dyebath:
d = 2.00 g·L−1   CNaCl = Ctotal = 50.00 mS·cm−1   pH= 11.3
(2b) First wash-off effluent:
d = 1.45 g·L−1   CNaCl = Ctotal = 10.91 mS·cm−1   pH= 10.2
(2c) Mixture of the same volume of the two effluents.
In all cases, the required Q to reach a degree of decolouration of 85% was calculated, and the feasibility of mixing both effluents was evaluated (Figure 9).
Taking into account the necessary current value in each case, it is advisable to mix both effluents before the electrochemical treatment, especially when the dye concentration is high.

4. Conclusions

In this work, the influence of pH, dye concentration, total conductivity, and conductivity due to the NaCl concentration, on the decolouration kinetic constant and on the current consumption required to reach 85% decolouration were evaluated and modelled.
According to the results, the conductivity of the solution has a significant influence on the process efficiency. The decolouration rate becomes faster when the conductivity increases. This fact is remarkable when the conductivity of the solution is mainly due to the presence of NaCl. However, in these cases, it was observed that a certain amount of current is required before the reaction achieves a first-order kinetic. On the other hand, when Na2SO4 is the only electrolyte in the solution, the decolouration reaction follows a first-order kinetic from the beginning, but the reaction is slower.
On the other hand, when the dye concentration increases, the current required to reach 85% decolouration also increases, especially when the amount of NaCl is low. It was also found that the pH is not a key factor in the efficiency of the treatment, but it has an effect on the current necessary to stabilise the reaction in first-order kinetics.
Finally, the model obtained in this work was used to evaluate the required current value at an industrial level. The feasibility of individually treating the effluents from dyeing and the subsequent washing-off process was studied. It was concluded that, from an energy consumption point of view, it is advisable to mix both effluents for efficient decolouration.

Supplementary Materials

The following are available online at https://www.mdpi.com/article/10.3390/pr10102024/s1, the re-sults obtained in the 34 tests carried out are shown in the supplementary information.

Author Contributions

Conceptualization, M.P. and C.G.-B.; methodology, M.P., C.G.-B., V.L.-G. and V.B.; formal analysis, M.P., C.G.-B., V.L.-G., V.B. and B.V.; investigation, B.V., V.B. and V.L.-G.; resources, C.G.-B.; writing—original draft preparation, M.P. and C.G.-B.; writing—review and editing, V.B. and V.L-G.; supervision, C.G.-B. and M.P.; project administration, C.G.-B.; funding acquisition, C.G.-B. All authors have read and agreed to the published version of the manuscript.

Funding

This research received no external funding.

Data Availability Statement

Not applicable.

Conflicts of Interest

The authors declare no conflict of interest.

References

  1. Azam Khan, M.; Wahid, A.; Ahmad, M.; Tayab Tahir, M.; Ahmed, M.; Ahmad, S.; Hasanuzzaman, M. World Cotton Production and Consumption: An Overview. In Cotton Production and Uses: Agronomy, Crop Protection, and Postharvest Technologies; Shakeel, A., Hasanuzzaman, M., Eds.; Springer: Singapore, 2020; pp. 1–7. [Google Scholar] [CrossRef]
  2. Burkinshaw, S.M.; Salihu, G. The Role of Auxiliaries in the Immersion Dyeing of Textile Fibres: Part 6 Analysis of Conventional Models That Describe the Manner by Which Inorganic Electrolytes Promote Reactive Dye Uptake on Cellulosic Fibres. Dye. Pigment. 2019, 161, 595–604. [Google Scholar] [CrossRef]
  3. Wei, Y.; Jiang, Z.; Wang, Q.; Wang, P.; Yu, Y. A Salt-Free and Water-Saving Approach as a Green Alternative to Conventional Reactive Dyeing of Cotton. Sustain. Chem. Pharm. 2021, 24, 100536. [Google Scholar] [CrossRef]
  4. Bezerra, K.C.H.; Fiaschitello, T.R.; Labuto, G.; Freeman, H.S.; Fragoso, W.D.; da Costa, S.M.; da Costa, S.A. Reuse of Water from Real Reactive Monochromic and Trichromic Wastewater for New Cotton Dyes after Efficient Treatment Using H2O2 Catalyzed by UV Light. J. Environ. Chem. Eng. 2021, 9, 105731. [Google Scholar] [CrossRef]
  5. Dong, X.; Gu, Z.; Hang, C.; Ke, G.; Jiang, L.; He, J. Study on the Salt-Free Low-Alkaline Reactive Cotton Dyeing in High Concentration of Ethanol in Volume. J. Clean Prod. 2019, 226, 316–323. [Google Scholar] [CrossRef]
  6. Hussein, T.K.; Jasim, N.A. A Comparison Study between Chemical Coagulation and Electro-Coagulation Processes for the Treatment of Wastewater Containing Reactive Blue Dye. Mater. Today Proc. 2021, 42, 1946–1950. [Google Scholar] [CrossRef]
  7. Feng, L.; Liu, J.; Guo, Z.; Pan, T.; Wu, J.; Li, X.; Liu, B.; Zheng, H. Reactive Black 5 Dyeing Wastewater Treatment by Electrolysis-Ce (IV) Electrochemical Oxidation Technology: Influencing Factors, Synergy and Enhancement Mechanisms. Sep. Purif. Technol. 2022, 285, 120314. [Google Scholar] [CrossRef]
  8. Vilaseca, M.; López-Grimau, V.; Gutiérrez-Bouzán, C. Valorization of Waste Obtained from Oil Extraction in Moringa Oleifera Seeds: Coagulation of Reactive Dyes in Textile Effluents. Materials 2014, 7, 6569–6584. [Google Scholar] [CrossRef]
  9. Yang, X.; López-Grimau, V.; Vilaseca, M.; Crespi, M. Treatment of Textile Wastewater by CAS, MBR, and MBBR: A Comparative Study from Technical, Economic, and Environmental Perspectives. Water 2020, 12, 1306. [Google Scholar] [CrossRef]
  10. Yang, X.; López-Grimau, V. Reduction of Cost and Environmental Impact in the Treatment of Textile Wastewater Using a Combined MBBR-MBR System. Membranes 2021, 11, 892. [Google Scholar] [CrossRef] [PubMed]
  11. Appa, R.M.; Ramesh Naidu, B.; Venkateswarlu, D.; Hanafiah, M.M.; Lakkaboyana, S.K.; Lakshmidevi, J.; Venkateswarlu, K. Water Extract of Pomegranate Ash–I2 as Sustainable System for External Oxidant/Metal/Catalyst-Free Oxidative Iodination of (Hetero)Arenes. Green Chem. Lett. Rev. 2021, 14, 700–712. [Google Scholar] [CrossRef]
  12. Suhadolnik, L.; Pohar, A.; Novak, U.; Likozar, B.; Mihelič, A.; Čeh, M. Continuous Photocatalytic, Electrocatalytic and Photo-Electrocatalytic Degradation of a Reactive Textile Dye for Wastewater-Treatment Processes: Batch, Microreactor and Scaled-up Operation. J. Ind. Eng. Chem. 2019, 72, 178–188. [Google Scholar] [CrossRef]
  13. Can-Güven, E. Advanced Treatment of Dye Manufacturing Wastewater by Electrocoagulation and Electro-Fenton Processes: Effect on COD Fractions, Energy Consumption, and Sludge Analysis. J. Environ. Manag. 2021, 300, 113784. [Google Scholar] [CrossRef]
  14. Dadban Shahamat, Y.; Masihpour, M.; Borghei, P.; Hoda Rahmati, S. Removal of Azo Red-60 Dye by Advanced Oxidation Process O3/UV from Textile Wastewaters Using Box-Behnken Design. Inorg. Chem. Commun. 2022, 143, 109785. [Google Scholar] [CrossRef]
  15. Buscio, V.; López-Grimau, V.; Álvarez, M.D.; Gutiérrez-Bouzán, C. Reducing the Environmental Impact of Textile Industry by Reusing Residual Salts and Water: ECUVal System. Chem. Eng. J. 2019, 373, 161–170. [Google Scholar] [CrossRef]
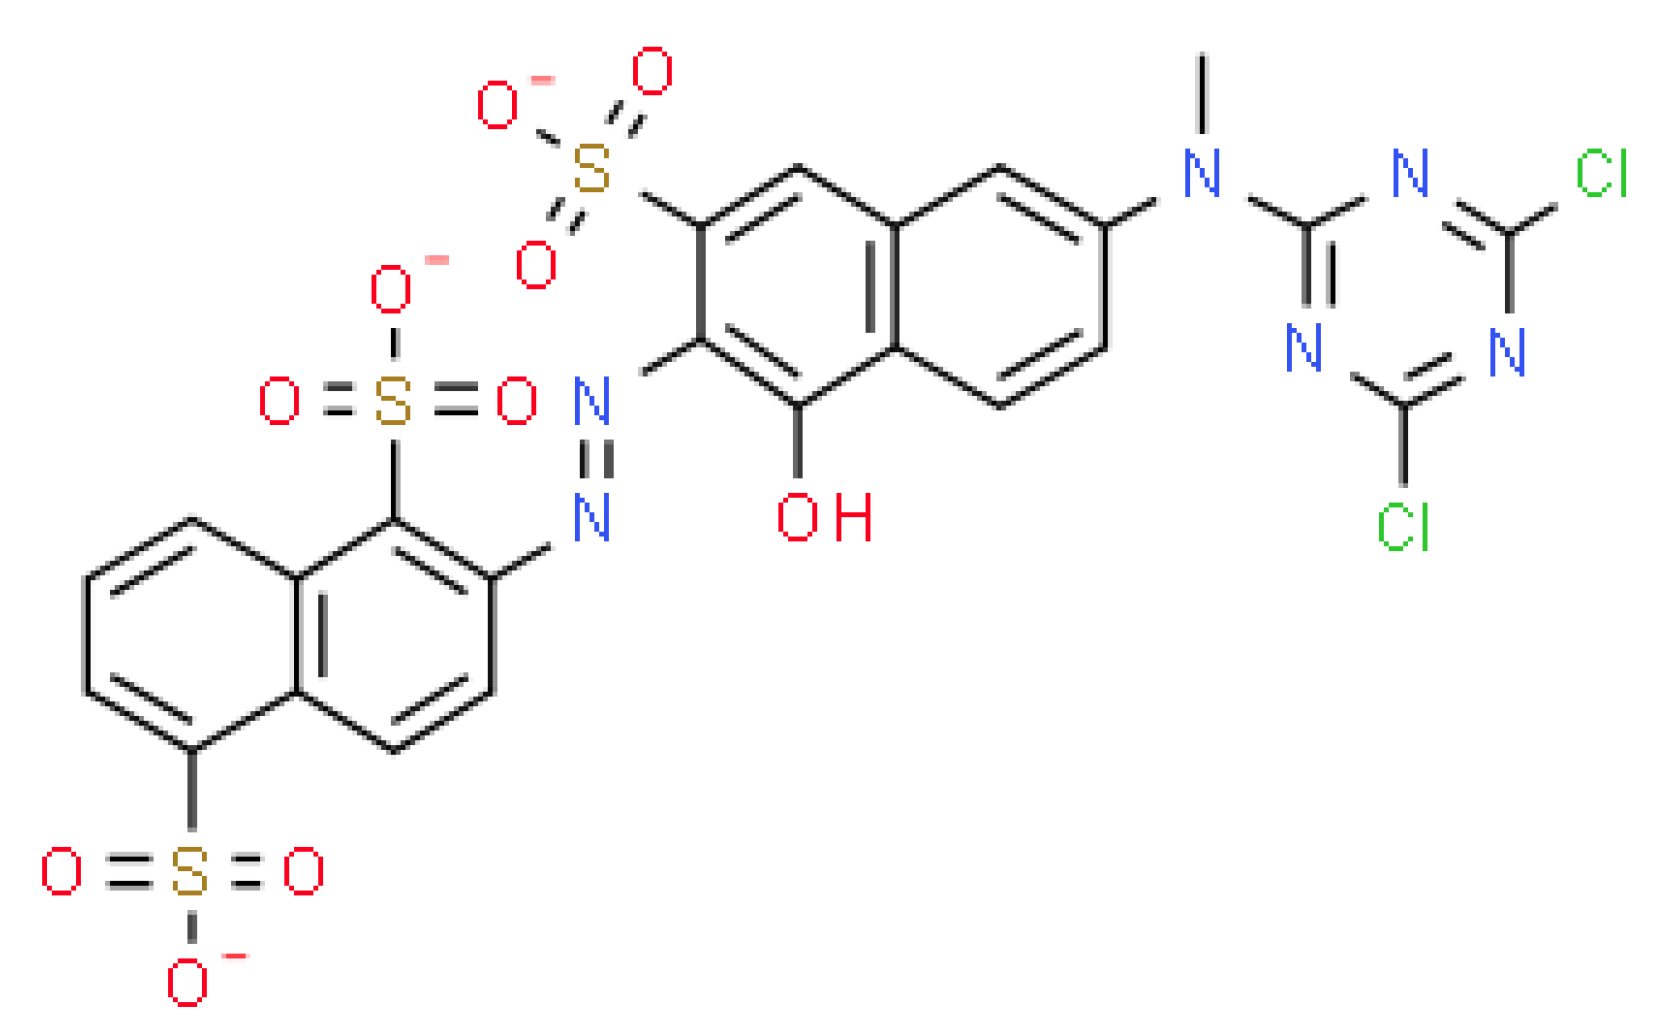
  16. Chemspider Database. Available online: http://www.chemspider.com/Chemical-Structure.20157139.html (accessed on 4 October 2022).
  17. Buscio, V.; García-Jiménez, M.; Vilaseca, M.; López-Grimau, V.; Crespi, M.; Gutiérrez-Bouzán, C. Reuse of Textile Dyeing Effluents Treated with Coupled Nanofiltration and Electrochemical Processes. Materials 2016, 9, 490. [Google Scholar] [CrossRef] [PubMed]
  18. Garcia-Segura, S.; Ocon, J.D.; Chong, M.N. Electrochemical Oxidation Remediation of Real Wastewater Effluents—A Review. Process Saf. Environ. Prot. 2018, 113, 48–67. [Google Scholar] [CrossRef]
  19. García-Espinoza, J.D.; Mijaylova-Nacheva, P.; Avilés-Flores, M. Electrochemical Carbamazepine Degradation: Effect of the Generated Active Chlorine, Transformation Pathways and Toxicity. Chemosphere 2018, 192, 142–151. [Google Scholar] [CrossRef]
  20. Klidi, N.; Clematis, D.; Delucchi, M.; Gadri, A.; Ammar, S.; Panizza, M. Applicability of Electrochemical Methods to Paper Mill Wastewater for Reuse. Anodic Oxidation with BDD and TiRuSnO2 Anodes. J. Electroanal. Chem. 2018, 815, 16–23. [Google Scholar] [CrossRef]
  21. Gutiérrez-Bouzán, C.; Buscio, V.; Tornero, J.A. Reuse of Salt-Containing Dyeing Effluents by Means of an Electrochemical and Ultraviolet Coupled System. In Advances in Textile Waste Water Treatments; Muthu, S.S., Ed.; Springer: Singapore, 2021; pp. 1–24. [Google Scholar] [CrossRef]
Figure 1. Chemical structure of C.I. Reactive Orange 4 [16].
Processes 10 02024 g001
Figure 2. Examples of decolouration kinetics for the dye.
Processes 10 02024 g002
Figure 3. Influence of NaCl concentration of the kinetic results, working at a fixed conductivity.
Processes 10 02024 g003
Figure 4. Comparison of k and y0 values (experimental results versus values from models).
Processes 10 02024 g004
Figure 5. Modelized values for pH, di, CNaCl, and Ctotal. (i) Ctotal=10 and di = 0.1; (ii) Ctotal=50 and di = 2.0; (iii) Ctotal=10 and pH = 5; (iv) Ctotal=50 and pH = 11.
Processes 10 02024 g005
Figure 6. Modelized values of y0 with respect to pH, di, CNaCl, and Cfinal. (i) Ctotal=10 and pH = 5; (ii) Ctotal=50 and pH = 11.
Processes 10 02024 g006
Figure 7. Modelled values of current required to achieve 85% decolouration. (i) Ctotal=50 and pH = 5; (ii) Ctotal=50 and pH = 11.
Processes 10 02024 g007
Figure 8. Current required to obtain 85% decolouration under different initial conditions.
Processes 10 02024 g008
Figure 9. Comparison of Q required to achieve 85% decolouration by separately treating the exhausted dyebath and the first wash-off effluent or by mixing them before the treatment.
Processes 10 02024 g009
Table 1. Experimental conditions for each test.
TrialpHCNaCl (mS/cm)Ctotal (mS/cm)di (g/L)Reference
1530.030.01.05-30-30-1
2730.030.01.07-30-30-1
3930.030.01.09-30-30-1
4750.050.01.07-50-50-1
5710.010.01.07-10-10-1
6730.030.02.07-30-30-2
7710.010.00.17-10-10-0.1
8950.050.00.19-50-50-0.1
9550.050.00.15-50-50-0.1
10910.010.00.19-10-10-0.1
11510.010.00.15-10-10-0.1
12550.050.02.05-50-50-2
13950.050.02.09-50-50-2
14910.010.02.09-10-10-2
15510.010.02.05-10-10-2
16750.050.02.07-50-50-2
171150.050.02.011-50-50-2
181110.010.02.011-10-10-2
1950.050.02.05-0-50-2
2051.750.02.05-1.7-50-2
2155.750.02.05-5.7-50-2
2259.950.02.05-9.9-50-2
23514.050.02.05-14-50-2
24525.450.02.05-25.4-50-2
25550.050.02.05-50-50-2
2650.010.00.15-0-10-0.1
2790.010.02.09-0-10-2
2850.050.02.05-0-50-2
2990.050.00.19-0-50-0.1
3050.010.02.05-0-10-2
3190.010.00.19-0-10-0.1
3250.050.00.15-0-50-0.1
3390.050.02.09-0-50-2
3470.030.01.07-0-30-1
Table 2. Experimental conditions and parameters obtained with the first-order kinetic adjustments.
Referencesky0R2
5-30-30-13.3767−0.54010.9991
7-30-30-12.8270−0.57900.9922
9-30-30-12.4928−0.29270.9982
7-50-50-13.2751−0.34480.9776
7-10-10-11.6757−0.60810.9809
7-30-30-21.5874−0.63290.9927
7-10-10-0.13.7328−0.09580.9931
9-50-50-0.13.80010.13520.9977
5-50-50-0.16.05830.15740.9949
9-10-10-0.13.1596−0.21000.9964
5-10-10-0.14.2216−0.16620.9910
5-50-50-22.1372−1.20100.9799
9-50-50-21.9905−0.61590.9917
9-10-10-20.8535−0.45190.9910
5-10-10-20.8937−0.43850.9922
7-50-50-22.4245−0.80430.9871
11-50-50-22.0558−0.56360.9887
11-10-10-20.9568−0.48640.9861
5-0-50-20.20310.03760.9979
5-1.7-50-20.18250.01530.9985
5-5.7-50-20.2660−0.12150.9921
5-9.9-50-20.7408−0.35570.9994
5-14-50-20.9115−0.43700.9836
5-25.4-50-21.4326−0.64960.9931
5-50-50-22.1176−0.52340.9923
5-0-10-0.10.27530.00570.9978
9-0-10-20.1658−0.01760.9925
5-0-50-20.37060.02230.9940
9-0-50-0.10,8183−0.01200.9990
5-0-10-20.1516−0.00890.9968
9-0-10-0.10.22100.01300.9965
5-0-50-0.10.54390.02180.9946
9-0-50-20.3782−0.02080.9980
7-0-30-10.2525−0.00330.9943
Publisher’s Note: MDPI stays neutral with regard to jurisdictional claims in published maps and institutional affiliations.

