
Towards Autonomous Process Control—Digital Twin for HIV-Gag VLP Production in HEK293 Cells Using a Dynamic Metabolic Model
 , , ,
, , ,  and
and
Abstract
:1. Introduction
1.1. HIV
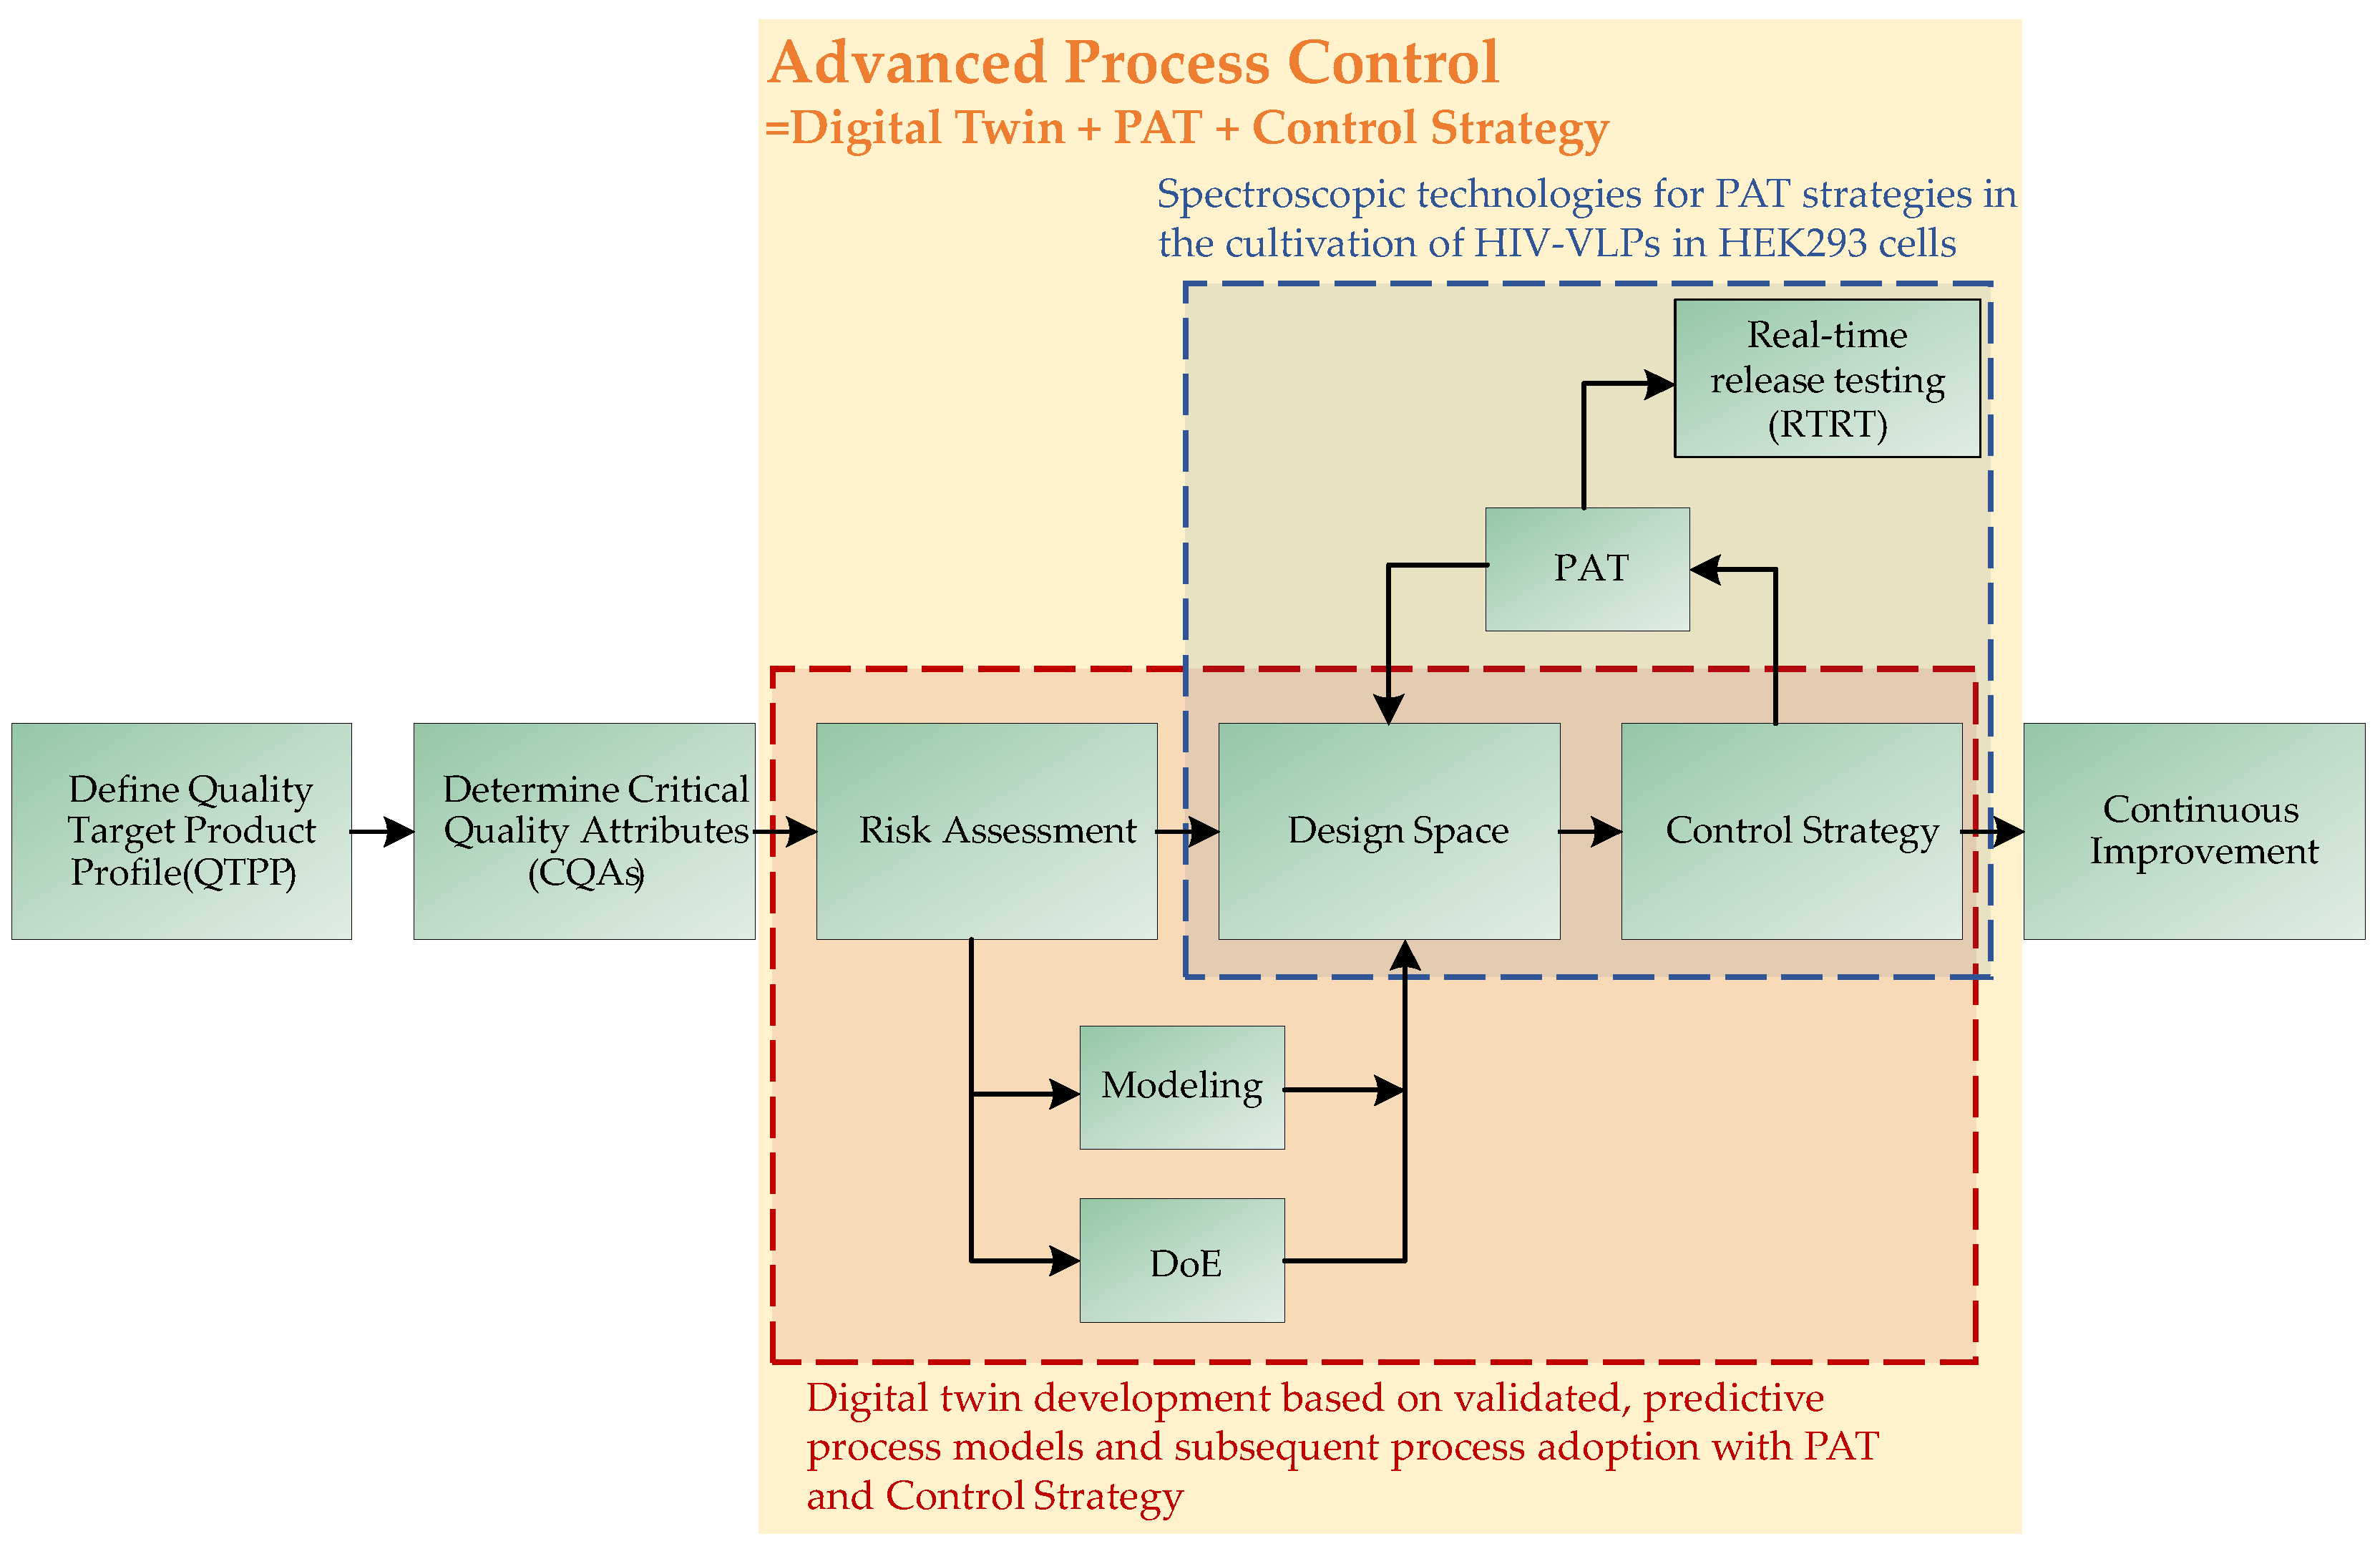
1.2. QbD-Based Process Development

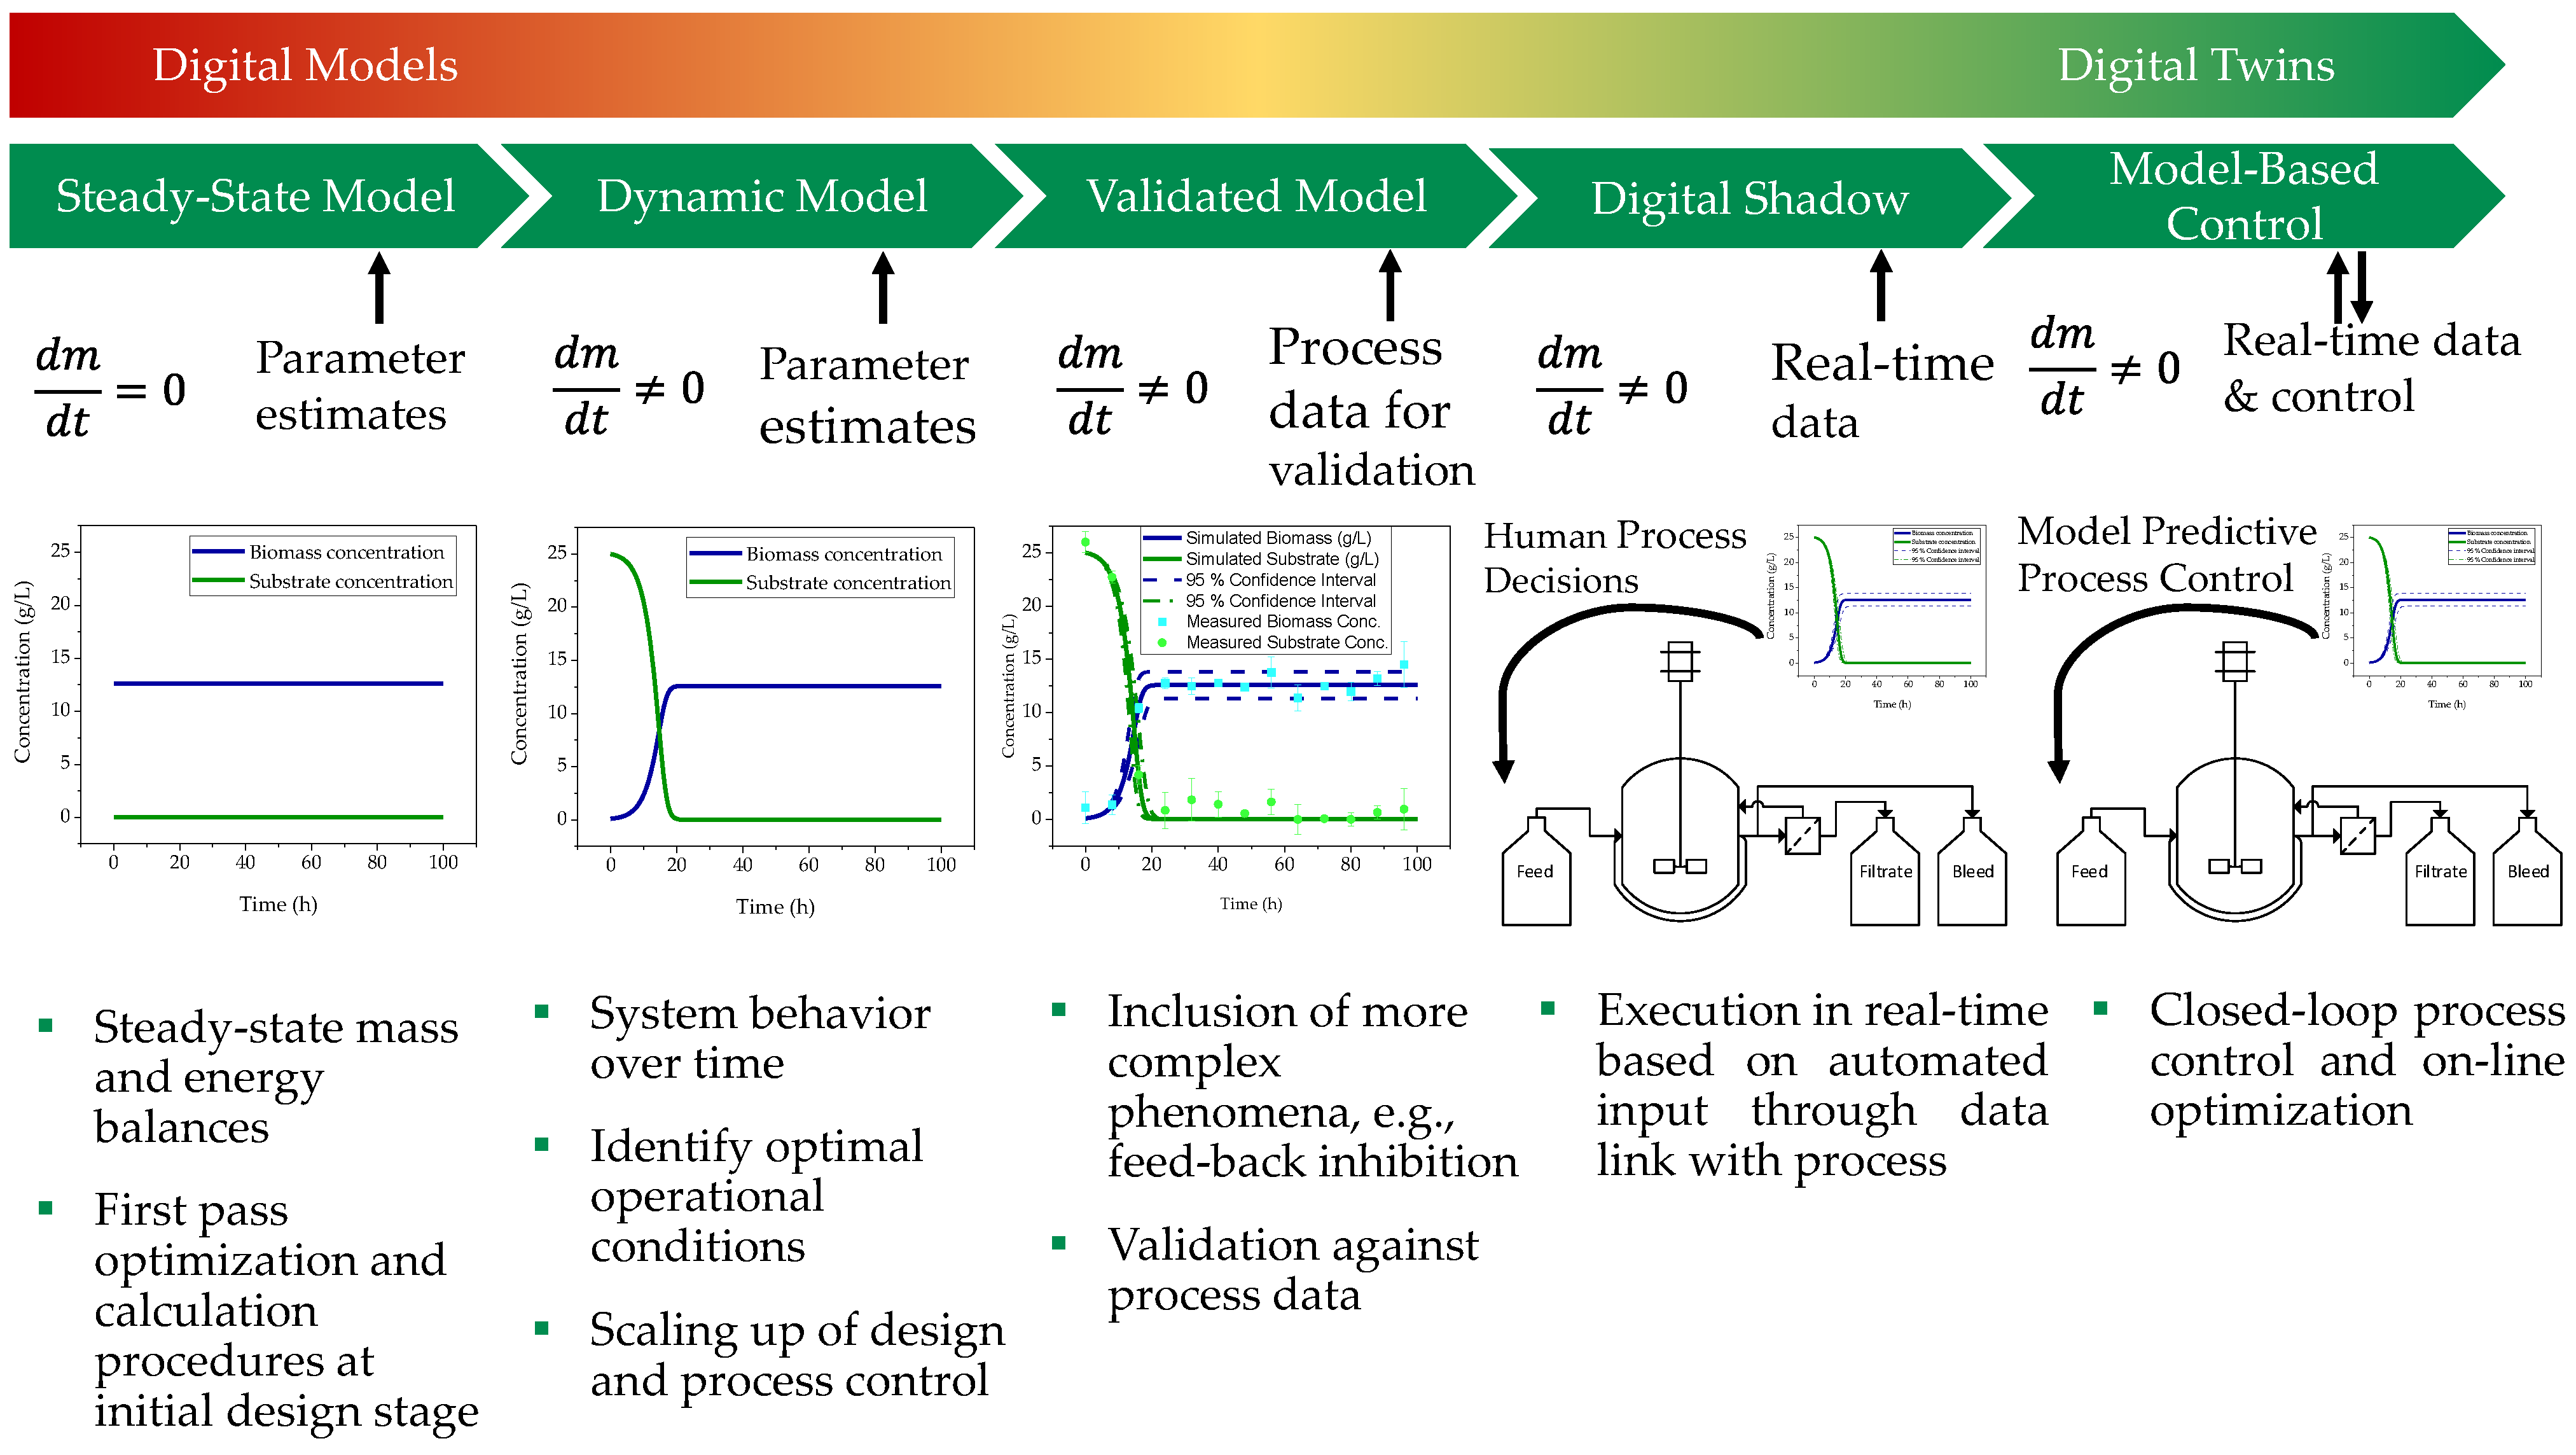
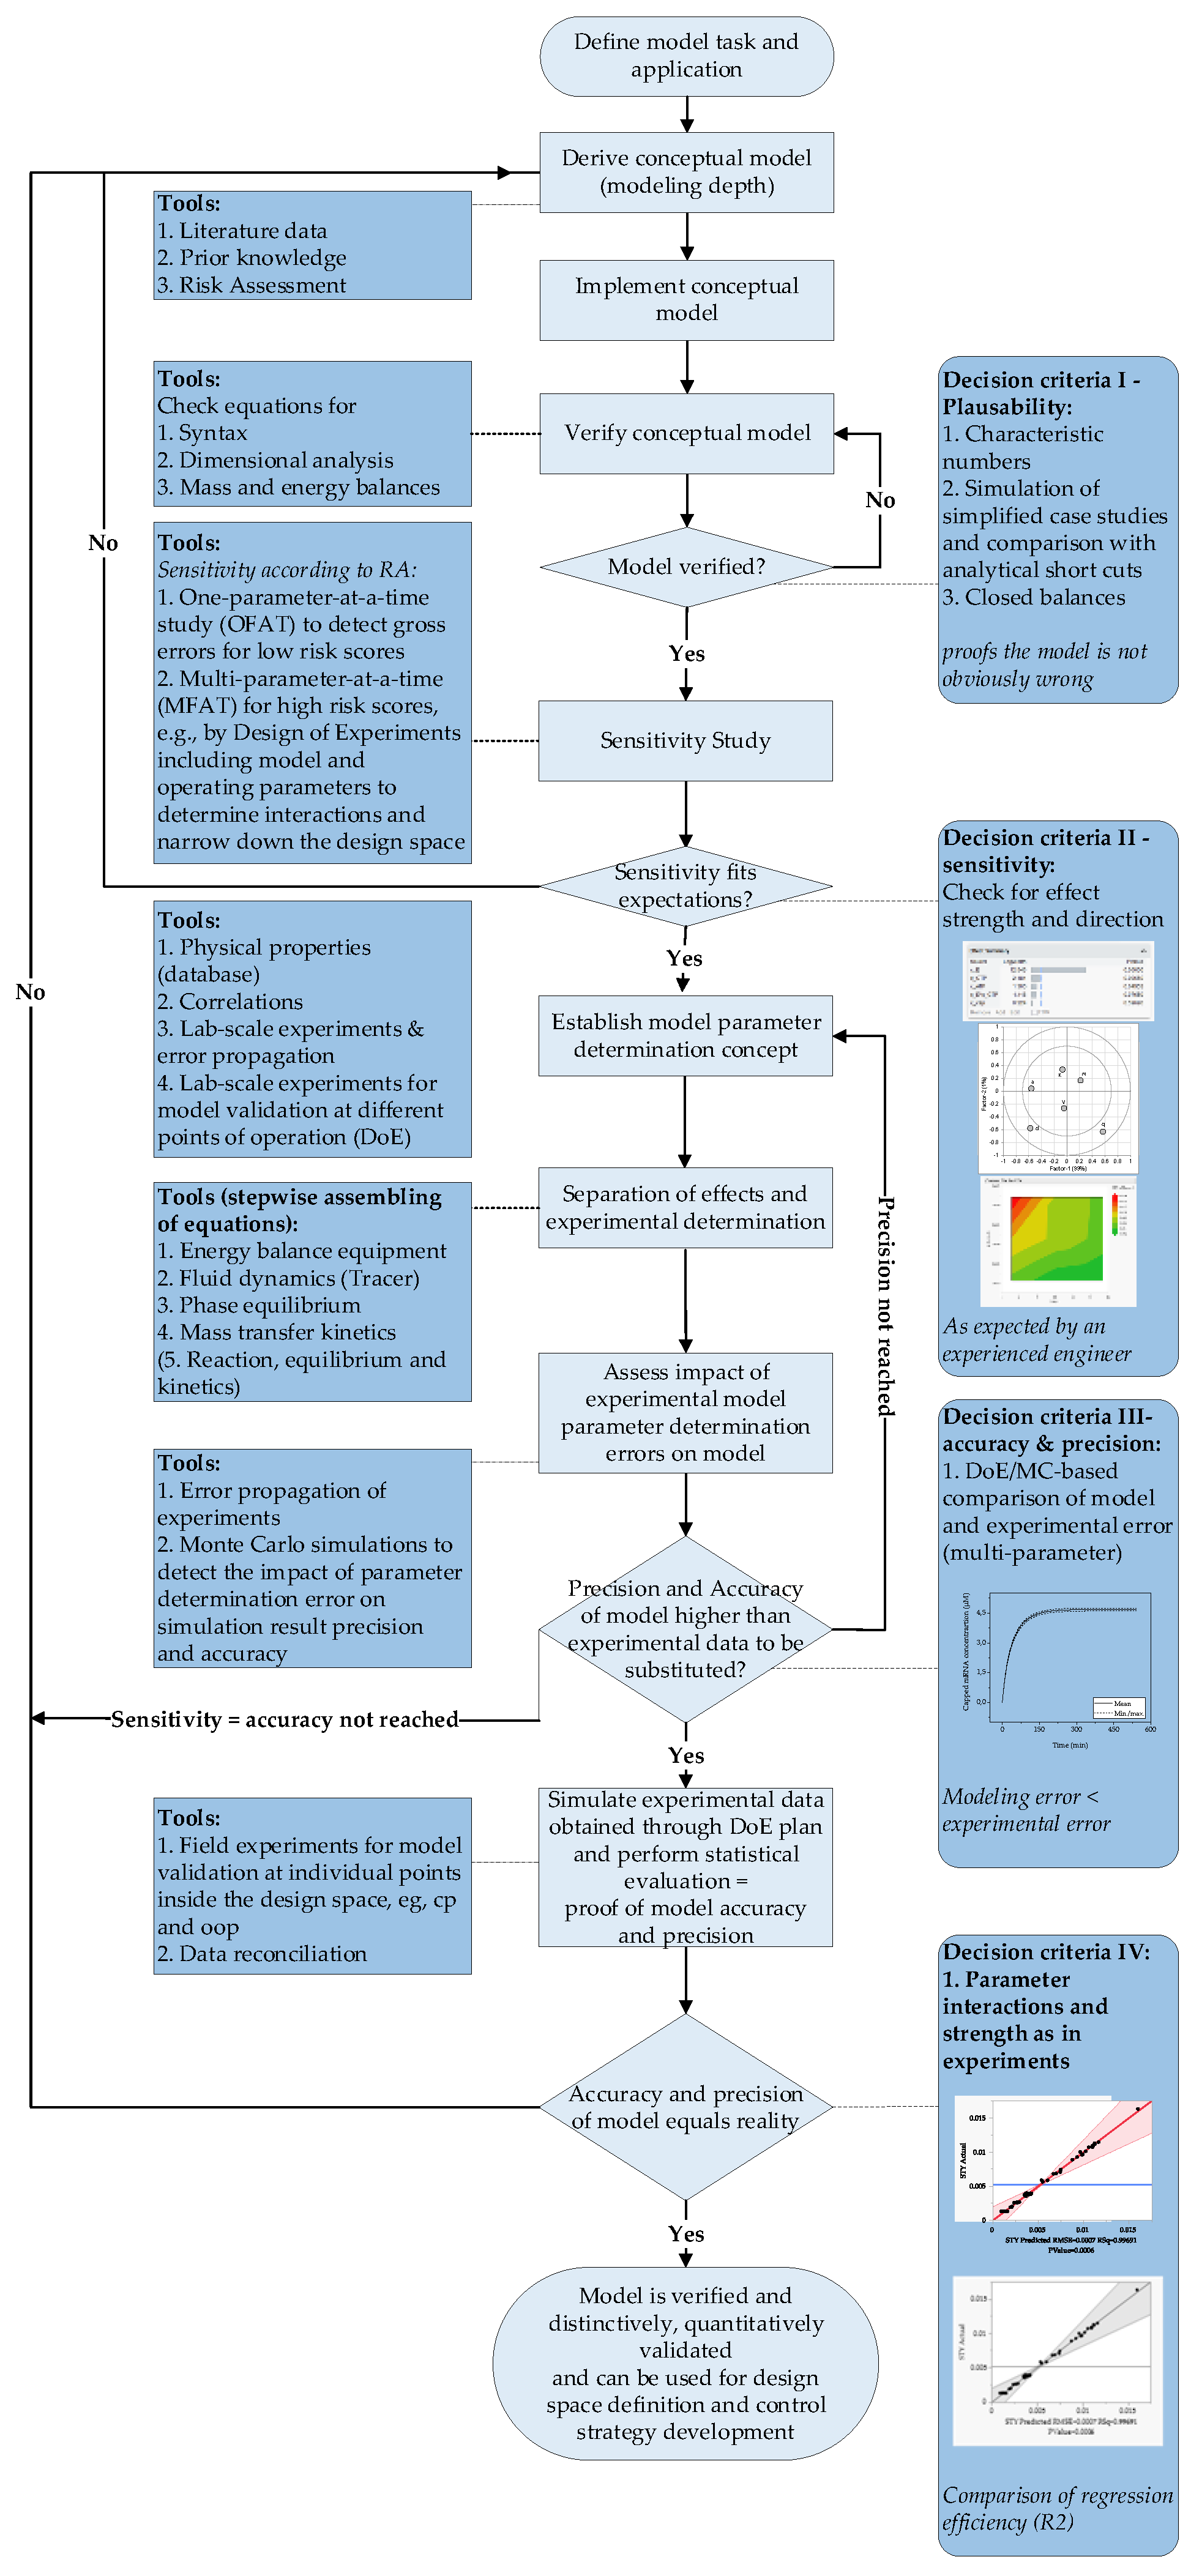
1.3. Model Validation
2. Materials and Methods
3. Modelling
3.1. Process Model
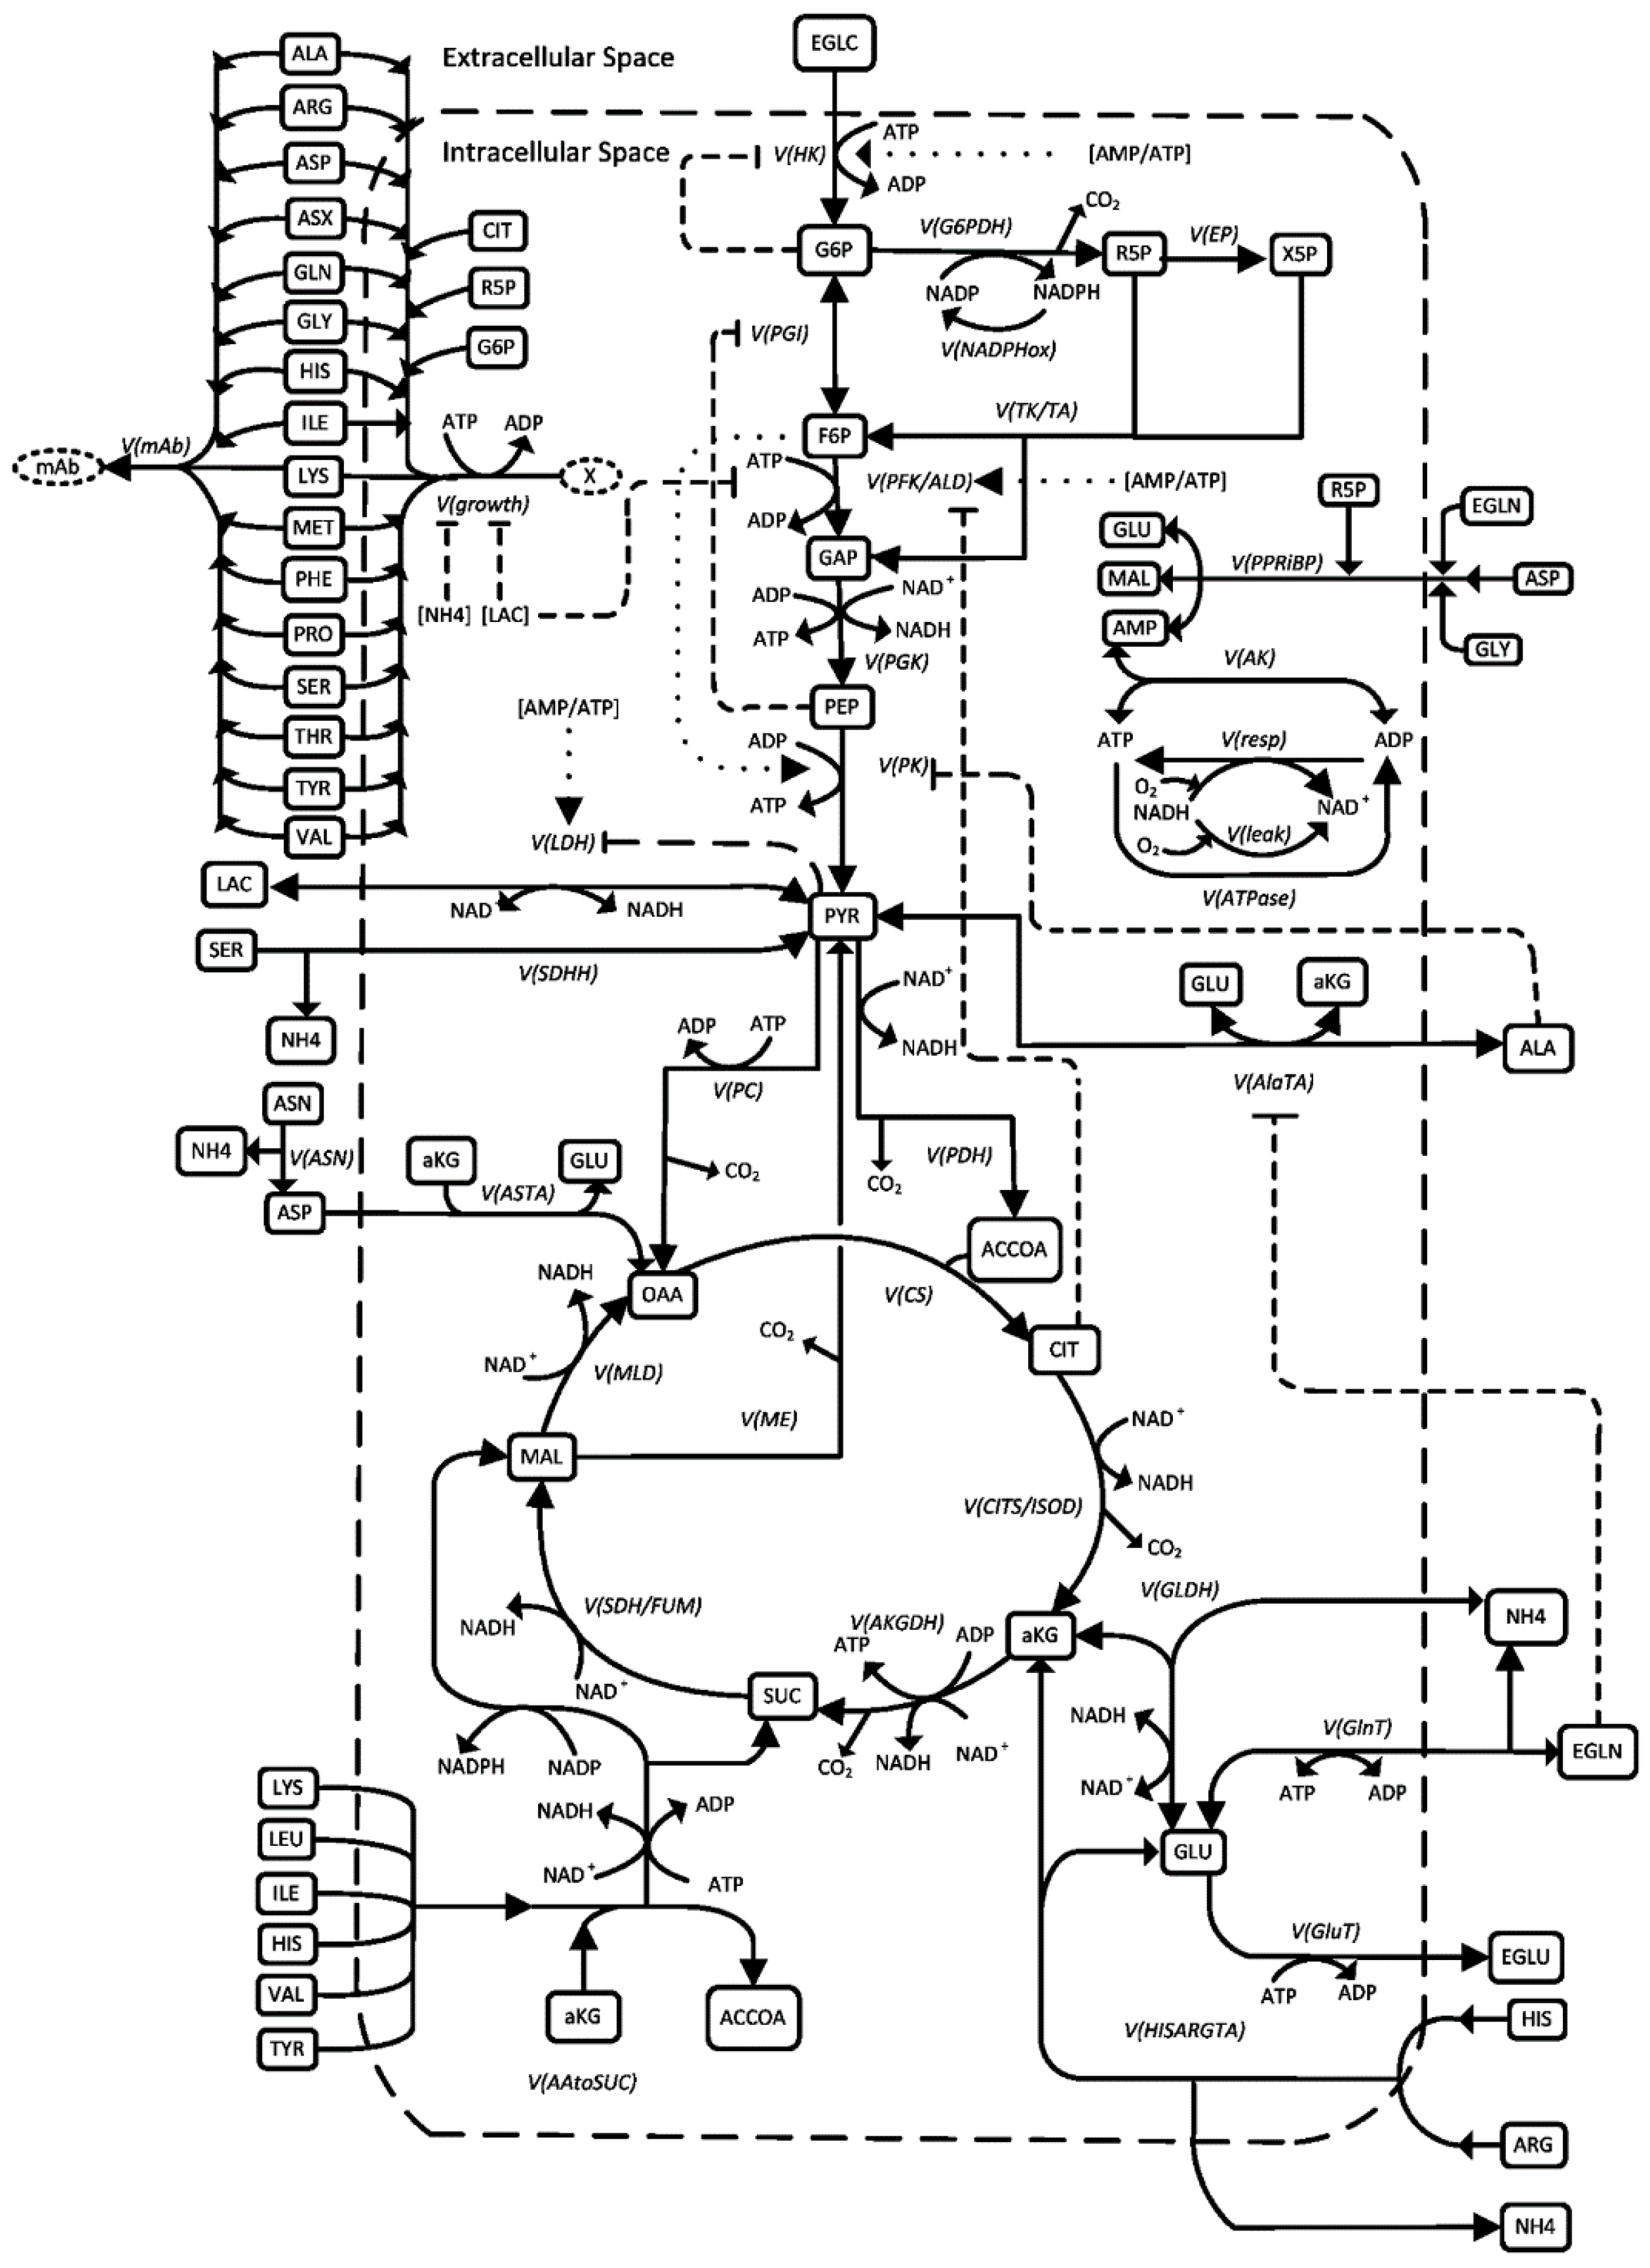
3.2. Modeling of the Intracellular Metabolism of HEK Cells
- SDHH was assumed to be reversible;
- Adjustment of the product formation mechanism;
- Stronger weighting of ammonium as an inhibitor of growth and inducer of cell death since the cells used tolerate high lactate concentrations relatively well;
- Adjustment of several parameter values as detailed in Table 1.
- Assumption of ideal mixing in the stirred tank reactor, i.e., homogeneous pH, temperature, and concentration profile of chemical species in the liquid phase. Moreover, the pH, pO₂, and temperature were assumed as constant;
- The model is an unsegregated, structured model. This means that an “average cell” was assumed to represent the entire cell population, and the phases of the cell cycle were not considered;
- Limited the number of metabolites, where possible, and reasonable reaction pathways were lumped by only considering the main reaction of interest in the pathway, representing a branch in a metabolic pathway, or that are taken up directly from the medium into the cell. This helps to reduce model complexity without sacrificing the predictive power of the metabolic model;
- Constant enzyme amounts: the maximum reaction rate of an enzyme-catalyzed reaction depends on the enzyme amount. The enzyme amount depends on the transcription and translation rates of the respective genes, which may be induced or inhibited by the substrate and product concentrations and other influencing variables. To fully elucidate such relationships, “omics” data are required, which were not available in the context of this work. Thus, constant enzyme amounts were assumed in this model;
- New cells and virus-like particles were assumed to be directly formed from precursors present in the cell (amino acids, citrate (representing lipids), and R5P (representing nucleotides);
- Components such as vitamins, trace elements, phospholipid precursors, growth factors, etc., were assumed to be present in sufficient amounts;
- The cell volume was assumed to be constant during the cultivation, i.e., the change in concentration of intracellular substrates due to changes in cell volume were not considered;
- The composition of the cells was assumed to be constant.
4. Model Parameter Determination
5. Model Validation
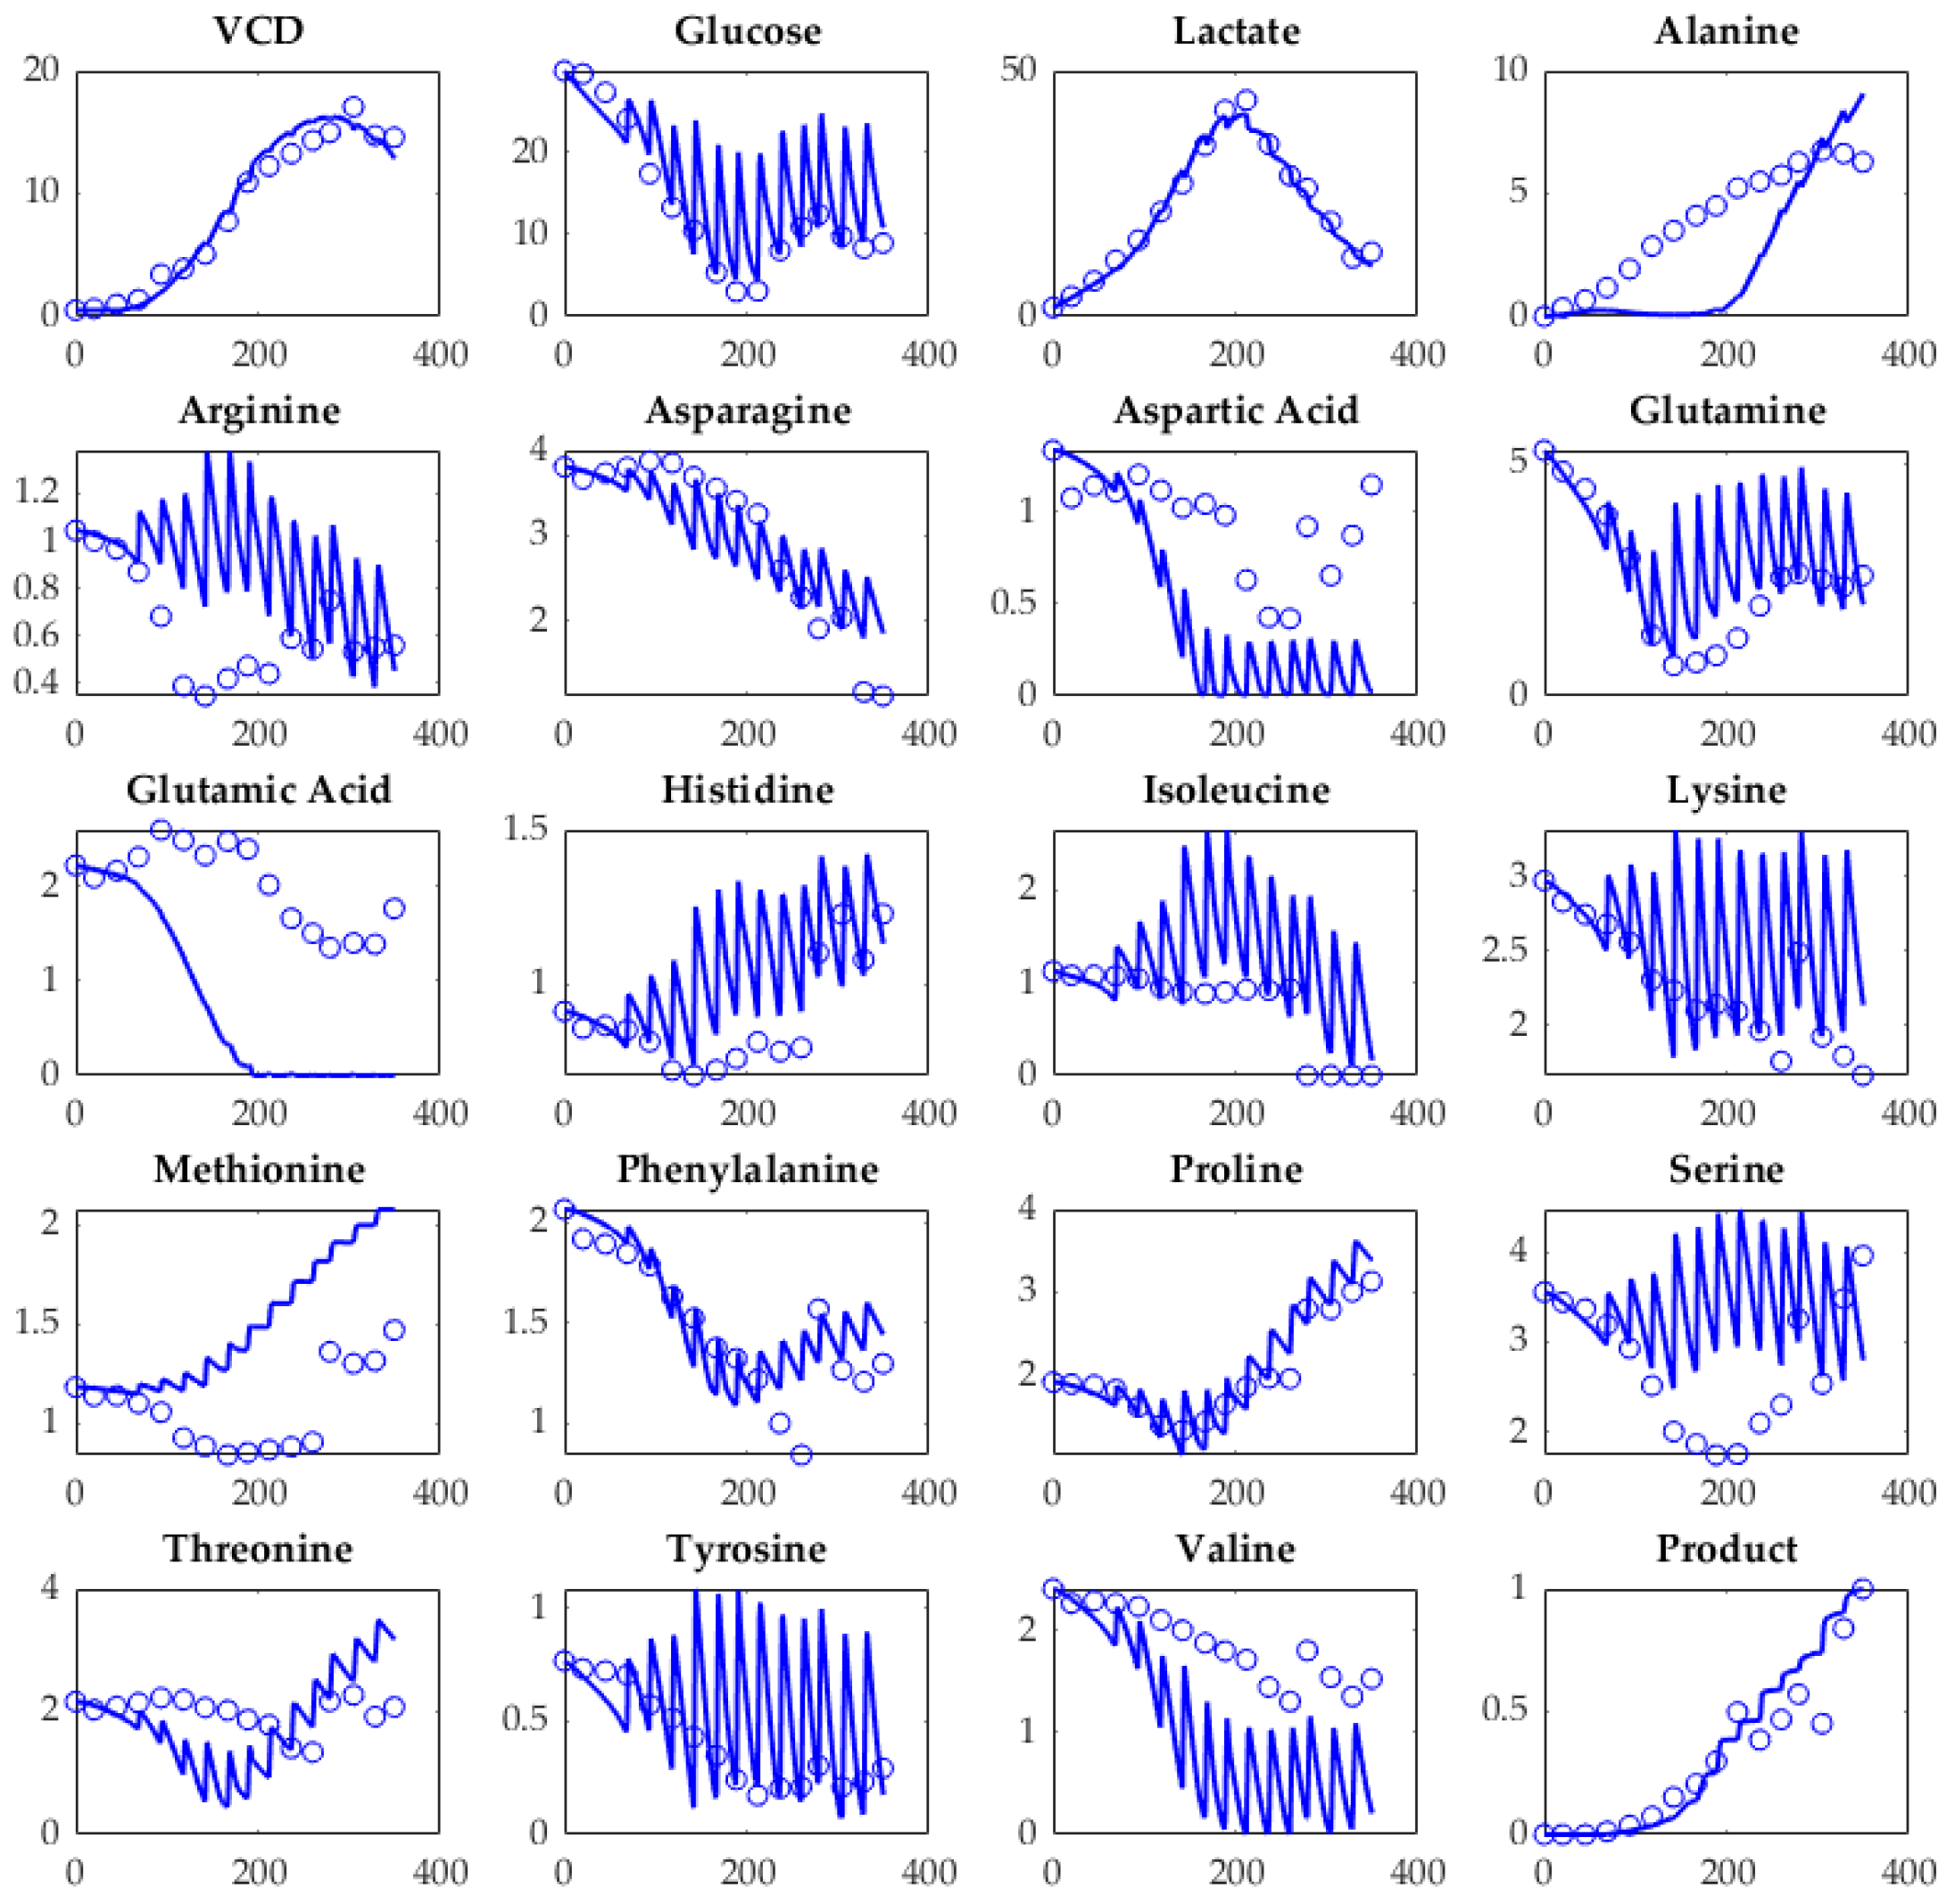
5.1. Model Verification
5.1.1. Plausibility
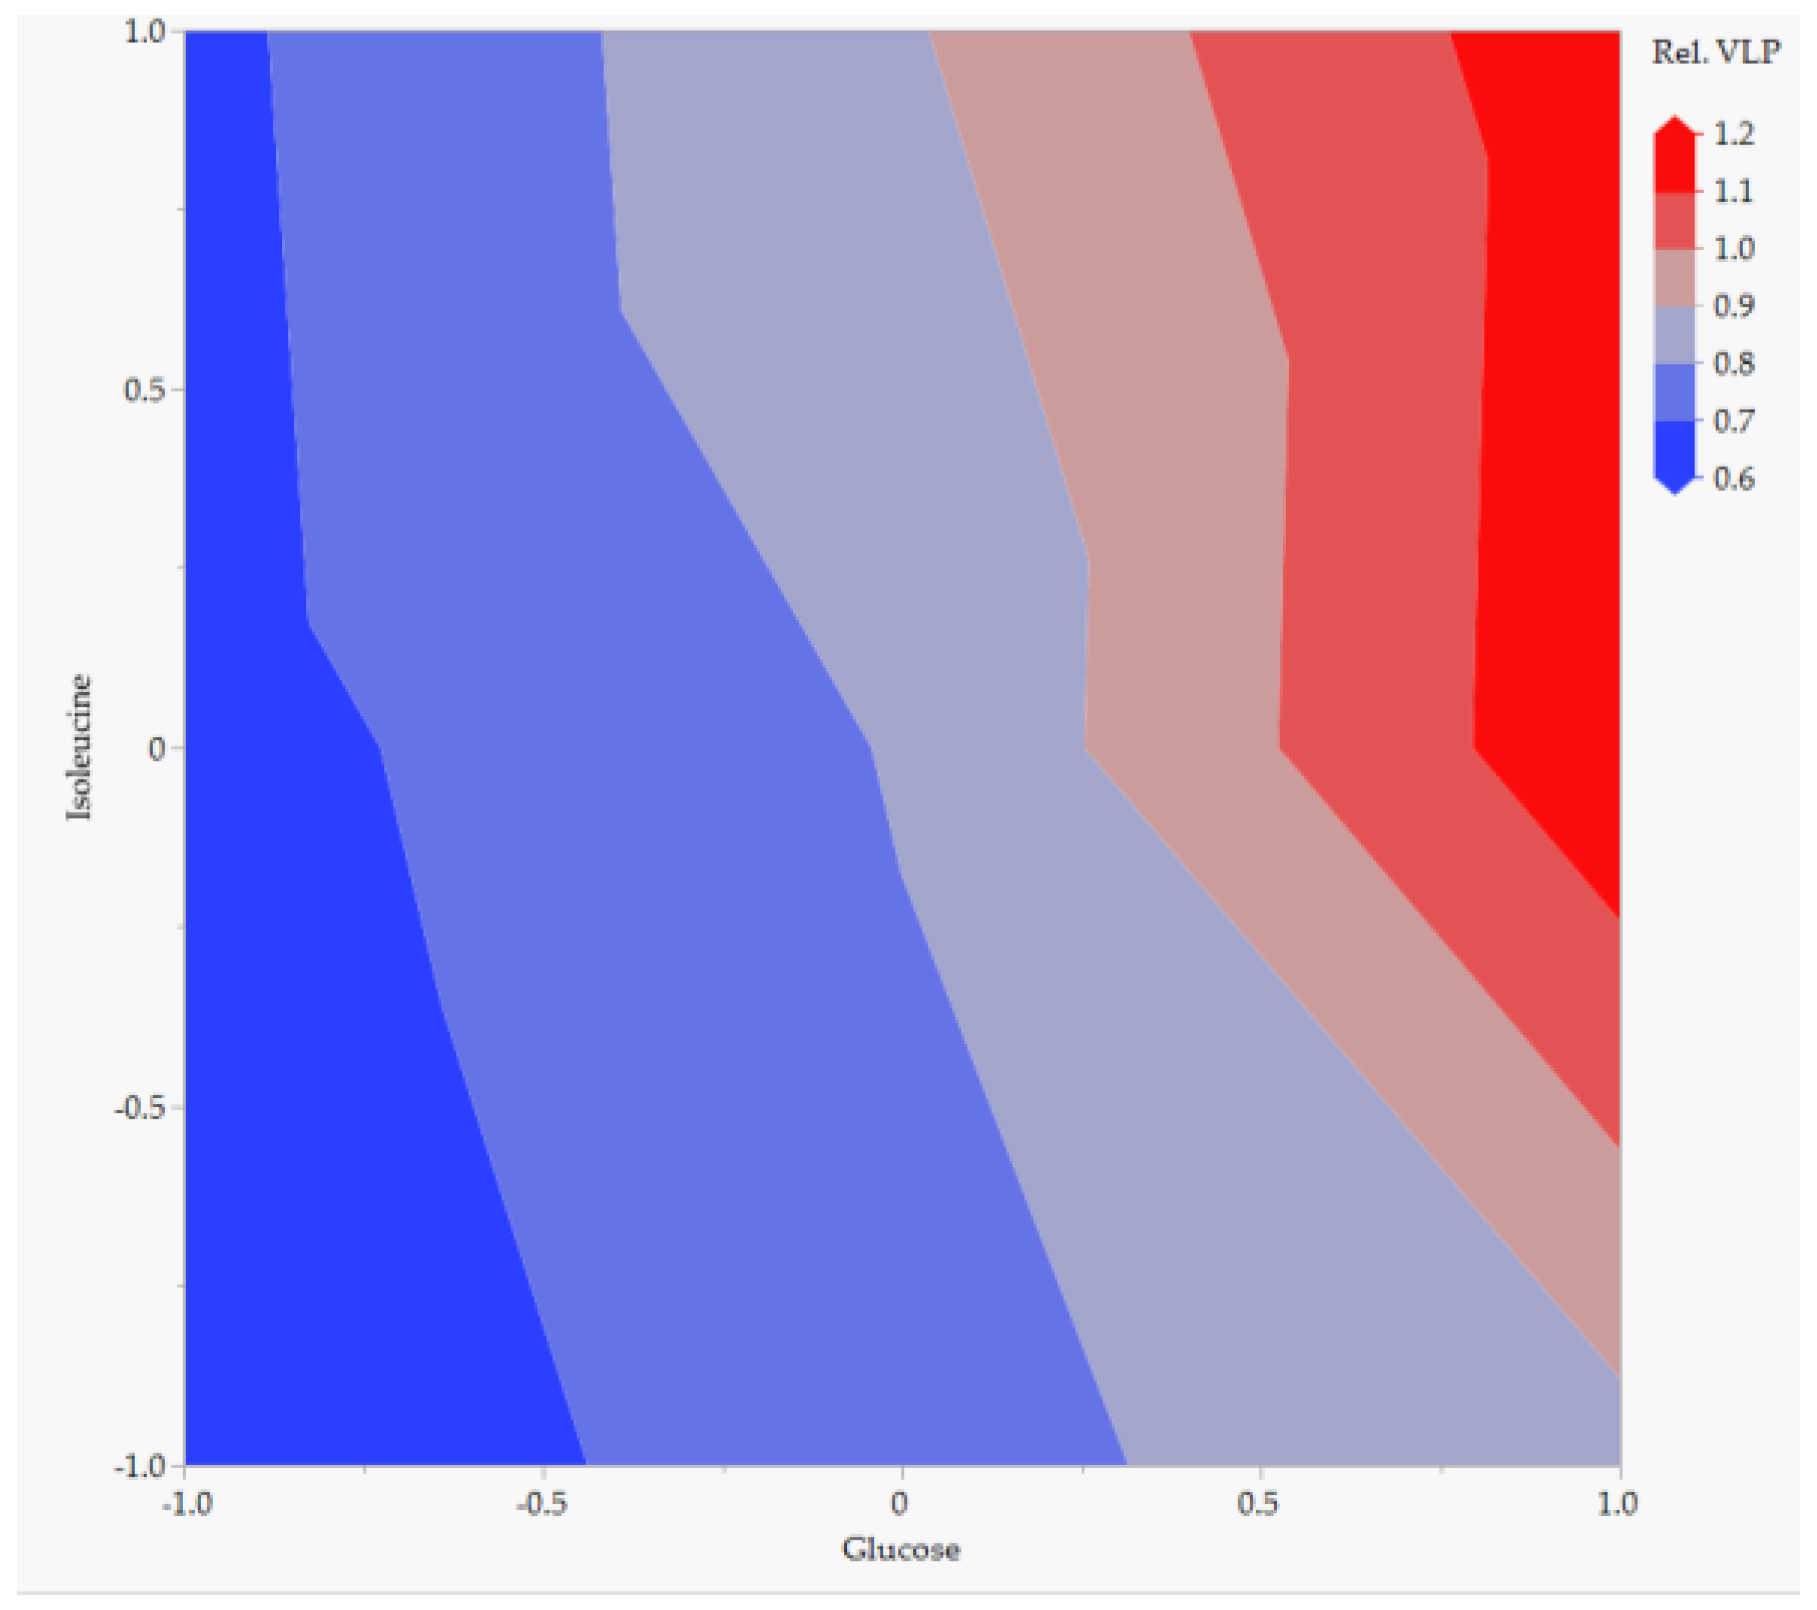
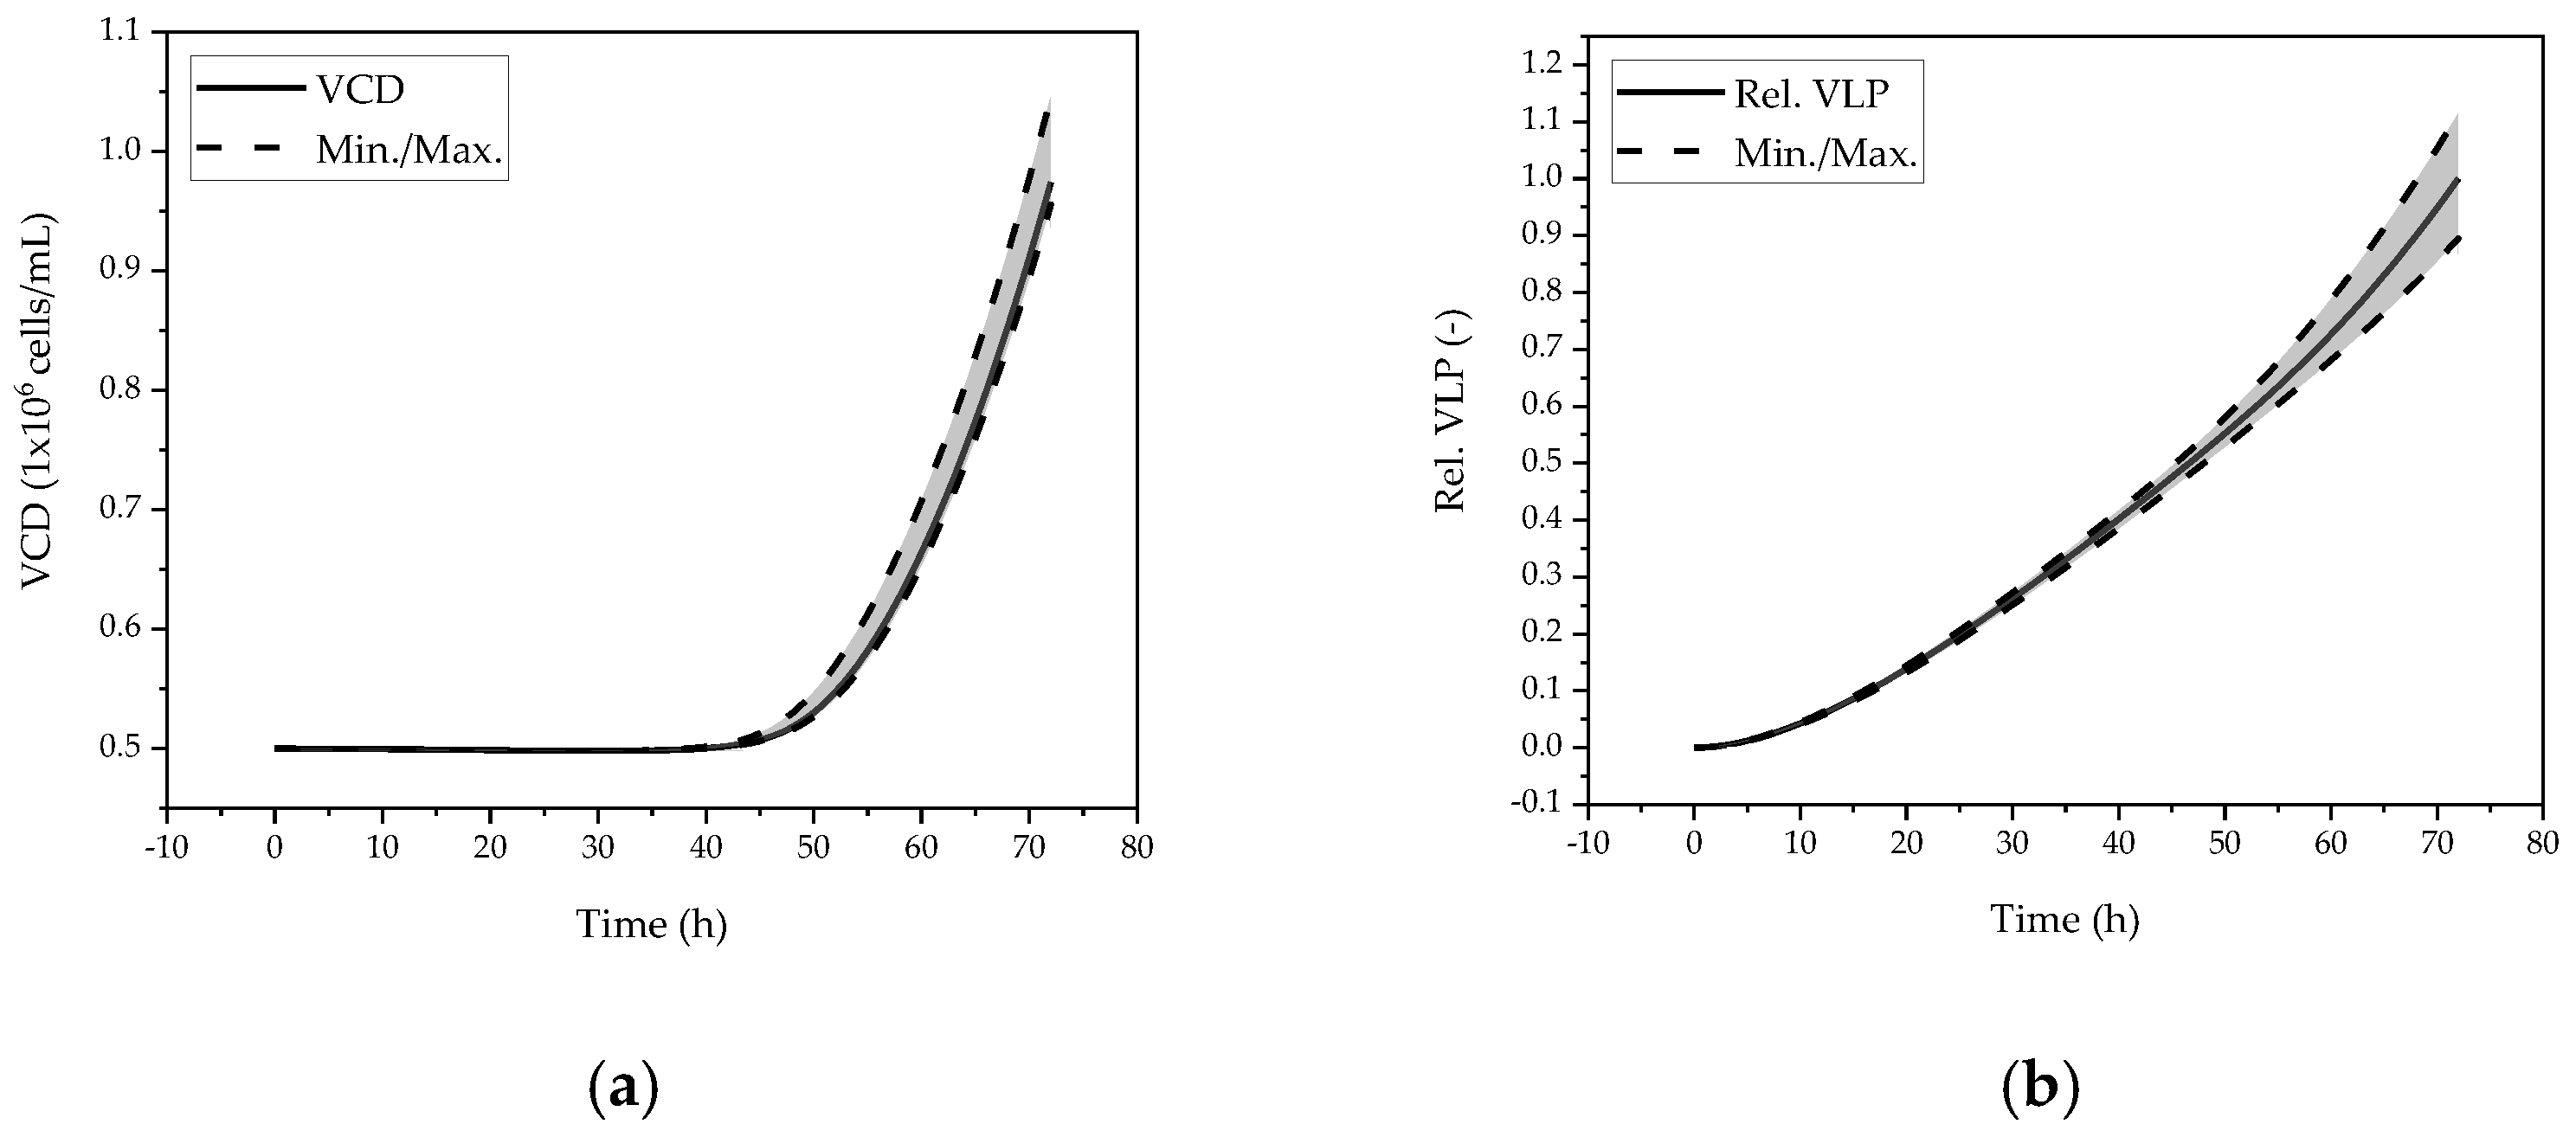
5.1.2. Sensitivity
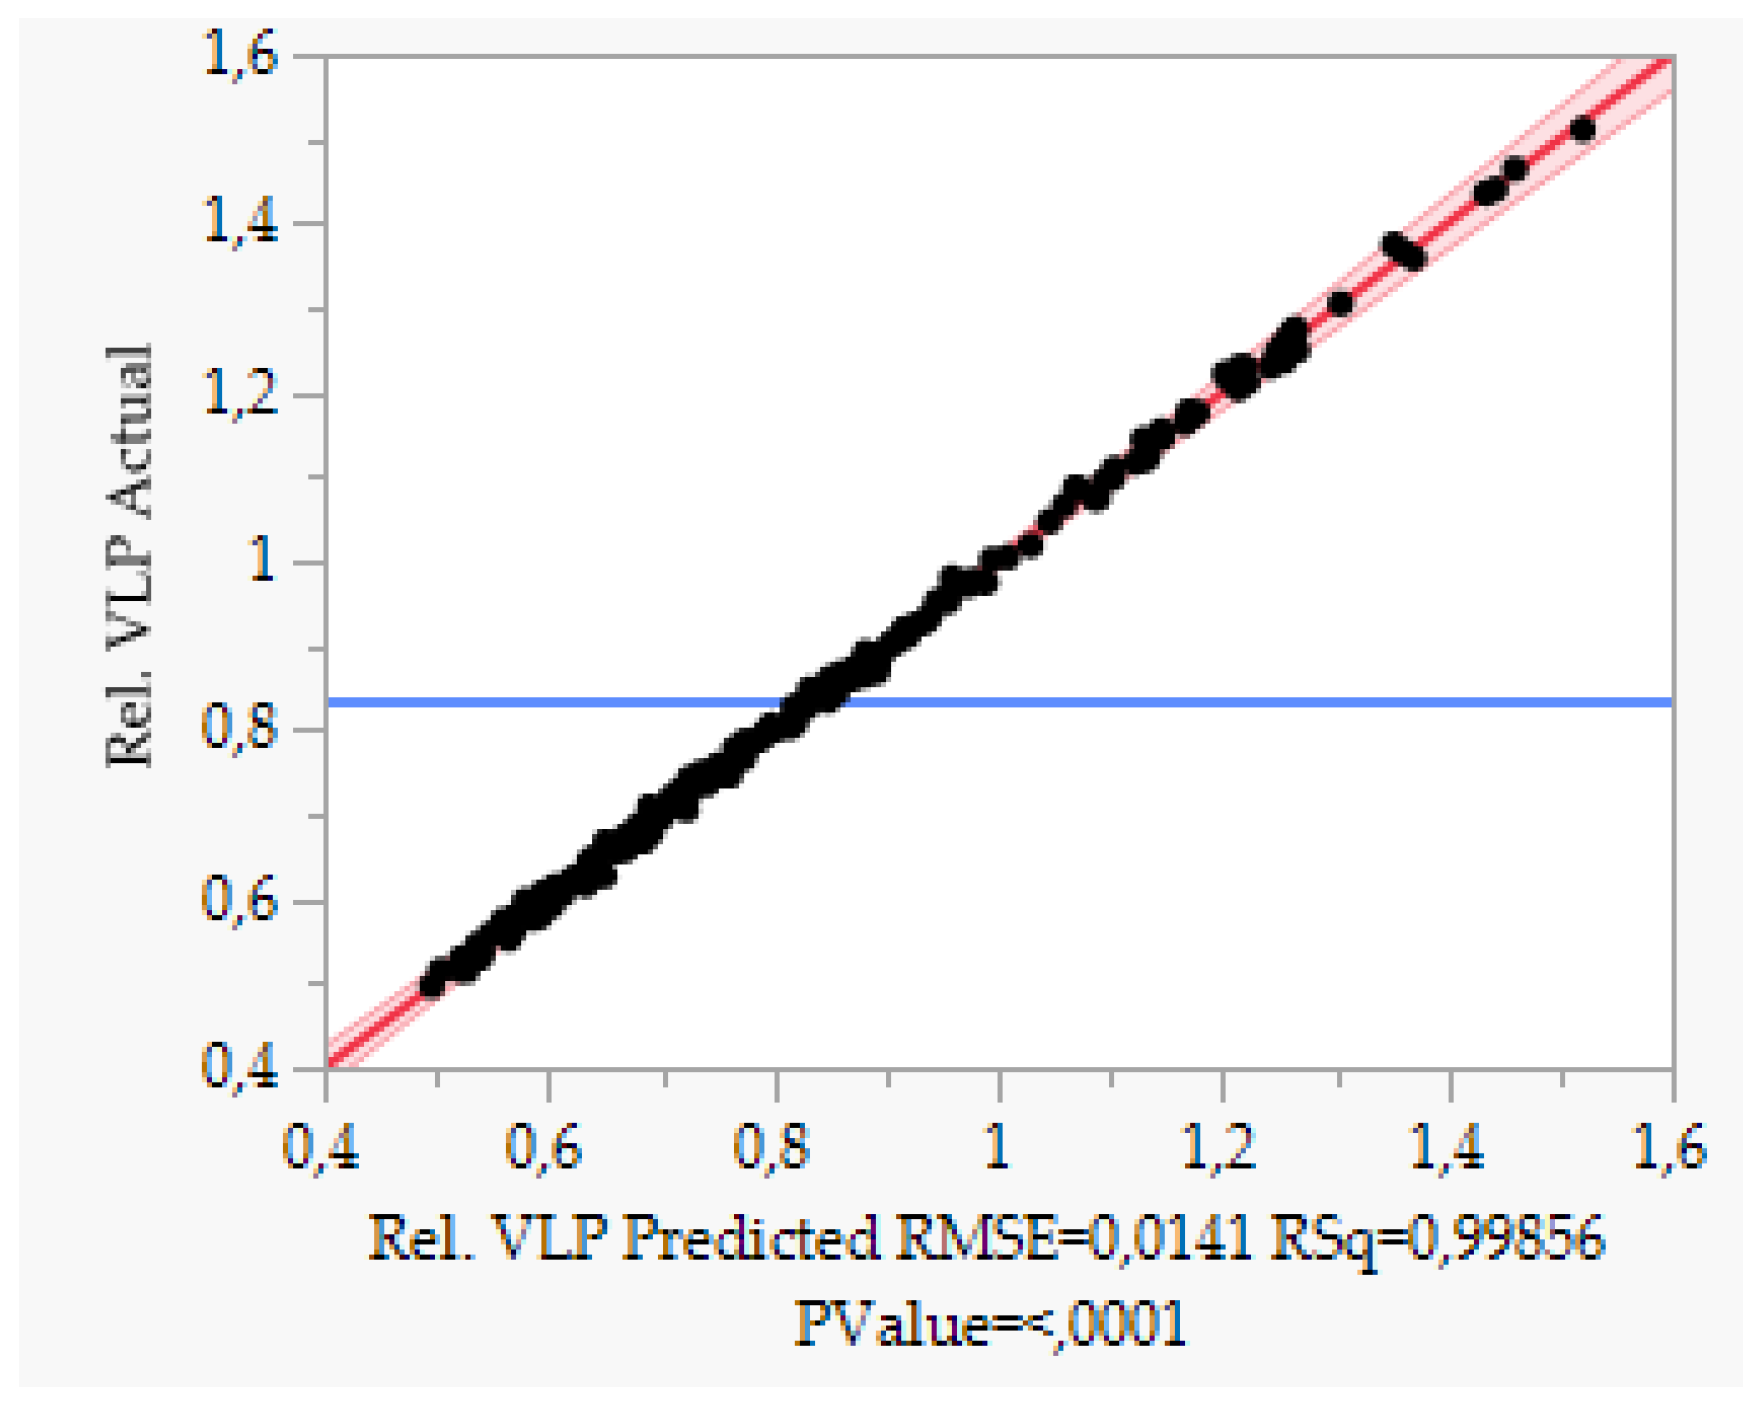
5.2. Accuracy and Precision
6. Discussion
Author Contributions
Funding
Institutional Review Board Statement
Informed Consent Statement
Data Availability Statement
Acknowledgments
Conflicts of Interest
References
- Hammonds, J.; Chen, X.; Zhang, X.; Lee, F.; Spearman, P. Advances in methods for the production, purification, and characterization of HIV-1 Gag-Env pseudovirion vaccines. Vaccine 2007, 25, 8036–8048. [Google Scholar] [CrossRef]
- Wang, H.; Wolock, T.M.; Carter, A.; Nguyen, G.; Kyu, H.H.; Gakidou, E.; Hay, S.I.; Mills, E.J.; Trickey, A.; Msemburi, W.; et al. Estimates of global, regional, and national incidence, prevalence, and mortality of HIV, 1980–2015: The Global Burden of Disease Study 2015. Lancet HIV 2016, 3, e361–e387. [Google Scholar] [CrossRef] [Green Version]
- Haynes, B.F.; Shaw, G.M.; Korber, B.; Kelsoe, G.; Sodroski, J.; Hahn, B.H.; Borrow, P.; McMichael, A.J. HIV-Host Interactions: Implications for Vaccine Design. Cell Host Microbe 2016, 19, 292–303. [Google Scholar] [CrossRef] [PubMed] [Green Version]
- Daniel, M.D.; Kirchhoff, F.; Czajak, S.C.; Sehgal, P.K.; Desrosiers, R.C. Protective effects of a live attenuated SIV vaccine with a deletion in the nef gene. Science 1992, 258, 1938–1941. [Google Scholar] [CrossRef] [PubMed] [Green Version]
- Lifson, J.D.; Rossio, J.L.; Piatak, M.; Parks, T.; Li, L.; Kiser, R.; Coalter, V.; Fisher, B.; Flynn, B.M.; Czajak, S.; et al. Role of CD8(+) lymphocytes in control of simian immunodeficiency virus infection and resistance to rechallenge after transient early antiretroviral treatment. J. Virol. 2001, 75, 10187–10199. [Google Scholar] [CrossRef] [Green Version]
- Williamson, A.-L.; Rybicki, E.P. Justification for the inclusion of Gag in HIV vaccine candidates. Expert Rev. Vaccines 2016, 15, 585–598. [Google Scholar] [CrossRef]
- Minor, P.D. Live attenuated vaccines: Historical successes and current challenges. Virology 2015, 479, 379–392. [Google Scholar] [CrossRef] [Green Version]
- Mohsen, M.O.; Zha, L.; Cabral-Miranda, G.; Bachmann, M.F. Major findings and recent advances in virus-like particle (VLP)-based vaccines. Semin. Immunol. 2017, 34, 123–132. [Google Scholar] [CrossRef]
- Deml, L.; Speth, C.; Dierich, M.P.; Wolf, H.; Wagner, R. Recombinant HIV-1 Pr55gag virus-like particles: Potent stimulators of innate and acquired immune responses. Mol. Immunol. 2005, 42, 259–277. [Google Scholar] [CrossRef]
- Roldão, A.; Mellado, M.C.M.; Castilho, L.R.; Carrondo, M.J.T.; Alves, P.M. Virus-like particles in vaccine development. Expert Rev. Vaccines 2010, 9, 1149–1176. [Google Scholar] [CrossRef]
- Cervera, L.; Gòdia, F.; Tarrés-Freixas, F.; Aguilar-Gurrieri, C.; Carrillo, J.; Blanco, J.; Gutiérrez-Granados, S. Production of HIV-1-based virus-like particles for vaccination: Achievements and limits. Appl. Microbiol. Biotechnol. 2019, 103, 7367–7384. [Google Scholar] [CrossRef] [PubMed]
- Ludwig, C.; Wagner, R. Virus-like particles-universal molecular toolboxes. Curr. Opin. Biotechnol. 2007, 18, 537–545. [Google Scholar] [CrossRef] [PubMed]
- Kirnbauer, R.; Taub, J.; Greenstone, H.; Roden, R.; Dürst, M.; Gissmann, L.; Lowy, D.R.; Schiller, J.T. Efficient self-assembly of human papillomavirus type 16 L1 and L1-L2 into virus-like particles. J. Virol. 1993, 67, 6929–6936. [Google Scholar] [CrossRef] [PubMed] [Green Version]
- Andersson, A.-M.C.; Schwerdtfeger, M.; Holst, P.J. Virus-Like-Vaccines against HIV. Vaccines 2018, 6, 10. [Google Scholar] [CrossRef] [PubMed] [Green Version]
- Chhatre, S.; Farid, S.S.; Coffman, J.; Bird, P.; Newcombe, A.R.; Titchener-Hooker, N.J. How implementation of Quality by Design and advances in Biochemical Engineering are enabling efficient bioprocess development and manufacture. J. Chem. Technol. Biotechnol. 2011, 86, 1125–1129. [Google Scholar] [CrossRef]
- Schmidt, A.; Strube, J. Distinct and Quantitative Validation Method for Predictive Process Modeling with Examples of Liquid-Liquid Extraction Processes of Complex Feed Mixtures. Processes 2019, 7, 298. [Google Scholar] [CrossRef] [Green Version]
- Kornecki, M.; Strube, J. Accelerating Biologics Manufacturing by Upstream Process Modelling. Processes 2019, 7, 166. [Google Scholar] [CrossRef] [Green Version]
- Kornecki, M.; Schmidt, A.; Lohmann, L.; Huter, M.; Mestmäcker, F.; Klepzig, L.; Mouellef, M.; Zobel-Roos, S.; Strube, J. Accelerating Biomanufacturing by Modeling of Continuous Bioprocessing—Piloting Case Study of Monoclonal Antibody Manufacturing. Processes 2019, 7, 495. [Google Scholar] [CrossRef] [Green Version]
- Helgers, H.; Hengelbrock, A.; Schmidt, A.; Rosengarten, J.; Stitz, J.; Strube, J. Process Design and Optimization towards Digital Twins for HIV-Gag VLP Production in HEK293 Cells, including Purification. Processes 2022, 10, 419. [Google Scholar] [CrossRef]
- Beg, S.; Hasnain, M.S.; Rahman, M.; Swain, S. Introduction to Quality by Design (QbD): Fundamentals, principles, and applications. In Pharmaceutical Quality by Design; Elsevier: Amsterdam, The Netherlands, 2019; pp. 1–17. ISBN 9780128157992. [Google Scholar]
- ICH Expert Working Group. Pharmaceuticel Development Q8(R2): ICH Harmonised Tripartite Guideline; ICH Expert Working Group: Geneva, Switzerland, 2009. [Google Scholar]
- ICH Expert Working Group. Riskmanagement (Q9): ICH Harmonised Tripartite Guideline; ICH Expert Working Group: Geneva, Switzerland, 2005. [Google Scholar]
- ICH Expert Working Group. Pharmaceutical Quality System (Q10): ICH Harmonised Tripartite Guideline; ICH Expert Working Group: Geneva, Switzerland, 2008. [Google Scholar]
- ICH. Q11 Step 5 Development and manufacture of drug substances. In ICH Quality Guidelines: An Implementation Guide; Teasdale, A., Elder, D., Nims, R.W., Eds.; Wiley: Hoboken, NJ, USA, 2017; pp. 639–665. [Google Scholar]
- European Medicines Agency. Q12 Step 5 Technical and Regulatory Considerations for Pharmaceutical Product Lifecycle Management; European Medicines Agency: Amsterdam, The Netherlands, 2017. [Google Scholar]
- Aksu, B.; Yeğen, G. Global regulatory perspectives on quality by design in pharma manufacturing. In Pharmaceutical Quality by Design; Elsevier: Amsterdam, The Netherlands, 2019; pp. 19–41. ISBN 9780128157992. [Google Scholar]
- Rajamanickam, V.; Babel, H.; Montano-Herrera, L.; Ehsani, A.; Stiefel, F.; Haider, S.; Presser, B.; Knapp, B. About Model Validation in Bioprocessing. Processes 2021, 9, 961. [Google Scholar] [CrossRef]
- Alt, N.; Zhang, T.Y.; Motchnik, P.; Taticek, R.; Quarmby, V.; Schlothauer, T.; Beck, H.; Emrich, T.; Harris, R.J. Determination of critical quality attributes for monoclonal antibodies using quality by design principles. Biologicals 2016, 44, 291–305. [Google Scholar] [CrossRef] [PubMed]
- CMC-Vaccines Working Group. A-VAX: Applying Quality by Design to Vaccines; Parental Drug Association: Bethesda, MD, USA, 2012. [Google Scholar]
- CMC Biotech Working Group. A-Mab: A Case Study in Bioprocess Development; CASSS, International Separation Science Society: Emeryville, CA, USA, 2009. [Google Scholar]
- Yu, L.X.; Amidon, G.; Khan, M.A.; Hoag, S.W.; Polli, J.; Raju, G.K.; Woodcock, J. Understanding pharmaceutical quality by design. AAPS J. 2014, 16, 771–783. [Google Scholar] [CrossRef] [PubMed] [Green Version]
- Cogdill, R.P.; Drennen, J.K. Risk-based Quality by Design (QbD): A Taguchi Perspective on the Assessment of Product Quality, and the Quantitative Linkage of Drug Product Parameters and Clinical Performance. J. Pharm. Innov. 2008, 3, 23–29. [Google Scholar] [CrossRef]
- Beg, S.; Swain, S.; Rahman, M.; Hasnain, M.S.; Imam, S.S. Application of Design of Experiments (DoE) in pharmaceutical product and process optimization. In Pharmaceutical Quality by Design; Beg, S., Hasnain, M.S., Eds.; Elsevier: Amsterdam, The Netherlands, 2019; pp. 43–64. ISBN 9780128157992. [Google Scholar]
- Schmidt, A.; Helgers, H.; Lohmann, L.J.; Vetter, F.; Juckers, A.; Mouellef, M.; Zobel-Roos, S.; Strube, J. Process analytical technology as key-enabler for digital twins in continuous biomanufacturing. J. Chem. Technol. Biotechnol. 2022, 97, 2336–2346. [Google Scholar] [CrossRef]
- Helgers, H.; Schmidt, A.; Lohmann, L.J.; Vetter, F.L.; Juckers, A.; Jensch, C.; Mouellef, M.; Zobel-Roos, S.; Strube, J. Towards Autonomous Operation by Advanced Process Control—Process Analytical Technology for Continuous Biologics Antibody Manufacturing. Processes 2021, 9, 172. [Google Scholar] [CrossRef]
- Nayak, A.K.; Ahmed, S.A.; Beg, S.; Tabish, M.; Hasnain, M.S. Application of quality by design for the development of biopharmaceuticals. In Pharmaceutical Quality by Design; Elsevier: Amsterdam, The Netherlands, 2019; pp. 399–411. ISBN 9780128157992. [Google Scholar]
- Hengelbrock, A.; Helgers, H.; Schmidt, A.; Vetter, F.L.; Juckers, A.; Rosengarten, J.F.; Stitz, J.; Strube, J. Digital Twin for HIV-Gag VLP Production in HEK293 Cells. Processes 2022, 10, 866. [Google Scholar] [CrossRef]
- Udugama, I.A.; Lopez, P.C.; Gargalo, C.L.; Li, X.; Bayer, C.; Gernaey, K.V. Digital Twin in biomanufacturing: Challenges and opportunities towards its implementation. Syst. Microbiol. Biomanuf. 2021, 1, 257–274. [Google Scholar] [CrossRef]
- Helgers, H.; Hengelbrock, A.; Schmidt, A.; Strube, J. Digital Twins for Continuous mRNA Production. Processes 2021, 9, 1967. [Google Scholar] [CrossRef]
- Sixt, M.; Uhlenbrock, L.; Strube, J. Toward a Distinct and Quantitative Validation Method for Predictive Process Modelling—On the Example of Solid-Liquid Extraction Processes of Complex Plant Extracts. Processes 2018, 6, 66. [Google Scholar] [CrossRef] [Green Version]
- Zobel-Roos, S.; Schmidt, A.; Mestmäcker, F.; Mouellef, M.; Huter, M.; Uhlenbrock, L.; Kornecki, M.; Lohmann, L.; Ditz, R.; Strube, J. Accelerating Biologics Manufacturing by Modeling or: Is Approval under the QbD and PAT Approaches Demanded by Authorities Acceptable Without a Digital-Twin? Processes 2019, 7, 94. [Google Scholar] [CrossRef]
- Helgers, H.; Schmidt, A.; Strube, J. Towards Autonomous Process Control—Digital Twin for CHO Cell-Based Antibody Manufacturing Using a Dynamic Metabolic Model. Processes 2022, 10, 316. [Google Scholar] [CrossRef]
- Sheikh, K.; Förster, J.; Nielsen, L.K. Modeling hybridoma cell metabolism using a generic genome-scale metabolic model of Mus musculus. Biotechnol. Prog. 2005, 21, 112–121. [Google Scholar] [CrossRef] [PubMed]
- Nolan, R.P.; Lee, K. Dynamic model of CHO cell metabolism. Metab. Eng. 2011, 13, 108–124. [Google Scholar] [CrossRef] [PubMed]
- Robitaille, J.; Chen, J.; Jolicoeur, M. A Single Dynamic Metabolic Model Can Describe mAb Producing CHO Cell Batch and Fed-Batch Cultures on Different Culture Media. PLoS ONE 2015, 10, e0136815. [Google Scholar] [CrossRef]
- Huter, M.J. Modellunterstützte Prozessauslegung Unterschiedlicher Grundoperationen am Beispiel von kontinuierlicher Ultrafiltration und Absatzweiser Kristallisation. Available online: https://dokumente.ub.tu-clausthal.de/servlets/mcrfilenodeservlet/clausthal_derivate_00001426/db114668.pdf (accessed on 16 August 2022).
- Helgers, H.; Hengelbrock, A.; Schmidt, A.; Vetter, F.L.; Juckers, A.; Strube, J. Digital Twins for scFv Production in Escherichia coli. Processes 2022, 10, 809. [Google Scholar] [CrossRef]
- Rosengarten, J.F.; Schatz, S.; Wolf, T.; Barbe, S.; Stitz, J. Components of a HIV-1 vaccine mediate virus-like particle (VLP)-formation and display of envelope proteins exposing broadly neutralizing epitopes. Virology 2022, 568, 41–48. [Google Scholar] [CrossRef]
- Kornecki, M.; Schmidt, A.; Strube, J. PAT as key-enabling technology for QbD in pharmaceutical manufacturing A conceptual review on upstream and downstream processing. Chim. Oggi 2018, 36, 44–48. [Google Scholar]
- Santos, R.M.; Kessler, J.-M.; Salou, P.; Menezes, J.C.; Peinado, A. Monitoring mAb cultivations with in-situ raman spectroscopy: The influence of spectral selectivity on calibration models and industrial use as reliable PAT tool. Biotechnol. Prog. 2018, 34, 659–670. [Google Scholar] [CrossRef]
- Abu-Absi, N.R.; Kenty, B.M.; Cuellar, M.E.; Borys, M.C.; Sakhamuri, S.; Strachan, D.J.; Hausladen, M.C.; Li, Z.J. Real time monitoring of multiple parameters in mammalian cell culture bioreactors using an in-line Raman spectroscopy probe. Biotechnol. Bioeng. 2011, 108, 1215–1221. [Google Scholar] [CrossRef] [PubMed]
- Pereira Aguilar, P.; González-Domínguez, I.; Schneider, T.A.; Gòdia, F.; Cervera, L.; Jungbauer, A. At-line multi-angle light scattering detector for faster process development in enveloped virus-like particle purification. J. Sep. Sci. 2019, 42, 2640–2649. [Google Scholar] [CrossRef] [PubMed]
- Berry, B.; Moretto, J.; Matthews, T.; Smelko, J.; Wiltberger, K. Cross-scale predictive modeling of CHO cell culture growth and metabolites using Raman spectroscopy and multivariate analysis. Biotechnol. Prog. 2015, 31, 566–577. [Google Scholar] [CrossRef] [PubMed]
- Biechele, P.; Busse, C.; Solle, D.; Scheper, T.; Reardon, K. Sensor systems for bioprocess monitoring. Eng. Life Sci. 2015, 15, 469–488. [Google Scholar] [CrossRef]
- Kornecki, M.; Strube, J. Process Analytical Technology for Advanced Process Control in Biologics Manufacturing with the Aid of Macroscopic Kinetic Modeling. Bioengineering 2018, 5, 25. [Google Scholar] [CrossRef] [PubMed]


| Parameter. | Value | Unit |
|---|---|---|
| 3.38 × 10⁵ | mM | |
| 1.20 × 10² | mM 10−6 cells | |
| 3.40 × 10⁻³ | mM 10−6 cells | |
| 8.35 × 10⁻⁵ | mM 10−6 cells | |
| 2.43 × 10⁻⁴ | - | |
| 2.20 | - | |
| 4.61 × 10⁻⁴ | mM 10−6 cells h−1 | |
| 1.43 × 10⁻⁷ | mM 10−6 cells h−1 | |
| 2.17 × 10⁻⁴ | mM 10−6 cells h−1 | |
| 2.4 × 10⁻⁵ | mM 10−6 cells h−1 | |
| 5.03 × 10⁻⁵ | mM 10−6 cells h−1 | |
| 5.15 × 10⁻⁴ | mM 10−6 cells h−1 | |
| 7.92 × 10⁻⁶ | mM 10−6 cells h−1 | |
| 2.63 × 10⁻⁴ | mM 10−6 cells h−1 | |
| 8.50 × 10⁻⁷ | mM 10−6 cells h−1 | |
| 1.28 × 10⁻² | mM 10−6 cells h−1 | |
| 6.78 × 10⁻⁴ | mM 10−6 cells h−1 | |
| 1.40 × 10⁻⁵ | mM 10−6 cells h−1 | |
| 8.89 × 10¹ | mM 10−6 cells h−1 | |
| 1.5 × 10⁻³ | mM 10−6 cells h−1 | |
| 4.00 × 10⁻⁴ | mM 10−6 cells h−1 | |
| 3.42 × 10⁻³ | mM 10−6 cells h−1 | |
| 8.50 × 10⁻⁶ | mM 10−6 cells h−1 | |
| 3.10 × 10⁻⁶ | mM 10−6 cells h−1 |
Publisher’s Note: MDPI stays neutral with regard to jurisdictional claims in published maps and institutional affiliations. |
© 2022 by the authors. Licensee MDPI, Basel, Switzerland. This article is an open access article distributed under the terms and conditions of the Creative Commons Attribution (CC BY) license (https://creativecommons.org/licenses/by/4.0/).
Share and Cite
Helgers, H.; Hengelbrock, A.; Rosengarten, J.F.; Stitz, J.; Schmidt, A.; Strube, J. Towards Autonomous Process Control—Digital Twin for HIV-Gag VLP Production in HEK293 Cells Using a Dynamic Metabolic Model. Processes 2022, 10, 2015. https://doi.org/10.3390/pr10102015
Helgers H, Hengelbrock A, Rosengarten JF, Stitz J, Schmidt A, Strube J. Towards Autonomous Process Control—Digital Twin for HIV-Gag VLP Production in HEK293 Cells Using a Dynamic Metabolic Model. Processes. 2022; 10(10):2015. https://doi.org/10.3390/pr10102015
Chicago/Turabian StyleHelgers, Heribert, Alina Hengelbrock, Jamila Franca Rosengarten, Jörn Stitz, Axel Schmidt, and Jochen Strube. 2022. "Towards Autonomous Process Control—Digital Twin for HIV-Gag VLP Production in HEK293 Cells Using a Dynamic Metabolic Model" Processes 10, no. 10: 2015. https://doi.org/10.3390/pr10102015