Article

Hybrid Methodology Based on Symmetrized Dot Pattern and Convolutional Neural Networks for Fault Diagnosis of Power Cables

1
Department of Electrical Engineering, National Chin-Yi University of Technology, Taichung City 411, Taiwan
2
Department of Electrical Engineering, National Taiwan University of Science and Technology, Taipei City 106335, Taiwan
*
Author to whom correspondence should be addressed.
Processes 2022, 10(10), 2009; https://doi.org/10.3390/pr10102009
Submission received: 6 September 2022 / Revised: 28 September 2022 / Accepted: 3 October 2022 / Published: 5 October 2022
(This article belongs to the Section Energy Systems)

Abstract

:
This study proposes a recognition method based on symmetrized dot pattern (SDP) analysis and convolutional neural network (CNN) for rapid and accurate diagnosis of insulation defect problems by detecting the partial discharge (PD) signals of XLPE power cables. First, a normal and three power cable models with different insulation defects are built. The PD signals resulting from power cable insulation defects are measured. The frequency and amplitude variations of PD signals from different defects are reflected by comprehensible images using the proposed SDP analysis method. The features of different power cable defects are presented. Finally, the feature image is trained and identified by CNN to achieve a power cable insulation fault diagnosis system. The experimental results show that the proposed method could accurately diagnose the fault types of power cable insulation defects with a recognition accuracy of 98%. The proposed method is characterized by a short detection time and high diagnostic accuracy. It can effectively detect the power cable PD to identify the fault type of the insulation defect.

1. Introduction

Due to a steady increase in the residential and industrial demands under national development, the transmission and distribution systems continuously develop towards higher transmission voltage and capacity. Power cables have substituted the traditional overhead transmission lines for power transmission. They have become one of the most important and necessary pieces of equipment for transmission and distribution systems. Over the long-term operation, the insulating material of power cables must bear electrical stress. The failures in insulating properties resulting from careless construction, natural disasters, insulation deterioration, and other factors are likely to occur. In worse cases, internal partial discharge (PD) may occur, which results in the interruption of power transmission, and even causes fires and personal injuries [1,2]. The PD signal is an important index for distinguishing the power cable insulation material conditions. Early detection of the PD signal and effective diagnosis of the insulation deterioration, defects, or damage of power cables contributes to enhancing the power supply reliability and operational safety of transmission and distribution systems [3,4].
The PD is a pulse-like phenomenon [5]. An impulsive current signal occurs in the power cable earth wire. Sound, light, heat, and chemical reactions are diffused in ambient space. The PD signal change is an effective index of power cable insulation defect conditions [6,7,8,9]. The PD detection method has been used to study the insulation defect state in some literature. Shang et al. [10] proposed a feature extraction method based on variational mode decomposition (VMD) and multi-scale dispersion entropy (MDE) to overcome the limitations of conventional PD fault diagnosis. Their study performed the PD fault diagnosis using a hypersphere multiclass support vector machine (HMSVM). The experimental results showed that the main feature parameters of PD could be extracted by combining the VMD-MDE PD feature extraction method with the PD recognition of HMSVM. The effectiveness and superiority of the proposed PD fault diagnosis method were proved as the recognition accuracy was high. Polisetty et al. [11] proposed using commercial sonic sensors and an artificial neural network (ANN) for five common PD classes in controlled conditions. They discussed the influence of measurement distance and angle on classification accuracy. They extended the applications to different types of PD recognition in outdoor insulation systems and proved that the PD recognition accuracy of acoustic emission (AE) technology was higher than 85%. Based on ANN, Dobrzycki et al. [12] proposed automatic recognition of acoustic wave signals accompanying electric trees in the insulating materials. Their study evaluated the efficiency of different ANNs in testing electric tree-related signals. By adequately selecting statistical indices or input parameters of the analysis window, they further verified that ANN effectively analyzed PD and solid dielectric electric trees. Wang et al. [13] used ultrasonic sensors to test PD signals, used a threshold wavelet to suppress the noise of PD ultrasonic signals, and proposed combining multi-scale analysis with a backpropagation neural network to identify different types of PD models. The PD type is classified to diagnose the cable terminal defect and evaluate the life and danger. Gu et al. [14] studied a defect cast resin transformer. They transformed the PD signals into energy distributions with time-frequency domain information by the Hilbert–Huang transform. They proposed the Kolmogorov–Smirnov test with signal-energy ratio sorting as an effective way to determine the optimal shifting number. The experimental results verified that the accuracy of processing nonlinear and non-stationary signals could be increased. Peng et al. [15] proposed a deep learning method for high-voltage cable PD recognition based on convolutional neural networks (CNNs). First, the ethylene-propylene-rubber cables’ PD data signals were measured. The transient PD pulse feature was extracted by Wavelet Transform analysis. The CNN structure that influenced the accuracy of the PD recognition method was discussed. The proposed method had better PD recognition accuracy than the traditional machine learning method. It solved the problem of distinguishing the highly similar PD signals of high-voltage cable insulation defects. To overcome the bottleneck and restrictions of the traditional machine learning method in increasing the XLPE power cable PD recognition accuracy, Wang et al. [16] combined discrete wavelet transform with the Lorenz chaotic system. This approach helped obtain the PD signal feature map and used CNN to identify the power cable insulation fault type. The proposed method could rapidly identify the power cable fault state. It has better recognition accuracy and noise resistance than the traditional machine learning method.
This study obtained the PD signal feature image based on SDP and diagnosed the insulation defect in the XLPE power cable using CNN. First, the high voltage potential transformer was combined with an autotransformer to apply a regulating voltage to the XLPE power cable conductor with insulation defects. The high-speed data capture card captured the power cable PD signals measured by a high-frequency current sensor. The PD time domain signals were transformed by SDP into visual feature images in the polar form to visualize the signal frequency and amplitude variations when there were different insulation defects. Finally, these SDP feature images were transferred to CNN to identify the insulation fault type of the XLPE power cable. The experimental results show that the power cable insulation fault recognition accuracy was as high as 98% compared to Ref. [16]. This finding proved that the proposed method could rapidly and effectively identify the PD insulation defect type of power cable.

2. Power Cable PD Modeling and Test

2.1. Power Cable Defect Construction

The defects resulting from man-induced poor construction or the insulation defects induced by an external environment are the major causes of the faults in the operation of power cables [17,18,19]. To study the PD of power cables, the XLPE-PVC single-core power cable with a cross-section area of 38 mm2 and a withstand voltage of 25 kV was taken as an experimental subject. A normal power cable model with an end connector (Type I) and three common defective power cable fault models with end connectors (Type II~Type IV) were built, and the PD phenomenon of power cable induced by different defect conditions was discussed.

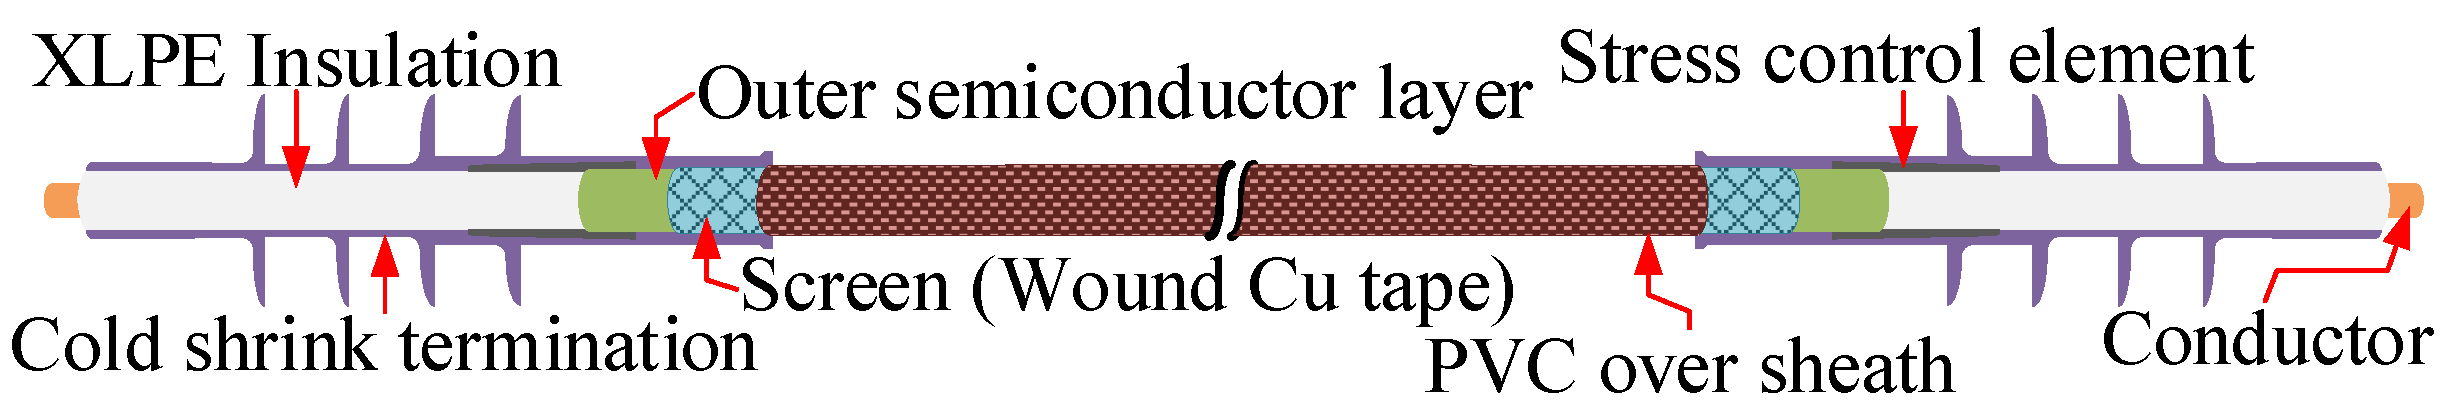
2.1.1. Normal Power Cable (Type I)

The power cable comprises a copper conductor, an inner semi-conducting layer, an XLPE insulation layer, an outer semi-conducting layer, a screen, and a PVC covering from inside to outside. To avoid the high voltage creepage along the cable surface, an end connector of a wavy structure was mounted to increase the surface distance. It has stress control (stress cone), waterproofing, screening, and insulation functions. As a result, the electric field distribution could be equalized effectively, and the cable surface discharge accident was prevented. The normal power cable model built in this study is shown in Figure 1.

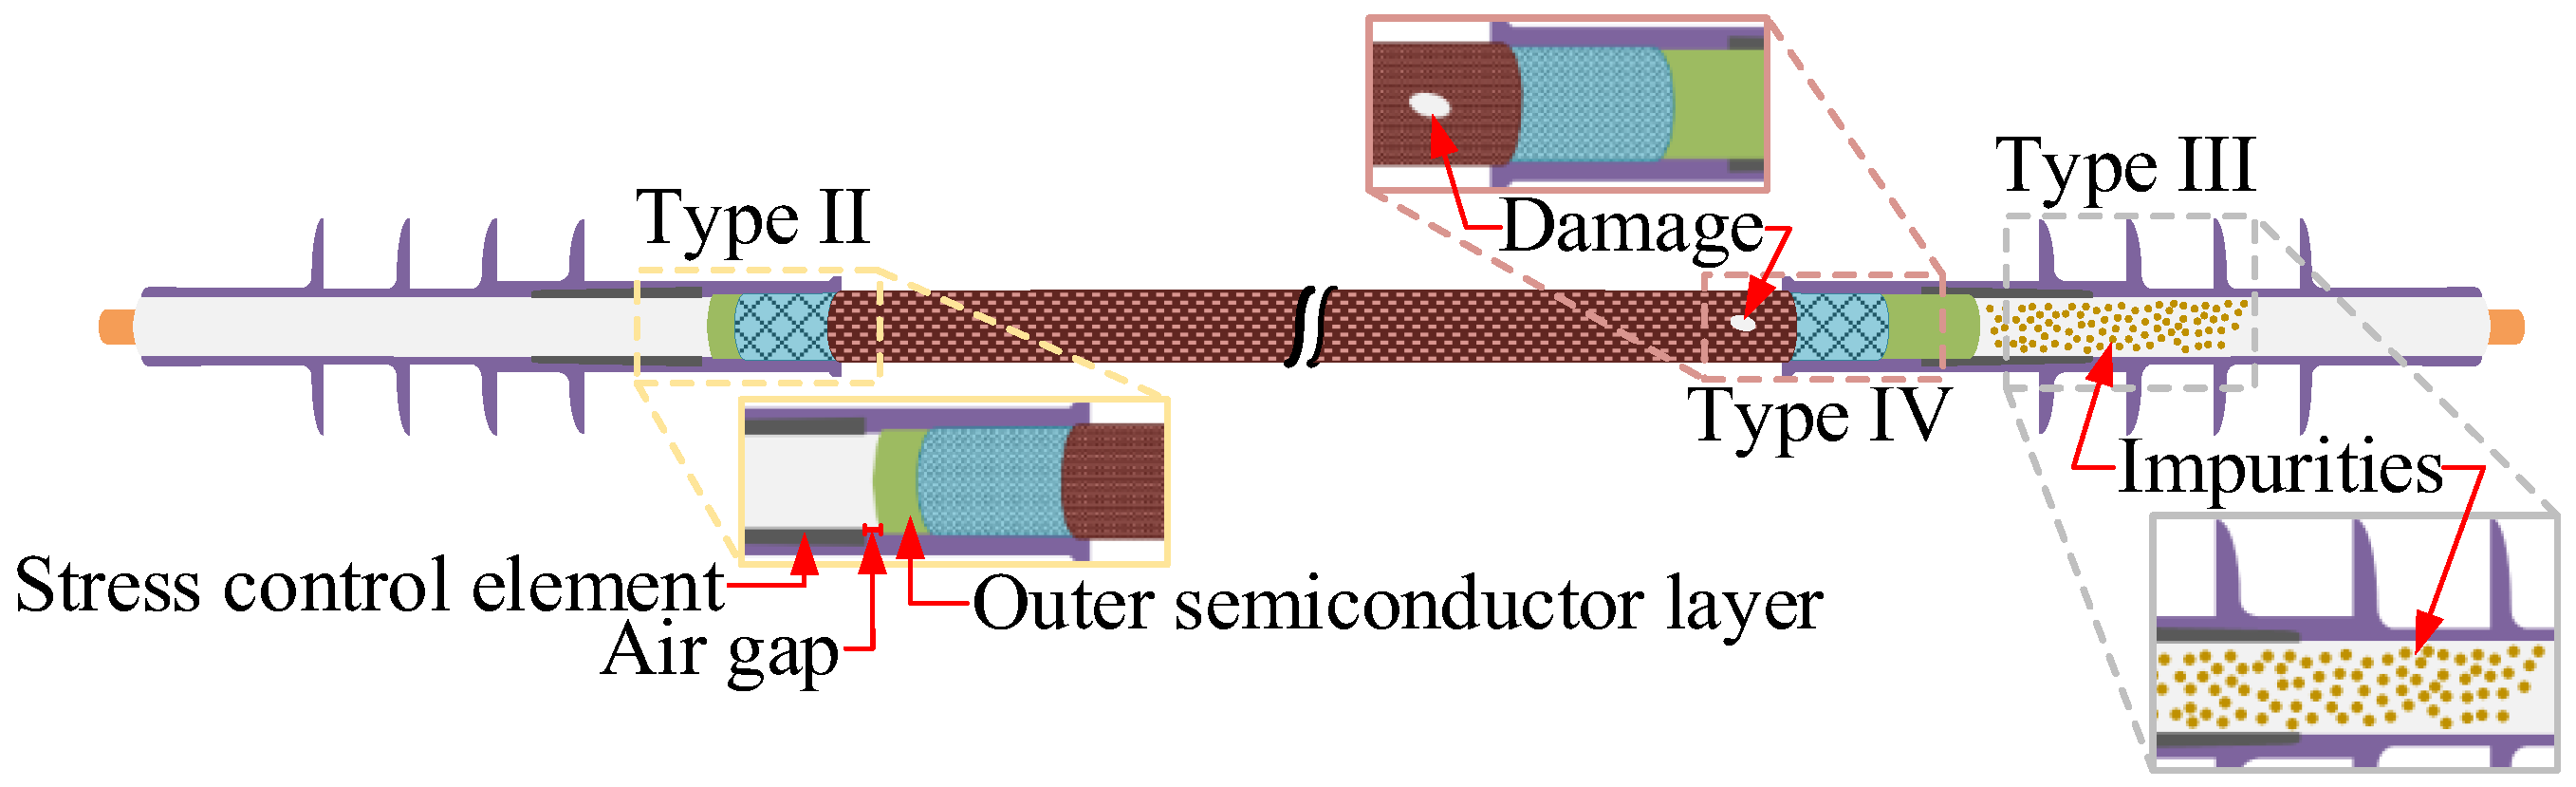
2.1.2. Defective Power Cable (Type II~IV)

If the power cable does not comply with construction specifications, the stress cone will fail when installing the end connector. Subsequently, the dielectric constant and electric field distribution inside the end connector are nonuniform, leading to a PD phenomenon. Therefore, a defect model where the outer semi-conducting layer of the power cable was only 5 mm long was built in this study. The stress cone of the end connector on the outer semi-conducting layer could not be covered, and the PD induced by the defect was detected.
During the installation of the end connector on the power cable, the dust in the construction environment results in partial impurities on the insulation layer of the cable. The residual impurities on the insulation layer influence the electric field distribution. The insulation layer must be wiped in a fixed direction with a special cleaning patch. Regarding the defect model simulating the residual impurities on the power cable insulation layer, this study sprinkled copper powder on the cable insulation to simulate the construction without cleaning. The PD induced by residual impurities on the insulation layer was detected.
The insulation of the power cable may be damaged by external factors such as man-induced poor construction or the biting of animals. If the cable insulation damage does not immediately induce a power outage accident, the cable insulation is likely to be infiltrated by water vapor in long-term operation, and the insulation breakdown is induced and eventually causes faults. Regarding the defect model simulating the power cable insulation damage, the cable insulation in this study was damaged by a drilling bit with a diameter of 2 mm. The PD induced by the insulation layer damage was detected. The defective power cable model built in this study is shown in Figure 2.

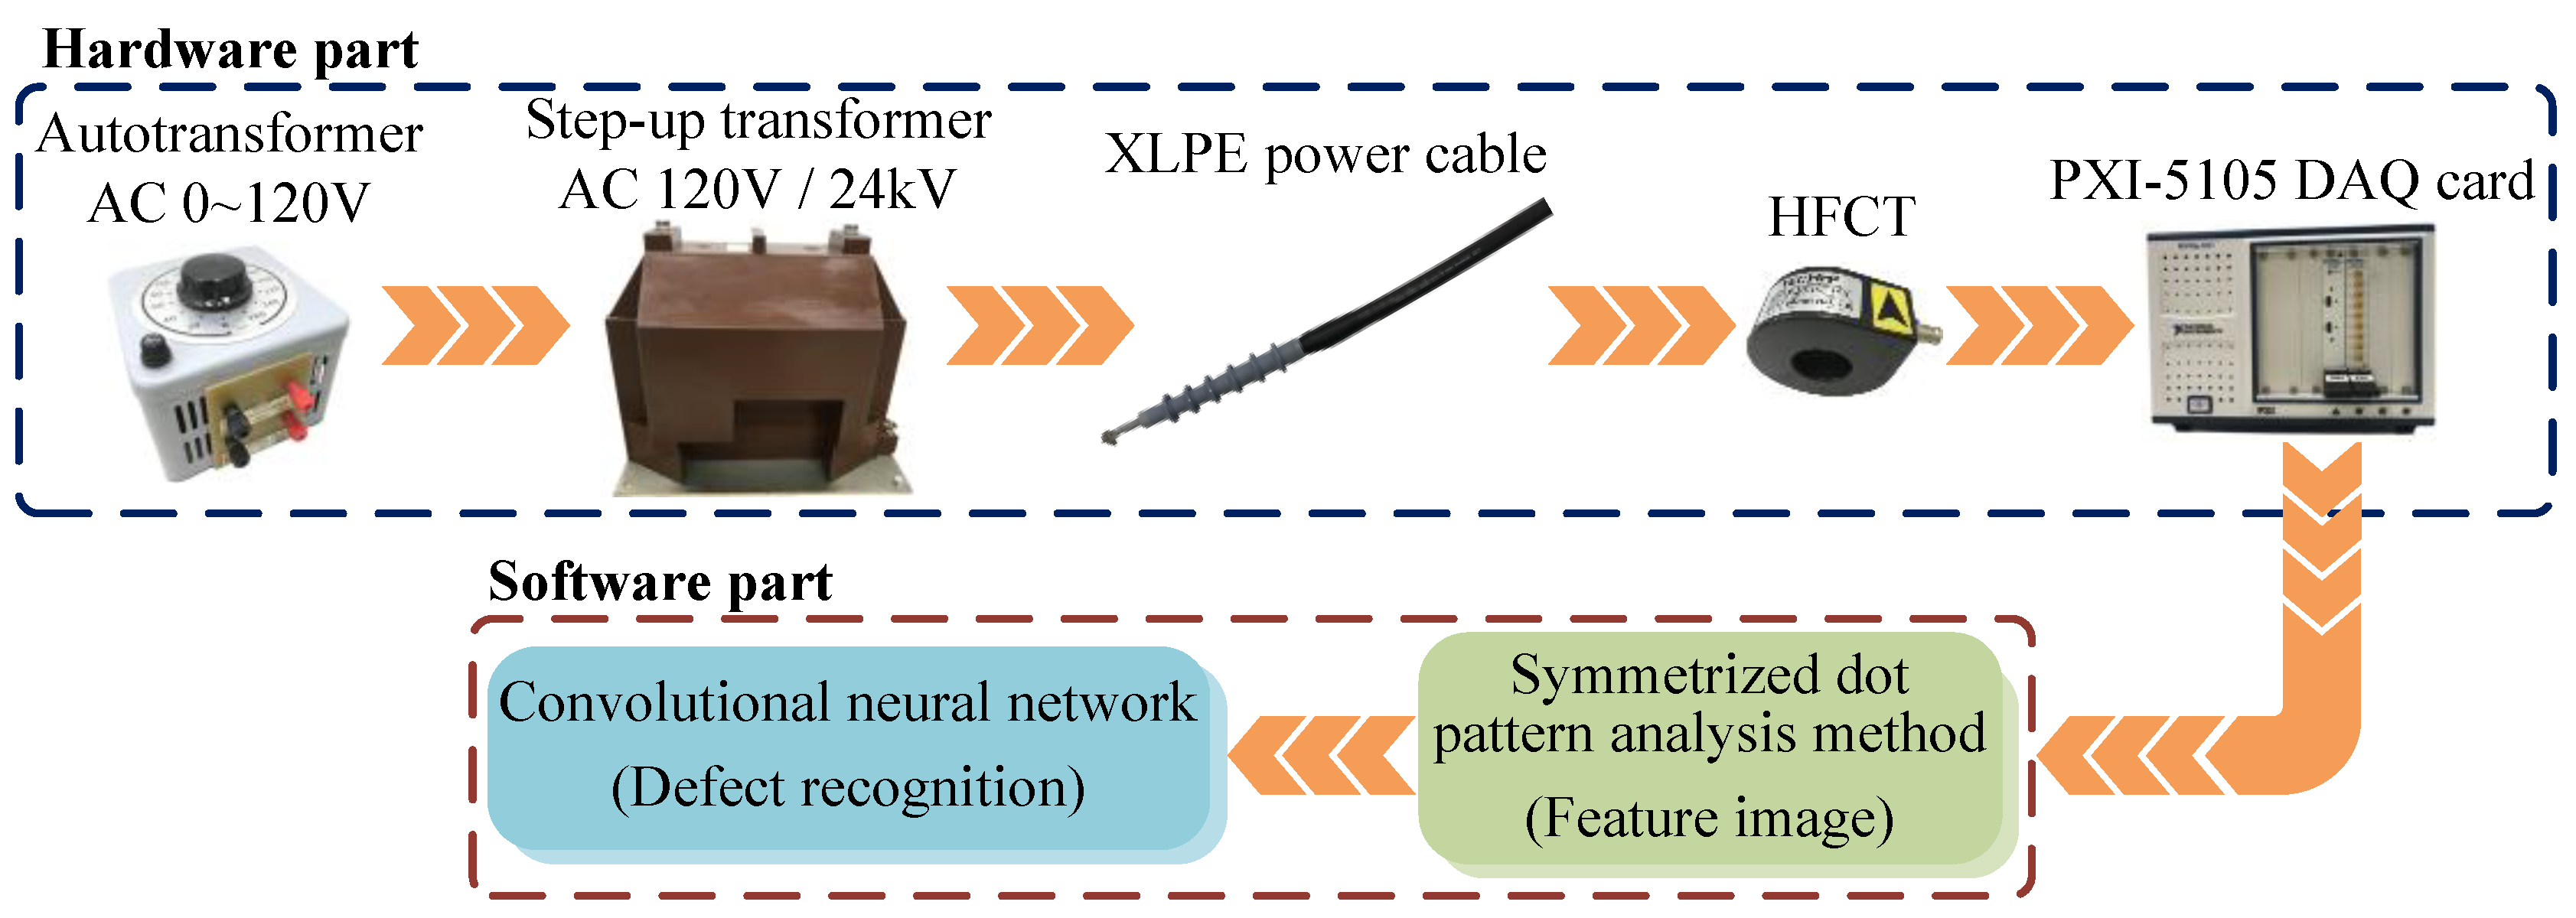
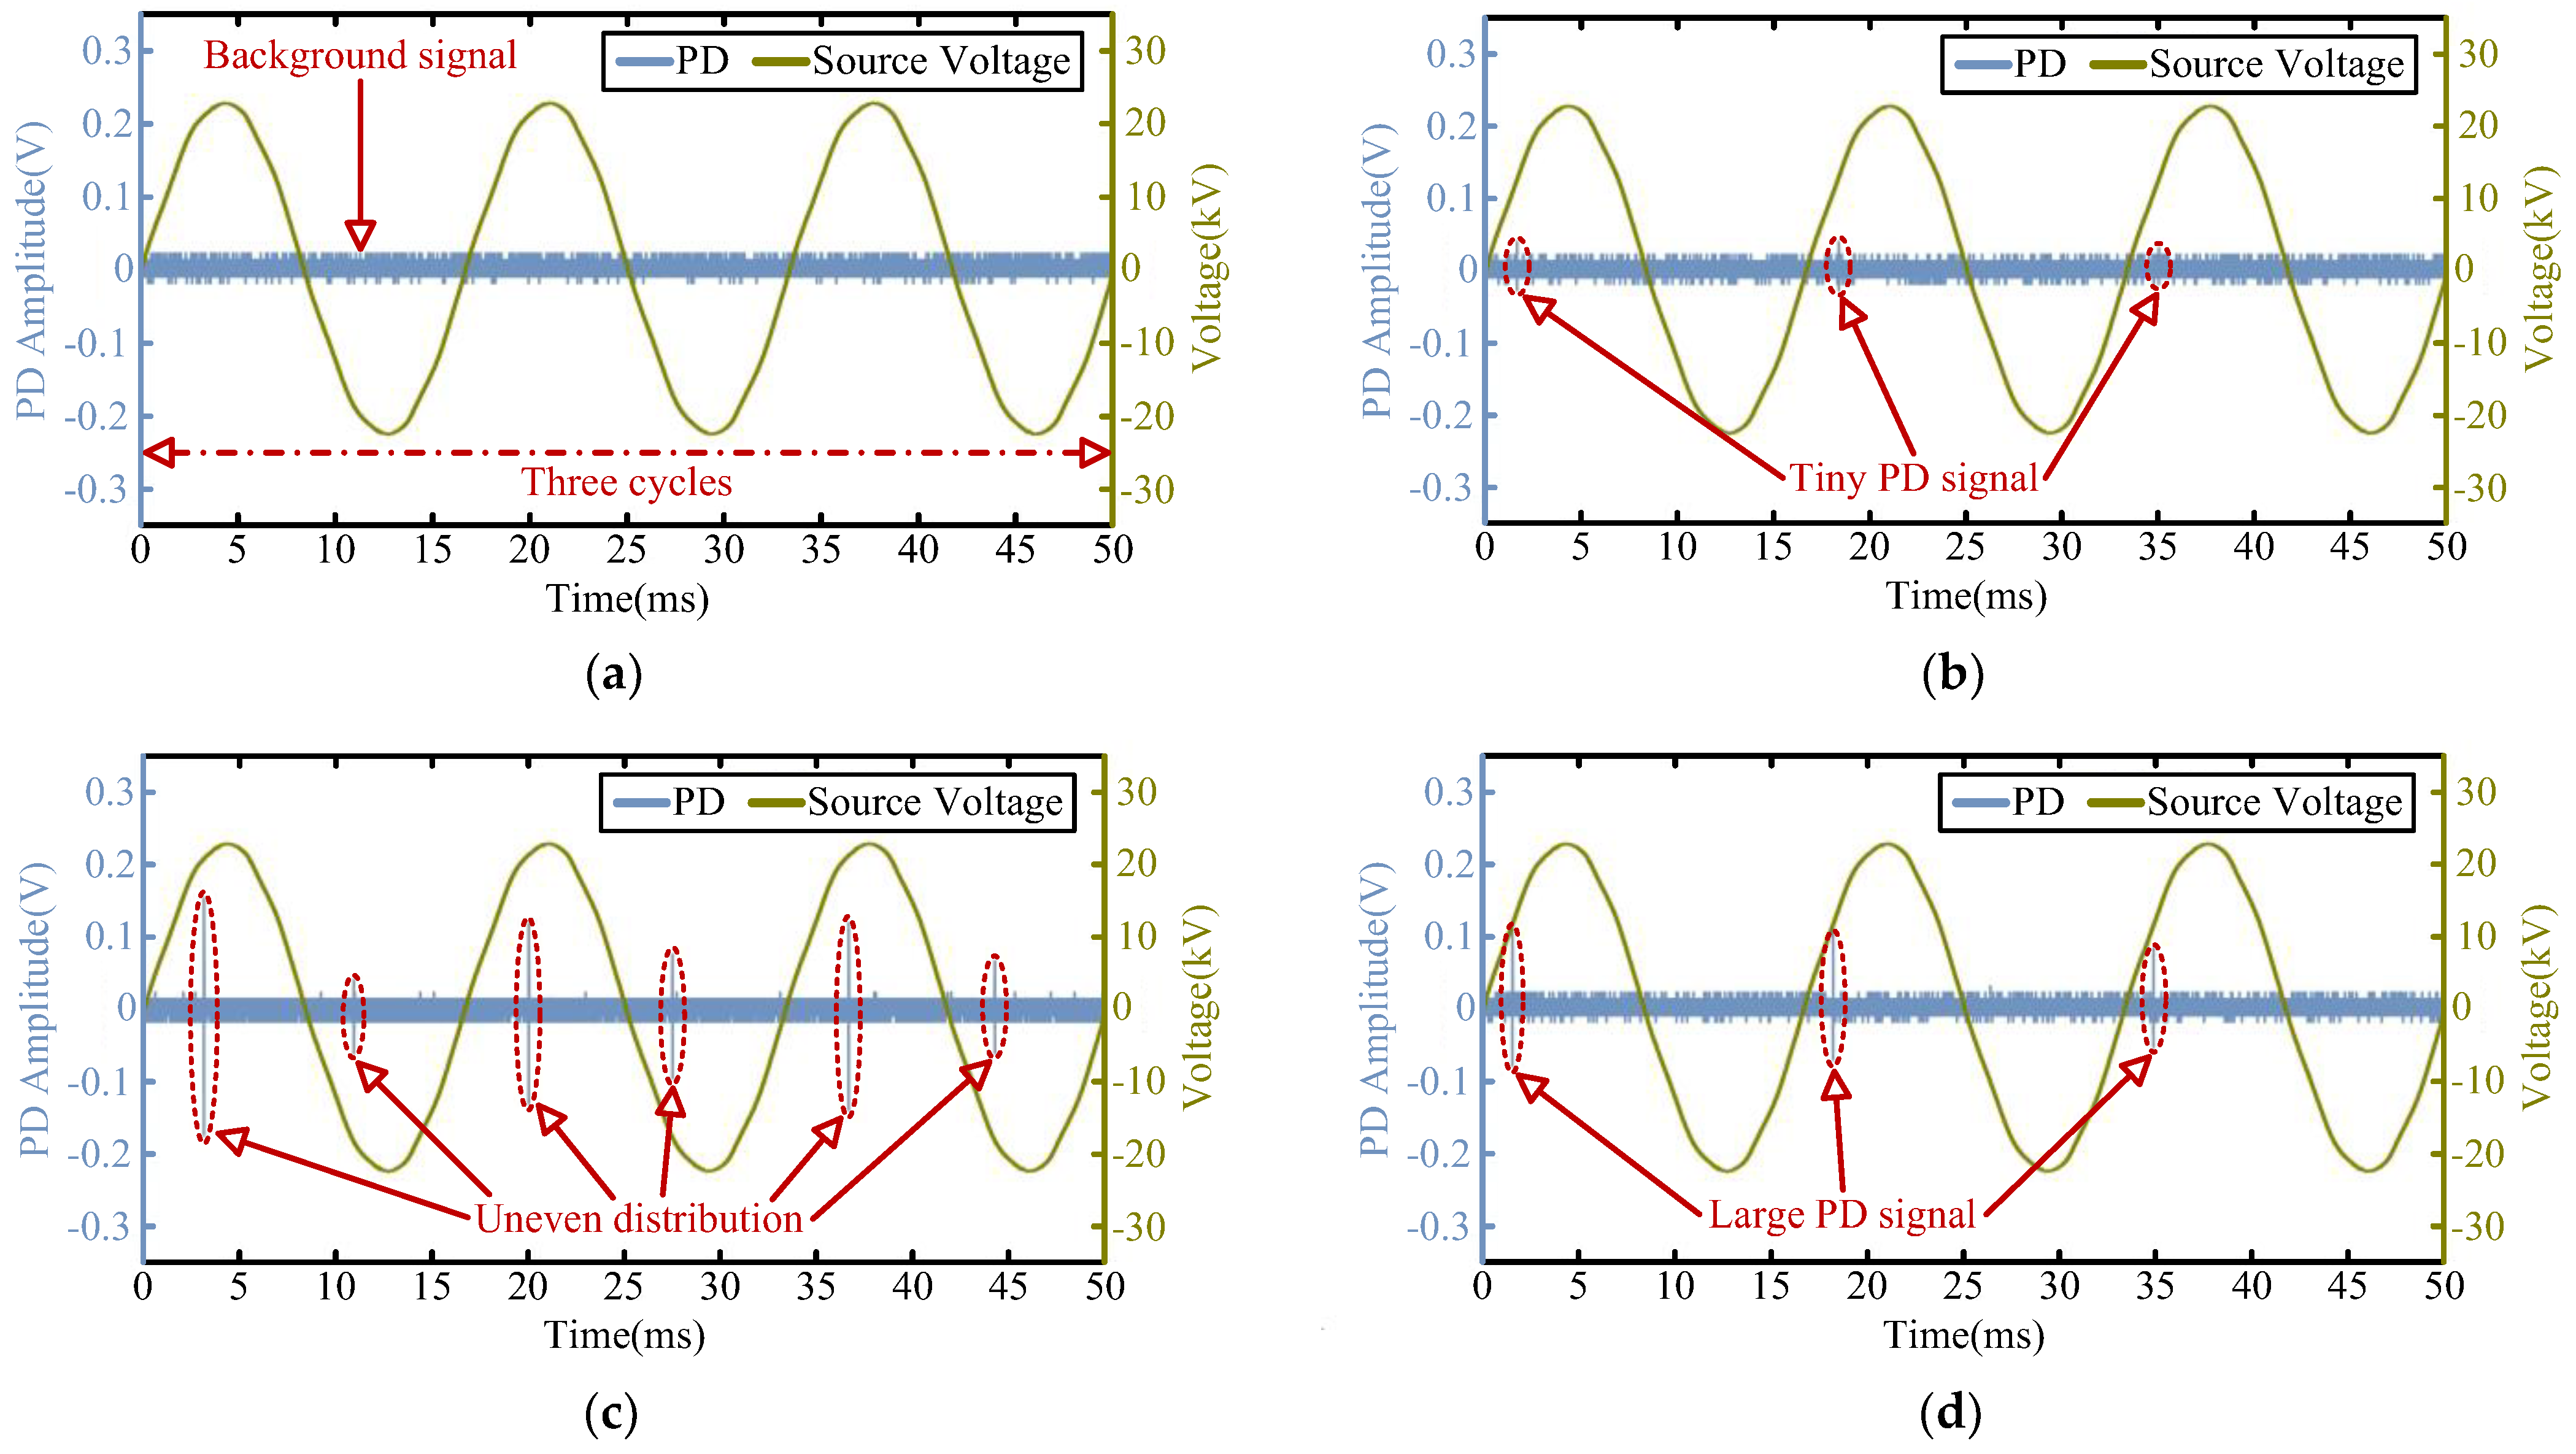
2.2. PD Signal Capture

Figure 3 shows the power cable test process designed in this study. First, the autotransformer was used to regulate the voltage of a high voltage potential transformer to generate a 22.8 kV high voltage. These voltages were applied to the XLPE power cable conductor. The high-frequency current sensor (HFCT) captured the current pulse signals of the power cable earth wire. The high-speed data capture card received the output signals of HFCT for calculation analysis. The bandwidth of HFCT was 1 MHz to 60 MHz, and the sampling rate of the NI PXI-5105 high-speed data capture card was as high as 60 MS/s, which was sufficient to display all PD signals detected by HFCT. Figure 4 shows the power cable PD testing platform.

3. Proposed Method

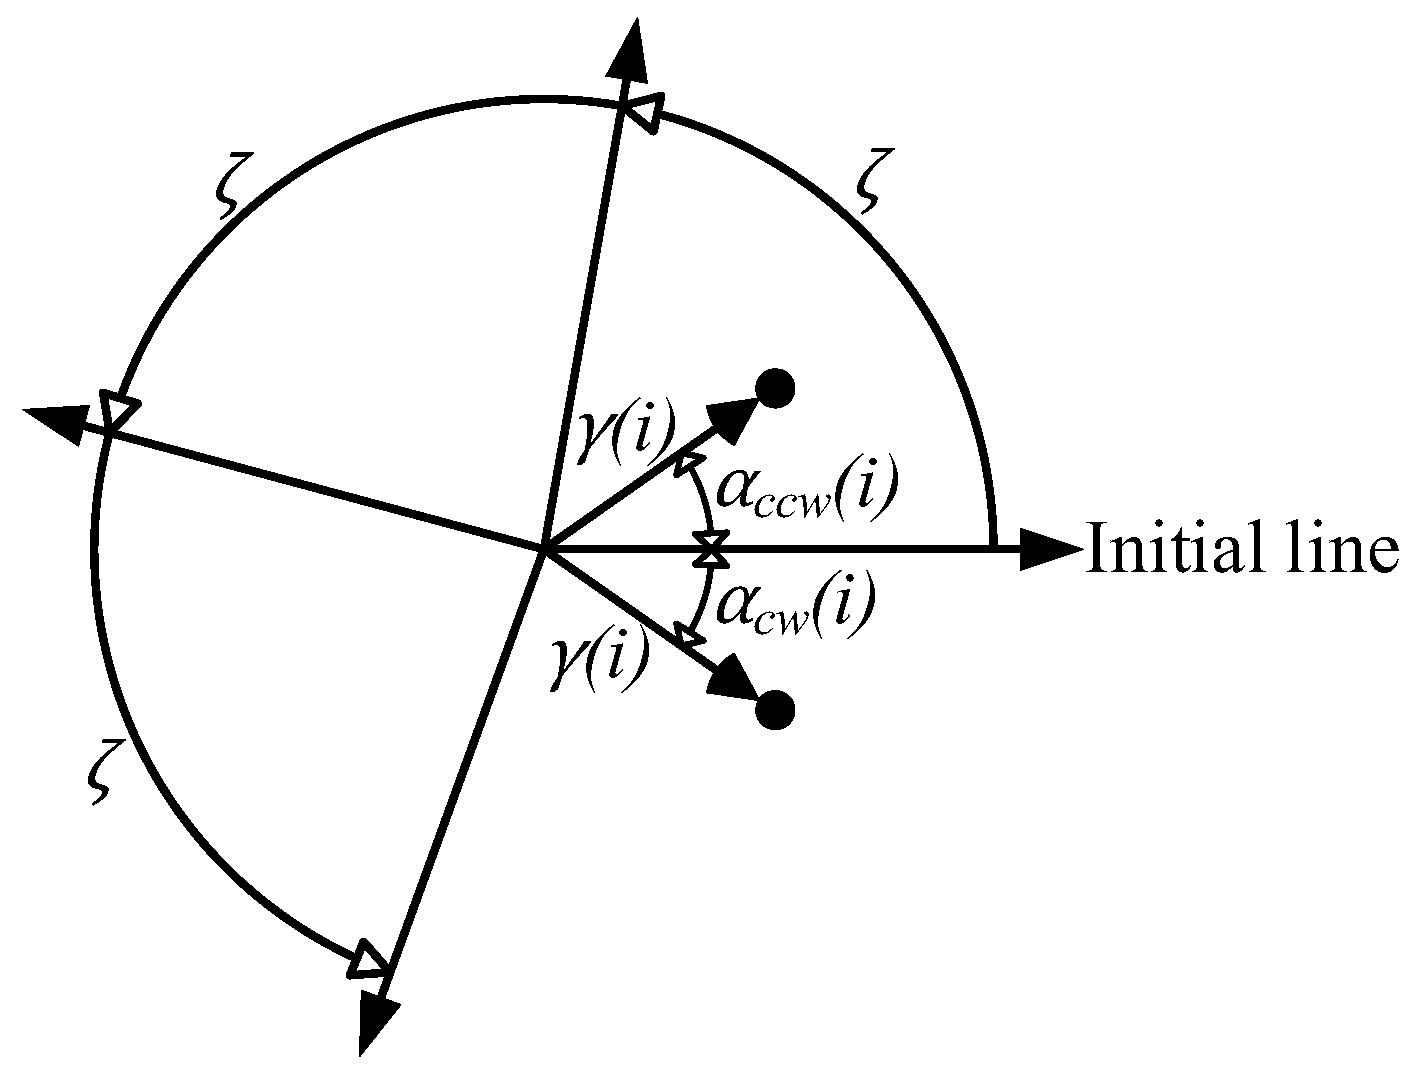
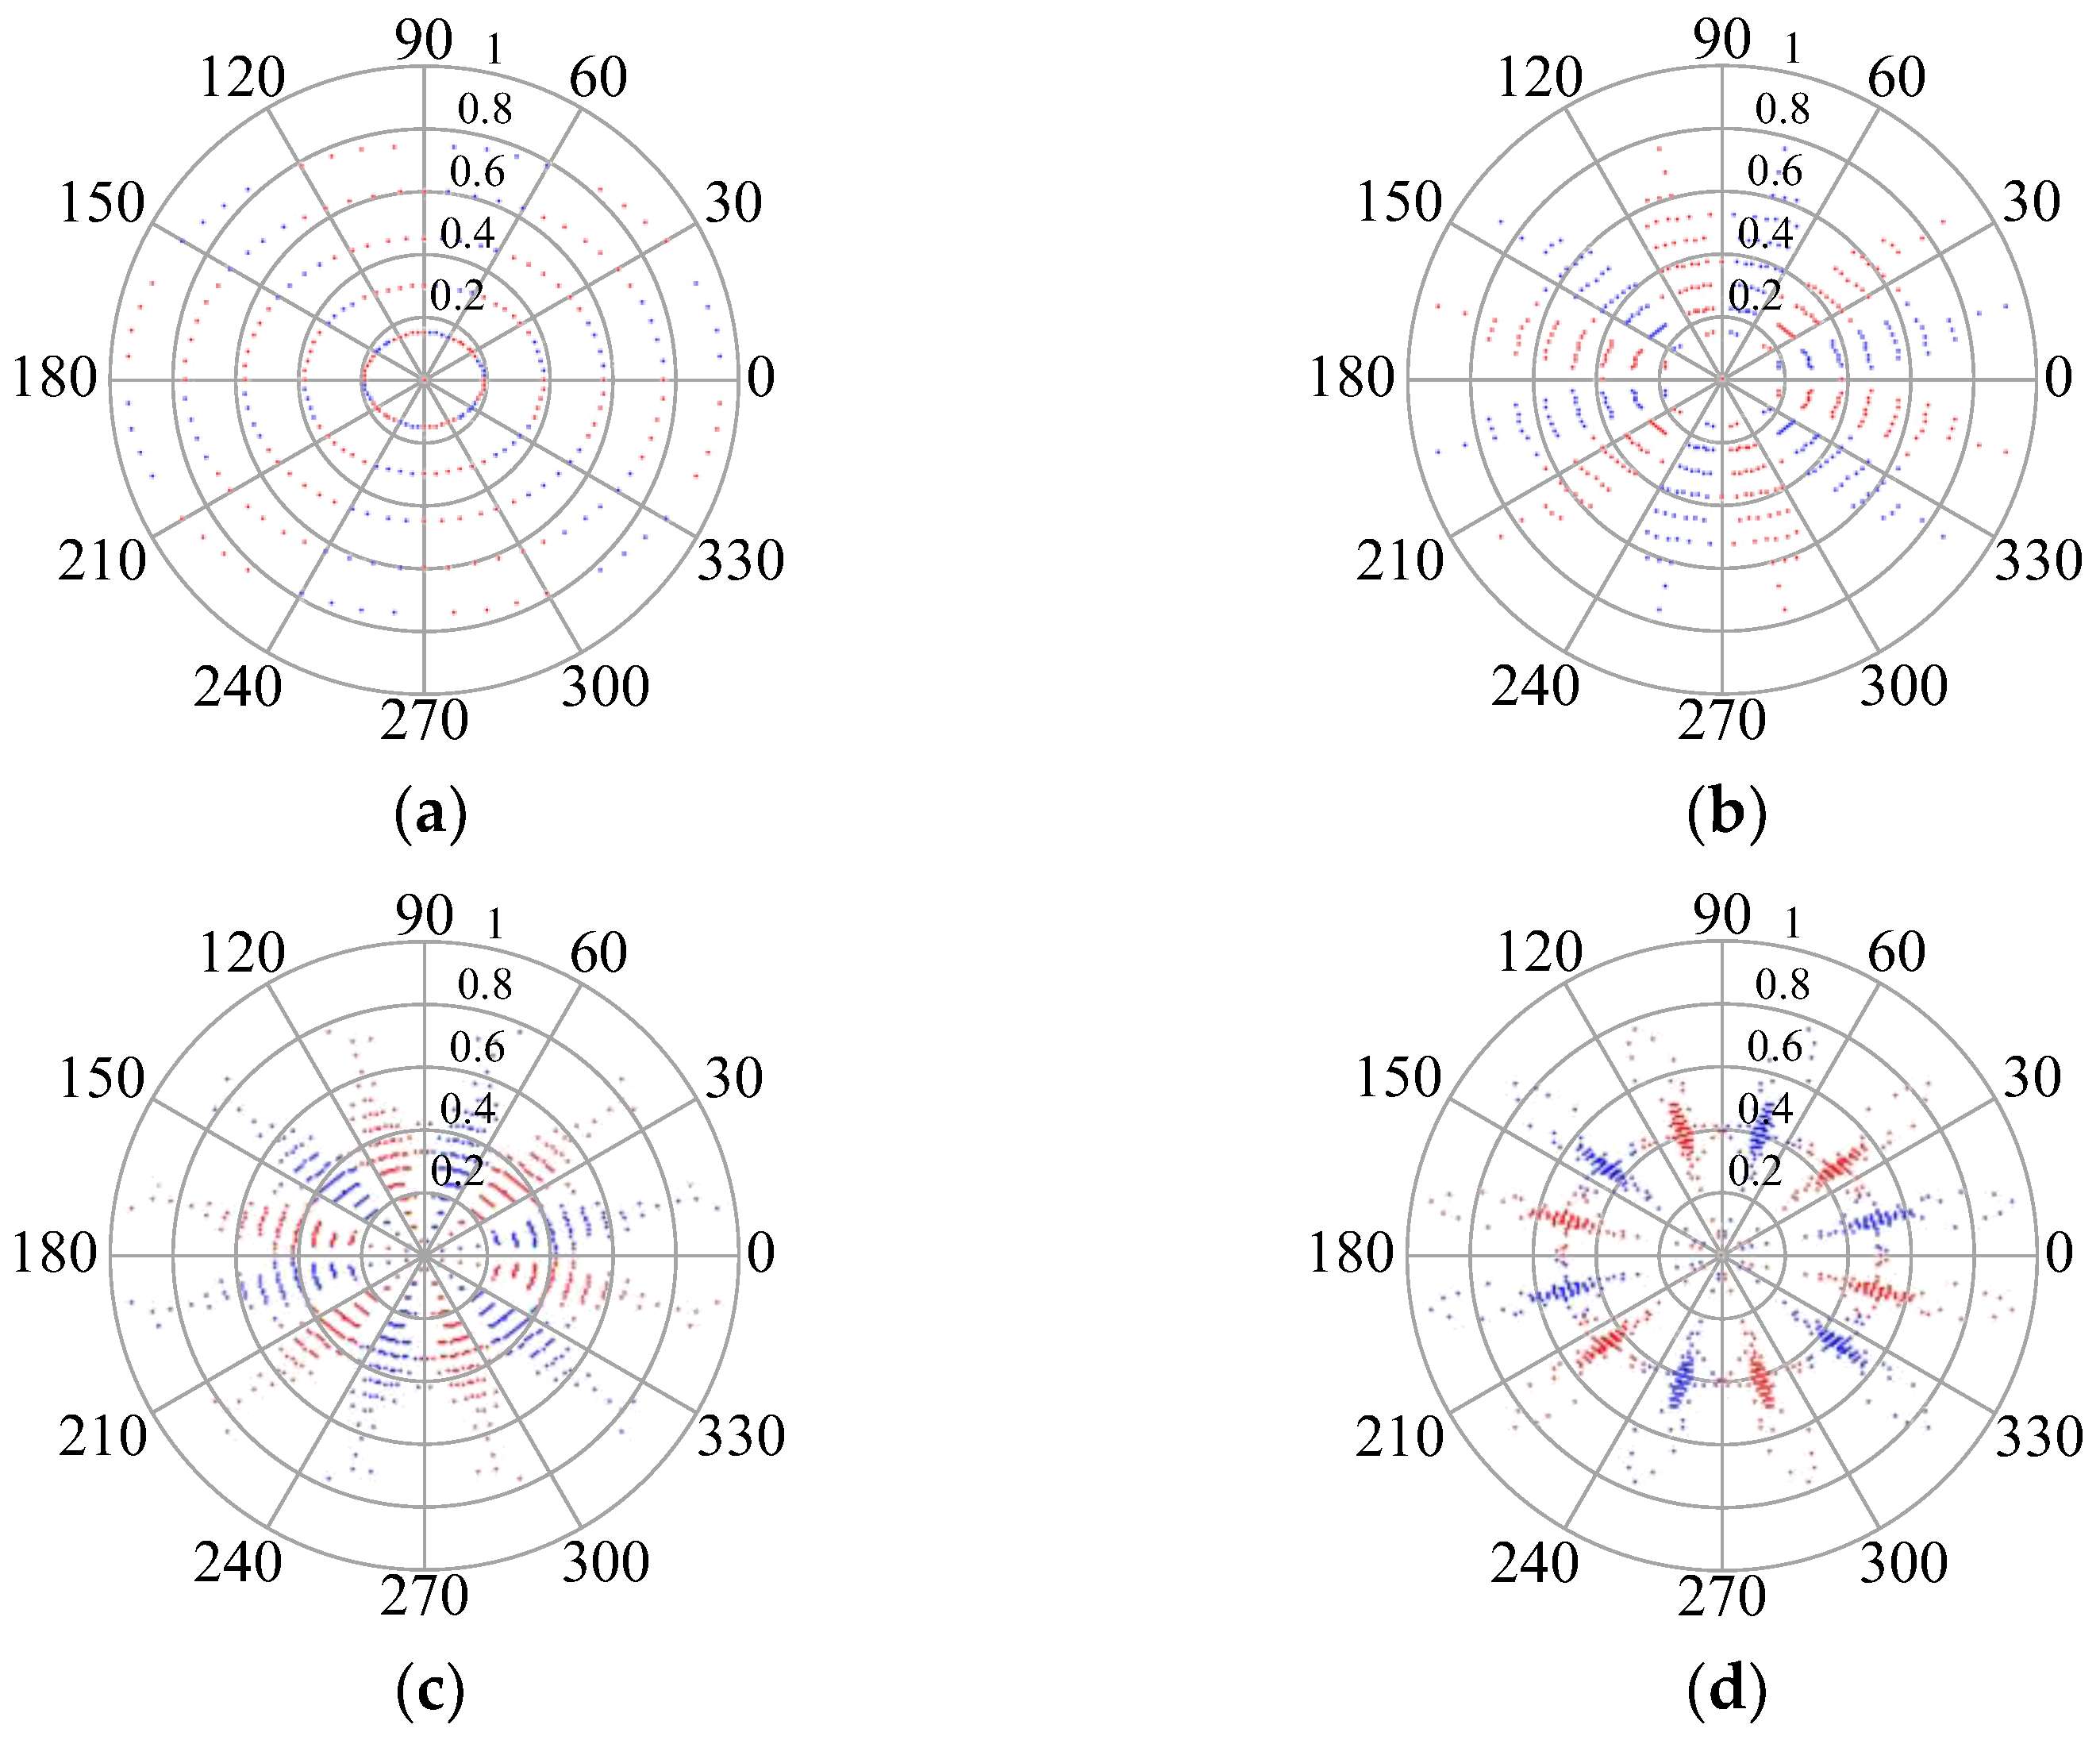
3.1. Symmetrized Dot Pattern (SDP)

The SDP provides a visual method to obtain the features of PD signals. Comprehensible images describe the amplitude and frequency variations of time sequence signals, and the correlated results of discrete time axis signals are transformed. The snowflake-like point set of sextuple symmetry is obtained and drawn in the polar coordinate space as a mirror symmetry image [20,21,22,23]. The imaging principle of SDP analysis is shown in Figure 5.
The time-domain PD signal is X d s = { d s 1 ,   d s 2 ,   d s 3 , , d s i } ,   d s i is i th sampling point of PD signal X d s , d s i + Δ T is i th + Δ T sampling point of PD signal X d s after interval time Δ T . According to the SDP principle, when the time domain PD signal point d s i is transformed into polar coordinate space P ( γ ( i ) , α c w ( i ) , α c c w ( i ) ) , the radius γ ( i ) of the PD signal point d s i mapped into the polar coordinates can be expressed as follows:
γ ( i ) = d s i d s m i n d s m a x d s m i n
where d s m i n is the minimum amplitude value of the time-domain PD signal X d s ; d s m a x is the maximum amplitude value of the time-domain PD signal X d s ; α c w ( i ) is the clockwise rotation angle of the initial line of the adjacent interval time point x i + Δ T in polar coordinates; α c c w ( i ) is the counterclockwise rotation angle of the initial line of adjacent interval time point x i + Δ T in polar coordinates, expressed as follows:
α c w = ϕ d s i + Δ T d s m i n d s m a x d s m i n ζ
α c c w = ϕ + d s i + Δ T d s m i n d s m a x d s m i n ζ
where ϕ represents the initial rotation angle of the mirror symmetry plane ( ϕ = 360 m / n ,   m = 1 , 2 , 3 , , n ) ;   n is the number of mirror symmetry planes ( n is 6 in general); Δ T is the time interval (range value 1~10); ζ is the amplification coefficient of rotation angle (smaller than the value of ϕ in general).
The SDP transforms the time-domain PD signal waveform into a polar coordinate plane P ( γ ( i ) , α c w ( i ) , α c c w ( i ) ) locating point. The signal amplitude or frequency difference is reflected in the position difference and curvature change of polar coordinate plane points. Therefore, the SDP can visualize the PD signal information in images and display the feature images of different PD phenomena. The SDP image transformed from the PD signal waveform of the power cable defect model (Type II) proposed in this study is shown in Figure 6.

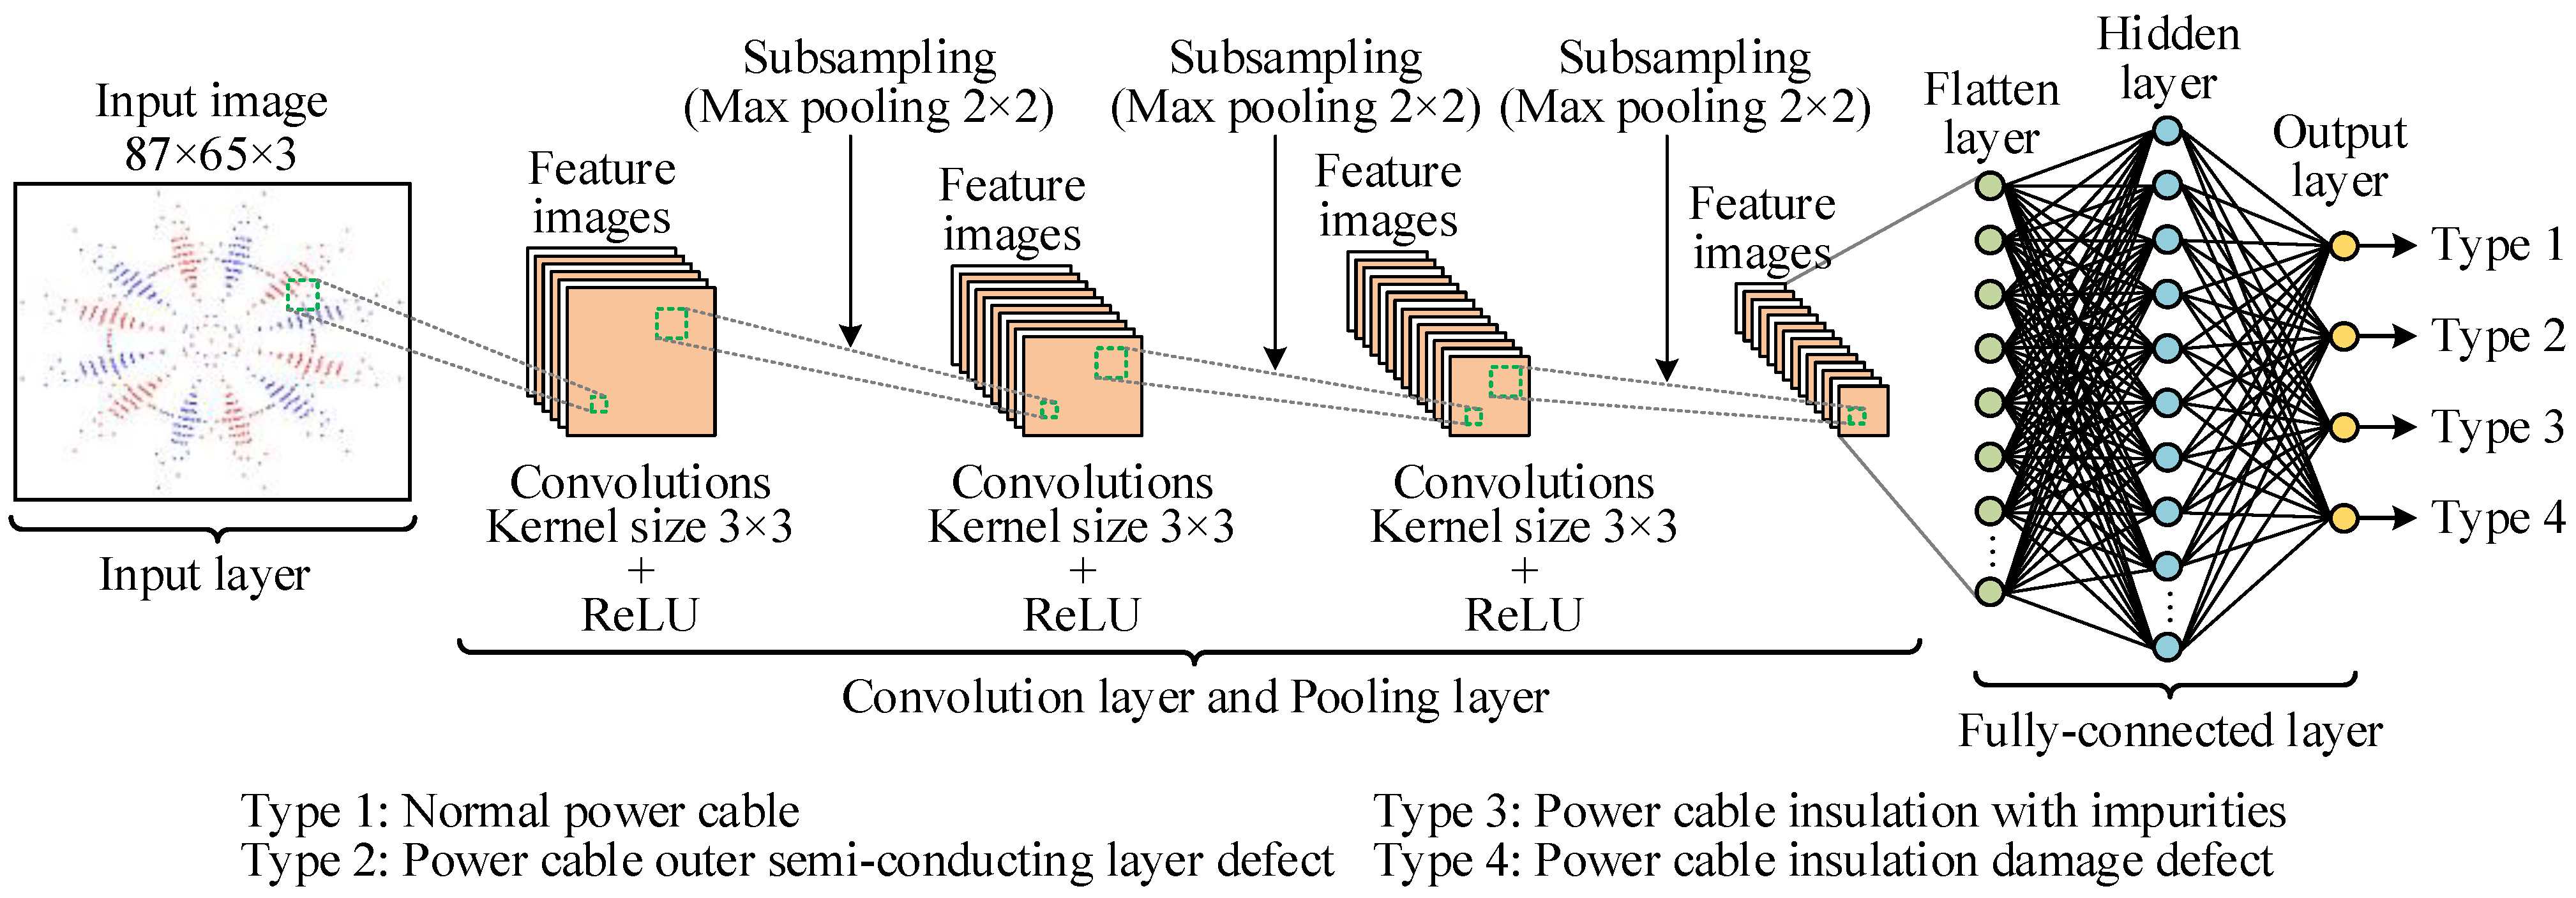
3.2. Convolutional Neural Network (CNN)

CNNs are image classifiers extensively used for supervised learning, and the network has excellent accuracy for image classification [24,25,26,27]. Compared to the traditional multilayer perception network, CNN can identify image details using the convolution and pooling layers, whereas the other neural networks simply extract data for operation. The main structure of the neural network comprises a convolution layer, a pooling layer, and a fully connected layer with activation functions. The CNN structure proposed in this study is shown in Figure 7. The features of the SDP image of PD were extracted from an input layer, three convolution layers, and a pooling layer. Afterward, the fault type of power cable defect was identified by the fully connected layer composed of a flatten layer, a hidden layer, and an output layer. The layers are introduced below.

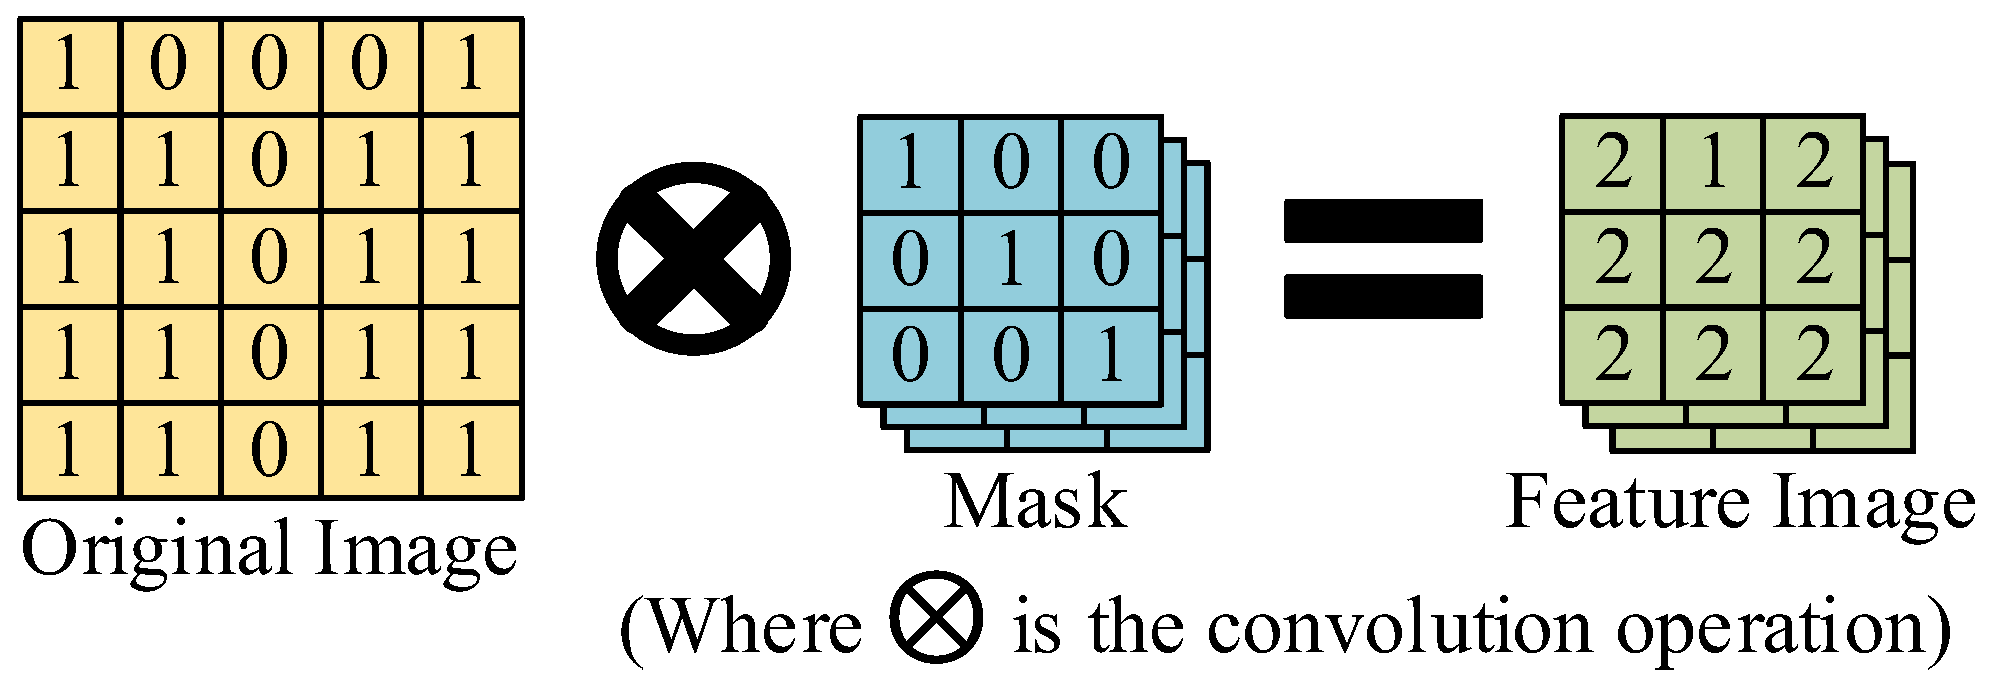
3.2.1. Convolution Layer

The convolution layer captures the image features in the network. This layer uses masks of different sizes for convolution operations, and the image feature extraction or feature enhancement is performed using spatial filtering. One stride is moved each time until all pixels of the original input image are calculated by the mask (inner product), and the Feature Map is obtained. Figure 8 shows an example of the convolution operation with a 3 × 3 mask. The operation of the convolution layer is expressed as Equation (4).
O F i m a g e q = p = 1 L I F i m a g e p M p , q ,   q = 1 , , K
where I F i m a g e p is the p th input feature image; O F i m a g e q is the q th output feature image; M p , q is the convolution kernel of the q th input feature image corresponding to p th output feature image; is the convolution operation; L is the number of input feature images; K is the number of output feature images.
To enhance the nonlinear mapping of the output result of the convolution layer, the activation function is applied after the convolution operation [28,29]. Sigmoid and ReLU are the common activation functions. The gradient vanishing of the Sigmoid function worsens as the number of iterations increases. The ReLU function can overcome the gradient vanishing problem effectively. It is more effective in accelerating network training than the Sigmoid function. It will not significantly influence the generalization accuracy of the model. Therefore, this study used the ReLU function as a nonlinear function, expressed as Equation (5).
f ( x ) = { 0 , i f   x < 0 x , i f   x 0
wherein x is the output of the last neuron. If x < 0 , the output of the nonlinear function is 0; if x 0 , the input of the nonlinear function is equal to the output.

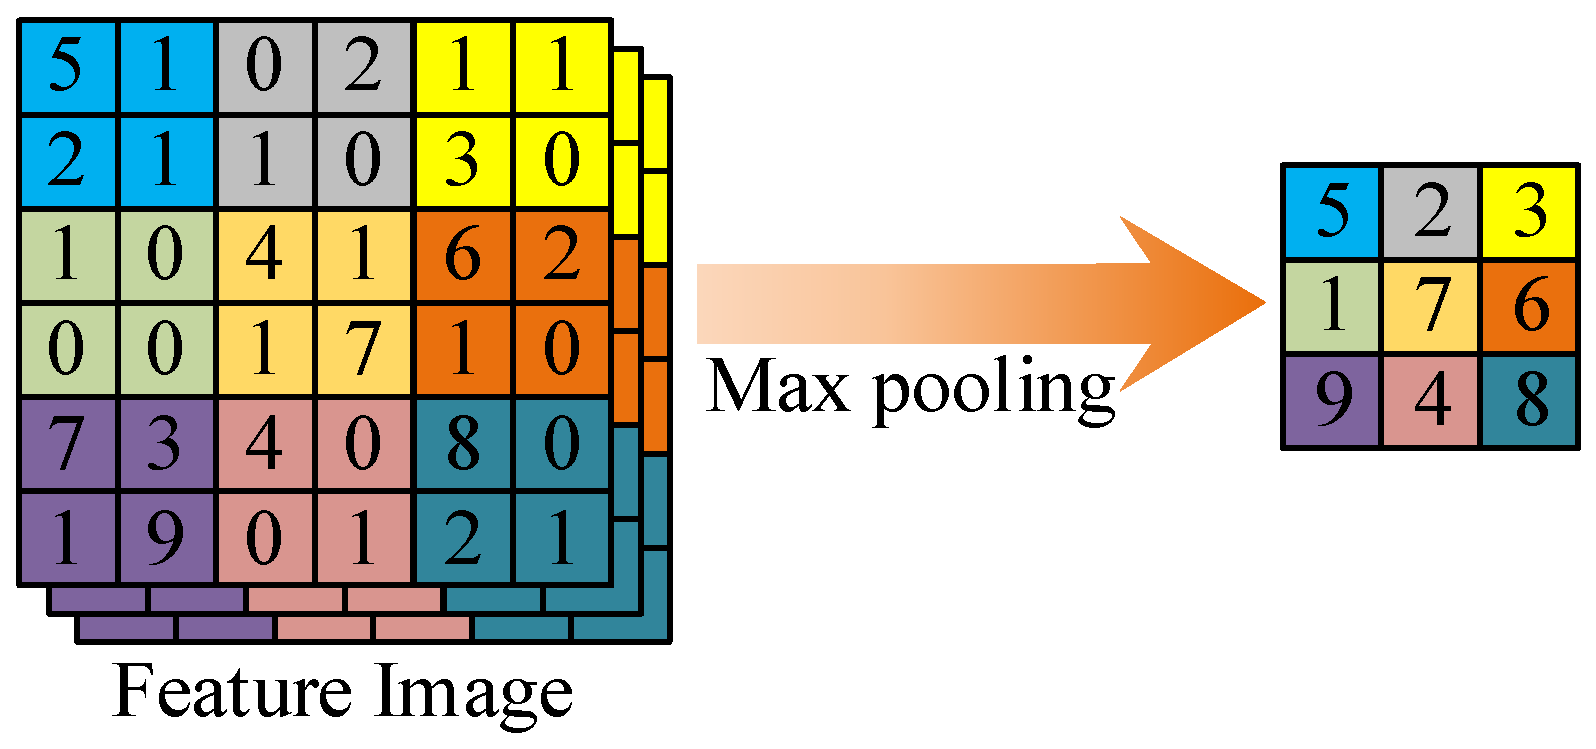
3.2.2. Pooling Layer

The pooling layer is used to reduce the feature size and maintain the invariance of image features after capturing the feature image by the convolution layer. It reduces the computation complexity of the entire network and maintains the features matching the image. The conventional pooling layer is divided into max pooling and average pooling. The max pooling computing mode is where a color block is taken as a unit to obtain the maximum value, and the max pooling output can be obtained. Similar to max pooling, in average pooling, one color block is taken as a unit to obtain the average pixel values and the average pooling output. This study used the max pooling operation. Figure 9 shows an example of a 2 × 2 max pooling operation. If the input feature image ( I F i , j ) is L × L , the output feature image ( O F i , j ) after the max pooling operation is L 2 × L 2 , the pooling layer operation is expressed as Equation (6).
O F u , v = M a x ( I F 2 u , 2 v , I F 2 u , 2 v + 1 , I F 2 u + 1 , 2 v , I F 2 u + 1 , 2 v + 1 )   ,   0 u , v ( L 2 1 )

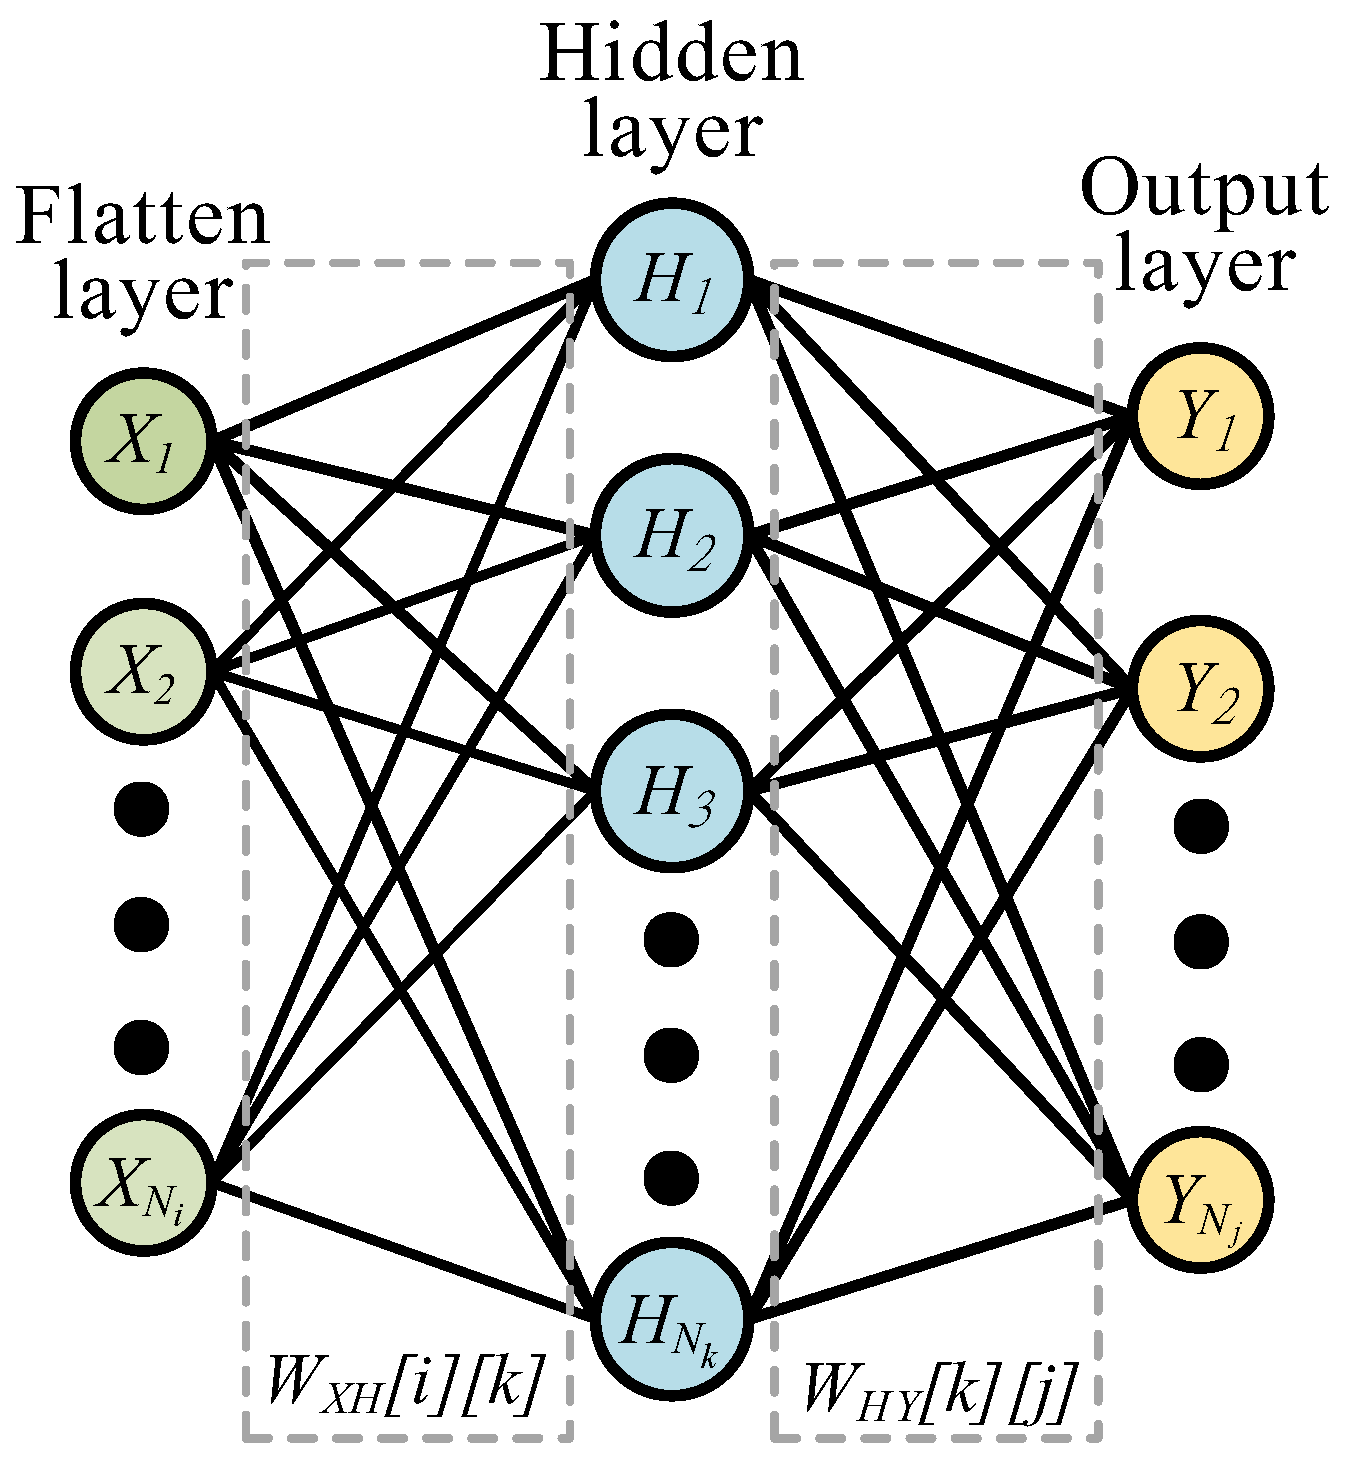
3.2.3. Fully Connected Layer

The fully connected layer is usually located in the traditional neural network model at the tail end of CNN. Its primary function is to transform the image feature matrix extracted by the convolution and pooling layers into a one-dimensional vector, and then the backpropagation operation neural network performs training. Finally, the output layer generates the image classification result. Figure 10 shows the structure of the fully connected layer proposed in this study. If the flatten layer has N i   X neurons, the hidden layer has N k   H neurons, and the output layer has N j Y neurons. Where W X H is the weight of the relationship between the flattened and hidden layers. W H Y is the weight of the relationship between the hidden layer and output layer. X i is the i t h neuron of flatten layer, H k is the k t h neuron of the hidden layer, Y j is the j t h neuron of the output layer. The flatten layer N i is 5120 neuron data, the hidden layer N k is 1000 neuron data, the output layer N j is 4 neuron data. The relationship between the flattened layer and the hidden layer of a fully connected layer is expressed as Equation (7). The relationship between the hidden layer and output layer is expressed as Equation (8).
H k = i = 1 N i X i × W X H [ i ] [ k ] , i = 1 N i , k = 1 N k
Y j = k = 1 N k H k × W H Y [ k ] [ j ] , k = 1 N k , j = 1 N j

4. Experimental Results

4.1. Power Cable PD Signal Measurement and Processing

There are four types of models built in this study, including a normal power cable model (Type I), a power cable outer semi-conducting layer defect model (Type II), a defect model of power cable insulation with impurities (Type III), and a power cable insulation damage defect model (Type IV). The PD signals of the power cable were measured based on three cycles of grid 60 Hz power supply. For each type of PD signal, the sampling time, sampling frequency, and the number of sampling points were 50 ms, 40 ms/s, and 2,000,000, respectively. The ground terminal HFCT of the power cable was connected with a high-speed data capture card to capture PD signals. Figure 11 shows the original PD signals of the power cable.

4.2. SDP Feature Image of Power Cable PD

The efficiency and accuracy of identifying the fault type are related to the performance of signal feature extraction. The feature extraction is the key factor influencing the defect fault diagnosis result. The PD signals of power cable defect models will be measured. The time-domain PD signal waveform is directly transformed by SDP into the feature image of the polar coordinate plane. The SDP feature images of normal and three power cable defect fault types are shown in Figure 12. According to the feature images of power cables in different fault states drawn by SDP, the feature images of different defect fault types show significantly different point coordinate distributions and densities. The image point coordinates of the normal power cable are uniformly distributed and noticeably presented in concentric rings. When the power cable insulation has different defect conditions, the image point coordinates will have varying degrees of nonuniform density distribution. The image point coordinate distribution shape and the point coordinate area distribution at the geometric center of the image show symmetric snowflake-like variations. The above SDP feature image characteristics can be used in CNN for training and identifying the fault types.

4.3. CNN Fault Recognition Result

To implement the power cable fault diagnosis system, the proposed algorithm was developed using MATLAB 2020a. The computer test environment was Intel® Core™i7-9700 CPU@3.0 GHz processor, NVIDIA GeForce RTX 2080 SUPER graphics adapter, and Windows 10 professional 64-bit operating system. The PD sampling was performed for a normal model and three defect fault types of power cables. Meanwhile, each power cable fault type had 300 samples. According to the SDP operation method, 300 SDP feature images were drawn for each type of power cable PD signal; 200 feature images were randomly selected as training samples and validation samples, and 100 feature images were used as test samples. The CNN structure for identifying the power cable fault types proposed in this study comprises three convolution layers, three pooling layers, and one fully connected layer (including the flatten layer, hidden layer, and output layer). Each convolution layer penetrated one 3 × 3 mask and one ReLU activation function, and each pooling layer penetrated one 2 × 2 max pooling. The hyperparameters used in the CNN training period are shown in Table 1.
The CNN model designed in this study was trained and learned by using the collected 800 SDP feature images of power cable fault types as training samples (200 SDP feature images of each type). To verify that the trained CNN model can identify different power cable fault types, 400 SDP feature images different from the training sample images were collected as test samples, with 100 samples for each fault type. Table 2 shows the power cable classification and recognition results. The results show that the proposed method could effectively identify different fault types of power cables, and the recognition accuracy was as high as 98%. Additionally, the recognition result of power cable defect fault types is displayed in a confusion matrix, as shown in Figure 13. Wherein the x-axis is the actual fault type and the y-axis is the predicted fault type. The green and red grids of the confusion matrix represent the number of accurate recognitions and the number of mistakes, respectively. Each fault type’s recognition accuracy and error rates are the green and red values in the whiteish-gray grids on the x-axis. The overall recognition accuracy and error rates are the green and red values in the gray grid in the lower right corner of the confusion matrix, respectively.
The same training sample data and test sample data were compared with Ref. [16], in which the DWT was combined with the chaos theory to obtain the XLPE PD signal feature image, and then the fault type was identified by CNN. The comparison is shown in Table 3. Regarding training and recognition time, DWT + ChaosTheory + CNN required 25 s for training and 0.29 s for recognition. Whereas, SDP+CNN required 23 s for training and 0.3 s for recognition. In terms of accuracy, the accuracy (98%) of SDP+CNN was better than the accuracy (97.5%) of DWT + ChaosTheory + CNN. Therefore, the SDP proposed in this study does not need DWT to filter the PD background noise. It can transform the feature image computing time in Chaos Theory more rapidly and achieve better recognition accuracy.
In the power cable PD measurement environment, the measured PD signals were likely to be disturbed by outside noise. To verify the noise resistance of the proposed method, the original signals were provided with different degrees of signal-to-noise ratio (SNR) white noise. According to Table 3, the recognition accuracy decreased as the noise increased (SNR decreased). If SNR = 10, the proposed method had higher recognition accuracy (95.5%) than DWT + ChaosTheory + CNN (91.5%).

5. Conclusions

This study built a normal and three common insulation defect models of power cables and measured the actual PD phenomenon. It also proposed a power cable fault detection method. To highlight the PD signals, the key feature image was transformed by SDP. The feature image was used as the key to fault diagnosis, and the fault type was identified by CNN. The experimental results show that the recognition accuracy of the proposed method was as high as 98%. The training and recognition times were only 23 s and 0.3 s, respectively. Subsequently, the robustness of the proposed method for actual noise was verified. Different degrees of SNR noise were added to the original PD signals, and the recognition rate was still higher than 95.5%. This proves that the proposed method can obtain good recognition accuracy and interference resistance, and the training and recognition time of power cable fault detection could be saved effectively. The future research directions are described below.
  • Using a hardware circuit to implement the power cable fault diagnosis system will contribute to evaluating the power cable insulation state and preventive diagnosis of faults;
  • Using the proposed method for fault diagnosis of other power equipment to implement advanced maintenance work of power equipment and to enhance the running life and reliability of power systems.

Author Contributions

M.-H.W. conceived the presented idea, and designed; S.-D.L. supervised the findings of this work, planned the experiments, and writing—review and editing; H.-W.S. performed the numerical simulations, and writing—original draft preparation; all authors provided critical feedback and helped shape the research, analysis, and manuscript. All authors have read and agreed to the published version of the manuscript.

Funding

The authors gratefully acknowledge the financial support of the Ministry of Science and Technology of Taiwan, under contract numbers: MOST 110-2221-E-167-008-MY3 and MOST 111-2221-E-167-004.

Conflicts of Interest

The authors declare no conflict of interest.

References

  1. Kessler, O. The importance of partial discharge testing: PD testing has proven to be a very reliable method for detecting defects in the insulation system of electrical equipment and for assessing the risk of failure. IEEE Power Energy Mag. 2022, 18, 62–65. [Google Scholar] [CrossRef]
  2. Firuzi, K.; Vakilian, M.; Darabad, V.P.; Phung, B.T.; Blackburn, T.R. A novel method for differentiating and clustering multiple partial discharge sources using S transform and bag of words feature. IEEE Trans. Dielectr. Electr. Insul. 2017, 24, 3694–3702. [Google Scholar] [CrossRef]
  3. Parrado-Hernández, E.; Robles, G.; Ardila-Rey, J.A.; Martínez-Tarifa, J.M. Robust Condition Assessment of Electrical Equipment with One Class Support Vector Machines Based on the Measurement of Partial Discharges. Energies 2018, 11, 486. [Google Scholar] [CrossRef] [Green Version]
  4. Driessen, A.B.J.M.; Van Duivenbode, J.; Wouters, P.A.A.F. Partial discharge detection for characterizing cable insulation under low and medium vacuum conditions. IEEE Trans. Dielectr. Electr. Insul. 2018, 25, 306–315. [Google Scholar] [CrossRef]
  5. Lu, S.; Chai, H.; Sahoo, A.; Phung, B.T. Condition Monitoring Based on Partial Discharge Diagnostics Using Machine Learning Methods: A Comprehensive State-of-the-Art Review. IEEE Trans. Dielectr. Electr. Insul. 2020, 27, 1861–1888. [Google Scholar] [CrossRef]
  6. Chen, Y.; Hao, Y.; Huang, T.; Xiao, J.; Hui, B.; Chen, Y.; Yang, L.; Li, L. Voltage Equivalence of Partial Discharge Tests for XLPE Insulation Defects. IEEE Trans. Dielectr. Electr. Insul. 2022, 29, 683–692. [Google Scholar] [CrossRef]
  7. Morette, N.; Ditchi, T.; Oussar, Y. Feature extraction and ageing state recognition using partial discharges in cables under HVDC. Electr. Power Syst. Res. 2022, 178, 106053. [Google Scholar] [CrossRef]
  8. Zhou, Y.; Wang, Y.; Wang, W. A Study on the Propagation Characteristics of Partial Discharge in Cable Joints Based on the FDTD Method. IEEE Access 2020, 8, 130094–130103. [Google Scholar] [CrossRef]
  9. Santos, M.G.; Braulio, G.A.; Bernardes, J.V., Jr.; Salles, C.; Milanez, J.R.C.; Bortoni, E.C.; Bastos, G.S. Continuous Partial Discharges Analysis During Automated Thermal Cycle Aging Experiment. IEEE Trans. Energy Convers. 2020, 35, 1989–1992. [Google Scholar] [CrossRef]
  10. Shang, H.; Li, F.; Wu, Y. Partial Discharge Fault Diagnosis Based on Multi-Scale Dispersion Entropy and a Hypersphere Multiclass Support Vector Machine. Entropy 2019, 21, 81. [Google Scholar] [CrossRef] [PubMed]
  11. Polisetty, S.; El-Hag, A.; Jayram, S. Classification of common discharges in outdoor insulation using acoustic signals and artificial neural network. High Volt. 2019, 4, 333–338. [Google Scholar] [CrossRef]
  12. Dobrzycki, A.; Mikulski, S.; Opydo, W. Using ANN and SVM for the Detection of Acoustic Emission Signals Accompanying Epoxy Resin Electrical Treeing. Appl. Sci. 2019, 9, 1523. [Google Scholar] [CrossRef] [Green Version]
  13. Wang, Y.; Zhang, X.; Li, Y.; Li, L.; Gao, J.; Guo, N. Multi-Scale Analysis and Pattern Recognition of Ultrasonic Signals of PD in a Liquid/Solid Composite of an Oil-Filled Terminal. Energies 2020, 13, 366. [Google Scholar] [CrossRef] [Green Version]
  14. Gu, F.; Chen, H.; Chao, M. Application of improved Hilbert-Huang transform to partial discharge signal analysis. IEEE Trans. Dielectr. Electr. Insul. 2018, 25, 668–677. [Google Scholar] [CrossRef]
  15. Peng, X.; Yang, F.; Wang, G.; Wu, Y.; Li, L.; Li, Z.; Bhatti, A.A.; Zhou, C. A Convolutional Neural Network-Based Deep Learning Methodology for Recognition of Partial Discharge Patterns from High-Voltage Cables. IEEE Trans. Power Deliv. 2019, 34, 1460–1469. [Google Scholar] [CrossRef]
  16. Wang, M.H.; Lu, S.D.; Liao, R.M. Fault Diagnosis for Power Cables Based on Convolutional Neural Network with Chaotic System and Discrete Wavelet Transform. IEEE Trans. Power Deliv. 2022, 37, 582–590. [Google Scholar] [CrossRef]
  17. Sachan, S.; Zhou, C.; Wen, R.; Sun, W.; Song, C. Multiple Correspondence Analysis to Study Failures in a Diverse Population of a Cable. IEEE Trans. Power Deliv. 2017, 32, 1696–1704. [Google Scholar] [CrossRef] [Green Version]
  18. Choudhary, M.; Shafiq, M.; Kiitam, I.; Hussain, A.; Palu, I.; Taklaja, P. A Review of Aging Models for Electrical Insulation in Power Cables. Energies 2022, 15, 3408. [Google Scholar] [CrossRef]
  19. Preduș, M.F.; Popescu, C.; Răduca, E.; Hațiegan, C. Study of the Accelerated Degradation of the Insulation of Power Cables under the Action of the Acid Environment. Energies 2022, 15, 3550. [Google Scholar] [CrossRef]
  20. Shirai, T.; Shibata, K.; Takahashi, A.; Mori, K.; Kasashima, N.; Ueno, Y. Method for detecting faults in FFUs using SDP based on audio signal analysis. In Proceedings of the 1996 IEEE Conference on Emerging Technologies and Factory Automation, Kauai, HI, USA, 18–21 November 1996; Volume 1, pp. 243–247. [Google Scholar] [CrossRef]
  21. Shibata, K.; Takahashi, A.; Shirai, T. Fault Diagnosis of Rotating Machinery through visualisation of Sound Signals. Mech. Syst. Signal Process. 2000, 14, 229–241. [Google Scholar] [CrossRef]
  22. Yang, J.; Yan, R. A Multidimensional Feature Extraction and Selection Method for ECG Arrhythmias Classification. IEEE Sens. J. 2021, 21, 14180–14190. [Google Scholar] [CrossRef]
  23. Long, Z.; Zhang, X.; He, M.; Huang, S.; Qin, G.; Song, D.; Tang, Y.; Wu, G.; Liang, W.; Shao, H. Motor Fault Diagnosis Based on Scale Invariant Image Features. IEEE Trans. Ind. Inform. 2022, 18, 1605–1617. [Google Scholar] [CrossRef]
  24. Salehinejad, H.; Colak, E.; Dowdell, T.; Barfett, J.; Valaee, S. Synthesizing Chest X-Ray Pathology for Training Deep Convolutional Neural Networks. IEEE Trans. Med. Imaging 2019, 38, 1197–1206. [Google Scholar] [CrossRef] [PubMed]
  25. Ramon, A.J.; Yang, Y.; Pretorius, P.H.; Johnson, K.L.; King, M.A.; Wernick, M.N. Improving Diagnostic Accuracy in Low-Dose SPECT Myocardial Perfusion Imaging with Convolutional Denoising Networks. IEEE Trans. Med. Imaging 2022, 39, 2893–2903. [Google Scholar] [CrossRef]
  26. Hassanzadeh, T.; Essam, D.; Sarker, R. 2D to 3D Evolutionary Deep Convolutional Neural Networks for Medical Image Segmentation. IEEE Trans. Med. Imaging 2021, 40, 712–721. [Google Scholar] [CrossRef]
  27. DiSpirito, A.; Li, D.; Vu, T.; Chen, M.; Zhang, D.; Luo, J.; Horstmeyer, R.; Yao, J. Reconstructing Undersampled Photoacoustic Microscopy Images Using Deep Learning. IEEE Trans. Med. Imaging 2021, 40, 562–570. [Google Scholar] [CrossRef] [PubMed]
  28. Qiumei, Z.; Dan, T.; Fenghua, W. Improved Convolutional Neural Network Based on Fast Exponentially Linear Unit Activation Function. IEEE Access 2019, 7, 151359–151367. [Google Scholar] [CrossRef]
  29. Huang, Z.; Du, X.; Chen, L.; Li, Y.; Liu, M.; Chou, Y.; Jin, L. Convolutional Neural Network Based on Complex Networks for Brain Tumor Image Classification with a Modified Activation Function. IEEE Access 2020, 8, 89281–89290. [Google Scholar] [CrossRef]
Figure 1. Normal power cable model.
Processes 10 02009 g001
Figure 2. Defective power cable model.
Processes 10 02009 g002
Figure 3. Power cable test process.
Processes 10 02009 g003
Figure 4. Power cable testing platform.
Processes 10 02009 g004
Figure 5. Image principle of SDP analysis.
Processes 10 02009 g005
Figure 6. SDP image of power cable PD signals.
Processes 10 02009 g006
Figure 7. CNN model structure.
Processes 10 02009 g007
Figure 8. Schematic diagram of convolution layer operation.
Processes 10 02009 g008
Figure 9. Schematic diagram of pooling layer operation.
Processes 10 02009 g009
Figure 10. The structure of a fully connected layer.
Processes 10 02009 g010
Figure 11. Power cable PD signals of different insulation defects. (a) Normal power cable; (b) power cable outer semi-conducting layer defect; (c) power cable insulation with impurities; (d) power cable insulation damage defect.
Processes 10 02009 g011
Figure 12. SDP feature images of power cable defect fault types. (a) Normal power cable; (b) power cable outer semi-conducting layer defect; (c) power cable insulation with impurities; (d) power cable insulation damage defect.
Processes 10 02009 g012
Figure 13. Confusion matrix of CNN for fault diagnosis of power cable.
Processes 10 02009 g013
Table 1. Hyperparameters in CNN training period.
Hyperparameter OptionSet Value
Solver for training network (Solver Name)sgdm
Hardware resource for training network (Execution Environment)GPU
Initial learning rate (Initial Learn Rate)0.005
Maximum number of epochs (Max Epochs)100
Size of mini-batch (Mini Batch Size)100
Option for data shuffling (Shuffle)every-epoch
Data to use for validation during training (Validation Data)The same data type of training data
Frequency of network validation (Validation Frequency)10
Table 2. Power cable classification and recognition results of the proposed method.
Fault TypeNormalOuter Semi-Conducting
Layer Defect
Insulation with
Impurities
Insulation Damage
Defect
Test pattern (items)100100100100
Accurate pattern (items)100989896
Recognizing rate (%)100989896
Total recognizing rate (%)98
Table 3. Comparison results of the proposed method and Ref. [16].
Detection MethodFeature Extraction Execution Time
(s)
Training Time
(s)
Test Time
(s)
Recognition Accuracy (%)Ranking
SNR = 0SNR = 15SNR = 10
SDP+CNN651 (800 samples)230.39897.595.51
DWT + Chaos Theory + CNN [16]3488 (800 samples)250.2997.594.591.52
Publisher’s Note: MDPI stays neutral with regard to jurisdictional claims in published maps and institutional affiliations.

