Article

Physicochemical Analysis of Cold Brew and Hot Brew Peaberry Coffee

by
Evan T. Schwarzmann
,
Marlena P. Washington
and
Niny Z. Rao
*
Department of Biological and Chemical Sciences, College of Life Sciences, Thomas Jefferson University, Philadelphia, PA 19144, USA
*
Author to whom correspondence should be addressed.
Processes 2022, 10(10), 1989; https://doi.org/10.3390/pr10101989
Submission received: 16 August 2022 / Revised: 27 September 2022 / Accepted: 28 September 2022 / Published: 2 October 2022
(This article belongs to the Special Issue Total Antioxidant Capacity: Idea, Methods and Limitations)

Abstract

:
Peaberry coffee is the result of a natural mutation of coffee beans, and they make up only about 5–7% of coffee crops. A typical coffee cherry contains two seeds that are developed against each other, resulting in the distinctive half-rounded shape of coffee beans. However, failing to fertilize both ovules of one of the seeds or failure in endosperm development can cause only one of the seeds to develop, resulting in smaller, denser beans with a more domed shape. Peaberry coffees are said to be sweeter, lighter, and more flavorful since the peaberry beans receive all nutrients from the coffee cherry. Due to its exclusive nature, the chemical characteristic of peaberry coffee is not well understood. This study explores the acidities and antioxidant activity of peaberry coffee sourced from multiple regions. Total antioxidant capacity, total caffeoylquinic acid (CQA), total caffeine concentration, and pH levels were evaluated for peaberry coffee extracts prepared by cold and hot brewing methods. Little correlation between antioxidant activity and the concentrations of caffeine and CQA in peaberry beans was shown. Six methods were performed for the characterization of total antioxidant capacity including cyclic voltammetry, ABTS assay, and FRAP assay. Peaberry bean extract demonstrated higher average total caffeine concentrations compared to traditional coffee bean extracts.

1. Introduction

Coffee remains one of the largest global industries with 166.3 million 60 kg bags consumed internationally for the 2020–2021 year [1]. Within the global industry, a specialty coffee market continues to grow providing consumers with access to unique and rare coffee beans [2]. Civet coffee beans are one such variety that is unique because they undergo digestion by the civet cat and are a luxury export of Indonesia with a comparatively high price per pound [3]. While some specialty coffee beans occupy a high price range, market prices for average coffee beans are insufficient to sustain farming operations causing many farms to operate at a loss financially per the Specialty Coffee Association’s Price Crisis Response Initiative [4]. As a result, sustainability, both in specialty and regular coffee production, remains a major focus of the global industry to ensure continued industry growth as predicted. Due to industry growth, peaberry coffee beans, a bean type previously seen as waste, has grown in popularity enabling regular farmers to sell “deformed” beans as specialty coffee to allow for an increase in financial profit and stability.
Research around the peaberry coffee bean is relatively limited compared to general coffee research. Availability is a major limiting factor as roughly 7% of harvested farm crops are identified as peaberry beans [5,6]. Peaberry coffee beans result from the abortion of an ovary by a coffee plant leading to the fertilization and development of only one bean [7]. Furthermore, researchers have identified three factors: unfavorable environmental conditions, incompatibility of parent species, and insufficient pollination, which result in either failure to fertilize one of two ovaries or failure of an ovary to develop into an endosperm [8]. Peaberry is not a genetic mutation and thus cannot be selectively bred by farmers for production or elimination. The primary difference between peaberry and regular coffee beans is the shape and size of the beans with peaberries appearing smaller and rounder compared to regular, flat-sided beans. Prior to the recent economic interest in peaberry coffee, farmers would typically sort peaberries from regular coffee beans and discard them. This was done to maintain even roasting in coffee bean batches since the smaller peaberries roast more quickly. Techniques for the separation of peaberry beans by features such as color and shape for an automated system are under development, while they are currently sorted by hand [9,10]. Despite its recent popularity as a class of specialty coffee in recent years, the physicochemical profile of peaberry coffee extracts has not been fully characterized.
Coffee bean extract is the traditional product of coffee bean fruits which, through extensive research, has been shown to positively impact health. Extracts contain approximately one thousand types of biologically active molecules including caffeine and chlorogenic acid derivatives which are principal compounds [11,12]. Other compounds present in the extract include phenolic compounds, diterpenes, melanoidins, and trigonelline [13]. In isolated studies, caffeine and chlorogenic acid have been shown to have antimicrobial and anti-inflammatory activity, as well as protective effects against neurodegenerative and hepatic diseases [14,15]. Interestingly, chlorogenic acid positively correlates to anticarcinogenic, anti-hypertensive, and anti-diabetic effects [15]. Antioxidant activity further contributes to these beneficial effects by reducing the effects of oxidative stress through the removal of free radicals from bodily systems [16].
A variety of colorimetric assays are frequently used for the determination of total antioxidant capacity (TAC) in food extract samples, including ABTS (2,2 -azinobis(3-ethylbenzothiazoline-6-sulfonic acid) diammonium salt), DPPH (2,2-diphenyl-1-picrylhydrazy), FRAP (Ferric Ion Reducing Antioxidant Power), Folin–Ciocalteu Phenolic, and Flavonoids Assays. Unfortunately, limitations to each assay prevent TAC to be accurately reflected by an individual assay [17]. As a result, assays utilize different mechanisms to quantify antioxidant concentrations, enabling a more complete identification. ABTS assays require the development of an ABTS radical cation through the oxidation of ABTS and measure antioxidant ability to scavenge the radical cation [18]. Radical scavenging ability is determined by quantifying the decolorization of solution from a control. Decolorization assays beyond ABTS include the use of the stable radical DPPH. The scavenging ability of antioxidants is determined by the hydrogen electron transfer of antioxidants to the nitrogen radical of DPPH [19]. FRAP assays measure the reduction in a Fe(III)-TPTZ complex to a Fe(II)-TPTZ complex [20]. This assay measures TAC by analyzing color generation by a reducing agent (antioxidant) and comparing it to a known standard such as chlorogenic acid. The Folin–Ciocalteu assay is a measurement of the reductive capacity of antioxidants through the quantification of total polyphenols. This reduction/oxidation reaction generates color through the oxidation of phenols present reducing phosphotungstic acid and phosphomolybdic acid to tungsten oxide and molybdenum oxide [21,22]. To determine total flavonoid capacity, an aluminum chloride-based assay is used. In this assay, sodium nitrite oxidizes the flavonoid to form an aluminum ion chelation before the complex is treated with a reducing agent forming a radical [23,24].
Beyond the spectrophotometric assays, electrochemical techniques can also be utilized to give insight into TAC. Cyclic voltammetry (CV) is an electrochemical technique used in the analyses of electron transfer reactions in which an applied potential is “swept” through the sample and the change in current is observed as the species undergoes a redox process. This technique looks at the reduction and oxidation processes of a molecular species, of which the gaining and losing of electrons can be determined. When looking at the data obtained from this technique, one can determine any number of different outcomes, such as the number of transferable electrons, the concentration of relevant species, and molecular orbital energetics [25]. Beyond the spectrophotometric assays, electrochemical techniques have garnered attention for their use in correlating and corroborating results of the other assays, especially regarding the focus of this paper, phenolic antioxidants [26,27,28,29,30]. It was determined that looking at the oxidation potential allows for further understanding of antioxidant concentration in samples, where a decrease in potential results in a higher concentration. Using a technique such as CV, the determination of TAC within the food and beverage industry has garnered much interest [31,32,33,34,35,36,37,38,39,40,41,42,43,44,45,46,47,48,49,50]. Through these studies, the characterization of phenolic antioxidants was carried out.
The rich antioxidant content of peaberry coffee is not well-documented [51]. This study aims to perform novel characterization of the physicochemical profile of peaberry coffee from multiple geographic origins using both cold and hot brew methods. Selection of brewing methods was based on general popularity and accessibility. The TAC of cold and hot brew peaberry coffee extracts were assessed using a suite of spectrophotometric assays, including ABTS radical cation decolorization assay, DPPH free radical decolorization assay, FRAP assay, Folin–Ciocalteu assay for total phenolic content (TPC), and total flavonoids content (TFC) assay. Cyclic voltammetry techniques were also employed to further elucidate the TAC of cold and hot brew peaberry coffee extracts.

2. Materials and Methods

2.1. Materials

5-Caffeoylquinic acid (5-CQA, CAS: 327-97-9), Caffeine (CAS: 58-08-02), 2,2 -azinobis(3-ethylbenzothiazoline-6-sulfonic acid) diammonium salt (ABTS, CAS: 30931-67-0), 6-hydroxy-2,5,7,8-tetramethylchroman-2-carboxylic acid (Trolox, CAS: 53188-07-1), Potassium Persulfate (CAS: 7727-21-1), Sodium Acetate Trihydrate (CAS: 6131-90-4), Glacial Acetic Acid (CAS: 64-19-7), Methanol (CAS: 67-56-1), Iron (II) Sulfate Heptahydrate (CAS: 7782-63-0), 2,4,6-Tris(2-pyridyl)-s-triazine (TPTZ, CAS: 3682-35-7), Folin–Ciocalteu Reagent (MDL: MFCD00132625), Sodium Carbonate (CAS: 497-19-8), Caffeic Acid (CAS: 331-39-5), and Standardized 0.1 M and 1 M Sodium Hydroxide (CAS: 1310-73-2) were purchased from Sigma-Aldrich (Milwaukee, WI, USA). 2,2-diphenyl-1-picrylhydrazy (DPPH, CAS: 1898-66-4), Iron (III) Chloride Hexahydrate (CAS: 10025-77-1), and 3,4,5-trihydroxybenzoic acid (Gallic Acid, CAS: 149-91-7) were obtained from Alfa Aesar (Ward Hill, MA, USA). Hydrochloric Acid (CAS: 7647-01-0), Sodium Nitrite (CAS: 7632-00-0), and Aluminium Chloride Hexahydrate (CAS: 7784-13-6) were purchased from Thermo Scientific/Fischer Chemical (Nazareth, PA, USA). HPLC-grade Rutin Hydrate was acquired from Tokyo Chemical Industry (Tokyo, Japan). Britton-Robinson pH 4.10 buffer was manufactured by the Ricca Chemical Company.

2.2. Coffee Bean Preparation

Unroasted Tanzania peaberry coffee beans were purchased from Golden Valley Coffee Roasters located in West Chester, PA, USA. Unroasted peaberry coffee beans from Kenya, Sumatra, and Papua New Guinea were purchased from Sweet Maria’s Home Coffee Roasting Retailer. Green coffee beans samples, 250 g, were roasted until after the first crack in a Hottop coffee roaster (Model No. KN-8828B-2K, HotTop, Hottop Coffee Roaster, Cranston, RI, USA) using the manufacturer’s default temperature-time setting. Beans were ejected from the roaster at a final temperature of 188 °C for a medium roast. Roasts were placed on baking sheets, covered, and allowed to rest in a room temperature environment until the beans external temperature reached 20 °C. The roasted beans were then frozen for a minimum of 12 h at −19 °C [52] before grinding while frozen using a Capresso conical burr coffee grinder (Model No. 560.01, Capresso, Montvale, NJ, USA) at the highest Medium coarseness setting as designated by the manufacturer. Three sieves were used with mesh openings of 500 µm, 710 µm, and 1000 µm to separate and retain particles in increments of <500 µm, 500–710 µm, and 710–1000 µm. Sieved grounds were stored at approximately −18 °C before brewing. Particle sizes ranging from 500 µm to 710 µm were retained for this study [53].

2.3. Coffee Bean Extract Preparation

Cold brew coffee was prepared by placing a sample of 10 g of coffee grounds with 100 mL deionized (DI) water at room temperature in a French press coffee maker for 24 h, after which the coffee solution was obtained by depressing the plunger. Hot brew coffee was prepared by pouring 100 mL DI water at 100 °C over 10 g of coffee grounds in a French press coffee maker. After 6 min, the coffee was obtained by depressing the plunger. All brewed coffee was filtered using a 0.20 μm Acrodisc® Syringe Filter with a Universal PTFE Membrane (Pall, New York, NY, USA) [54]. All coffee samples were stored at 4 °C until analysis. Three batches of coffee were brewed per brewing method per bean origin. The extracts were then combined based on bean origin and brewing method before being analyzed (n = 8).

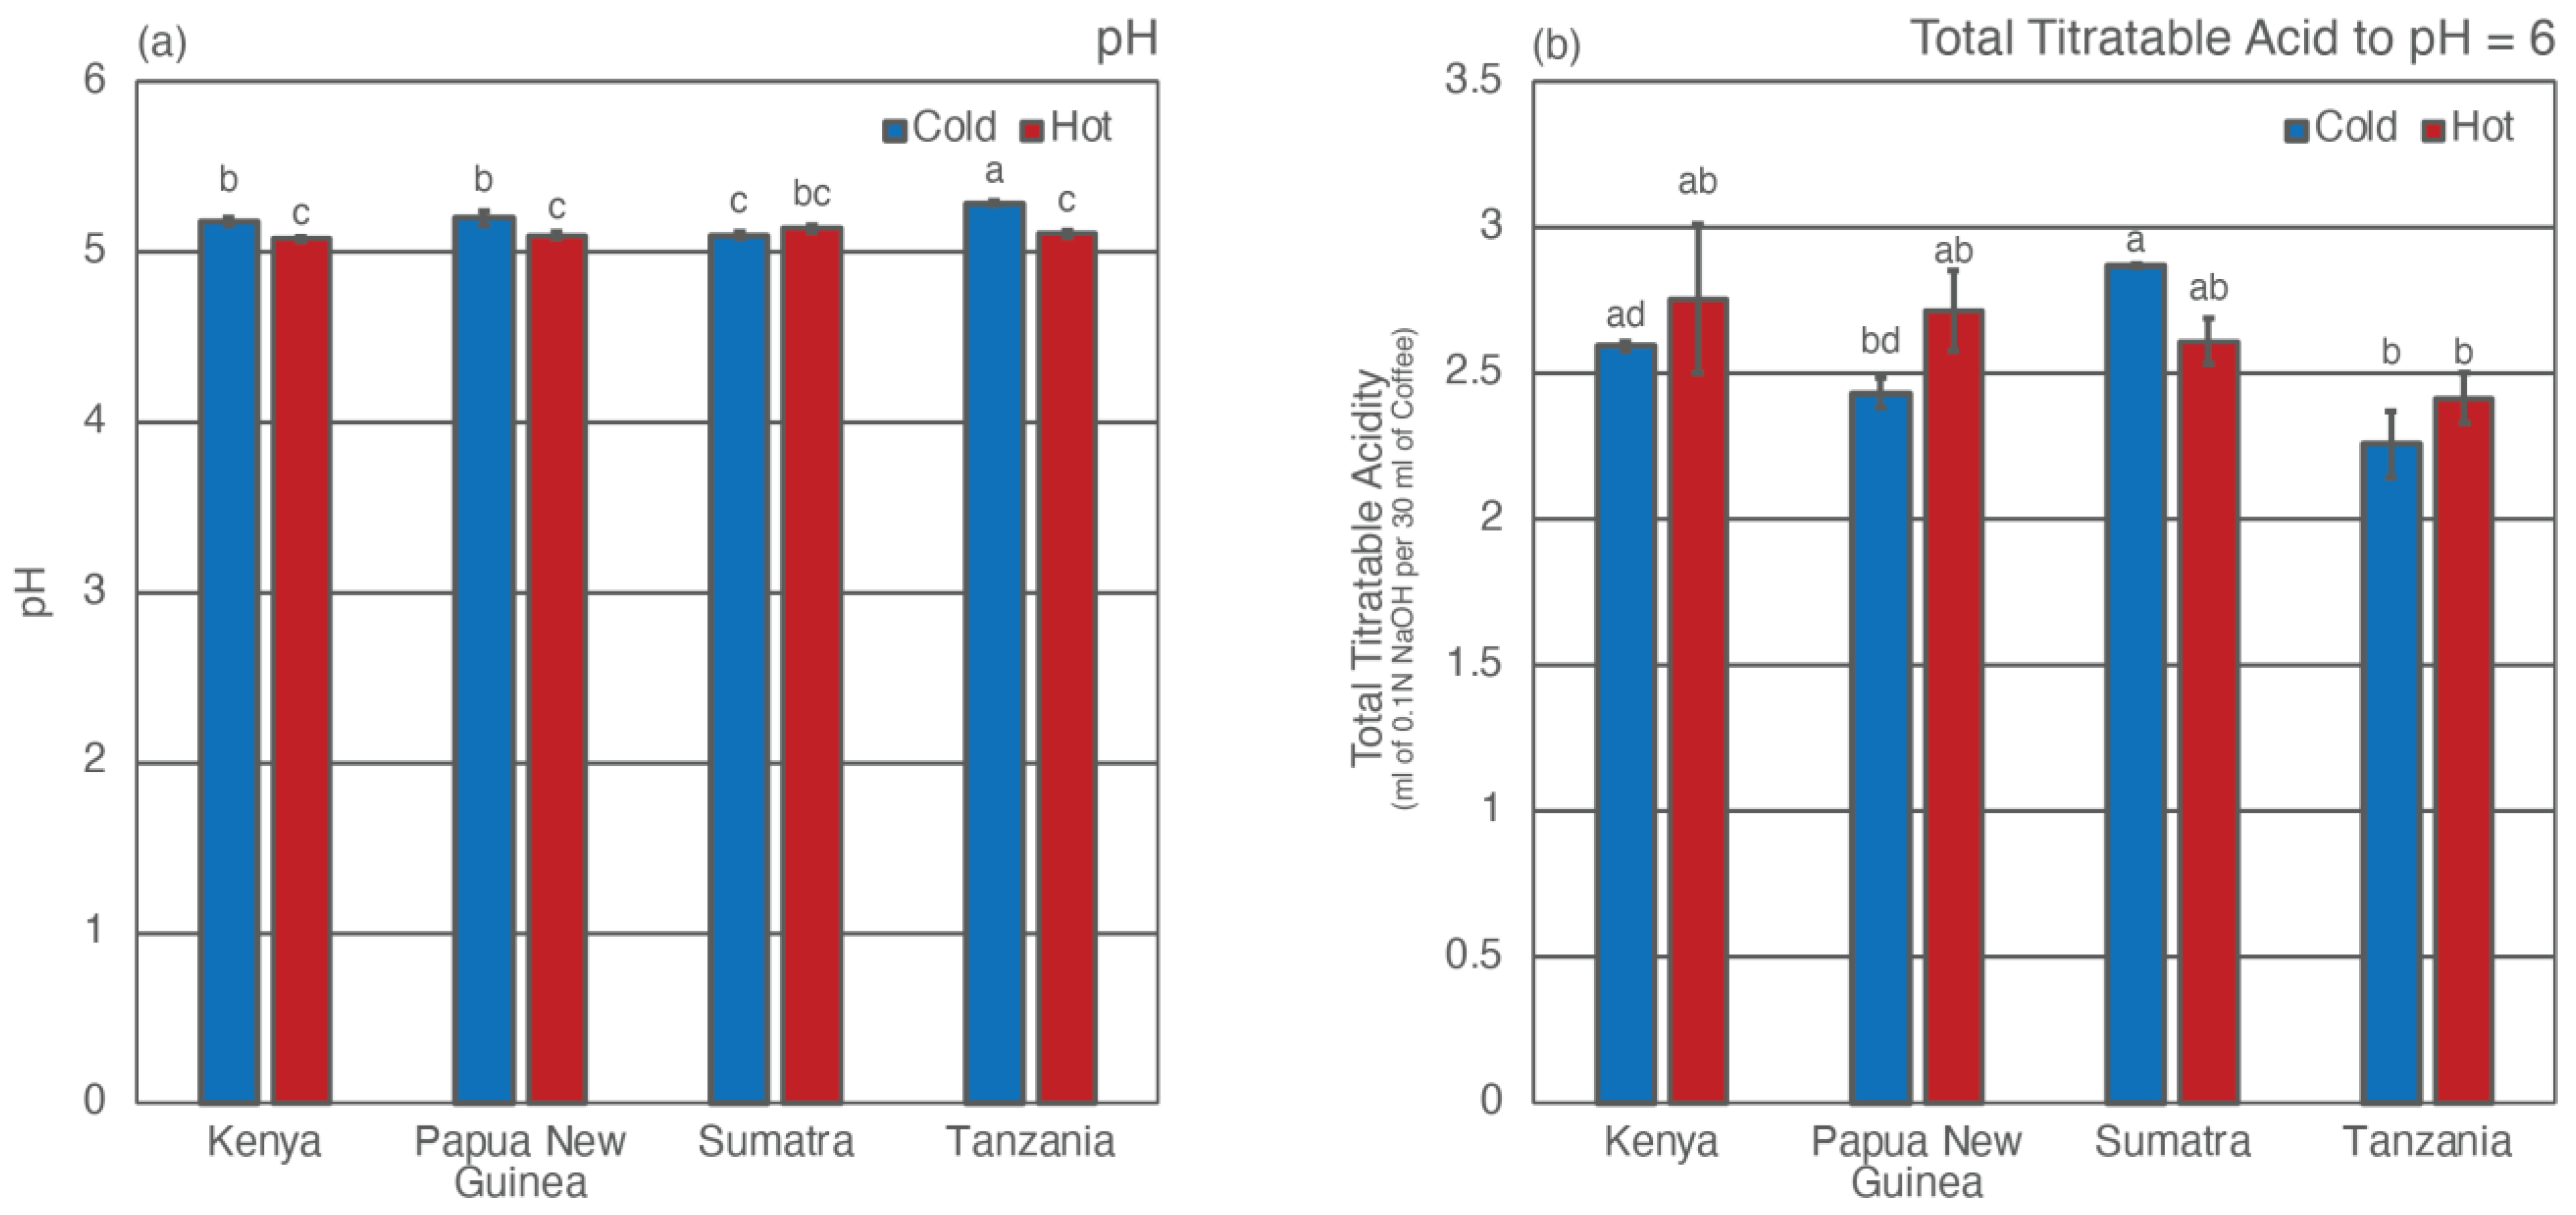
2.4. pH and Total Titratable Acidity

Using a ThermoScientific OrionStar T910 titrator, 30 mL of each coffee brew was analyzed under the same titration method following an initial pH reading using an Orion Ross Sure-Flow pH electrode (Catalog #: 8172BNWP). Titrator was set for two endpoints, pH = 6 and pH = 8, to record the volume of titrant required to reach each pH. The titrant used was standardized 0.1 N NaOH. Three batches of coffee were brewed and analyzed per brewing method per bean origin (n = 3).

2.5. Total Antioxidant Capacity Measurements

2.5.1. ABTS Assay

Methodology for ABTS⁺ radical cation decolorization assay was previously described by Rao et al. [55]. To prepare a stock solution, 7 mM ABTS and 2.45 mM potassium persulfate solutions were combined in a 1:1 ratio and incubated for at least 16 h in a dark room. A working solution was prepared by diluting the stock ABTS radical solution with DI water to obtain an absorbance within the range of 0.8 to 0.9 at 734 nm. Dilution factor in this experiment was roughly 500 µL of stock solution to 20 mL of DI water. A total of 5 µL of extract sample was added to 3000 µL of the working solution in a covered vial. The resulting solution was mixed for 1 min and incubated for 6 min at room temperature. The absorbance of the solution was then measured at 734 nm using a Thermo Scientific Evolution 201 spectrophotometer. Trolox was used as a standard and results were expressed in mmol of Trolox equivalence (TE) per liter of extract. Each extract was analyzed 6 times, n = 6.

2.5.2. DPPH Assay

Methodology for DPPH radical scavenging activity assay was adapted from Odžaković et al. and Muzykievicz et al. [56,57]. In brief, a working solution was prepared by diluting 0.3 mM DPPH methanolic solution with methanol to obtain an absorbance 1.000 ± 0.020 at 517 nm using a Thermo Scientific Evolution 201 spectrophotometer. A 5 µL aliquot of extract was added to 2850 µL of the DPPH working solution. Solution was vortexed for 1 min using a VWR Vortexer 2 before incubation for 30 min in a dark room at room temperature. The absorbance of the solution was then measured at 517 nm. Trolox was used as a standard, and results were expressed in mmol of Trolox equivalence (TE) per liter of extract. Each extract was analyzed 6 times, n = 6.

2.5.3. Folin–Ciocalteu Assay (TPC)

Methodology for the Folin–Ciocalteu method for the determination of total phenolic content (TPC) was adopted from Muzykiewicz et al. [57]. Then, 10% v/v Folin–Ciocalteu reagent and 5 mM Na2CO3 aqueous solutions were prepared and incubated for 1 h prior to the assay. Next, 2700 µL of 5 mM Na2CO3, 150 µL of 10% Folin–Ciocalteu, and 15 µL of extract were mixed and incubated in a dark room. After 30 min, the absorbance of the solution was measured at 750 nm using UV-VIS spectroscopy. Gallic acid was used as standard and results were expressed in mg gallic acid equivalence (GAE) per liter of extract. Each extract was analyzed 6 times, n = 6.

2.5.4. Ferric Ion Reducing Antioxidant Power (FRAP)

Methodology for a reducing capacity assay, ferric ion reducing antioxidant power (FRAP) assay, was adapted from Benzie and Strain, and Muzykievicz et al. [20,57]. To prepare a working solution, 1 part 10 mM TPTZ in 40 mM HCl, 1 part 20 mM iron (III) chloride hexahydrate, and 10 parts 300 mM acetate buffer of pH 3.6 were combined. The acetate buffer was prepared using 3.1 g sodium acetate trihydrate and 16 mL glacial acetic acid into a 1 L volumetric flask and filled with DI water. In a wrapped vial, 3 mL of working solution was mixed with a 100 µL sample (5 µL extract + 95 µL DI water). The absorbance of the solution was measured at 593 nm after 15 min of incubation. Iron (II) sulfate heptahydrate and ascorbic acid were used as standards with results expressed in mg FeSO4 per liter of extract. Each extract was analyzed 6 times, n = 6.

2.5.5. Total Flavonoid Capacity Assay

To assess total flavonoid content, the aluminum chloride method was adapted from Saeed et al. [58]. Then, 150 µL of 0.5 M NaNO2, 3.4 mL of 30% methanol, 150 µL of 0.3 M aluminum chloride hexahydrate, and 50 µL of coffee extract were mixed for one minute. After 5 min, 1 mL of 1 N NaOH was added and mixed for one minute. Sample absorbance was measured at 506 nm using UV-VIS spectroscopy. Rutin was used as a flavonoid standard and results were expressed in mg rutin equivalents/g spent coffee extract. Each extract was analyzed 6 times, n = 6.

2.5.6. Cyclic Voltammetry Analysis

A BASi Epsilon Eclipse Potentiostat was utilized for all cyclic voltammetry (CV) measurements. A three-electrode system was set up consisting of a glassy carbon working electrode, platinum wire counter electrode, and silver-silver chloride reference electrode. The glassy carbon working electrode was polished with 0.05 micron alumina (BASi PK-4 polishing kit), thoroughly cleaned of any residue, and dried before use. Glassware was cleaned and oven-dried overnight before use. All scans were performed at a scan rate of 0.1 V/s with a potential window of −0.2 V to +1.1 V (based on scans of longer ranges showing degradation of the solvent) at room temperature, unless for variable scan rate measurements to determine reversibility in the case of the caffeic acid standard. Deionized (DI) water was used in all aspects of CV analyses. Due to the chemical nature of the antioxidants present in the coffee samples, pH considerations were accounted for whereby all measurements were performed in buffered solutions acting as the supporting electrolyte with a pH of 4.10 (Britton-Robinson Buffer: adjusted to a 0.5 M ionic strength with a composition of water, potassium chloride, phosphoric acid, acetic acid, boric acid, and sodium hydroxide). A CV scan of the buffer supporting electrolyte alone under the conditions and parameters to mimic the coffee samples was obtained and subtracted from all scans to account for reactive species present in the buffer. To aid with the standardization of the measurements, a stock solution (5 mg/L) of caffeic acid was prepared and measured via CV at variable scan rates. A Levich plot was prepared to illustrate the reversible nature of the caffeic acid standard solution before coffee samples were analyzed and produced a goodness-of-fit of 0.99 which can be found in the Supporting Information [25]. Coffee samples analyzed were made to obtain a final concentration of 50 mg/L and analyzed under the same parameters as the caffeic acid standard.

2.6. HPLC Analysis

Methodology for the analysis of standard solutions and coffee extracts was adapted from GL Sciences Technical Note No. 67 using an Agilent 1200 series high-performance liquid chromatography (HPLC) system [59]. The HPLC system is fitted with a Supelco C-18, 5 µm column (15 cm × 4.6 cm) (Supelco, Bellefonte, PA, USA), and a C-18 guard column at 25 °C with a mobile phase mixture of 80% mobile phase A and 20% mobile phase B (A: 95% 2.0 mM phosphoric acid and 5% methanol; B: 95% methanol and 5% 2.0 mM phosphoric acid). The mobile phase flow rate was set at 1.0 mL/min with an injection volume of 10.0 µL. CQA isomers were detected using a diode array detector at 325 nm and 280 nm, respectively. Concentrations of 5-CQA were quantified via standard calibration curves. The retention time of 3-CQA and 4-CQA isomers was determined using standard solutions and quantitation of these two isomers was accomplished using the area of the 5-CQA standard combined with the respective molar extinction coefficients of the other two isomers as reported previously [60,61,62]. Each extract was analyzed 6 times, n = 6.

2.7. Statistical Analysis

Two-way ANOVA analysis with Tukey’s Honest Significant Difference (HSD) test was performed using an R script by Wessa [63]. Differences between means were considered significant at p < 0.05.

3. Results and Discussion

3.1. pH and Total Titratable Acidity

The pH and total titratable acidity (TTA) results are shown in Figure 1. The pH of all samples analyzed ranged from 5.10 (cold brew Sumatra peaberry, and hot brew Papua New Guinea peaberry) to 5.29 (cold brew Tanzania peaberry) (see Table S1). Cold brew Tanzania was observed to have the lowest TTA value (2.26 mL of 0.1 N NaOH per 30 mL of coffee), while cold brew Sumatra was observed to have the highest TTA value (2.87 mL of 0.1 N NaOH per 30 mL of coffee) as shown in Figure 1. The pH of extracts from the present study is comparable to previously reported values of extracts of regular coffee beans [64,65,66]. Although the pH of cold brew extracts was generally higher than that of the hot brew extract, the differences were minimal and agree with previous studies [64,65,66,67]. The total titratable acidity (TTA) of cold brew extracts was found to be lower than that of the hot brew counterparts, in general, suggesting that additional acids or higher concentrations of acids were found in hot brew extracts. This finding is in agreement with a previous study by Rao and Fuller, in which they reported significant differences between hot and cold brew coffee extracts using beans from various regions [64].
Previous studies have attempted to better understand the acidity of coffee by attempting to correlate pH measurements with other chemical and/or sensory metrics and have found that total titratable acidity (TTA) is a better indicator for coffee acidity than pH [64,68,69,70,71,72,73,74]. As detailed by Rao and Fuller, pH values indirectly quantify the amount of deprotonated acids in a sample at the time of analysis, while total titratable acidity (TTA) measures both dissociated and non-dissociated acidic protons in a sample via a neutralization reaction with a strong base [64]. As a result, pH values do not paint a complete picture with regard to acids present in coffee extracts [74]. This work found little correlation between pH and TTA for hot brew coffee (r = −0.46 for TTA titrated to pH 6, r = 0.07 for TTA titrated to pH 8), and a strong correlation between pH and TTA for cold brew coffee (r = −0.9 and −0.95 for TTA titrated to pH 6 and pH 8, respectively; p < 0.05). The lack of correlation between pH and TTA for hot brew is in agreement with findings by Gloess et al. [74]. The strong correlation between pH and TTA in cold brew extracts contradicts previous findings by Rao and Fuller, in which they found that pH of both cold and hot brew correlated poorly with TTA [64]. To date, only one study attempted to identify the acids present in peaberry coffee in organic solvent extracts [75]. The result from the current study implies that the majority of acids present in cold brew extracts of peaberry coffee exist in their deprotonated forms. Moreover, higher TTA values of hot brew extracts indicated that additional non-deprotonated acids were extracted using hot brew methods than cold brew methods, suggesting that the solubility of these acids is low at low temperatures and can only be extracted more readily with high water temperature.

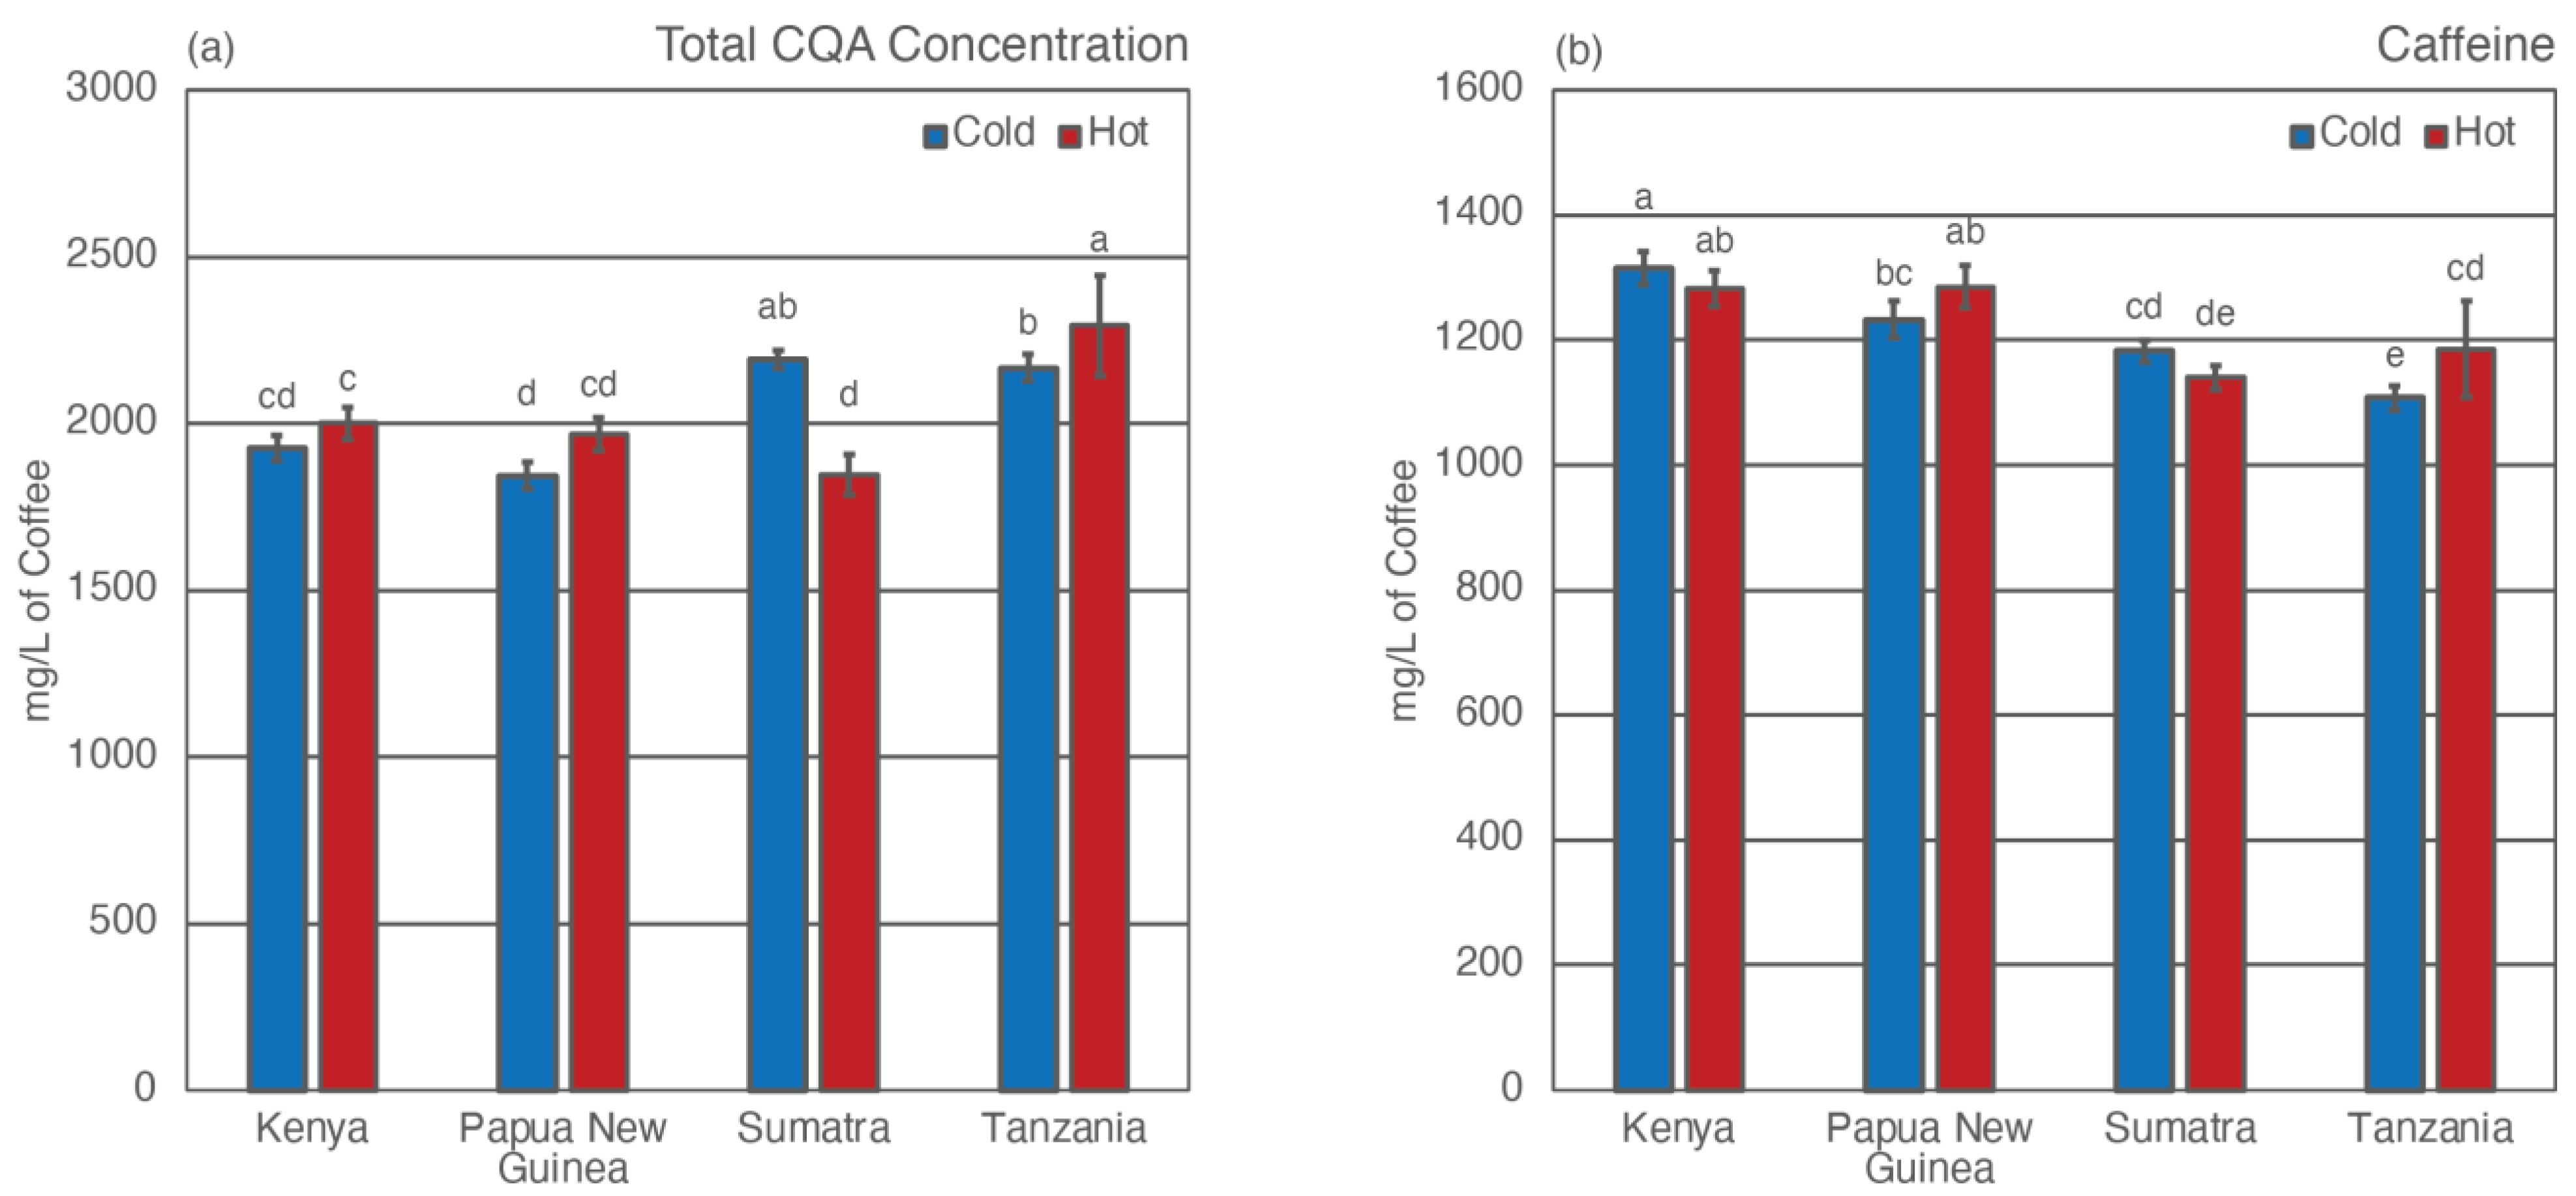
3.2. Total Caffeine and CQA Concentrations

The chlorogenic acid concentrations of both cold and hot brew extracts of the peaberry coffee included the three major isomers of caffeoylquinic acid (CQA), namely, 5-CQA, 4-CQA, and 3-CQA. The total CQA concentration ranged from 1845 mg per liter of coffee to 2294 mg per liter of coffee (see Table S2). As shown in Figure 2, the Tanzania peaberry hot brew extract was found to have the highest CQA concentration while Papua New Guinea cold brew extract was found to have the lowest CQA concentration. Cordoba et al. reported higher levels of 5-CQA and 4-CQA concentration in cold brew extracts of Columbian coffee made from an immersion method compared to extracts made from the hot brew French press method [67]. However, Rao et al. reported comparable CQA concentrations among cold and hot brew Columbian coffee extracts [55]. Previous studies also reported that CQA concentration of the cold brew extracts varied with bean origin [64,76]. The data from this work indicates that the CQA concentrations of peaberry beans also vary with the bean origin. Data reported in the current study is not indicative of a consistent correlation between total CQA concentration and brewing methods in peaberry beans.
The caffeine concentration of cold and hot brew extract of the peaberry coffee ranged from 1108 mg per liter of coffee to 1315 mg per liter of coffee (see Table S2). Kenya cold brew extract was observed to have the highest caffeine concentration, while Tanzania cold brew extract was found to have the lowest caffeine concentration (see Figure 2). In general, the caffeine concentrations in the cold brew extracts of peaberry coffee were found to be comparable to those in the hot brew extracts, in agreement with recent studies [55,66,67,76,77,78,79]. Variation of caffeine content with bean origin has been reported previously [80,81,82,83,84]. Caffeine concentrations from previous studies of regular coffee beans using similar brewing methods ranged from 960 mg/L [55] to 1250 mg/L [85] for cold brew extracts [67,76,83], and 520 mg/L [85] to 1140 mg/L [77] for French press hot brew extracts [55,67,83]. Caffeine concentrations in peaberry coffee reported in the current study are higher than previously reported values, hinting at the possibility that peaberry coffee beans may have higher caffeine content than regular beans.

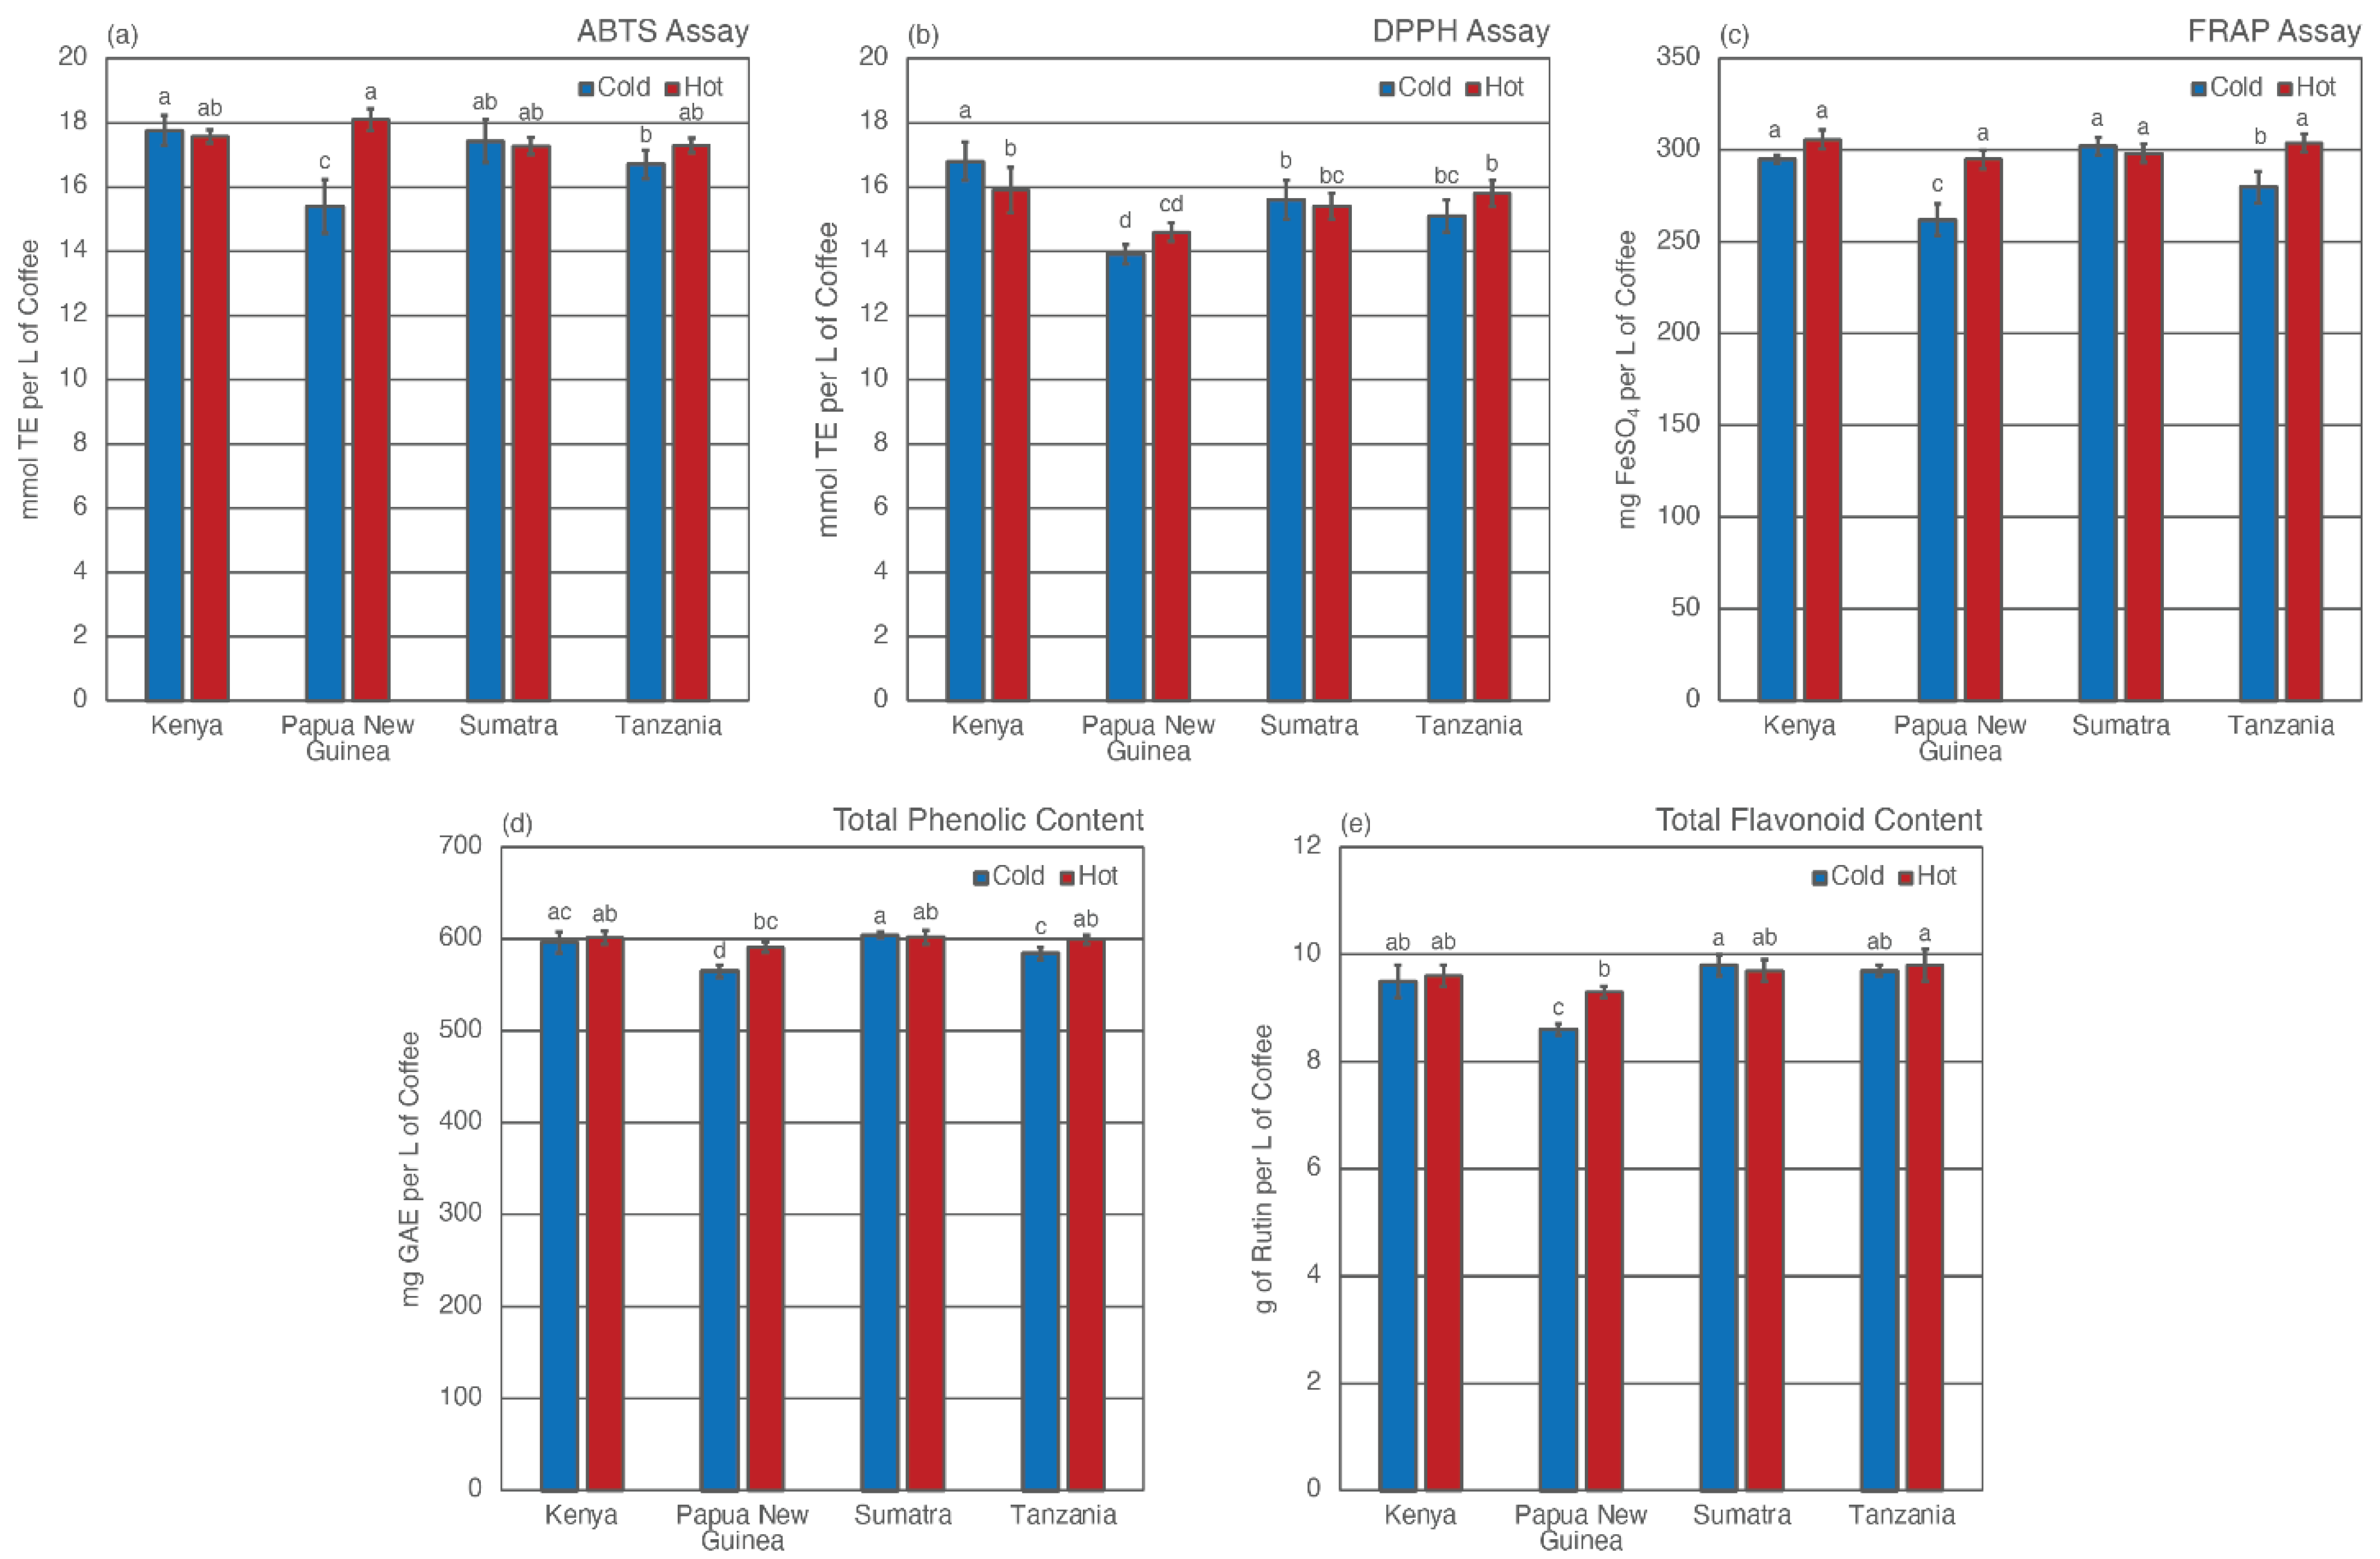
3.3. Total Antioxidant Capacity (TAC)

The total antioxidant capabilities (TAC) of cold and hot extracts of peaberry coffee from multiple origins are shown in Figure 3. The TAC of coffee has been studied extensively using various methods [86,87]. However, there is no universal method to quantify TAC accurately [17,88]. The free radical scavenging activities were assessed using ABTS and DPPH assays. The extracts’ ability to reduce Fe3+ ions was evaluated using FRAP (Ferric Reducing Antioxidant Power) assay. Total phenolic content (TPC) was assessed using the Folin-Ciocalteau assay. The basic mechanism of the Folin–Ciocalteu assay is an oxidation/reduction reaction, and can, therefore, be considered a metric for antioxidant activities. Flavonoids are a group of phenolic compounds with antioxidant activities [89,90]. The total flavonoid content (TFC) was assessed as an additional TAC indicator. In all five assays, Papua New Guinea peaberry cold brew extract was found to have the lowest TAC values, while Kenya peaberry hot brew extract was observed to have relatively high TAC values. Direct comparison of TAC values among studies is somewhat difficult due to a lack of standardized TAC testing methods [17]. The ABTS values from this study are comparable to the ABTS values of cold brew extracts previously reported by Rao and Fuller, in which the ABTS values for cold brew extract ranged from 13.36 mmol of Trolox equivalence (TE)/L to 17.45 mmol TE/L [64], whereas ABTS values from this study ranged from 15.39 mmol TE/L to 18.10 mmol TE/L (see Table S3). The DPPH values from the current study are also higher than those previously reported by Milek et al. The values from this study ranged from 15.39 mmol TE/L to 16.84 mmol TE/L (see Table S3), whereas values reported by Milek et al. ranged from 10.12 mmol TE/L to 11.74 mmol TE/L [91]. It is worth noting that Kenya coffee extracts exhibited high DPPH values in the current study, similar to the finds from Milek et al. [91].
In general, results from the present study showed that the differences in TAC values between cold brew and hot brew peaberry coffee extracts were relatively small and there was no conclusive evidence to suggest that brewing temperature strongly impacted the TAC values of peaberry coffee extracts (see Figure 3). Hot brew methods have been shown to have higher radical scavenging activities than cold brew methods [64,65,66,76]. However, a study by Kang et al., showed that cold brew coffee extracted using a steeping method at 20 °C had higher ABTS values than the hot brew extracts studied [92]. While studies of TPC extraction from other botanicals have demonstrated that the TPC values were sensitive to extraction temperature [93,94,95,96], the effect of brewing temperature on the phenolic content of coffee extracts was somewhat disputable. While some studies reported a relatively high concentration of phenolic compounds in hot brew extracts [53,76], other studies observed that cold brew methods were more effective at the extraction of phenolic compounds [66,92]. Results from this work showed that TPC values were somewhat insensitive to extraction temperature, in agreement with a previous study by Bilge, in which the author noted that the TPC values for cold brew and French press coffee extracts were similar [65]. Muzykiewicz-Szymańska et al., also noted that some cold brew extracts exhibited higher radical scavenging activities and iron reducing power (FRAP) than their hot brew counterparts and concluded that it might be difficult to fully assess how brewing temperature affects the extraction of antioxidants from coffee [66].
Previous studies by Vignoli et al. reported significant correlations between TPC values and ABTS, DPPH, and FRAP measurements [97,98]. A study by Sánchez-Gonzálex et al., also reported that TPC values correlated strongly with ABTS and FRAP values. Similar correlations were observed from data collected from this work. The Pearson correlation coefficients between TPC values and ABTS, DPPH, and FRAP were 0.82 (p < 0.05), 0.74 (p < 0.05), and 0.97 (p < 0.05), respectively. The TPC values were determined by Folin-Ciocalteau assay, the basic mechanism of which is an oxidation-reduction reaction. The strong correlations between TPC values and other AA methods suggest that the phenolic compounds are the major contributor to the antioxidant activities of peaberry coffee extracts and are also involved in radical scavenging and exhibit iron-reducing power. Additionally, TFC values also correlated with TPC (r = 0.87, p < 0.05) and FRAP (r = 0.80, p < 0.05). Since TFC measures flavonoids, a class of phenolic compounds, a high correlation between TFC and TPC was expected. The significant correlation between TFC and FRAP, in conjunction with the lack of strong correlations between TFC and radical scavenging AA assays, implied that the dominant antioxidant activity mechanism of flavonoids in peaberry coffee extract was likely a redox reaction [17].
Coffee extracts with high caffeine content have been noted to have high antioxidant activities [97,98,99,100]. Strong correlations between caffeine concentrations and TAC methods were not observed in this study, however, suggesting that caffeine was not a major contributor to the AA of peaberry coffee extracts. Moreover, the CQA concentrations did not exhibit strong correlations with any TAC methods. Rao and Fuller previously reported that 5-CQA concentration positively correlated with ABTS values for cold brew coffee extracts [64]. No significant correlations were observed in this study between TAC methods and CQA concentrations regardless of the brewing temperature. This suggested that at low extraction temperatures, CQAs are not the chemical species that contribute to the antioxidant activities of peaberry coffee extracts. There is an abundance of additional chemical species highly soluble at low extraction temperature present in peaberry coffee. The results from current work also suggest that peaberry coffee beans contain a variety of bioactive compounds with a wide range of solubility.
The geographical origins of the coffee beans have been shown to affect the concentration of bioactive compounds [51,53,64,65,66,84,101]. Other factors, such as growing conditions [102], agricultural practices [103,104], processing [105,106], storage [107], and genetic varietals [108], may also impact the physicochemical profile of the coffee extract.

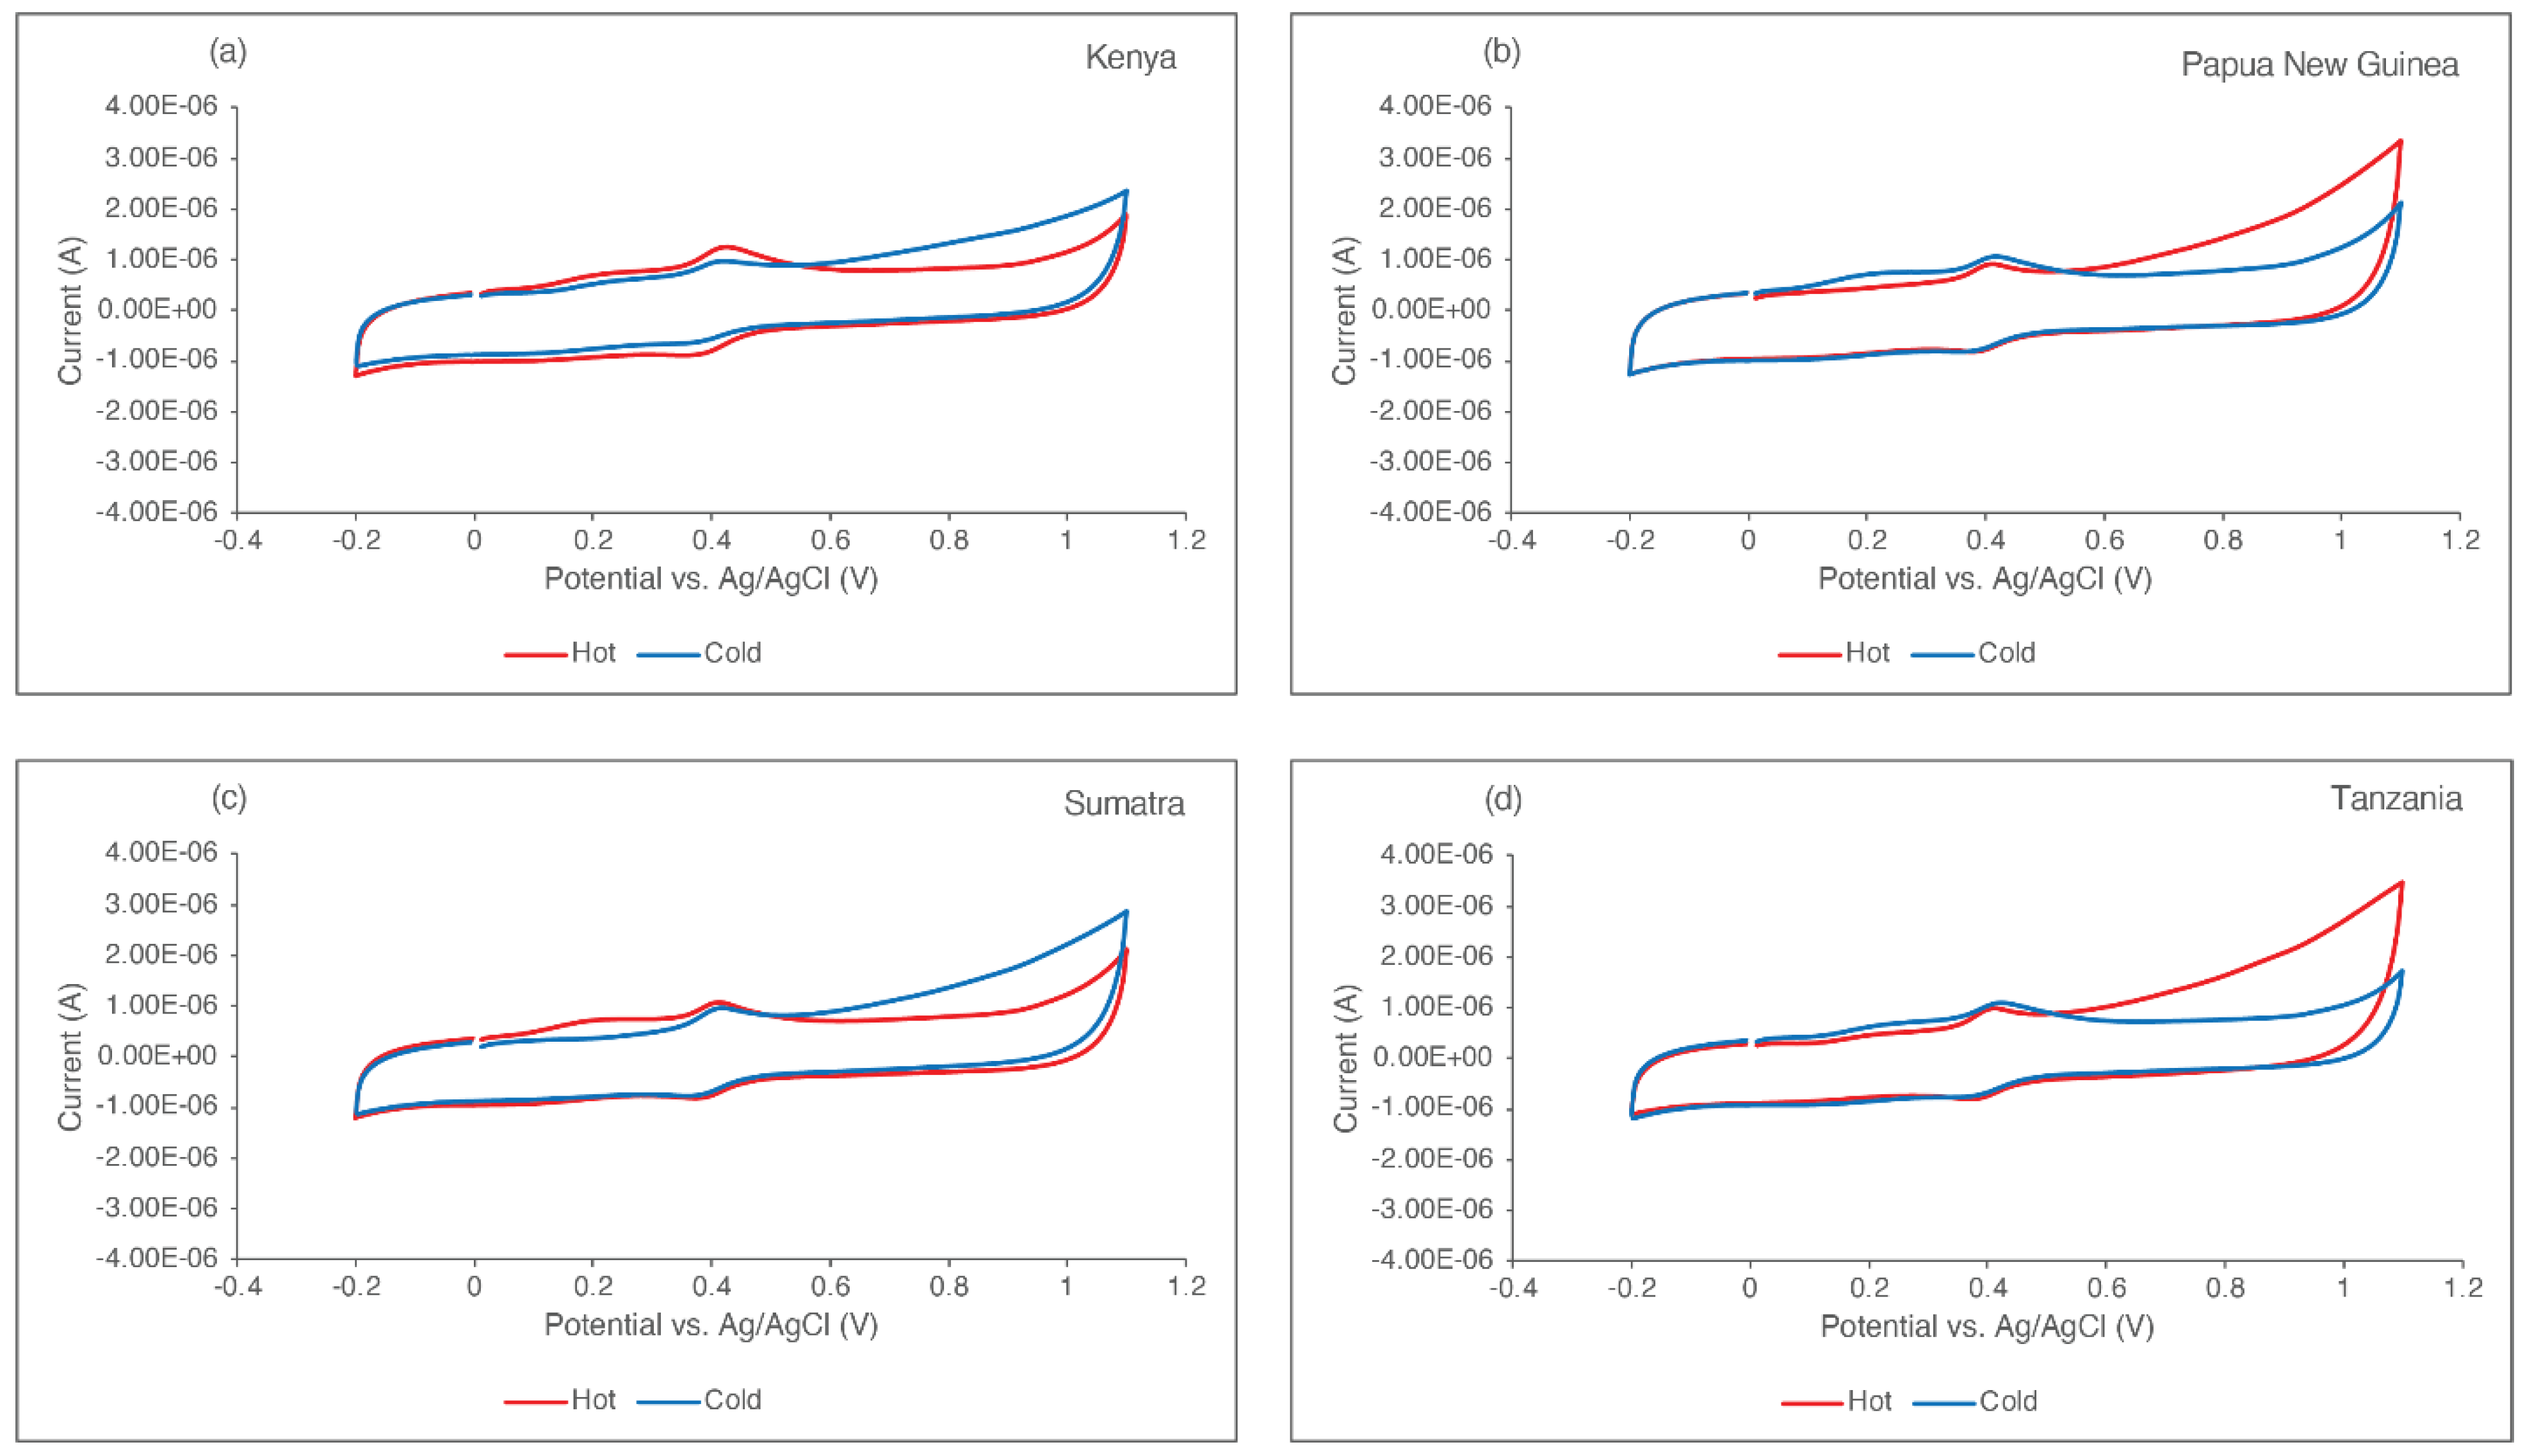
3.4. Cyclic Voltammetry

Cyclic voltammograms of cold and hot extracts of peaberry coffee from the four global regions can be seen in Figure 4, with redox data seen in Table 1. The voltammograms feature distinct reversible waves with an average redox potential (E1/2) of 0.407 and 0.406 V vs. Ag/AgCl for cold and hot extracts, respectively. The reversible nature is due to the two-electron redox process of key diphenolic antioxidants, such as caffeic and chlorogenic acid to their quinone forms. These values are in good agreement with similar studies performed by Yildirim et al., Kilmartin and Hsu, Ziyatdinova et al., Juárez-Gómez et al., Yardim, Takahashi et al. 2020, Pilipczuk et al., and Oliveira-Neto et al. with coffee. Similar work on phenolic antioxidants in different beverages of varying pH values found an increase in pH by 1 will cause the potential to decrease by 0.035 V [27,31,32,33,34,38,40,41,43,44,45,48,49,109,110,111]. Despite the differences in pH within the different studies, the values presented here are within the range of values reported elsewhere.
The average E1/2 of 0.407 and 0.406 V vs. Ag/AgCl for cold and hot extracts, respectively, are slightly higher than the E1/2 value for the standard caffeic acid solution studied of 0.374 V vs. Ag/AgCl with a buffered solution. The difference can be attributed to a variety of possibilities. One such possibility is the phenolic antioxidants within the coffee extracts are undergoing a structural change during the CV scan from the presence of hydroxyl groups on the aromatic ring to quinones. With these changes to multiple substances, the stability of the quinone is called into question, which results in very slight differences in potential, current, and reversibility owing to the slight shouldering within the traces seen in Figure 4. Another possibility is the radical species formed during the redox processes of the antioxidants can cause other reactions resulting in the shouldering seen as byproduct contamination or even decomposition within the trace. Lastly, the change in potential between caffeic acid and the coffee extracts could be the result of particulates within the coffee extracts of which the caffeic acid standard would not be assumed as a suspended solution, which can cause changes in resistance during the scans.
The redox data gives a strong correlation to the data from the spectrophotometric assays. As seen in Figure 3 for the ABTS and DPPH assays, coffee extracts from the four regions behaved similarly when looking at the anodic current values. The same pattern is seen where the higher anodic current corresponds to a higher TAC value, of which the same trend is seen in the assays with Kenya being highest and Papua New Guinea being lowest. This similarity is manifested in the CV data due to the structure of the phenolic antioxidants, specifically caffeic and chlorogenic acids, where the stabilization of the quinone formed during the redox process due to electron delocalization and the donation of hydrogen to act as radical scavengers is seen [34,112]. When comparing brewing temperatures, there is no conclusive evidence that temperature had an impact on the TAC, as the values presented do not show measurable differences. This correlates to the results of the TAC assays mentioned earlier.

4. Conclusions

Peaberry coffee has been gaining popularity in recent years. Originally considered a defect, coffee producers have been marketing peaberry coffee as flavorful with a complex aroma and sweeter taste. To date, the physicochemical profile and antioxidant activity of peaberry coffee extracts have not been reported. Results from the current work demonstrated peaberry coffee extracts contain higher levels of caffeine than regular coffee reported in the literature. Comparisons of hot and cold brewing techniques demonstrated that cold brew peaberry coffee extracts have comparable pH and generally lower titratable acidity than their hot brew counterparts. However, the current work showed no significant difference in total antioxidant capacity between hot and cold brew extracts. The total phenolic content (TPC) of peaberry coffee extracts was observed to have a strong correlation with other total antioxidant capacities (TAC) assays, suggesting that the phenolic compounds in peaberry extracts have different modes of antioxidant activity mechanism. Moreover, the current work found that the TAC values of peaberry coffee extracts did not correlate to either caffeine concentration or CQA concentration, indicating that neither compounds were a major contributor to the antioxidant activities of peaberry coffee extract. While CV data did show expected two-electron reversibility of the phenolic antioxidants present in coffee, it did not show a significant difference in TAC between cold and hot brew peaberry coffee extracts, as further noted by TAC assay data. CV studies also resulted in the corroboration of ABTS and DPPH studies for TAC based on the different regions studied for peaberry coffee origin with Kenya having the highest TAC and Papua New Guinea having the lowest. In general, peaberry coffee is a plentiful source of antioxidants independent of brewing style.

Supplementary Materials

The following supporting information can be downloaded at: https://www.mdpi.com/article/10.3390/pr10101989/s1, Table S1: Physicochemical characteristics of cold and hot brew peaberry coffee samples from four regions; Table S2: 5-CQA, 4-CQA, 3-CQA, total CQA, and caffeine concentration of cold and hot brew peaberry coffee samples from four regions; Table S3: Antioxidant activities, total phenolic content (TPC), and total flavonoid content (TFC) of cold and hot brew peaberry coffee samples from four regions.

Author Contributions

Conceptualization, N.Z.R., E.T.S. and M.P.W.; data curation, E.T.S.; formal analysis, N.Z.R., E.T.S. and M.P.W.; investigation, N.Z.R., E.T.S. and M.P.W.; methodology, E.T.S. and M.P.W.; project administration, N.Z.R.; writing—original draft, N.Z.R., E.T.S. and M.P.W.; writing—review and editing, N.Z.R., E.T.S. and M.P.W. All authors have read and agreed to the published version of the manuscript.

Funding

This work was supported by Thomas Jefferson University and in part by the Improving Food Quality 2019-67018-29187/1018488 from the USDA National Institute of Food and Agriculture.

Data Availability Statement

Not applicable.

Acknowledgments

The authors would like to thank our friends at Golden Valley Coffee Roasters in West Chester, Pennsylvania for their constant support. The authors would also like to thank Brian G. Yust for his insightful discussions and suggestions. NZR would like to thank Mark Shapiro for catalyzing this work. Publication made possible in part by support from the Thomas Jefferson University Open Access Fund.

Conflicts of Interest

The authors declare no conflict of interest.

References

  1. Trade Statistics Tables, International Coffee Organization. 2021. Available online: https://www.ico.org/trade_statistics.asp?section=Statistics (accessed on 24 June 2022).
  2. National Coffee Association. NCA-SCA 2022 Consumption Report; National Coffee Association: New York, NY, USA, 2022. [Google Scholar]
  3. D’Cruze, N.; Toole, J.; Mansell, K.; Schmidt-Burbach, J. What is the true cost of the world’s most expensive coffee? Oryx 2014, 48, 170–171. [Google Scholar] [CrossRef] [Green Version]
  4. Price Crisis Response Initiative, SCA Publishes PCR Summary of Work and Recommendations, The Specialty Coffee Association. 2020. Available online: https://sca.coffee/sca-news/news/price-crisis-summary-of-work (accessed on 1 August 2022).
  5. Suhandy, D.; Yulia, M. Peaberry coffee discrimination using UV-visible spectroscopy combined with SIMCA and PLS-DA. Int. J. Food Prop. 2017, 20, S331–S339. [Google Scholar] [CrossRef]
  6. Suhandy, D.; Yulia, M. Kusumiyati Chemometric quantification of peaberry coffee in blends using UV–visible spectroscopy and partial least squares regression. In AIP Conference Proceedings; AIP Publishing LLC: Melville, NY, USA, 2018; Volume 2021, p. 060010. [Google Scholar] [CrossRef]
  7. Ram, A.S.; Sreenivasan, M.S.; Ramaiah, P.K. A study of peaberry development: Its implications in coffee breeding. J. Coffee Res. 1990, 20, 69–76. [Google Scholar]
  8. Yilma, A.; Kufa, T. Coffee Peaberry as A Potential Seed Source for Production. Int. J. Res. Stud. Agric. Sci. 2020, 7, 30–35. [Google Scholar]
  9. Gope, H.L.; Fukai, H. Peaberry and normal coffee bean classification using CNN, SVM, and KNN: Their implementation in and the limitations of Raspberry Pi 3. AIMS Agric. Food 2022, 7, 149–167. [Google Scholar] [CrossRef]
  10. Gope, H.L.; Fukai, H. Normal and peaberry coffee beans classification from green coffee bean images using convolutional neural networks and support vector machine. Int. J. Comput. Inf. Eng. 2020, 14, 189–196. Available online: https://publications.waset.org/10011255/normal-and-peaberry-coffee-beans-classification-from-green-coffee-bean-images-using-convolutional-neural-networks-and-support-vector-machine (accessed on 1 August 2022).
  11. Bhandarkar, N.S.; Brown, L.; Panchal, S.K. Chlorogenic acid attenuates high-carbohydrate, high-fat diet–induced cardiovascular, liver, and metabolic changes in rats. Nutr. Res. 2018, 62, 78–88. [Google Scholar] [CrossRef]
  12. Cano-Marquina, A.; Tarín, J.J.; Cano, A. The impact of coffee on health. Maturitas 2013, 75, 7–21. [Google Scholar] [CrossRef]
  13. De Melo Pereira, G.V.; de Carvalho Neto, D.P.; Magalhães Júnior, A.I.; do Prado, F.G.; Pagnoncelli, M.G.B.; Karp, S.G.; Soccol, C.R. Chemical composition and health properties of coffee and coffee by-products. Adv. Food Nutr. Res. 2020, 91, 65–96. [Google Scholar] [CrossRef]
  14. Depaula, J.; Farah, A. Caffeine Consumption through Coffee: Content in the Beverage, Metabolism, Health Benefits and Risks. Beverages 2019, 5, 37. [Google Scholar] [CrossRef] [Green Version]
  15. Farah, A.; Lima, J.D.P. Consumption of Chlorogenic Acids through Coffee and Health Implications. Beverages 2019, 5, 11. [Google Scholar] [CrossRef] [Green Version]
  16. Pizzino, G.; Irrera, N.; Cucinotta, M.; Pallio, G.; Mannino, F.; Arcoraci, V.; Squadrito, F.; Altavilla, D.; Bitto, A. Oxidative Stress: Harms and Benefits for Human Health. Oxid. Med. Cell. Longev. 2017, 2017, 8416763. [Google Scholar] [CrossRef]
  17. Prior, R.L.; Wu, X.; Schaich, K. Standardized Methods for the Determination of Antioxidant Capacity and Phenolics in Foods and Dietary Supplements. J. Agric. Food Chem. 2005, 53, 4290–4302. [Google Scholar] [CrossRef]
  18. Re, R.; Pellegrini, N.; Proteggente, A.; Pannala, A.; Yang, M.; Rice-Evans, C. Antioxidant activity applying an improved ABTS radical cation decolorization assay. Free Radic. Biol. Med. 1999, 26, 1231–1237. [Google Scholar] [CrossRef]
  19. Kedare, S.B.; Singh, R.P. Genesis and development of DPPH method of antioxidant assay. J. Food Sci. Technol. 2011, 48, 412–422. [Google Scholar] [CrossRef] [PubMed] [Green Version]
  20. Benzie, I.F.F.; Strain, J.J. The ferric reducing ability of plasma (FRAP) as a measure of “antioxidant power”: The FRAP assay. Anal. Biochem. 1996, 239, 70–76. [Google Scholar] [CrossRef] [PubMed] [Green Version]
  21. Lamuela-Raventós, R.M. Folin-Ciocalteu method for the measurement of total phenolic content and antioxidant capacity. In Measurement of Antioxidant Activity and Capacity: Recent Trends and Applications; Apak, R., Capanoglu, E., Shahidi, F., Eds.; John Wiley & Sons: Hoboken, NJ, USA, 2017; pp. 107–116. [Google Scholar]
  22. Mikołajczak, N.; Tańska, M.; Ogrodowska, D. Phenolic compounds in plant oils: A review of composition, analytical methods, and effect on oxidative stability. Trends Food Sci. Technol. 2021, 113, 110–138. [Google Scholar] [CrossRef]
  23. Shraim, A.M.; Ahmed, T.A.; Rahman, M.; Hijji, Y.M. Determination of total flavonoid content by aluminum chloride assay: A critical evaluation. LWT 2021, 150, 111932. [Google Scholar] [CrossRef]
  24. Mekonnen, A.; Desta, W. Comparative study of the antioxidant and antibacterial activities of Rumex abyssinicus with commercially available Zingiber officinale and Curcuma longa in Bahir Dar city, Ethiopia. Chem. Biol. Technol. Agric. 2021, 8, 1–11. [Google Scholar] [CrossRef]
  25. Bard, A.J.; Faulkner, L.R. Methods involving forced convection-hydrodynamic methods. In Electrochemical Methods: Fun-Damentals and Applications, 2nd ed.; John Wiley & Sons: Hoboken, NJ, USA, 2001; pp. 331–367. [Google Scholar]
  26. Chevion, S.; Roberts, M.A.; Chevion, M. The use of cyclic voltammetry for the evaluation of antioxidant capacity. Free Radic. Biol. Med. 2000, 28, 860–870. [Google Scholar] [CrossRef]
  27. Kilmartin, P.A. Electrochemical Detection of Natural Antioxidants: Principles and Protocols. Antioxid. Redox Signal. 2001, 3, 941–955. [Google Scholar] [CrossRef] [PubMed] [Green Version]
  28. He, J.-B.; Yuan, S.-J.; Du, J.-Q.; Hu, X.-R.; Wang, Y. Voltammetric and spectral characterization of two flavonols for assay-dependent antioxidant capacity. Bioelectrochemistry 2009, 75, 110–116. [Google Scholar] [CrossRef]
  29. Głód, B.K.; Kiersztyn, I.; Piszcz, P. Total antioxidant potential assay with cyclic voltammetry and/or differential pulse voltammetry measurements. J. Electroanal. Chem. 2014, 719, 24–29. [Google Scholar] [CrossRef]
  30. Ma, X.; Yang, H.; Xiong, H.; Li, X.; Gao, J.; Gao, Y. Electrochemical Behavior and Determination of Chlorogenic Acid Based on Multi-Walled Carbon Nanotubes Modified Screen-Printed Electrode. Sensors 2016, 16, 1797. [Google Scholar] [CrossRef] [Green Version]
  31. Kilmartin, P.A.; Zou, H.; Waterhouse, A.L. A Cyclic Voltammetry Method Suitable for Characterizing Antioxidant Properties of Wine and Wine Phenolics. J. Agric. Food Chem. 2001, 49, 1957–1965. [Google Scholar] [CrossRef]
  32. Roginsky, V.; Barsukova, T.; Hsu, C.F.; Kilmartin, P.A. Chain-Breaking Antioxidant Activity and Cyclic Voltammetry Characterization of Polyphenols in a Range of Green, Oolong, and Black Teas. J. Agric. Food Chem. 2003, 51, 5798–5802. [Google Scholar] [CrossRef] [PubMed]
  33. Kilmartin, P. Characterisation of polyphenols in green, oolong, and black teas, and in coffee, using cyclic voltammetry. Food Chem. 2003, 82, 501–512. [Google Scholar] [CrossRef]
  34. Sousa, W.R.; da Rocha, C.; Cardoso, C.L.; Silva, D.H.S.; Zanoni, M.V.B. Determination of the relative contribution of phenolic antioxidants in orange juice by voltammetric methods. J. Food Compos. Anal. 2004, 17, 619–633. [Google Scholar] [CrossRef]
  35. Zielinska, D.; Szawara-Nowak, D.; Ornatowska, A.; Wiczkowski, W. Use of Cyclic Voltammetry, Photochemiluminescence, and Spectrophotometric Methods for the Measurement of the Antioxidant Capacity of Buckwheat Sprouts. J. Agric. Food Chem. 2007, 55, 9891–9898. [Google Scholar] [CrossRef]
  36. Zielinska, D.; Szawara-Nowak, D.; Zielinski, H. Comparison of Spectrophotometric and Electrochemical Methods for the Evaluation of the Antioxidant Capacity of Buckwheat Products after Hydrothermal Treatment. J. Agric. Food Chem. 2007, 55, 6124–6131. [Google Scholar] [CrossRef]
  37. Yakovleva, K.E.; Kurzeev, S.A.; Stepanova, E.V.; Fedorova, T.; Kuznetsov, B.A.; Koroleva, O.V. Characterization of plant phenolic compounds by cyclic voltammetry. Appl. Biochem. Microbiol. 2007, 43, 661–668. [Google Scholar] [CrossRef]
  38. Piljac-Žegarac, J.; Valek, L.; Stipčević, T.; Martinez, S. Electrochemical determination of antioxidant capacity of fruit tea infusions. Food Chem. 2010, 121, 820–825. [Google Scholar] [CrossRef]
  39. Amidi, S.; Mojab, F.; Moghaddam, A.B.; Tabib, K.; Kobarfard, F. A simple electrochemical method for the rapid esti-mation of antioxidant potentials of some selected medicinal plants. Iran. J. Pharm. Res. 2012, 11, 117–121. Available online: https://www.ncbi.nlm.nih.gov/pubmed/25317192 (accessed on 1 August 2022). [PubMed]
  40. Yardım, Y. Electrochemical Behavior of Chlorogenic Acid at a Boron-Doped Diamond Electrode and Estimation of the Antioxidant Capacity in the Coffee Samples Based on Its Oxidation Peak. J. Food Sci. 2012, 77, C408–C413. [Google Scholar] [CrossRef] [PubMed]
  41. Ziyatdinova, G.; Aytuganova, I.; Nizamova, A.; Budnikov, H. Differential Pulse Voltammetric Assay of Coffee Antioxidant Capacity with MWNT-Modified Electrode. Food Anal. Methods 2013, 6, 1629–1638. [Google Scholar] [CrossRef]
  42. Jara-Palacios, M.J.; Hernanz, D.; Escudero-Gilete, M.L.; Heredia, F.J. Antioxidant potential of white grape pomaces: Phenolic composition and antioxidant capacity measured by spectrophotometric and cyclic voltammetry methods. Food Res. Int. 2014, 66, 150–157. [Google Scholar] [CrossRef]
  43. Pilipczuk, T.; Kusznierewicz, B.; Zielińska, D.; Bartoszek, A. The influence of roasting and additional processing on the content of bioactive components in special purpose coffees. J. Food Sci. Technol. 2014, 52, 5736–5744. [Google Scholar] [CrossRef] [Green Version]
  44. Oliveira-Neto, J.R.; Rezende, S.G.; de Fátima Reis, C.; Benjamin, S.R.; Rocha, M.L.; de Souza Gil, E. Electrochemical behavior and determination of major phenolic antioxidants in selected coffee samples. Food Chem. 2016, 190, 506–512. [Google Scholar] [CrossRef]
  45. Hoyos-Arbeláez, J.; Vázquez, M.; Contreras-Calderón, J. Electrochemical methods as a tool for determining the antioxidant capacity of food and beverages: A review. Food Chem. 2017, 221, 1371–1381. [Google Scholar] [CrossRef]
  46. Jiao, Y.; Kilmartin, P.A.; Fan, M.; Quek, S.Y. Assessment of phenolic contributors to antioxidant activity of new kiwifruit cultivars using cyclic voltammetry combined with HPLC. Food Chem. 2018, 268, 77–85. [Google Scholar] [CrossRef]
  47. Zielińska, D.; Turemko, M. Electroactive Phenolic Contributors and Antioxidant Capacity of Flesh and Peel of 11 Apple Cultivars Measured by Cyclic Voltammetry and HPLC–DAD–MS/MS. Antioxidants 2020, 9, 1054. [Google Scholar] [CrossRef] [PubMed]
  48. Juárez-Gómez, J.; Ramírez-Silva, M.T.; Guzmán-Hernández, D.S.; Romero-Romo, M.; Palomar-Pardavé, M. Novel electrochemical method to evaluate the antioxidant capacity of infusions and beverages, based on in situ formation of free superoxide radicals. Food Chem. 2020, 332, 127409. [Google Scholar] [CrossRef] [PubMed]
  49. Takahashi, S.; Wada, R.; Muguruma, H.; Osakabe, N. Analysis of Chlorogenic Acids in Coffee with a Multi-walled Carbon Nanotube Electrode. Food Anal. Methods 2020, 13, 923–932. [Google Scholar] [CrossRef]
  50. Yildirim, S.; Demir, E.; Gok, I.; Aboul-Enein, H.Y. Use of electrochemical methods to determine the effect of brewing techniques (Espresso, Turkish and Filter coffee) and roasting levels on the antioxidant capacity of coffee beverage. J. Food Sci. Technol. 2022, 1–11. [Google Scholar] [CrossRef]
  51. Babova, O.; Occhipinti, A.; Maffei, M.E. Chemical partitioning and antioxidant capacity of green coffee (Coffea arabica and Coffea canephora) of different geographical origin. Phytochemistry 2016, 123, 33–39. [Google Scholar] [CrossRef]
  52. Uman, E.; Colonna-Dashwood, M.; Colonna-Dashwood, L.; Perger, M.; Klatt, C.; Leighton, S.; Miller, B.; Butler, K.T.; Melot, B.C.; Speirs, R.W.; et al. The effect of bean origin and temperature on grinding roasted coffee. Sci. Rep. 2016, 6, 24483. [Google Scholar] [CrossRef] [Green Version]
  53. Cordoba, N.; Pataquiva, L.; Osorio, C.; Moreno, F.L.M.; Ruiz, R.Y. Effect of grinding, extraction time and type of coffee on the physicochemical and flavour characteristics of cold brew coffee. Sci. Rep. 2019, 9, 8440. [Google Scholar] [CrossRef] [Green Version]
  54. Moeenfard, M.; Rocha, L.; Alves, A. Quantification of Caffeoylquinic Acids in Coffee Brews by HPLC-DAD. J. Anal. Methods Chem. 2014, 2014, 965353. [Google Scholar] [CrossRef]
  55. Rao, N.Z.; Fuller, M.; Grim, M.D. Physiochemical Characteristics of Hot and Cold Brew Coffee Chemistry: The Effects of Roast Level and Brewing Temperature on Compound Extraction. Foods 2020, 9, 902. [Google Scholar] [CrossRef]
  56. Odžaković, B.; Džinić, N.; Kukrić, Z.; Grujić, S. Effect of roasting degree on the antioxidant activity of different Arabica coffee quality classes. Acta Sci. Pol. Technol. Aliment. 2015, 15, 409–417. [Google Scholar] [CrossRef] [Green Version]
  57. Muzykiewicz, A.; Zielonka-Brzezicka, J.; Klimowicz, A. The antioxidant potential of flesh, albedo and flavedo extracts from different varieties of grapefruits. Acta Sci. Pol. Technol. Aliment. 2015, 18, 453–462. [Google Scholar] [CrossRef] [PubMed]
  58. Saeed, N.; Khan, M.R.; Shabbir, M. Antioxidant activity, total phenolic and total flavonoid contents of whole plant extracts Torilis leptophylla L. BMC Complement. Altern. Med. 2012, 12, 221. [Google Scholar] [CrossRef]
  59. Takahash, R. Analysis of Chlorogenic Acid in Coffee by HPLC, GL Science Inc. (n.d.). Available online: https://www.glsciences.com/technique/app/detail.php?data_number=LT067 (accessed on 7 October 2018).
  60. Farah, A.; de Paulis, T.; Trugo, L.C.; Martin, P.R. Effect of Roasting on the Formation of Chlorogenic Acid Lactones in Coffee. J. Agric. Food Chem. 2005, 53, 1505–1513. [Google Scholar] [CrossRef]
  61. Trugo, L.C.; Macrae, R. Chlorogenic acid composition of instant coffees. Analyst 1984, 109, 263–266. [Google Scholar] [CrossRef] [PubMed]
  62. Monente, C.; Ludwig, I.A.; Irigoyen, A.; De Peña, M.-P.; Cid, C. Assessment of Total (Free and Bound) Phenolic Compounds in Spent Coffee Extracts. J. Agric. Food Chem. 2015, 63, 4327–4334. [Google Scholar] [CrossRef]
  63. Wessa, P. Free Statistics Software, Office for Research Development and Education, Version 1.2.1. 2020. Available online: https://www.wessa.net (accessed on 3 August 2022).
  64. Rao, N.Z.; Fuller, M. Acidity and Antioxidant Activity of Cold Brew Coffee. Sci. Rep. 2018, 8, 16030. [Google Scholar] [CrossRef] [Green Version]
  65. Bilge, G. Investigating the effects of geographical origin, roasting degree, particle size and brewing method on the physicochemical and spectral properties of Arabica coffee by PCA analysis. J. Food Sci. Technol. 2020, 57, 3345–3354. [Google Scholar] [CrossRef] [PubMed]
  66. Muzykiewicz-Szymańska, A.; Nowak, A.; Wira, D.; Klimowicz, A. The Effect of Brewing Process Parameters on Antioxidant Activity and Caffeine Content in Infusions of Roasted and Unroasted Arabica Coffee Beans Originated from Different Countries. Molecules 2021, 26, 3681. [Google Scholar] [CrossRef]
  67. Córdoba, N.; Moreno, F.L.; Osorio, C.; Velásquez, S.; Ruiz, Y. Chemical and sensory evaluation of cold brew coffees using different roasting profiles and brewing methods. Food Res. Int. 2021, 141, 110141. [Google Scholar] [CrossRef] [PubMed]
  68. Maier, H.G. Electrophoretic clean-up of organic acids from coffee for the GC/MS analysis. Anal. Bioanal. Chem. 1996, 355, 190–193. [Google Scholar] [CrossRef]
  69. Maier, H.G.; Balcke, C.; Thies, F.-C. Die Säuren Des Kaffees. VI. Abhängigkeit des sauren Geschmacks von pH-Vert und Säuregrad. Lebensm. Gerichtl. Chem. 1983, 37, 81–83. [Google Scholar]
  70. Balzer, H.H. Acids in coffee. In Coffee: Recent Development; Clarke, R.J., Vitzthum, O.G., Eds.; Blackwell Science: Oxford, UK, 2001; pp. 18–32. [Google Scholar]
  71. Batali, M.E.; Cotter, A.R.; Frost, S.C.; Ristenpart, W.D.; Guinard, J.-X. Titratable Acidity, Perceived Sourness, and Liking of Acidity in Drip Brewed Coffee. ACS Food Sci. Technol. 2021, 1, 559–569. [Google Scholar] [CrossRef]
  72. Cordoba, N.; Fernandez-Alduenda, M.; Moreno, F.L.; Ruiz, Y. Coffee extraction: A review of parameters and their influence on the physicochemical characteristics and flavour of coffee brews. Trends Food Sci. Technol. 2020, 96, 45–60. [Google Scholar] [CrossRef]
  73. Yeager, S.E.; Batali, M.E.; Guinard, J.-X.; Ristenpart, W.D. Acids in coffee: A review of sensory measurements and meta-analysis of chemical composition. Crit. Rev. Food Sci. Nutr. 2021, 1–27. [Google Scholar] [CrossRef] [PubMed]
  74. Gloess, A.N.; Schönbächler, B.; Klopprogge, B.; D`ambrosio, L.; Chatelain, K.; Bongartz, A.; Strittmatter, A.; Rast, M.; Yeretzian, C. Comparison of nine common coffee extraction methods: Instrumental and sensory analysis. Eur. Food Res. Technol. 2013, 236, 607–627. [Google Scholar] [CrossRef] [Green Version]
  75. Wonorahardjo, S.; Yuniawati, N.; Molo, A.D.P.; Rusdi, H.O.; Purnomo, H. Different Chemical Compound Profiles of Indonesian Coffee Beans as Studied Chromatography/Mass Spectrometry. IOP Conf. Ser. Earth Environ. Sci. 2019, 276, 012065. [Google Scholar] [CrossRef]
  76. Stanek, N.; Zarębska, M.; Biłos, Ł.; Barabosz, K.; Nowakowska-Bogdan, E.; Semeniuk, I.; Błaszkiewicz, J.; Kulesza, R.; Matejuk, R.; Szkutnik, K. Influence of coffee brewing methods on the chromatographic and spectroscopic profiles, antioxidant and sensory properties. Sci. Rep. 2021, 11, 21377. [Google Scholar] [CrossRef]
  77. Fuller, M.; Rao, N.Z. The Effect of Time, Roasting Temperature, and Grind Size on Caffeine and Chlorogenic Acid Concentrations in Cold Brew Coffee. Sci. Rep. 2017, 7, 1–9. [Google Scholar] [CrossRef] [Green Version]
  78. Angeloni, G.; Guerrini, L.; Masella, P.; Innocenti, M.; Bellumori, M.; Parenti, A. Characterization and comparison of cold brew and cold drip coffee extraction methods. J. Sci. Food Agric. 2018, 99, 391–399. [Google Scholar] [CrossRef]
  79. Lane, S.; Palmer, J.; Christie, B.; Ehlting, J.; Le, C. Can Cold Brew Coffee Be Convenient? A Pilot Study For Caffeine Content in Cold Brew Coffee Concentrate Using High Performance Liquid Chromatography. Arbutus Rev. 2017, 8, 15–23. [Google Scholar] [CrossRef]
  80. Fox, G.P.; Wu, A.; Yiran, L.; Force, L. Variation in Caffeine Concentration in Single Coffee Beans. J. Agric. Food Chem. 2013, 61, 10772–10778. [Google Scholar] [CrossRef] [PubMed]
  81. Jeon, J.S.; Kim, H.T.; Jeong, I.H.; Hong, S.R.; Oh, M.S.; Park, K.H.; Shim, J.H.; Abd El-Aty, A.M. Determination of chlorogenic acids and caffeine in homemade brewed coffee prepared under various conditions. J. Chromatogr. B Anal. Technol. Biomed. Life Sci. 2017, 1064, 115–123. [Google Scholar] [CrossRef] [PubMed]
  82. Ciaramelli, C.; Palmioli, A.; Airoldi, C. Coffee variety, origin and extraction procedure: Implications for coffee beneficial effects on human health. Food Chem. 2018, 278, 47–55. [Google Scholar] [CrossRef] [PubMed]
  83. Olechno, E.; Puścion-Jakubik, A.; Zujko, M.; Socha, K. Influence of Various Factors on Caffeine Content in Coffee Brews. Foods 2021, 10, 1208. [Google Scholar] [CrossRef] [PubMed]
  84. Gebeyehu, B.T. Determination of Caffeine Content and Antioxidant Activity of Coffee. Am. J. Appl. Chem. 2015, 3, 69. [Google Scholar] [CrossRef] [Green Version]
  85. Angeloni, G.; Guerrini, L.; Masella, P.; Bellumori, M.; Daluiso, S.; Parenti, A.; Innocenti, M. What kind of coffee do you drink? An investigation on effects of eight different extraction methods. Food Res. Int. 2018, 116, 1327–1335. [Google Scholar] [CrossRef]
  86. Liang, N.; Kitts, D.D. Antioxidant Property of Coffee Components: Assessment of Methods that Define Mechanisms of Action. Molecules 2014, 19, 19180–19208. [Google Scholar] [CrossRef] [Green Version]
  87. Yashin, A.; Yashin, Y.; Wang, J.Y.; Nemzer, B. Antioxidant and Antiradical Activity of Coffee. Antioxidants 2013, 2, 230–245. [Google Scholar] [CrossRef]
  88. Shahidi, F.; Zhong, Y. Measurement of antioxidant activity. J. Funct. Foods 2015, 18, 757–781. [Google Scholar] [CrossRef]
  89. Van Acker, S.A.B.E.; Van Den Berg, D.-J.; Tromp, M.N.J.L.; Griffioen, D.H.; Van Bennekom, W.P.; Van Der Vijgh, W.J.F.; Bast, A. Structural aspects of antioxidant activity of flavonoids. Free Radic. Biol. Med. 1996, 20, 331–342. [Google Scholar] [CrossRef]
  90. Burda, S.; Oleszek, W. Antioxidant and Antiradical Activities of Flavonoids. J. Agric. Food Chem. 2001, 49, 2774–2779. [Google Scholar] [CrossRef]
  91. Miłek, M.; Młodecki, Ł.; Dżugan, M. Caffeine content and antioxidant activity of various brews of specialty grade coffee. Acta Sci. Pol. Technol. Aliment. 2015, 20, 179–188. [Google Scholar] [CrossRef]
  92. Kang, D.-E.; Lee, H.-U.; Davaatseren, M.; Chung, M.-S. Comparison of acrylamide and furan concentrations, antioxidant activities, and volatile profiles in cold or hot brew coffees. Food Sci. Biotechnol. 2019, 29, 141–148. [Google Scholar] [CrossRef] [PubMed]
  93. García-Márquez, E.; Román-Guerrero, A.A.; Pérez-Alonso, C.; Cruz-Sosa, F.; Jiménez-Alvarado, R.; Vernon-Carter, E.J. Effect of solvent-temperature extraction conditions on the initial antioxidant activity and total phenolic content of muitle extracts and their decay upon storage at different pH. Rev. Mex. Anal. Conducta. 2012, 11, 1–10. [Google Scholar]
  94. Sripum, C.; Kukreja, R.K.; Charoenkiatkul, S.; Kriengsinyos, W.; Suttisansanee, U. The effect of extraction conditions on anti-oxidant activities and total phenolic contents of different processed Thai Jasmine rice. Int. Food. Res. J. 2017, 24, 1644–1650. [Google Scholar]
  95. Pinelo, M.; Rubilar, M.; Jerez, M.; Sineiro, A.J.; Núñez, M.J. Effect of Solvent, Temperature, and Solvent-to-Solid Ratio on the Total Phenolic Content and Antiradical Activity of Extracts from Different Components of Grape Pomace. J. Agric. Food Chem. 2005, 53, 2111–2117. [Google Scholar] [CrossRef] [PubMed]
  96. Ghafoor, K.; Ahmed, I.A.M.; Doğu, S.; Uslu, N.; Fadimu, G.J.; Al Juhaimi, F.; Babiker, E.E.; Özcan, M.M.; Jamiu, F.G. The Effect of Heating Temperature on Total Phenolic Content, Antioxidant Activity, and Phenolic Compounds of Plum and Mahaleb Fruits. Int. J. Food Eng. 2019, 15. [Google Scholar] [CrossRef]
  97. Vignoli, J.A.; Viegas, M.C.; Bassoli, D.G.; Benassi, M.D.T. Roasting process affects differently the bioactive compounds and the antioxidant activity of arabica and robusta coffees. Food Res. Int. 2014, 61, 279–285. [Google Scholar] [CrossRef] [Green Version]
  98. Vignoli, J.A.; Bassoli, D.G.; Benassi, M.T. Antioxidant activity, polyphenols, caffeine and melanoidins in soluble coffee: The influence of processing conditions and raw material. Food Chem. 2011, 124, 863–868. [Google Scholar] [CrossRef]
  99. López-Galilea, I.; De Peña, M.P.; Cid, C. Correlation of Selected Constituents with the Total Antioxidant Capacity of Coffee Beverages: Influence of the Brewing Procedure. J. Agric. Food Chem. 2007, 55, 6110–6117. [Google Scholar] [CrossRef]
  100. Parras, P.; Martínez-Tomé, M.; Jiménez, A.; Murcia, M. Antioxidant capacity of coffees of several origins brewed following three different procedures. Food Chem. 2007, 102, 582–592. [Google Scholar] [CrossRef]
  101. Stelmach, E.; Pohl, P.; Szymczycha-Madeja, A. The content of Ca, Cu, Fe, Mg and Mn and antioxidant activity of green coffee brews. Food Chem. 2015, 182, 302–308. [Google Scholar] [CrossRef] [PubMed]
  102. Somporn, C.; Kamtuo, A.; Theerakulpisut, P.; Siriamornpun, S. Effect of shading on yield, sugar content, phenolic acids and antioxidant property of coffee beans (Coffea Arabica L. cv. Catimor) harvested from north-eastern Thailand. J. Sci. Food Agric. 2012, 92, 1956–1963. [Google Scholar] [CrossRef] [PubMed]
  103. Hallmann, E.; Ożga, M.; Rembiałkowska, E. The content of bioactive compounds in selected kind of coffee from organic and conven-tional production. J. Res. Appl. Agric. Eng. 2010, 53, 99–104. [Google Scholar]
  104. Górecki, M.; Hallmann, E. The Antioxidant Content of Coffee and Its In Vitro Activity as an Effect of Its Production Method and Roasting and Brewing Time. Antioxidants 2020, 9, 308. [Google Scholar] [CrossRef] [PubMed] [Green Version]
  105. Duarte, S.M.D.S.; De Abreu, C.M.P.; De Menezes, H.C.; Dos Santos, M.H.; Gouvêa, C.M.C.P. Effect of processing and roasting on the antioxidant activity of coffee brews. Food Sci. Technol. 2005, 25, 387–393. [Google Scholar] [CrossRef]
  106. Haile, M.; Bae, H.M.; Kang, W.H. Comparison of the Antioxidant Activities and Volatile Compounds of Coffee Beans Obtained Using Digestive Bio-Processing (Elephant Dung Coffee) and Commonly Known Processing Methods. Antioxidants 2020, 9, 408. [Google Scholar] [CrossRef]
  107. Król, K.; Gantner, M.; Tatarak, A.; Hallmann, E. The content of polyphenols in coffee beans as roasting, origin and storage effect. Eur. Food Res. Technol. 2019, 246, 33–39. [Google Scholar] [CrossRef] [Green Version]
  108. Kitzberger, C.S.G.; Scholz, M.B.D.S.; Benassi, M.D.T. Bioactive compounds content in roasted coffee from traditional and modern Coffea arabica cultivars grown under the same edapho-climatic conditions. Food Res. Int. 2014, 61, 61–66. [Google Scholar] [CrossRef]
  109. Yildirim, S.; Gok, I.; Demir, E.; Tokusoglu, O. Use of electrochemical techniques for determining the effect of brewing techniques (espresso, Turkish and filter coffee) and roasting levels on total antioxidant capacity of coffee beverage. J. Food Process. Preserv. 2022, 46, e16626. [Google Scholar] [CrossRef]
  110. Demir, E.; Silah, H.; Aydogdu, N. Electrochemical Applications for the Antioxidant Sensing in Food Samples Such as Citrus and Its Derivatives, Soft Drinks, Supplementary Food and Nutrients. In Citrus-Research, Development and Biotechnology; IntechOpen: London, UK, 2021. [Google Scholar] [CrossRef]
  111. Yildirim, S.; Demir, E.; Gök, I. Determination of Total Antioxidant Capacities in Turkish and Filter Coffee Samples by Electrochemical Methods. BSEU J. Sci. 2020, 7, 382–393. [Google Scholar] [CrossRef]
  112. Escarpa, A. Food electroanalysis: Sense and simplicity. Chem. Rec. 2011, 12, 72–91. [Google Scholar] [CrossRef] [PubMed]
Figure 1. (a) pH and (b) total titratable acidity titrated to pH of 6.0 (TTA) of cold and hot brew peaberry coffee samples from four different regions. Error bars represent standard deviation (SD). Letters a–d, denote significant differences as analyzed by two-way ANOVA and the TUKEY HDS post-test. Samples without a common letter differ (p < 0.05).
Processes 10 01989 g001
Figure 2. (a) Total CQA concentration and (b) caffeine concentration of cold and hot brew extract of peaberry coffee from four different regions. Error bars represent standard deviation (SD). Letters a–e, denote significant differences as analyzed by two-way ANOVA and the TUKEY HDS post-test. Samples without a common letter differ (p < 0.05).
Processes 10 01989 g002
Figure 3. Total antioxidant capabilities (TAC) of cold and hot extracts of peaberry coffee from four different regions assessed using (a) ABTS assay, (b) DPPH assay, (c) FRAP assay, (d) Folin-Ciocalteau assay for total phenolic content (TPC), and (e) total flavonoid content (TFC). Error bars represent standard deviation (SD). Letters a–d, denote significant differences as analyzed by two-way ANOVA and the TUKEY HDS post-test. Samples without a common letter differ (p < 0.05).
Processes 10 01989 g003
Figure 4. Cyclic voltammograms of cold and hot extracts of peaberry coffee from four (4) different regions (a) Kenya, (b) Papua New Guinea, (c) Sumatra, and (d) Tanzania. Samples were prepared in 50 mg/L solutions with pH 4.10 buffer acting as supporting electrolyte at a scan rate of 0.1 V/s. Individual scans of each sample can be found in the Supporting Information.
Processes 10 01989 g004
Table 1. Redox values of cold and hot extracts of peaberry coffee from four (4) different regions.
Coffee SamplesReduction Potential
(V)
Oxidation Potential
(V)
E1/2
(V)
Reduction Current
(A)
Oxidation Current
(A)
Cold Brew
Kenya0.4240.3910.4089.71 × 10−7−5.94 × 10⁻⁷
Papua New Guinea0.4260.3910.4091.06 × 10−6−7.70 × 10⁻⁷
Sumatra0.4240.3850.4059.56 × 10−7−7.42 × 10⁻⁷
Tanzania0.4270.3850.4061.09 × 10−6−7.25 × 10⁻⁷
Hot Brew
Kenya0.4360.3890.4131.24 × 10−6−8.28 × 10⁻⁷
Papua New Guinea0.4260.3970.4128.95 × 10−7−7.78 × 10⁻⁷
Sumatra0.4200.3850.4031.06 × 10−6−7.99 × 10⁻⁷
Tanzania0.4120.3820.3971.00 × 10−6−7.85 × 10⁻⁷
Publisher’s Note: MDPI stays neutral with regard to jurisdictional claims in published maps and institutional affiliations.

