Article

Analysis of Gas Flow Dynamics in Thermal Cut Kerf Using a Numerical and Experimental Approach for Nozzle Selection

1
School of Mechanical Engineering, Pusan National University, Busan 46241, Korea
2
Busan Machinery Research Center, Korea Institute of Machinery and Materials, Busan 46744, Korea
3
Department of Mechanical Engineering, Pukyong National University, Busan 48513, Korea
*
Authors to whom correspondence should be addressed.
These authors contributed equally to this work.
Processes 2022, 10(10), 1951; https://doi.org/10.3390/pr10101951
Submission received: 25 August 2022 / Revised: 15 September 2022 / Accepted: 19 September 2022 / Published: 27 September 2022

Abstract

:
Consistency in gas flow behavior under various operating conditions is expected for uniform cutting performance in the thermal cutting process. The slope of the cut front in the kerf slot of a sample cutting material varies with the operating condition which affects the gas flow pattern. Therefore, how the nozzle exit diameter and the slope of the cut front effects gas flow behavior has been studied using the Reynolds averaged Navier–Stokes (RANS) based kω turbulence model. Convergent–straight-type nozzles with exit diameters φexit of 1.5 mm, 2 mm and 2.5 mm were used to study the flow patterns through the kerf slots of variable cut front slopes. The numerical simulation results were then compared with the results obtained from the Schlieren experiments. In addition, image processing was performed in the Schlieren images for clear visualization and precise comparison of the numerical and experimental data. The results confirm that a nozzle with an exit diameter of 2 mm shows a higher consistency in flow behavior in variable operating conditions.

1. Introduction

Thermal cutting is a process in which the heat of an electric arc, radiation energy or an exothermic reaction is utilized to melt or oxidize a metal at an accelerated rate to achieve a cut [1,2]. During the process, metal at the spot of the focused heat source melts and is removed by a jet of the assisting gas through the cut being formed [2]. An important parameter characterizing the cut quality is the size of the dross (resolidified material at the rear surface) deposited on the cut surface, which is significantly affected by the gas flow dynamics. The gas used in thermal cutting may be an inert gas (argon or helium), a neutral gas (nitrogen), or an active gas (oxygen) [1]. The inert or neutral gas jet assists cutting by exerting a mechanical force on the molten layer to eject the melts moving at the cut front, whereas the jet of an active gas impinges upon the heated metal to generate heat by chemical reaction in addition to the heat source.
The gas-assisted thermal cutting process has a wide applicability in industrial processes such as welding, assembling, and riveting, and has serves as an integral part of industries such as structural engineering, machine fabrication, energy equipment manufacturing, construction, aerospace, ship building, nuclear power plants, batteries, and automotive industries. Despite the widespread use of gas-assisted cutting, the process of melt removal from the cut has yet to be adequately studied. The cut quality of material degrades with the thickness of the sample and worsens when the thickness of the metal is 25 mm or greater. One major cause of this is a reduction in shear and pressure force on the melt surface, acting from the gas on the melt and subsequent inadequate removal of the melts [3]. Nonetheless, the operating pressure for the gas-assisted cutting process is still empirically determined.
High-pressure nozzle flow usually leads to the occurrence of a non-desirable aerodynamic phenomena such as the presence of shock structures resulting in the deterioration of the dynamic characteristics of the exit jet [4]. The complex nature of the shock structure, associated with the high-speed gas jet impinging on a work piece, can lead to poor cutting quality [5,6]. No reliable concepts of the mechanisms of the processes inside the kerf during the cutting process have been proposed to date. Recording the processes under natural conditions is impossible because the cut walls are not transparent, and the processes involve high temperatures and reflected radiation [7]. Research under natural conditions is confined to observations of particles leaving the cut channel and to inspecting the metal surface after it has been affected by the heat source [3]. Due to these restrictions, physical and mathematical modelling of the cutting processes is significantly important.
The gas dynamics of the thermal cutting process is the subject of research for many authors. The shock-wave phenomena in gas-assisted thermal cutting has been studied by many investigators, and in many cases [8,9,10,11,12,13,14] the structure of the shock wave has been obtained by flow visualization technologies such as the shadow graph method [8,9,10]. The authors in [11,12] proposed new nozzle designs based on the analysis of gas dynamics. Tseng et al. [13] studied flow pattern and pressure variation of nozzles. They measured depth and width of focus based on the flow visualization and reported that the depth of focus is increased with the rise of exit Mach number whereas the width of focus increases with the nozzle diameter.
Chen et al. [14] calculated and measured the mass flow rate, gas pressure distribution, and shear stress in the cutting front of laser cutting. Their study includes a complete description of the shock wave structure, and they showed that the generation of shock waves during laser cutting is mainly affected by the ratio of the stagnation pressure at the nozzle outlet to the ambient pressure. The authors in [15,16,17] investigated the interaction of gas flows within the cut kerf to study the dynamic characteristics of the exit jet at various stand-off distances during the laser cutting process. Darwish et al. [18] investigated the effect of inlet stagnation pressure and nozzle geometry on the behavior of the gas flow. They used a quasi-1-D gas dynamics theory to calculate the exact-design operating conditions for three different supersonic nozzles. They then modeled the jet flow through these nozzles numerically and verified them experimentally using Schlieren visualization. They reported that the exit jet preserved its uniform distribution with parallel boundaries and low divergence under the exact-design operating condition, unlike what was observed for the other two conditions, especially for a nozzle with a small divergence angle. The dynamic characteristics of the exit jet, from both conical and supersonic nozzles, have been comprehensively reviewed in [8,9]. Man et al. [8] theoretically analyzed and visualized the exit jet patterns in the free stream to illustrate how its dynamic characteristics are affected by the type and size of the nozzle.
In the study by Cho et al. [19], the gas flow image was captured using a high-speed camera with the Schlieren method. The images captured before and after gas injection were used to obtain the image intensity by subtracting the former from the latter. Their work revealed that the stronger the inlet pressure and the shorter the stand-off distance, the higher the image intensity value and gas flow rate. The authors in [3] studied the flow separation phenomena in the narrow channel as in the kerf channels obtained from the laser cutting process. They conducted a numerical and experimental investigation on two types of nozzles (sonic and supersonic) and examined the specific features originating in the flow separation on a smooth surface in a narrow channel. They also proposed mechanisms for controlling the separation.
Mai et al. [16] studied and simulated the exit jet from a straight nozzle on an inclined substrate at various inclination angles. Their study revealed that the inclined substrate angle had a significant effect on the exit jet pattern within the cut kerf and had a negative effect on both the ability to remove molten materials and the cutting quality due to the steep pressure gradient at a higher inclined angle. Man et al. [9] performed an experimental investigation with the shadow graph technique and demonstrated the effects of inlet stagnation pressure, nozzle tip to work-piece stand-off distance, cut kerf width, and thickness of the workpiece in relation to the behavior of the gas jet patterns inside a simulated kerf. Their findings suggest that a high-speed jet increases the ability to remove dross and, consequently, improves cutting quality.
In this study, we focus on numerically and experimentally analyzing gas flow dynamics in the kerf slot. The parameters affecting gas flow behavior investigated in this study are the kerf geometry (the varying slope of the cut front) and the nozzle exit diameter (φexit). The slope of the cut front in the kerf slot changes with the variation in cutting speed. This change in the slope of the cut front significantly affects the gas flow dynamics. Similarly, the nozzle exit diameter affects the size and position of the shock structures formed during high-pressure gas flow. These shock structures can deteriorate gas flow dynamics to a great extent; therefore, the selection of an optimal nozzle exit diameter is necessary for a high-quality thermal cut. This study aims to assess the gas flow characteristics inside a kerf slot for variable kerf geometry and nozzle exit diameter and proposes an optimal nozzle for a high-quality thermal cut.

2. Experimental Procedure

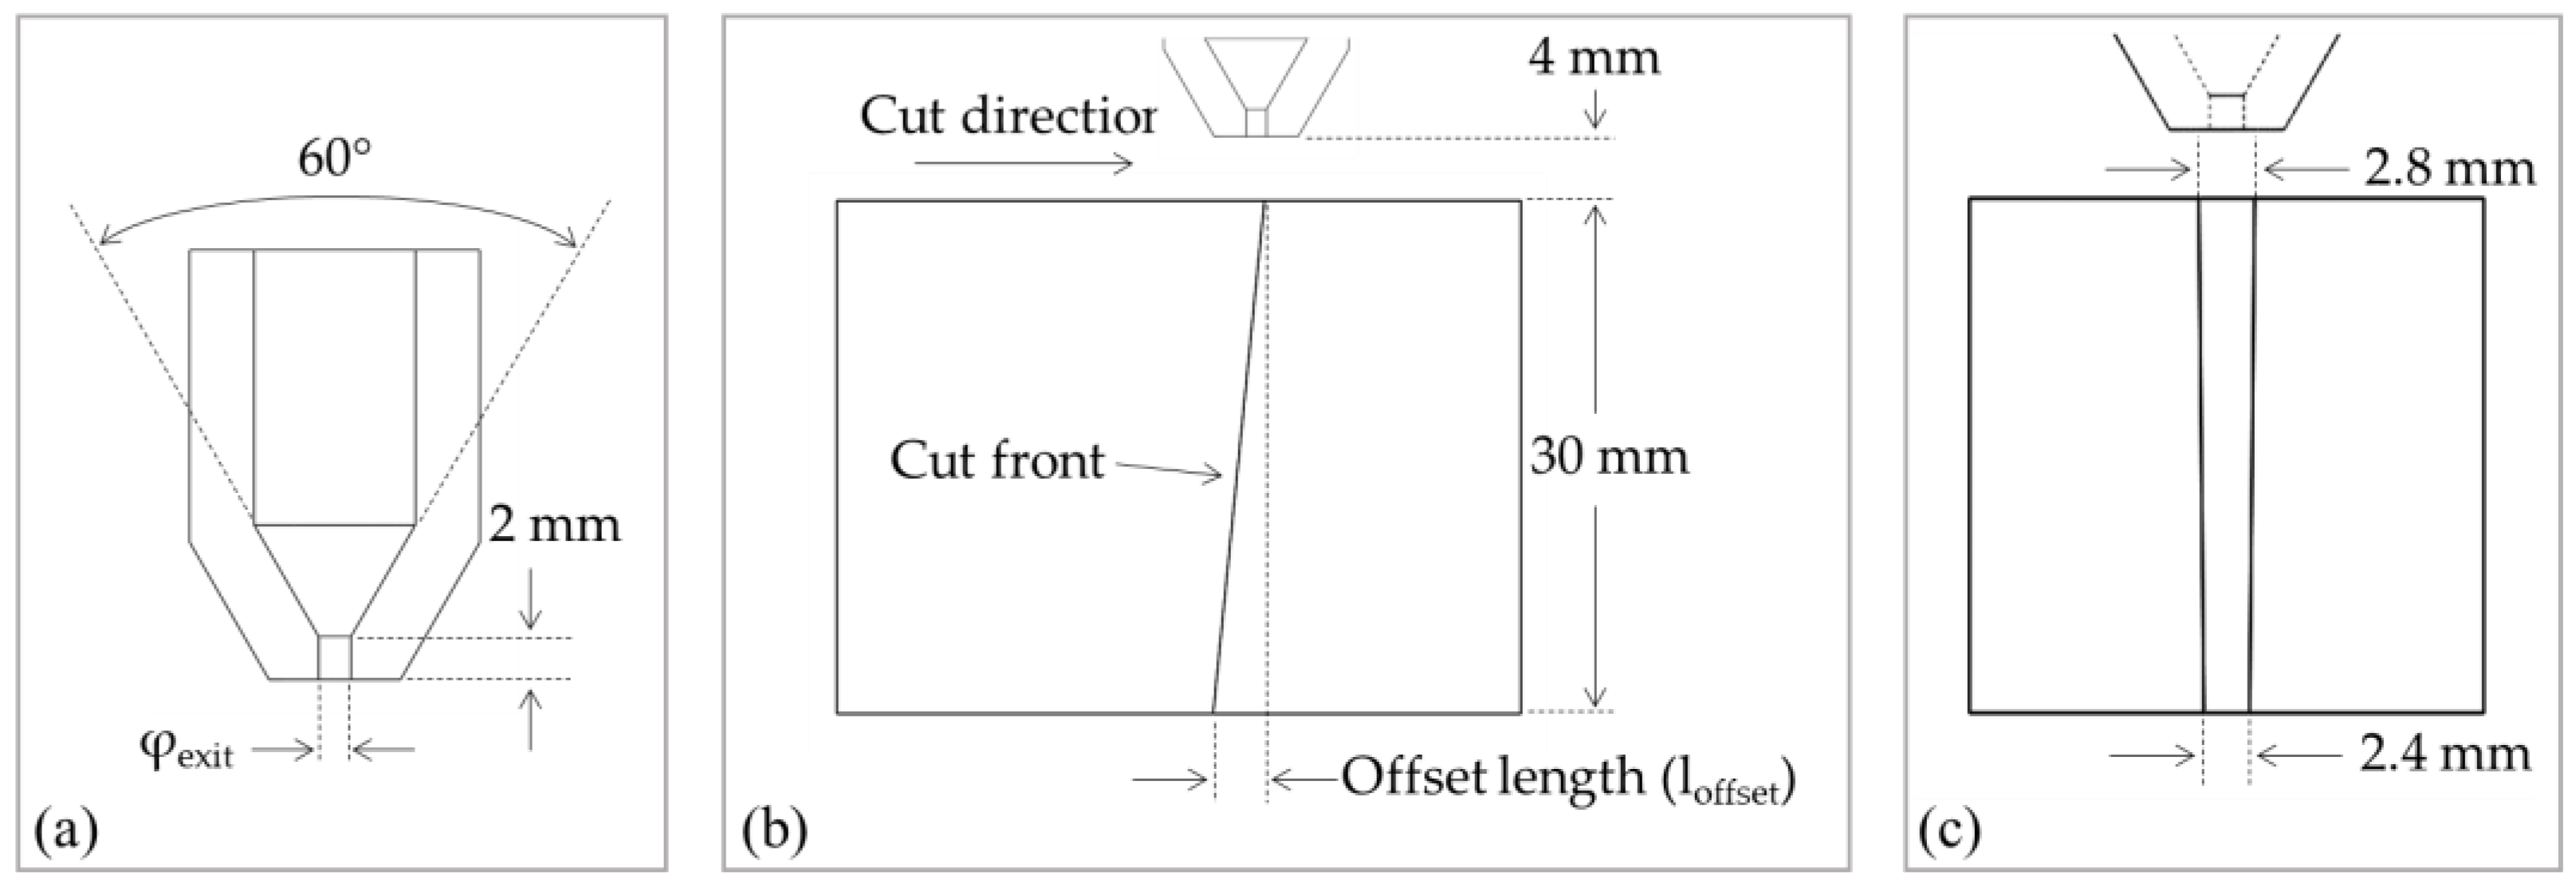
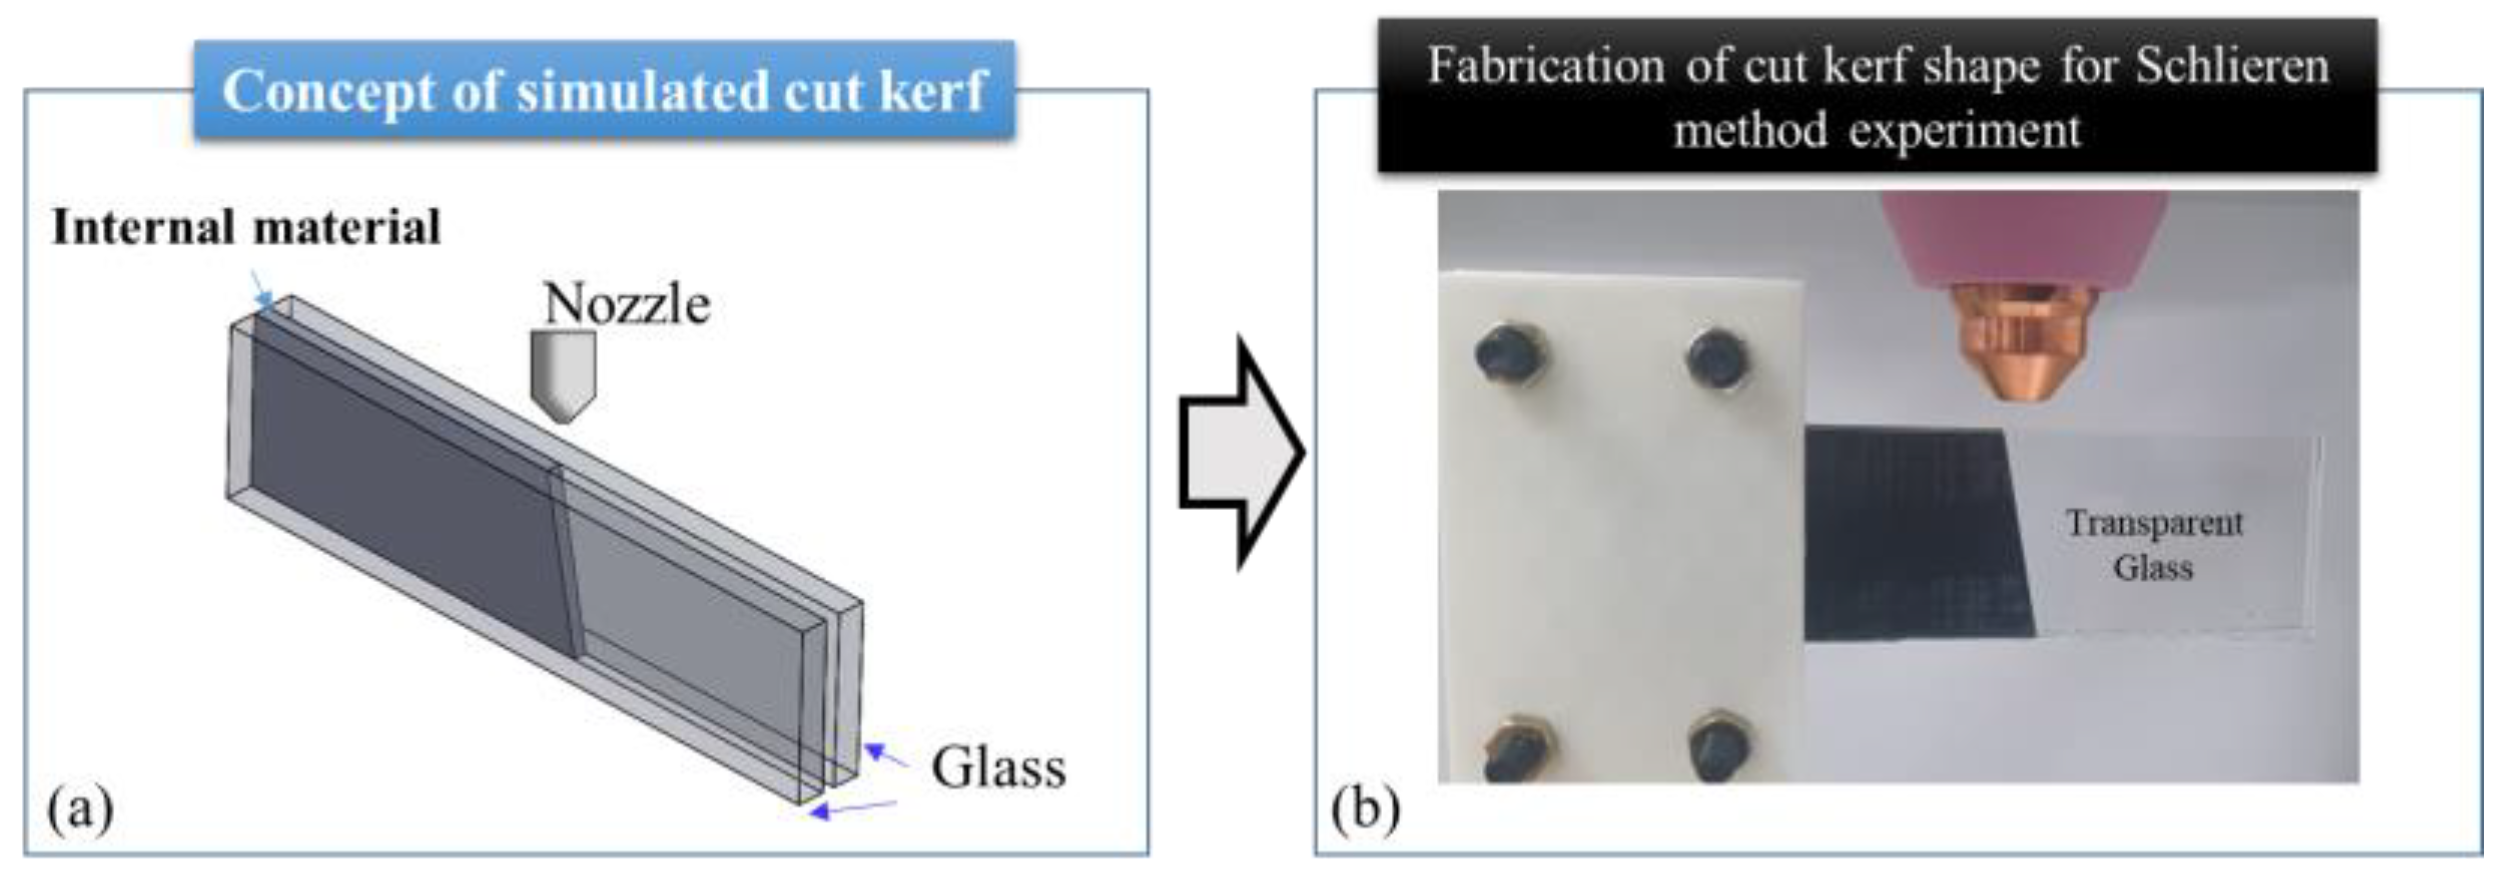
2.1. Nozzle and Cut Kerf Geometry

Nozzle geometry and the exit diameter significantly affect flow dynamics. Bernoulli’s theorem states that a fluid’s total energy remains the same regardless of the internal pressure and the velocity of the fluid. The theorem implies that the energy due to pressure, potential energy, and kinetic energy in a fluid have a constant sum. Considering this, it can be concluded that reducing the internal pressure of the fluid will cause a proportionate increase in the velocity of the fluid, without the input of any additional energy. This is true for incompressible flow and some compressible flows with Mach number 0.3 and below [20]. However, in compressible flow, reducing the internal pressure of the fluid contributes to the increase in velocity, density, and temperature of the fluid which complicates analysis of compressible flows [21]. The total internal pressure can be reduced by forcing the flow through a nozzle, and thus increasing the kinetic energy of the flow. The variation in the diameter of the nozzle exit results in the variation of the total internal pressure of the flow which, in turn, changes the flow speed at the exit of the nozzle. However, the recurrence of Mach shock disks should be considered when selecting the nozzle exit diameter during the cutting process.
In this study, three conical nozzles with varying exit diameters were used to investigate the flow behavior along cut kerfs. The flow inside the nozzle is considered to be irrotational, isentropic, compressible, and subsonic. The nozzles used in this study consist of straight walls with an exit angle of 0°, since they can easily be manufactured. The detailed geometry of the nozzle and kerf are given in Figure 1.
During thermal cutting, the cut kerf shape is determined by various factors such as cutting speed, the power of the heat source, sample thickness, etc. The thickness of the cut sample used in this study was 30 mm. To investigate the gas flow dynamics inside the cut kerf, the inclination of the cutting front was varied. The offset distance between the end of the kerf channel on the top and bottom surface of the cut sample was varied to produce various inclinations in the cutting front of the kerf slot. The kerf width on the top and bottom surface was 2.8 mm and 2.4 mm, respectively.

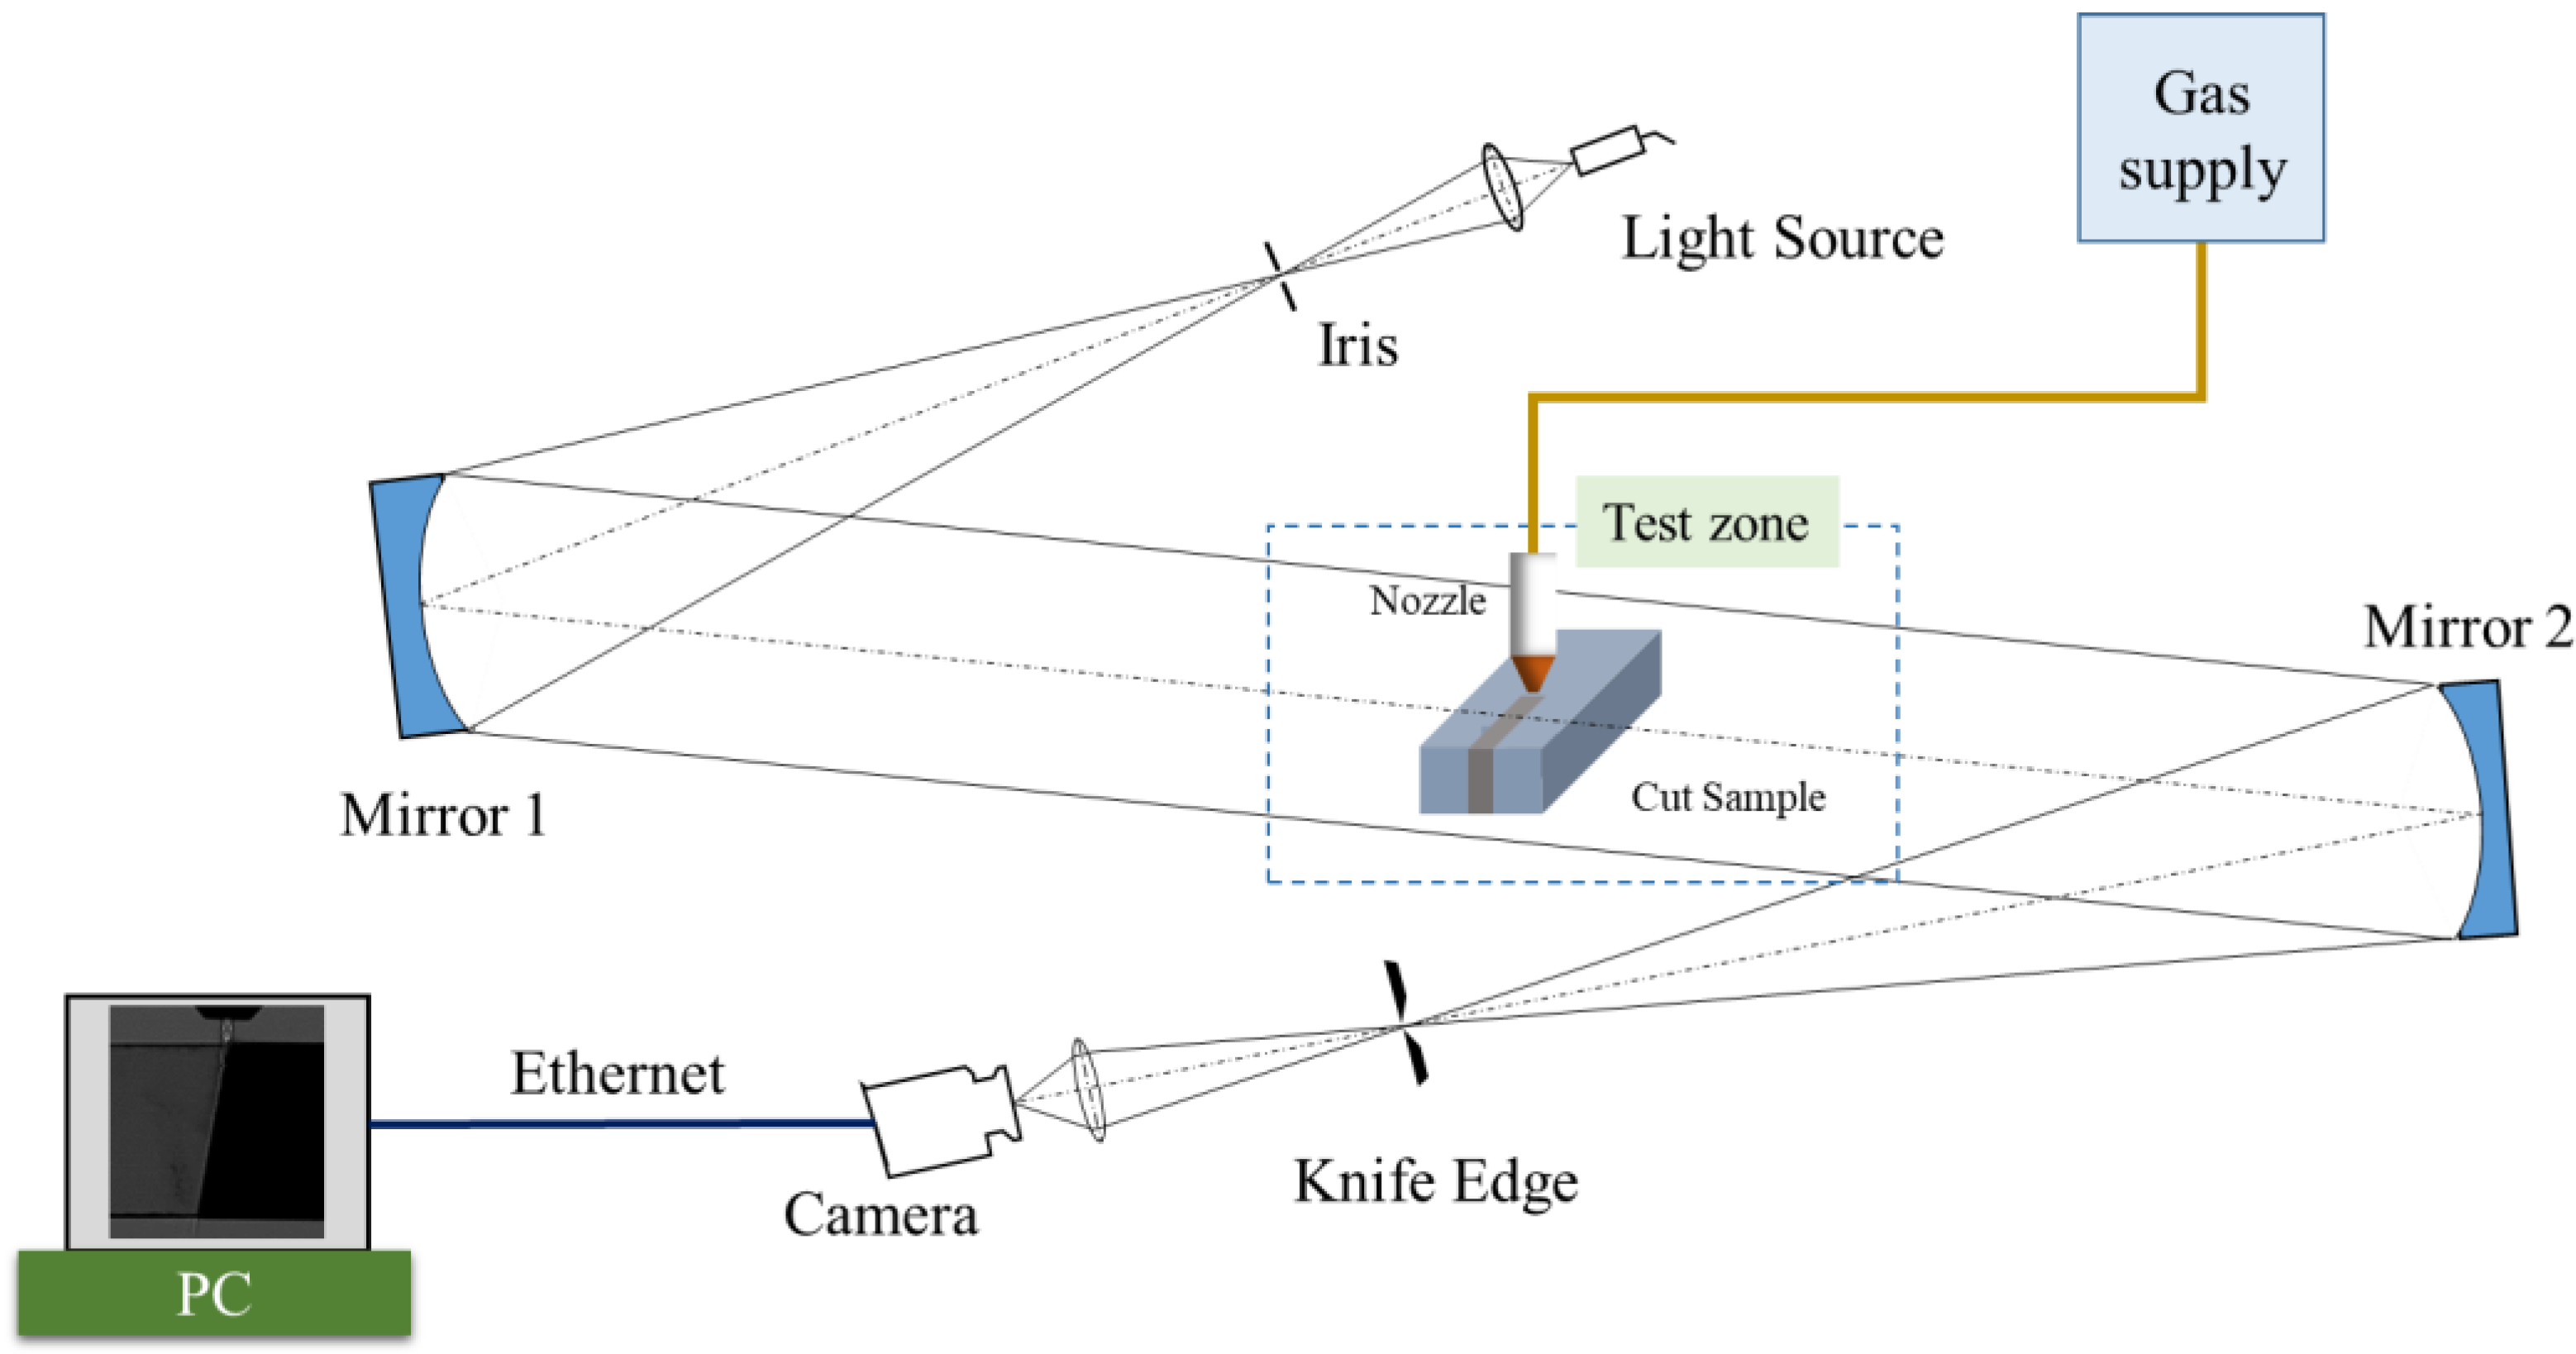
2.2. Schlieren Method

For the Schlieren experiment, the kerf shapes were fabricated using clear glass plates and 3D printed parts, as demonstrated in Figure 2a,b.
A Toepler’s Z-type Schlieren assembly with two concave mirrors was configured as shown in Figure 3 for this experiment. A gas supply with compressed air was connected to the nozzle. A constant pressure of 6 atm was maintained at the inlet of the nozzle for this experiment and was derived from a plasma arc cutting process. For the Schlieren setup, a 120 W high-power white LED lamp was used as the light source which focuses through a condenser lens and passes through a slit 2 mm in diameter. The concave mirrors used in this setup were axially parabolic mirrors with a diameter of 200 mm, with a focal length of 2030 mm, and were made of Pyrex material coated with aluminum. The reflectance of the mirror was more than 90%. For imaging, Photron’s FASTCAM mini UX100 camera was used. No separate ND filter or band pass filter was used in the Schlieren configuration in this study. A shutter speed (exposure time) of 1/25,600 sec and a frame rate of 1000 fps were used to capture the images.

Schlieren Imaging

Careful measurement was performed when setting up the test material. Several duplicate experiments were carried out for each case to minimize the error during the schlieren method. The images captured during each experiment were compared to verify the flow pattern captured during the experiments. The high-speed camera was used to capture multiple images during gas flow. The flow became stable approximately after 150–200 milliseconds. The images after 200 milliseconds showed stable shock wave pattern along the flow direction. Figure 4 shows the Schlieren images of stable flow pattern captured during three different experiments using same process parameters. The gauge pressure of the injected flow was 6 atm. The nozzle used for the experiments was of 2 mm exit diameter (φexit). The similarity in the flow pattern and shockwave structures can be used to validate the performance of the Schlieren method applied in this experiment.

3. Numerical Model

A numerical simulation was carried out using commercial Computational Fluid Dynamics (CFD) software ANSYS Fluent 19.0. A pressure-based iterative-coupled algorithm was utilized for discretizing the convective transport terms. This algorithm solves the momentum- and pressure-based continuity equations simultaneously. The full implicit coupling is achieved through an implicit discretization of pressure gradient terms in the momentum equations and an implicit discretization of the face mass flux, including pressure dissipation terms. The gas flow inside the kerf slot is assumed to be at a steady state, and compressible and turbulent. Therefore, in addition to the conservation equations, a standard kω turbulent model [22,23] based on turbulent kinetic energy (k) and specific dissipation rate of turbulent kinetic energy (ω) was used for solving turbulence in the flow. This model was selected based on the study carried out by Balabel et al. [21] where they investigated a modified kε turbulence model, a kω turbulence model, and a Reynolds stress model (RSM) over a wide range of nozzle pressure ratios to demonstrate their numerical accuracy in predicting the turbulent gas flow in a rocket nozzle with a complex nozzle wall geometry and found the kω turbulence model outperformed all other turbulence models. From their assessment they concluded that the kε turbulence models perform well in most of the cases related to a high-pressure gas flow; however, for the near wall flow problems, the kω turbulence model gives a better result. This study presents the gas flow analyses in various cases with variable nozzles and cut kerf geometry. Table 1 shows the study cases investigated in this work.

3.1. Governing Equation

The governing equations in the numerical simulation involved conservation of mass, momentum, and energy equations, and are given as follows:
Continuity equation:
· ( ρ u ) = 0
Momentum equation:
· ( ρ u u ) = p + · [ μ ( u + ( u ) T ) ] + · [ λ ( · u ) I ]
Energy equation:
· [ ρ u ( e + 1 2 u 2 ) ] = · ( κ T ) + · [ p u + τ · u ]
Additionally, the transport equations for the turbulent model consist of equations for turbulent kinetic energy k and the specific dissipation rate ω.
The turbulent kinetic energy equation:
· ( ρ u k ) = · ( ( μ + μ t σ k ) k ) + G k Y k
The specific dissipation rate equation:
· ( ρ u ω ) = · ( ( μ + μ t σ ω ) ω ) + G ω Y ω
Turbulent dynamic viscosity:
μ t = α * ρ k ω
The coefficient α * damps the turbulent viscosity causing a low-Reynolds number correction. This is given by:
α * = α * ( α 0 * + R e t / R k 1 + R e t / R k )
where α * = 1 , α 0 * = β i 3 , β i = 0.072, R e t = ρ k μ ω , and R k = 6.

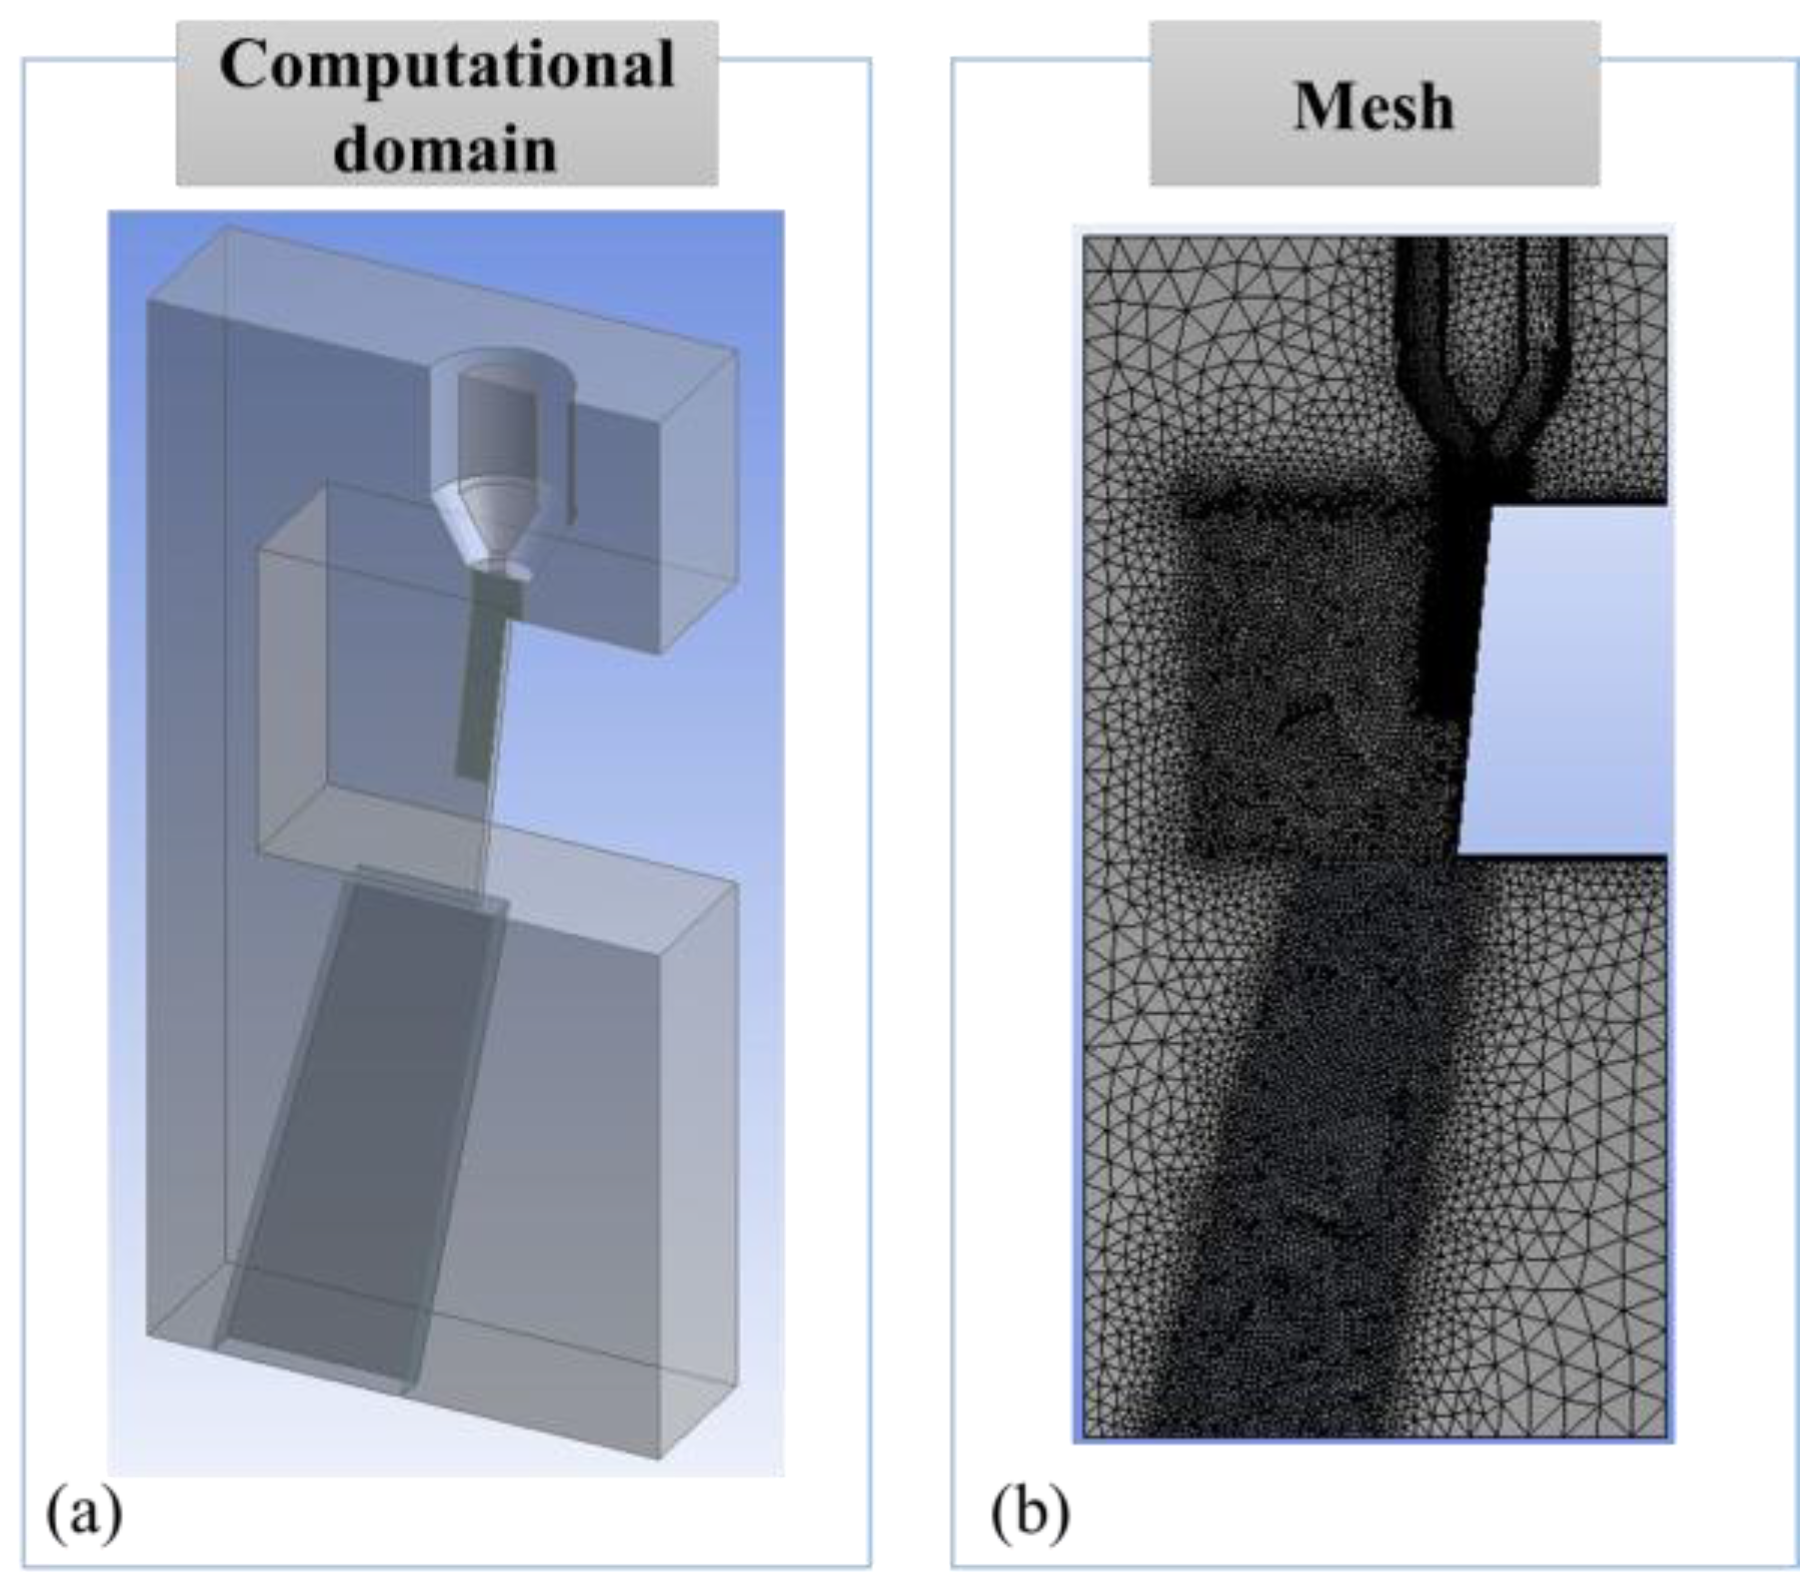
3.2. Computational Domain and Grid Generation
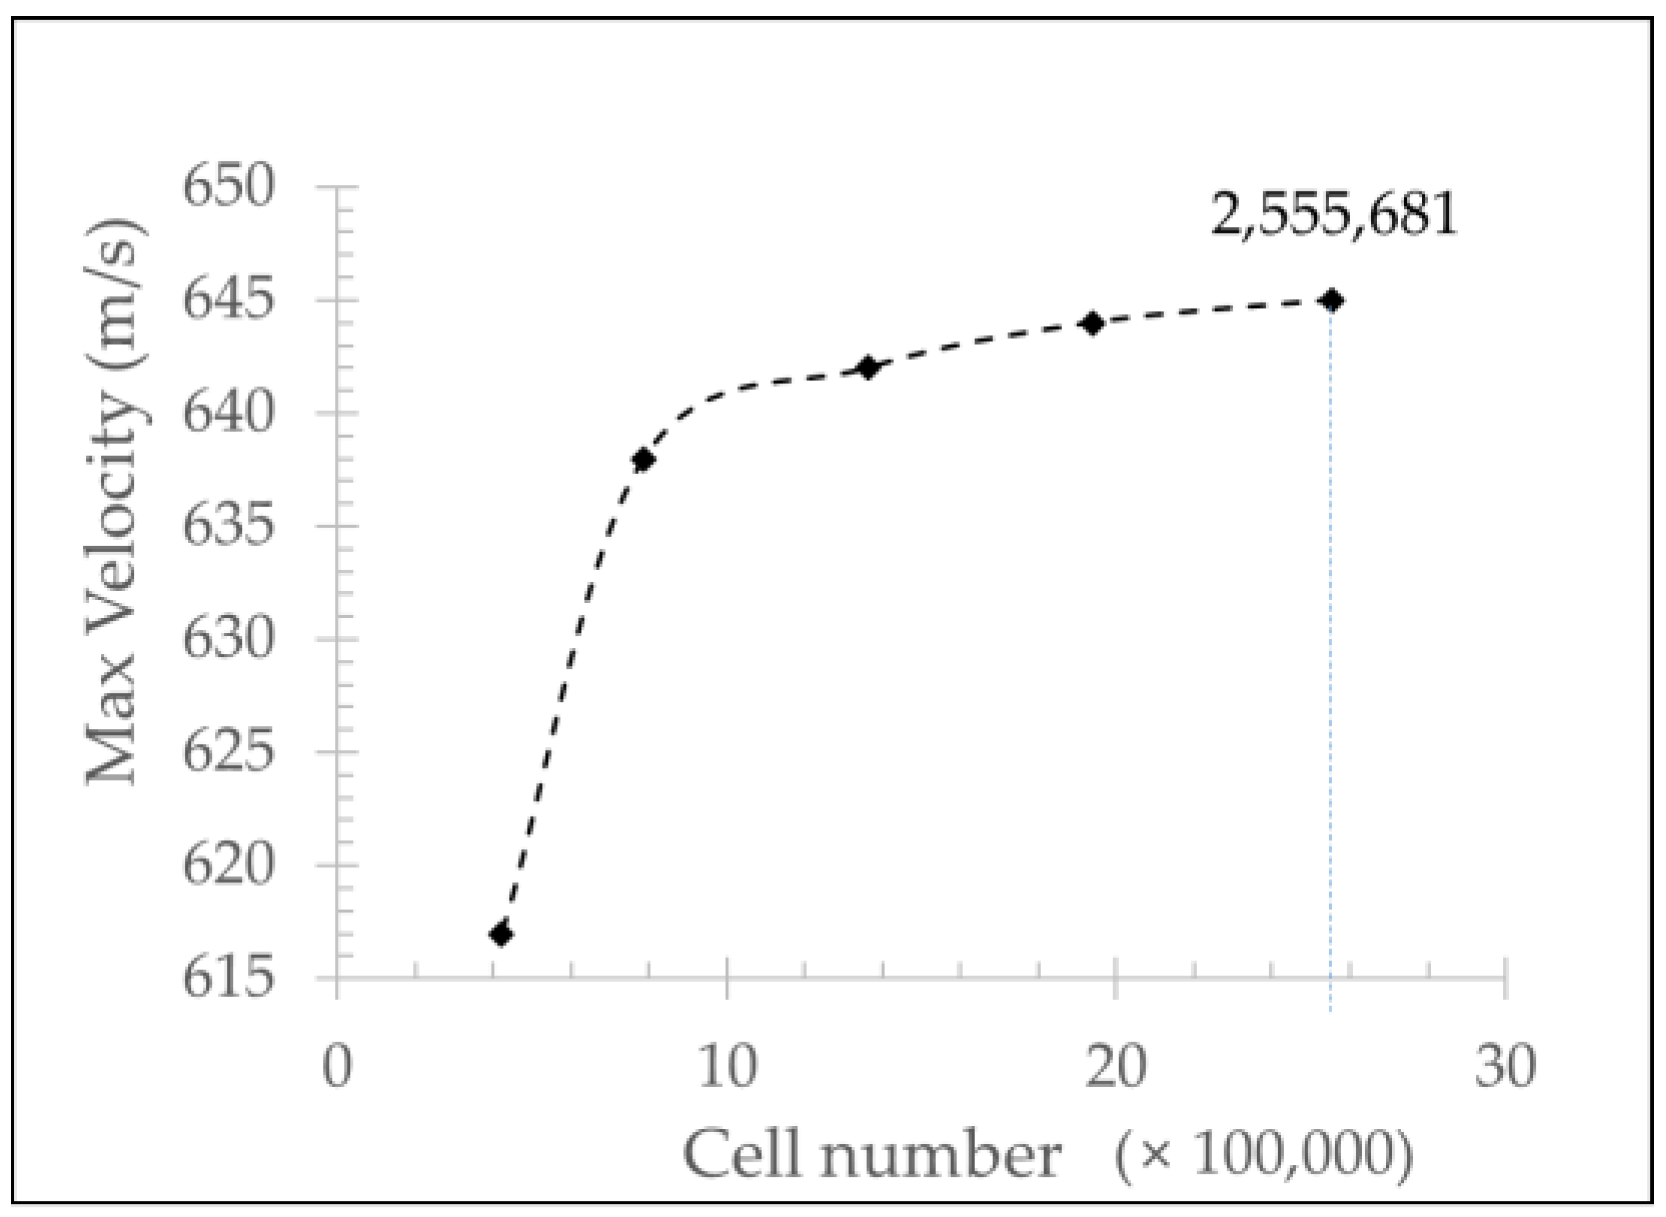
The numerical simulation was carried out for the computational domain, as shown in Figure 5a. The buffer zone under the bottom surface of the cutting sample is partitioned for a finer mesh. The gas flow behavior under the bottom surface can be used to understand the melt removal quality during the cutting process. Therefore, the region under the bottom surface near the kerf channel was finely meshed to capture gas flow dynamics with higher accuracy. The mesh size was chosen to be 0.3 mm at the inner wall of the nozzle and the kerf channel. The partitioned region under the bottom surface was meshed with an element size of 0.5 mm. The rest of the computational domain was meshed with a size of 3 mm. The total number of mesh elements in all the cases ranged from 2,600,000 to 3,200,000. Figure 5b shows the cross section of the mesh model.

Grid Independence

An insight into the sensitivity of the model with respect to various changes to the model parameter values is necessary for a CFD model. Therefore, a grid independence test was carried out on the mesh model. The element sizes of the walls inside the cut kerf and the inner wall of the nozzles were changed from 0.50 mm to 0.10 mm, the elements in the region at stand-off distance were altered from 0.10 mm to 0.01 mm, and the edges of the kerf on the top surface were altered from 0.20 mm to 0.01 mm to obtain a mesh model with various level of refinement. Each refinement level was maintained at a ratio above 1.3, which is greater than the recommended refining ratio of 1.1 [24]. Altogether five mesh models with cell numbers of 421,744, 786,368, 1,362,065, 1,938,360, and 2,555,681 were prepared to carry out a grid independence test. Maximum velocity along the flow direction was used to evaluate its dependency on the grid size. Figure 6 is the grid dependency result carried out in the mesh model. The modelled meshes show stable results as the cell number was increased above 786,368. Using a finer grid increases the computational cost greatly. Therefore, the grids chosen are usually a compromise between accuracy and computational time. However, in this study, the mesh size was reduced to a level where the shock wave structures were modelled well. Therefore, a mesh model with fine grid at the region of stand-off distance and cut kerf channel was used to accurately model the shock wave structures in the flow.

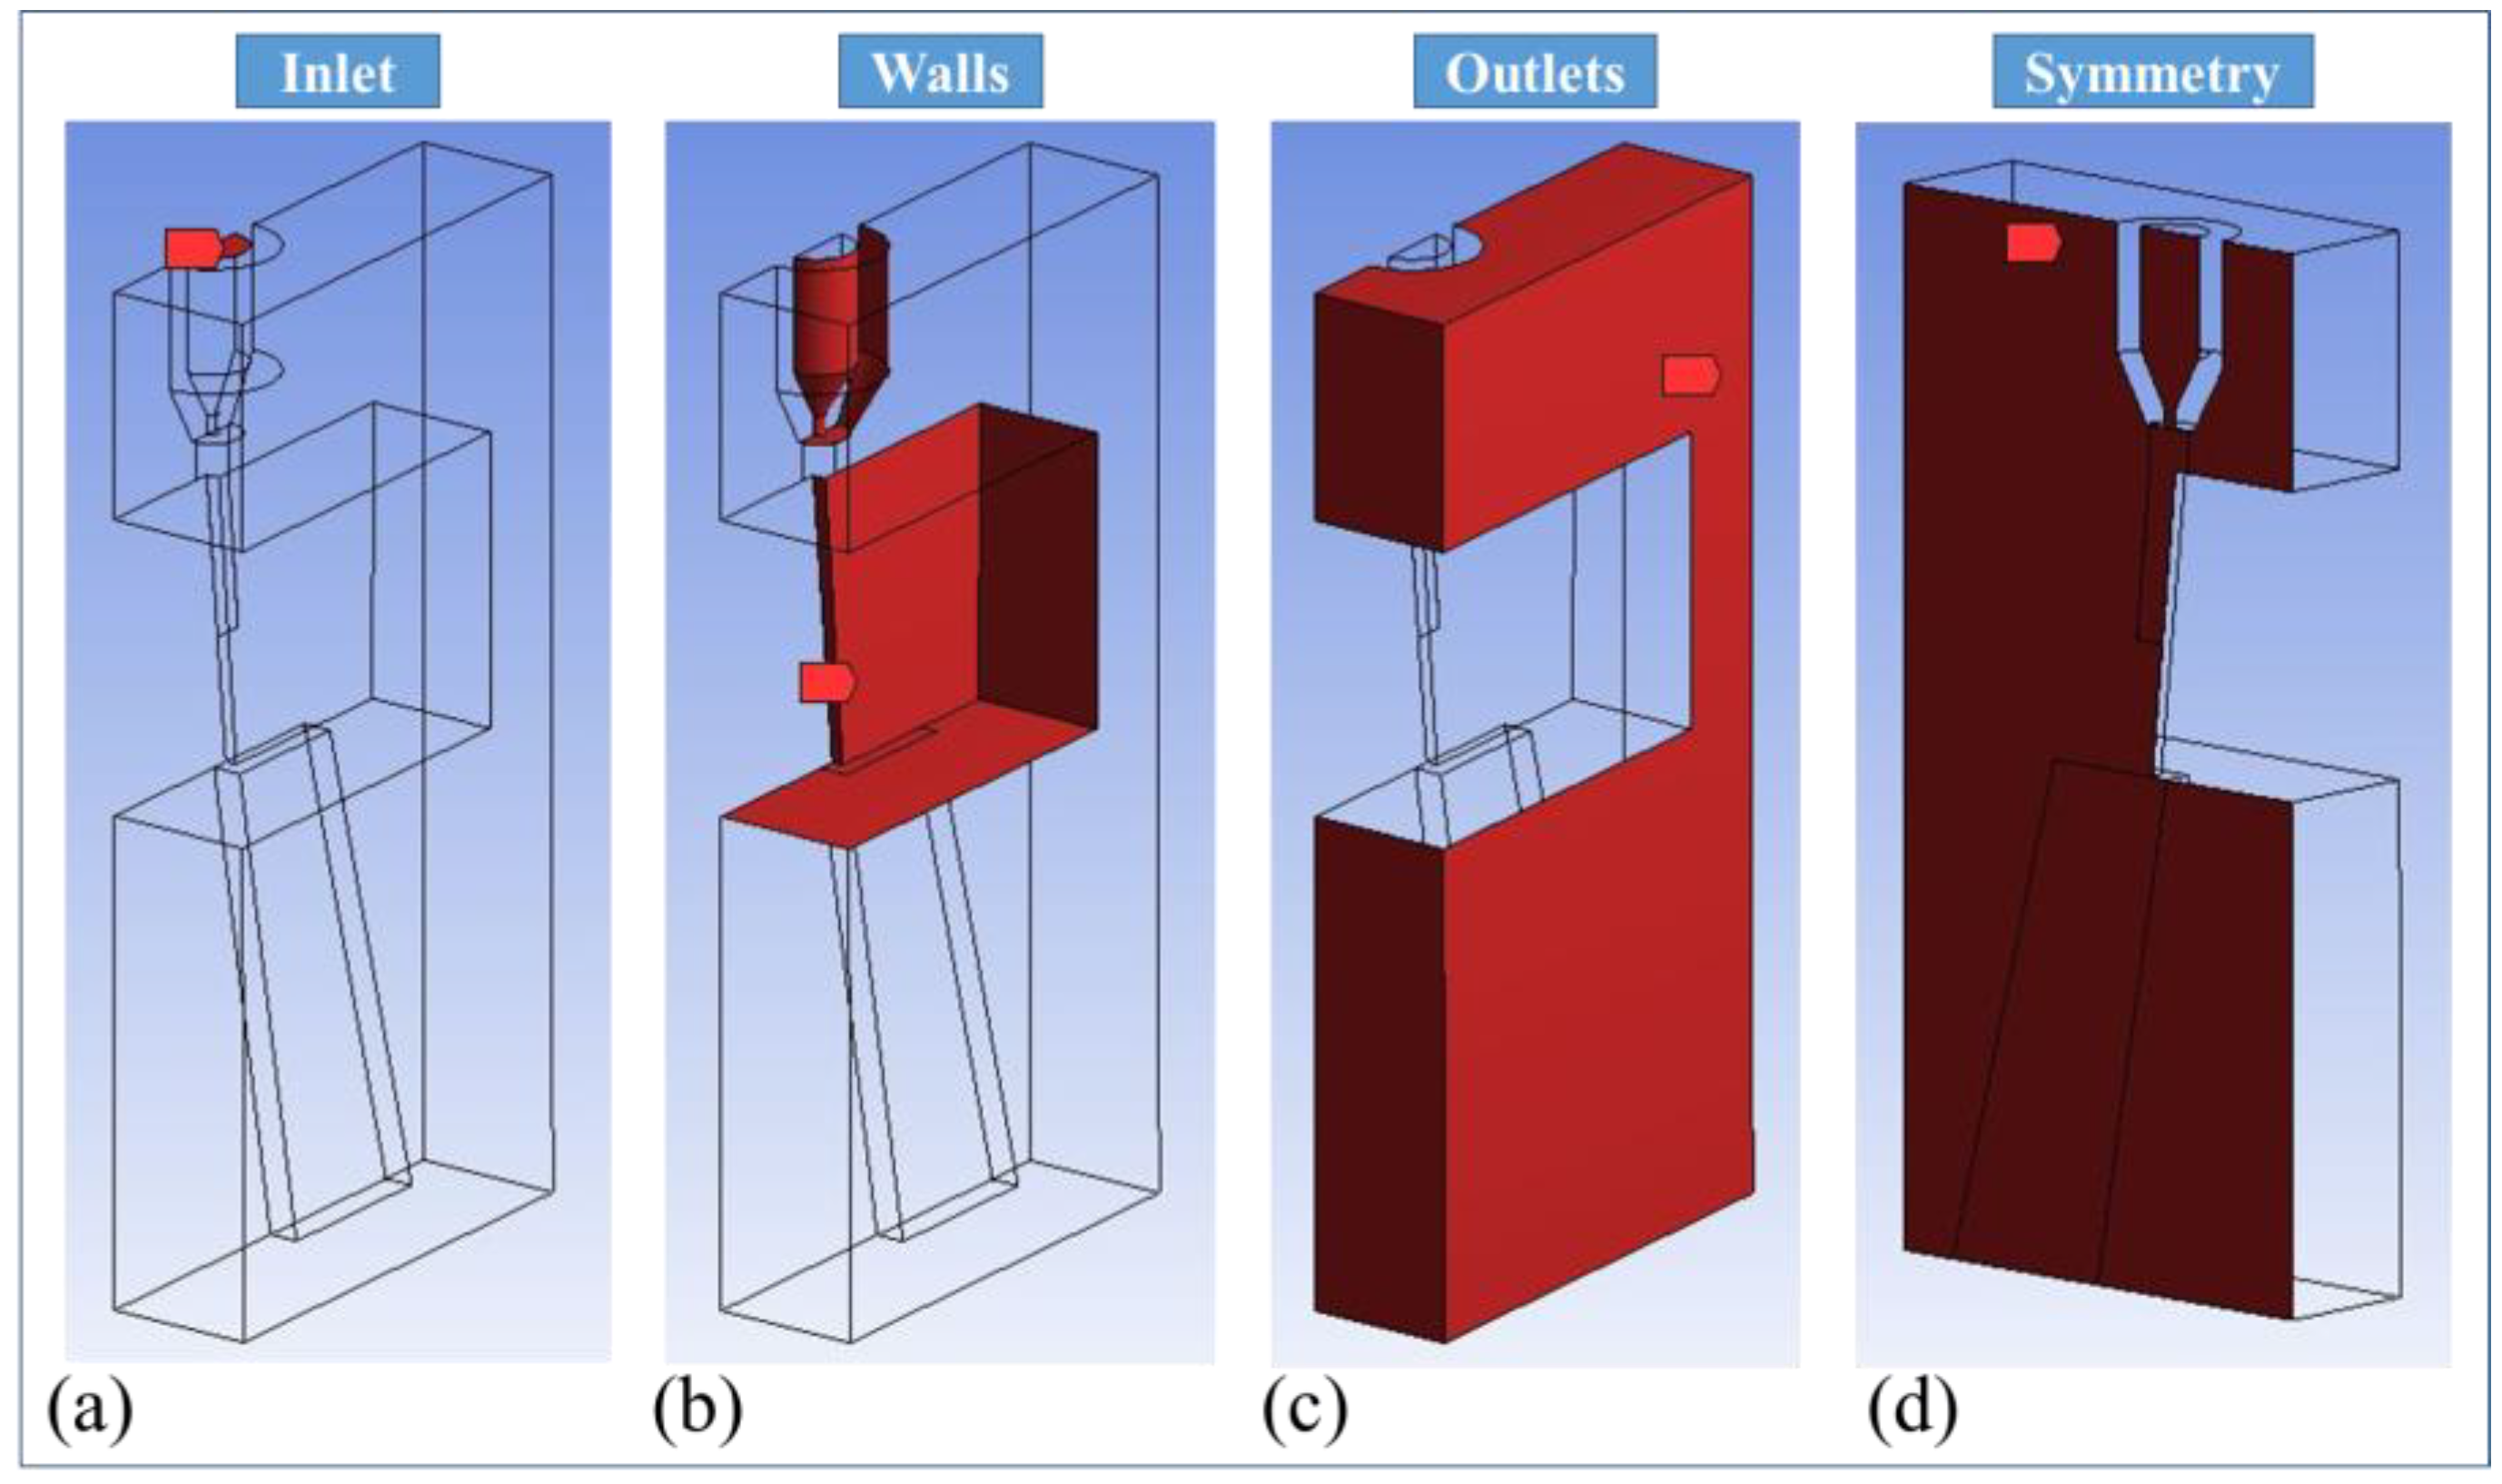
3.3. Boundary Conditions

The initial and boundary conditions were defined for velocity (u), pressure (p), temperature (T), and turbulence variables at the inlet, outlets, and walls. The inlet and outlets were modelled as pressure inlet and pressure outlets with a pressure value of 6 × 10⁵ Pascal (Pa) at the inlet and 0 Pascal (Pa) at the outlets. These are the gauge value taken from the Schlieren experiment. The temperature was fixed to 25 °C at both the inlet and outlets. All the walls were considered to be a stationary wall system and a no-slip boundary condition was used. The boundary layers are shown with colored patches in Figure 7.
ANSYS Fluent 19.0 was applied in the numerical modeling, and double precision was used for solving the governing equations. The computations utilize a pressure-based iterative-coupled algorithm for discretizing the convective transport terms. A compressible form of the Navier–Stokes equation along with the standard k–omega (kω) turbulence model, discretized by the second order upwind for momentum, energy, and turbulence equations, were used to simulate the phenomenon of the flow pattern along the cut kerf slot and around the top and bottom surface of the cutting plate. The number of iterations carried out in each case was 10,000.

4. Results and Discussion

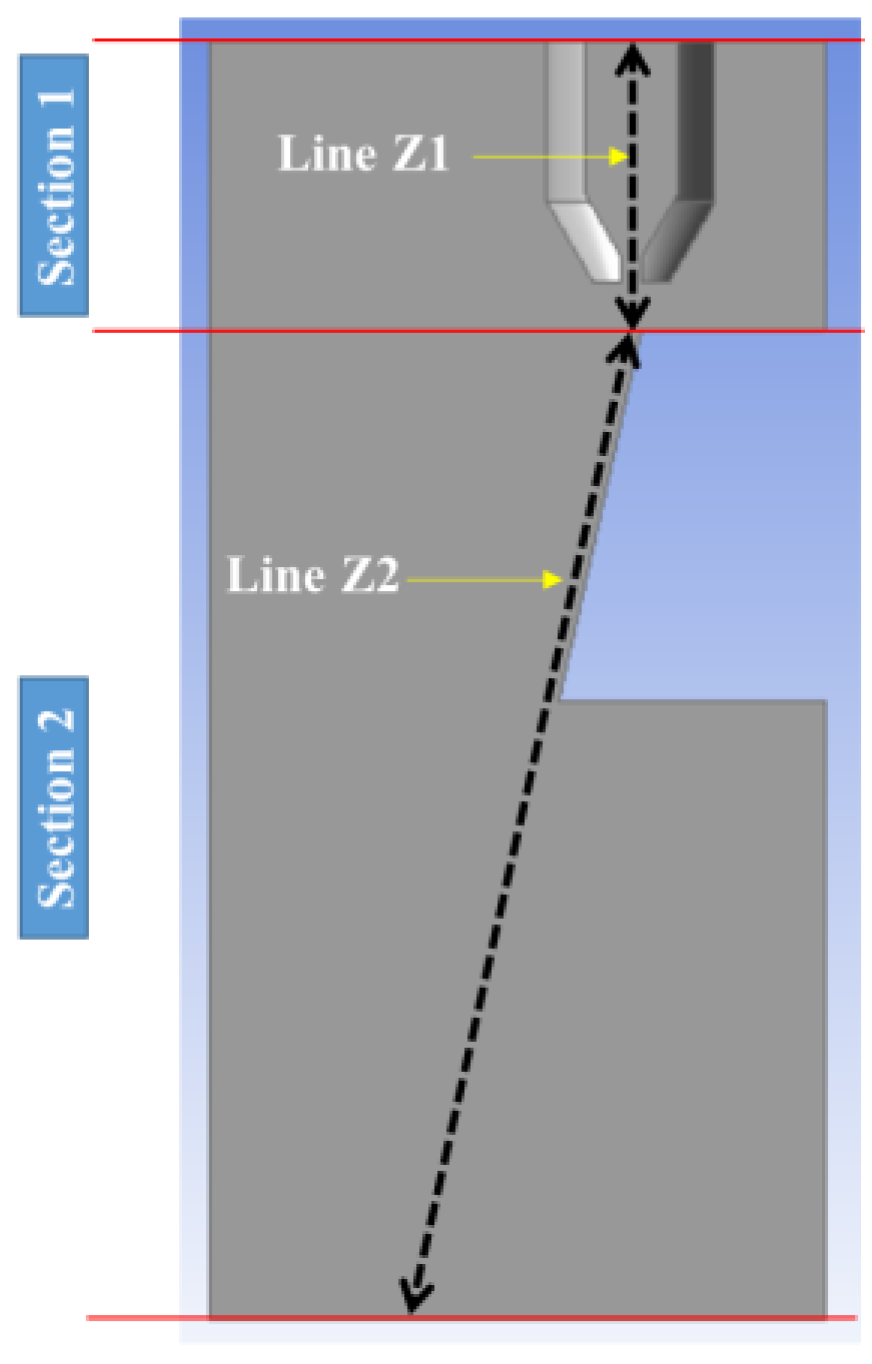
4.1. Numerical Results

The effect of various nozzle sizes on the dynamic characteristics of gas flow through the kerf channel was investigated by presenting the velocity and pressure distributions for the flow. The flow distribution was analyzed through the cut kerf and over and under the cutting plate. The velocity and pressure distribution in the three cut kerf models with the three different nozzles were studied for gas flow behavior. The flow behavior was examined along (a) the top surface of the cut sample and (b) the center plane parallel to the flow direction. The velocity and pressure distribution were calculated along two sections in the symmetry plane, as shown in Figure 8. The distribution curves for the velocity and pressure were plotted along the lines Z1 and Z2 given in Figure 8. Line Z1 passes along the nozzle axis and line Z2 is parallel to the inclination of the kerf at 0.5 mm offset from the end of the kerf. In addition, the velocity map along the plane at a distance of 0.1 mm from the top surface of the cut sample was assessed to investigate the flow deflection on the top surface.
The effect of nozzle diameter and kerf geometry on the behavior of gas flow was assessed through the pressure and velocity distribution along the kerf slot in the symmetry plane for all the cases discussed in Section 3. Figure 9 shows the pressure distribution along the symmetry plane of the computational domain. Similarly, Figure 10 represents the velocity distribution. In addition to the flow distribution along the kerf slot, the flow deflection along the top surface of the cutting sample was examined using a velocity map. Figure 11 shows the velocity distribution along the top surface of the cutting sample.
The gas flow through all the nozzles showed an under-expansion flow. This behavior is common for high-pressure flows in conical subsonic nozzles such as those being investigated in this study. The flow distribution along the nozzle and kerf slot for all cases showed uniformity and a good flow distribution. The pressure distribution along the flow direction exhibited oscillation that dampened as the flow propagated further downstream. The frequent oscillation inside the kerf slot near the top surface indicates the presence of an oblique shock wave. Further downstream, the flow exhibits periodic oscillation that dampens as the flow propagates away from the nozzle. This is due to the presence of shock structures along the flow propagation direction, as observed in the Schlieren experiment. The velocity field shows a similar oscillation in the flow indicating an interrelation between the velocity and pressure field.

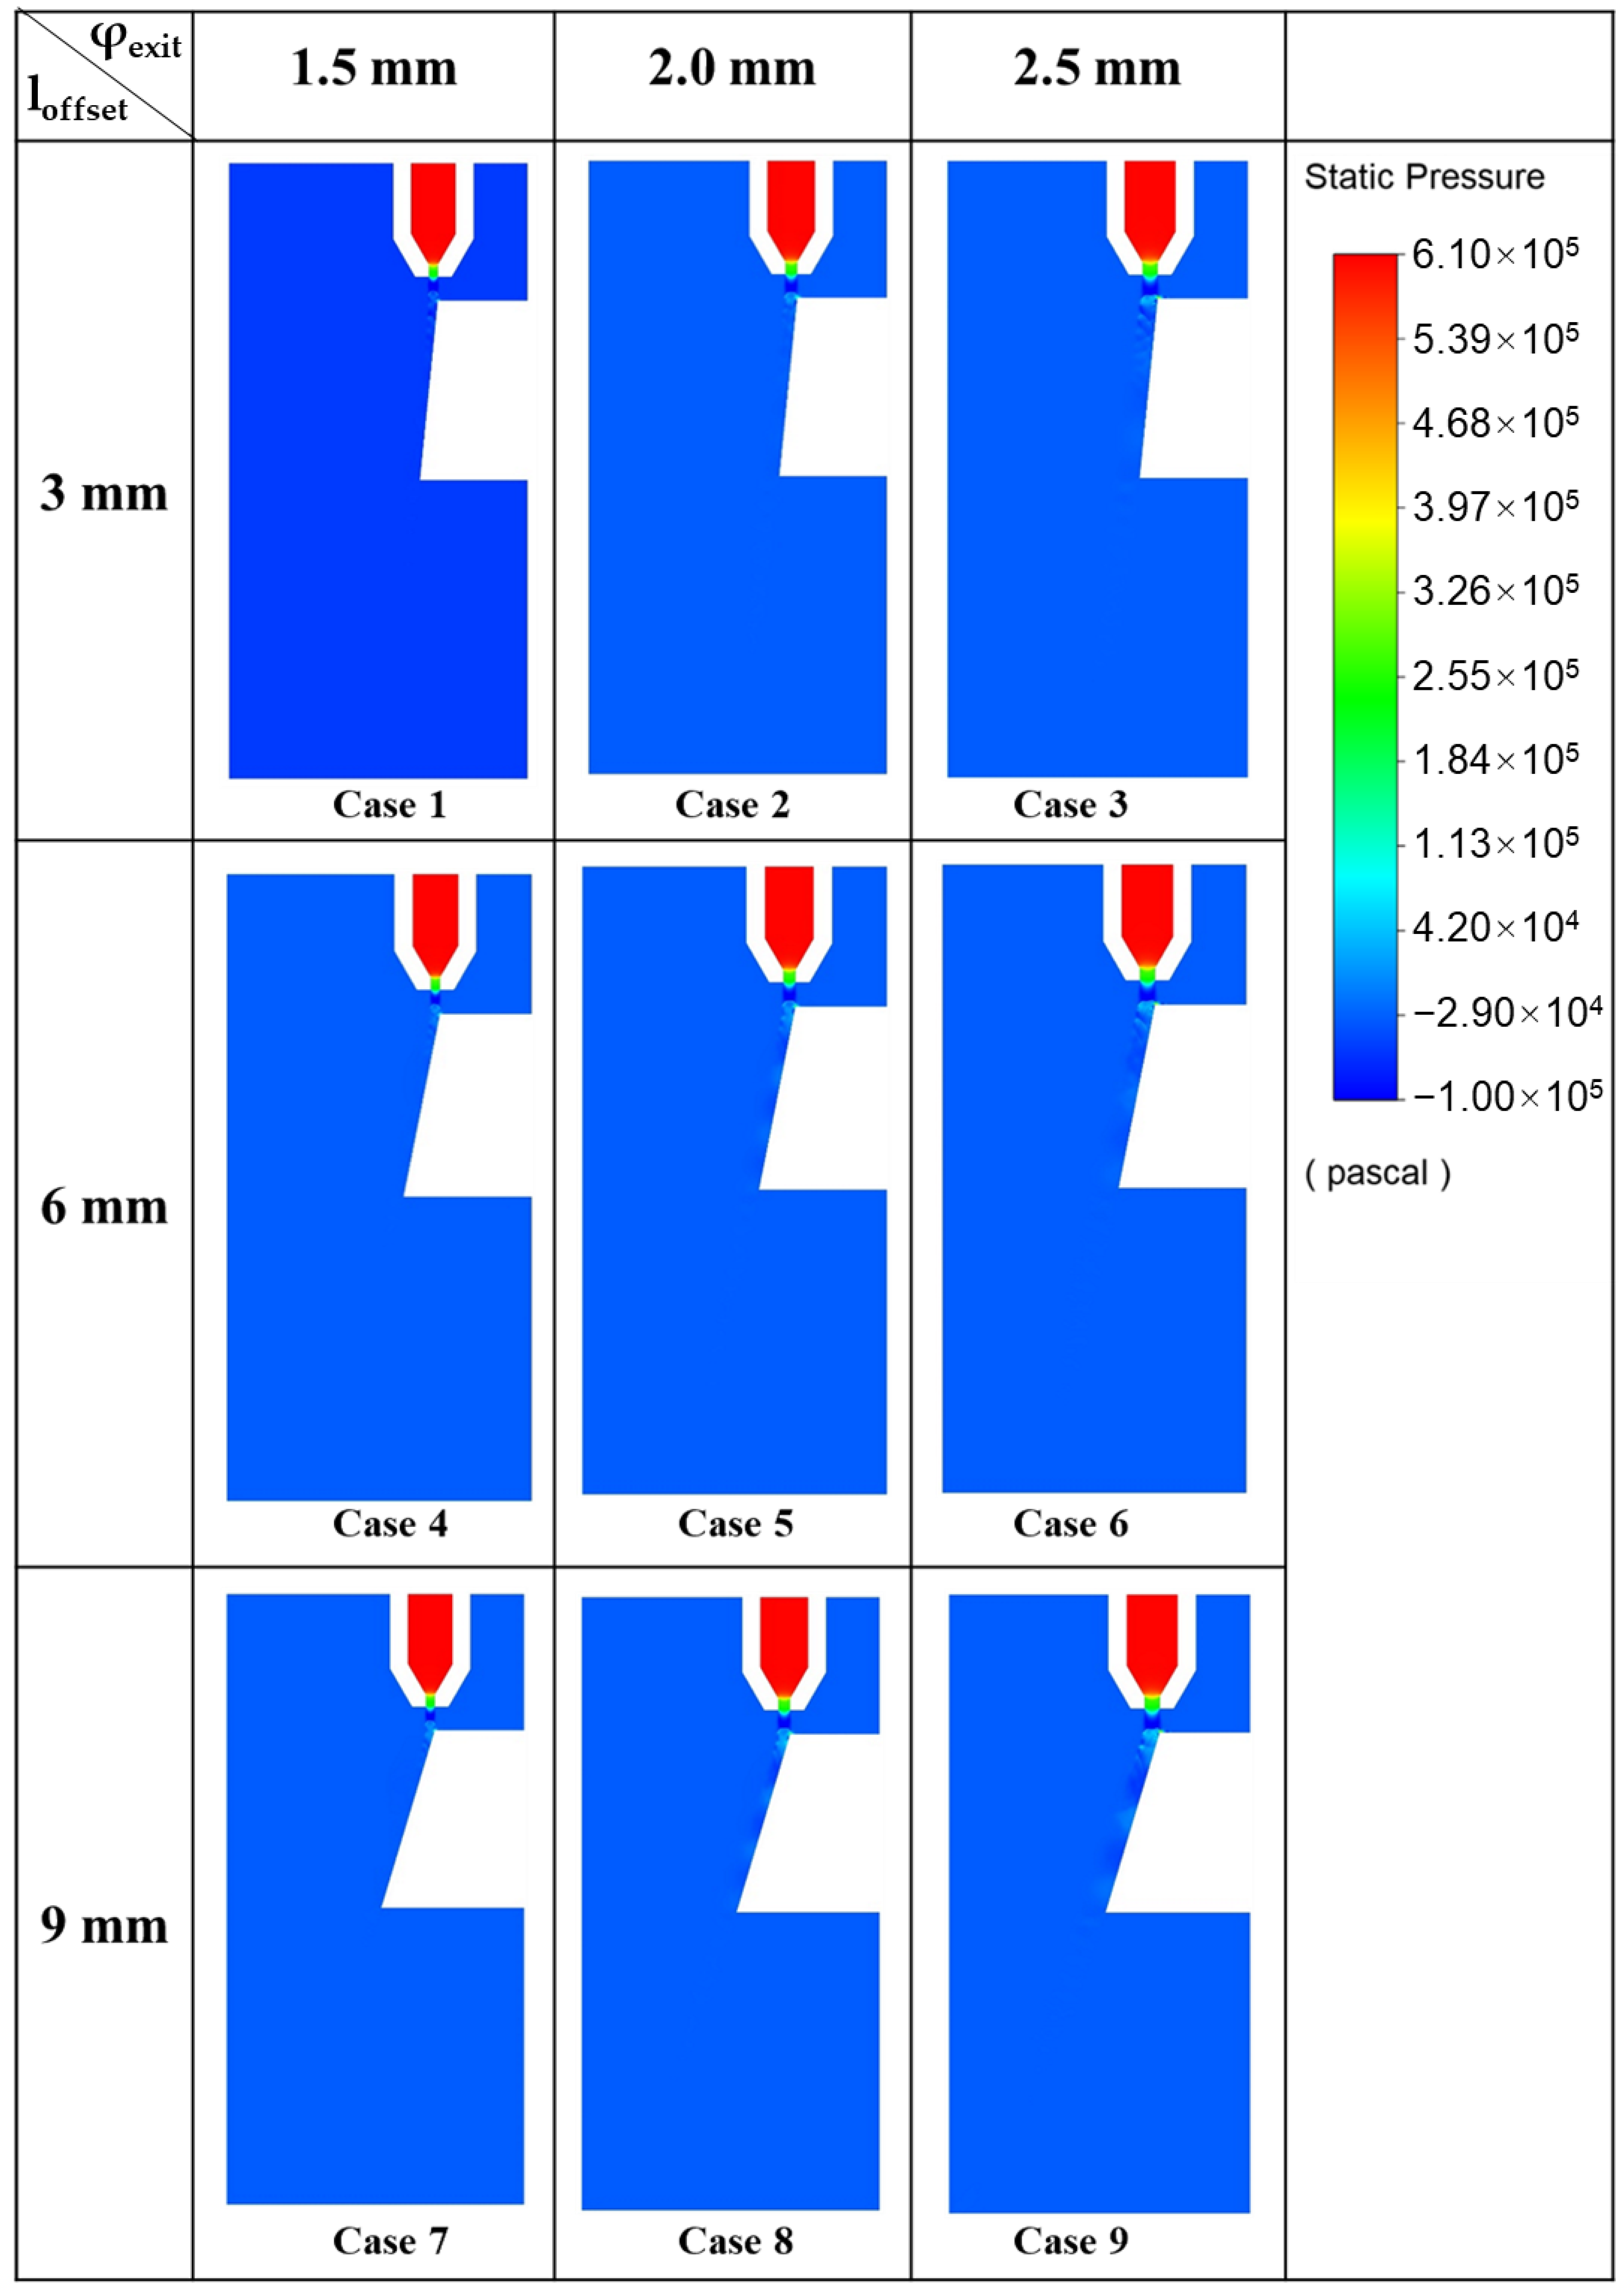
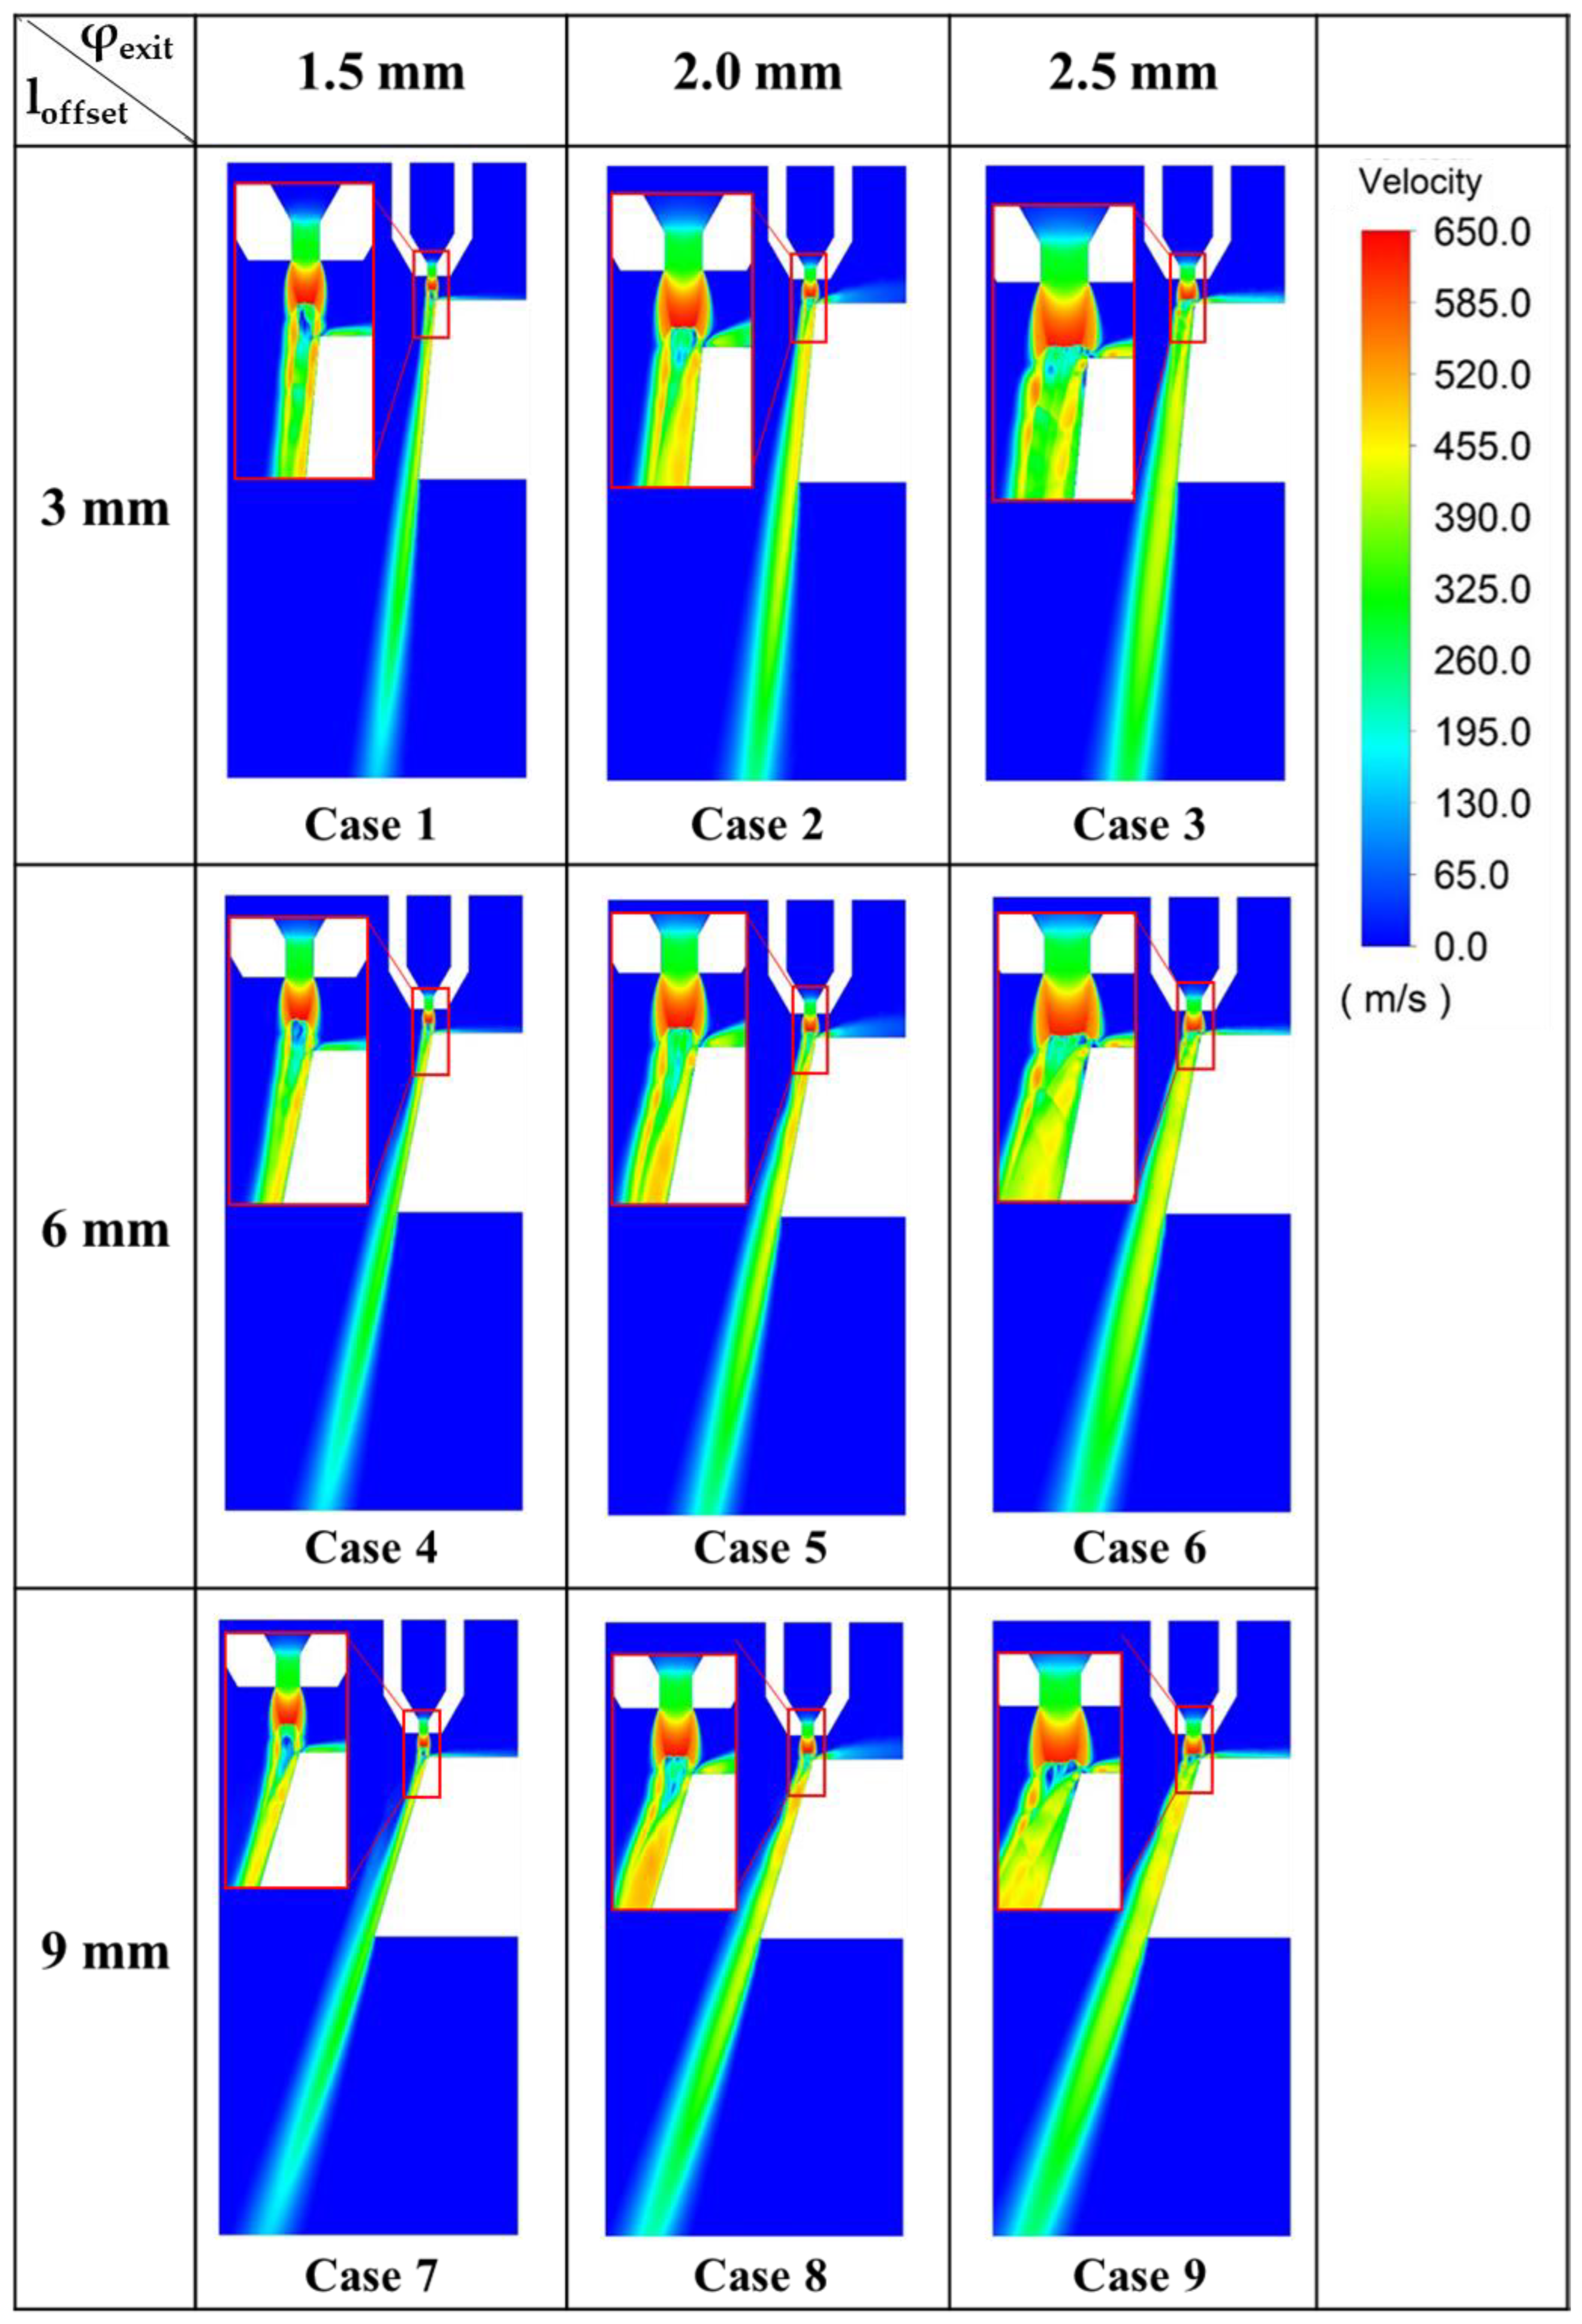
4.1.1. Effect of Nozzle Exit Diameter on Gas Flow Characteristics

The numerical results for pressure distribution showed the presence of low- and high-pressure regions along the flow propagation. The oscillation in the pressure profile along the flow direction is due to the presence of shock wave structures, as observed in the Schlieren experiment results. Figure 12, Figure 13 and Figure 14 show the pressure distribution curve along the Z1 and Z2 lines. The pressure distribution curves follow a sinusoidal wave pattern with exponentially decaying amplitude as the flow progresses inside the kerf slot. The high- and low-pressure regions are formed along the flow direction and are shown with the crest and trough in the pressure curves.
The pressure distribution curves along line Z1 in Figure 12, Figure 13 and Figure 14a exhibit a gradual decline in flow pressure as the flow reaches the conical structure of nozzle. The flow experiences a sudden expansion as it exits the nozzle and therefore further loss in the flow pressure can be observed. A discontinuity in the flow pressure curve can be seen at different positions depending on the nozzle exit diameter (φexit), which indicates the presence of a normal shock wave (Mach disk) structure in the flow. The normal shock wave was observed farther from the nozzle tip as the exit diameter (φexit) of nozzle increased.
The pressure distribution curves along line Z2 showed high oscillation in the flow near the top surface of the kerf slot. This is due to the presence of oblique shock waves. As the flow propagated further downstream, the oblique shock wave grew weaker. Therefore, the pressure curves in these region exhibited a smooth periodic oscillation which dampened exponentially, as seen in Figure 12, Figure 13 and Figure 14b.
The flow from the nozzle with an exit diameter of 2.0 mm exhibited oscillation with the lowest intensity near the top surface of kerf slot in comparison to the flow from the other two nozzles. The high intensity oscillation near the top surface of kerf slot indicates the presence of stronger oblique shock waves. Though both the nozzles with exit diameters of 1.5 mm and 2.5 mm exhibited a high intensity of oscillation, the frequency of oscillation was higher for 1.5 mm nozzle. This indicated the presence of oblique shock waves at a closer distance in the flow through the 1.5 mm nozzle. In the cases with 2.5 mm nozzle, the under-expanded jet from the nozzle exit deflected greatly as the flow impinged on the top surface of the kerf slot. The deflection in gas flow caused disruption in the flow propagation inside kerf slot, generating additional shock wave structures. Hence, high intensity oscillation was seen near the top surface of the cut kerf in the flow from the 2.5 mm nozzle.
As the flow propagated further downstream, a smooth periodic oscillation was seen in the pressure curves. This indicates the absence of an oblique shock wave structure and the presence of periodic high- and low-pressure regions along the direction of the flow. The intensity and the distance between the smooth periodic oscillations was higher for the nozzle with the larger exit diameter.
The velocity distribution resembles the pressure distribution in many ways. Figure 15, Figure 16 and Figure 17 show the velocity distribution curves which show that the low-pressure region in the pressure distribution map corresponds with the high velocity region in the velocity distribution map and vice versa.
Similar to the pressure curves, the velocity curves along the line Z1 given in Figure 15, Figure 16 and Figure 17a showed discontinuity at the position where a Mach shock disk was generated. The Mach shock disk behaves as a barrier and prevents the flow from passing through. Therefore, a rapid drop in velocity behind the Mach shock disc was observed. The gas tends to flow around the Mach shock disk and therefore high flow velocity can be seen around the Mach disk in the velocity distribution map shown in Figure 10.
The velocity distribution curves along the line Z2 are shown in Figure 15, Figure 16 and Figure 17b. The amplitude and wavelength in the velocity curves showed a similar pattern with those of the pressure curves. The velocity curves along line Z2 in Figure 15, Figure 16 and Figure 17b show that the flow from the 1.5 mm nozzles experienced a greater loss in velocity magnitude as the flow propagated inside the kerf. The presence of a higher number of oblique shock waves near the top surface of the kerf slot deteriorated the flow significantly.
Similarly in the 2.5 mm nozzle flow, the shock wave structures generated due to the deflection of the flow on the top surface of the kerf slot affected the flow adversely. Thus, a low velocity magnitude was measured under the bottom surface of the kerf slot.
For improved thermal cutting performance, the melt removal efficiency is expected to be high; however, a highly deteriorated gas flow can reduce this efficiency. From the velocity curves, it can be seen that the flow velocity at the lower surface of the cutting sample is lowest for cases with a 1.5 mm φexit nozzle. The cases with a 2.5 mm and 2 mm φexit nozzle show similar performance in most of the cases. However, because of the highly under-expanded flow in the cases with a 2.5 mm φexit nozzle, the deflection along the top surface is high in comparison to the other two nozzles.
In Figure 11, the deflection of gas flow along the top surface of the cutting sample can be seen for all the cases assessed in this study. These figures show that the deflection is high for nozzles with a larger exit diameter. The under-expanded gas exiting the nozzle forms a stagnation point at the region where the free stream contacts the top surface. The gas flow through a nozzle with a larger exit diameter shows a higher degree of expansion, resulting a larger volume of gas contacting the top surface during the collision. Hence, the flow along the top surface is deflected to a greater extent as the nozzle exit diameter increases. Thus, considering the flow deflection rate along the top surface and the rate of flow deterioration in the flow direction, the 2 mm φexit nozzle shows better performance in gas flow dynamics through the given kerf slots.

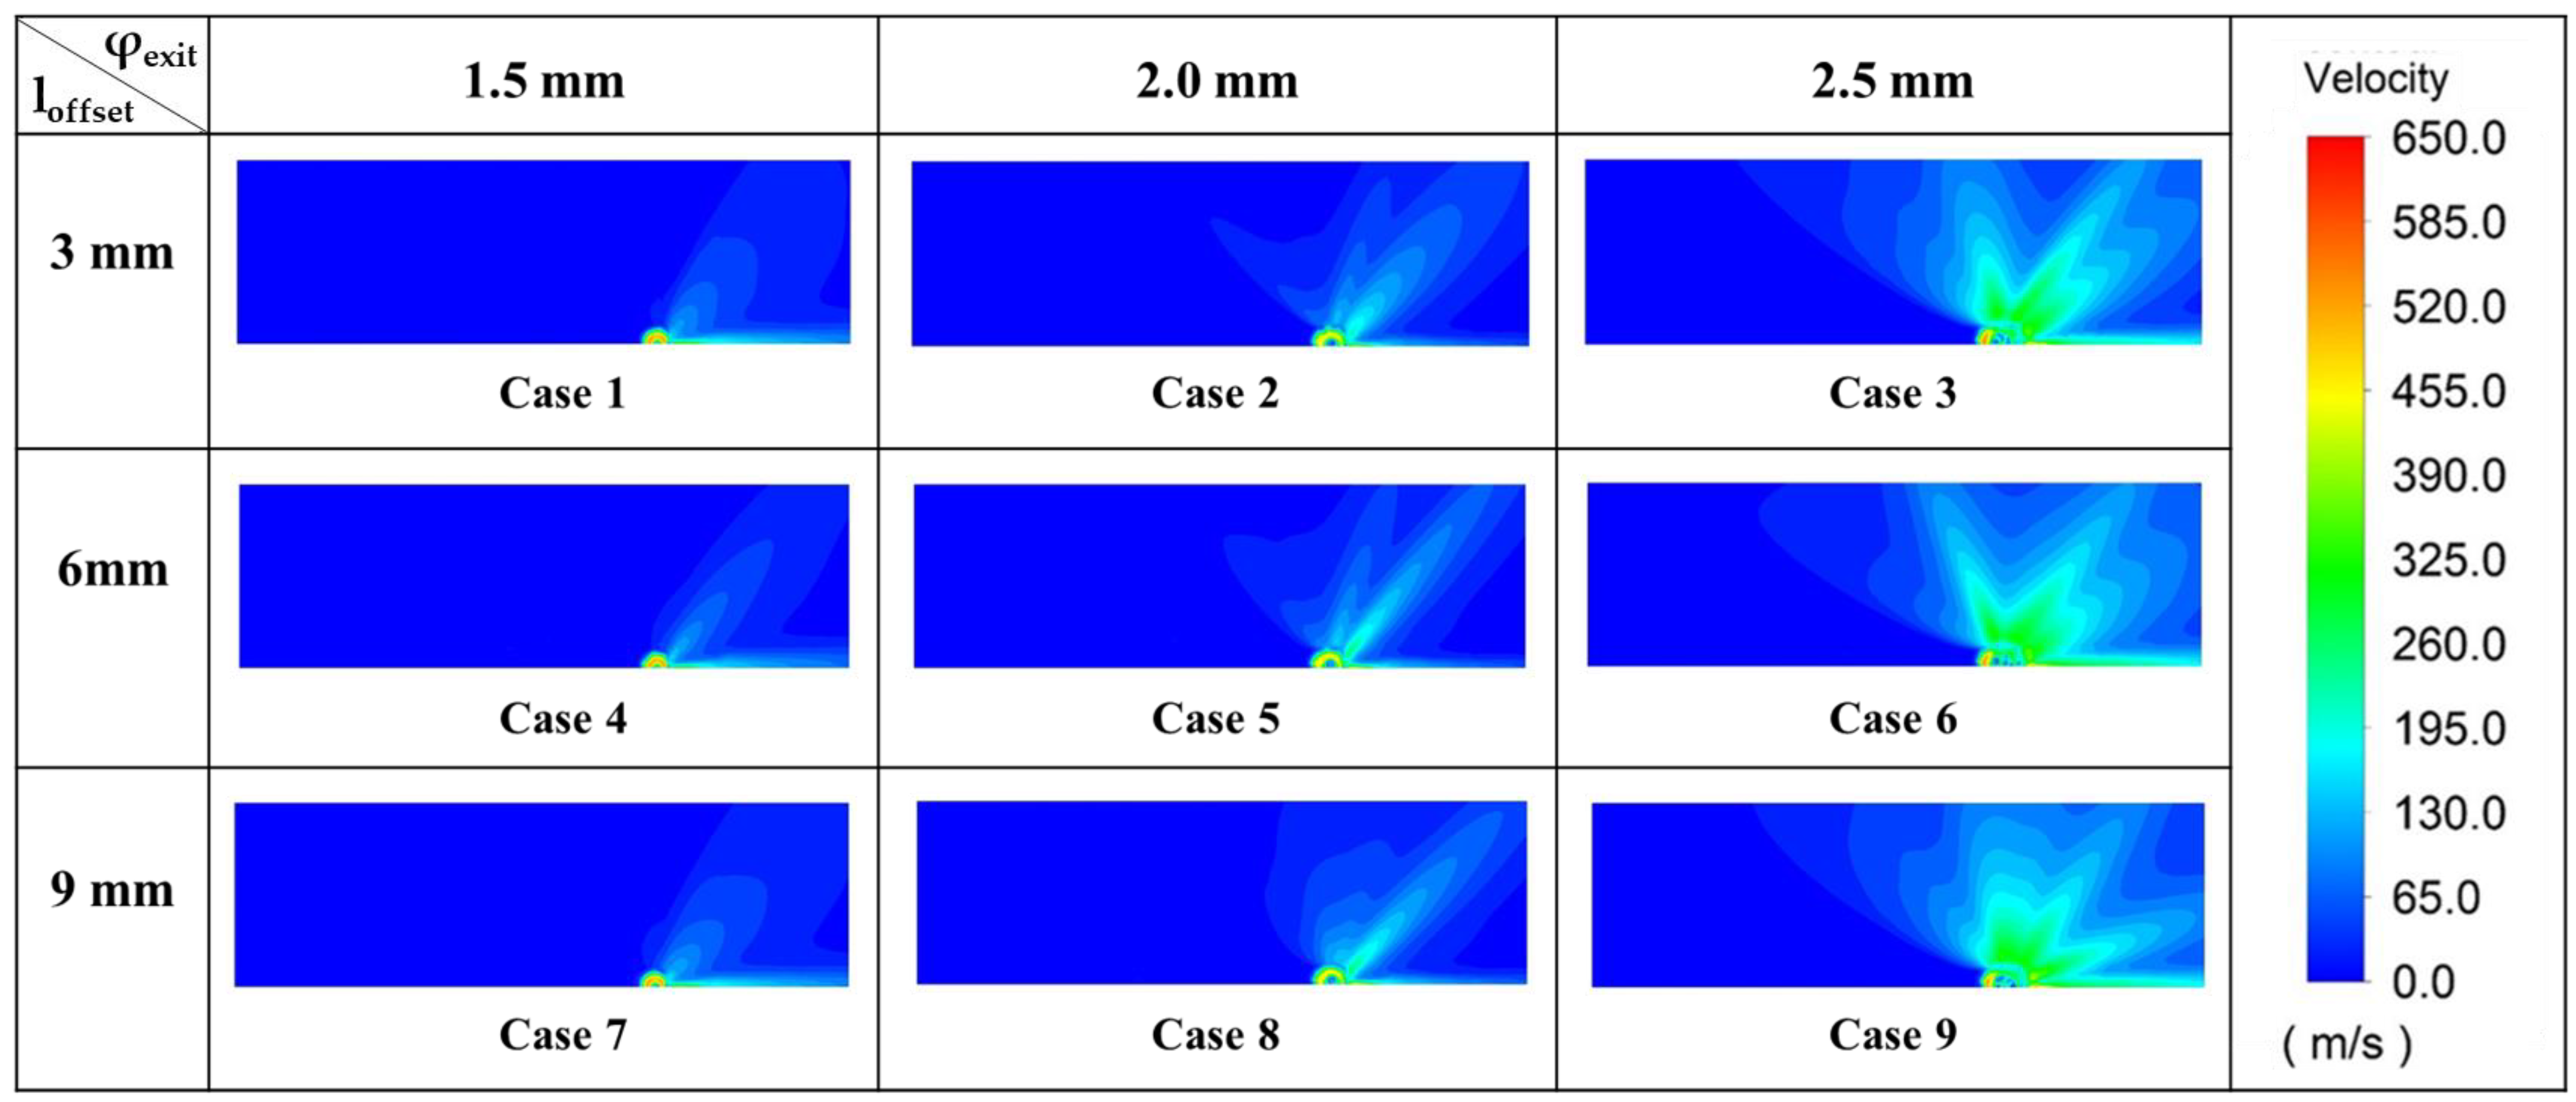
4.1.2. Effect of the Cut Front Slope (Variation in loffset) on Gas Flow Characteristics

The change in slope of the cut front in the kerf slot showed variations in gas flow behavior. As the slope of the inclined cut front decreased (increase in loffset), a damping effect along the flow direction increased, resulting in a reduction of the flow velocity. The sets of cases 1, 4 and 7; 2, 5 and 8; and 3, 6 and 9 represent cases with the same nozzle and varying slopes of the cut front inside the kerf. The pressure and velocity distribution curve along line Z2 is shown for these sets of cases in Figure 18 and Figure 19, respectively.
The pressure distribution curves in Figure 18a show the reduction in the amplitude of the curve as the slope of the cut front is reduced (loffset increased). The nozzle used in these cases was of a 1.5 mm exit diameter. It can be noticed that the pressure distribution curves show a high frequency of oscillation near the top surface in all the cases given in Figure 18a. This phenomenon was observed because of the presence of a higher number of oblique shock waves. The kerf with a lower cut front slope (longer loffset) experienced a higher degree of damping effect. Therefore, the amplitude of the pressure curve in the kerf with a low cut front slope dampened more rapidly.
In the cases shown in Figure 18b,c, the amplitude of the pressure distribution curve increased with the decrease in cut front slope (increase in loffset). In cases with the highest cut front slope (loffset = 3 mm) given in Figure 18b,c (i.e., cases 2 in Figure 18b and case 3 in Figure 18c), the frequency of oscillation was higher in comparison to other cases. This phenomenon is due to the presence of high oblique shock wave structures near the top surface. Due to these shock wave structures, the flow experiences loss in pressure. On the other hand, for the cases with lower cut front slope (higher loffset distance), the pressure curves show less oscillation near the top surface. Therefore, the pressure drop due to shock wave structures is low in these cases. Hence, the pressure distribution curve shows a smoother transition and the amplitude of the pressure curve increase with the decrease in cut front slope (increase in loffset).
The velocity curves shown in Figure 19a–c show a similar result. As the flow entered the kerf slot, the kerf with a low cut front slope (high loffset) gained higher flow velocity. This can be attributed to the reduced number of shock wave structures. As the flow propagated further downstream in the kerf slot, the flow velocity reduced rapidly. This reduction in flow velocity can be attributed to the drag force on gas flow applied by the inclination of the cut front.
The high variation in flow velocity due to the change in the slope of the cut front can reduce the melt removal efficiency as the cutting speed increases; therefore, the nozzle showing consistent flow dynamics at variable operating conditions is preferable for the cutting operation. From our studies in this work, a 2 mm φexit nozzle shows a high degree of consistency in flow dynamics at variable operating conditions.

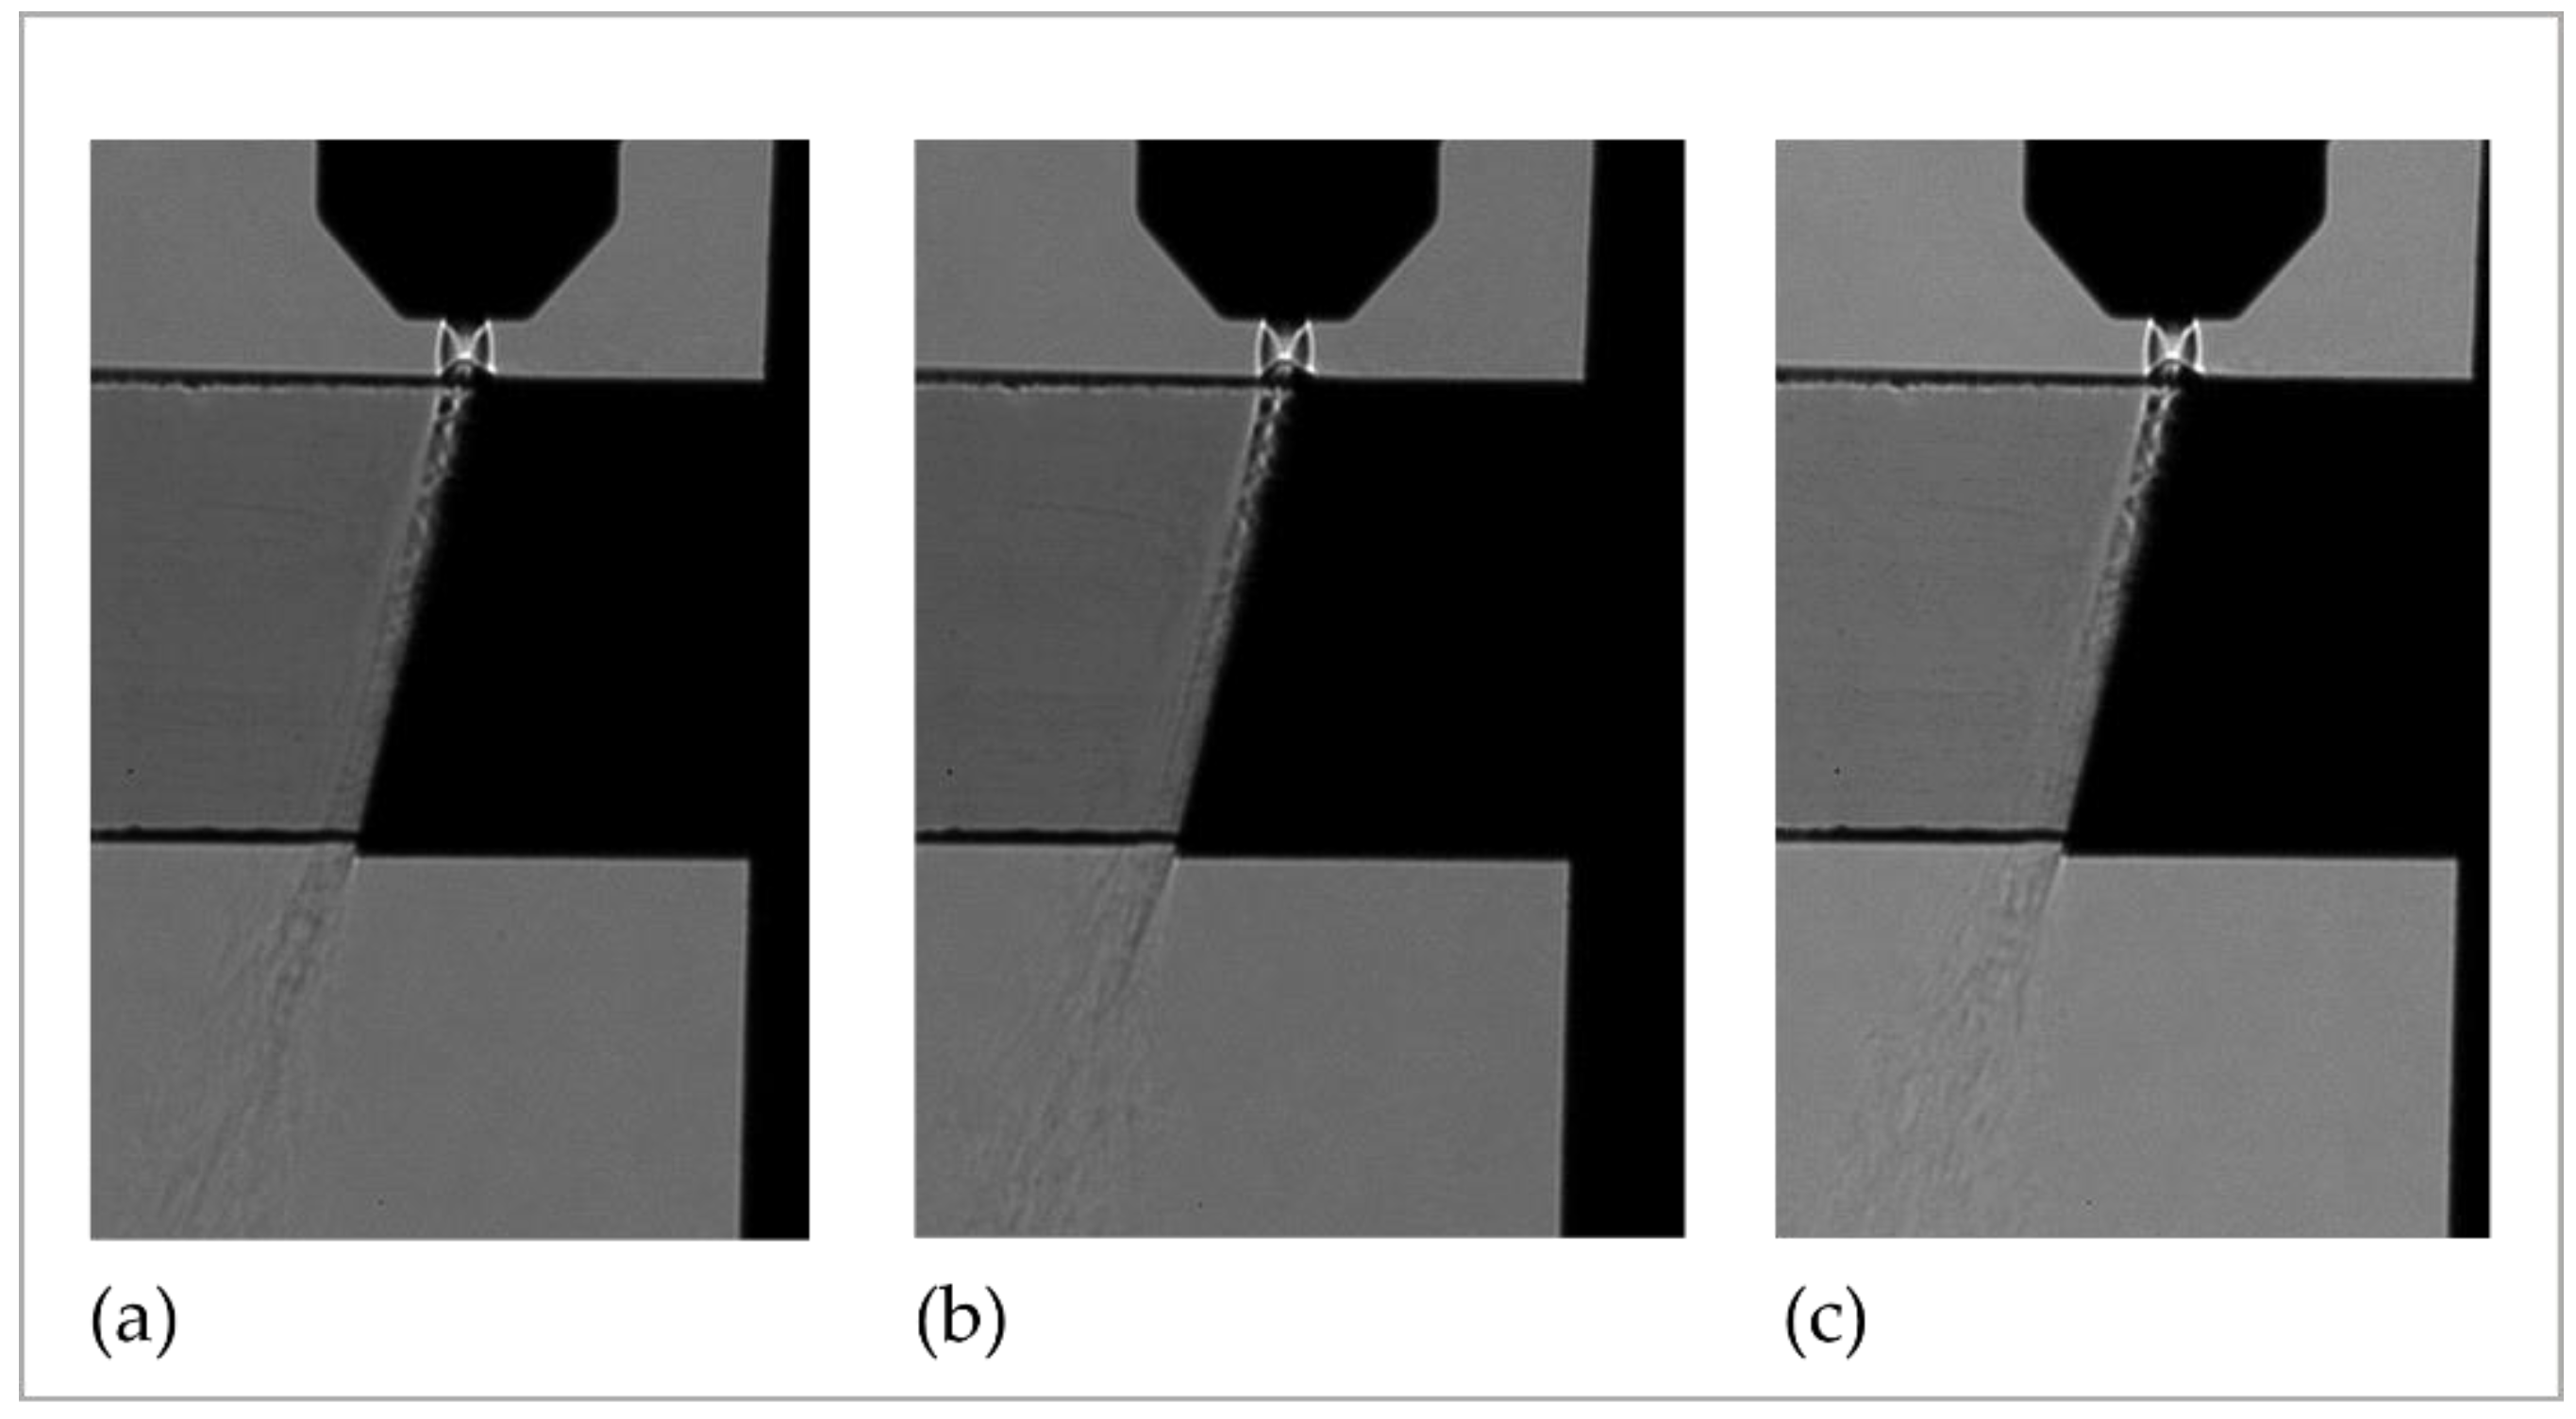
4.2. Schlieren Measurement

A velocity field map, density gradient map, and numerical Schlieren image constructed from the numerical simulation results were used to compare the simulation and experimental results. Figure 20 shows a side-by-side comparison between the simulation and experimental results for all nine cases. The flow pattern obtained from the Schlieren experiment, and the simulation results are closely correlated regarding the generation of Mach shock disk and oblique shock wave structures. The numerical model was able to simulate the gas flow with intricate details such as flow separations near the entrance of the kerf slot and the tiny fluctuations in separated flows. The density gradient map from simulation results shows a significant resemblance with the density gradient map captured with Schlieren method. The jet structure under the kerf slot seen with Schlieren experiment was similar with the results predicted by numerical simulation. The length of the tail seen in the Schlieren experiment shows a high degree of similarities with the tail length of the jet seen in density gradient map from the simulated results. A velocity map, density gradient map and numerical Schlieren image from the Simulation results are given in the first, second, and third column of Figure 20, respectively. The images captured from Schlieren experiment are given in the last column of Figure 20.
The high degree of similarities between the simulation and experimental results can be used to validate the simulation results. Thus, the results obtained from the simulation can be used to further analyze the gas flow behavior to select an optimal nozzle geometry.

5. Conclusions

In this research, the effects of nozzle exit diameter (φexit) and the slope of the cut front (loffset distance) on the behavior of a gas-assisted thermal cutting flow inside the kerf slot was investigated. Three nozzles with variable exit diameters were studied for gas flow behavior inside cut kerf slots with variable cut front slopes. A total of nine cases were assessed in this study. The gas flow dynamics for these cases have been numerically simulated using Ansys FLUENT 19.0 employing a kω turbulence model. The pressure and velocity field along the flow path inside the kerf slot were analyzed. The predicted results from the numerical simulations were compared with the actual flow patterns obtained from the Schlieren method. Based on the results obtained, the following conclusions can be drawn:
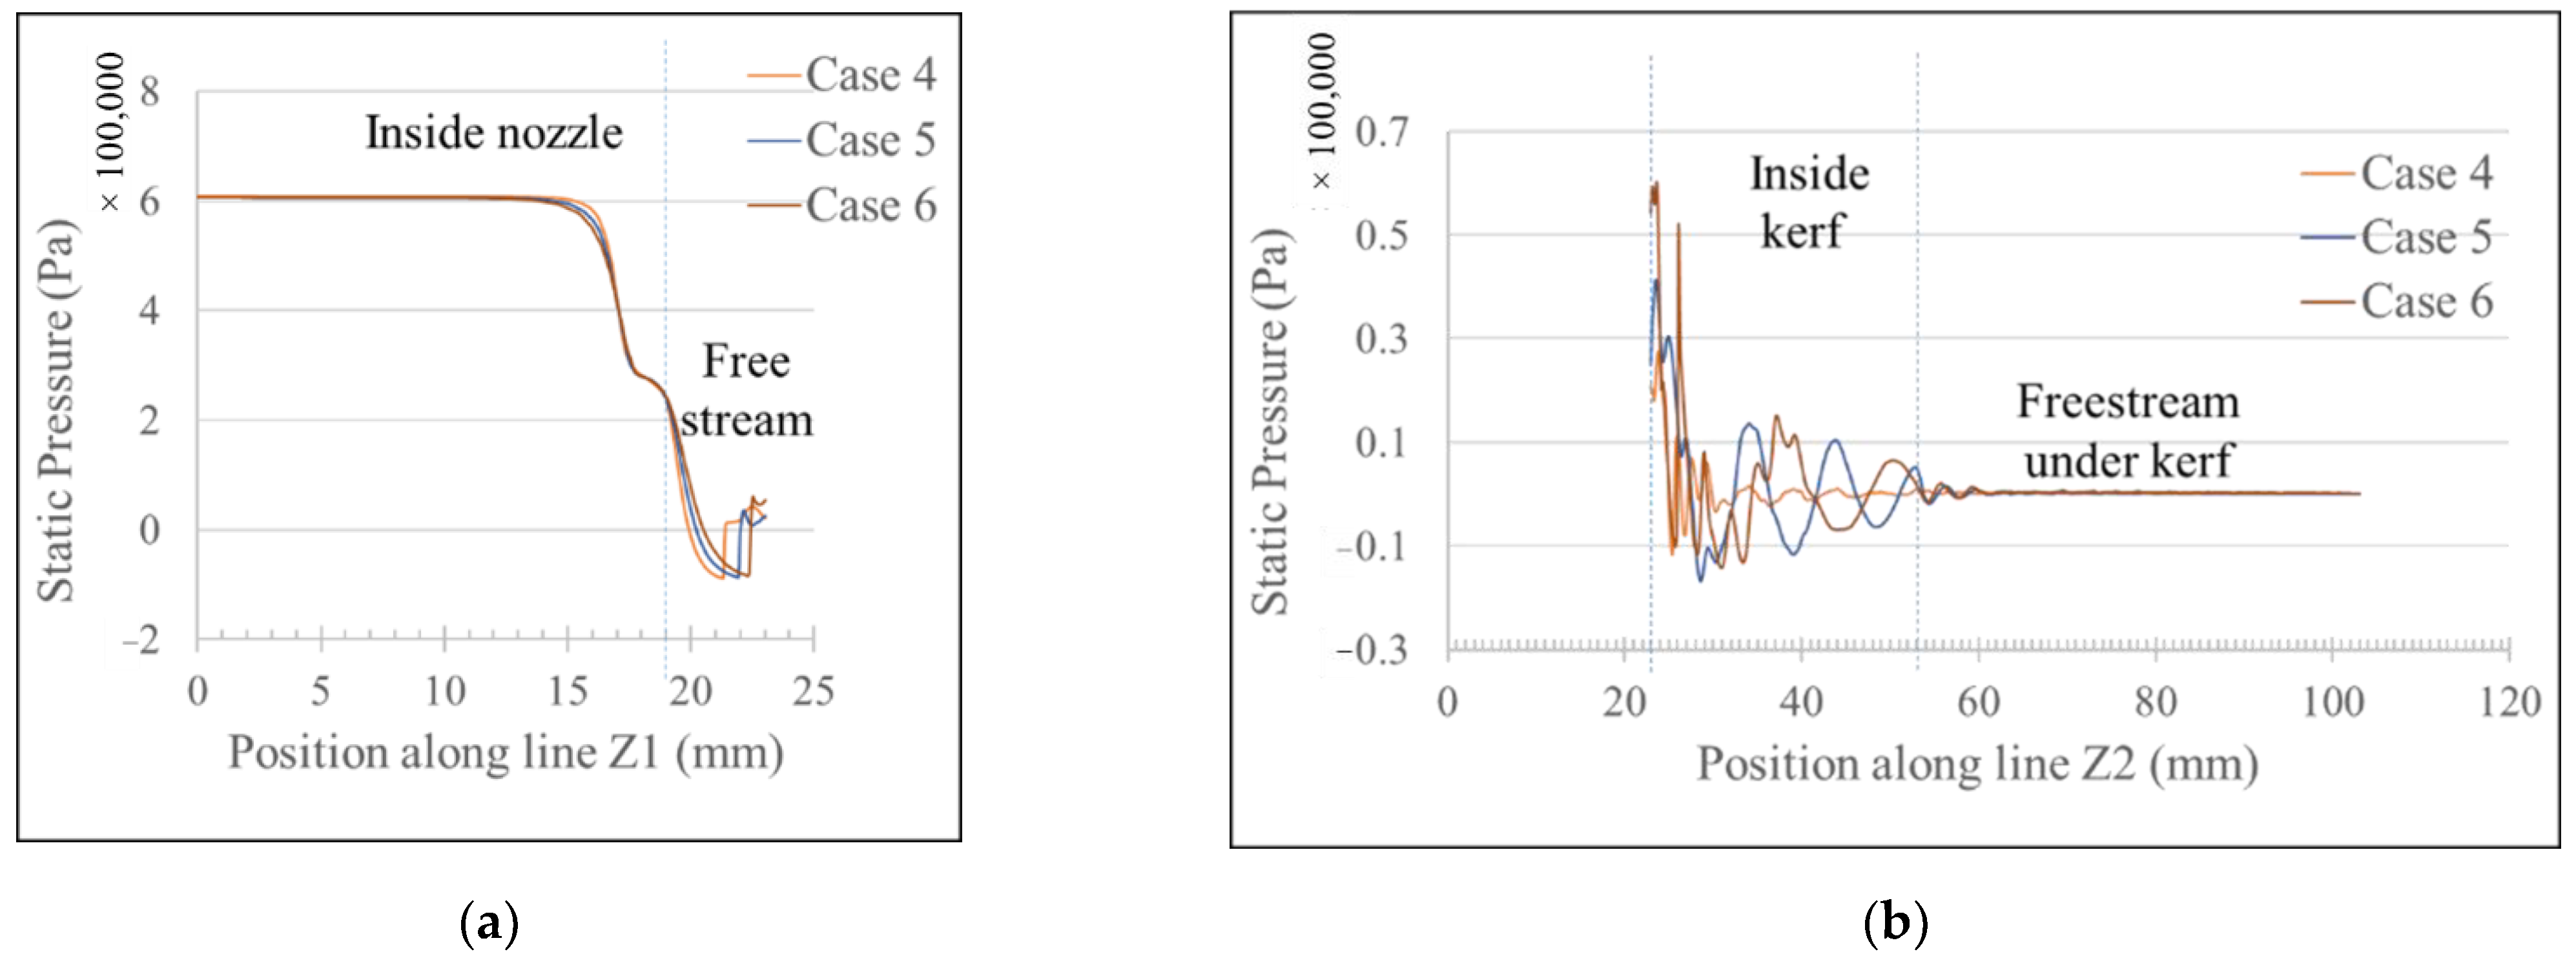
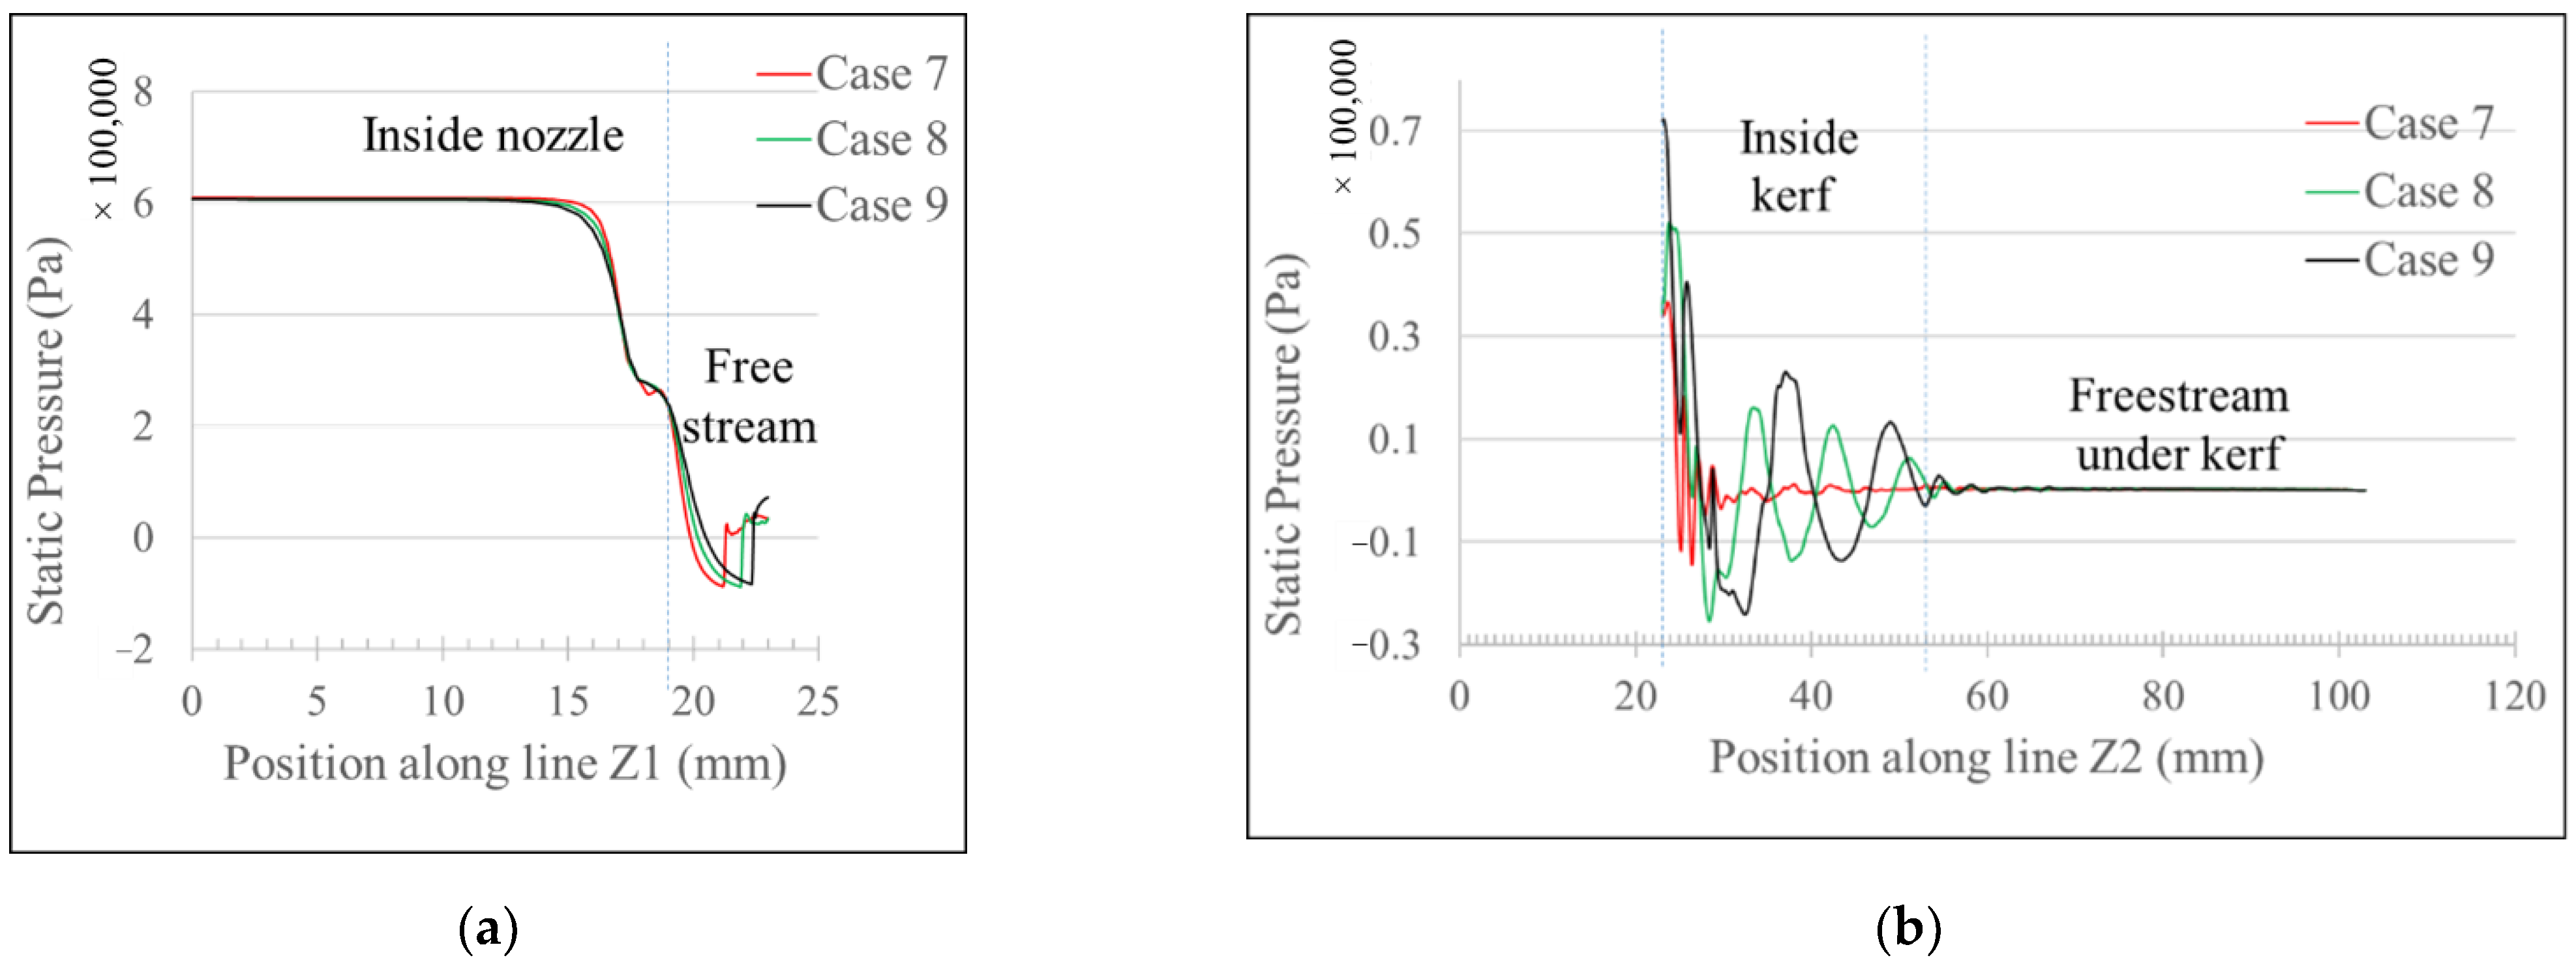
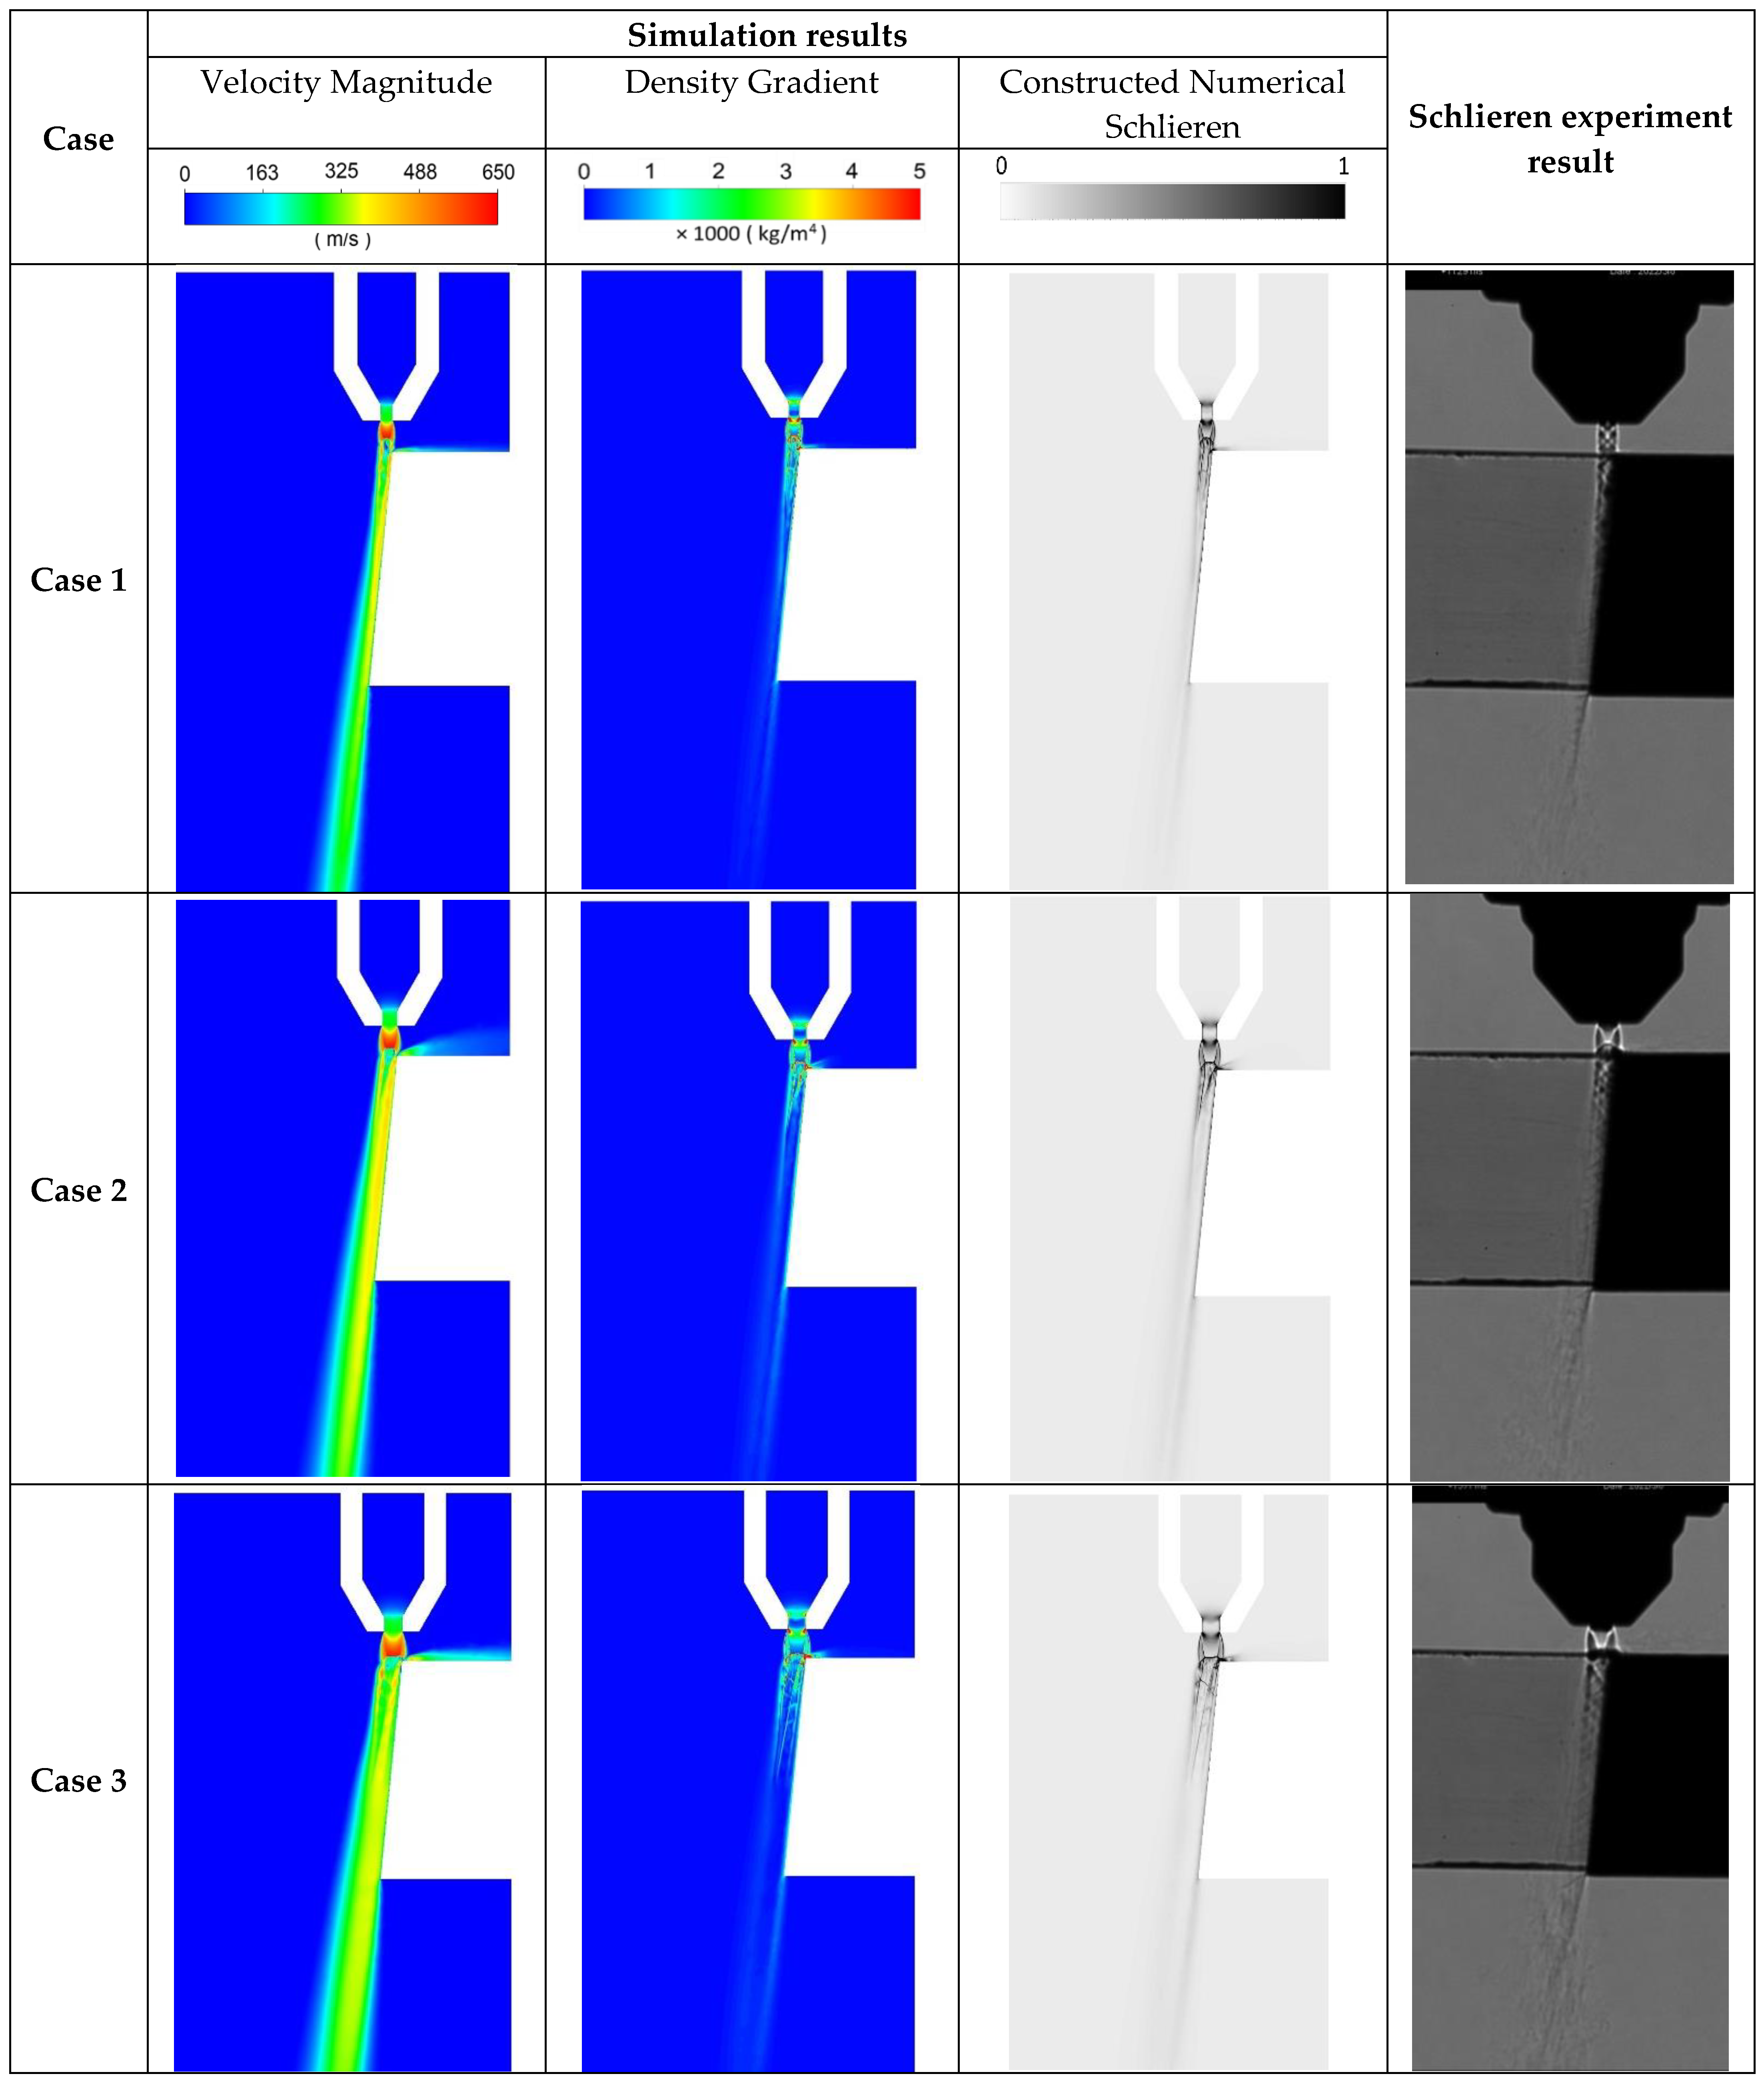
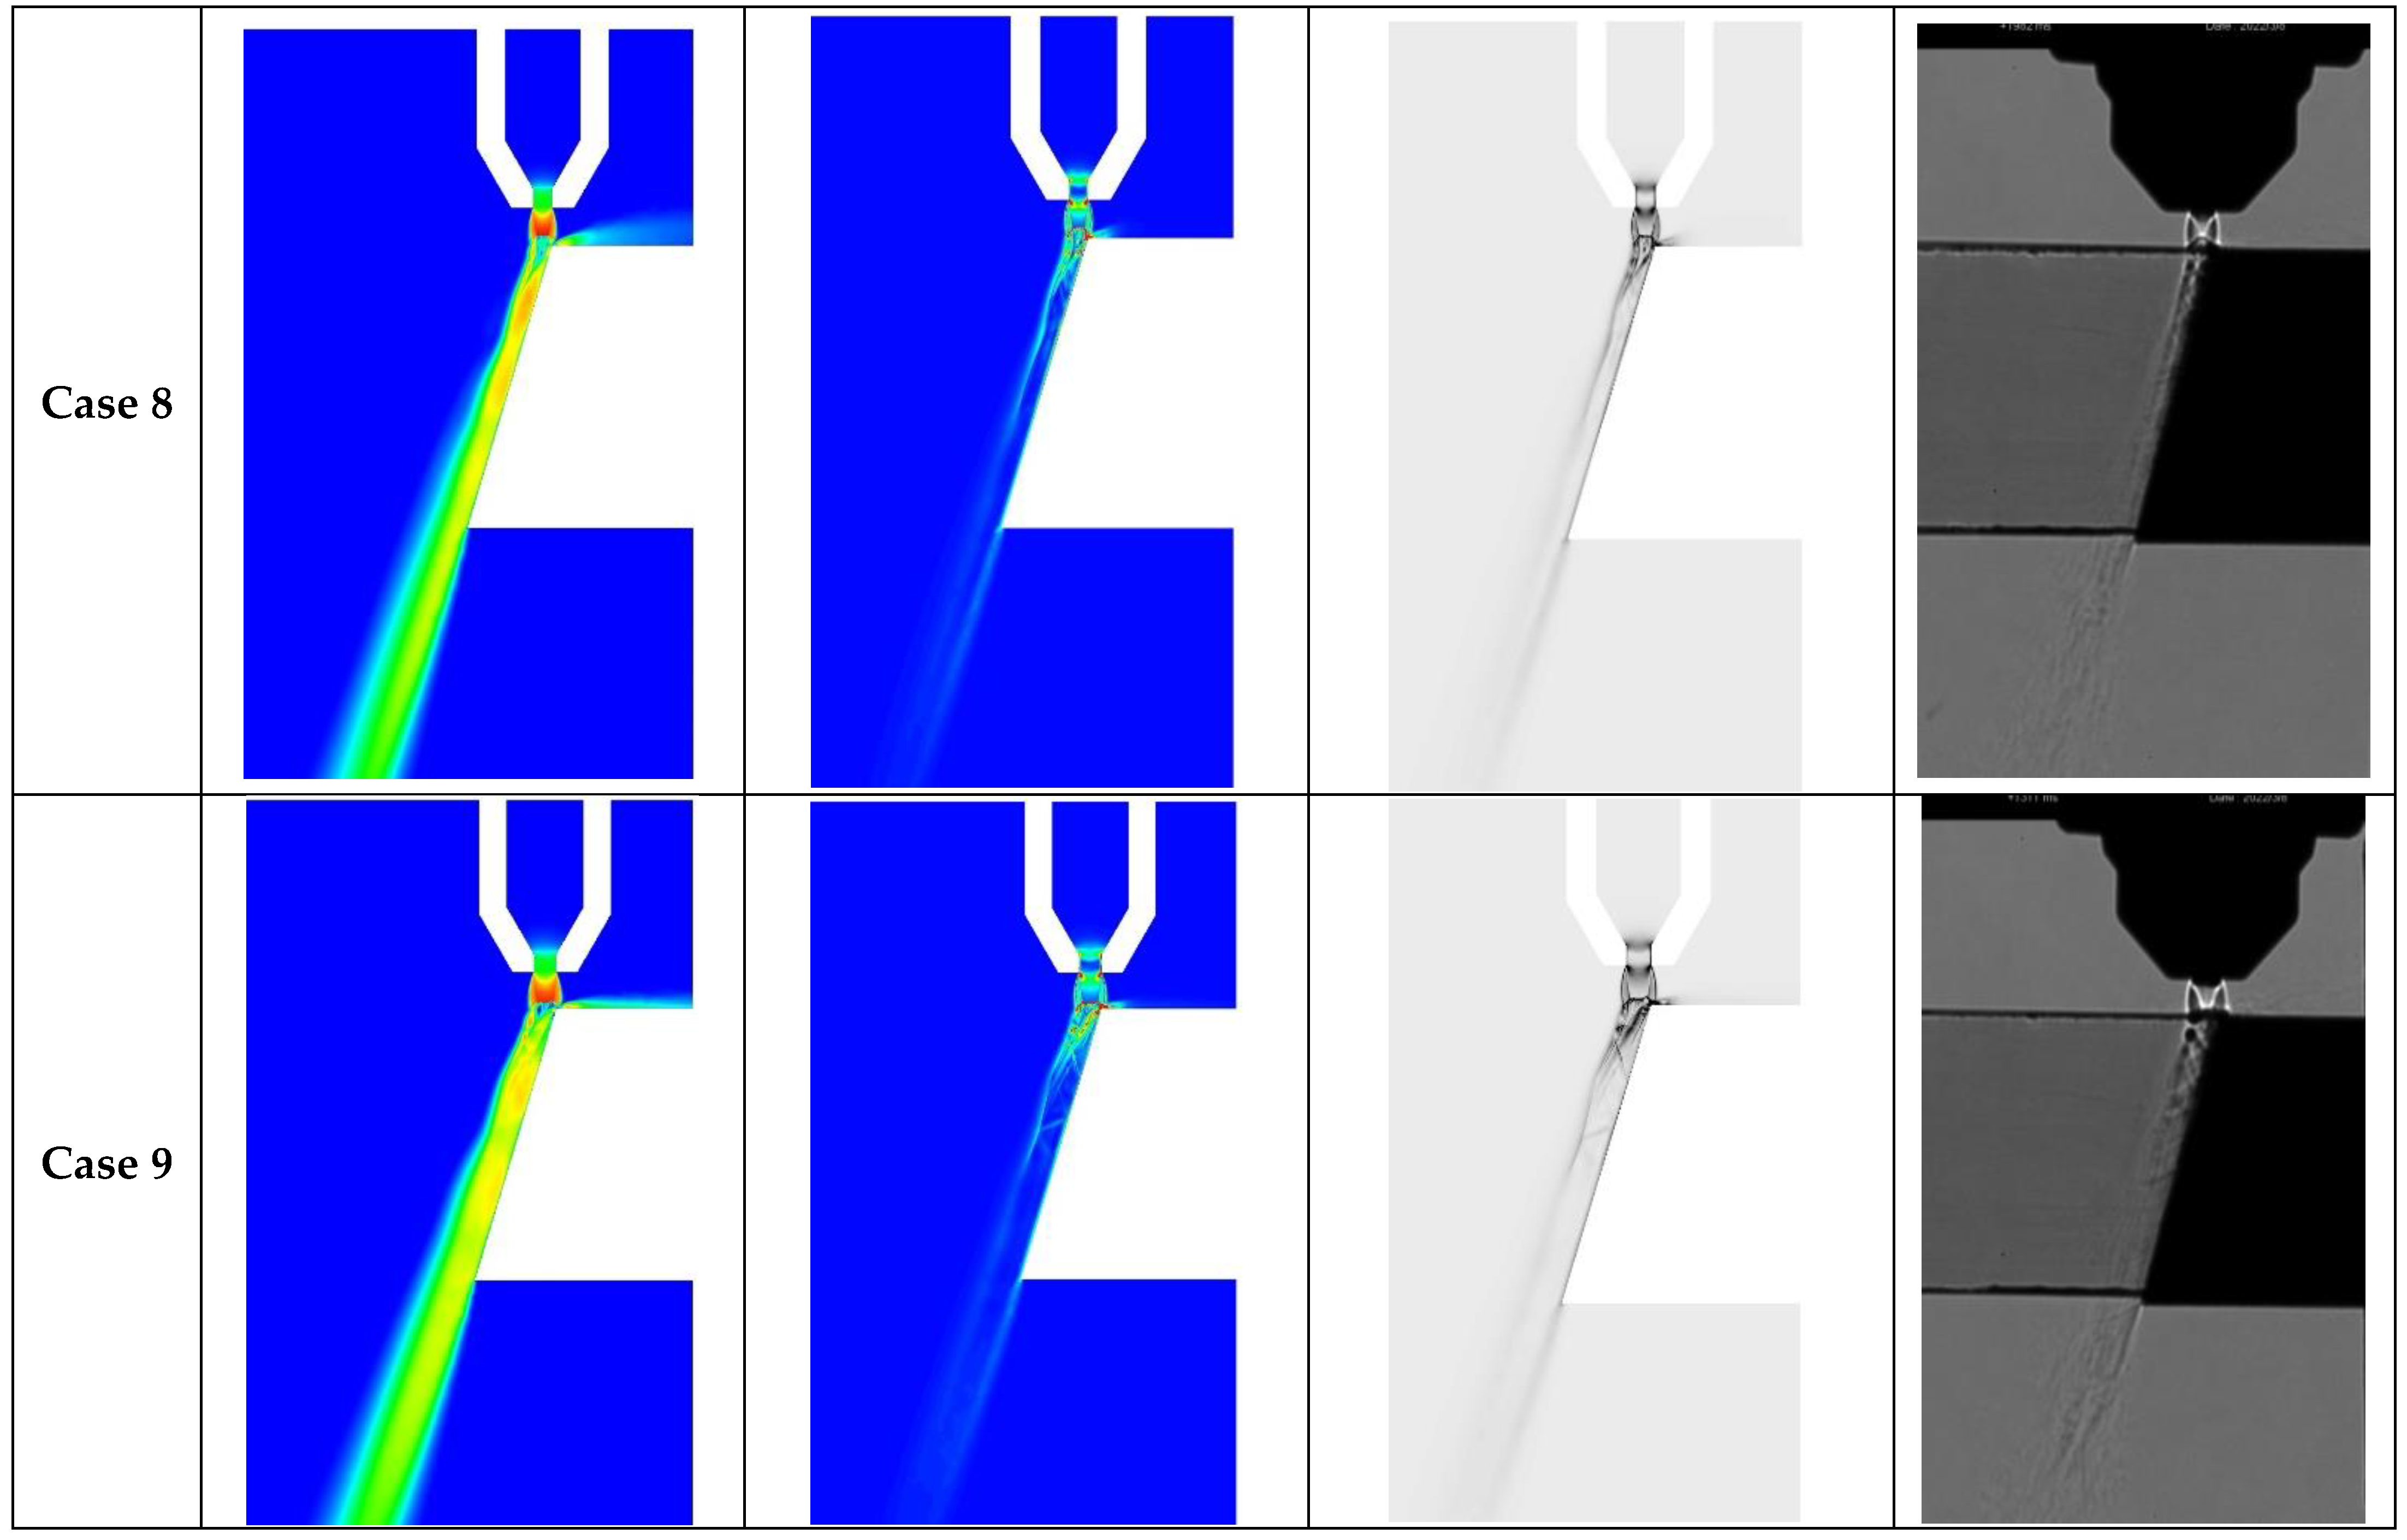
  • The simulation showed the generation of a high- and low-pressure region along the flow direction, indicating the presence of a shock wave structures along the flow, as seen in the Schlieren experiments. The position and intensity of the shock wave structures were affected by the nozzle exit diameter. We found that the smaller the nozzle exit diameter, the greater the frequency of the oblique shock wave structures.
  • As the flow propagated further downstream inside the kerf slot, the oblique shock waves were weakened, and smooth harmonic oscillations were seen in the flow pressure curve. The intensity of these oscillations was affected by the nozzle exit diameter. The amplitude of the oscillations was shorter for the nozzles with narrow exit diameter.
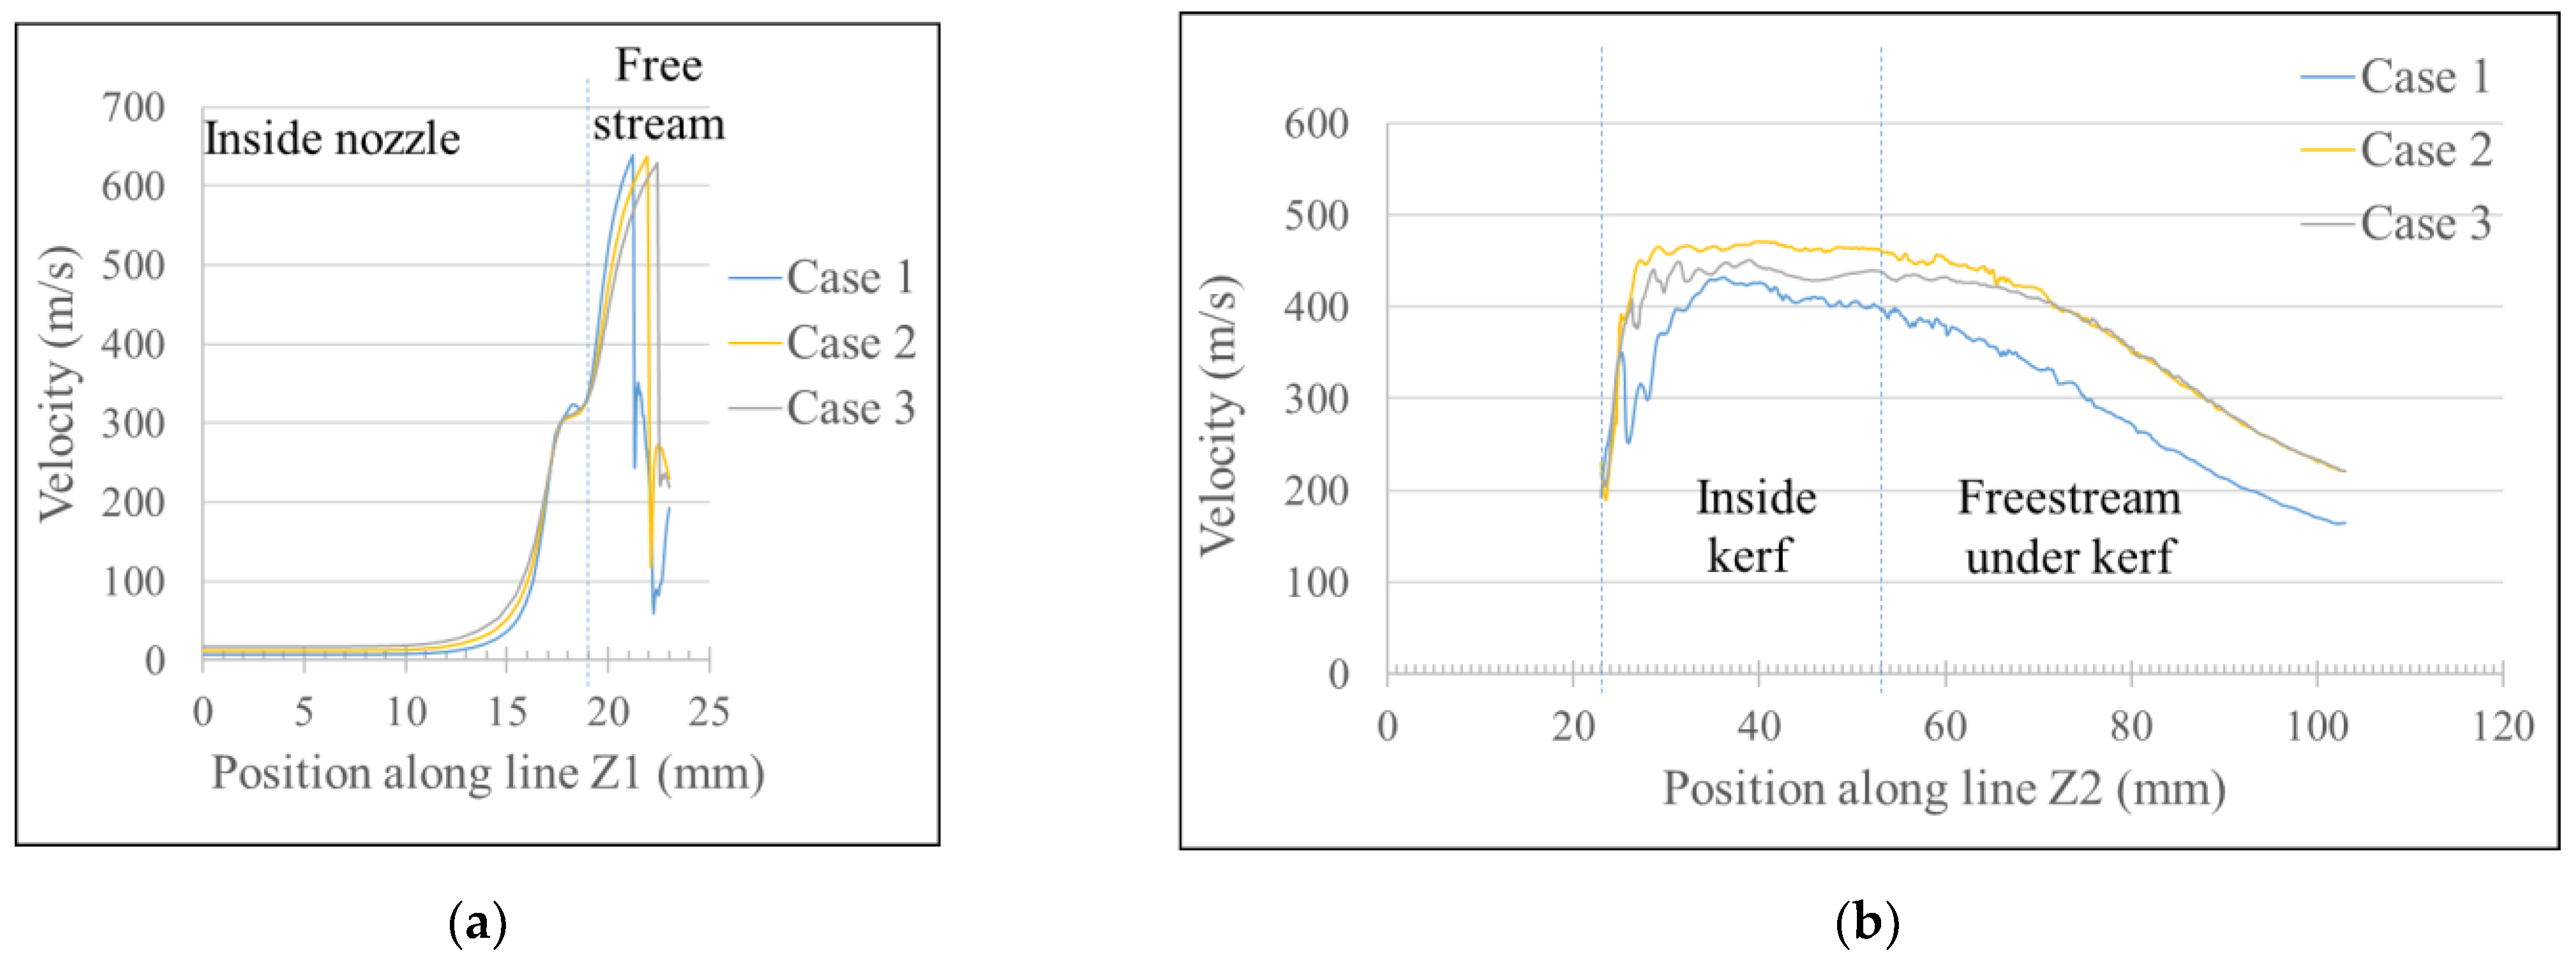
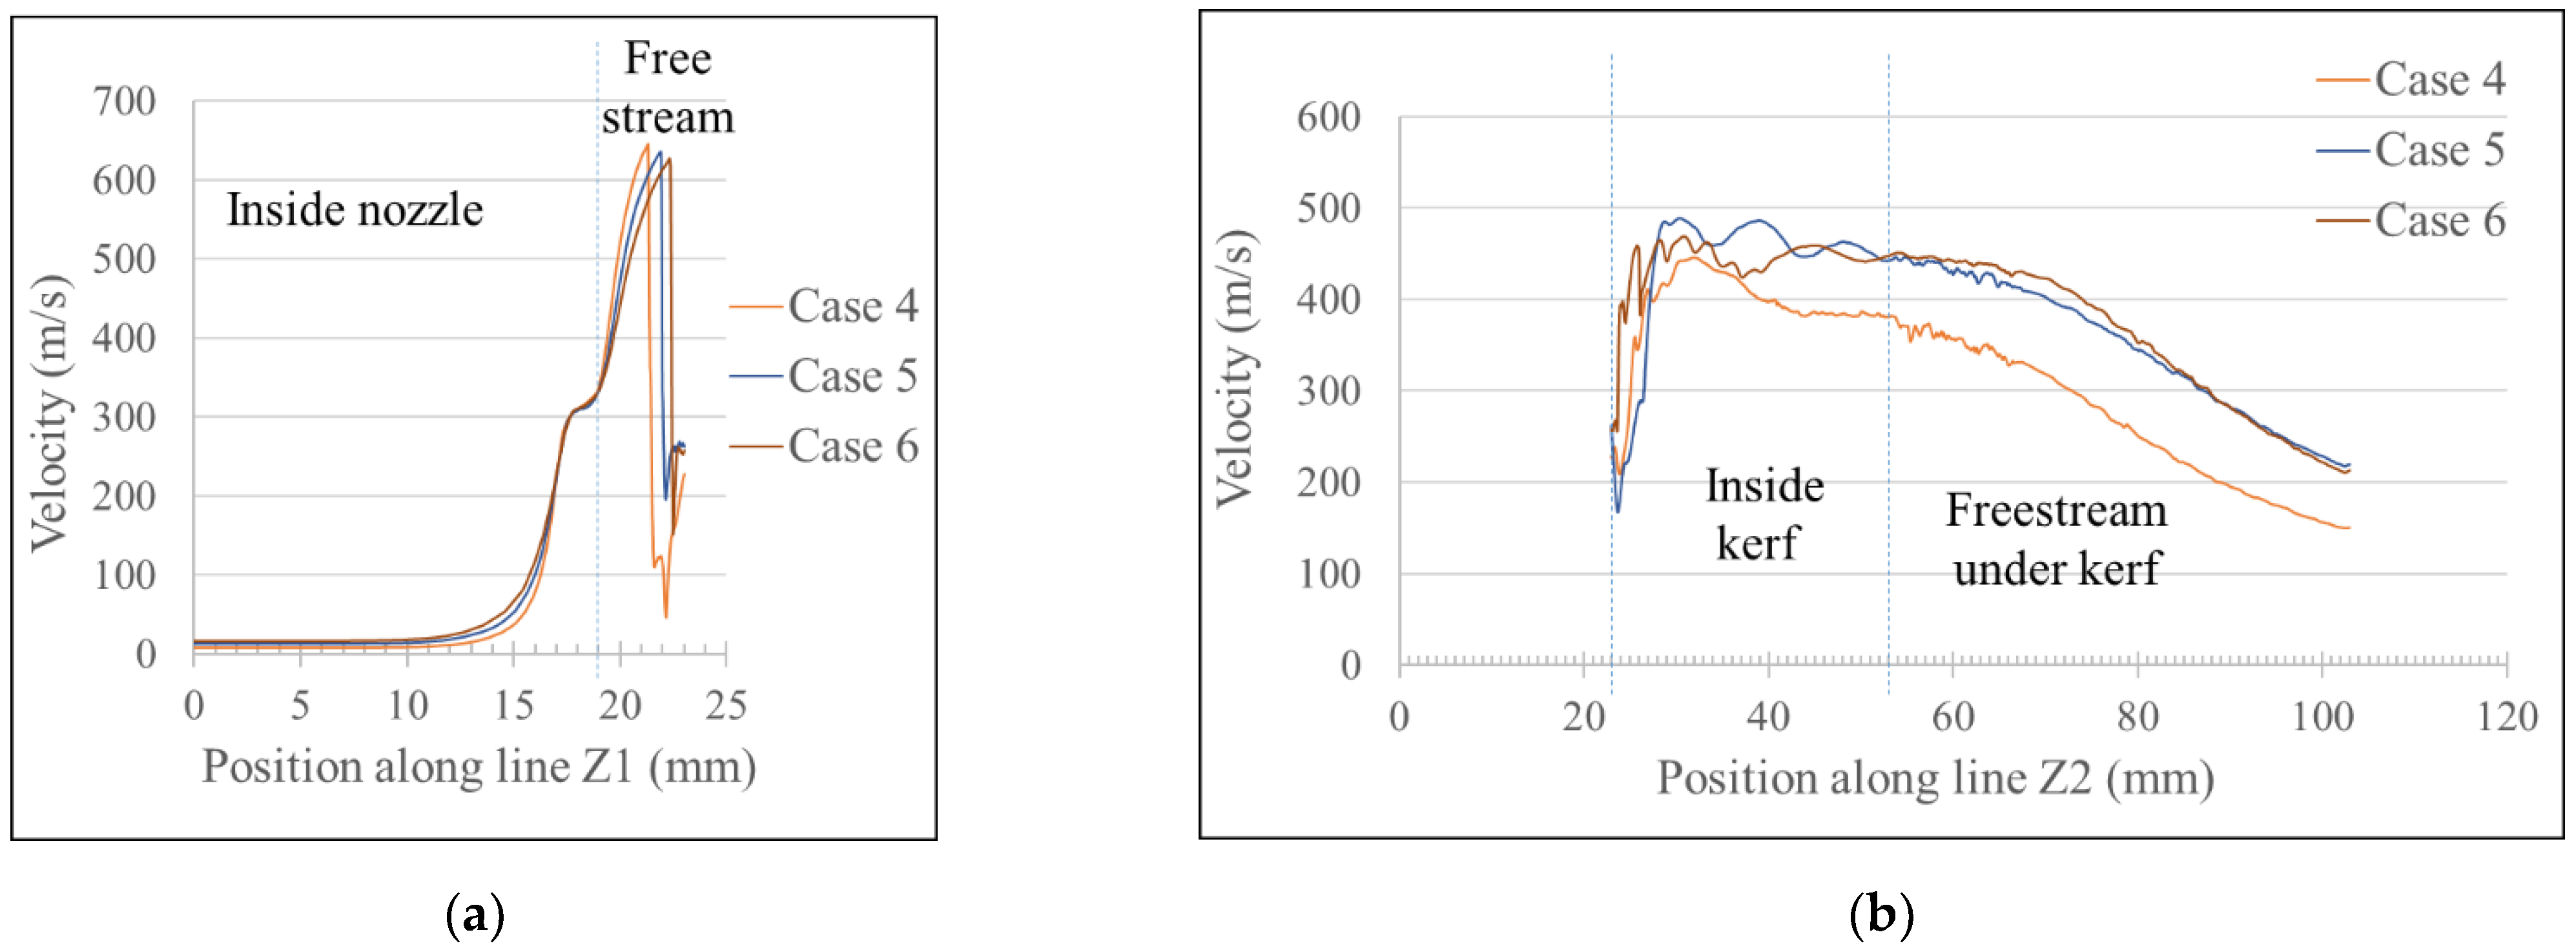
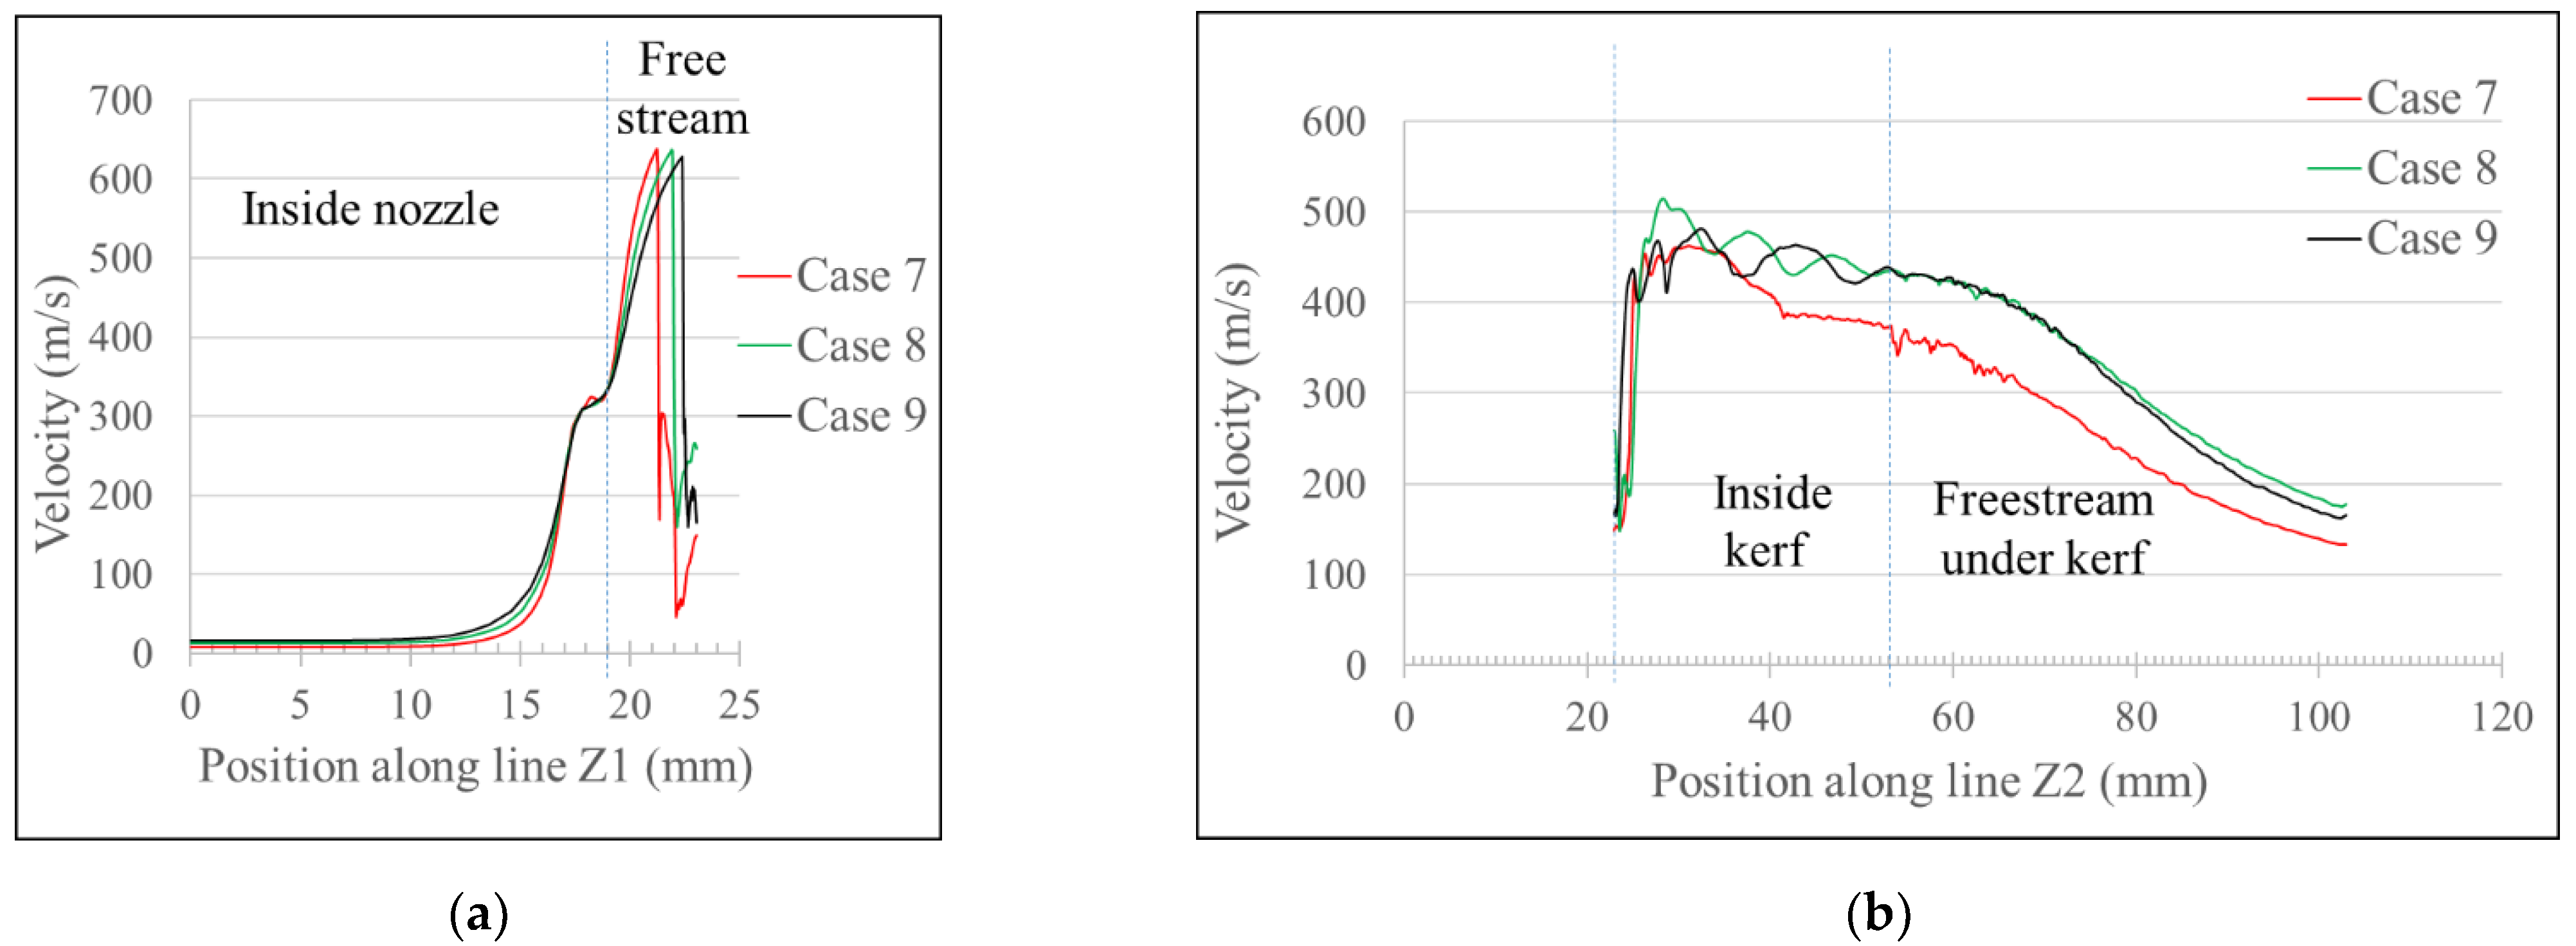
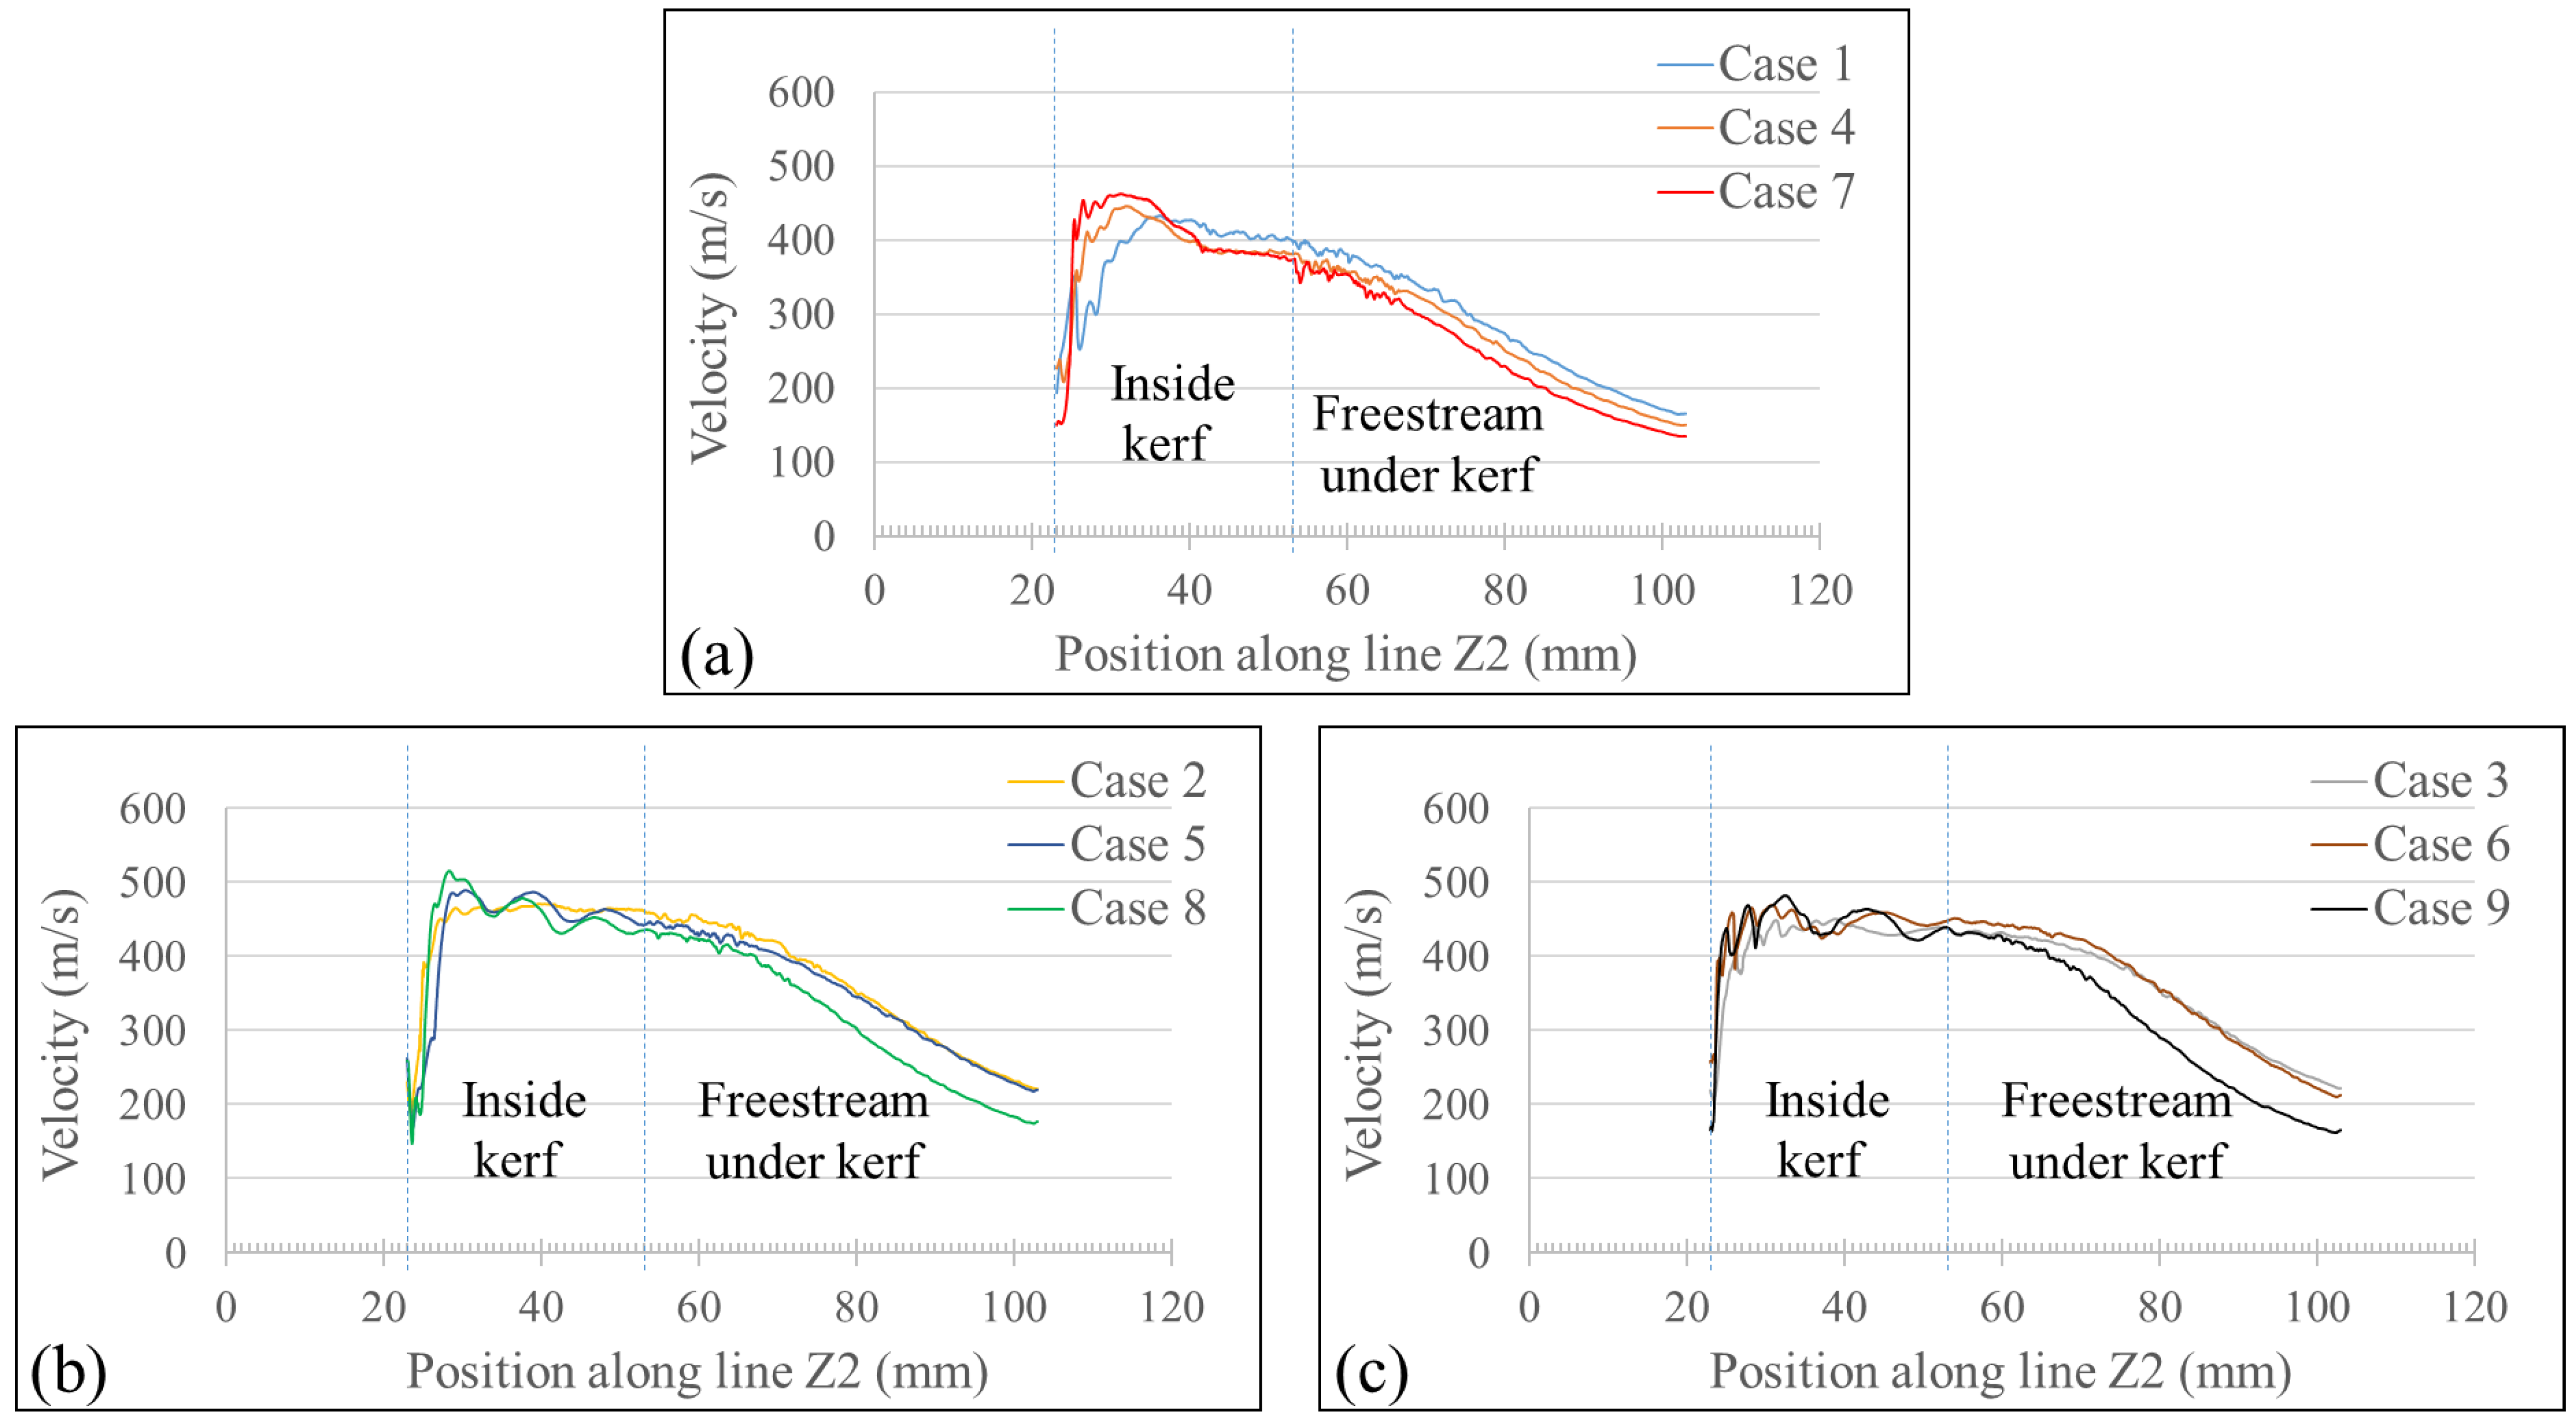
  • The velocity distribution curve showed similarities with the pressure distribution curve. The low-pressure region had a high flow velocity and vice versa. The flow from nozzles with a narrow exit diameter deteriorated to a greater extent. However, nozzles with a wider exit experienced a higher deflection in flow along the top surface of the kerf slot resulting in the deterioration of the flow velocity.
  • The slope of the cut front (loffset distance) inside the kerf slot affected the generation of oblique shock wave structures along the flow direction. As the slope of the cut front decreased, the generation of oblique shock wave structures reduced. The amplitude of the pressure curve was observed to be lower for the cut front with a lower slope (greater loffset distance).
  • As the slope of the cut front decreased (increase in loffset), the overall flow velocity along the kerf slot was reduced for all three nozzle exit diameters. However, increase in velocity was observed in the kerf slot near the top surface due to reduction in the generation of oblique shock waves.
The flow analysis presented in this study gives an insight into the gas flow behavior during the gas-assisted cutting process. The cut quality due to impinging effect of the cut front inclination, at varying cutting speeds was assessed. The numerical results and Schlieren visualization results are qualitatively in high agreement in terms of the shape and the position of the shock wave structures inside the kerf slot, thereby further encouraging the use of the proposed numerical model to accurately predict the flow behavior in gas-assisted cutting methods.

Author Contributions

Conceptualization, D.-W.C., U.T. and S.-H.A.; methodology, U.T., S.-H.A. and S.K.; Numerical Modeling, U.T., D.-W.C. and D.-H.K.; Numerical Simulation, U.T., Image Processing, S.-H.A. and S.-H.B.; validation, D.-W.C. and T.-K.P.; investigation, U.T. and S.-H.A.; resources, D.-W.C. and D.-H.K.; data curation, U.T. and S.-H.A.; writing—original draft preparation, U.T. and S.-H.A.; writing—review and editing, U.T., S.-H.A. and D.-W.C.; visualization, U.T. and S.-H.A.; supervision, D.-W.C. and S.A.; project administration, D.-W.C.; funding acquisition, D.-W.C. and S.A. All authors have read and agreed to the published version of the manuscript.

Funding

This work was supported by the Korea Institute of Energy Technology Evaluation and Planning (KETEP) granted financial resource from the Ministry of Trade, Industry & Energy, Republic of Korea (No. 20201520300060, No.20201510300350 No. 20214000000410), National Research Fund (NRF-2018M2B2B106563723, No.2017M2B2B1072888) and the Korea Institute of Machinery and Materials (NK238A, NK238C).

Institutional Review Board Statement

Not applicable.

Informed Consent Statement

Not applicable.

Data Availability Statement

Not applicable.

Conflicts of Interest

The authors declare no conflict of interest.

Nomenclature

SymbolDefinition
ρDensity [kg·m−3]
u, uVelocity [m·s−1]
pPressure [Pa]
μDynamic viscosity [Pa·s]
Superscript TMatrix transformation
λBulk viscosity [Pa·s]
IIdentity tensor [N·m−2]
eInternal (thermal) energy [J]
κThermal conductivity [W·m−1K−1]
TTemperature [K]
τViscous stress tensor [N·m−2]
kTurbulent kinetic energy (TKE) [J·kg−1]
σkTurbulent Prandtl number for TKE [m2·s−1]
μtTurbulent dynamic viscosity [Pa·s]
ωSpecific dissipation rate of turbulent kinetic energy [s−1]
σωTurbulent Prandatl number for ω [m2·s−1]
Gk, GωGeneration of k and ω due to mean velocity gradients
Yk, YωDissipation of k and ω due to turbulence
α * , β i , R k Empirical coefficients

References

  1. Powell, J. CO2 Laser Cutting, 2nd ed.; Springer London: London, UK, 1998; ISBN 978-1-85233-047-7. [Google Scholar]
  2. Steen, W.M.; Mazumder, J. Laser Material Processing; Springer London: London, UK, 2010; ISBN 978-1-84996-061-8. [Google Scholar]
  3. Kovalev, O.B.; Yudin, P.V.; Zaitsev, A.V. Modeling of Flow Separation of Assist Gas as Applied to Laser Cutting of Thick Sheet Metal. Appl. Math. Model. 2009, 33, 3730–3745. [Google Scholar] [CrossRef]
  4. Darwish, M.; Mrňa, L.; Orazi, L.; Reggiani, B. Numerical Modeling and Schlieren Visualization of the Gas-Assisted Laser Cutting under Various Operating Stagnation Pressures. Int. J. Heat Mass Transf. 2020, 147, 118965. [Google Scholar] [CrossRef]
  5. Andersson, B.; Andersson, R.; Håkansson, L.; Mortensen, M.; Sudiyo, R.; van Wachem, B. Computational Fluid Dynamics for Engineers; Cambridge University Press: Cambridge, UK, 2011; ISBN 9781107018952. [Google Scholar]
  6. Cantwell, B.J. Fundamentals of Compressible Flow, 3rd ed.; Stanford University: Stanford, CA, USA, 2007. [Google Scholar]
  7. Afonin, Y.F.; Golyshev, A.P.; Ivanchenko, A.I.; Konstantinov, S.A.; Maslov, N.A.; Orishich, A.M.; Filev, V.F.; Shikhalev, E.G.; Shulyatyev, V.B. Automated Laser Technological Complex Based on a 5.0-KW CO2 Laser and Its Metrological Support. In Proceedings of the Seventh International Symposium on Laser Metrology Applied to Science, Industry, and Everyday Life, Novosibirsk, Russia, 9–13 September 2002; Chugui, Y.V., Bagayev, S.N., Weckenmann, A., Osanna, P.H., Eds.; SPIE: Bellingham, WA, USA, 2002; Volume 4900, pp. 929–934. [Google Scholar]
  8. Man, H.C.; Duan, J.; Yue, T.M. Dynamic Characteristics of Gas Jets from Subsonic and Supersonic Nozzles for High Pressure Gas Laser Cutting. Opt. Laser Technol. 1998, 30, 497–509. [Google Scholar] [CrossRef]
  9. Man, H.C.; Duan, J.; Yue, T.M. Analysis of the Dynamic Characteristics of Gas Flow inside a Laser Cut Kerf under High Cut-Assist Gas Pressure. J. Phys. D Appl. Phys. 1999, 32, 1469–1477. [Google Scholar] [CrossRef]
  10. Iwamoto, J. Impingement of Under-Expanded Jets on a Flat Plate. J. Fluids Eng. 1990, 112, 179–184. [Google Scholar] [CrossRef]
  11. Man, H.C.; Duan, J.; Yue, T.M. Design and Characteristic Analysis of Supersonic Nozzles for High Gas Pressure Laser Cutting. J. Mater. Process Technol. 1997, 63, 217–222. [Google Scholar] [CrossRef]
  12. Masuda, W.; Moriyama, E. Aerodynamic Characteristics of Underexpanded Coaxial Impinging Jets. JSME Int. J. Ser. B 1994, 37, 769–775. [Google Scholar] [CrossRef]
  13. Tseng, C.S.; Chen, C.M.; Wang, C.C. A Visual Observation of the Air Flow Pattern for the High Speed Nozzle Applicable to High Power Laser Cutting and Welding. Int. Commun. Heat Mass Transf. 2013, 49, 49–54. [Google Scholar] [CrossRef]
  14. Chen, K.; Yao, Y.; Modi, V. Gas Dynamic Effects on Laser Cut Quality. J. Manuf. Process 2001, 3, 38–49. [Google Scholar] [CrossRef]
  15. Hu, J.; Zhang, Z.; Luo, J.; Sheng, X. Simulation and Experiment on Standoff Distance Affecting Gas Flow in Laser Cutting. Appl. Math. Model. 2011, 35, 895–902. [Google Scholar] [CrossRef]
  16. Mai, C.C.; Lin, J. Flow Structures around an Inclined Substrate Subjected to a Supersonic Impinging Jet in Laser Cutting. Opt. Laser Technol. 2002, 34, 479–486. [Google Scholar] [CrossRef]
  17. Jun, H.; Guo, S.-J.; Lei, L.; Yao, Z. Characteristic Analysis of Supersonic Impinging Jet in Laser Machining. Int. J. Adv. Manuf. Technol. 2008, 39, 716–724. [Google Scholar] [CrossRef]
  18. Darwish, M.; Orazi, L.; Angeli, D. Simulation and Analysis of the Jet Flow Patterns from Supersonic Nozzles of Laser Cutting Using OpenFOAM. Int. J. Adv. Manuf. Technol. 2019, 102, 3229–3242. [Google Scholar] [CrossRef]
  19. Cho, D.-W.; Choi, J.; Lee, S.; Shin, D. Analysis of Gas Flow Behavior in the Laser Cutting Process Using the Schlieren Method and Image Processing. J. Weld. Jt. 2020, 38, 569–575. [Google Scholar] [CrossRef]
  20. Batchelor, G.K. An Introduction to Fluid Dynamics; Cambridge University Press: Cambridge, UK, 2000; ISBN 9780521663960. [Google Scholar]
  21. Shapiro, A.H. The Dynamics and Thermodynamics of Compressible Fluid Flow; Ronald Press: New York, NY, USA, 1954; Volume 2. [Google Scholar]
  22. Wilcox, D.C. Turbulence Modeling for CFD; DCW Industries: La Canada, CA, USA, 1998; Volume 2. [Google Scholar]
  23. Wilcox, D.C. Formulation of the K-w Turbulence Model Revisited. AIAA J. 2008, 46, 2823–2838. [Google Scholar] [CrossRef]
  24. Roache, P.J. Perspective: A Method for Uniform Reporting of Grid Refinement Studies. J. Fluids Eng. 1994, 116, 405–413. [Google Scholar] [CrossRef]
Figure 1. Detailed geometry of nozzle and kerf. (a) Nozzle. (b) Section view of kerf (perpendicular to the cut direction). (c) Side view of the kerf (along the cut direction).
Processes 10 01951 g001
Figure 2. Kerf structure fabrication for the Schlieren experiment. (a) Conceptual model for simulated kerf. (b) Fabricated kerf slot.
Processes 10 01951 g002
Figure 3. Schematic diagram of Schlieren method.
Processes 10 01951 g003
Figure 4. Schlieren images of gas flow inside fabricated cut kerf captured during three different experiments using same process parameters (nozzle exit diameter (φexit) = 2mm; inlet gauge pressure (P) = 6 Atm). (a) Experiment 1 (t = 493 ms), (b) Experiment 2 (t = 686 ms), and (c) Experiment 3 (t = 889 ms).
Processes 10 01951 g004
Figure 5. CFD model. (a) Computational domain and (b) Mesh model.
Processes 10 01951 g005
Figure 6. Grid dependency of the maximum velocity of the flow.
Processes 10 01951 g006
Figure 7. Computational domain showing boundary layers. (a) Inlet, (b) Walls, (c) Outlets, and (d) Symmetry.
Processes 10 01951 g007
Figure 8. Sections showing lines Z1 and Z2, where the flow field distribution was studied.
Processes 10 01951 g008
Figure 9. Numerical simulation results for the pressure field along the symmetry plane.
Processes 10 01951 g009
Figure 10. Numerical simulation results for the velocity field along the symmetry plane.
Processes 10 01951 g010
Figure 11. Numerical simulation results for the velocity field along the top surface of the cutting sample.
Processes 10 01951 g011
Figure 12. Pressure distribution curve for various nozzle configurations in kerf slot (loffset = 3 mm): (a) along line Z1 and (b) along line Z2.
Processes 10 01951 g012
Figure 13. Pressure distribution curve for various nozzle configurations in kerf slot (loffset = 6 mm): (a) along line Z1 and (b) along line Z2.
Processes 10 01951 g013
Figure 14. Pressure distribution curve for various nozzle configurations in kerf slot (loffset = 9 mm): (a) along line Z1 and (b) along line Z2.
Processes 10 01951 g014
Figure 15. Velocity distribution curve for various nozzle configurations in kerf slot (loffset = 3 mm): (a) along line Z1 and (b) along line Z2.
Processes 10 01951 g015
Figure 16. Velocity distribution curve for various nozzle configurations in kerf slot (loffset = 6 mm): (a) along line Z1 and (b) along line Z2.
Processes 10 01951 g016
Figure 17. Velocity distribution curve for various nozzle configurations in kerf slot (loffset = 9 mm): (a) along line Z1 and (b) along line Z2.
Processes 10 01951 g017
Figure 18. Pressure distribution curve along line Z2 for various kerf geometry: (a) cases 1, 4 and 7; (b) cases 2, 5 and 8; and (c) case 3, 6 and 9.
Processes 10 01951 g018
Figure 19. Velocity distribution curve along line Z2 for various kerf geometry: (a) cases 1, 4 and 7; (b) cases 2, 5 and 8; and (c) case 3, 6 and 9.
Processes 10 01951 g019
Figure 20. Flow behavior comparison between simulation results and experimental results.
Processes 10 01951 g020aProcesses 10 01951 g020bProcesses 10 01951 g020c
Table 1. Simulation cases with different kerf and nozzle geometries.
CasesKerf Offset Length (loffset) (mm)Nozzle Exit Diameter (φexit) (mm)
Case 131.5
Case 232
Case 332.5
Case 461.5
Case 562
Case 662.5
Case 791.5
Case 892
Case 992.5
Publisher’s Note: MDPI stays neutral with regard to jurisdictional claims in published maps and institutional affiliations.

