
Significance of Chromatographic Techniques in Pharmaceutical Analysis


Department of Analytical Chemistry, Faculty of Pharmaceutical Sciences in Sosnowiec, Medical University of Silesia in Katowice, Jagiellońska 4, 41-200 Sosnowiec, Poland
*
Authors to whom correspondence should be addressed.
Processes 2022, 10(1), 172; https://doi.org/10.3390/pr10010172
Submission received: 14 December 2021
/
Revised: 10 January 2022
/
Accepted: 14 January 2022
/
Published: 17 January 2022
(This article belongs to the Special Issue Applications of Chromatographic Separation Techniques in Food and Chemistry)
Abstract
:This work presents an overview of the modern approaches embracing advanced equipment and validation parameters of both liquid and gas chromatography techniques, including thin-layer chromatography (TLC), column liquid chromatography (CLC), and gas chromatography (GC), suitable for the identification and quantitative determination of various bioactive compounds occurring in pharmaceutical products and medicinal plants in the time from 2020 to 2021 (November). This review confirmed that HPLC is an incredibly universal tool, especially when combined with different detectors, such as UV-Visible spectroscopy, mass spectrometry (MS), and fluorescence detection for numerous active ingredients in different pharmaceutical formulations without interferences from other excipients. TLC, in combination with densitometry, is a very efficient tool for the determination of biologically active substances present in pharmaceutical preparations. In addition, TLC coupled to densitometry and mass spectrometry could be suitable for preliminary screening and determination of the biological activity (e.g., antioxidant properties, thin layer chromatography (TLC) by 2,2-diphenyl-1-picrylhydrazyl (DPPH) method) of plant materials. Gas chromatography, coupled with a mass spectrometer (GC-MS, GC-MS/MS), is of particular importance in the testing of any volatile substances, such as essential oils. LC, coupled to NMR and MS, is the best solution for identifying and studying the structure of unknown components from plant extracts, as well as degradation products (DPs). Thanks to size-exclusion chromatography, coupled to multi-angle light scattering, the quality control of biological pharmaceuticals is possible.

1. Introduction
All pharmaceuticals can be classified as natural or synthetic bioactive compounds. It should be emphasized that there is no uniform definition of a bioactive substance in the scientific literature [1]. Because of a wide pharmacological spectrum of natural and synthetic bioactive compounds, such as anti-cancer properties, their role in the design of new drugs and more effective pharmaceutical formulations applicable in the treatment of many diseases is also important. Natural and synthetic bioactive compounds are used in the production of pharmaceuticals, nutraceuticals, dietary supplements and cosmetics. A very important element of chemical analysis is testing the purity and quantification of a biologically active substance of natural or synthetic origin in pharmaceutical preparations [2,3,4,5,6,7]. Chromatographic methods are an excellent tool in the analysis of bioactive compounds present in pharmaceutical preparations and extracted from plant medicinal substances. Both planar techniques, as well as high performance liquid chromatography and gas chromatography, allow the systematic analysis of the qualitative and quantitative composition and the comparison of individual plant substances based on differences and similarities in their composition. Chromatography is a technique of separating multicomponent mixtures into single components, which are the result of their different migration speeds along the bed of the stationary phase. Unlike other classical separation techniques (such as crystallization, extraction or distillation), it allows for the separation of compounds without the need for in-depth information about the type of substances to be separated, i.e., their number and their relative amounts in the mixture [8,9]. The versatility and resolving power of chromatographic systems has made chromatography an excellent analytical technique intensively used for scientific, industrial and medical purposes. It is not only a key element of the methodology of many scientific studies, but also a tool for monitoring the state of the environment or the production of pure compounds in the pharmaceutical and chemical industries. The greatest application of chromatography is in the analysis of pharmaceuticals (30%), biochemical and clinical chemistry (25%), environmental protection (15%), food and cosmetics (10%), inorganic substances (5%); analyses in other fields accounts for 15% [10]. In turn, chromatography is used, on average, in 75% of the total number of analyses developed in various pharmacopoeias.
This article overviews modern approaches embracing advanced equipment and validation parameters of liquid and gas chromatography techniques devoted to the identification and quantitative determination of various bioactive compounds occurring in pharmaceutical products and medicinal plant extracts in the time from 2020 to 2021 (November). The presented review paper discusses chromatographic methods to the complex analysis of pharmaceutically active compounds in different dosage forms, including tablets, capsules, drop solutions, injectable powders, creams and herbal formulations.
For this purpose, the content of PubMed, Embase and Google Scholar databases was used and keyword searches for ‘pharmaceuticals AND plant extracts AND LC analysis’ and ‘pharmaceuticals AND plant extracts AND GC analysis’ were applied. The careful analysis of titles and abstracts led to a selection of manuscripts describing chromatographic methods to determine natural and synthetic bioactive compounds in pharmaceuticals and medicinal plants.
The main focus was on optimization, including the validation process of chromatographic analysis carried out by using thin-layer chromatography (TLC), TLC-MS, HPTLC-ESI-MS/MS, high-performance liquid chromatography (HPLC, SEC-HPLC) and gas chromatography (GC) combined with various detectors ((TLC-UV/Vis, TLC-densitometry, HPTLC/DESI/IMS/MSI, HPLC-UV/Vis, HPLC-DAD(PDA), HPLC-MS, HPLC-MS/MS, HPLC-TQ-ESI-MS/MS, GC-FID, GC-MS, GC-MS/MS,)), as with the combined techniques (coupled techniques), e.g., TLC/HPLC, HPTLC/HPLC, HPLC/GC, which can be of value for the separation and quantification or assessment of certain physicochemical (e.g., lipophilicity) and pharmacological properties of numerous compounds, including the newly developed natural and synthetic bioactive compounds. Moreover, the combined LC-NMR technique described in this review was used primarily to identify natural bioactive compounds isolated from plant extracts, to identify impurities in drugs as well as to identify drug degradation products (DPs).
2. Thin Layer Chromatography
The natural and synthetic bioactive compounds were analyzed by TLC technique. Mainly synthetic medicinal substances in pharmaceutical preparations, e.g., antidiabetic drugs (metformin, saxagliptin, dapaglifloxin, linagliptin), antibiotics (gatifloxacin, ofloxacin, cefoperazone, chloramphenicol), steroid compounds (dexamethasone, prednisone, clobetasol, estradiol norethisterone, estrone, estriol, testosterone), vitamins (D, and K), alkaloids, non-steroidal anti-inflammatory drugs belonging to different groups (ibuprofen, meloxicam, celecoxib, etoricoxib, firecoxib, robenacoxib and cimicoxib), and antihypertensive compounds (reserpine, lupeol, scopoletine, bacoside A, piperine in Cardimap tablet) were investigated. Herbal medicine or phytotherapy is a type of treatment in which raw materials and plant preparations are used. Therefore, the subject of research was natural bioactive compounds found mainly in plants, such as steroidal (diosgenin, stigmasterol, ecdysteroids, β-sitosterol) and phenolic compounds (gallic acid), anticancer substances (arctiin, arctigenin), tannins, saponins, coumarins, alkaloids (trigonelline, berberine, barbamine, palmitine, magnoflorine, jatrorrhizine, ephedrine), flavonoids (i.a. diosmin, rutin), triterpenes (betulinic acid), essential oils, and antidepressants (salidroside, rosavin, p-tyrosol, and hydroquinone). Table 1 shows exemplary applications of thin layer chromatography for the determination of various biologically active compounds in drugs and medicinal raw materials. Analyses were mainly performed by TLC in connection with densitometry. The vast majority of studies, in accordance with the International Conference on Harmonization (ICH) guidance, were validated by stating the linearity range, precision (intraday and interday precisions), recovery, specificity, limit of detection, limit of quantification, and robustness of the method used.
The study focused on estimating the effects of different chromatographic conditions on the sensitivity of thin-layer chromatography in combination with densitometry, i.e., limit of detection (LOD) and limit of quantification (LOQ) has been performed for ibuprofen as a drug with anti-inflammatory, analgesic and antipyretic properties [39]. Results obtained confirmed the utility of TLC-densitometry for sensitive analysis of ibuprofen at low level, i.e., from several nanograms (below one microgram) to a few micrograms/spot. Of all chromatographic systems tested, the best are those consisting of silica gel 60F254 plates with concentrating zone and the mixture of n-hexane-ethyl acetate-glacial acetic acid in ratio 36:12:2 (v/v/v), as well as RP plates, i.e., RP-18F254 aluminum plates developed with methanol-water in volume composition 40:10 (v/v). These chromatographic systems allowed quantifying ibuprofen in the amount less than 1 µg/spot [39].
Parys et al. [40] used the TLC-densitometric technique for identification of meloxicam, as well as non-steroidal anti-inflammatory drugs. Different kinds of chromatographic plates were applied, such as: neutral aluminum oxide 60F254 and 150F254, silica gel 60 and 60F254, mixture of silica gel 60 and Kieselguhr 60F254, silica gel RP-18F254 and RP-8F254. The mixtures of ethyl acetate-toluene-n-butylamine (2:2:1, v/v/v) and ethyl acetate-ethanol-toluene-25% NH4OH (6:3:1:0.06, v/v/v/v) were used in the NP-TLC analysis. For the RP-TLC analysis, a mixture of methanol-water (5:5, 8:2, v/v) was applied. Processes of spot visualization of meloxicam were carried out by the use of various visualization agents, such as: rhodamine B, Janus blue, methyl green, brilliant green, crystalline violet, alkaline blue, gentian violet, methylene violet, fuchsine and brilliant cresyl blue. Among all chromatographic conditions studied, the best proved to be silica gel 60F254 and neutral aluminum oxide plates, as well as the mixture of ethyl acetate-toluene-n-butylamine (2:2:1, v/v/v) in NP-TLC. RP-8F254 and RP-18F254 plates and the mixture of methanol-water (8:2, v/v) enabled detection of meloxicam at the lowest concentration level in RP-TLC. Moreover, of all visualization agents studied, the smallest limit of detection of meloxicam provided crystalline violet and gentian violet as new visualization agents on silica gel 60F254 and neutral aluminum oxide 150F254, respectively.
The paper published by Megawati and coworkers [41] indicate the applicability of thin-layer chromatography for the separation, identification and bioactivity i.e., antioxidant activity as well as toxicity of selected steroids, as the new renewable bioactive compounds obtained from plant material, such as algae cultivated in Indonesia. The steroids extracted from red algae Eucheuma cottonii and Chlorella sp. coming from Indonesia have been separated on a silica gel plate F254 activated by heating in an oven by using the eluent n-hexane-ethyl acetate in a proper volume composition and next identified under UV at 254 and 366 nm, as well as by using Liebermann–Burchard reagent [41]. The paper prepared by Claude et al. [42] describes the utility of combining analytical techniques HPTLC/DESI/IMS/MSI, i.e., high performance liquid chromatography with high resolution time of fight mass spectrometry (MS) for the detection, identification and imaging (HPTLC/MSI) of ecdysteroids (insect moulting hormones) present in several plant extracts obtained from members of the Silene family. Chromatography was performed on silica gel. The plates were developed using chloroform-ethanol (4:1, v/v) as mobile phase. After drying, the plates was taken for analysis by DESI/MSI and next by DESI/IMS/MSI. This study indicates that DESI/MSI coupled to the imaging of HPTLC could be suitable for the preliminary screening of plant materials containing the selected ecdysteroid [42].
In another work, stability of sulfated lactosyl archaeol (SLA) archaeosomes, when used as an adjuvant in vaccines, was investigated using high performance thin-layer chromatography. Analysis was performed on silica gel plates using the chloroform-methanol-0.2% CaCl2 (60:40:10, v/v/v) mobile phase. Sulfuric acid and azure A were used as visualizing reagents. It was found that SLA pre-formed archaeosomes maintained their chemical structure and purity for six months at both 4 °C and 37 °C [43].
Giri et al. [44] investigated the TLC fingerprint profile and antioxidant activity of 18 Nepalese medicinal plants. Concentrated dry extracts of crude plant samples were studied by means of TLC plates and two solvent systems consisted of chloroform, methanol and water in 7:3:0.5 and 6:4:1 ratio. Flavonoids, tannins, saccharides and phenols were next identified under UV at 254 nm, 366 nm and using spraying agents such, as 10% H2SO4/heat and 10% aqueous ferric chloride, as well by dipping in DPPH (2,2-diphenyl-1-picrylhydrazyl) solution [44]. Another work demonstrated thin-layer chromatographic fingerprint and antioxidant activity by a TLC-DPPH test of selected Pulownia species as the potential source of phenolic compounds. The TLC fingerprint profiles of examined plant material were executed using the silica gel 60F254 plates and mixture of ethyl acetate-formic acid-acetic acid-water (12:1.5:1.5:4, v/v/v/v) with Naturstoff as reagent derivatization [45]. Nugraha et al. [46] detected alkaloids, flavonoids, polyphenols, tannins, saponins, and steroids in Bryophyllum pinnatum, Dioscorea esculenta, Senna siamea, Flagellaria indica, Persea odoratissima, Hibiscus tilliaceus., Moringa oleifera, Lunasia amara, Murraya paniculata, and Tetrastigma lanceolarium. Analyses were realized using the TLC technique and using dichloromethane-methanol (9.5:0.5, v/v) as mobile phase. Vanillin reagent and Dragendorff reagent were used for the detection of terpenoids and alkaloids, respectively. The work prepared by Belhi et al. [47] presents the utility of TLC as a preliminary technique for phytochemical screening of Limoniastrum feei extracts collected from the South-West of Allgeria. Chromatographic analysis conducted by using ethyl acetate-heptane in volume ratio: 75:25 confirmed the presence of various bioactive compounds, such as saponins, flavonoids, tannins, coumarins, and alkaloids in these extracts. Spots were detected on chromatographic plates (silica gel 60F254) under UV light and with the use of proper visualizing reagents, such as ethanolic solution of 5% AlCl3 in the case of flavonoids, ethanolic solution of KOH in order to indicate the presence of coumarins, methanolic solution (80%) of 1% FeCl3 to detect tannins or a mixture of formaldehyde solution with sulfuric for the analysis of alkaloids. The RF values of spots on the plates were used to identify the active compounds. The use of TLC with bioautography in further steps of this study revealed the antifungal and anti-cellulases activity of examined Limoniastrum feei extracts [47].
The essential oils are produced and stored by various plants’ organs. Essential oils have been used for thousands of years as specifics in natural medicine, cosmetics and dermatology. Essential oils can be used as drugs: irritating, antibacterial, expectorant, diuretic, choleretic, gastric, sedative and anesthetic. Naik et al. [48] used HPTLC for the analysis of essential oils in mature fruits, leaves, barks, and roots of Ammona smuricata. HPTLC was realized on silica gel 60 F254 plates using toluene-ethyl acetate (9.3:0.7, v/v) as mobile phase. Spots were visualized using vanillin-sulphuric acid as a visualizing agent. Densitometric analysis was performed at λ = 254 and 366 nm. RF values equaled 0.04 and 0.17 for essentials oils, and 0.29, 0.37, 0.45, 0.56, and 0.92 for unknown substances in the rind extract of A. muricata L. RF values equaled 0.04 and 0.70 for essentials oils, and 0.06, 0.10, 0.20, 0.26, and 0.36 for unknown substances in the pulp extract of A. muricata L. RF values equaled 0.07, 0.17, 0.22, 0.29, and 0.70 for essentials oils, and 0.38 for unknown substance in the seed extract of A. muricata L. RF values equaled 0.17; 0.42 for essentials oils, and 0.03 and 0.53 for unknown substances in the leaf extract of A. muricata L. RF values equaled 0.18 and 0.39 for essentials oils, and 0.02, 0.27, and 0.46 for unknown substances in the root extract of A. muricata L. RF values equaled 0.07, 0.22, 0.29, and 0.70 for essentials oils, and 0.17 and 0.38 for unknown substances in the seed extract of A. muricata L. [48].
Salidroside, rosavin, p-tyrosol, and hydroquinone have potential antidepressant and anxiolytic properties. These compounds were investigated in Rhodiola rosea L. root and rhizome extract. Analyses were performed on silica gel 60 F254 plates using ethyl acetate-methanol-water (77:13:10, v/v/v) as mobile phase. For the visualization of sugars, 2-isopropyl-5-methylphenol (0.5 g) in 95mL ethanol and 5mL sulfuric acid was used with the NP-PEG test: 1g diphenylboryl-oxyethylamine in 100 mL methanol, and 5 g polyethylene glycol-4000 in 100 mL ethanol, and 0.2% 2,2-diphenyl-1-picrylhydrazyl solution in methanol were used as visualizing reagents. Bioautographic detection TLC was also applied. Chromatograms were sprayed in the acetylcholinesterase (AChE) from Electrophorus electricus solution. Chromatograms were immersed for 8s in the bacterial suspension (bioautogram was documented in VIS reflected light). Plates were incubated in the humid atmosphere in a closed vessel at 37 °C for 20 min. The NP-PEG test confirmed high content of phenolic compounds. RF equaled 0.32, 0.53, and 0.82 for rosavin (dark green spot), salidroside (brown spot), and p-tyrosol (orange-brown spot), respectively. Hydroquinone was not detected with p-anisaldehyde [49].
HPTLC was also used to qualitatively study the composition of Weikangling capsules, which are used to treat chronic gastritis. The method developed allowed for the identification of four herbs in Weikangling capsules. A mixture of chloroform-methanol-water (14:5:1, v/v/v) was used as the mobile phase [50].
Tang et al. [51] described how to use smartphones to recognize patterns of planar chromatograms. They used micellar TLC to distinguish four herbal remedies from citrus fruits. The analyses were performed on polyamide plates. They used an octanol/water-formic acid (98:2, v/v) emulsion as the mobile phase. On the other hand, a 1% aqueous solution of AlCl3 was the visualizing reagent.
The scientific literature cited and discussed above indicates that thin layer chromatography in combination with densitometry is the technique of choice for the analysis of herbal and synthetic drugs. The advantage of TLC is the availability, speed of analyzing several samples on the same chromatographic plate, and the ability to detect the marked substances using various methods (e.g., physical under UV light, or chemical through the use of an appropriate visualizing reagent). Thin layer chromatography can easily deal with complex and diverse matrices. However, TLC also has some disadvantages. Thin layer chromatography separation results are dependent on many parameters that are difficult to standardize. Interlaboratory studies show that there may be significant differences in retention parameters obtained for different sorbents, even within a given production batch of the same manufacturer. This is due to the fact that the technological process of obtaining sorbents is complicated and depends on many parameters; hence, the reproducibility of the chromatographic properties is difficult to achieve. Therefore, it should pay attention to the production batch number when comparing the separation results; this is especially important when comparing the values of the RF coefficients. It is best to analyze both the sample and the standards of the substances to be separated on the same plate. The sample application stage significantly affects the quality of the separation, as well as the precision and accuracy of the quantitative results. The reproducibility of the results in TLC is also influenced by the saturation of the chamber with vapors of the components of the mobile phase. The composition of the vapors may be unique in subsequent experiments, as it depends on the volume of the chromatographic chamber, the state of saturation of the chamber with vapor in the mobile phase before the unfolding process begins and, of course, the temperature. Therefore, it is very important to ensure the reproducibility of the conditions for developing the chromatograms. The best reproducibility is achieved with chromatogram developing in sandwich chambers and with automatic chromatogram developing (ACD) chambers. However, the recently published TLC procedures conducted by means of high quality adsorbents and mobile phases accurately controlled the activation time of TLC plates and the saturation time of the chromatographic chamber to ensure obtaining satisfactory results of reproducibility the measurements of different bioactive compounds in plant and synthetic materials for pharmaceutical purpose, similar to other validation parameters listed in Table 1. Moreover, thin layer chromatography is an economic technique. TLC has grown in importance by connecting online to MS, usually via a commercial TLC-MS interface for direct elution from the layer to the inlet of the mass spectrometer. By combining TLC with MS, substances can be identified, irrespective of the source, on the basis of their chromatographic fingerprint. Thin layer chromatography is an excellent tool for quickly comparing several samples in parallel, checking for adulteration, monitoring purity and stability, and quantifying biologically active compounds. TLC-MS can complement the much more sophisticated and expensive HPLC-MS method. TLC analyses allow for the use of smaller volumes of mobile phases compared to HPLC analyses, which makes TLC a more ecological technique. There are many reports in the scientific literature combining TLC with a densitometry. However, there are few works linking TLC with MS and TLC with electrospray ionization and tandem mass spectrometry (ESI–MS/MS). Therefore, it seems that, in the next few years, there should be more scientific papers using TLC-MS and HPTLC-ESI-MS/MS.
3. Column Liquid Chromatography
High Performance liquid chromatography (HPLC) is the dominant technique in pharmaceutical and phytochemical analysis of various bioactive compounds. Compared with other analytical techniques, HPLC offers high sensitivity and accuracy of qualitative and quantitative analysis of pharmaceutically active compounds (APIs) in different samples (matrices), such as synthetic drug products and plant materials [52,53,54].
Several original papers created in the last two years have reported its utility in the pharmaceutical analysis of different chemical structures and pharmacological activity of bioactive compounds [11,13,14,55,56,57,58,59,60,61,62,63,64,65,66,67,68,69,70,71,72,73,74,75,76,77,78,79,80,81,82,83,84,85,86,87,88,89,90,91]. HPLC has contributed as a reliable analytical tool in the pharmaceutical industry, i.e., in quality and quantity control of natural and synthetic drugs and drug substances, as well as their chemical stability. Some of the recent papers depicting the application of high-performance liquid chromatography for the pharmaceutical analysis and phytochemical study of medical plants cultivated in different countries are presented in Table 2.
In order to obtain reliable results of quantitative analysis, the HPLC procedure should be optimised and validated. Therefore, the data presented in Table 2 show the characteristics of chromatographic conditions used and validation parameters determined for described HPLC procedures in accordance with the International Conference on Harmonization guidelines (ICH), such as linearity range, precision, recovery, specificity, limit of detection (LOD), limit of quantification (LOQ), and robustness. Some of these HPLC procedures are dedicated for simultaneous determination of several active ingredients in multicomponent samples, including the newly synthesized co-drugs. The presented HPLC methods are simple and didn’t involve expensive instrumentation or excessive solvents. The described papers confirm that the HPLC method, in combination with different detection systems (UV, DAD(PDA), MS), i.e., ultraviolet, diode array spectrophotometry, and mass spectrometry, provides simple, accurate, reproducible and stability indicating assays for routine control of different APIs as well as phytochemical constituents in the presence of excipients or induced degradation products as their impurities in different commercially available pharmaceutical dosage forms i.e., tablets, capsules, drops, creams and injection vials.
Table 2 shows the utility of HPLC with UV or DAD (PDA) detection to determine the members of various classes of bioactive compounds, such as biguanide and gliptin antidiabetic drugs: metformin, saxagliptin, dapaglifloxin in ternary combined tablets [11], metformin and ertugliflozin pidolate in bulk and tablets [55] and a relatively new, oral antidiabetic drug, namely vildagliptin in tablets [56]. The HPLC method with isocratic or gradient elution system found to be precise, sensitive, accurate and selective for routine laboratory control of these orally applied diabetic drugs in combined tablets or in mixture of their degradation products, similar to the vildagliptin study [11,55,56].
The next works aimed to develop and validate a novel, accurate, rapid and selective HPLC procedure for the analysis of different antibiotics that belong to fluoroquinolones, penicillins, cephalosporins and others in bulk and pharmaceutical formulations for oral use, i.e., tablets, capsules and suspensions [57,58,59,60,61,62] or as ophthalmic formulations, respectively [14]. In almost all described studies, the single HPLC method with UV detection was selective and sensitive for separation and simultaneous determination without interference of two or more antibiotics in combined dosage form in the presence of other active ingredients, such as β-lactamase inhibitors (e.g., clavulanic acid) or steroids (e.g., prednisone, dexamethasone) and others. The LODs and LOQs are placed in the range of µg/mL. In addition to this, one of the new works prepared by Almalki and coworkers demonstrates an ecofriendly HPLC-MS method for quantitative assay of amoxicillin, dicloxacillin and their impurities in pure form and capsules [59].
Further analysis of newly published papers indicate the success of new HPLC-UV and LC-QTOF-MS methods (liquid chromatography coupled to quadrupole time-of-flight mass spectrometry) for quantitative laboratory control of selected corticosteroids, glycocorticosteroids and anabolics (e.g., triamcilonone acetonide, stanozolol, hydrocortisone) in different dosage forms for human and veterinary use, i.e., tablets, injectable suspension, topical dosage form or in the newly developed ophthalmic dosage form [63,64,65,66,67,68]. The improved RP-HPLC method with ultraviolet detection for the analysis of prednisolone as an active ingredient of pharmaceutical products and its five related substances (impurities) in accordance with Ph. Eur. Monograph (European Pharmacopea) was reported by Finsgar et al. [63]. In another work, Tabaza and coworkers developed an RP-HPLC method for the determination of dehydroepiandrosterone (DHEA) in dietary supplements and pharmaceutical products [67]. This steroid is commercially available in the form of tablets and capsules and can be combined with vitamins or herbal extracts (e.g., gingko). Tabaza and coauthors implemented an RP-HPLC method for DHEA analysis in dietary supplements aiming to reduce the cost and time, and to obtain reliable results of analysis [67].
Due to the observed increase of consumption of nonsteroidal anti-inflammatory drugs (NSAIDs), there is a need to develop new and efficient analytical methods for separation and accurate determination of these compounds in multi-component drug formulations.
Newly published papers indicate that RP-HPLC could simultaneously detect in one HPLC run various NSAIDs in combined pharmaceutical formulations [69,70,71,72]. For instance, an RP-HPLC method has been used as a stability-indicating assay for active ingredients, namely indomethacin, paracetamol, famotidine and the newly synthesized codrug (indomethacin-paracetamol) [69]. Another work prepared by Al-Khateeb and coauthors shows a simple, rapid, efficient and green method of high-temperature liquid chromatography (HTLC) for the separation and simultaneous determination of selected NSAIDs (ketoprofen, naproxen, sodium diclofenac, ibuprofen) in pharmaceuticals, as well of NSAIDs trace in water samples [70]. Growing research on the simultaneous analysis of the combination of NSAIDs, i.e., aspirin, paracetamol, and naproxen by isocratic RP-HPLC method using short column also confirms the next two papers published by Hassan and Nam [71,72]. Reported HPLC methods are cost-effective way to determine NSAIDs in a combined mixture.
Observed progress of the COVID-19 pandemic shows an urgent need of safe and effective therapy in treating coronavirus disease. Therefore, different HPLC procedures with ultraviolet or dual, i.e., ultraviolet-fluorimetric detection have been described for the quantification of selected antiviral drugs as potential candidate drugs for COVID-19, such as remdesivir, favipiravir and hydroxychloroquine enantiomers [73,74,75,76]. As is shown in Table 2, a new RP-HPLC method with fluorimetric and diode array detection suitable for quality control of remdesivir in raw material and pharmaceutical dosage form was developed and fully validated by Hamdy and coworkers [73]. Similarly, Bulduk and Akbel reported a new HPLC method for analysis of this drug in pharmaceutical formulations [74]. In another work, Bulduk proposed a sensitive and isocratic HPLC-UV method for the quantification of favipiravir in tablet dosage form [75]. Xiong and coworkers developed and validated an accurate normal chiral HPLC method for the analysis of two enantiomers purity (R- and S-) of hydroxychloroquine as a potential new therapy for COVID-19. The method was further evaluated with biological samples [76]. With this method, the LOD were 0.27, 0.34 and 0.20 µg/mL for racemate and enantiomer R- and S-, respectively [76].
An RP-HPLC technique was also applicable as a stability-indicating method for the analysis of active ingredients and their impurities in pharmaceutical formulations of some drugs affecting the autonomic nerves system, such as ephedrine in the presence of naphazoline and neostigmine methylsulfate [13,77]. The RP-HPLC analysis proposed by Parab and coworkers allows for the simultaneous quality control, forced degradation and stability study of neostigmine methylsulfate in bulk drug and injection formulation [77].
The presented literature review also confirms the use of high-performance liquid chromatography in the study of drug stability and drug degradation kinetics. HPLC-UV was successfully applied to test the stability of antihistamines: ketotifen (KETO), epinastine (EPI) and emedastine (EME) in the pH range from 1 to 13 [78]. Degradation products were identified by UHPLC-MS/MS. Chromatographic analysis was conducted on an RP-18 column (and CN column) using a mobile phase: acetonitrile-methanol—acetate buffer of pH 4.8 and methanol-phosphate buffer of pH 2.5 [78].
Table 2 shows the use of HPLC for the characterization and quantification of selected phenolic compounds/polyphenols and related compounds as potential antioxidants that occurred in bulk drugs and plant extracts [79,80,81,82].
The validated HPLC-UV technique utilizing the mobile phase consisted of ammonium acetate and acetonitrile; moreover, the C18 column proposed by Subramanian et al. [79] can be sensitive and reproducible to determine the stability of quercetin and rutin in pharmaceutical formulations [79].
Another work shows the utility of the HPLC method for the determination of different bioactive compounds belonging to antioxidants from Crocus sativus L. flowers extract [80]. A new HPLC-PDA technique has been successfully applied for the separation and simultaneous quantification of bioactive compounds, including phenolics with antioxidant activity in polyherbal Unani formulation, thus, as active drug components [81]. Similarly, Khursheed et al. validated a simple high-performance liquid chromatography (HPLC) method for the simultaneous determination of curcumin and quercetin in exctracts of Allium cepa and Mentha arvensis, as well as extracts-based marketed formulations or in-house formlated selfnano emulsifying drug delivery system [82].
HPLC-MS/MS profiling of potential antioxidants i.e., some phenolic acids and flavonoids in extracts of Salvia species from Jordan have been successfully presented by Al-Jaber and coworkers [83]. The results obtained confirmed that the three Salvia species exhibited good antioxidant activity due the presence of four bioactive phenolic acids, including gallic acid, caffeic acid, rosmarinic acid and salvianolic acid B and seven other flavonoids, such as luteolin-7-O-glucoside, apigenin, apigenin-7-O-glucoside, rutin, nariginin, hesperidin and quercetin [83].
The literature review indicates that the broad spectrum of pharmacological activities of plant components, cultivated in different countries, increases the role of the HPLC method in combination with the UV detector and mass or tandem mass spectrometry, respectively, in the phytochemical analysis of various plants rich in anticancer compounds and, thus, in the development of new anticancer drug candidates.
Similarly, Zvikas et al. [84] investigated the antitumor activity of Japanese quince (JQ) extracts of the cultivars “Darius”, “Rondo” and “Rasa” leaf extracts on C6 and HROG36 glioma cells. They studied the composition of polyphenols found in plant extracts and they used the previously validated UPLC-ESI-MS/MS to evaluate the composition of polyphenolic compounds. Analyses were conducted using the C18 column and two mobile phases (solvent A: 0.1% formic acid solution in water; solvent B: acetonitrile) in the gradient elution. A total of 16 phenolic compounds have been identified. It was stated that Japanese quince (JQ) extracts of “Darius”, “Rondo” and “Rasa” leaf extracts could be potential anticancer drugs, as they reduce the viability of glioblastoma cells [84].
Another work shows the use of HPLC-DAD with a C18 column and acetonitrile-water (55:45) as a mobile phase in the design of new formulations containing paclitaxel (a compound useful in treating different tumors), i.e., to characterize paclitaxel loaded micelles as an anticancer drug. It was stated that sodium cyanide loaded with paclitaxel in an acidic environment effectively released paclitaxel and increased its cytotoxicity [85].
The next papers indicate the usefulness of HPLC-DAD and HPLC-ESI-MS/MS methods for qualitative and quantitative analyses of alkaloids [86,87,88], which have a wide range of pharmacological activities. For example, some of them, such as isoquinoline derivatives, indicate acetylcholinesterase activity inhibition and can be important for neurodegenerative disorders such as Alzheimer’s disease. Tuzimski and Petruczynik applied the HPLC-DAD method for the quantitative determination of five isoquinoline alkaloids, i.e., berberine, chelerythrine, chelidonine, proptopine and sanguinarine in plant extracts (Sanguinaria canadensis) [86]. In another article, the HPLC method was established for the rapid quantitative determination of other alkaloids, namely columbamine, jateorhizine, palmatine and berberine in the three Mahonia plant materials to evaluate and compare their quality [87]. HPLC-ESI-MS/MS and HPLC-DAD methods were successfully applied for the analysis of aconite alkaloids: benzoylaconine, benzoylmesaconine, benzoylhypaconine, aconitine, mesaconitine, and hypaconitine in extract of Aconiti kusnezoffii Radix, popular in traditional Chinese and Mongolina medicine as a source of analgesic and anti-inflammatory phytocompunds [88].
Table 2 also indicates the utility of the validated HPLC method coupled to UV and DAD (PDA) detector for the determination of glucosamine sulphate in dietary supplement tablets [89], as well as Shankhpushpi (important for functioning of the brain) in fifteen Shankhpushpi samples purchased in February (2019), and also coming from the local market and three authenticated samples of all three C. pluricaulis, C. ternatea, E. alsinoides [90]. In addition to this, Table 2 presents the parameters of HPLC methodology as suitable for the determination of ethyl p-methoxycinnamate (anti-inflammatory, antifungal, antiangiogenic, larvicidal, and analgesic activities) in Kaempferia galangal [34]. An interesting study performed by Jia and coworkers established an HPLC-DAD method for the determination of the five constituents (deoxyschizandrin, γ-schizandrin, loganin, paeoniflorin, and paeonol) in Maiwei Dihuang pills used as traditional Chinese medicine as a source of different bioactive compounds [91].
The recently published works also confirm the utility of size-exclusion chromatography (SEC) coupled to multi-angle light scattering (MALS) to control the production process of biological drugs. As is well known, these drugs revolutionized the treatment process of cancer and autoimmune system diseases. SEC-MALS technique coupled to HPLC is the reference method for analysis of different macromolecules, such as proteins and polymers [92,93]. It allows for direct measurements of their molecular weight and purity based on difference in size. Thanks to SEC-MALS, the analysis of modified proteins such as lipoproteins or glycoproteins, and conjugates such as detergent-solubilized membrane proteins, is also possible. Because biologic drugs can be composed of proteins, nucleic acids or a combination of them, this, therefore, increases the role of SEC-MALS in the monitoring process of the production of such drugs. Hence, SEC-MALS is an efficient tool in the confirmation of the properties of molecules as potential candidates for biological drugs.
In the case of the HPLC analysis combined to SEC-MALS, a mixture containing phosphate buffered saline (PBS) as mobile phase and SEC column, i.e., silica-based or polymers-based are usually used. For instance, Fu et al. used this technique in a quality study of recombinant anti-interleukin-23 monoclonal antibodies as potential anticancer drug candidates [94]. Another work shows utility of size-exclusion chromatography in purity control of next antibody-drug conjugates (ADCs) as anticancer agents. In this work, a novel approach to derive homogeneous ADCs with a drug-to-antibody ratio of 2 from any human immunoglobulin 1 (IgG1), using trastuzumab as a model, was described [95]. A similar study was presented by Farras and coworkers concerning the search of functional monoclonal antibodies (mAbs) based on trastuzumab structure [96]. Another paper shows that HPLC combined to SEC-MALS was a fast method for characterizing the content of capsids in samples containing adeno-associated virus (AAV) and, thus, for supporting the development of therapeutic AAV-based drugs [97].
Another work presents the important role of SEC in the detection of macromolecular substances occurring in traditional Chinese medicine injections as a dangerous factor causing adverse reactions on human organism [98].
To summarize, it can be stated that high performance liquid chromatography in both normal and reversed phase systems coupled to UV-Vis, DAD(PDA) and MS detection modes in isocratic or gradient elution systems is a versatile tool for stability-indicating assays for numerous active ingredients (APIs) in different pharmaceutical formulations without interferences from other excipients. Fully validated in accordance with ICH guidelines, the HPLC method was successfully applied in qualitative and quantitative simultaneous analyses, i.e., in quality control of active ingredients belonging to different chemical structure and pharmacological activity, compounds such as antidiabetic agents, selected antibiotics, some steroids, antioxidants or relatively new antivirus compounds for COVID-19 treatment, in synthetic or natural drug products commercially available in tablets, capsules, drops, suspension, creams and injection vials.
The current literature review indicates that HPLC with diode array detection or fluorimetric detection is universal because it is economical, sensitive enough and a selective method for quantification and can describe the impurity profiles or stability study of different groups of drugs, including antibiotics, antidiabetic drugs, NSAIDs and antivirus agents. It has also been observed to increase the role of the HPLC method in combination with UV detector and mass/tandem mass spectrometry, respectively, especially in the pharmacokinetic study of these drugs and phytochemical analysis of various plants rich in phytocompounds that may have various pharmacological activities, e.g., antioxidants or anticancer compounds, and, thus, in the development of new drug candidates. The main advantage of the current HPLC method combined with modern detection systems, i.e., HPLC-TQ-ESI-MS/MS, is its high selectivity and sensitivity for the identification and simultaneous quantification of a variety of bioactive compounds belonging to different chemical classes and occurring in various matrices. However, until today, the main disadvantage of the described HPLC method, especially in combination with advanced detection systems, is it’s high cost, non-universal detection system and time consuming sample preparation.
4. RP-TLC/RP-HPLC and Lipophilicity
The next papers show the utility of liquid chromatography, i.e., thin-layer chromatography as well as high-performance liquid chromatography in reversed phase system (RP-TLC and RP-HPLC), to evaluate the lipophilicity as one of the most important physicochemical properties of organic compounds that influences their biological activity as potential drugs [99,100,101,102,103,104,105]. The use of chromatographic techniques to study the lipophilicity of compounds has been known for many years.
Morak-Młodawska et al. [99] investigated the lipophilic properties of 1,2,3-triazole-dipyridothiazine with antitumor activity by the RP-TLC method. The lipophilicity parameters obtained by the TLC technique were compared with the logP obtained by calculation. They found that the calculation methods did not give good approximations to the values of the lipophilicity parameters obtained experimentally with the RP-TLC technique. Another work presents the application of chromatographic parameters RF and next RM to determine the lipophilicity descriptor according to the Soczewiński–Wachtmeister methodology for twenty-one newly synthesized chalcones [100]. Thin-layer chromatography analysis was performed using reversed phase silica gel 60 RP-18F254 plates (RP-TLC) and three binary phases: acetonitrile–water, ethanol–water and acetone–water. Among all mobile phases used, the best was that which consisted of acetonitrile-water. This mixture allowed one to predict the most reliable chromatographic parameter of lipophilicity (C0) best correlated with calculated logP. In addition to this, the performed QSRR analysis (quantitative structure-retention relationship) between C0 and selected molecular descriptors was helpful to determine those with the highest influence on C0, and, thus, on the lipophilicty parameter of examined compounds. Thin layer chromatography and the Soczewiński–Wachtmeister method were also used for the evaluation of the lipophilicity of spirohydantoins applied in the treatment of epilepsy and diabetes [101]. High correlations were stated between lipohilicity and plasma protein binding and between lipophilicity and the blood–brain barrier [101]. Dołowy et al. [102] investigated by NPTLC and RPTLC techniques the lipophilicity of antidiabetic drugs, namely metformin and phenformin. The obtained results of lipophilicity were compared with the theoretical values of the partition coefficients of the studied drugs. They showed difficulties in obtaining reliable lipophilicity values. They indicated that theoretical methods based on the Gutman and Randic topological indexes could be used as new procedures to calculate the lipophilicity of metformin and phenformin.
Another study confirmed that both chromatographic techniques, TLC and HPLC, play an important role in describing the retention behavior and then modeling using chromatographic lipophilicity parameters of selected antiarrhythmics compounds, i.e., ivabradine, its related compounds, diltiazem and verapamil, in the hydrophilic interactions under both chromatographic systems [103]. In the case of TLC, retention behavior of the investigated compounds was studied on silica gel 60 CN F254 plates as stationary phase and acetonitrile-methanol containing 25% (v/v) formic acid. The HPLC conditions consisted of silica gel modified with cyanopropyl ligands as a column packing and the acetonitrile—0.25% aqueous solution of formic acid as mobile phase. Retention behavior of the investigated compounds was characterized both for TLC and HPLC data by the Soczewiński–Wachtmeister equation. The presented study shows that the lipophilicity parameter afftects the retention behavior of pharmaceutically important compounds and plays a key role in the controlling of this retention mechanism [103].
The current literature review shows the utility of both, i.e., high performance liquid chromatography and chemometric analysis, for the determination of the pharmacological profile of 15 cytostatic drugs, such as nimustine, actinomycin D, irinotecan, daunorubicin, doxorubicin, idarubicin, melphalan, mitomycin C, vinorelbine, pirarubicin, docetaxel, vincristine, vindesine, vinblastine and etoposide [104] and nine β-blockers [105]. The drugs were analyzed using an RP-HPLC system that consisted of a C18 column, with gradient elution by mixture of eluent A (water-0.1% formic acid) and eluent B (acetonitrile-0.1% formic acid). The lipophilicity parameters obtained under the described chromatographic conditions were compared with the logP calculated by computer programs. Principal component analysis (PCA) was applied to find relationship models between obtained lipophilicity parameters, some molecular descriptors and biological activity, as well as the mechanism of action and therapeutic properties of examined drugs. The study indicates that PCA can effectively allow the classification of bioactive compounds on the basis of computational data, such as the calculated lipophilicity parameter. Similarly, as in previous work, the data were compared with QSAR analysis, which is an important tool in the design of new drugs and in the prediction of their potential pharmacological activity [104].
5. Gas Chromatography
The recently published papers indicate that gas chromatography (GC) with different detection systems, such as flame-ionization detector (GC-FID), or coupled to single or tandem mass spectrometric approaches (GC-MS, GC-MS/MS), served as an effective tool for the determination of various bioactive compounds in pharmaceutical and phytochemical analysis [106,107,108,109,110,111,112,113,114,115,116,117,118,119,120,121,122,123,124,125,126,127,128,129,130].
GC-FID was used for the determination of the active ingredient in the phenyl salicylate drug substance [106]. Analyses were performed on the HP-5 quartz capillary column (30 m × 0.5 mm × 0.25 µm) with chemically grafted 5% diphenyl- and 95% dimethylpolysiloxane, using nitrogen as carrier gas with a flow rate of 1.0 mL/min. Precision and robustness of the developed method were 0.15% and 0.08 ÷ 0.13%, respectively [106]. In another paper, GC-FID was used for the rapid, simultaneous determination of six active ingredients, i.e., acetaminophen (APAP), dextromethorphan hydrobromide (DN), pseudoephedrine hydrochloride (PE), chlorpheniramine maleate (CPM), diphenhydramine hydrochloride (DE) and caffeine (CA) in anti-cold drugs [107]. Analyses were done on the TM-1301 capillary column (30 m × 0.25 mm × 0.25 µm), using nitrogen as carrier gas with a flow rate 1.0 mL/min. Under the optimum conditions, the LODs and LOQs of analyzed compounds were in the range of 0.36 ÷ 2.50 µg/mL and 1.20 ÷ 8.30 µg/mL, respectively. The intra- and intraday precision were in the range 1.2 ÷ 3.1% and 0.6 ÷ 0.9%, respectively [107].
The next papers [108,109,110,111,112] show the applicability of GC analysis for the determination of impurities in drugs. For example, GC-FID was successfully applied to the determination of methyl, ethyl and isopropyl methanesulfonates impurities (MMS, EMS, IPMS) in the delgocitinib drug [108]. Analysis were performed on the DB-624 UI column (30 m × 0.25 mm × 1.4 µm), using helium as the carrier gas with a flow rate of 5.0 mL/min. The developed method showed good linearity, accuracy and precision from 1 to 5 ppm. The LOD and LOQ were 0.1 and 0.3 ppm for MMS, 0.05 and 0.1 ppm for EMS and IPMS, respectively [108]. Ahirrao et al. [109] used the GC-MS/MS method for the estimation of genotoxic impurities, i.e., methyl methane sulfonate (MMS), ethyl methane sulfonate (EMS) and isopropyl methane sulfonate (IMS) in alalevonadifloxacin mesylate (ALA), which is a new antibiotic approved in India to treat infections caused by Gram-positive bacteria. The study was conducted using the Rtx-624 column (30 m × 0.32 mm × 1.8 µm) and helium as the carrier gas, with a flow rate equal to 1.5 mL/min. The proposed method was highly sensitive with LOQ for MMS, EMS and IMS as 5, 10, and 20 ng/g of ALA, respectively [109]. In the next paper, headspace GC-MS was used for the determination of 1,2-dibromoethane, which is a known carcinogenic impurity in tramadol hydrochloride drug substances [110]. The DB 624 column (30 m × 0.2 mm × 1.8 µm), with helium as the carrier gas and a constant column flow of 2.0 mL/min were employed. In addition, 1,2-dibromoethane was detected and quantified at 0.29 ppm and 0.96 ppm, respectively [110]. On the other hand, Ramakrishna Reddy et al. [111] developed GC-FID for the determination of 1,4-butanediol (related impurity) in busulfan drug, which is used, i.a., in the treatments of chronic myeloid leukemia. Analysis was performed on the DB-1 column (30 m × 0.53 mm × 2.65 µm), with nitrogen as the carrier gas and a flow rate of 3.5 mL/min. The LLOD and LLOQ for examined impurity were 77 ppm and 253 ppm, respectively [111]. Another study shows the utility of GC-MS/MS for the determination of four N-nitrosamine genotoxic impurities (i.e., N-nitrosodimethylamine (NDMA), N-nitrosodiethylamine (NDEA), N-nitrosodibutylamine (NDBA), and N-nitrosodiisopropylamine (NDIPA)) in sartan drugs [112]. Analyses of N-nitrosamines were conducted on the Agilent VF-Wax capillary column (30 m × 0.25 mm × 1.0 µm). Helium as the carrier gas was set at a flow of 1.0 mL/min. The proposed method was linear in the range 0.8 ÷ 60 ng/mL. The LODs and LOQs of analyzed impurities were in the range of 0.002 ÷ 0.150 ppm and 0.008 ÷ 0.500 ppm, respectively [112].
GC is a useful technique for testing any volatile substances, such as essential oils, which are a promising group of natural products of the aromatic plants, as a result of their various biological effects, i.e., their antioxidant, antibacterial, antimicrobial, and antitumor activities [113,114,115,116,117,118,119,120].
Almeida et al. [113] determined essential oils in Ocotea odorifea using GC-MS on the HP-5MS (5%-phenyl-95%-dimethylpolysiloxane, 30 m × 0.25 mm × 0.25 µm) column, with helium as the carrier gas and a flow rate of 1.0 mL/min. Analysis confirmed the presence in Ocotea odorifea in the following essential oils: α-pinene (0.3%), camphene (0.2%), β-pinene (0.1%), α-felandrene (1.9%), o-cymene (3.0%), 1,8-cineole (0.9%), camphor (0.4%), α-terpinol (0.3%), safrole (77.9%), eugenol (0.6%), (E)-caryophyllene (0.4%), γ-muurolene (0.3%), Δ-selinene (0.5%), bicyclogemacrene (1.1%), spathulenol (4.0%), and 11-selinen-4-alpha-ol (1.2%) [113]. Essential oils can provide an alternative to antibiotics. Therefore, Zakaria Nabti, et al. [114] examined the composition and antibacterial activity of essential oils in the Algerian Origanum glandulosum Desf using the GC-MS method. Measurements were performed on the HP-5MS capillary column (5% phenylmethylpolysiloxane, 30 m × 0.25 mm × 0.1μm), with helium as carrier gas and a flow rate equal 1.0 mL/min. The authors found that thymol (15.2–56.4%), carvacrol (2.8–59.6%), γ-terpinene (9.9–21.8%) and p-cymene (8.5–59.6%) 13.9%) were the main components of Algerian Endemic Origanum glandulosum Desf and showed antibacterial properties. Therefore, Origanum glandulosum Desf can be used as an antibacterial drug, e.g., in the treatment of bacterial urinary tract infection [114]. Boukhatem et al. [115] examined the antitumor activity of the Algerian Lavandula stoechas essential oil. They determined the composition of essential oils found in Lavandula stoechas using GC-MS. Analyses were performed using a Tracsil Meta.X5 (95% dimethylpolysiloxane and 5% diphenylpolysiloxane) column (60 m × 0.25 mm × 0.25 µm), with helium as the carrier gas. The following essential oils were found in the extract: α-pinene, camphene, β-pinene, 1,8-cineol, linalool, pinocarveol, α-terpineol, myrtenal, arpmadendrene, and cis-calamenene. 1,8-Cineol is the most abundant (61.36%) and can, therefore, be used in skin care products with anti-inflammatory and anti-cancer properties [115]. In other paper, GC-MS was successfully applied to the determination of essential oil composition of the leaves of Abies pindrow, growing in India [116]. Analyses were done on the VF-5 MS capillary column (60 m × 0.25 mm × 0.25 μm), with helium as carrier gas and a flow rate equal to 1.0 mL/min. Authors identified twelve constituents from the essential oil of Abies pindow. The main constituents were limonene (38.9%), α-pinene (36.5%), β-pinene (6.9%), and α-selinene (4.4%). The essential oil showed meaningful antioxidant, antibacterial and anticancer activities [116]. In the next study, Moller et al. [117] determined the chemical composition and antioxidant and cytotoxic activity of Aloysia polystachya (Griseb) Moldenke essential oil. GC-MS was conducted on the HP-5 MS column. Eight compounds were found, with the most abundant being R-carvone (91.03%) [117]. Fayed et al. [118] determined essential oil from Deverra tortuosa using GC-MS on the TR-5 MS column (30 m × 0.32 mm × 0.25 µm), with helium as the carrier gas and a flow rate of 1.0 mL/min. Analysis confirmed the presence in Deverra tortuosa of 86 compounds, wherein oxygenated sesquiterpenes and monoterpene hydrocarbons were the main groups. Widdrol (14.64%), β-phellandrene (10.49%), piperitol (9.48%), cubedol (6.89%), (E)-10-heptadecen-8-ynoic acid methyl ester (6.52%), α-terpinene (6.21%), m-cymene (4.65%), and citronellyl tiglate (4.58%), were the major compounds [118]. Zhou et al. [119] investigated chemical and pharmacological properties of Eucalyptus grandis × E. urophylla (EEO) leaves essential oils using GC-MS. Twenty-seven compounds were identified, in which α-pinene (17.02%), α-terpineol (13.63%), aromadendrene (11.08%), D-limonene (8.47%) and endo-borneol (7.77%) were the main compounds for EEO. Essential oil from E. grandis × E. urophylla showed antioxidant, antibacterial and phytotoxic activity [119]. An interesting GC-MS study performed by Teles et al. [120] revealed that eugenol was the main compound of S. aromaticum essential oil. In addition, essential oil of S. aromaticum and eugenol had antimicrobial, antioxidant, and antitrypanosomal activity.
The next papers [121,122,123,124,125,126,127,128,129,130] show the applicability of GC-MS analysis for the identification of chemical components with different activity, including antioxidant, anticancer anti-androgenic, antimicrobial, antifungal and anti-inflammatory properties of various medicinal herbs that are cultivated in different countries, and that have not been well-studied in the literature. For example, the GC-MS technique was used for phytochemical analysis of Thaumatococcus daniellii leaves. Analyses were performed on the column (l20 mm × 0.25 mm × 0.25 µm), using helium as carrier gas and a flow rate equal to 1.46 mL/min. Vitamin composition of the Thaumatococcus daniellii leaf (mg/100g) was: 33.1 ± 0.09, 1.07 ± 0.01, 1.32 ± 0.02, 1.11 ± 0.02, 16.34 ± 0.02, 11.86 ± 0.04, 25.19 ± 0.14 for Vitamins: A, B1, B3, B5, B6, B12, C, respectively [121]. Slobodianiuk and coworkers [122] demonstrated the ability of the GC-MS method to determine the content of carbohydrates in Saponaria officinalis L. herb and roots. The measurements were performed on the HP-5MS column (30 m × 0.25 mm × 0.25 µm), using helium as the carrier gas at a constant flow rate of 1.2 mL/min. The obtained data exhibited that D-saccharose was common amongst free carbohydrates of Saponaria officinalis L. in the largest amounts. Its content in herb and roots of the common soapwort was 3.72 mg/g and 25.39 mg/g, respectively [122]. In other paper, Savych et al. [123] used GC-MS for investigation of the content of carbohydrates in five herbal antidiabetic mixtures. Capillary column HP-5 MS (30 m × 0.25 mm × 0.25 µm) and helium with flow rate 1.2 mL/min were used as the stationary and mobile phase, respectively. The obtained results showed that fructose, glucose and sucrose were the main sugars in all samples. In addition, number of polyalcohols like mannitol, pinitol and myo-inositol were identified by chromatographic analysis. These polyalcohols are important for the treatment and prevention of the progression of diabetes mellitus and its complications [123]. In the next work, Savych and coworkes [124] applied GC-MS for investigation of the content of inulin in five herbal mixtures, which are take in folk medicine for the prevention and treatment of diabetes mellitus type 2 in Ukraine. High content of inulin in the range of 99.21 to 458.97 mg/g in examined herbal mixtures was stated. Other work of Savych et al. [125] shows the applicability of GC-MS technique for identification of fatty acid content in the antidiabetic herbal mixture. The plant components of the examined herbal mixture were: Urtica dioica L. leaf, Rosa majalis L. fruits, Vaccinium myrtillus L. leaf, Mentha piperita L. herb, and Taraxacum officinale L. roots. Analyses was performed on the capillary column HP-5 MS (30 m × 0.25 mm × 0.25 µm), with helium as the carrier gas and a flow rate of 1.0 mL/min. Authors demonstrated that Urtica dioica L. leaf and Vaccinium myrtillus L. leaf contain 12 fatty acids, Rosa majalis L. fruits and Taraxacum officinale L. roots contain 13 fatty acids, and Mentha piperita L. herb contain 14 fatty acids. Moreover, unsaturated fatty acids were the main long-chain carboxylic acids in all plant raw material, in which the content was 55.3% in Urtica dioica L. leaf, 64.7% in Rosa majalis L. fruits, 60.5% in Vaccinium myrtillus L. leaf, 64.3% in Mentha piperita L. herb and 51.7% in Taraxacum officinale L. roots [125]. Mykhailenko et al. [126] for the first time applied GC-MS for study carboxylic acid composition of leaves of four species of the genus Iris (Iris hungarica Waldst. & Kit., Iris germanica L., Iris pallida Lam., Iris variegate L.) appearing in Ukraine. Chromatographic analysis of the methyl ethers of carboxylic acids were performed on the capillary column HP-INNOWAX (30 m × 250 µm × 0.50 µm) with helium as the carrier gas and a flow rate of 1.2 mL/min. Obtained results indicated high content of short-chain carboxylic acids, such as citric (1337.5 ÷ 12,364.4 mg/kg), malic (50.8 ÷ 4558.0 mg/kg) and oxalic (1199.0 ÷ 3435.2 mg/kg) acids in all samples. In addition, α-Linolenic acid prevailed in the leaves of I. germanica (869.5 mg/kg), I. pallida (753.3 mg/kg), and I. variegate (250.3 mg/kg) amongst polyunsaturated fatty acids, whereas linoleic acid was dominant in the leaves of I. hungarica (1150.7 mg/kg). Studies [127] show the applicability of thGC-MS analysis for investigation of the content of amino acids in the plant mixture samples: ((1) Cichorium intybus roots, Elymus repens rhizome, Helichrysum arenarium flowers, Rosa majalis fruits, and Zea mays columns with stigmas; (2) Urtica dioica leaf, Taraxacum officinale roots, Vaccinium myrtillus leaf, Rosa majalis fruits, Mentha piperita herb), which have proven antidiabetic activity in studies in vivo. Capillary column HP-5 MS (30 m × 0.25 mm × 0.25 µm) and helium with flow rate 1.0 mL/min were used as the stationary and mobile phase, respectively. Authors stated that dominant amino acids components were L-proline (19.885 mg/g in free form and 13.856 mg/g in bound form) in the sample 1 and also L-leucine (8.707 mg/g in bound form) and L-proline (4.794 mg/g in free form) in the sample 2 of studied plant antidiabetic mixtures. These and essential amino acids have the most pronounced insulin secretolytic activity [127].
In another paper, the GC-MS analysis was applied to the determination of the phytocomponents present in Clerodendrum serratum Linn roots, used in the treatment of various diseases, such as cough, asthma, rheumatism fever and cephalalgia ophthalmia in the Ayurveda and Siddha medicine in India [128]. Next, the GC-FID method was used for the determination of squalene, which was one of the constituents present in C. serratum Linn roots. The GC-MS measurements were performed on the Elite-5MS column (30 m × 0.25 mm × 1 µm), with helium as the carrier gas. Whereas, the GC-FID measurements were performed on the Zebron DB column (30 m × 0.25 mm × 0.50 µm), with nitrogen as the carrier gas with flow rate 12.7 mL/min. The obtained results showed that squalene, methyl palmitate, hexadecenoic acid and stigmasterol were major constituents in C. serratum Linn roots. Intra- and interday precision of squalene ranged from 1.154 ÷ 1.819% and 1.5102 ÷ 1.861%, respectively. The LOD and LOQ of analyzed squalene were 0.79 µg/mL and 1.89 µg/mL, respectively [128].
Izuegbuna and coworkers [129] investigated antineoplastic activity of Pelargonium Inquinans Ait leaves, a plant that comes from South Africa on acute leukaemia cell lines, U937 and Jurkat using GC-MS analysis. The measurements were performed on Zebron-5MS column (30 m × 0.25 mm × 0.25 µm), with helium as the carrier gas at a flow rate of 2 mL/min. It was stated that Pelargonium Inquinans have anti-proliferative and cytotoxic activity on U937 and Jurkat cell lines. In addition, the examined plants have anti-inflammatory and pro-inflammatory properties, respectively [129]. The study in [130] shows the applicability of GC-MS analysis for the determination of bioactive compounds of superior mutant rodent tuber (Typhoniumflagelliforme) in different fractions. The authors stated the presence of the main following compounds in the ethyl acetate and n-hexane fraction:
9,11-octadecadienoic acid methyl ester (55.37%), 9-octadecenoic acid (Z)-methyl ester (26.77%), hexadecanoic acid methyl ester (2.97), 9,12-octadecadienoyl chloride (2.47%), humulene (1.11%), octahydronapthalene (0.97%), alloaromadendrene oxide-(2) (0.85%), pentadecanoic acid methyl ester (0.80%), methyl tetradecanoate (0.79%), and eucalyptol (0.69%). Most of the identified compounds in examined Indonesian herb exibited anticancer, antioxidant, anti-androgenic, antimicrobial, antifungal and antiinflammatory activity [130]. The reviewed works confirmed that gas chromatography is a frequently used method for the rapid determination of active ingredients and impurities in drugs. GC analysis shows high sensitivity and allows one to detect impurities at the ng/g level. Gas chromatography has recently been used to study medicinal herbs (the contents of carbohydrates, inulin, fatty acids, carboxylic acids, amino acids, squalene, compounds with antioxidant properties, such as, e.g., essential oils). The most commonly used gas chromatography was combined with a mass spectrometer or a dual mass spectrometer (GC-MS, GC-MS/MS).
Described papers indicate the utility of this technique for the determination of new anticancer, antioxidant, antidiabetic, antimicrobial, and anti-inflammatory agents in plants.
6. Combined Techniques
The latest trends in the determination of bioactive compounds present in various complex matrices concern the so-called combined techniques (coupled techniques). In these techniques, separation methods are combined with various detection methods. Chromatographic methods (e.g., LC, GC) are mainly used as separation techniques, while spectroscopic methods (MS, NMR) are used as detection methods. Combined techniques also include combinations of several chromatographic methods. The combined technique should be selective for the analytes to be determined, be sensitive over a wide range of concentrations, and should enable the best possible identification of the substances to be determined. The nature of the analyte, the ease of combining the various methods, the sensitivity of the determinations required and the availability of the equipment should determine the choice of the appropriate combined technique. Numerous papers reported the utility of combined techniques in pharmaceutical and phytochemical analysis [131,132,133,134,135,136,137,138,139,140].
High performance thin layer chromatography and high performance liquid chromatography were used for the analysis of flavonoids and phenolic acids found in Flos Lamii albi [131]. HPTLC analyses were performed on Si 60F254 plates using a multiple gradient development program. For the analysis of flavonoids at a distance of 3 cm, the following were used: 6 mL solution A (toluene: hexane: formic acid, 7: 3: 0.1), 3 mL ethyl acetate, and 1 mL methanol. Then, 5 mL solution A (toluene: hexane: formic acid, 7: 3: 0.1), 2.5 mL ethyl acetate, and 2.5 mL methanol were used at a distance of 9 cm. For the analysis of phenolic acids, 3 mL solution B (heptane: dichloromethane, 7: 3), 2 mL diisopropyl ether, 0.1 mL 85% formic acid, and 1 mL distilled water were used in the development step 1 and 2. However, from step 3 to step 7, 4 mL solution B (heptane: dichloromethane, 7:3), 1 mL diisopropyl ether, and 0.1 mL 85% formic acid were used for development. Protocatechuic, vanillic, and cafeic acids were identified in L. album subsp. album flowers in two forms: as free acids and as glycosides. The highest amount of caffeic acid was found in the extract after basic hydrolysis. HPLC was used to separate the phenolic acids using the RP-18 column and water-methanol-formic acid (75: 25: 0.5, v/v/v) as mobile phase with UV detection at 254 nm. Nine acids were detected in esterified forms, namely protocatechuic, vanillic, caffeic, syringic, gallic, gentisic, p-coumaric, and chlorogenic acids, and trace amounts of ferulic acid [131].
Zekič et al. [132] compared the effectiveness of 13 organic solvents for the extraction of flavonoids and phenolic acids from Solidago canadensis L. and Solidago gigantea Aiton. HPTLC and HPLC-PDA were used for the analysis of extracts. HPTLC was performed on silica gel 60 plates and ethyl acetate-water-formic acid (85:15:10, v/v/v) as mobile phase. The spots were visualized; next, a scan was performed on the densitometer at λ = 370 nm. HPTLC-MS/MS was used to identify substances on the chromatography plates, whereas HPLC analyses were performed on a Hypersil ODS C18 column. Two mobile phases were used with the gradient elution, namely, first: 0.4% ortho-phosphoric acid in water and second: 4% tetrahydrofuran in acetonitrile. The flow rate was 1.0 mL/min. HPTLC and HPLC analyses confirmed that the best extraction yields were obtained with 70% aqueous solutions of methanol, ethanol and acetone. Different contents of chlorogenic acid, rutin, hyperoside, isoquercetin and quercetin were observed in Solidago canadensis L. and Solidago gigantea Aiton. Analyses using HPTLC and HPLC coupled with tandem mass spectrometry (MS/MS; HPTLC-MS/MS and LC-MS/MS) allowed for the initial identification of phenolic acids and flavonoids.
UHPLC-DAD-ESI-HRMS/MS combined with molecular networking-based dereplication and NMR were applied for the identification of flavonoid-3-O-glycosides in the ethyl acetate fraction of the methanolic extract from leaves of Casearia arborea, which is a fundamental source of cytotoxic highly oxidised clerodane diterpenes, besides phenolics, flavonoids and glycoside derivatives [133]. The authors identified compounds not annotated in the GNPS platform (global natural products social molecular networking) by co-injection of standards in HPLC-DAD or via isolation and characterization of the metabolites using NMR spectroscopy. HPLC-DAD analysis was performed on the RP Zorbax Eclipse Plus column using water (0.1% acetic acid) with acetonitrile in gradient elution. Detection was done at λ = 352 nm. A molecular family of six flavonoid-3-O-glycosides in the molecular networking formed by the GNPS platform was annotated. They were avicularin, cacticin, isoquercitrin, quercitrin, rutin and a quercetin-3-O-pentoside cluster. The annotations with standard compounds by HPLC-DAD co-injection three flavonoid-3-O-pentosides and characterisation via 1D and 2D NMR was confirmed, except for identifying quercetin-3-O-robinobioside and kaempferol. Furthermore, three flavonoid-3-O-pentosides were isolated and characterized by 1D and 2D NMR spectroscopy. They were identified as reynoutrin, guaijaverin and avicularin [133].
A novel integrated approach consisting of LC-ESI-MS and tandem mass spectrometry (MSn), with NMR analysis, wwas carried out for isolation and structural identification of bioactive compounds from Calycotome spisosa (L.) Link leaves [134]. Separation was performed on a C18 reverse phase column using acetonitrile with methanol as a mobile phase in a gradient elution. The presence of two novel compounds, namely 5-hydroxy-1H-indole (an alkaloid) and D-pinitol (cyclitol), were found in the extracts of Calycotome spisosa (L.) Link. Besides, three well-known flavonoids were also identified. They were chrysin-7-O-(β-D-glucopyranoside), chrysin-7-O-β-D-(6″-acetyl)glucopyranoside), and apigenin-7-O-β-D-glycopyranoside. 5-hydroxy-1H-indole has shown a great significant antibacterial potential against Staphylococcus aureus, Pseudomonas aeruginosa and Salmonella abony, as well as an excellent antioxidant activity [134].
Lactucaxanthin has anti-diabetic properties. Jayapala et al. [135] examined lettuce (Lactuca sativa) and its bioactive component lactucaxanthin and lutein. TLC on silica gel using heptane-acetone (7:3, v/v) was used for preparative analysis. The RF were equal to 0.41 and 0.44 for lactucaxanthin and lutein, respectively. The spots of lactucaxanthin and lutein were scraped off and substances eluted. Eluates were analyzed by the HPLC-UV/Vis technique using the C18 column and three mobile phases (eluent A: acetonitrile, eluent B: methanol, eluent C: ethyl acetate containing 0.05% trimethylamine) in gradient elution with a flow rate equal to 0.525 mL/min. LC-MS was used to confirm the mass spectrum of purified lactucaxanthin. Concentrations (mg/100g) of lutein were: 0.43 ± 0.08 for iceberg lettuce, 0.50 ± 0.03 for Romania lettuce, and 3.63 ± 0.15 for green lettuce. Concentrations (mg/100g) of lactucaxanthin were: 0.36 ± 0.06 for iceberg lettuce, 0.42 ± 0.05 for Romania lettuce, and 3.05 ± 0.12 for green lettuce.
In another work, different compounds were analyzed in Ocimum basilicum [136]. The GC-FID with HP-Innowax FSC column, and the GC-MS with HP-Innowax FSC and HP-5MS column, with helium as carrier gas and a flow rate equal to 0.8 mL/min, were applied for identified essential oils. In total, 48 essential oils were identified in O. basilicum green flowers, and 29 essential oils were identified in O. basilicum dark purple flowers. Extraction and fractionation of lipids that occur in Ocimum basilicum were performed using column chromatography (CC) and TLC, with a silica gel as chromatographic medium. Hexane-diethyl ether (49:1, 4:1, 1:1, v/v) mobile phases were used for CC analysis, and hexane-acetone-acetic acid (70:30:1, v/v/v) for analysis total or neutral lipids, fatty acid methyl esters and nonsaponifiable substances, chloroform-acetone-ethanol-acetic acid-water (65:20:10:10:3, v/v/v/v) for lipids, chloroform-methanol-acetic acid-water (25:15:4:2, v/v,v,v) and chloroform-methanol-ammonia (65:25:4, v/v/v) for phospholipids for TLC analysis. The GC-FID with HP-5 column and helium as carrier gas at a flow rate equal 2.0 mL/min was used for the analysis of fatty acid methyl esters. The contents of neutral and polar lipids in two O. basilicum varieties in green basil were: neutral lipids 45.4%, glycolipids 50.7%, phospholipids 3.9%, non-saponifable substance of total lipids 12.0%, and fatty acids in flower lipids: 0.3% ÷ 64.0%. Content of neutral and polar lipids of two O. basilicum varieties in purple basil: neutral lipids 47.3%, glycolipids: 49.4, phospholipids 3.3%, non-saponifable substance of total lipids 11.8%, and fatty acids: in flower lipids: 0.3% ÷ 56.7%. Chiral analysis of α-pinene, β-pinene, sabinene, limonene, and linalool were performed using GC-MS with Lipodex G column and helium sa carrier gas with a flow rate equal to 5 mL/min. Contents in green basil were: (+)-linalool 0%, (+)-α-pinene 68%, (+)-β-pinene 63%, (+)-sabinene 85%, and (+)-limonene: 80%. In purple basil, only (-)-linalool (100%) was present.
The utility of off-line 2,2 -diphenyl-1-picrylhydrazyl (DPPH)-gas chromatography (GC)-mass spectrometry (MS) offline and the high-speed countercurrent chromatography (HSCCC) method for screening and identification of separation of antioxidants in essential oil of Curcuma wenyujin was performed by Y.H. Chen et C. Ling [137]. The essential oil was analyzed by means of the HP-5 5% phenyl methyl siloxane capillary column and GC chromatograph with a flame ionization detector (FID). The five compounds were described as antioxidants using DPPH-GC and were next identified with the GC-MS method. Eucalyptol, camphor, δ-elemene, β-elemene, and curzerene were successfully isolated by the HSCCC method with the use of the following solvents: n-hexane-acetonitrile-ethanol (5:3:2, v/v) and n-hexane-acetonitrile-acetone (4:3:1, v/v). Finally the antioxidant property of theme have been confirmed by DPPH scavenging assay.
The HPLC-SPE-NMR technique was applied for the analysis of furanosesquiterpenoids from bark exudates of the tree Commiphora swynnertonni Burrt, which is used by ethnic groups in Tanzania and Kenya to treat various diseases in humans and to kill ectoparasites infesting livestock [138]. Separation was carried out using a silica-based Apollo C18 column and mobile phase consisting in water with 0.1% formic acid and acetonitrile in gradient elution. Detection was done at λ = 246 nm. Four known furanosesquiterpenoids, namely 6-oxodendrolasin, (E)-6-oxoisodendrolasin, (Z)-6-oxoisodendrolasin, crassifolone and one new one, namely 7,8-dihydroisodendrolasin, were obtained, and were stated to constitute a main part of the exudate [138].
In a study performed by Patil et al. [139], an unknown impurity (at the level of 0.62%) was detected during routine analysis of terbutaline sulfate API, which is a drug used in patients with any broncho constructive or obstructive pulmonary disease. The preparative HPLC method was used for the isolation of impurities; accurate mass Q-TOF LC MS/MS and NMR (1H, 13C, DEPT) spectroscopy were used for its identification. The new impurity was identified as N-tert-Butyl-N-[2-(3,5-dihydroxyphenyl)-2-hydroxy-ethyl] acetamide on the basis of the spectroscopic data obtained, and further validated by the use of the HPLC method. It was stated that limit of detection and quantification were 0.01 and 0.02, respectively. Precision (%RSD), repeatability (intraday, %RSD) and intermediate precision (interday, %RSD) were 2.36, 2 and 3.18, respectively. Recoveries were in the range 80.43% ÷ 101.96% [139].
The identification and characterization of degradation products (DPs) is helpful in establishing drug degradation pathways, which are significant both from a quality and safety standpoint. In work conducted by Sahu et al. [140], degradation products of celiprolol hydrochloride, which has antihypertensive and antianginal properties, were characterized using hyphenated mass and NMR techniques. Stress studies were performed under acidic (0.1 N HCl), alkaline (0.1 N NaOH), neutral (H2O) hydrolysis, photolytic, oxidative (0.3, 3, 10, 30% H2O2 and 20% AIBN) and thermal (80 °C) conditions. It was found that the drug underwent degradation in hydrolytic, oxidative, photo-acidic and photo-basic conditions. A total of seven degradation products were formed, whose separation was efficiently achieved on a C18 HPLC column as a stationary phase and a mixture of acetonitrile and potassium dihydrogen phosphate in water (10 mM, pH = 3.0) as a mobile phase in gradient elution. Four degradation products were solely characterized based on liquid chromatography-high resolution mass spectrometry (LC-HR-MS) and liquid chromatography-multi-stage tandem mass spectrometry (LC-MSn). The proposed structures of degradation products (IV) and (V) were additionally substantiated from 1D and 2D NMR data, while the structure of the degradation product (VI) was confirmed using 1H LC-NMR analysis [140].
Combined techniques create enormous, previously unknown possibilities, and their main advantages are: extremely low limits of detection and limits of quantification, as well as very good accuracy and repeatability of determinations. As with all others, they are also characterized by specific limitations, such as: high price of the instruments and the requirements of perfect mastery of analytical methodologies and detailed knowledge of the instruments by their users. This, in turn, means that they are not widely available and are not routinely used in laboratories. These are expensive systems that are used for research rather than for routine analysis.
7. Conclusions
This review paper shows the significant role of both liquid and gas chromatographic techniques in the pharmaceutical analysis of different drugs with diverse chemical structures and wide spectrum pharmacological activities, including the antiviral activity required for COVID-19 disease treatment based on works published within the two last years. Liquid chromatography (LC) is the dominant analytical technique in pharmaceutical and phytochemical analysis because of its versatility, reproducibility, and extensive applications in research and quality control. Until today, HPLC has been an incredibly universal tool, especially when combined with different detectors, such as UV-Visible spectroscopy (UV-Vis), diode array detection (DAD(PDA)), mass spectrometry (MS), and fluorescence detector (FL), for numerous active ingredients (APIs) in different pharmaceutical formulations (i.e., tablets, capsules, drop suspension, injectable powders, creams) as well as for new codrugs without interferences from other excipients. Thanks to size-exclusion chromatography coupled to multi-angle light scattering (SEC-MALS), the quality control of biological pharmaceuticals such as various monoclonal antibodies used in cancer treatment is possible. Therefore, the current high performance liquid chromatography systems are powerful tools to estimate the quality and chemical stability of natural and synthetic drugs. TLC, in combination with densitometry, is a very efficient tool for the determination of biologically active substances present in different pharmaceutical dosage forms. In addition, thin-layer chromatography coupled to densitometry and mass spectrometry could be suitable for preliminary screening and determination of the biological activity (e.g., antioxidant properties, TLC-DPPH) of plant materials. Liquid chromatography (TLC, HPLC) in reversed phase system, in combination with other methods, e.g., chememometry, is suitable to evaluate the lipophilicity and pharmacological activity of newly developed bioactive molecules as new drug candidates such as the new anticancer agents.
Gas chromatography, coupled with a mass spectrometer or a dual mass spectrometer (GC-MS, GC-MS/MS), is of particular importance in the testing of any volatile substances, such as essential oils, which have antioxidant, antibacterial, antimicrobial and anticancer properties.
LC coupled to NMR and MS is particularly suitable for identifying and studying the structure of unknown components from plant extracts, as well as from degradation products (DPs).
Author Contributions
W.P., M.D. and A.P.-P., have collected the data, designed and written the manuscript, A.P.-P., W.P. and M.D., have revised the manuscript. All authors have read and agreed to the published version of the manuscript.
Funding
This research was funded by Medical University of Silesia grant number PCN-1-099/K/0/F. The APC was funded by MDPI.
Institutional Review Board Statement
Not applicable.
Informed Consent Statement
Not applicable.
Data Availability Statement
Not applicable.
Conflicts of Interest
The authors declare that there is no conflict of interest regarding the publication of this paper.
References
- Guaadaoui, A.; Benaicha, S.; Elmajdoub, N.; Bellaoui, M.; Hamal, A. What is a bioactive compound? A combined definition for a preliminary consensus. Int. J. Food Sci. Nutr. 2014, 3, 174–179. [Google Scholar] [CrossRef]
- Mustafa, G.; Arif, R.; Atta, A.; Sharif, S.; Jamil, A. Bioactive compounds from medicinal plants and their importance in drug discovery in Pakistan. Matrix Sci. Pharma 2017, 1, 17–26. [Google Scholar] [CrossRef]
- Aranaz, P.; Navarro-Herrera, D.; Zabala, M.; Romo-Hualde, A.; López-Yoldi, M.; Vizmanos, J.L.; Milagro, F.I.; González-Navarro, C.J. Phenolic compounds reduce the fat content in Caenorhabditis elegans by affecting lipogenesis, lipolysis, and different stress responses. Pharmaceuticals 2020, 13, 355. [Google Scholar] [CrossRef]
- Ovidi, E.; Masci, V.L.; Taddei, A.R.; Paolicelli, P.; Petralito, S.; Trilli, J.; Mastrogiovanni, F.; Tiezzi, A.; Casadei, M.A.; Giacomello, P.; et al. Chemical investigation and screening of anti-proliferative activity on human cell lines of pure and nano-formulated lavandin essential oil. Pharmaceuticals 2020, 13, 352. [Google Scholar] [CrossRef] [PubMed]
- Rodrigues, F.N.; Maria, M.O. Applications of recovered bioactive compounds in cosmetics and health care products. In Olive Mill Waste, Recent Advances for Sustainable Management; Academic Press: Cambridge, MA, USA, 2017; pp. 255–274. [Google Scholar] [CrossRef]
- Prajapati, P.; Agrawal, Y.K. Analysis and impurity identification in pharmaceuticals. Rev. Anal. Chem. 2014, 33, 123–133. [Google Scholar] [CrossRef]
- Folashade, K.O.; Omoregie, E.H.; Ochogu, A.P. Standarization of herbal medicines—A review. Int. J. Biodivers. Conserv. 2012, 4, 101–112. [Google Scholar] [CrossRef]
- Grinberg, N.; Carr, P.W. Advances in Chromatography; CRC Press: Boca Raton, FL, USA, 2020; Volume 57, ISBN 9780367456122. [Google Scholar]
- Issaq, H.J. A Century of Separation Science; CRC Press: Boca Raton, FL, USA, 2001; ISBN 9780367396510. [Google Scholar]
- Jork, H.; Funk, W.; Fischer, W.; Wimmer, H. Thin Layer Chromatography: Reagents and Detection Methods; VCH: Weinheim, Germany, 1994; ISBN 3-527-28205-X. [Google Scholar]
- El-Shoubashy, O.H.-E.; El Makarem Beltagy, Y.A.; ElSayed Issa, A.; El-Kafrawy, D.S. Comparative study of HPLC-DAD and HPTLC for the simultaneous determination of a new multitarget antidiabetic ternary mixture in combined tablets. J. Planar Chromatogr. Mod. TLC 2020, 33, 59–70. [Google Scholar] [CrossRef]
- Rode, V.P.; Tajne, M.R. Development of a specific and sensitive high-performance thin-layer chromatography assay method for the determination of linagliptin in tablet dosage form. J. Planar Chromatogr. Mod. TLC 2021, 34, 279–283. [Google Scholar] [CrossRef]
- Magdy, M.A.; Abdelfatah, R.M. Green validated HPTLC and HPLC methods for determination of ephedrine hydrochloride and naphazoline nitrate in the presence of methylparaben, in their pure forms and pharmaceutical formulation. J. Planar Chromatogr. Mod. TLC 2020, 33, 141–148. [Google Scholar] [CrossRef]
- Saad, M.N.; Essam, H.M.; Elzanfaly, E.S.; Amer, S.M. Economic chromatographic methods for simultaneous quantitation of some fluoroquinolones and corticosteroids present in different binary ophthalmic formulations. J. Liq. Chromatogr. Rel. Technol. 2020, 43, 271–281. [Google Scholar] [CrossRef]
- Bodiwala, K.B.; Rana, P.M.; Patel, N.T.; Sureja, D.K.; Gajjar, A.K. Quantitation of ofloxacin, tinidazole, terbinafine hydrochloride, and clobetasol propionate in topical cream formulation by chromatographic methods. J. Liq. Chromatogr. Rel. Technol. 2021, 44, 329–341. [Google Scholar] [CrossRef]
- Yehia, A.M.; Arafa, R.M.; Abbas, S.S.; Amer, S.M. Chromatographic separation of synthetic estrogen and progesterone in presence of natural congeners: Application to sliva and pharmaceutical samples. Chromatographia 2021, 84, 1–11. [Google Scholar] [CrossRef]
- Saraya, R.E.; Hameed, E.A.A. Eco-friendly micellar HPTLC technique for the simultaneous analysis of co-formulated antibiotic cefoperazone and sulbactam in pure form and vial pharmaceutical formualation. J. Planar Chromatogr. Mod. TLC 2021, 34, 121–129. [Google Scholar] [CrossRef]
- Eissa, M.S.; Abd El-Hadi, H.R.; Zaazaa, H.E.; Eltanany, B.M. Smart TLC-densitometric methods for determination of ophthalmic ternary mixture containing chloramphenicol in the presence of its synthetic precursor: Comparative ec-scaling for greenness assessment. J. Planar Chromatogr. Mod. TLC 2020, 33, 501–509. [Google Scholar] [CrossRef]
- Hubicka, U.; Padiasek, A.; Żuromska-Witek, B.; Szlósarczyk, M. Determination of vitamins K1, K2 MK-4, MK-7, MK-9 and D3 in pharmaceutical products and dietary supplements by TLC-densitometry. Processes 2020, 8, 870. [Google Scholar] [CrossRef]
- Gumułka, P.; Dąbrowska, M.; Starek, M. TLC-densitometric determination of five coxibes in pharmaceutical preparations. Processes 2020, 8, 620. [Google Scholar] [CrossRef]
- Sangani, M.B.; Patel, P.B.; Vaghela, J.P.; Paun, J.S. Standardization of Cardimap tablet using multiple markers. J. Planar Chromatogr. Mod. TLC 2021, 34, 31–38. [Google Scholar] [CrossRef]
- Foudah, A.I.; Alam, P.; Anwer, M.K.; Yusufoglu, H.S.; Abdel-Kader, M.S.; Shakeel, F. A Green RP-HPTLC-densitometry method for the determination of diosmin in pharmaceutical formulations. Processes 2020, 8, 817. [Google Scholar] [CrossRef]
- Ganguly, P.; Chowdhury, S.; Paul, N.; Haldar, S.; Singh, R.; Katiyar, C.K. Role of TLC to ensure manifestation of individual ingredients in herbal formulation. J. Planar Chromatogr. Mod. TLC 2020, 33, 281–291. [Google Scholar] [CrossRef]
- Alam, P.; Alam, P.; Sharaf-Eldin, M.A. Simultaneous identification of rutin, chlorogenic acid and gallic acid in Moringa oleifera by densitometric high-performance thin-layer chromatography method. J. Planar Chromatogr. Mod. TLC 2020, 33, 27–32. [Google Scholar] [CrossRef]
- Khalid, M.; Algarni, M.H.; Foudah, A.I.; Alam, P. A high-performance thin-layer chromatography method for the simultaneous determination of quercetin and gallic acid in Eclipta alba and Guiera senegalensis. J. Planar Chromatogr. Mod. TLC 2021, 34, 71–77. [Google Scholar] [CrossRef]
- Jiang, M.; Tian, S. Qualitative and quantitative analyses of gallic acid and orientin and orientin-2”-O-β-L-galactoside in Chinese medicine compound antibacterial gel by high-performance thin-layer chromatography. J. Planar Chromatogr. Mod. TLC 2021, 34, 307–313. [Google Scholar] [CrossRef]
- Satija, S.; Tambuwala, M.M.; Pabreja, K.; Bakshi, H.A.; Chellappan, D.K.; Aljabali, A.A.; Nammi, S.; Singh, T.G.; Dureja, H.; Gupta, G.; et al. Development of a novel HPTLC fingerprint method for simultaneous estimation of berberine and rutin in medicinal plants and their pharmaceutical preparations followed by its application in antioxidant assay. J. Planar Chromatogr. Mod. TLC 2020, 33, 313–319. [Google Scholar] [CrossRef]
- Basera, I.A.; Girme, A.; Bhatt, V.P.; Shah, M.B. A validated high-performance thin-layer chromatography method for the simultaneous estimation of berberine, berbamine, palmatine, magnoflorine and jatrorrhizine form Barberis Aristata. J. Planar Chromatogr. 2021, 34, 147–155. [Google Scholar] [CrossRef]
- Jain, P.K.; Jain, S.; Chak, P.; Swarnkar, S.K.; Sharma, S.; Paliwal, S. High-performance thin-layer chromatographic investigation of rutin in the leaves of Phoenix sylvestris in sequence with pharmacognostical and phytochemical evaluation. J. Planar Chromatogr. 2020, 33, 191–201. [Google Scholar] [CrossRef]
- Darwish, R.S.; Shawky, E.; Hammoda, H.M.; Harraz, F.M. A new thin-layer chromatography–direct bioautography assay for the qualitative and quantitative determination of peroxidase inhibitors in plant extracts. J. Planar Chromatogr. Mod. TLC 2020, 33, 3–9. [Google Scholar] [CrossRef]
- Ge, L.; Liu, F.; Hu, Y.; Zhou, X. Qualitative and quantitative analysis of arctiin and arctigenin in Arctium tomentosum Mill. by high-performance thin-layer chromatography. J. Planar Chromatogr. Mod. TLC 2020, 33, 19–26. [Google Scholar] [CrossRef]
- Noman, O.M.; Nasr, F.A.; Mothana, R.A.; Alqahtani, A.S.; Qamar, W.; Al-Mishari, A.A.; Al-Rehaily, A.J.; Siddiqui, N.A.; Alam, P.; Almarfadi, O.M. Isolation, characterization, and HPTLC-quantification of compounds with anticancer potential from Loranthus Acaciae Zucc. Separations 2020, 7, 43. [Google Scholar] [CrossRef]
- Basera, I.A.; Shah, M.B. A validated high-performance thin-layer chromatography method for quantification of bavachin, bakuchiol, and psoralen from Psoralea corylifolia seeds. J. Planar Chromatogr. Mod. TLC 2020, 33, 293–300. [Google Scholar] [CrossRef]
- Zhang, K.; Wu, W.; Tian, S. Comparative study on the determination of ethyl p-methoxycinnamate in Kaempferia galanga rhizome by HPTLCS and HPLC. J. Planar Chromatogr. Mod. TLC 2020, 33, 51–57. [Google Scholar] [CrossRef]
- Ahamad, J.; Kaskoos, R.A.; Amin, S.; Mir, S.R. Quantitative analysis of gymnemagenin in Gymnema sylvestre leaves and in herbal formulation by a validated HPTLC method. J. BAPN 2020, 10, 211–219. [Google Scholar] [CrossRef]
- Patel, U.; Girme, A.; Patel, K.; Ghule, C.; Hingorani, L.; Gandhi, T. A validated HPTLC method for quantification of cordifolioside A, 20-β-hydroxyecdysone and columbin with HPTLC-ESI-MS/MS characterization in stems of Tinospora cordifolia. J. Planar Chromatogr. Mod. TLC 2021, 34, 217–228. [Google Scholar] [CrossRef]
- Wu, W.; Wang, L.; Tian, S. Simultaneous qualitative and quantitative analyses of ursolic acid and oleanolic in Punica granatum L. (Pomegranate) flowers by high-performance thin layer chromatography. J. Planar Chromatogr. Mod. TLC 2021, 34, 165–172. [Google Scholar] [CrossRef]
- Mehta, S.; Sharma, A.K.; Singh, R.K. Development and validation of HPTLC method for simultaneous estimation of bioactive components in combined extracts of three hepatoprotective plants. J. Liq. Chromatogr. Rel. Technol. 2021, 44, 375–381. [Google Scholar] [CrossRef]
- Jampilek, J.; Dolowy, M.; Pyka-Pajak, A. Estimating limits of detection and quantification of ibuprofen by TLC-densitometry at different chromatographic conditions. Processes 2020, 8, 919. [Google Scholar] [CrossRef]
- Parys, W.; Pyka-Pająk, A.; Dołowy, M. A cost-effective and sensitive TLC-densitometric identification of meloxicam. Acta Pharm. 2021, 71, 143–152. [Google Scholar] [CrossRef]
- Megawati, D.S.; Fasya, A.G.; Pratiwi, R.A.; Maghfiroh, N. Pharmacology potency of thin layer chromatography steroid isolates of Chlorella sp. chloroform fraction. IOP Conf. Ser. Earth Environ. Sci. 2020, 456, 012012. [Google Scholar] [CrossRef]
- Claude, E.; Tower, M.; Lafont, R.; Wilson, I.D.; Plumb, R.S. High Performance Thin-Layer Chromatography of plant ecdysteroids coupled with Desorption Electrospray Ionisation-Ion Mobility-Time of Flight High Resolution Mass Spectrometry (HPTLC/DESI/IM/ToFMS). Chromatographia 2020, 83, 1029–1035. [Google Scholar] [CrossRef]
- Jia, Y.; Chandan, V.; Akache, B.; Qian, H.; Jakubek, Z.J.; Vinogradov, E.; Dudani, R.; Harrison, B.A.; Jamshidi, M.P.; Stark, F.C.; et al. Assessment of stability of sulphated lactosyl archaeol archaeosomes for use as a vaccine adjuvant. J. Liposome Res. 2021, 31, 237–245. [Google Scholar] [CrossRef]
- Giri, S.; Giri, U.; Subedi, K.; Magar, K.T.; Pan, S.; Joshi, K.R. Thin layer chromatography (TLC) based chemical profiling and antioxidant activity of selected Nepalese medicinal plants. J. Health Allied Sci. 2020, 10, 15–22. [Google Scholar] [CrossRef]
- Hawrył, A.; Hawrył, M.; Litwińczuk, W.; Bogucka-Kocka, A. Thin-layer chromatographic fingerprint of selected Paulownia species with chemometrics and antioxidant activity. J. Liq. Chromatogr. Relat. Technol. 2020, 43, 367–374. [Google Scholar] [CrossRef]
- Nugraha, A.S.; Permatasari, A.E.N.; Kadarwenny, C.P.; Pratoko, D.W.; Triatmoko, B.; Rosyidi, V.A.; Norcahyanti, I.; Dewi, I.P.; Dianasari, D.; Sary, I.P.; et al. Phytochemical screening and the antimicrobial and antioxidant activities of medicinal plants of Meru Betiri National Park—Indonesia. J. Herbs Spices Med. Plants 2020, 26, 303–314. [Google Scholar] [CrossRef]
- Belhi, Z.; Boulenouar, N.; Cheriti, A.; Marouf, A. Antifungal and anti-cellulases activity of Limoniastrum feei extracts to promote Bayoud disease treatment using bioautography. Cogent Food Agric. 2020, 6, 1726083. [Google Scholar] [CrossRef]
- Naik, V.A.; Sellappan, K. Chromatographic fingerprint of essential oils in plant organs of Annona muricata L. (Annonaceae) using HPTLC. Anal. Chem. Lett. 2020, 10, 214–226. [Google Scholar] [CrossRef]
- Nikolaichuk, H.; Studziński, M.; Choma, I.M. Effect directed detection of Rhodiola rosea L. root and rhizome extract. J. Liq. Chromatogr. Rel. Technol. 2020, 43, 361–366. [Google Scholar] [CrossRef]
- Liu, F.; Wang, M.; Li, X. Simultaneous qualitative characterization of four herbs in Weikangling capsules by a validated high-performance thin-layer chromatography method. J. Planar Chromatogr. Mod. TLC 2020, 33, 449–455. [Google Scholar] [CrossRef]
- Tang, T.; Liu, H.; Deng, L.; Qiu, X.; Liang, J. A pattern recognition method on smartphones for planar chromatography and verification on chromatograms of four herbal medicines from citrus fruits. J. Liq. Chromatogr. Rel. Technol. 2021, 44. [Google Scholar] [CrossRef]
- Corradini, D. Handbook of HPLC, 2nd ed.; CRC Press: Boca Raton, FL, USA, 2020. [Google Scholar]
- Fanali, S.; Haddad, P.R.; Poole, C.; Riekkola, M.L. Liquid Chromatography Fundamentals and Instrumentation, 2nd ed.; Elsevier-Science: Saint Louis, MO, USA, 2017. [Google Scholar]
- Waksmundzka-Hajnos, M.; Sherma, J. High Performance Liquid Chromatography in Phytochemical Analysis; CRC Press: Boca Raton, FL, USA, 2010. [Google Scholar]
- Kumari, K.S.; Bandhakavi, S. Development and validation of stability-indicating RP-HPLC method for the simultaneous determination of ertugliflozin pidolate and metformin hydrochloride in bulk and tablets. Futur. J. Pharm. Sci. 2020, 6, 66. [Google Scholar] [CrossRef]
- Gumieniczek, A.; Berecka-Rycerz, A.; Fornal, E.; Żyżyńska-Granica, B.; Granica, S. Comprehensive insight into chemical stability of important antidiabetic drug Vildagliptin using chromatography (LC-UV and UHPLC-DAD-MS) and spectroscopy (Mid-IR and NIR with PCA). Molecules 2021, 26, 5632. [Google Scholar] [CrossRef] [PubMed]
- Shamshad, H.; Mirza, A.Z. Application of RP-HPLC method for the simultaneous determination of cetirizine in the presence of quinolones. Futur. J. Pharm. Sci. 2021, 7, 117. [Google Scholar] [CrossRef]
- Anwar, S.; Mohd, P.; Khan, A.A. Stability indicating RP-HPLC method for estimation of two synthetic antibiotics, amoxicillin and enrofloxacin, simultaneously. IJPSR 2020, 11, 204–211. [Google Scholar] [CrossRef]
- Almalki, A.H.; Hussein, E.A.; Naguib, I.A.; Abdelaleem, E.A.; Zaazaa, H.E.; Abdallah, F.F. Development and validation of ecofriendly HPLC-MS method for quantitative assay of amoxicillin, dicloxacillin, and their official impurity in pure and dosage forms. J. Anal. Methods Chem. 2021, 9, 5570938. [Google Scholar] [CrossRef]
- Tegegn, B.; Chandravanshi, B.S.; Zewge, E.; Pillay, L.; Chimuka, L. Development and validation of a single HPLC method for the determination of thirteen pharmaceuticals in bulk and tablet dosage form. Bull. Chem. Soc. Ethiop. 2021, 35, 17–31. [Google Scholar] [CrossRef]
- Nessa, F.; Al Zoubi, H.; Khan, G.A. Pharmaceutical equivalence study of amoxicillin/clavulanic acid salt tablets commercially available in UAE pharmaceutical market. Pharm. Sci. Asia. 2020, 47, 262–273. [Google Scholar] [CrossRef]
- Salman, A.T. RP-HPLC Estimation of ceftriaxone sodium in pharmaceuticals. Egypt. J. Chem. 2021, 64, 4901–4906. [Google Scholar] [CrossRef]
- Finsgar, M.; Perva-Uzunalic, A.; Behr, H.; Ledinek, N.; Knez, Z.; Novak, Z. An improved reversed-phase high-performance liquid chromatography method for the analysis of related substances of prednisolone in active ingredient. ACS Omega 2020, 5, 7987–8000. [Google Scholar] [CrossRef] [PubMed] [Green Version]
- Nazir, A.; Masih, M.; Iqbal, M. Formulation, optimization, qualitative and quantitative analysis of new dosage form of corticosteroid. Futur J. Pharm. Sci. 2021, 7, 208. [Google Scholar] [CrossRef]
- Camposa, E.R.; Eller, S.; Birk, L.; Coimbra, M.A.; Macedo, S.M.D.; Yonaminec, M.; Josias, O.M.; Yonamine, M.; Merib, J.O.; Oliveiraa, T.F. Analysis of seized stanozolol formulations in South Brazil by liquid chromatography coupled to quadrupole time-of-flight-mass spectrometry. Drug Anal. Res. 2020, 4, 58–63. [Google Scholar] [CrossRef]
- Iqbal, D.N.; Ashraf, A.; Iqbal, M.; Nazir, A. Analytical method development and validation of hydrocortisone and clotrimazole in topical dosage form using RP-HPLC. Fut. J. Pharm. Sci. 2020, 6, 49. [Google Scholar] [CrossRef]
- Tabaza, Y.Z.; Mansi, K.M.; Azzam, H.A.; Al-Mamoori, F.F.; Al-Samydai, A.M.; Aburjai, T.A. Determination of dehydroepiandrosterone in dietary supplements by reversed-phase HPLC. Trop. J. Pharm. Res. 2021, 20, 383–387. [Google Scholar] [CrossRef]
- Amjad, M.; Hussain, S. Development and validation of HPLC method for the simultaneous determination of dexamethasone sodium phosphate and prednisolone acetate in injectable veterinary suspension. PCJHBA 2020, 7, 48–65. [Google Scholar]
- Assali, M.; Abualhasan, M.; Zohud, N.; Ghazal, N. RP-HPLC method development and validation of synthesized codrug in combination with indomethacin, paracetamol, and famotidine. Int. J. Anal. Chem. 2020, 2020, 1894907. [Google Scholar] [CrossRef]
- Al-Khateeb, A.L.; Dahas, F.H. Green method development approach of superheated water liquid chromatography for separation and trace determination of non-steroidal anti-inflammatory compounds in pharmaceutical and water samples and their extraction. Arab. J. Chem. 2021, 14, 103226. [Google Scholar] [CrossRef]
- Hassan, M.M.; Nam, S.W. High-performance liquid chromatography for determining a mixture of nonsteroidal anti-inflammatory drugs. Electron. Mater. Lett. 2021, 17, 414–420. [Google Scholar] [CrossRef]
- Hassan, M.M.; Nam, S. Isocratic reverse-phase HPLC method for determination of aspirin, paracetamol, and naproxen. Preprints 2021, 2021070229. [Google Scholar] [CrossRef]
- Hamdy, M.M.A.; Abdel Moneim, M.M.; Kamal, M.F. Accelerated stability study of the ester prodrug remdesivir: Recently FDA-approved Covid-19 antiviral using reversed-phase-HPLC with fluorimetric and diode array detection. Biomed. Chromatogr. 2021, 35, e5212. [Google Scholar] [CrossRef]
- Bulduk, I.; Akbel, E. A comparative study of HPLC and UV spectrophotometric methods for remdesivir quantification in pharmaceutical formulations. J. Taibah. Univ. Sci. 2021, 15, 507–513. [Google Scholar] [CrossRef]
- Bulduk, I. HPLC-UV method for quantification of favipiravir in pharmaceutical formulations. Acta Chromatogr. 2021, 33, 209–215. [Google Scholar] [CrossRef]
- Xiong, X.; Wang, K.; Tang, T. Development of a chiral HPLC method for the separation and quantification of hydroxychloroquine enantiomers. Sci. Rep. 2021, 11, 8017. [Google Scholar] [CrossRef]
- Parab, M.; Shirsat, V.A.; Kodgule, Y.M.; Kodgule, M. A RP-HPLC method for the analysis of neostigmine methylsulfate and process-related impurities, forced degradation studies, in the injection formulation. Int. J. Anal. Chem. 2021, 11, 2021:5570173. [Google Scholar] [CrossRef]
- Gumieniczek, A.; Kozak, I.; Żmudzki, P.; Hubicka, U. LC-UV and UPLC-MS/MS Methods for analytical study on degradation of three antihistaminic drugs, ketotifen, epinastine and emedastine: Percentage degradation, degradation kinetics and degradation pathways at different pH. Processes 2021, 9, 64. [Google Scholar] [CrossRef]
- Subramanian, G.; Narenderan, S.T.; Meyyanathan, S.N. Stability indicating RP-HPLC method for the simultaneous estimation of quercetin and rutin in bulk drug. Int. J. Res. Pharm. Sci. 2020, 11, 1254–1258. [Google Scholar] [CrossRef] [Green Version]
- Moratalla-López, N.; Sánchez, A.M.; Lorenzo, C.; López-Córcoles, H.; Alonso, G.L. Quality determination of Crocus sativus L. flower by high-performance liquid chromatography. J. Food Compos. Anal. 2020, 93, 103613. [Google Scholar] [CrossRef]
- Kamal, Y.T.; Ahmad, S.; Mahadevan, N.; Alam, P.; Salam, S.; Asiri, Y.I.; Muhsinah, A.B.; Alsayari, A. Separation and quantification of nine bioactive compounds in traditional Unani formulations by High Performance Liquid Chromatography–Photodiode Array Detector. Acta Chromatogr. 2021, 33, 3–10. [Google Scholar] [CrossRef]
- Khursheed, R.; Singh, S.K.; Kapoor, B.; Gulati, M.; Wadhwa, S.; Gupta, S.; Prasher, P.; Kumar, D.; Dua, K.; Kumar, L.S.M.; et al. Development and validation of RP-HPLC method for simultaneous determination of curcumin and quercetin in extracts, marketed formulations, and Self-Nanoemulsifying Drug Delivery Syste. Re. GEN Open. 2021, 1, 43–52. [Google Scholar] [CrossRef]
- Al-Jaber, H.I.; Shakya, A.K.; Elagbar, Z.A. HPLC profiling of selected phenolic acids and flavonoids in Salvia eigii, Salvia hierosolymitana and Salvia viridis growing wild in Jordan and their in vitro antioxidant activity. Peer J. 2020, 8, e9769. [Google Scholar] [CrossRef]
- Zvikas, V.; Urbanaviciute, I.; Bernotiene, R.; Kulakauskiene, D.; Morkunaite, U.; Balion, Z.; Majiene, D.; Liaudanskas, M.; Viskelis, P.; Jekabsone, A.; et al. Investigation of phenolic composition and anticancer properties of ethanolic extracts of japanese quince leaves. Foods 2021, 10, 18. [Google Scholar] [CrossRef] [PubMed]
- Rehan, F.; Ahemad, N.; Islam, R.A.; Gupta, M.; Gan, S.H.; Chowdhury, E.H. Optimization and formulation of nanostructured and self-assembled caseinate micelles for enhanced cytotoxic effects of paclitaxel on breast cancer cells. Pharmaceutics 2020, 12, 984. [Google Scholar] [CrossRef] [PubMed]
- Tuzimski, T.; Petruczynik, A. Application of HPLC-DAD for In vitro investigation of acetylcholinesterase inhibition activity of selected isoquinoline alkaloids from Sanguinaria canadensis extracts. Molecules 2021, 26, 230. [Google Scholar] [CrossRef]
- Zhu, H.; Li, S.; Wang, M.; Wan, D.; Liu, B.; Shaopeng, Z.; Ran, X. Simultaneous determination of four bioactive alkaloid Components in the stems of three Mahonia plant species by HPLC. Int. J. Pharm. Chem. 2021, 7, 45–51. [Google Scholar] [CrossRef]
- LI, Q.Y.; Wu, B.; Gong, X.; Wang, W.S.; Zhu, J.X.; Zhang, C.H.; Zhang, N. Qualitative and quantitative analyses of aconite alkaloids in Aconiti kusnezoffii Radix, and NO inhibitory activity evaluation of the alkaloid extracts. Food Sci. Technol. 2021. [Google Scholar] [CrossRef]
- Semiz, A.; Duman, O.; Tunç, S. Development of a reversed phase-high performance liquid chromatographic method for the analysis of glucosamine sulphate in dietary supplement tablets. J. Food Compos. Anal. 2020, 93, 103607. [Google Scholar] [CrossRef]
- Patel, N.D.; Kanaki, N.S. Fingerprint analysis of Shankhpushpi for species discrimination by HPLC coupled with chemometric method. J. Liq. Chromatogr. Rel. Technol. 2020, 43, 455–463. [Google Scholar] [CrossRef]
- Jia, D.; Cai, H.; Ke, Y. Simultaneous determination of the five constituents in Maiwei Dihuang Pills by the HPLC-DAD method. Evid. Based Complement. Alternat. Med. 2021, 2021, 2536558. [Google Scholar] [CrossRef] [PubMed]
- Some, D.; Amartely, H.; Tsadok, A.; Lebendiker, M. Characterization of proteins by size-exclusion chromatography coupled to multi-angle light scattering (SEC-MALS). J. Vis. Exp. 2019, 148, e59615. [Google Scholar] [CrossRef] [Green Version]
- Fekete, S.; Beck, A.; Veuthey, J.L.; Guillarme, D. Theory and practice of size exclusion chromatography for the analysis of protein aggregates. J. Pharm. Biomed. Anal. 2014, 101, 43–55. [Google Scholar] [CrossRef] [PubMed]
- Fu, Z.-H.; Wu, G.; Li, M.; Cui, Y.-F.; Wang, L. Quality study of recombinant anti-interleukin-23 monoclonal antibodies. Chin. J. New Drugs 2021, 30, 1738–1745. [Google Scholar]
- Farràs, M.; Miret, J.; Camps, M.; Román, R.; Martínez, Ó.; Pujol, X.; Erb, S.; Ehkirch, A.; Cianferani, S.; Casablancas, A.; et al. Homogeneous antibody-drug conjugates: DAR 2 anti-HER2 obtained by conjugation on isolated light chain followed by mAb assembly. MABS 2020, 12, 1702262. [Google Scholar] [CrossRef] [Green Version]
- Farràs, M.; Román, R.; Camps, M.; Miret, J.; Martínez, Ó.; Pujol, X.; Casablancas, A.; Cairó, J.J. Heavy chain dimers stabilized by disulfide bonds are required to promote in vitro assembly of trastuzumab. BMC Mol. Cell Biol. 2020, 21, 2. [Google Scholar] [CrossRef] [Green Version]
- Gagnon, P.; Goricar, B.; Mencin, N.; Zvanut, T.; Peljhan, S.; Leskovec, M.; Strancar, A. Multiple-monitor HPLC assays for rapid process development, In-process monitoring, and validation of AAV production and purification. Pharmaceutics 2021, 13, 113. [Google Scholar] [CrossRef] [PubMed]
- Li, Y.; Duan, J.; Xia, H.; Shu, B.; Duan, W. Macromolecular substances as a dangerous factor in traditional Chinese medicine injections were determined by size-exclusive chromatography. Toxicol. Res. 2020, 21, 323–330. [Google Scholar] [CrossRef]
- Morak-Młodawska, B.; Pluta, K.; Jeleń, M. Evaluation of the lipophilicity of new anticancer 1,2,3-triazole-dipyridothiazine hybrids using RP TLC and different computational methods. Processes 2020, 8, 858. [Google Scholar] [CrossRef]
- Dobričić, V.; Turković, N.; Ivković, B.; Csuvik, O.; Vujić, Z. Evaluation of the lipophilicity of chalcones by RP-TLC and computational methods. J. Planar Chromatogr. 2020, 33, 245–253. [Google Scholar] [CrossRef]
- Tot, K.; Lazić, A.; Djaković-Sekulić, T. A comparative study of chromatographic lipophilicity and bioactivity parameters of selected spirohydantoins. J. Liq. Chromatogr. Relat. Technol. 2020, 43, 925–933. [Google Scholar] [CrossRef]
- Dołowy, M.; Jampilek, J.; Bober-Majnusz, K. A comparative study of the lipophilicity of metformin and phenformin. Molecules 2021, 26, 6613. [Google Scholar] [CrossRef] [PubMed]
- Obradović, D.; Arsić, A.; Čarapić, M.; Agbaba, D. Modeling of chromatographic retention of the selected antiarrhythmics and structurally related compounds in the hydrophilic interactions under the TLC and HPLC conditions. J. Liq. Chromatogr. Relat. Technol. 2020, 43, 328–335. [Google Scholar] [CrossRef]
- Gackowski, M.; Koba, M.; Pluskota, R.; Daghir-Wojtkowiak, E.; Szatkowska-Wandas, P. Pharmacological classification of anticancer drugs applying chromatographic retention data and chemometric analysis. Chem. Pap. 2021, 75, 265–278. [Google Scholar] [CrossRef]
- Hakiem, A.F.A.; Kamal, A.M.; Ali, A.M.B.H.; Salem, R.A.; Aboraia, A.S. Predictive retention study of β-blockers in different chromatographic systems as potential tool for lipophilicity screenung based on QSRR approach. J. Liq. Chromatogr. Relat. Technol. 2021, 44, 12–24. [Google Scholar] [CrossRef]
- Kupriyanova, O.V.; Milyukov, V.A.; Shevyrin, V.A.; Sadykova, R.G.; Mustafin, R.I. Development and validation of a gas chromatographic method for quantitative determination of the active ingredient in phenyl salicylate drug substance. Pharm. Chem. J. 2020, 54, 73–78. [Google Scholar] [CrossRef]
- Yang, F.; Duan, X.; Wang, Z.; Dong, Y. A gas chromatography flame ionization detector method for rapid simultaneous separation and determination of six active ingredients of anticold drug. Curr. Pharm. Anal. 2022, 18, 71–81. [Google Scholar] [CrossRef]
- Nomura, S.; Ito, Y.; Takegami, S.; Kitade, T. Development of trace analysis for alkyl methanesulfonates in the delgocitinib drug substance using GC-FID and liquid-liquid extraction with ionic liquid. Open Chem. 2020, 18, 1020–1029. [Google Scholar] [CrossRef]
- Ahirrao, V.K.; Jadhav, R.A.; Rane, V.P.; Bhamare, H.R.; Yeole, R.D. Time-dependent selected reaction monitoring-based GC-MS/MS method for estimation of genotoxic impurities in new antibacterial agent: Alalevonadifloxacin mesylate. J. Anal. Sci. Technol. 2020, 11, 22. [Google Scholar] [CrossRef]
- Vardhani Devi, D.P.V.; Narayanarao, K.M.V.; Shyamala, P.; Krishna, R.M.; Prasad, K.S. Determination of 1,2-dibromoethane in tramadol hydrochloride drug substances by head space gas chromatography linked with mass spectrometry. Int. J. Pharm. Res. 2020, 12, 949–954. [Google Scholar] [CrossRef]
- Ramakrishna, R.H.; Pratap, S.R.; Chandrasekhar, N.; Shamshuddin, S.Z.M. A simple gas chromatography method for the quantitative determination of related impurity (1,4-butanediol) in busulfan drug. Rasāyan J. Chem. 2021, 14, 914–919. [Google Scholar] [CrossRef]
- Liu, J.; Xie, B.; Mai, B.; Cai, Q.; He, R.; Guo, D.; Zhang, Z.; Fan, J.; Zhang, W. Development of a sensitive and stable GC-MS/MS method for simultaneous determination of four N-nitrosamine genotoxic impurities in sartan substances. J. Anal. Sci. Technol. 2021, 12, 3. [Google Scholar] [CrossRef]
- Almeida, R.S.; Freitas, P.R.; Araújo, A.C.J.; Alencar Menezes, I.R.; Santos, E.L.; Tintino, S.R.; Moura, T.F.; Filho, J.R.; Ferreira, V.A.; Silva, A.C.A.; et al. GC-MS profile and enhancement of antibiotic activity by the essential oil of Ocotea odorífera and safrole: Inhibition of Staphylococcus aureus efflux pumps. Antibiotics 2020, 9, 247. [Google Scholar] [CrossRef]
- Zakaria Nabti, L.; Sahli, F.; Laouar, H.; Olowo-okere, A.; Nkuimi Wandjou, J.G.; Maggi, F. Chemical composition and antibacterial activity of essential oils from the algerian endemic Origanum glandulosum Desf. against multidrug-resistant uropathogenic E. coli Isolates. Antibiotics 2020, 9, 29. [Google Scholar] [CrossRef] [Green Version]
- Boukhatem, M.N.; Sudha, T.; Darwish, N.H.E.; Chader, H.; Belkadi, A.; Rajabi, M.; Houche, A.; Benkebailli, F.; Oudjida, F.; Mousa, S.A. A new eucalyptol-rich lavender (Lavandula stoechas L.) essential oil: Emerging potential for therapy against inflammation and cancer. Molecules 2020, 25, 3671. [Google Scholar] [CrossRef]
- Ul-Khazir, Z.; Yatoo, G.N.; Wani, H.; Shah, S.A.; Zargar, M.I.; Rather, M.A.; Banday, J.A. Gas chromatographic-mass spectrometric analysis, antibacterial, antioxidant and antiproliferative activities of the needle essential oil of Abies pindrow growing wild in Kashmir, India. Microb. Pathog. 2021, 158, 105013. [Google Scholar] [CrossRef] [PubMed]
- Moller, A.C.; Parra, C.; Said, B.; Werner, E.; Flores, S.; Villena, J.; Russo, A.; Caro, N.; Montenegro, I.; Madrid, A. Antioxidant and anti-proliferative activity of essential oil and main components from leaves of Aloysia polystachya harvested in central Chile. Molecules 2021, 26, 131. [Google Scholar] [CrossRef]
- Fayed, E.M.; Abd-Elgawad, A.M.; Elshamy, A.I.; El-Halawany, E.S.F.; El-Amier, Y.A. Essential oil of Deverra tortuosa aerial parts: Detailed chemical profile, allelopathic, antimicrobial, and antioxidant activities. Chem. Biodivers. 2021, 18, e2000914. [Google Scholar] [CrossRef] [PubMed]
- Zhou, L.; Li, J.; Kong, Q.; Luo, S.; Wang, J.; Feng, S.; Yuan, M.; Chen, T.; Yuan, S.; Ding, C. Chemical composition, antioxidant, antimicrobial, and phytotoxic potential of Eucalyptus grandis × E. urophylla leaves essential oils. Molecules 2021, 26, 1450. [Google Scholar] [CrossRef]
- Teles, A.M.; Silva-Silva, J.V.; Fernandes, J.M.P.; Abreu-Silva, A.L.; Calabrese, K.S.; Filho, N.E.M.; Mouchrek, A.N.; Almeida-Souza, F. GC-MS characterization of antibacterial, antioxidant, and antitrypanosomal activity of Syzygium aromaticum essential oil and eugenol. Evid. Based Complementary Altern. Med. 2021, 2021, 6663255. [Google Scholar] [CrossRef] [PubMed]
- Iwueke, A.V.; Ejekwumadu, N.J.; Chukwu, E.C.; Nwodu, J.A.; Akalonu, C. Nutritional composition and GC-MS phytochemical analysis of thaumatococcus daniellii leaves. Eur. J. Nutr. Food Saf. 2020, 12, 81–86. [Google Scholar] [CrossRef]
- Slobodianiuk, L.; Budniak, L.; Marchyshyn, S.; Kostyshyn, L.; Zakharchuk, O. Analysis of carbohydrates in Saponaria officinalis L. using GC/MS method. Pharmacia 2021, 68, 339–345. [Google Scholar] [CrossRef]
- Savych, A.; Marchyshyn, S.; Millan, I. Determination of carbohydrates in the herbal antidiabetic mixtures by GC-MS. Acta. Pharm. 2021, 71, 429–443. [Google Scholar] [CrossRef]
- Savych, A.; Marchyshyn, S.; Kozyr, H.; Yarema, N. Determination of inulin in the herbal mixtures by GC-MS method. Pharmacia 2021, 68, 181–187. [Google Scholar] [CrossRef]
- Savych, A.; Basaraba, R.; Muzyka, N.; Ilashchuk, P. Analysis of fatty acid composition content in the plant components of antidiabetic herbal mixture by GC-MS. Pharmacia 2021, 68, 433–439. [Google Scholar] [CrossRef]
- Mykhailenko, O.; Gudžinskas, Z.; Romanova, S.; Orlova, T.; Kozyra, S.; Harna, S.; Volochai, V. The comparative analysis of carboxylic acid composition of four Iris species from Ukraine. Chem. Biodivers. 2021, 18, e2000969. [Google Scholar] [CrossRef]
- Savych, A.; Marchyshyn, S.; Harnyk, M.; Kudria, V.; Ocheretniuk, A. Determination of amino acids content in two samples of the plant mixtures by GC-MS. Pharmacia 2021, 68, 283–289. [Google Scholar] [CrossRef]
- Reddy, K.; Gurupadayya, B.M.; Choezom, L.; Vikram, H. Determination of phytocomponents and validation of squalene in ethanolic extract of Clerodendrum serratum Linn. roots—Using gas chromatography-mass spectroscopy and GC-FID technique. J. Anal. Sci. Technol. 2021, 12, 31. [Google Scholar] [CrossRef]
- Izuegbuna, O.; Otunola, G.A.; Bradley, G. GC-MS profiling and antineoplastic activity of Pelargonium inquinans ait leaves on acute leukaemia cel lines U937 and Jurkat. Nutr. Cancer 2021, 3, 1–23. [Google Scholar] [CrossRef]
- Sianipar, N.F.; Assidqi, K.; Hadisaputri, Y.E.; Salam, S.; Tarigan, R.; Purnamaningsih, R. Determination of bioactive compounds of superior mutant rodent tuber (Typhoniumflagelliforme) in various fractions using GC-MS. Earth Environ. Sci. 2021, 794, 012144. [Google Scholar] [CrossRef]
- Sulborska, A.; Konarska, A.; Matysik-Woźniak, A.; Dmitruk, M.; Weryszko-Chmielewska, E.; Skalska-Kamińska, A.; Rejdak, R. Phenolic constituents of Lamium album L. subsp. album flowers: Anatomical, histochemical, and phytochemical study. Molecules 2020, 25, 6025. [Google Scholar]
- Zekič, J.; Vovk, I.; Glavnik, V. Extraction and analyses of flavonoids and phenolic acids from Canadian Goldenrod and Giant Goldenrod. Forests 2021, 12, 40. [Google Scholar] [CrossRef]
- Santos, A.L.; Soares, M.G.; de Medeiros, L.S.; Ferreira, M.J.P.; Sartorelli, P. Identification of flavonoid-3-O-glycosides from leaves of Casearia arborea (Salicaceae) by UHPLC-DAD-ESI-HRMS/MS combined with molecular networking and NMR. Phytochem. Anal. 2021, 32, 1–8. [Google Scholar] [CrossRef]
- Cherfia, R.; Zaiter, A.; Akkal, S.; Chaimbault, P.; Abdelwahab, A.B.; Kirsch, G.; Chaouche, N.K. New approach in the characterization of bioactive compounds isolated from Calycotome spinose (L.) Link leaves by the use of negative electrospray ionization LITMSn, LC-ESI-MS/MS, as well as NMR analysis. Bioorg. Chem. 2020, 96, 103535. [Google Scholar] [CrossRef] [PubMed]
- Jayapala, N.; Elavarasan, A.R.; Chaudhari, S.R.; Vallikannan, B. Cytotoxicity and 3T3-L1 cell uptake of lactucaxanthin purified and characterized by LC-MS and NMR from lettuce (Lactuca sativa). J. Liq. Chromatogr. Rel. Technol. 2020, 43, 233–246. [Google Scholar] [CrossRef]
- Bobakulov, K.; Ozek, G.; Ozek, T.; Asilbekova, D.T.; Abdullaev, N.D.; Sagdullaev, S.S.; Başer, K.H.C. Essential oils and lipids from the flowers of two varieties of Ocimum basilicum L. cultivated in Uzbekistan. J. Essent. Oil Res. 2020, 32, 323–330. [Google Scholar] [CrossRef]
- Wang, X.; Zuo, G.-L.; Wang, C.Y.; Kim, H.Y.; Lim, S.S.; Tong, S.Q. An off-line DPPH-GC-MS coupling countercurrent chromatography method for screening, identification, and separation of antioxidant compounds in essential oil. Antioxidants 2020, 9, 702. [Google Scholar] [CrossRef]
- Kalala, W.M.; Foubert, K.; Pieters, L.; Maregesi, S. HPLC-SPE-NMR analysis of furanosesquiterpenoids from bark exudates of Commiphora swynnertonii Burrt. Phytochem. Lett. 2020, 38, 128–132. [Google Scholar] [CrossRef]
- Patil, S.; Kantikar, G.; Koppula, S.; Koppula, P. Identification and characterization of a new process related impurity in terbutaline sulfate by Accurate-Mass Q-TOF LC/MS/MS and NMR. Chromatographia 2021, 84, 381–391. [Google Scholar] [CrossRef]
- Sahu, A.; Balhara, A.; Raju, N.; Kumar, B.K.; Sharma, P.; Singh, D.K.; Singh, S. Characterization of degradation products of celiprolol hydrochloride using hyphenated mass and NMR techniques. J. Pharm. Biomed. Anal. 2021, 197, 113953. [Google Scholar] [CrossRef] [PubMed]

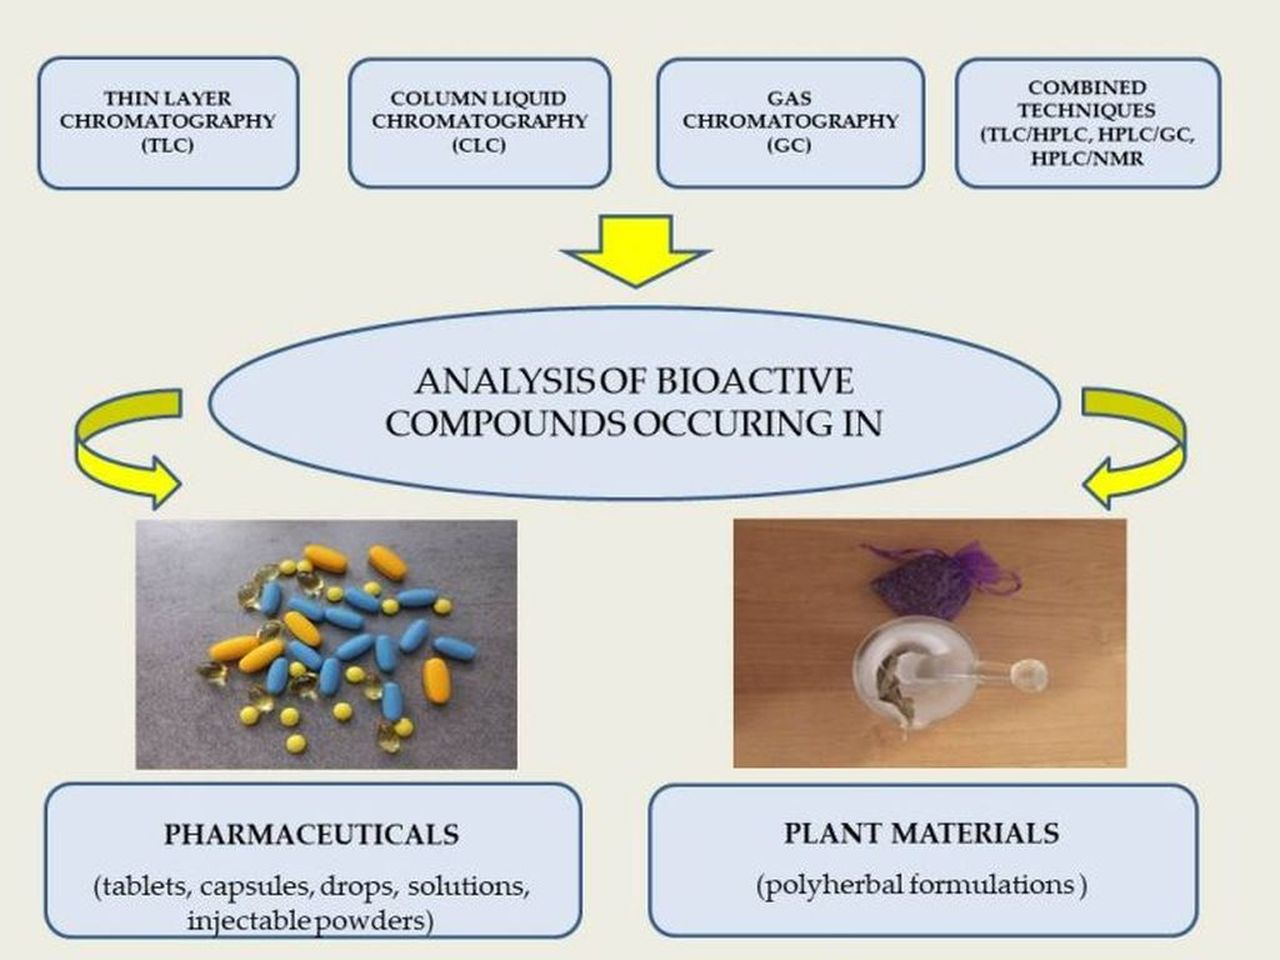
Table 1.
Drug and pharmaceutical raw materials analyzed by TLC.
| Matrix/Compounds | Chromatographic Conditions | Other Parameters | Refs. |
|---|---|---|---|
| Pharmaceutical formulations and bulk drugs | |||
| Antidiabetic compounds | |||
| Ternary combined tablets Metformin (MF), Saxagliptin (SG), Dapaglifloxin (DG) | HPTLC-densitometry λ = 224 nm Silica gel 60F254 Chloroform-methanol-water-acetic acid (7.4:2.6:0.5:0.01, v/v/v/v) | Linearity (µg/mL): 30–350 (for MF) 140–1500 (for SG) 50–600 (for DG) LOD: 6.877–38.882 µg/mL Intraday precision: 0.06–0.30% Interday precision: 0.20–0.53% Robustness: RSD = 0.06–1.71% | [11] |
| Tablet Linagliptin | HPTLC-densitometry Silica gel 60F254 Toluene-methanol (7.0:3.0, v/v) | RF = 0.50 ± 0.02 Linearity (µg/band): 100–500 LOD: 0.26 ng/band LOQ: 0.78 ng/band Intraday precision: 1.12–1.25% Interday precision: 1.20–1.56% Recovery: RSD = 1.53–1.81% Robustness: RSD = 0.91–0.962% | [12] |
| Nonheterocyclic alkaloids (phenylethylamine derivatives) | |||
| Pharmaceutical formulation Ephedrine hydrochloride (EPH), Naphazoline nitrate (NPN) | HPTLC-densitometry λ = 220 nm Silica gel F254 Ethyl acetate-ethanol-trimethylamine (8:2:0.2, v/v/v) | Linearity (µg/band): 2–16 (for EPH) 0.4–1.8 (for NPN) LOD (µg/spot): 0.52 (for EPH); 0.12 (for NPN) Intraday precision: 1.18–1.25% Interday precision: 1.31–1.47% Symmetry factor (T): 1.12, 1.05 (for EPH and NPN) | [13] |
| Antibiotics and steroids | |||
| Binary ophthalmic formulations Ofloxacin (OF), Gatifloxacin (GF), Dexamethasone sodium phosphate (DM), Prednisone (PR) | TLC-densitometry λ = 243 nm Silica gel 60 F254 Butanol-acetic acid-water (6:2:2, v/v/v) | RF: 0.18, 0.45, 0.61, 0.60 (OF, GF, DM, PR) Resolution: 5.217, 3.033, 5.357 Linearity (µg/band): 0.1–10 (for OF and GF) 0.2–8 (for DM and PR) LOD (µg/band): 0.03, 0.02, 0.05, 0.06 (for OF, GF, DM, PR) Accuracy: 99.454–99.806% Intraday precision: 0.311–0.902% Interday precision: 1.142–1.318% | [14] |
| Cream formulation Ofloxacin (OF) Tinidazole (TD) Terbinafine hydrochloride (TH) Clobetasol propionate (CP) | TLC-densitometry λ = 238 nm Silica gel 60 F254 Toluene-ethyl acetate-methanol-triethylamine-formic acid (5:4:1:0.3:0.3, v/v/v/v/v) | Linearity (ng/band): 300–1500 (for OF, TD, TH, CP) LOD: 27.65–53.93 ng/band Intraday precision: <2% Interday precision: <2% Robustness: RSD < 2% | [15] |
| Pharmaceutical formulation (tablets, ampoules) Estradiol valerate (EST) Norethisterone acetate (NOR) Estradiol (DIOL) Estrone (ONE) Estriol (TRIOL) Testosterone (TEST) | TLC-densitometry Silica gel 60 RP18F254s Chloroform-propanol-formic acid (5:3:2, v/v/v) | Linearity (µg/band): 0.02–3.20 (for EST, NOR) 0.01–3.50 (for DIOL, ONE, TRIOL) LLOQ: 0.02 µg/band (for EST, NOR) LLOQ: 0.01 µg/band (for DIOL, ONE, TRIOL) | [16] |
| Pharmaceutical formulation Trexotaz vial Cefoperazone (CFP) Sulbactam (SUB) | HPTLC-densitometry λ = 265 nm Silica gel 60 RP18F254s Acetone-ethanol-ethyl acetate-2% sodium dodecyl sulfate-glacial acetic acid (3:2:4:1:0.5, v/v/v/v/v) | RF = 0.45 ± 0.015 for CFP and 0.69 ± 0.008 for SUB Linearity (ng/band): 150–1000 (for CFP) 100–1000 (for SUB) LOD (ng/band): 42.42 (for CFP), 29.59 (for SUB) LOQ (ng/band): 128.6 (for CFP), 89.66 (for SUB) Intraday precision: <1% Interday precision: <2% Accuracy: 99.50–100.50 (for CFP) 99.10–100.40 (for SUB) Robustness: RSD < 2% | [17] |
| Eye drop Chloramphenicol (CHL) Dexamethasone sodium phosphate (DSP) Tetrahydrozoline (THZ) p-nitroacetophenone (PNA) | TLC-densitometry λ = 220 nm (for THZ) λ = 242 nm (for other drugs) Silica gel 60 F254 (A) Ethanol-water-ammonia (7.0:2.5:0.5, v/v/v) | RF = 0.20; 0.65; 0.76 (for THZ, DSP, CHL) Linearity (µg/band): 0.1–1.4 (for CHL) 0.2–1.2 (for DSP) 0.1–0.5 (for THZ) LOD (µg/band): 0.03, 0.04, 0.02 (for, CHL, DSP, THZ) Precision: RSD = 0.73–1.32% | [18] |
| (B) Acetonitrile-water-ammonia (10.0:3.0:0.5, v/v/v) | RF = 0.38; 0.58; 0.78; 0.87 (for DSP, THZ, CHL, PNA) Linearity (µg/band): 0.6–1.8 (for CHL) 0.8–3.2 (for DSP) 0.32–1.4 (for PNA) 0.01–0.1 (for THZ) LOD (µg/band): 0.06, 0.13, 0.07, 0.003 (for, CHL, DSP, PNA, THZ) Precision: RSD = 0.32–1.57% | ||
| Vitamins | |||
| Pharmaceutical products Menaquinone 9 (MK-9) Menaquinone 7 (MK-7) Vitamin K1 (K1) Menaquinone 4 (MK-4) Cholecalciferol (D3) Menadione (K3) | TLC-densitometry Silica gel 60 F254 methanol-ethanol-isopropanol (15:1:4, v/v/v) | RF = 0.08, 0.15, 0.24, 0.33, 0.36, and 0.68 for MK-9, MK-7, K1, MK-4, D3, and K3 Linearity (µg/band): 0.091–0.910 for MK-9, 0.079–0.790 for MK-7, 0.050–0.700 for K1, 0.100–0.700 for MK-4, 0.107–0.749 for D3, and 0.051–0.714 for K3 LOD = 25.0–53.5 ng/band LOQ = 50.0–107.0 ng/band, Intraday precision, RSD = 1.14–2.70%, Interday precision, RSD = 1.38–2.63%), Recovery = 95.78–104.96%, RSD = 0.64–2.33% Stable, RSD = 1.89–2.56% | [19] |
| Non-steroidal anti-inflammatory compounds | |||
| Pharmaceutical preparations Celecoxib (C), Etoricoxib (E), Firecoxib (F), Robenacoxib (R), Cimicoxib (CM) | HPTLC-densitometry, λ = 290 nm Silica gel 60F254 Chloroform-acetone-toluene (12:5:2, v/v/v) | Linearity (mg/mL): 0.10–5.00 (for C); 0.02–3.00 (for E); 0.40–4.00 (for F); 0.10–10.00 (for R) 0.05–3.00 (for CM) LOD (ng/band): 90.55 (for C); 29.62 (for E); 54.10 (for F); 79.52 (for R); 40.75 (for CM) Intraday precision (RSD): 0.32–1.05% Interday precision (RSD):0.62–1.22% Accuracy (RSD): 0.48–1.86% | [20] |
| Antihypertensive compounds | |||
| Cardimap tablet Reserpine (RP) Lupeol (LP) Scopoletine (SP) Bacoside A (BA) Piperine (PP) | HPTLC-densitometry, λ = 254 nm (for RP, SP, PP) λ = 580 nm (for LP after derivatization with H2SO4) λ = 598 nm (for BA after derivatization with H2SO4) Silica gel 60F254 Benzene-ethyl acetate- glacial actatic acid-n-butanol (5.7:3:1:0.3, v/v/v/v) for RP, SP, PP Benzene-ethyl acetate (9:1, v/v) for LP n-Butanol-glacial acetic acid-water (36:6:8, v/v/v) for BA | Linearity (µg/spot): 1–2 (for RP), 2.5–4.5 (SP), 10–50 (for PP), 12–24 (for BA), 1–5 (for LP) RF: 0.17, 0.53, 0.73 (for RP, SP, PP); 0.34 (for BA); 0.48 (for LP) Intraday precision, %CV < 1 Interday precision, %CV < 1 Accuracy: % Recovery 98.14–100.9; %RSD < 2 LOD (µg): 0.0065, 0.0126, 0.0109, 0.3771, 0.3240 (for RP, SP, PP, BA, LP) LOQ (µg): 0.0197, 0.0384, 0.0330, 1.1428, 0.9820 (for RP, SP, PP, BA, LP) | [21] |
| Glycosidated flavonoids | |||
| Commercial tablets Diosmin | HPTLC-densitometry RP silica gel 60F254S Ethanol: water (5.5:4.5, v/v) | RF = 0.80 Linearity: 200–700 ng/band LOD = 33.72 ± 2.28 ng/band LOQ = 101.16 ± 6.84 ng/band Accurate: Rrecovery = 98.10–101.15%, RSD = 1.20–1.51% Intraday precision, RSD = 1.49–1.97% Interday precision, RSD = 1.56–1.98% | [22] |
| Plant extracts | |||
| Alkaloids (piperidine derivatives) | |||
| Herbal formulation Piperine | HPTLC-densitometry λ = 254 nm Silica gel 60F254 Toluene-ethyl acetate-formic acid-methanol (3:3:0.8:0.2, v/v/v/v) | Linearity: 100–500 ng/spot LOD: 71.88 ng/spot LOQ: 217.82 ng/spot Recovery: 98.77% Intraday precision: 2.27–4.02% Interday precision: 3.83–4.30% | [23] |
| Antioxidants (i.a. phenolic compounds, alkoloids, sterols) | |||
| Moringa oleifera Rutin (RN), Chlorogenic acid (CGA), Gallic acid (GA) | HPTLC-densitometry λ = 254 nm Silica gel 60F254s Ethyl acetate-acetone-water-formic acid (6:3:2:2, v/v/v/v) | Linearity (ng/spot): 1000–7000 (for RN) 100–700 (for CGA and GA) LOD: 5.23–7.12 ng/mL Intraday precision: 0.37–0.91% Interday precision: 0.43–1.31% Robustness: RSD = 0.48–1.20% | [24] |
| Eclipta alba Guiera senegalensis Quercetin (QR) Gallic acid (GA) | HPTLC-densitometry λ = 254 nm Silica gel 60F254s Toluene-ethyl acetate-glacial acetic acid (6:3:1, v/v/v) | RF = 0.58; 0.76 (for GA, QR) Linearity (ng/band): 200–2000 (for GA, QR) Intraday precision: 0.06–0.58% Interday precision: 0.04–0.39% Accuracy: 98.91–113.16 (for GA) 100.75–113.67 (for QR) LOD (ng/spot): 3.30, 12.70 (for GA, QR) LOQ (ng/spot): 10.20, 38.60 (for GA, QR) | [25] |
| Trollius altaicus antibacterial gels Gallic acid (GA), Orientin (O) Orientin-2″-O-β-l-galactoside (OG) | HPTLC-densitometry λ = 280 nm for GA λ = 360 nm for O and OG Polyamide Dichloromethane-butanone-methanol-formic acid (6:0.5:2:0.6, v/v/v/v) | Linearity (µg/band): 0.089–0.785 for GA 0.082–0.575 for O 0.026–0.209 for OG Stability test, %RSD: 4.82, 4.51, 3.55 for GA, O, and OG Precision, %RSD: 1.35, 2.82, 2.78 for GA, O, and OG Recovery, %RSD: 2.67, 3.70, 3.69 for GA, O, and OG | [26] |
| Medicinal plants, pharmaceutical preparations Berberine (BB), Rutin (RN) | HPTLC-densitometry λ = 254 nm Silica gel F254 n-Hexane-ethyl acetate-glacial acetic–methanol (10:1.1:1.1:2.5, v/v/v/) | Linearity: 0.2–1.4 µg/spot LOD (µg/spot): 0.2 (for BB), 2 (for RN) Intraday precision: 0.62–1.87% Interday precision: 0.30–1.55% Repeatability in CV: 0.54–0.56% | [27] |
| Berberis aristata Berberine (BB) Berbamine (BA) Palmatine (PT) Magnoflorine (MF) Jatrorrhizine (JR) | HPTLC-densitometry λ = 254 nm λ = 366 nm Silica gel 60F254 Ethyl acetate-formic acid-glacial acetic acid-water (100:11:11:26, v/v/v/v) | RF = 0.47; 0.12; 0.38; 0.14; 0.40 (for BB, BA, PT, MF, JR) Linearity (ng): 1000–6000 (for BB, BA), 200–700 (for PT), 500–2000 (for MF), 300–1800 (for JR) LOD (ng): 323.24, 227.0, 55.68, 86.67, 86.56 (for BB, BA, PT, MF, JR) %Recovery = 98.10–101.1 Intraday precision, %CV < 1% Interday precision, %CV < 1% Robustness, %CV < 1% | [28] |
| Phoenix sylvestris Rutin | HPTLC-densitometry λ = 254 nm Silica gel F254 Chloroform-methanol-formic acid (2:8:0.2, v/v/v) | Linearity: 200–1000 ng/spot LOD: 125.01 ng/spot LOQ: 204.921 ng/spot Intraday precision: 1.09–2.18% Interday precision: 1.45–2.01% Recovery (RSD): 99.01–100.00% Repeatability (RSD): 1.24% | [29] |
| Plant extracts Peroxidase inhibitors | HPTLC-bioautography method: reaction of peroxidase with hydrogen peroxide, and reaction between the released oxygen and benzidine Silica gel 60 Chloroform-methanol-acetic acid (8.5:1.5:0.15, v/v/v); for methylene chloride fractions Ethyl acetate–methanol-water-acetic acid (45:4:2:0.35, v/v/v); for ethyl acetate butanol fractions | Linearity: 0.85–9 µg/spot LOD: 0.280 µg/spot LOQ: 0.85 µg/spot Intraday precision: 0.95–2.35% Interday precision: 1.80–3.20% Accuracy: RSD = 1.84–2.21% | [30] |
| Arctium tomentosum Mill Arctiin (AR), Arctigenin (AG) | HPTLC-densitometry λ = 280 nm Silica gel G Chloroform-methanol (48:5, v/v) | Linearity (µg/spot): 0.5315–5.8465 (for AR) 0.5654–6.2194 (for AG) Recovery: 98.55–103.07% Intraday precision: 1.30–2.87% Interday precision: 1.76–1.85% | [31] |
| Loranthus acaciaeZucc Betulinic acid (BA), β-Sitosterol (ST) | HPTLC Vanillin/HCl as spray visualizing reagent λ = 540 nm Silica gel 60F254 Chloroform-methanol-glacial acetic acid (97:2:1, v/v/v) | RF: 0.31, 0.41 (for BA and ST) Linearity: 200–1400 ng/spot (for BA and ST) LOD (ng): 34.51(for BA), 40.95 (for ST) Intraday precision: 1.01–1.30% Interday precision: 0.99–1.29% Recovery: 98.85–99.71% Robustness: 1.01–1.22% | [32] |
| Other compounds | |||
| Psoralea corylifolia Bavachin (BV), Bakuchiol (BK), Psoralen (PS) | HPTLC-densitometry λ = 254 nm Silica gel F254 Toluene-ether (1:1, v/v saturated with 10% glacial acetic acid) | Linearity: 1000–11,000 ng/spot (for BV, BK, PS) LOD: 274.60, 317.42,108.46 ng/spot (for BV, BK, PS) Recovery: 98.18–100% Intraday precision: 0.10–0.99% Interday precision: 0.15–1.29% | [33] |
| Kaempferia galanga Ethyl p-methoxycinnamate | HPTLC/ densitometry, λ = 309 nm Silica gel GF254 n-Hexane-ethyl acetate (18:1, v/v) | Linearity: 2.00–6.00 µg Intraday precision: 2.18–2.43% Interday precision: 2.20% Recovery: 100.1%; RSD = 2.49% | [34] |
| Gymnema sylvestre and herbal formulation Gymnemagenin | HPTLC-densitometry with vanillin-sulphuric acid as visualizing reagent λ = 500 nm Silica gel F254 Toluene-ethyl acetate-methanol-formic acid (60:20:1:5, v/v/v/v) | RF = 0.16 ± 0.03 Linearity: 500–3000 ng/band LOD: 65 ng/band LOQ: 190 ng/band Intraday precision: 0.92–1.47% Interday precision: 0.20–1.96% Recovery: 98.43–101.44% Robustness: 0.77–1.47% | [35] |
| Tinospora cordifolia Cordifolioside A (CA) 20-β-hydroxyecdysone (HE) Columbin (C) | HPTLC-ESI-MS/MS λ = 254 nm λ = 600 nm (for C after their derivatization) Silica gel F254 Hexane-chloroform-methanol-formic acid (4:4:2:0.1%, v/v/v/v) | RF: 0.12, 0.47, 0.86 (CA, HE, C) Linearity (ng/band): 750–2250 (for CA, HE); 675–1875 (for C) LOD (ng/band): 107.05, 40.90, 53.86 (for CA, HE, C) Intraday precision: 0.14–1.57% Interday precision: 0.08–1.83% Recovery: 98.15–101.56% (for CA), 98.96–100.43% (for HE), 98.06–98.80% (for C) | [36] |
| Punica granatum L. Ursolic acid (UA) Oleanolic acid (OA) | HPTLC-densitometry λ = 530 nm Silica gel G Cyclohexane-ethyl acetate-methanol (8.2:1.8:0.5, v/v/v) 1% sulphuric acid-methanol solution as visualizing reagent | Linearity (µg/band): 0.2505–1.503, 0.2595–3.633 (for OA and UA) LOD ng/band: 10, 20 (for UA and OA) LOQ ng/band: 33, 67 (for UA and OA) Precision, RSD < 2% Stability test, RSD < 4% Repeatability test, RSD < 4% Recovery test, RSD < 3% | [37] |
| Picrorhiza kurroa (roots), Andrographis paniculata (aerial parts) and Silybum marianum (seeds) Picroside-I (PI) Andrographolide (ADG) Silybin (SL) | HPTLC-densitometry λ = 254 nm Silica gel 60F254 n-Butanol-glacial acetic acid-water (6:1:3, v/v/v) | Linearity (ng/spot): 60–600 (for PI, ADG, SL) LOD ng/spot: 15.089, 21.969, 25.702 (for PI, ADG, SL) LOQ ng/spot: 45.725, 66.573, 77.885 (for PI, ADG, SL) Intraday precision, RSD < 2% Interday precision, RSD < 2% Accuracy (% drug recovered): 97.75–103.74 (for PI) 99.75–101.12 (for ADG) 98.96–101.69 (for PI) Drug content (µg/mg): 1.221 ± 0.0129 (for PI) 0.366 ± 0.0734 (for ADG) 1.827 ± 0.0635 (for PI) | [38] |
Table 2.
HPLC in pharmaceutical and phytochemical analysis.
| Matrix/Compounds | Chromatographic Conditions | Other Parameters | Refs. |
|---|---|---|---|
| Pharmaceutical formulations | |||
| Biguanide and gliptin antidiabetic drugs | |||
| Ternary combined tablets Metformin (MF), Saxagliptin (SG), Dapaglifloxin (DG) | HPLC with DAD C18 (4.6 × 250 mm, 5µm) Eluent A: acetonitrile Eluent B: acidified water Gradient elution Flow rate: 0.8–1 mL/min | Linearity (µg/mL): 10–120 (for MF) 80–300 (for SG) 20–160 (for DG) LOD (µg/mL): 2.083 (for MF) 8.937 (for SG) 2.680 (for DG) Intraday precision: 0.06–0.35% Interday precision: 0.03–0.51% Robustness (RSD): 0.28–1.64% | [11] |
| Bulk and tablets Metformin (MF), Ertugliflozin pedolate (ERTU) | RP-HPLC λ = 224 nm C18 (150 × 4.6 mm, 5 µm) Eluent: 0.1% ortho-phosphoric acid buffer (pH 2.7):acetonitrile (65:35, v/v) Isocratic elution Flow rate: 1 mL/min | tR (min): 2.170 (MET), 2.929 (ERTU) Linearity (µg/mL): 0.9375–5.625 (ERTU), 62.5–375 (MET) LOD (µg/mL): 0.87 (for MET), 0.025 (for ERTU) LOQ (µg/mL): 2.63 (for MET), 0.076 (for ERTU) Recovery: 99.11–101.13% (for MET), 99.27–100.60% (for ERTU) Intraday precision (%RSD): 0.42 (for MET), 0.25 (for ERTU) Interday precision (%RSD): 0.56 (for MET), 0.70 (for ERTU) | [55] |
| Tablets Vildagliptin and its impurities | LC-UV DAD λ = 210 nm RP-18 (125 × 4.0 mm, 5 µm) Eluent: 2 mM ammonium acetate and acetonitrile 80:20 (v/v) Flow rate: 1.2 mL/min | Linearity range (µg/mL): 40–190 LOD (µg/mL): 2.99 LOQ (µg/mL): 9.09 Recovery (%): 99.86 Intra-day precision (% RSD): 0.26–0.55 Inter-day precision (% RSD): 0.64–1.46 | [56] |
| Antibiotics (fluoroquinolones, penicillins, cephalosporins) and others | |||
| Binary ophthalmic formulations Ofloxacin (OF), Gatifloxacin (GF), Dexamethasone sodium phosphate (DMSP), Prednisone (PR) | HPLC λ = 290 and 243 nm C18 (250 mm × 4.6 mm, 5µm) Eluent A: acetonitrile Eluent B: sodium dihydrogen phosphate buffer pH 3.0 ± 0.1 Gradient elution Flow rate: 1 mL/min | RT = 3.1, 3.6, 4.3, 6.1 (for OF, GF, DM, PR) Range (µg/mL): 2–70 (for OF, GF) 3–70 (for DMSP, PR) LOD (µg/mL): 0.387 (for OF) 0.473 (for GF) 0.633 (for DMSP) 0.698 (for PR) Accuracy: 99.060–100.76% Intraday precision: 99.318–101.282% Interday precision: 99.854–101.058% | [14] |
| Tablets and serum samples Ofloxacin, Ciprofloxacin, Levofloxacin, Enoxacin, Sparfloxacin, Norfloxacin, Cetrizine | RP-HPLC λ = 225 nm RP-18 (25 × 0.46 cm, 5 μm) Eluent: methanol:acetonitrile: water (50:20:30, v/v/v) a pH 3.1 Isocratic elution Flow rate: 1 mL/min | Linearity: 2.5–50 μg/mL Accuracy (%RSD): 0.22–1.52 Interday precision (RSD): 0.005–2.03% Recovery in formulations: 96.25–100.92% Recovery in serum samples: 96.13–104.19% | [57] |
| Oral suspension Amoxicillin (AMOX), Enrofloxacin (ENR) | RP-HPLC λ = 235 nm C18 analytical column Eluent: 0.1M potassium dihydrogen orthophosphate:methanol (65:35, v/v) Flow rate: 1 mL/min | Linearity (µg/mL): 38.5–115.5 (for AMOX) 17.5–52.50 (for ENR) LOD (µg/mL): 0.051 (for AMOX), 0.019 (for ENR) LOQ (µg/mL): 0.171 (for AMOX), 0.064 (for ENR) Recovery: 99.76–99.81% (for AMOX) 99.72–99.98% (for ENR) Precision (RSD of peak area): 0.047 mAU (for AMOX), 0.248 mAU (for ENR) | [58] |
| Capsules form Amoxicillin trihydrate (AMOX), Dicloxacillin sodium (DIC) and their impurity 6-aminopenicillanic acid (6-APA) | HPLC-MS Quadrupole mass spectrometer was used with electrospray ionization (ESI) at negative mode Capillary voltage was at 3000 V, and drying gas temperature was at 350 °C C18 (3.5 µm, 100 mm × 4.6 mm) Eluent: acetonitrile:water (65:35, v/v) Flow rate: 0.5 mL/min | tR [min]: 1.61 (AMOX), 2.54 (DIC), 3.50 (6-APA) Linerity range (µg/mL): 2–28 (AMOX), 2–35 (DIC), 1–10 (6-APA) LOD (µg/mL): 0.436 (for AMOX), 0.539 (for DIC), 0.232 (for 6-APA) LOQ (µg/mL): 1.322 (for AMOX), 1.634 (for DIC), 0.702 (for 6-APA) Intraday precision (%RSD): 0.132–0.885–0.463 (for AMOX), 0.533–0.186–0.764 (for DIC), 0.787–0.238–0.519 (for 6-APA) Interday precision (%RSD): 1.341–1.702–0.945 (for AMOX), 1.556–0.820–1.174 (for DIC), 1.540–1.306–1.169 (for 6-APA) | [59] |
| Bulk and tablet dosage form 13 drugs: amoxicillin, metformin, chloroquine, theophylline, trimethoprim, caffeine, norfloxacin, ciprofloxacin, acetylsalicylic acid, doxycycline hyclate, metronidazole, albendazole and cloxacillin | RP-HPLC λ = 250 nm Kromasil C18 Eluent A: water with 0.1% formic acid Eluent B: acetonitrile Eluent C: methanol Gradient elution Flow rate: 1 mL/min | Linearity: 0.25–100 µg/mL LOD: 0.02–0.27 µg/L LOQ: 0.08–0.91 µg/L Accuaracy: 86.0–102% for pure compounds, 90.9–106% for compounds in tablet dosage form | [60] |
| Tablets Amoxicillin (AMOX) Clavulanic acid lithium salt (CL) | RP-HPLC λ = 220 nm C18 (75 × 4.6 mm, 3.5 μm) Eluent: phoshate buffer:methanol (19:1 v/v) Isocratic mode Flow rate: 1 mL/min | Linerity range (µg/mL): 1 ÷ 500 (for AMOX), 0.4–200 (for CL) LOD (µg/mL): 0.01 (for AMOX), 0.02 (for CL) Recovery (%RSD): 99.85–102.48% (for AMOX) 99.82 ÷ 104.07 (for CL) Intraday precision (%RSD): 0.23 ÷ 1.04 (for AMOX), 0.15–1.68 (for CL) Interday precision (%RSD): 0.51–10.01 (for AMOX), 6.21–12.45 (for CL) | [61] |
| Pure dosage form and pharmaceutical preparation Ceftriaxone sodium (CFT) | RP-HPLC λ = 241 nm C18 (3.5 µm × 4.6 × 100 mm) Eluent: phosphate buffer pH 5.8–8):methanol (80:20, v/v) Isocratic mode Flow rate: 0.7 mL/min | Linerity range: 2–12 µg/mL LOD 4.36 × 10⁻⁶ µg/mL LOQ: 1.44 × 10⁻⁵ µg/mL Recovery: 99.57% RSD: 2.15% | [62] |
| Steroids | |||
| Sample of prednisolone active ingredient (real sample) Prednisolone and its five related substances (impurities) according to Ph. Eur. | RP-HPLC, UV λ = 254 nm C18 (150 × 4.6 mm, 3 µm) Eluent A: acetonitrile- tetrahydrofuran-water (15:10:75, v/v/v) Eluent B: acetonitrile-water (80:20, v/v) Gradient elution Flow rate: 0.8 mL/min | LOD: 0.125 μg/mL LOQ: 0.250 μg/mL Linearity: 0.26–6.33 μg/mL | [63] |
| Eye drop suspension Triamcilonone acetonide | RP-HPLC λ = 254 nm C18 (3.9 mm × 300 mm, 5 µm) Gradient elution Eluent: HPLC water:acetonitrile (65:35, v/v) | Linearity: 70–130% LOD: 0.096 μg/mL LOQ: 0.31 μg/mL Recovery: 99.80–101.6% Intraday precision: 100.5–101.4% Interday precision: 100.5–101.6% | [64] |
| 31 formulations (tablets and capsules) Stanozolol | (LC-QTOF-MS) Quadrupole time-of- flight-mass spectrometry in positive mode Shim-pack XR-ODS II (75 × 2.0 mm, 2.2 µm) Eluent A: 0.1% formic acid in water Eluent B: acetonitrile Gradient elution Flow rate: 400 µL/min | Linearity: 0.1–20 µg/mL LLOQ: 0.1 µg/mL Accuaracy: 92.10–95.24% Intraday precision (CV): 11.4–17.8% Interday precision (CV): 11.8–16.7% | [65] |
| Topical dosage form Hydrocortisone (HYD), Clotrimazole (CL) | RP-HPLC λ = 254 nm USP L1 (250 × 4.6 mm, 5 μm), Eluent: acetonitrile:buffer (75:25, v/v) Flow rate: 1 mL/min | tR (min): 3.0 min (for HYD), 7.3 min (for CL) Linearity: 100–300 µg/mL LOD (µg/mL): 43.62 (for HYD), 34.03 (for CL) LOQ (µg/mL): 14.39 (for HYD), 11.23 (for CL) Recovery (RSD): 0.03% for HYD, 0.08% for CL | [66] |
| Tablets of dietary supplements Dehydroepiandrosterone (DHEA) | RP-HPLC λ = 210 nm C18 (Eurospher-100, 150 mm × 4.6 mm, 5μm) Eluent: methanol:water (70:30 v/v) Flow rate: 1 mL/min. Isocratic system | Linearity: 0.0625–0.5 mg/mL LOD: 50 ng/mL LOQ: 166.7 ng/mL Intraday precision: 0.76–1.73% (for standard), 0.84–2.93% (for DHEA in supplement) Interday precision: 1.52–1.57% (for standard), 1.73–4.27% (for DHEA in supplement | [67] |
| Injectable veterinary suspension Dexamethasone sodium phosphate (DMSP) Prednisolone acetate (PA) | RP-HPLC λ = 254 nm C18 (250 mm × 4.6 mm, 5µm) Eluent: acetonitrile: phosphate buffer 0.1% (50:50, v/v) at pH 3.0 Isocratic mode Flow rate: 1.0 mL/min | tR (min): 2.25 min (for DMSP), 4.50 min (for PA) Linearity (µg/mL): 10.528–23.1616 µg/mL (for DMSP) 13.392–24.106 µg/mL (for PA) LOD (µg/mL): 0.66 (for DMSP), 0.37 (for PA) LOQ (µg/mL): 2.21 (for DMSP), 1.25 (for PA) Recovery: 98.72–100.31% (for DMSP), 97.05–101.60% (for PA) Intraday precision (%RSD): 0.81 (for DMSP), 1.23 (for PA) Interday precision (%RSD): 1.42 (for DMSP), 1.15 (for PA) | [68] |
| Non-steroidal anti-inflammatory drugs (acetylsalicyclic acid and 2-arylpropionic acid derivatives) and others | |||
| Newly synthesized codrug Indomethacin-Paracetamol (IND-PAR) Indomethacin (IND), Paracetamol (PAR), Famotidine (FAM) | RP-HPLC λ = 275 nm C18 (4.6 × 250 mm, 5 μm) Eluent: acetonitrile:sodium acetate buffer (60:40, v/v) pH 5 Flow rate: 1.4 mL/min | Linearity: 0.01–0.1 mg/mL LODs (mg/mL): 3.076 × 10⁻⁹ (for FAM), 3.868 × 10⁻¹⁰ (PAR), 1.066 × 10⁻⁹ (IND) and 4.402 × 10⁻⁹ (codrug) LOQs (mg/mL): 9.322 × 10⁻⁹ (for FAM), 1.172 × 10⁻¹⁰ (for PAR), 3.232 × 10⁻⁹ (for IND), 1.334 × 10⁻⁸ (for codrug) Recovery: 99.22–101.38% Intraday precision (%RSD): 0.70–1.66 Interday precision (%RSD): 0.20–1.75 | [69] |
| Tablet forms (pharmaceuticals) and water samples Ketoprofen (KET), Naproxen (NAP), Diclofenac (DIC), Ibuprofen (IBU) | HPLC λ = 220 nm Zir-Chrom PBD (4.6 mm × 150 mm, 5 μm) Eluent: acetonitrile:water (superheated water at 100–140 °C) Flow rate: 0.5–2.8 mL/min | Linearity (mg/L): 500.0–0.1, 500.0–0.005, 500.0–0.01, 500.0–0.1 for KET, NAP, DIC, and IBU LODs (µg/L): 14, 2, 4.2 and 32 for KET, NAP, DIC, and IBU LOQs (µg/L): 44, 8, 12 and 98 for KET, NAP, DIC, and IBU Recovery: 90.48–98.15% (for the water samples), 99.9–100.8% (for the pharmaceuticals) Intraday repeatability (%RSD): 0.08–1.52% Interday precision (%RSD): 1.01–2.67% | [70] |
| Antivirus drugs (adenosine triphosphate, pyrazine analogs) | |||
|
Injection vials and raw material Remdesivir (RDV) | HPLC-DAD (HPLC-diode array detection) λ = 240 nm HPLC-FD (HPLC-fluorimetric detection) λex/em = 245/390 nm C18 (250 × 4.6 mm, 5 µm) Eluent: acetonitrile:distilled water (acidified with phosphoric acid, pH 4) 55:45 (v/v), Isocratic elution Flow rate: 1 mL/min | Linearity (μg/mL): 0.1–15 (for DAD), 0.05–15 (for FD) LOD (μg/mL): 0.03 (for DAD), 0.015 (for FD) LOQ (μg/mL): 0.10 (for DAD), 0.05 (for FD) Accuracy and intra-day precision: 99.94 ± 1.33 (for DAD), 100.30 ± 1.10 (for FD) Accuracy and inter-day precision: 100.54 ± 1.05 (for DAD), 101.28 ± 1.75 (for FD) | [73] |
|
Injectable powder Remdesivir (RDV) | HPLC λ = 247 nm C18 (4.6 mm × 250 mm, 5 µm) Eluent: 20 mM KH2PO4:acetonitrile (50:50, v/v) Flow rate: 1.2 mL/min | Linearity: 10–60 μg/mL LOD: 2.40 μg/mL LOQ: 7.30 μg/mL Recovery: 99.20–100.14% Intraday precision (%RSD): 0.092 Interday precision (%RSD): 0.358 | [74] |
| Tablet dosage form Favipiravir | HPLC λ = 323 nm C18 (4.6 mm × 250 mm, 5.0µm) Eluent: potassium dihydrogen phosphate 50 mM (pH 2.3):acetonitrile (90:10, v/v) Flow rate: 1 mL/min | Linearity: 10–100 μg/mL LOD: 1.20 μg/mL LOQ: 3.60 μg/mL Recovery: 99.19–100.17% Intraday precision: (%RSD): 0.041–0.178 Interday precision (%RSD): 0.064–0.195 | [75] |
| Drugs affecting for autonomic nerves system (Nonheterocyclic alkaloids phenylethylamine derivatives, quartenary amines) | |||
| Pharmaceutical formulation Ephedrine hydrochloride (EPH), Naphazoline nitrate (NPN) | RP-HPLC λ = 220 nm C18 (250 × 4.6 mm, 5 µm) Eluent A: water Eluent B: ethanol Eluent C: acetonitrile A:B:C (80:20:2, v/v/v) Flow rate: 1 mL/min | Linearity (µg/mL): 5–30 (for EPH), 2–30 (for NPN) LOD (µg/mL): 1.41 (for EPH) 0.45 (for NPN) Intraday precision: 1.34–1.35% Interday precision: 1.48–1.78% Symmetry factor (T): 1.02, 1.09 (for EPH and NPN) | [13] |
| Injection formulation and bulk drug Neostigmine methylsulfate (NMS) Impurity A, Impurity B, Impurity C | RP-HPLC λ = 215 nm C18 (250 mm × 4.6 mm, 5 µ) Eluent: phosphate-buffer solution (Na2HPO4, pH 3.0 ± 0.05, 10.00 mM):acetonitrile Gradient elution Flow rate: 1 mL/min | Linearity (µg/mL): 0.2–3.0 (for NMS, IMPA, IMPC), 0.02–0.30 (for IMPB) LODs (µg/mL): 0.0978 (for NMS), 0.0357 (for IMPA), 0.0040 (for IMPB), 0.0149 (for IMPC) LOQs (µg/mL): 0.2965 (for NMS), 0.1083 (for IMPA), 0.0121 (for IMPB), 0.0454 (for IMPC) Precision (%RSD): 0.23% for bulk drug NMS, 0.37% for NMS injection Recovery: 102% for NMS injection, 98% for impurities | [77] |
| Antioxidants (phenolic/polyphenolic compounds, anthocyanins, flavonoids and related compounds) | |||
| Bulk drug Quercetin (Q) Rutin (RN) | HPLC-UV, λ = 259 nm Phenomenex Luna C18 (250 × 4.6mm, 5µm) Eluent A: 20mM ammonium acetate (pH 3.0) Eluent B: acetonitrile A:B (60:40, v/v) Flow rate: 1.0 mL/min | Linearity (μg/mL): 1–5 (for Q) 0.1–0.5 (for RN) LOD (ng/mL): 100 (for Q) 10 (for RN) Recovery: 99.3–101.1% (for Q) 101.3–102% (for RN) Intraday and interday precision: <41% (for Q) <1.63 % (for RN) | [79] |
| Plant extracts | |||
| Antioxidants (phenolic/polyphenolic compounds, anthocyanins, flavonoid, anthocyanins and related compounds) | |||
| Samples of Crocus sativus L. flowers collected from Albacate province (Spain) Different bioactive compounds, e.g., flavonols (FV), anthocyanins (AC), safranal (SF), crocetin esters (CCE), picrocrocin (PC) | HPLC-DAD λ = 440 nm (CCE) λ = 250 nm (PC) λ = 330 nm (SF) λ = 266 nm (FV) λ = 520 nm (AC) Develosil ODS-HG-5 column (250 × 4.6 mm, 5 μm) Eluent A: ultrahigh purity water –TFA (99.5:5:0.5, v/v/v) Eluent B: acetonitrile Gradient elution Flow rate: 1 mL/min | Linearity (mg/L): 11.25–500 (for PC) 0.15–5.23 (for SF) LOD (mg/L): 4.40 (for PC) 0.04 (for SF) LOQ (mg/L): 4.42 (for PC) 0.05 (for SF) Repeatability (RSD): 0.05% (for PC) 0.61% (for SF) Reproducibility (RSD): 0.71% (for PC) 0.72% for SF) | [80] |
| Polyherbal formulation Bioactive compounds (9): phenolic (4): gallic acid (GA), ellagic acid (EA), chebulinic acid (CHA), tannic acid (TA), flavonoids (2): rutin (RN), quercetin (Q), anthraquinones (2): sennoside A (SSA), sennoside B (SSB), oxygenated hydrocarbon (1): ascorbic acid (AA) | HPLC–PDA C18 (250 × 4.6 mm, 5 μm) Eluent A: 0.05%, v/v solution of orthophosphoric acid Eluent B: acetonitrile containing 0.5% mobile phase A Gradient elution Flow rate: 1.0 mL/min | Linearity (µg/mL): 6.4–320, 1.1–474, 1.8–257, 10–350, 10.6–355.8, 10–220, 5–346.8, 2.3–456, 2.8–2000.0 (for AA, GA, RN, SSB, CHA, SSA, Q, EA, TA) LOD (μg/mL): 0.27 (for GA)-4.10 (for SSB) LOQ (μg/mL): 0.92 (for GA)-10.3 (for SSB) Intraday precision (RSD): <3% Interday precision (RSD): <3% Recovery: 94.36–108.27% | [81] |
| Herbal extracts marketed formulations Quercetin (Q), Curcumin (C) | HPLC–DAD λ = 395 nm C18 (250 mm, 4.6 mm, 5 µm) Flow rate: 1 mL/min Eluent A: acetonitrile Eluent B: 2% glacial acetic acid Gradient elution Fow rate: 1 mL/min | Linearity (ng/mL): 50–250 for C, 800–1600for Q LOD (ng/mL): 11.76 for C, 32.94 for Q LOQ (ng/mL): 35.6 ng for C, 99.76 for Q Recovery: 95–105% Precision (%RSD): 0.74–1.28 for C, 1.17–1.49 for Q | [82] |
| Alkaloids | |||
| Sanguinaria canadensis extracts Isoquinoline alkaloids: Berberine (Be), Chelerythrine (Cr), Chelidonine (Chld), Proptopine (Pr), Sanguinarine (S) | RP-HPLC-DAD λ = 240 nm RP 8 (150 mm × 4.6 mm, 5 µm) Eluent A: 0.04 M 1-butyl-3-methylimidazolium tetrafluoroborate in water Eluent B: 1-butyl-3-methylimidazolium tetrafluoroborate in acetonitrile Gradient elution Flow rate: 1 mL/min | tR (min): 35.48, 42.57, 19.33, 14.18 and 36.82 for Be, Cr, Chld, Pr and S LOQs (mg/mL); 0.0457 for berberine, 0.0123 for chelerythrine, 0.0288 for protopine, 0.0371 for sanguinarine, 0.0336 chelidonine | [86] |
| Mahonia species: Mahonia bealei (Fort) Carr and Mahonia fortunei (Lindl.) Columbamine (C), Jateorhizine (J), Palmatine (P), Berberine (B) | HPLC λ = 348 nm C18 (250mm × 4.6 mm, 5µm) Eluent A: acetonitrile Eluent B: 50 mm potassium phosphate buffer, pH3.0) Gradient elution Flow rate: 1 mL/min | Linearity (µg/mL): 0.25–10, 1.50–20, 0.50–10 and 2.5–25 for C, J, P and B Recovery (%RSD): 3.74, 1.85, 2.21 and 1.83 for C, J, P and B Precision (%RSD): 0.21, 0.11, 0.19 and 0.17 C, J, P and B | [87] |
| Aconiti kusnezoffii Radix (Caowu) extract Aconite alkaloids (AAs): Benzoylaconine (BAC), Benzoylmesaconine (BMA), Benzoylhypaconine (BHA), Aconitine (AC), Mesaconitine (MA), Hypaconitine (HA) | HPLC-DAD, UHPLC–ESI-MS/MS λ = 3230 nm C18 (2.1 mm × 100 mm, 1.9 µm) Eluent A: 0.05% form acid in water, Eluent B: 0.05% form acid in acetonitrile Flow rate: 0.3 mL/min C18 (4.6 mm × 50 mm, 2.5 µm) Eluent A: 5 mM ammonium acetate in water (pH 9.5) Eluent B: acetonitrile Flow rate: 0.3 mL/min | Linearity (µg/mL): 1.463–292.5, 1.090–218.0, 1.120–224.0, 1.395–139.5, 1.560–156.0, 1.965–196.5 for BAC, BMA, BHA, AC, MA and HA LODs (µg/mL): 0.731, 0.545, 1.120, 1.395, 1.560 and 1.965 for BAC, BMA, BHA, AC, MA and HA LOQs (µg/mL): 2.925, 2.180, 5.600, 3.488, 3.900 and 9.825 for BAC, BMA, BHA, AC, MA and HA Intraday precision (%RSD): 0.89–3.36 Interday precision (%RSD): 0.45–3.66 Recovery: 95.37–108.08% | [88] |
| Other compounds | |||
| Kaempferia galanga Ethyl p-methoxycinnamate | HPLC λ = 309 nm C18 (4.6 mm × 250 mm, 5µm) Eluent A: methanol Eluent B: 0.1% phosphoric acid aqueous solution A:B (70:30, v/v) Flow rate: 1.0 mL/min | Linearity: 2.00–7.00 µg Intraday precision: 0.17–0.59% Interday precision: 0.45% Recovery: 100.0%; RSD: 0.75% | [34] |
| Dietary supplement tablets Glucosamine sulphate | RP-HPLC-DAD λ = 206 nm C18 (150 mm × 3.2 mm, 5 µm) Eluent A: acetonitrile Eluent B: water A:B (50:50, v/v at pH = 4.0) Flow rate: 0.6 mL/min | Linearity: 0.05–2.5 mg/L Intraday precision (RSD): 1.540–2.317% Interday precision (RSD): 0.721–1.892% Recovery: 90.71–114.64% LOD: 0.014 mg/L LOQ: 0.046 mg/L | [89] |
| 18 samples (fifteen Shankhpushpi samples were purchased in February, 2019 from the local market of Gandhinagar and Ahmedabad and three authenticated samples of all three C. pluricaulis (CPLU), C. ternateac (CTERN), E. alsinoides (EALSI) Shankhpushpi | RP-HPLC-PDA C18 (250 mm × 4.6 mm, 5 µm) Eluent A: acetonitrile Eluent B: 0.5% acetic acid in water (pH = 3) Gradient elution Flow rate: 0.4 mL/min | Repeatability (RSD): 1.71% (for CPLU) 2.96% (for CTERN) 2.09% (for EALSI) Intraday precision (RSD): 0.91% (for CPLU), 1.87% (for CTERN), 2.56% (for EALSI) Interday precision (RSD): 1.92% (for CPLU), 2.08% (for CTERN), 2.91% (for EALSI) Stability (RSD): 1.69% (for CPLU), 3.07% (for CTERN), 0.94% (for EALSI) | [90] |
| Extracts of Maiwei Dihuang Pills Deoxyschizandrin (D), γ-Schizandrin (S), Loganin (L), Paeoniflorin (PF), Paeonol (P) | HPLC-DAD λ = 220 nm C18 (4.5 mm × 145 mm, 5 µm) Eluent: acetonitrile:water:0.2% phosphoric acid Gradient elution Flow rate: 0.8 mL/min | Linearity (µg/mL): 11.6–72.3 for D, 6.4–45.2 for S, 35.2–237.6 for L, 18.1–114.2 for PF, 32.2–215.3 for P LODs (µg/mL): 0.07, 0.05, 0.10, 0.09 and 0.04 for D, S, L, PF and P LOQs (µg/mL): 0.18, 0.12, 0.31, 0.25 and 0.11 for D, S, L, PF and P Recovery: 100.26%, 101.39%, 101.19%, 102.5% and 102.3% for D, S, L, PF and P | [91] |
Publisher’s Note: MDPI stays neutral with regard to jurisdictional claims in published maps and institutional affiliations. |
© 2022 by the authors. Licensee MDPI, Basel, Switzerland. This article is an open access article distributed under the terms and conditions of the Creative Commons Attribution (CC BY) license (https://creativecommons.org/licenses/by/4.0/).
Share and Cite
MDPI and ACS Style
Parys, W.; Dołowy, M.; Pyka-Pająk, A. Significance of Chromatographic Techniques in Pharmaceutical Analysis. Processes 2022, 10, 172. https://doi.org/10.3390/pr10010172
AMA Style
Parys W, Dołowy M, Pyka-Pająk A. Significance of Chromatographic Techniques in Pharmaceutical Analysis. Processes. 2022; 10(1):172. https://doi.org/10.3390/pr10010172
Chicago/Turabian StyleParys, Wioletta, Małgorzata Dołowy, and Alina Pyka-Pająk. 2022. "Significance of Chromatographic Techniques in Pharmaceutical Analysis" Processes 10, no. 1: 172. https://doi.org/10.3390/pr10010172
Note that from the first issue of 2016, this journal uses article numbers instead of page numbers. See further details here.