
Impact of Applying Information and Communication Technology Tools in Physical Education Classes


Abstract
:1. Introduction
1.1. Self-Determination Theory and Motivation
1.2. Perceived Motivational Climate
1.3. Purpose of the Study and Hypotheses
2. Materials and Methods
2.1. Participants
2.2. Procedure
2.3. Measures
2.3.1. Motor Performance (20 m Shuttle Run Test)
2.3.2. Perceived Motivational Climate
2.3.3. Sport Motivational Scale
2.4. Data Analyses
3. Results
3.1. Learning Outcomes
3.2. Motivational Climate
3.3. Motivation
4. Discussion
5. Conclusions
Author Contributions
Funding
Institutional Review Board Statement
Informed Consent Statement
Data Availability Statement
Conflicts of Interest
References
- WHO/Europe. Physical Activity Strategy for the WHO European Region 2016–2025. Available online: https://www.euro.who.int/__data/assets/pdf_file/0010/282961/65wd09e_PhysicalActivityStrategy_150474.pdf (accessed on 11 July 2022).
- Rutkauskaite, R.; Koreivaite, M.; Karanauskiene, D.; Mieziene, B. Students’ Skills and Experiences Using Information and Communication Technologies in Remote Physical Education Lessons. Sustainability 2022, 14, 15949. [Google Scholar] [CrossRef]
- Proctor, M.; Moore, L.; Gao, D.; Cupples, L.A.; Bradlee, M.L.; Hood, M.Y.; Ellison, R.C. Television viewing and change in body fat from preschool to early adolescence: The Framingham Children’s Study. Int. J. Obes. 2003, 27, 827–833. [Google Scholar] [CrossRef] [PubMed]
- Ghekiere, A.; Van Cauwenberg, J.; Vandendriessche, A.; Inchley, J.; Gaspar de Matos, M.; Borraccino, A.; Gobina, I.; Tynjälä, J.; Deforche, B.; De Clercq, B. Trends in sleeping difficulties among European adolescents: Are these associated with physical inactivity and excessive screen time? Int. J. Public Health 2019, 64, 487–498. [Google Scholar] [CrossRef] [PubMed]
- O’ Brien, W.; Issartel, J.; Belton, S. Relationship between Physical Activity, Screen Time and Weight Status among Young Adolescents. Sports 2018, 23, 57. [Google Scholar] [CrossRef]
- Ladda, S.; Keating, T.; Adams, D.; Toscano, L. Including Technology in Instructional Programs. J. Phys. Educ. Recreat. Danc. 2004, 75, 12–13. [Google Scholar] [CrossRef]
- Dunn, L.; Tannehill, D. Using Pedometers to Promote Physical Activity in Secondary Physical Education. Strateg. A J. Phys. Sport. Educ. 2005, 19, 19–25. [Google Scholar] [CrossRef]
- McCaughtry, N.; Dillon, S.R.; Martin, J.J.; Oliver, K.L. Teachers’ Perspectives on the Use of Pedometers as Instructional Technology in Physical Education: A Cautionary Tale. J. Teach. Phys. Educ. 2008, 27, 83–99. [Google Scholar] [CrossRef]
- Charles, M.; Pangrazi, R.P.; Beighle, A. Using Pedometers to Promote Physical Activity in Physical Education. J. Phys. Educ. Recreat. Danc. 2013, 74, 33–38. [Google Scholar]
- Yang, Q.F.; Hwang, G.J.; Sung, H.Y. Trends and research issues of mobile learning studies in physical education: A review of academic journal publications. Interact. Learn. Environ. 2020, 28, 419–437. [Google Scholar] [CrossRef]
- Yu, H.; Hodges, P.H.; Lorenz, K.A. An integration of Mobile applications into physical education programs. Strategies 2018, 31, 13–19. [Google Scholar] [CrossRef]
- Böhm, B.; Karwiese, S.D.; Böhm, H.; Oberhoffer, R. Effects of mobile health including wearable activity trackers to increase physical activity outcomes among healthy children and adolescents: Systematic review. JMIR Mhealth Uhealth 2019, 7, e8298. [Google Scholar] [CrossRef] [PubMed]
- Vega-Ramírez, L.; Notario, R.O.; Ávalos-Ramos, M.A. The Relevance of Mobile Applications in the Learning of Physical Education. Educ. Sci. 2020, 10, 329. [Google Scholar] [CrossRef]
- Goodyear, V.A.; Armour, K.M. Young People’s health-related learning through social media: What do teachers need to know? Teach. Teach. Educ. 2021, 102, 103340. [Google Scholar] [CrossRef]
- Kerner, C.; Goodyear, V.A. The motivational impact of wearable healthy lifestyle technologies: A self-determination perspective on Fitbits with adolescents. Am. J. Health Educ. 2017, 48, 287–297. [Google Scholar] [CrossRef]
- Klenk, S.; Reifegerste, D.; Renatus, R. Gender differences in gratifications from fitness app use and implications for health interventions. Mob. Media Commun. 2017, 5, 178–193. [Google Scholar] [CrossRef]
- Phillips, A.; Rodenbeck, M.; Clegg, B. Apps for physical education: Teacher tested, kid approved: Column editor: Brent Heidorn. Strategies 2014, 27, 28–31. [Google Scholar] [CrossRef]
- Greve, S.; Thumel, M.; Jastrow, F.; Krieger, C.; Schwedler, A.; Süßenbach, J. The use of digital media in primary school PE – Student perspectives on product-oriented ways of lesson staging. Phys. Educ. Sport. Pedagog. 2022, 27, 43–58. [Google Scholar] [CrossRef]
- Gil-Espinosa, F.J.; Nielsen-Rodríguez, A.; Romance, R.; Burgueño, R. Smartphone applications for physical activity promotion from physical education. Educ. Inf. Technol. 2022, 27, 11759–11779. [Google Scholar] [CrossRef]
- Lee, J.E.; Gao, Z. Effects of the iPad and mobile application-integrated physical education on children’s physical activity and psychosocial beliefs. Phys. Educ. Sport. Pedagog. 2020, 25, 567–584. [Google Scholar] [CrossRef]
- Schwartz, B.; Baca, A. Wearables and apps—Modern diagnostic frameworks for health promotion through sport. Dtsch. Z Sport. Med. 2016, 67, 131–136. [Google Scholar] [CrossRef]
- Ferriz-Valero, A.; Østerlie, O.; García Martínez, S.; García-Jaén, M. Gamification in Physical Education: Evaluation of Impact on Motivation and Academic Performance within Higher Education. Int. J. Environ. Res. Public Health 2020, 17, 4465. [Google Scholar] [CrossRef] [PubMed]
- Quintas, A.; Bustamante, J.C. Effects of gamified didactic with exergames on the psychological variables associated with promoting physical exercise: Results of a natural experiment run in primary schools. Phys. Educ. Sport. Pedagog. 2021, 1–15. [Google Scholar] [CrossRef]
- Fernandez-Rio, J.; de las Heras, E.; González, T.; Trillo, V.; Palomares, J. Gamification and physical education. Viability and preliminary views from students and teachers. Phys. Educ. Sport. Pedagog. 2020, 25, 509–524. [Google Scholar] [CrossRef]
- Paic, R. Connection of Athlete-Coach Relationship, Motivation and Perceived Motivational Climate among Elite Male Handball Players. Ph.D. Thesis, University of Pécs, Pécs, Hungary, 2019. [Google Scholar]
- Deci, E.L.; Ryan, R.M. Intrinsic Motivation and Self-Determination in Human Behavior; Plenum Press: New York, NY, USA, 1985. [Google Scholar]
- Ryan, R.M.; Deci, E.L. Self-determination theory and the facilitation of intrinsic motivation, social development, and well-being. Am. Psychol. 2000, 55, 68–78. [Google Scholar] [CrossRef] [PubMed]
- Ryan, R.M.; Deci, E.L. Intrinsic and extrinsic motivations: Classic definitions and new directions. Contemp. Educ. Psychol. 2000, 25, 54–67. [Google Scholar] [CrossRef] [PubMed]
- Atkins, M.; Johnson, D.; Force, E.; Petrie, T. Peers, parents and coaches, oh my! The relation of the motivational climate to boys’ intention to continue in sport. Psychol. Sport. Exerc. 2015, 16, 170–180. [Google Scholar] [CrossRef]
- Chacón, R.; Zurita, F.; Castro, M.; Espejo, T.; Martínez, A.; Pérez, A.J. Motivational climate in sport and its relationship with digital sedentary leisure habits in university students. Saude Soc. 2017, 26, 29–39. [Google Scholar]
- Ntoumanis, N. Empirical Links between Achievement Goal Theory and Self-Determination Theory in Sport. J. Sport. Sci. 2001, 19, 397–409. [Google Scholar] [CrossRef]
- Ntoumanis, N. A self-determination approach to the understanding of motivation in physical education. Br. J. Educ. Psychol. 2001, 71, 225–242. [Google Scholar] [CrossRef]
- Brustad, R.J. Affective Outcomes in Competitive Youth Sport: The Influence of Interpersonal and Socialization Factors. J. Sport. Exerc. Psychol. 1988, 10, 307–321. [Google Scholar] [CrossRef]
- Scanlan, T.K.; Lewthwaite, R. Social psychological aspects of competition for male youth sport participants: I. Predictors of competitive stress. J. Sport. Psychol. 1984, 7, 25–35. [Google Scholar] [CrossRef]
- Wong, E.H.; Bridges, L.J. A model of motivational orientation for youth sport: Some preliminary work. Adolescence 1995, 30, 437–452. [Google Scholar] [PubMed]
- Lindner, K.J.; Johns, D.P.; Butcher, J. Factors in withdrawal from youth sport: A proposed model. J. Sport. Behav. 1991, 14, 3–18. [Google Scholar]
- Keegan, R.; Spray, C.M.; Harwood, C.; Lavallee, D. The motivational atmosphere in youth sport: Coach, parent and peer influences on motivation in specializing sport participants. J. Appl. Sport. Psychol. 2010, 22, 87–105. [Google Scholar] [CrossRef]
- Berghe, L.; Vansteenkiste, M.; Cardon, G.; Kirk, D.; Haerens, L. Research on Self-determination in Physical Education: Key Findings and Proposals for Future Research. Phys. Educ. Sport Pedagog. 2014, 19, 97–121. [Google Scholar] [CrossRef]
- Fernández-Rio, J.; Méndez-Giménez, A.; Cecchini Estrada, J.A. A cluster analysis on students’ perceived motivational climate. Implications on psycho-social variables. Span. J. Psychol. 2014, 17, E18. [Google Scholar] [CrossRef]
- Wang, J.C.; Liu, W.C.; Chatzisarantis, N.L.; Lim, C.B. Influence of Perceived Motivational Climate on Achievement Goals in Physical Education: A Structural Equation Mixture Modeling Analysis. J. Sport. Exerc. Psychol. 2010, 32, 324–338. [Google Scholar] [CrossRef]
- Henriksen, P.W.; Rayce, S.B.; Melkevik, O.; Due, P.; Holstein, B.E. Social background, bullying and physical inactivity. National study of 11 to 15 year olds. Scand. J. Med. Sci. Sport. 2016, 26, 1249–1255. [Google Scholar] [CrossRef]
- Ames, C.; Archer, J. Achievement goals in the classroom: Students’ learning strategies and motivation. J. Educ. Psychol. 1988, 80, 260–267. [Google Scholar] [CrossRef]
- Duda, J.L.; Whitehead, J. Measurement of goal perspectives in the physical domain. In Advances in Sport and Exercise Psychology Measurment, 1st ed.; Duda, J.L., Ed.; WV Fitness Information Technology: Morgantown, WV, USA, 1998. [Google Scholar]
- Biddle, S.J.H.; Soos, I.; Chatzisarantis, N. Predicting Physical Activity Intentions Using a Goal Perspective Approach: A Study of Hungarian Youth. Scand. J. Med. Sci. Sport. 1999, 9, 353–357. [Google Scholar] [CrossRef]
- Gonçalves, C.E.; Coelho, M.J.; Cruz, J.; Torregrosa, M.; Cumming, S. The effect of achievement goals on moral attitudes in young athletes. J. Sport. Sci. Med. 2010, 9, 605–611. [Google Scholar]
- Jaakkola, T.; Ntoumanis, N.; Liukkonen, J. Motivational climate, goal orientation, perceived sport ability, and enjoyment within Finnish junior ice hockey players. Scand. J. Scand. J. Med. Sci. Sport. 2016, 26, 109–115. [Google Scholar] [CrossRef] [PubMed]
- Spray, C.M.; Wang, C.K.J. Goal Orientations, Self-Determination and Pupils’ Discipline in Physical Education. J. Sport. Sci. 2001, 19, 903–913. [Google Scholar] [CrossRef] [PubMed]
- Van den Berghe, L.; Soenens, B.; Vansteenkiste, M.; Aelterman, N.; Cardon, G.; Tallir, I.B.; Haerens, L. Observed need-supportive and need-thwarthing teaching behavior in physical education: Do teachers’ motivational orientations matter? Psychol. Sport. Exerc. 2013, 14, 650–661. [Google Scholar] [CrossRef]
- Litalien, D.; Morin, A.J.; Mclnerney, D.M. Achievement goal profile among adolescent males and females. Dev. Psychol. 2017, 53, 731–751. [Google Scholar] [CrossRef]
- Erturan-Ilker, G.; Yu, C.; Alemdaroğlu, U.; Köklü, Y. Basic psychological needs and self-determined motivation in PE to predict health-related fitness level. J. Sport. Health Res. 2018, 10, 91–100. [Google Scholar]
- Keegan, R.J.; Harwood, C.G.; Spray, C.M.; Lavallee, D. A qualitative investigation of the motivational climate in elite sport. Psychol. Sport. Exerc. 2014, 15, 97–107. [Google Scholar] [CrossRef]
- Newton, M.; Duda, J.L.; Yin, Z. Examination of the psychometric properties of the Perceived Motivational Climate is Sport Questionnaire. J. Sport. Sci. 2000, 18, 275–290. [Google Scholar] [CrossRef]
- Ortega, F.Z.; Sánchez, M.R.; Ramón Cuberos, C.; Zagalaz, J.C.; Bolados, C.C.; Knox, E.; Muros, J. Analysis of the Psychometric Properties of Perceived Motivational Climate in Sport Questionnaire and Its Relationship to Physical Activity and Gender Using Structural Equation Modelling. Sustainability 2018, 10, 632. [Google Scholar] [CrossRef]
- Revesz, L.; Biro, M.; Csaki, I.; Horvath, T.; Patocs, A.; Kallay, E.; Balazsi, R.; Toth, L. The Hungarian Adaptation of the Perceived Motivational Climate in Sport Questionnaire-2 (H-PMCSQ-2). Cogn. Brain Behavior. Interdiscip. J. 2014, 18, 175–190. [Google Scholar]
- Pelletier, L.G.; Fortier, M.S.; Vallerand, R.J.; Tuson, K.M.; Brière, N.M.; Blais, M.R. Toward a new measure of intrinsic motivation, extrinsic motivation, and amotivation in sports: The Sport Motivation Scale (SMS). J. Sport. Exerc. Psychol. 1995, 17, 35–53. [Google Scholar] [CrossRef]
- Tsang, E.C.K.; Szabo, A.; Soos, I.; Bute, P. A study of cultural differences in motivational orientations towards sport participation of junior secondary school children in four cultures. J. Phys. Educ. Recreat. 2005, 11, 44–50. [Google Scholar] [CrossRef]
- Gliner, J.A.; Morgan, G.A.; Leech, N.L. Research Methods in Applied Settings: An Integrated Approach to Design and Analysis, 3rd ed.; Routledge/Taylor & Francis: New York, NY, USA, 2017. [Google Scholar]
- de Winter, J.C.F.; Dodou, D. Five-Point Likert Items: T test versus Mann-Whitney-Wilcoxon. Pract. Assess. Res. Eval. 2010, 15, 1–12. [Google Scholar]
- Legrain, P.; Gillet, N.; Gernigon, C.; Lafrenier, M. Integration of Information and Communication Technology and Pupils’ Motivation in a Physical Education Setting. J. Teach. Phys. Educ. 2015, 34, 384–401. [Google Scholar] [CrossRef]
- Park, N.; Kim, Y.C.; Shon, H.Y.; Shim, H. Factors influencing smartphone use and dependency in South Korea. Comput. Hum. Behav. 2013, 29, 1763–1770. [Google Scholar] [CrossRef]
- Ada, E.N.; Çetinkalp, Z.K.; Altiparmak, M.; Asci, F. Flow Experiences in Physical Education Classes: The Role of Perceived Motivational Climate and Situational Motivation. Asian J. Educ. Train. 2018, 4, 114–120. [Google Scholar] [CrossRef]
- Portela-Pino, I.; López-Castedo, A.; Martínez-Patiño, M.J.; Valverde-Esteve, T.; Domínguez-Alonso, J. Gender Differences in Motivation and Barriers for The Practice of Physical Exercise in Adolescence. Int. J. Environ. Res. Public Health 2019, 17, 168. [Google Scholar] [CrossRef] [Green Version]
- Ntoumanis, N. Motivational clusters in a sample of British physical education classes. Psychol. Sport Exerc. 2002, 3, 177–194. [Google Scholar] [CrossRef]
- Baena-Extremera, A.; Granero-Gallegos, A.; Perez-Quero, F.J.; Bracho-Amador, C.; Sanchez-Fuentes, J.A. Motivation and Motivational climate as predictors of perceived importance of physical education in Spain. S. Afr. J. Res. Sport Phys. Educ. Recreat. 2013, 35, 1–13. [Google Scholar]
- Manninen, M.; Campbell, S. The effect of the Sport Education Model on basic needs, intrinsic motivation and prosocial attitudes: A systematic review and multilevel meta-analysis. Eur. Phys. Educ. Rev. 2022, 28, 78–99. [Google Scholar] [CrossRef]
- Varga, A.; Révész, L. Digital Physical Education: Illusion or Reality? Examining the specifics of the use of ICT tools by physical education teachers. Inf. Soc. 2023, 1. in press. [Google Scholar]
- Mosston, M.; Ashworth, S. Teaching Physical Education, 1st ed.; Pearson Education: London, UK, 2008. [Google Scholar]


| Group | Pre-Test (20 m Shuttle Run Test in Meters) | Post-Test (20 m Shuttle Run Test in Meters) | Pre-and Post-Test Difference (in Meters) | Sig. |
|---|---|---|---|---|
| M ± SD | M ± SD | |||
| Test group 1 | 726.15 ± 448.27 | 843.85 ± 471.01 | 117.69 | * 0.04 |
| Test group 2 | 529.41 ± 267.43 | 614.71 ± 303.52 | 85.29 | * 0.00 |
| Control group | 510.40 + −264.77 | 512.80 ± 277.60 | 2.4 | 0.07 |
| Group | Pre-Test (20 m Shuttle Run Test in Meters) | F | Sig | T | Post-Test (20 m Shuttle Run Test in Meters) | Pre-and Post-Test Difference (in Meters) | F | Sig. | T |
|---|---|---|---|---|---|---|---|---|---|
| M ± SD | M ± SD | ||||||||
| Test group 1 | 726.15 ± 448.27 | 12.43 | * 0.03 | 2.11 | 843.85 ± 471.01 | 117.69 | 7.17 | * 0.02 | 2.28 |
| Test group 2 | 529.41 ± 267.43 | 614.71 ± 303.52 | 85.29 |
| Group | Sex | Run 1 | Run 2 | Run 3 | Run 4 | Run 5 | ||||||||||
|---|---|---|---|---|---|---|---|---|---|---|---|---|---|---|---|---|
| 10′ | 12′ | 15′ | 10′ | 12′ | 15′ | 10′ | 12′ | 15′ | 10′ | 12′ | 15′ | 10′ | 12′ | 15′ | ||
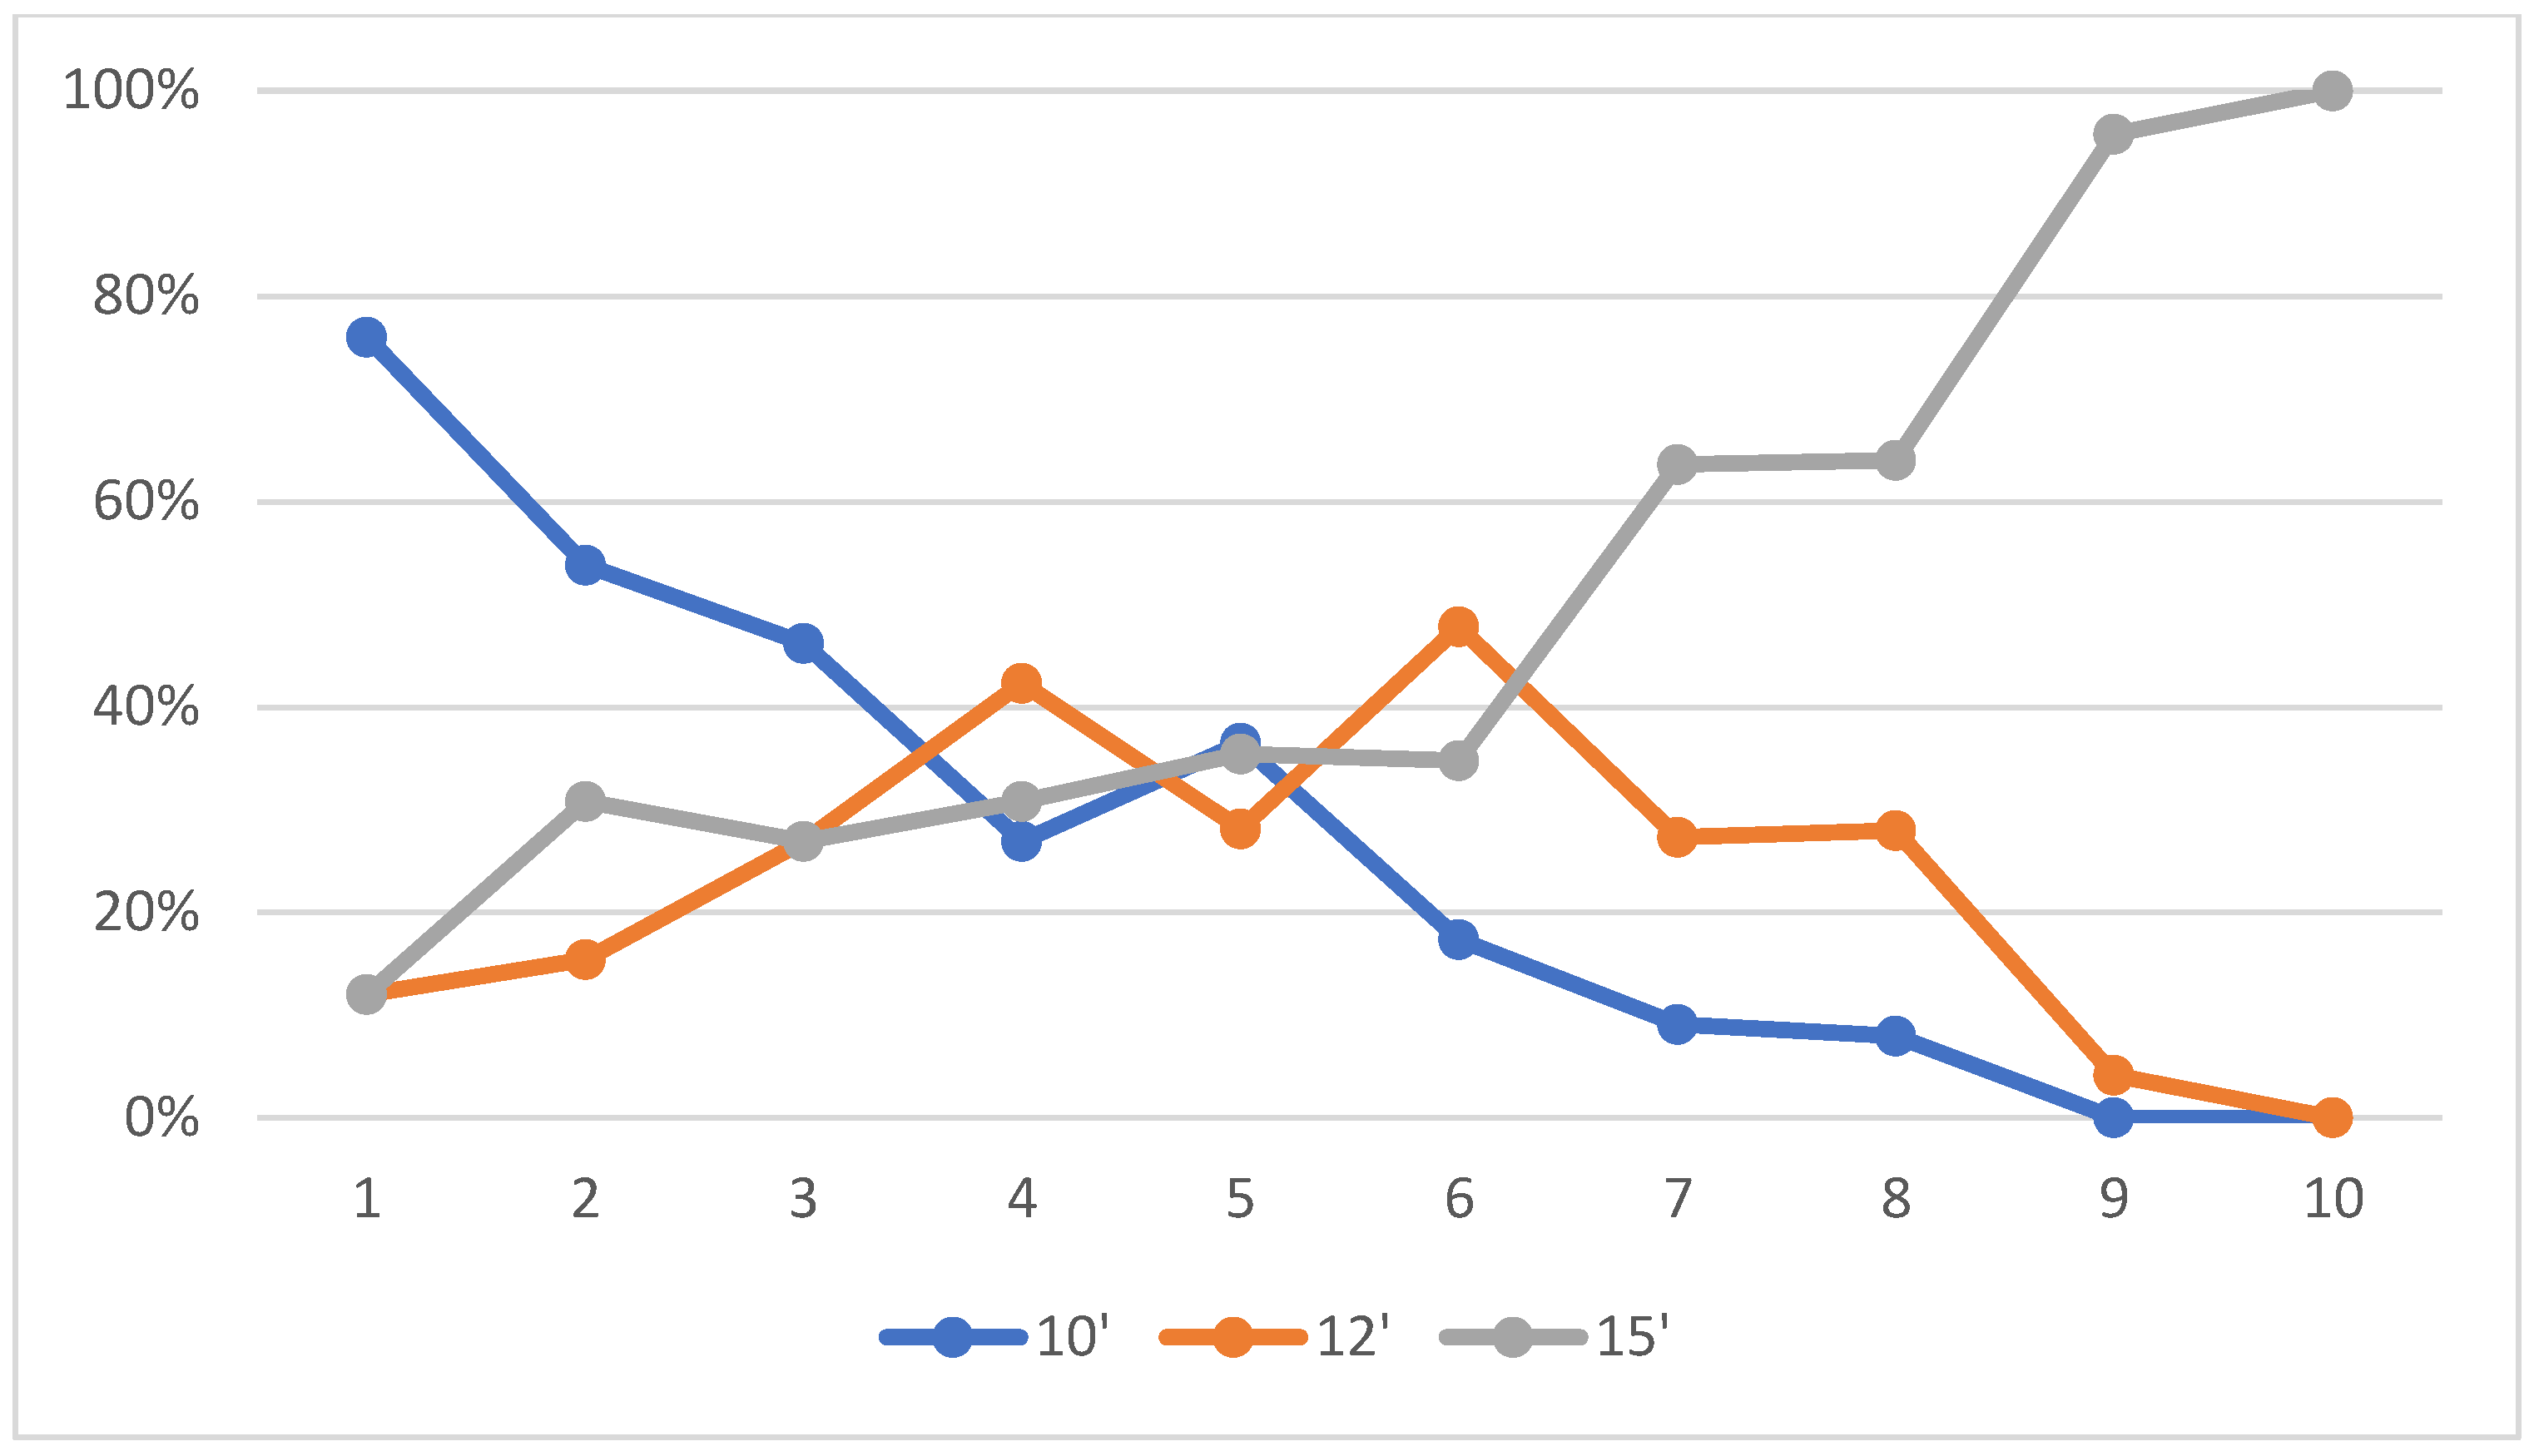
| Test group 1 | Avg. | 76 | 12 | 12 | 53.8 | 15.4 | 30.8 | 46.2 | 26.9 | 26.9 | 26.9 | 42.3 | 30.8 | 56.8 | 13.2 | 29.9 |
| Male | 66.7 | 16.7 | 16.6 | 38.5 | 23.1 | 38.4 | 53.8 | 30.8 | 15.4 | 30.8 | 30.8 | 38.4 | 63.6 | 18.2 | 18.2 | |
| Female | 84.6 | 7.7 | 7.7 | 69.2 | 7.7 | 23.1 | 38.5 | 23.1 | 38.4 | 23.1 | 53.8 | 23.1 | 50 | 8.3 | 41.7 | |
| Test group 2 | Avg. | 73 | 27 | 0 | 100 | 0 | 0 | 96.6 | 3.4 | 0 | 100 | 0 | 0 | 100 | 0 | 0 |
| Male | 50 | 50 | 0 | 100 | 0 | 0 | 80 | 20 | 0 | 100 | 0 | 0 | 100 | 0 | 0 | |
| Female | 96 | 4 | 0 | 100 | 0 | 0 | 100 | 0 | 0 | 100 | 0 | 0 | 100 | 0 | 0 | |
| Run 6 | Run 7 | Run 8 | Run 9 | Run 10 | ||||||||||||
| 10′ | 12′ | 15′ | 10′ | 12′ | 15′ | 10′ | 12′ | 15′ | 10′ | 12′ | 15′ | 10′ | 12′ | 15′ | ||
| Test group 1 | Avg. | 15.3 | 48.1 | 36.5 | 9.1 | 27.3 | 63.6 | 8 | 28.2 | 63.7 | 0 | 3.8 | 96.1 | 0 | 0 | 100 |
| Male | 30.7 | 46.2 | 23.1 | 9.1 | 18.2 | 72.7 | 7.7 | 23.1 | 69.2 | 0 | 7.7 | 92.3 | 0 | 0 | 100 | |
| Female | 0 | 50 | 50 | 9.1 | 36.4 | 54.5 | 8.4 | 33.3 | 58.3 | 0 | 0 | 100 | 0 | 0 | 100 | |
| Test group 2 | Avg. | 87.5 | 12.5 | 0 | 90 | 10 | 0 | 100 | 0 | 0 | 100 | 0 | 0 | 100 | 0 | 0 |
| Male | 75 | 25 | 0 | 80 | 20 | 0 | 100 | 0 | 0 | 100 | 0 | 0 | 100 | 0 | 0 | |
| Female | 100 | 0 | 0 | 100 | 0 | 0 | 100 | 0 | 0 | 100 | 0 | 0 | 100 | 0 | 0 | |
| Pre-Test M ± SD | Post-Test M ± SD | Sig. | |
|---|---|---|---|
| TASK | 3.19 ± 1.18 | 3.53 ± 1.18 | * 0.00 |
| Cooperative learning | 2.92 ± 1.22 | 3.32 ± 1.15 | * 0.02 |
| Important role | 2.93 ± 1.18 | 3.16 ± 1.28 | 0.09 |
| Effort/improvement | 3.52 ± 1.08 | 3.92 ± 1.01 | * 0.00 |
| EGO | 2.47 ± 1.31 | 2.37 ± 1.24 | 0.16 |
| Punishment for mistakes | 2.07 ± 1.26 | 2.10 ± 1.21 | 0.82 |
| Unequal recognition | 2.63 ± 1.31 | 2.31 ± 1.21 | * 0.01 |
| Intra-team member rivalry | 2.93 ± 1.18 | 3.16 ± 1.28 | 0.95 |
| Pre-Test M ± SD | Post-Test M ± SD | Sig. | |
|---|---|---|---|
| TASK | 3.02 ± 1.23 | 3.06 ± 1.15 | 0.55 |
| Cooperative learning | 2.79 ± 1.08 | 2.88 ± 1.07 | 0.49 |
| Important role | 2.54 ± 1.19 | 2.66 ± 1.13 | 0.25 |
| Effort/improvement | 3.49 ± 1.16 | 3.44 ± 1.10 | 0.55 |
| EGO | 2.26 ± 1.19 | 2.56 ± 1.18 | * 0.00 |
| Punishment for mistakes | 2.04 ± 1.16 | 2.26 ± 1.09 | * 0.03 |
| Unequal recognition | 2.27 ± 1.18 | 2.66 ± 1.19 | * 0.00 |
| Intra-team member rivalry | 2.67 ± 1.18 | 2.91 ± 1.20 | 1.38 |
| SMS Scale | Pre-Test | Post-Test | p |
|---|---|---|---|
| M ± SD | M ± SD | ||
| Extrinsic motivation | 2.89 ± 0.63 | 2.91 ± 0.57 | 0.93 |
| Intrinsic motivation | 2.79 ± 0.43 | 3.00 ± 0.50 | * 0.01 |
| Amotivation | 2.73 ± 0.53 | 2.76 ± 0.58 | 0.85 |
| SMS Scale | Pre-Test | Post-Test | p |
|---|---|---|---|
| Sum | Sum | ||
| Extrinsic motivation | 2.58 ± 0.42 | 2.74 ± 0.47 | 0.12 |
| Intrinsic motivation | 2.86 ± 0.45 | 2.72 ± 0.37 | 0.13 |
| Amotivation | 2.35 ± 0.56 | 2.62 ± 0.51 | * 0.04 |
Disclaimer/Publisher’s Note: The statements, opinions and data contained in all publications are solely those of the individual author(s) and contributor(s) and not of MDPI and/or the editor(s). MDPI and/or the editor(s) disclaim responsibility for any injury to people or property resulting from any ideas, methods, instructions or products referred to in the content. |
© 2023 by the authors. Licensee MDPI, Basel, Switzerland. This article is an open access article distributed under the terms and conditions of the Creative Commons Attribution (CC BY) license (https://creativecommons.org/licenses/by/4.0/).
Share and Cite
Varga, A.; Révész, L. Impact of Applying Information and Communication Technology Tools in Physical Education Classes. Informatics 2023, 10, 20. https://doi.org/10.3390/informatics10010020
Varga A, Révész L. Impact of Applying Information and Communication Technology Tools in Physical Education Classes. Informatics. 2023; 10(1):20. https://doi.org/10.3390/informatics10010020
Chicago/Turabian StyleVarga, Attila, and László Révész. 2023. "Impact of Applying Information and Communication Technology Tools in Physical Education Classes" Informatics 10, no. 1: 20. https://doi.org/10.3390/informatics10010020