1. Introduction
In the process of integration into the global economy, the development of Vietnam’s financial markets is unavoidable. Financial markets are expected to offer many attractive channels of capital mobilization, as well as a wide variety of investments with considerably variable risks. Financial markets will necessarily provide great incentives for the relevant national agencies to improve the underlying legal framework in order to promote sustainable development of the economy and to strengthen the trust of financial investors.
Based on the Resolution of the 11th Congress of the Communist Party of Vietnam on Orientation and Solutions for Development of Major Economic Industries to 2020, the Vietnam Government has devoted considerable attention to investing in four key industries, specifically energy, services, food, and telecommunications. However, this focus should not be interpreted as drawing attention from the development of other industries in the process of national economic growth and development.
In order to make optimal financial decisions, investors need to consider the risk levels of stocks compared with other financial assets in the same industry, as well as stocks in competing industries, and in the market overall. Each investor needs to determine the risk levels of stocks and industries for diversifying their portfolios in order to minimize the risks, given expected returns. Estimating risks for various stocks and industries is an important and essential tool for investors to improve investment efficiency and to achieve optimal outcomes through efficient hedging of financial portfolios.
Some attempts have been found in empirical studies in the context of measuring risk in Vietnam, but they have focused solely on the banking system. The literature review in the following section shows that no attempts seem to have been made to estimate market risk for industries, using a combination of two widely used risk measures, namely Value-at-Risk (VaR) and Conditional Value-at-Risk (CVaR), in the context of Vietnam.
For this reason, the present paper provides empirical evidence in relation to the market risks of the major industries in Vietnam, and their ranking over the last decade since the national stock markets were established in Hanoi and Ho Chi Minh City.
The primary purpose of the paper is to estimate market risk for the major industries in Vietnam. The focus is on the Energy sector, which has been designated as one of the four key industries, together with services, food, and telecommunications, targeted for economic development by the Vietnam Government through to 2020. The oil and gas industry is a separate energy-related major industry. The data set is from 2009 to 2017 and is decomposed into two distinct sub-periods after the Global Financial Crisis (GFC), namely the immediate post-GFC (2009–2011) period and the normal (2012–2017) period, in order to identify the behavior of market risk for the major industries in Vietnam.
The remainder of the paper is structured as follows. A discussion of the key risk measures, namely the VaR and CVaR approaches, is given in
Section 2, followed by a summary of the relevant empirical studies worldwide.
Section 3 presents the data, and the empirical findings are evaluated in
Section 4. Some concluding comments and policy implications are reported in
Section 5.
2. Literature Review
2.1. Value-at-Risk (VaR) and Conditional Value-at-Risk (CVaR)
Many methods have been used for assessing and estimating the level of market risk for an industry. Of the numerous methods for the purpose of measuring risk, Value-at-Risk (VaR) is one of the fundamental and key approaches for this purpose. It is assumed that market movements are normal, and there are no portfolio transaction costs. An index with a given probability and intervals, VaR, is considered to be a threshold where the likelihood of a loss over the market-adjusted value of the index over a given time period exceeds the value at the given probability level.
It is generally agreed that the greatest attraction of VaR is that it represents risk in the form of a single number or index. VaR is defined as the maximum amount a portfolio can lose at a certain level of confidence, typically 95%. For a comparison of VaR and Expected Shortfall as alternative measures of risk under the Basel III Accord, using Stochastic Dominance (see
Chang et al. 2019). For continuous distributions, this measure is also is known as CVaR (for further details, see
Acerbi and Tasche 2001;
Krokhmal et al. 2002).
Although it is well-known and widely used, VaR has a number of disadvantages.
Artzner et al. (
1997,
1999) proposed that VaR contained inconvenient mathematical attributes, such as lack of surplus and convexity. In addition, the authors also argued that VaR is based on the assumption of a distribution that is in proportion to the standard deviation.
McKay and Keefer (
1996) and
Mausser and Rosen (
1999) discuss the practical case whereby VaR is calculated on the basis of a combination of portfolios, which might outperform the overall risk of an individual portfolio.
These authors also emphasize that an unresolved problem with VaR is that it can be difficult to optimize when the level of market risk is computed under various scenarios. This view is based on the argument that the function of a positional portfolio may exhibit multiple local extrema, which incorporates uncertainty in determining the set of optimal possibilities and the overall value of VaR.
Conditional Value-at-Risk (CVaR) is considered to be a more effective alternative measure and estimate of the level of market risk in comparison with VaR. CVaR can be used to measure a conditional marginal value that is beyond the possibility of the VaR approach.
Allen and Powell (
2007) considered CVaR as a substitute for VaR in measuring market and credit risks. In a similar vein,
Pflug (
2000) demonstrated that CVaR is a rigorous risk measure which incorporates many desirable attributes, such as convexity and monotonicity, which are two inherent properties that are not properties of the VaR approach.
Furthermore, VaR does not represent the probable loss range, except for the first threshold value. In contrast, CVaR determines the number of losses that may be encountered in the tail distribution.
Rockafellar and Uryasev (
2002) analyzed CVaR for portfolio optimization problems and provided evidence that CVaR was more effective than VaR for practical purposes.
In addition,
Krokhmal et al. (
2002) conducted a case study on optimizing portfolios with CVaR constraints and concluded that CVaR risk management constraints, which are based on linear programming techniques, can be used in various applications, to provide bound on the percentiles of the loss distributions.
In practice, the Basel Accord regulations require the amount of capital to be retained in the banking system to be calculated on a daily basis. According to the regulations, the VaR approach is a highly recommended tool for calculating the amount of capital that must be retained by commercial banks and other deposit-taking financial institutions against potential losses on a daily basis. As previously discussed, VaR measures the potential loss over a given period of time for a given level of confidence (that is, reliability).
The retention of adequate funds by commercial banks to accommodate expected financial losses on a daily basis is intended to offset the chances of bankruptcy. The amount of capital reserves is intended to be sufficient for the bank to accommodate abnormal occurrences. In addition, accurate estimation of the level of reserves that are not in excess of the required level can help banks to enhance their financial performance.
According to
Allen et al. (
2012), there are three main methods for undertaking VaR measurements:
- (i)
Parametric,
- (ii)
Historical,
- (iii)
Monte Carlo Simulations.
While the parametric approach assumes that the rates of return and risk follow a particular distribution (such as normal), the historical methods use no such assumptions and use the actual observations of returns. Monte Carlo Simulations generate random numbers (and returns) that are based on predetermined indicators.
VaR determines the maximum loss value for a given period of time associated with a predetermined level of confidence. However, VaR does not present any other possible losses other than the specified VaR.
Prodyot et al. (
2005) criticize VaR risk measurement because it did not measure the losses in the tails of the distribution. CVaR overcomes this problem by measuring the distribution losses in the tails, as the key purpose in using CVaR is to measure the earnings that exceed the expected daily financial losses.
For example, if VaR is measured at the 95% confidence level, CVaR(
α) is an average of the worst 5% of the returns (
α = 0.05). CVaR is usually calculated as a percentage. For example, 0.01 CVaR daily at a 95% confidence level means that the loss should not exceed an average of 1% in the worst 5% of cases. CVaR has been used in a wide range of optimization (
Alexander et al. 2003;
Bird et al. 2013), risk management, and optimization (
Sarykalin et al. 2008) problems.
Boubaker and Sghaier (
2013) studied CVaR in simulations of the dependence structure between financial assets, the adequacy of bank capital (
Allen et al. 2016), and risk analysis during financial crises (
Allen et al. 2012;
Toque and Terraza 2014).
2.2. Empirical Analysis
Various papers have attempted to estimate the market risk level by using the VaR and CVaR methods concurrently.
Powell et al. (
2017) categorized the S&P Goldman Sachs Commodity Index into groups and used the modified CVaR method to assess the level of risk in particular periods, as classified according to GDP growth. The findings from this empirical study indicate that there are marked differences in the levels of risk for the various commodities for a variety of sub-samples.
Adesi (
2016) used the VaR and CVaR methods to examine options prices. The empirical results showed that when the measurement method changed, the estimates from CVaR were less sensitive than those arising from VaR.
Valecký (
2012) used a mixture of normal distribution VaR to estimate the market risk of four European market portfolios (namely, the Vienna Stock Exchange Austrian Traded Index—ATX, Deutsche Boerse AG German Stock Index—DAX, Financial Times Stock Exchange 100 Index—FTSE 100, and Prague Stock Exchange Index—PX). The empirical outcomes showed that, with higher reliability, the VaR figure estimated by the Markov-switching normal distribution provided more accurate estimates than did the other distributions.
Allen et al. (
2012) examined the relationship between market and credit risk of European industries, using VaR, CVaR, and the KMV/Merton methods. The empirical findings indicated that the telecommunication and information technology industry was one of the highest-risk industries in the pre-GFC period. However, during the GFC, the financial and consumer discretionary industries were found to be among the highest-risk industries.
Kourouma et al. (
2010) examined VaR and expected shortfall, using two methodologies, namely the nonparametric historical simulation method and the extreme value theory (EVT), using Standard & Poor’s Aggregate 500 Index (S&P500), Cotation Assistée en Continu—French stock market index (CAC 40), and Wheat and Crude oil indexes, during the GFC. The empirical results showed that unconditional VaR was not as effective as the conditional models were. Overall, the conditional EVT model provided more accurate and reliable outcomes in predicting property losses as compared with the historical simulation approach.
Allen and Powell (
2007) analyzed the market risk of industries in Australia, using VaR and CVaR, and measured credit risk, using the KMV/Merton model. The empirical results showed that the technology industry had high risk. Meanwhile, both models showed a significant association among the industry rankings over a period of seven years.
Harmantzis et al. (
2006) compared the performance of VaR and Expected Shortfall by examining the daily returns of popular indices and currencies from 1990 to 2003. The empirical results indicated that, for a 95% level of confidence, the impact of window size on performance was not determined, while the reliability was more pronounced at the 99% level of confidence.
Moreover, non-fat-tailed models can predict risk less accurately than their fat-tailed counterparts.
Allen and Powell (
2007) argued that CVaR is actually considered as a VaR equivalent method for measuring market and credit risks.
Rockafellar and Uryasev (
2002) used CVaR for portfolio optimization problems and provided empirical evidence to support the view that CVaR is more effective than VaR. Moreover, it was found that CVaR could be reduced efficiently, using linear programming and non-smooth optimization techniques.
Chang et al. (
2019) use stochastic dominance to order distributions in terms of welfare and portfolio selection, using VaR and Expected Shortfall. “Welfare costs” of the Basel III reforms, in terms of capital requirements and penalties, are a central concern for risk managers and regulators. A uniform ranking analysis based on stochastic dominance is provided as an effective tool for comparing distributions of daily capital requirement charges that can be produced under different regulations.
The striking empirical results suggested that Expected Shortfall should be preferred by risk averse policy makers, who favor larger but less volatile capital requirements. Moreover, the findings showed reductions in the sensitivity of capital charges to changes in the probability of default.
3. Data and Methodology
This section estimates the levels of market risk for the ten major industries in Vietnam, namely banking, education, energy, food, oil and gas, pharmaceutical, real estate, securities, services, and telecommunications. Of the ten industries, four specific key sectors, services, energy, telecommunications, and food, will receive particular attention in the empirical analysis, because they are targeted industries by the Vietnam Government in the national economic strategy through to 2020.
The data for each industry cover the nine-year period from 2009 (the first year when relevant data became available) through to 2017, and were collected from a financial website at
http://cophieu68.vn. The end-of-day values of stocks were collected for the sample period, to calculate portfolio risk according to the different industries.
Among various methods for calculating VaR, as previously presented, a parametric approach used by RiskMetrics (J.P. Morgan and Reuters) (see
Gupton et al. 1997) was used in the empirical analysis. In the parametric approach, it is hypothesized that the rates of return and risk follow the standard normal distribution, with known parameters.
McNeil et al. (
2005) mentioned the parametric VaR formula, as given below:
where μ indicates the mean and σ
2 represents the variance of the portfolio; Φ denotes the standard normal df; Φ
−1(α) is the
α-quantile of Φ; and φ is the density of the standard normal distribution.
Applying the formulae given above, in the empirical analysis, for purposes of simplicity in calculation, the following procedure is conducted: First, the current value, V
0, of the portfolio is calculated. Second, the expected rate of return µ and the deviation of the squared yield of the portfolio, σ, is estimated. Third, VaR is determined by the following expression:
For simplicity, VaR is calculated in terms of percentages rather than absolute values. It is noted that the parametric CVaR is calculated by the average returns beyond the parametric VaR. This practice follows the approach adopted in various studies, such as
Allen et al. (
2012) and
Powell et al. (
2017), among others:
It is generally agreed that the GFC impacted the world, including Vietnam, in October 2008. The following empirical analysis does not examine the levels of market risk of the ten major industries in Vietnam prior to and during the GFC (2007–2009), as the lack of available data precludes such an analysis.
Consequently, the change of the market risk levels of the major industries in Vietnam are considered for two distinct periods: (i) the recovery period, which includes the 2009–2011 (or immediate post-GFC) period; and (ii) the normal phrase, after the immediate recovery period, 2012–2017. Although somewhat arbitrary, the distinction between the two periods is expected to shed light on the policies and investment decisions in relation to any consideration of the different levels of market risk over time.
4. Empirical Results
Daily VaR and CVaR (both at the 95% confidence level) of ten major industries for the full sample period, 2009–2017, are presented in
Table 1. The average value of VaR in the period of 2009–2017 varies from 2.04 (pharmaceutical industry) to 3.18 (Oil and Gas industry). Meanwhile, CVaR varies from 2.90 to 4.49. An alternative approach to establishing confidence intervals around the VaR estimator is to report confidence intervals to convey the estimation error. In many practical applications, the estimation errors for the low quantiles of a return distribution is quite high when purely empirical techniques are used. As such, the parametric model-based approach is generally used in empirical analysis.
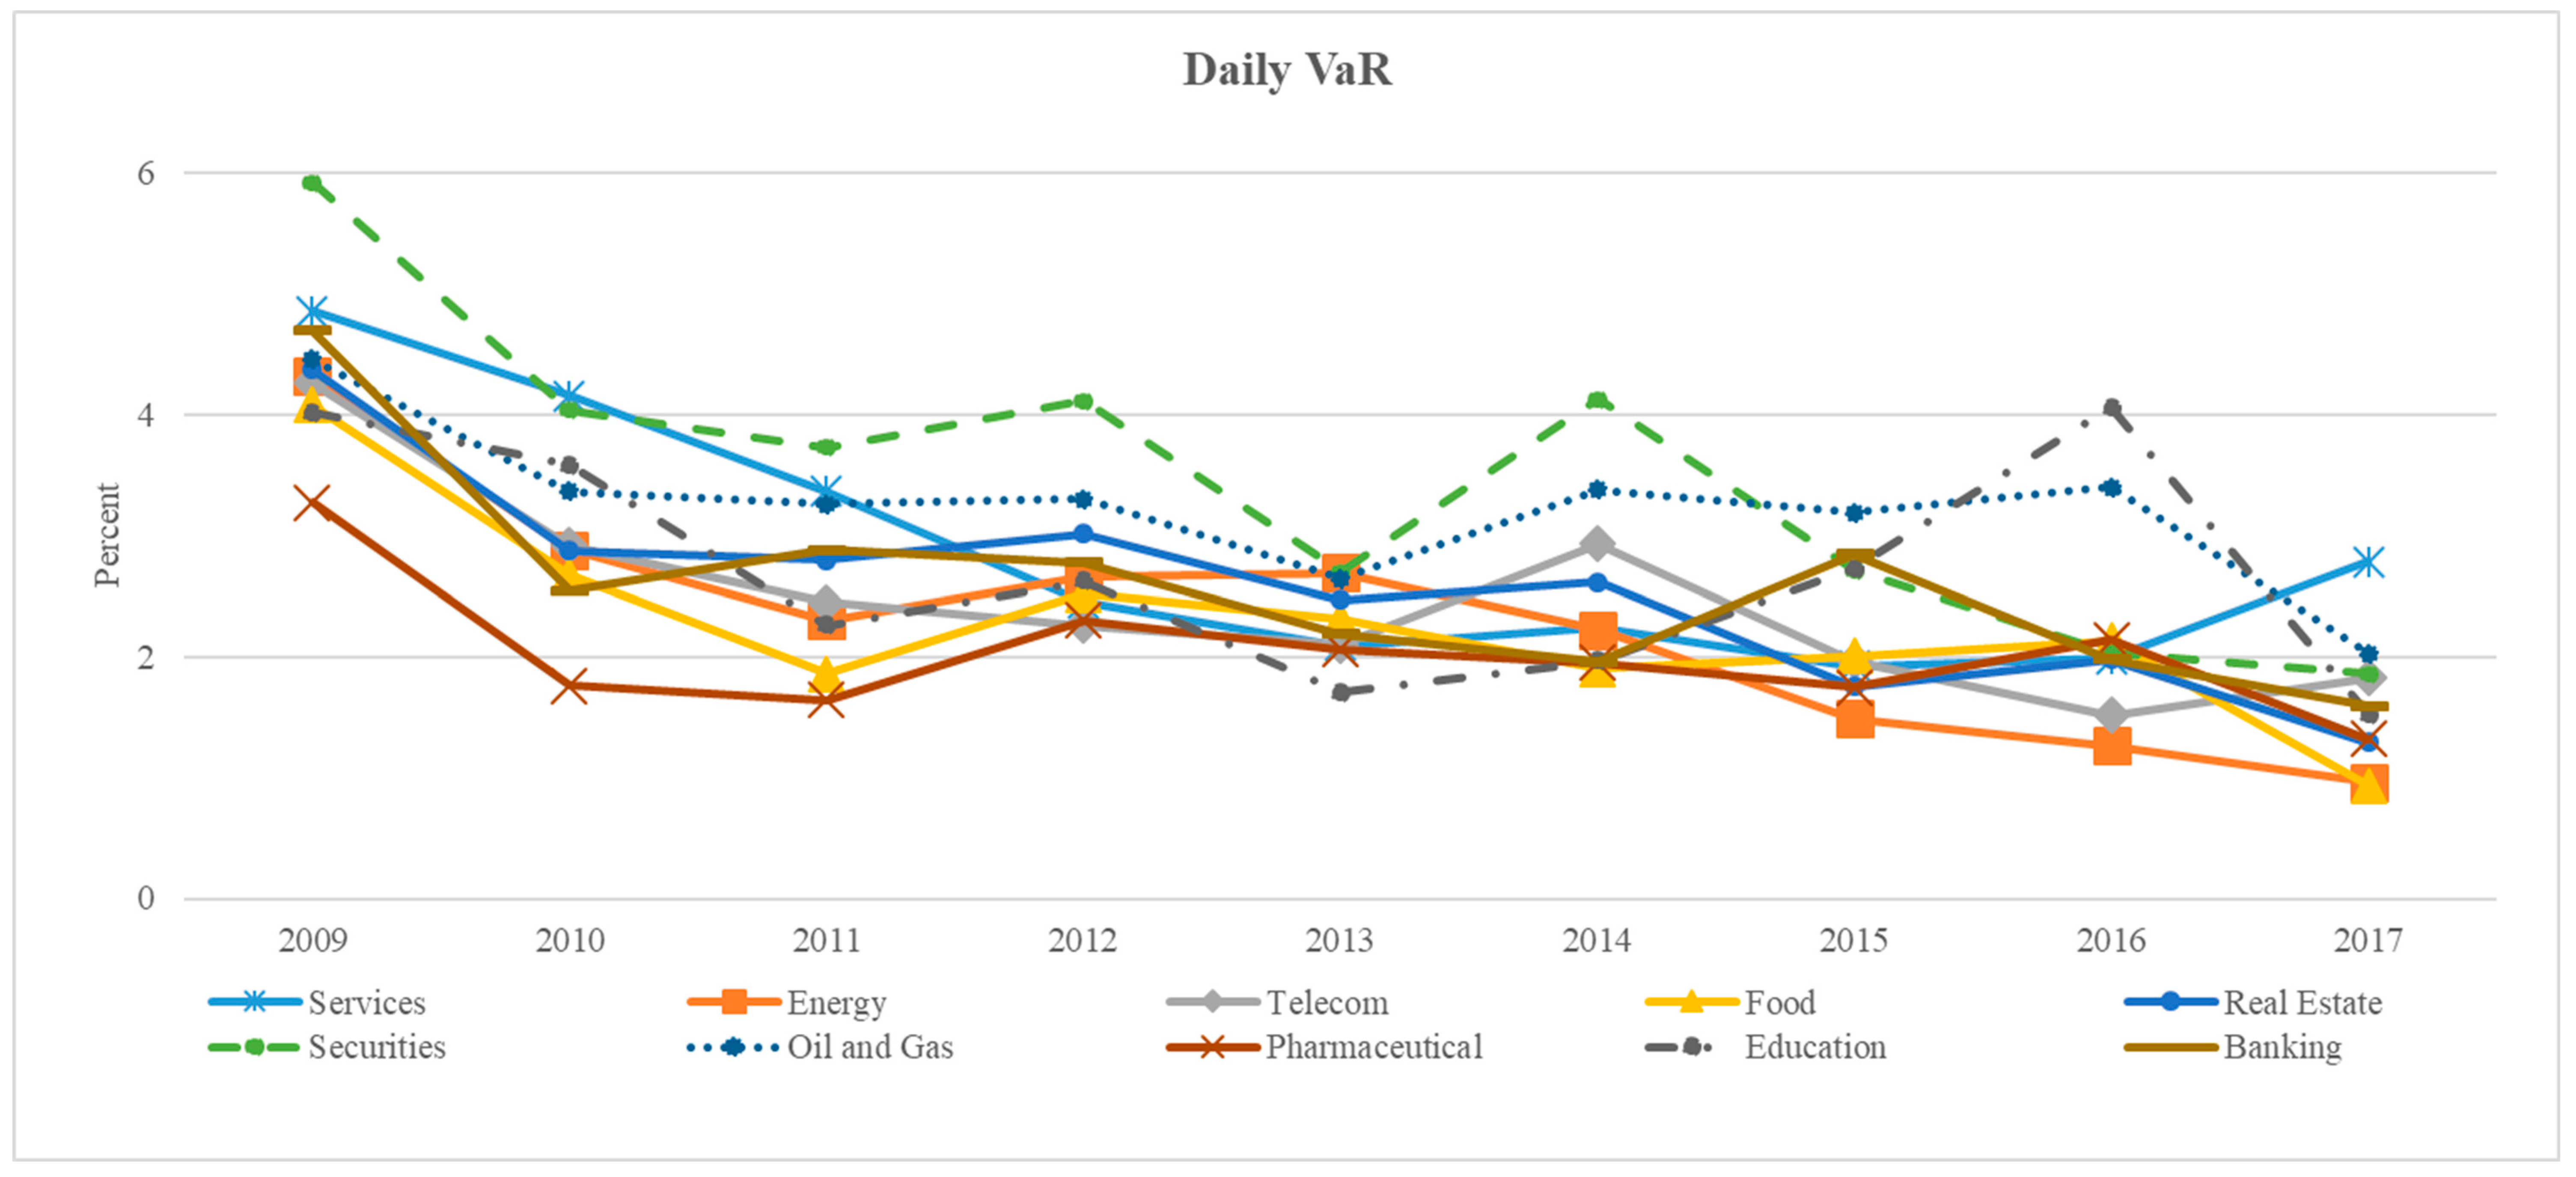
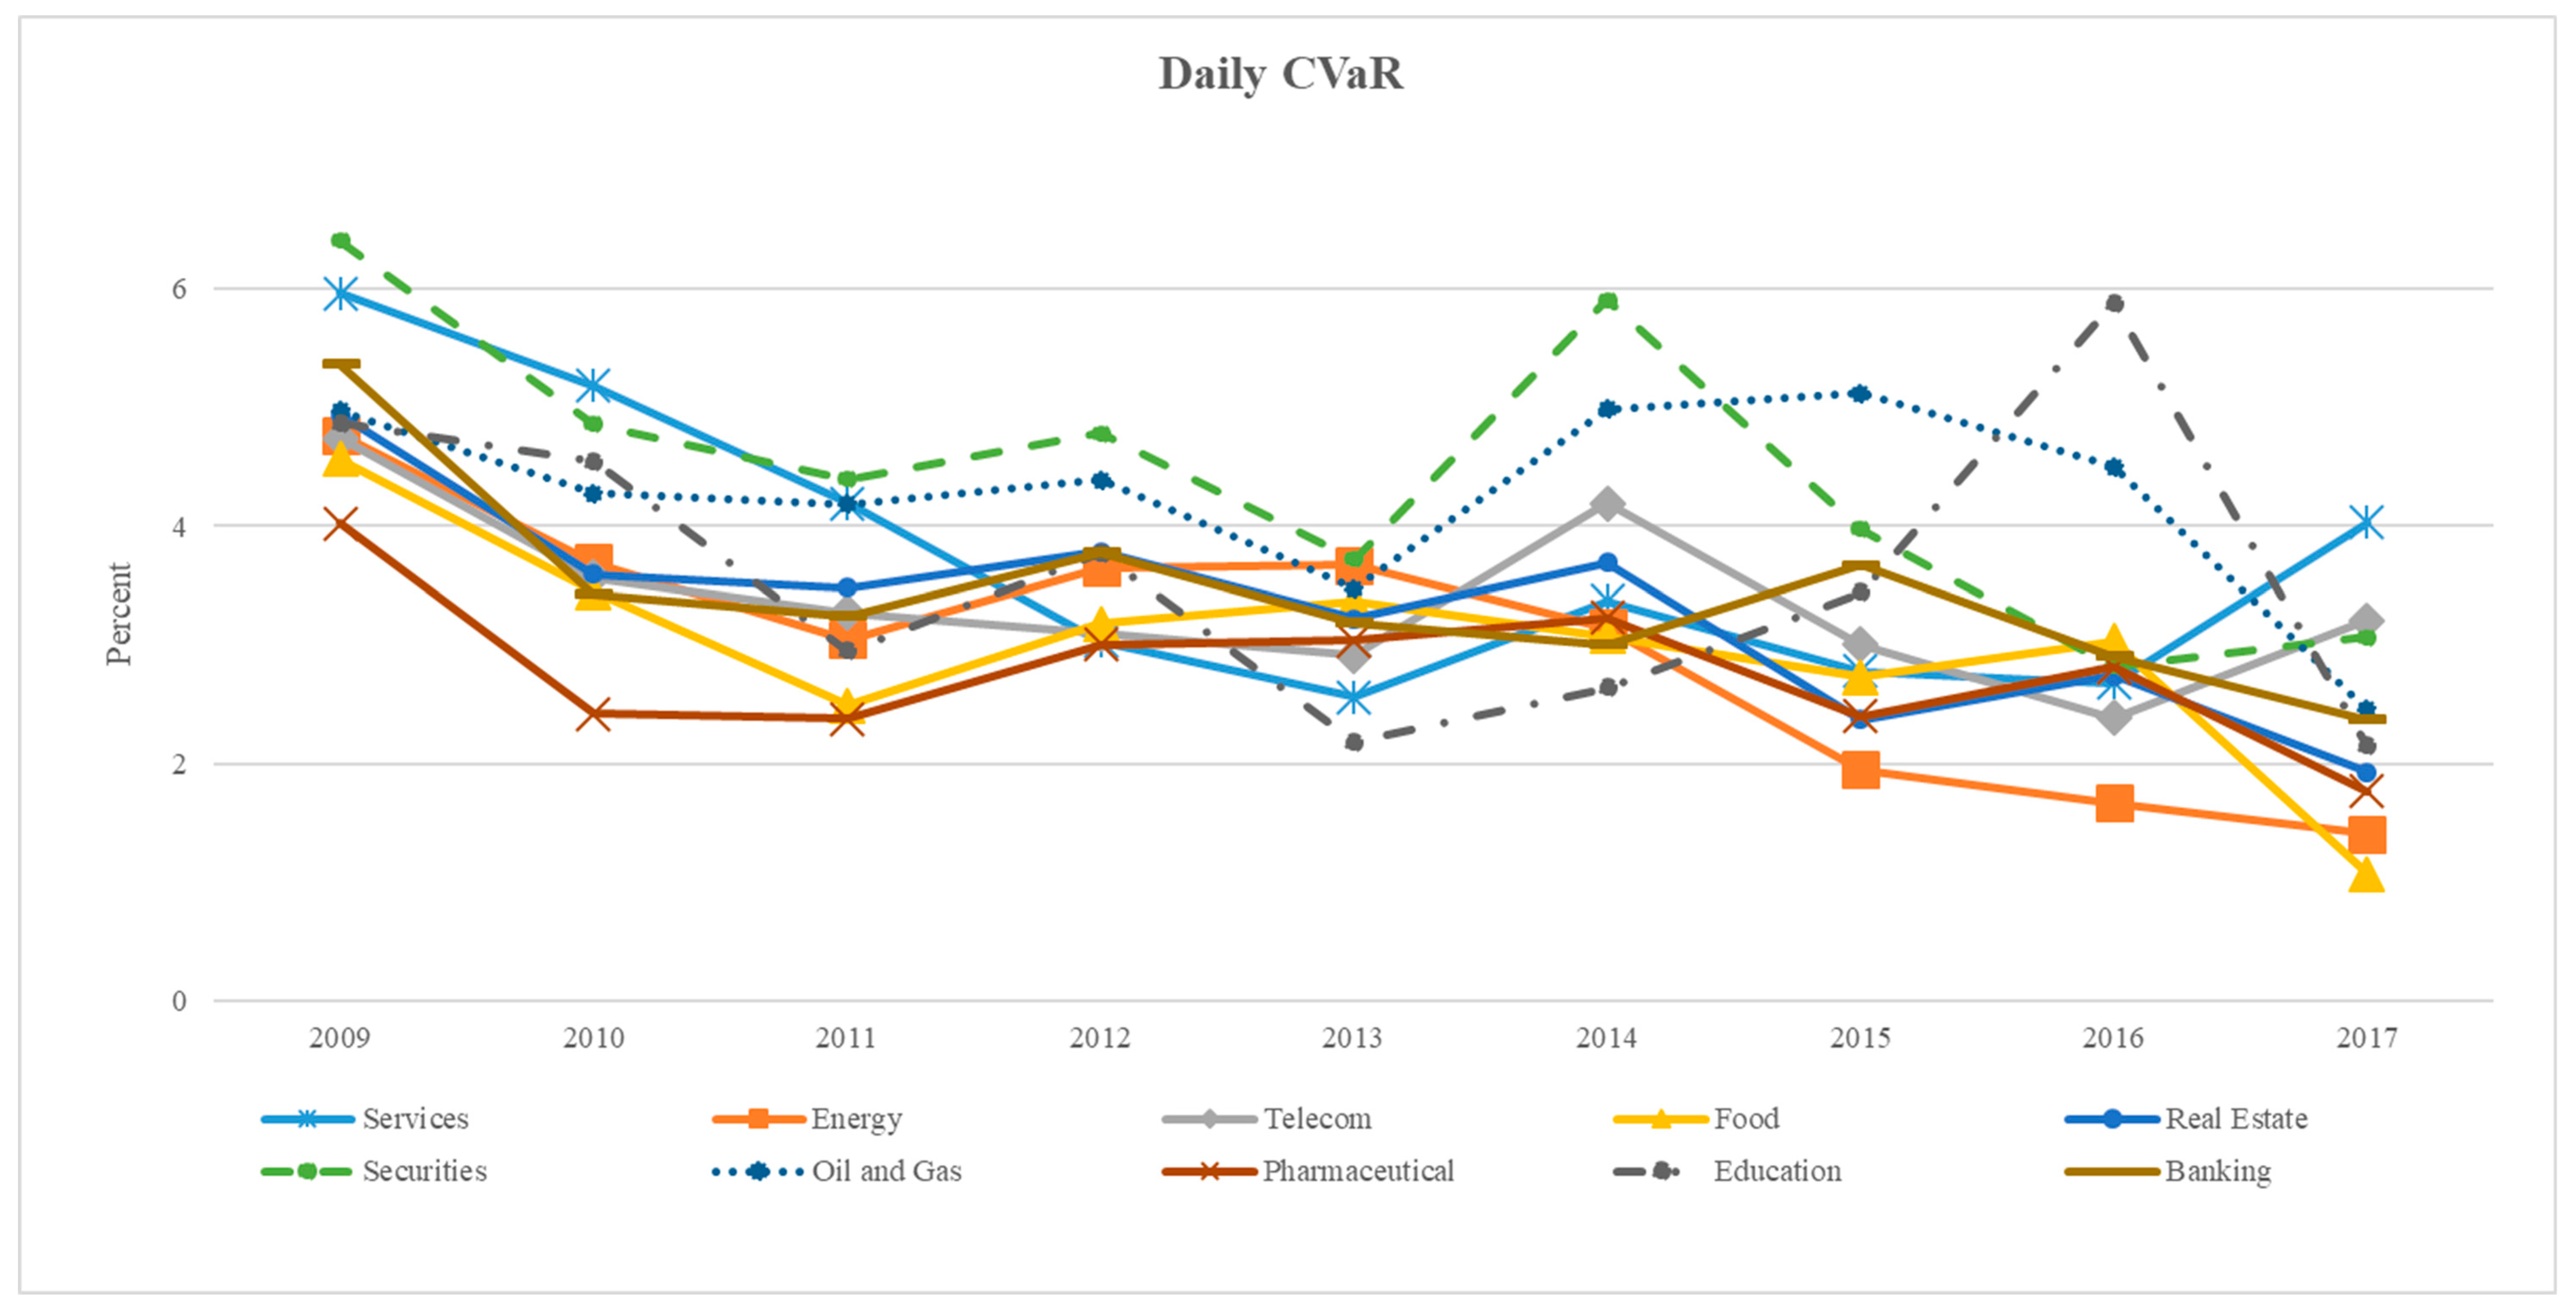
Figure 1 and
Figure 2 show the daily VaR and CVaR at the 95% confidence level for the ten industries. The general trend of the market risks for the ten industries in Vietnam was to decline from 2009 to 2013, increase until 2014, and then continue to decline toward the end of the sample period.
However, the common observation from the empirical findings is that the level of market risk for all industries has decreased from 2009 through to 2017. For the period 2009–2017, the level of risk for energy declined. At the 95% confidence level, in 2009, the largest loss for energy was 4.31% of investments, whereas this loss was substantially reduced to 0.96% in 2017.
Overall, oil and gas mirrors the movements in VaR for Energy, whereas the movements in CVaR are different for energy and oil and gas. This reflects the different underlying financial risk factors for energy and oil and gas in Vietnam.
In comparison with the other industries in Vietnam, the level of market risk for securities fluctuated over the period. For this industry, with 95% confidence, the largest loss was 5.92% in 2009. This level then gradually decreased over the following years. This industry was then hit with an increase of market risk of 4.11% in 2012, which decreased to 2.64% in 2013, to 4.13% in 2014, and then gradually decreased to 1.86% in 2017. For all ten industries, the levels of market risk over the period has changed consistently, based on both the VaR and CVaR approaches.
When the full sample period of 2009–2017 is considered, as presented in
Table 2, risk according to VaR varies within the range (1.88%, 4.56%), whereas a slightly higher range of (2.58%, 5.22%) is found under the CVaR approach.
As can clearly be seen in
Table 3, the estimates of the levels of market risk for the major industries suggest that, while the pharmaceutical and energy industries are the least risky industries, oil and gas and securities are the highest risk industries in Vietnam for the normal 2012–2017 period.
However, the post-GFC period reveals some differences: Securities and services are the industries that have the highest risk, while the least risky industries are food and pharmaceutical. These empirical findings are consistent for both VaR and CVaR.
We now shift attention to the four targeted industries in Vietnam, namely energy, services, food, and telecommunication. Among these four industries, in terms of the market risk levels, service is the highest-risk industry, whereas food has the lowest risk, as presented in
Table 4. The levels of market risk for these four industries were the highest in 2009, with some fluctuations in 2012, and then a gradual decrease toward the end of 2017. The spread of the market risk levels for all four industries indicates that the relative levels of ranking risk is not uniform over the full sample period.
Table 5 presents empirical evidence to show that the levels of market risk for the four targeted industries have decreased substantially from the post-GFC period (2009–2011) to the normal period (2012–2017). In particular, the VaR results suggest that the levels of market risk are reduced from 31% for food to 46% for services, from the former to the latter period. Based on CVaR, the range of reduction is 19% for telecommunication to 40% for services.
Finally,
Table 6 presents a summary of rankings for the four targeted industries over the two periods. On balance, services is generally ranked the highest-risk industry, whereas energy and food have relatively low market risk among the four industries, using both VaR and CVaR.
5. Conclusions and Policy Implications
The primary purpose of this paper was to estimate market risk for the ten major industries in Vietnam for the period 2009–2017. The primary focus was on the energy sector, which has been designated as one of the four key industries, together with services, food, and telecommunications, targeted for economic development by the Vietnam Government through to 2020. Oil and gas is a separate energy-related major industry.
The data set was decomposed into two distinct sub-periods after the Global Financial Crisis (GFC), namely the immediate post-GFC (2009–2011) period and the normal (2012–2017) period, in order to identify the behavior of market risk for the ten major industries in Vietnam, with an emphasis on energy and oil and gas.
This paper presented empirical evidence in relation to the market risk level of all the major industries. Based on the VaR and CVaR approaches, the empirical findings indicated that the levels of market risk across all the ten major industries were reduced substantially from 2009 (the first year after the end of the GFC) to 2017, the most recent year in the sample.
The energy and oil and gas industries play an important role in the context that Vietnam promotes industrialization and modernization. The development of the energy and oil and gas industries helps Vietnam to proactively ensure fuel supplies for the national economy and provides fuel for other industries. The energy and oil and gas industries contribute significantly to the national budget, bringing a large source of foreign currency, balancing imports and exports of international trade, and contributing to stable economic development for Vietnam.
With a huge role for the economy, the Government of Vietnam has issued a series of policies to promote the stable development of the energy and oil and gas industries, including the following: Decision No. 386/2006/QD-TTg, approving the Development Strategy of Vietnam’s oil and gas industry to 2015 and orientations to 2025; Decision No. 1855/2007/QD-TTg on Vietnam’s National Energy Development Strategy up to 2020, with a vision to 2050; and Resolution No. 41-NQ/TW date 23 July 2015 on strategic orientation for the development of Vietnam’s oil and gas industry to 2025 and vision to 2035.
The empirical findings support the call for the Vietnam Government to take courage in diverting attention from the riskier industries in order to achieve a more balanced outcome for the economy. The empirical analysis provides additional evidence for financial investors in Vietnam to expect respectable returns on their investment portfolios. In general, investors would need to distinguish the energy and oil and gas industries in terms of their levels of market risk.
The paper also presented important and striking empirical evidence that Vietnam’s industries have substantially improved their economic performance over the full sample, moving from relatively higher levels of market risk in the immediate post-GFC period (2009–2011) (referred to in the tables as “Post-GFC”) to a lower-risk environment for what is widely considered to be a normal period (2012–2017) (referred to in the tables as “Normal”) several years after the end of the calamitous GFC.


