Article

Do Behavioral Biases Affect Investors’ Investment Decision Making? Evidence from the Pakistani Equity Market

1
School of Finance, Central University of Finance and Economics, Beijing 100081, China
2
Department of Business Education, The University of Chenab, Gujrat 50700, Pakistan
3
Else School of Management, Millsaps College, Jackson, MS 39210, USA
4
College of Business and Economics, Longwood University, Farmville, VA 23909, USA
*
Author to whom correspondence should be addressed.
Risks 2023, 11(6), 109; https://doi.org/10.3390/risks11060109
Submission received: 13 April 2023 / Revised: 19 May 2023 / Accepted: 29 May 2023 / Published: 6 June 2023
(This article belongs to the Special Issue Frontiers in Quantitative Finance and Risk Management)

Abstract

:
Using a unique sample constructed by 600 investors’ responses to a structured questionnaire, we investigate the impact of behavioral biases on the investors’ investment decision making in the Pakistani equity market, as well as the roles that market anomalies and financial literacy play in the decision making process. We first document the empirical evidence to support that the behavioral biases and market anomalies are closely associated and that these two factors significantly influence the investors’ investment decision making. The additional analyses confirm the mediating roles of certain market anomalies in the association between the investors’ behavioral biases and their investment decision making. Furthermore, empirical evidence reveals that financial literacy moderates the association between behavioral biases and market anomalies, and eventually influences the investors’ investment decision making. Overall, although the results are inconclusive for the relationships between certain variables, our results highlight the importance of financial literacy in terms of optimal investment decision making of individuals and the stability of the overall stock market.
JEL Classification:
G2; G14; G15

1. Introduction

In various circumstances, investors display irrational behaviors due to different situations, feelings, emotions, and perceptions. They may include the wrong judgments in their investments and perceive them as the perfect rational choices in the stock market (Babajide and Adetiloye 2012). Some emotions and sentiments of the investors are caused by the disposition effect or other psychological reasons, and, in turn, the psychological factors can significantly influence their investment decisions (Summers and Duxbury 2012; Ahmad et al. 2017b; Barberis and Thaler 2003). In addition, most of the investors use various kinds of tools, techniques, and models, such as CAPM, capital budgeting techniques, arbitrage, etc., to process the available information and to make investment decisions, while these models ignore the investor’s emotions, feelings, and conflicts during the investment decisions (Sanfey et al. 2003).
Some factors have little impact on investors’ behaviors, whereas some others may have a major influence on investors’ behaviors (Iqbal et al. 2014). These factors heavily contribute to the irrational behaviors of investors when the investments from investors are based on personal experience and characteristics (Kudryavtsev et al. 2013). Some behavioral biases, such as herd bias, anchoring, mental accounting, and overconfidence bias, have a significant impact on the investors’ investment decision making (Ullah 2019). For example, overconfidence bias most likely occurs in active investors, while passive investors follow herding in financial markets (Abdin et al. 2018). As the financial market consists of investors, the aggregate behavior of the investors in the market represents the behavior of the overall financial market. If a large number of investors in the market have biases in their investment decision making, certain market anomalies may occur. Stock market anomalies are usually linked with the specific kinds of financial securities, causing the securities to overperform or underperform (Giles et al. 2014; Thaler 2005). These anomalies explain the events (e.g., certain stock price movements) that cannot be explained by the efficient market hypothesis (Silver 2011).
The occurrence of stock market anomalies, in turn, can influence the investors’ behaviors and overall stock market performance (Barber and Odean 2008; Brealey et al. 2012; Daniel et al. 1998). Specifically, three types of anomalies, such as the fundamental, technical, and calendar anomalies, have been well known to exist in the stock market for a long time (Lam et al. 2008). Many investors have a lack of the essential technical skills and knowledge regarding the stock market (Frydman and Rangel 2014). These investors always follow other investors or brokers to make their investment decisions, which occur due to information generalizations and the failure of investors to conduct extra trading (Shefrin 2002). Thus, it is important to construct the most effective financial advisory services and policies for a strong and secure financial system.
Most developed countries, such as the United States of America, have more sophisticated financial markets. In contrast, countries in emerging markets, such as Pakistan, have experienced fast economic growth but have less sophisticated financial markets. As most of the extant literature focuses on examining the investment decision making in developed countries, examining the investment decision making in an emerging market can help us better understand the behaviors of the investors and the financial market. Specifically, the Pakistan Stock Exchange has faced many ups and downs in recent times. Many investors blame this scenario on behavioral factors and the manipulation of large investors in the market. These factors have been created by prominent investors who are biased regarding investment decisions (Hayat and Anwar 2016). Numerous studies have formed a direct relationship between behavioral biases and decisions of investment amongst individual investors. Investors may follow the other investors’ portfolios for investment decision making and ignore their own perception because of greediness or anxiety of loss (Landberg 2003). In certain scenarios, investors may overestimate their calculations and think that their perceptions are accurate and ignore the suggestions of other investors (Dar et al. 2021; Larrick et al. 2007). It is also worth noting that studies show that financial knowledge has an important impression in minimizing the unreasonable conduct of behavioral biases in investment decisions (Hsiao and Tsai 2018; Al-Tamimi and Kalli 2009).
As Pakistan is a developing country, the individual investors in the country may not receive sufficient financial education. Thus, the majorities of individual investors in Pakistan do not know or fully understand the concept of rationality, and this scenario can highly influence their investment decisions (Akbar et al. 2016). They are behaviorally biased, causing them to be less risk averse in certain scenarios while more risk averse in others (Kim and Nofsinger 2008). Most studies have been implemented to examine the direct impact of behavioral biases on individual and institutional investors’ investment decisions (Hayat and Anwar 2016). Few studies have been conducted in Pakistan to explore the multimediation mechanism between behavioral biases and the investment decision making. Thus, one primary purpose of the study is to address this gap, with a focus to inspect the multimediation mechanism that further explains the relationship between behavioral biases and investment decisions. By inspecting the alternative mediation mechanisms, we can gain a better understanding of the decision making process (Abdin et al. 2018), potentially address some problems in the analytic process that are identified by the extant literature (Peloza 2009), and clarify the nature of the relationship between behavioral biases and investment decisions. According to our best knowledge, Abdin et al. (2018) is the only study that uses the multimediation mechanism between prospect factors and investment performance, but no other studies have been conducted to check the role of financial literacy along with the multimediation mechanism between behavioral biases and investment decisions.
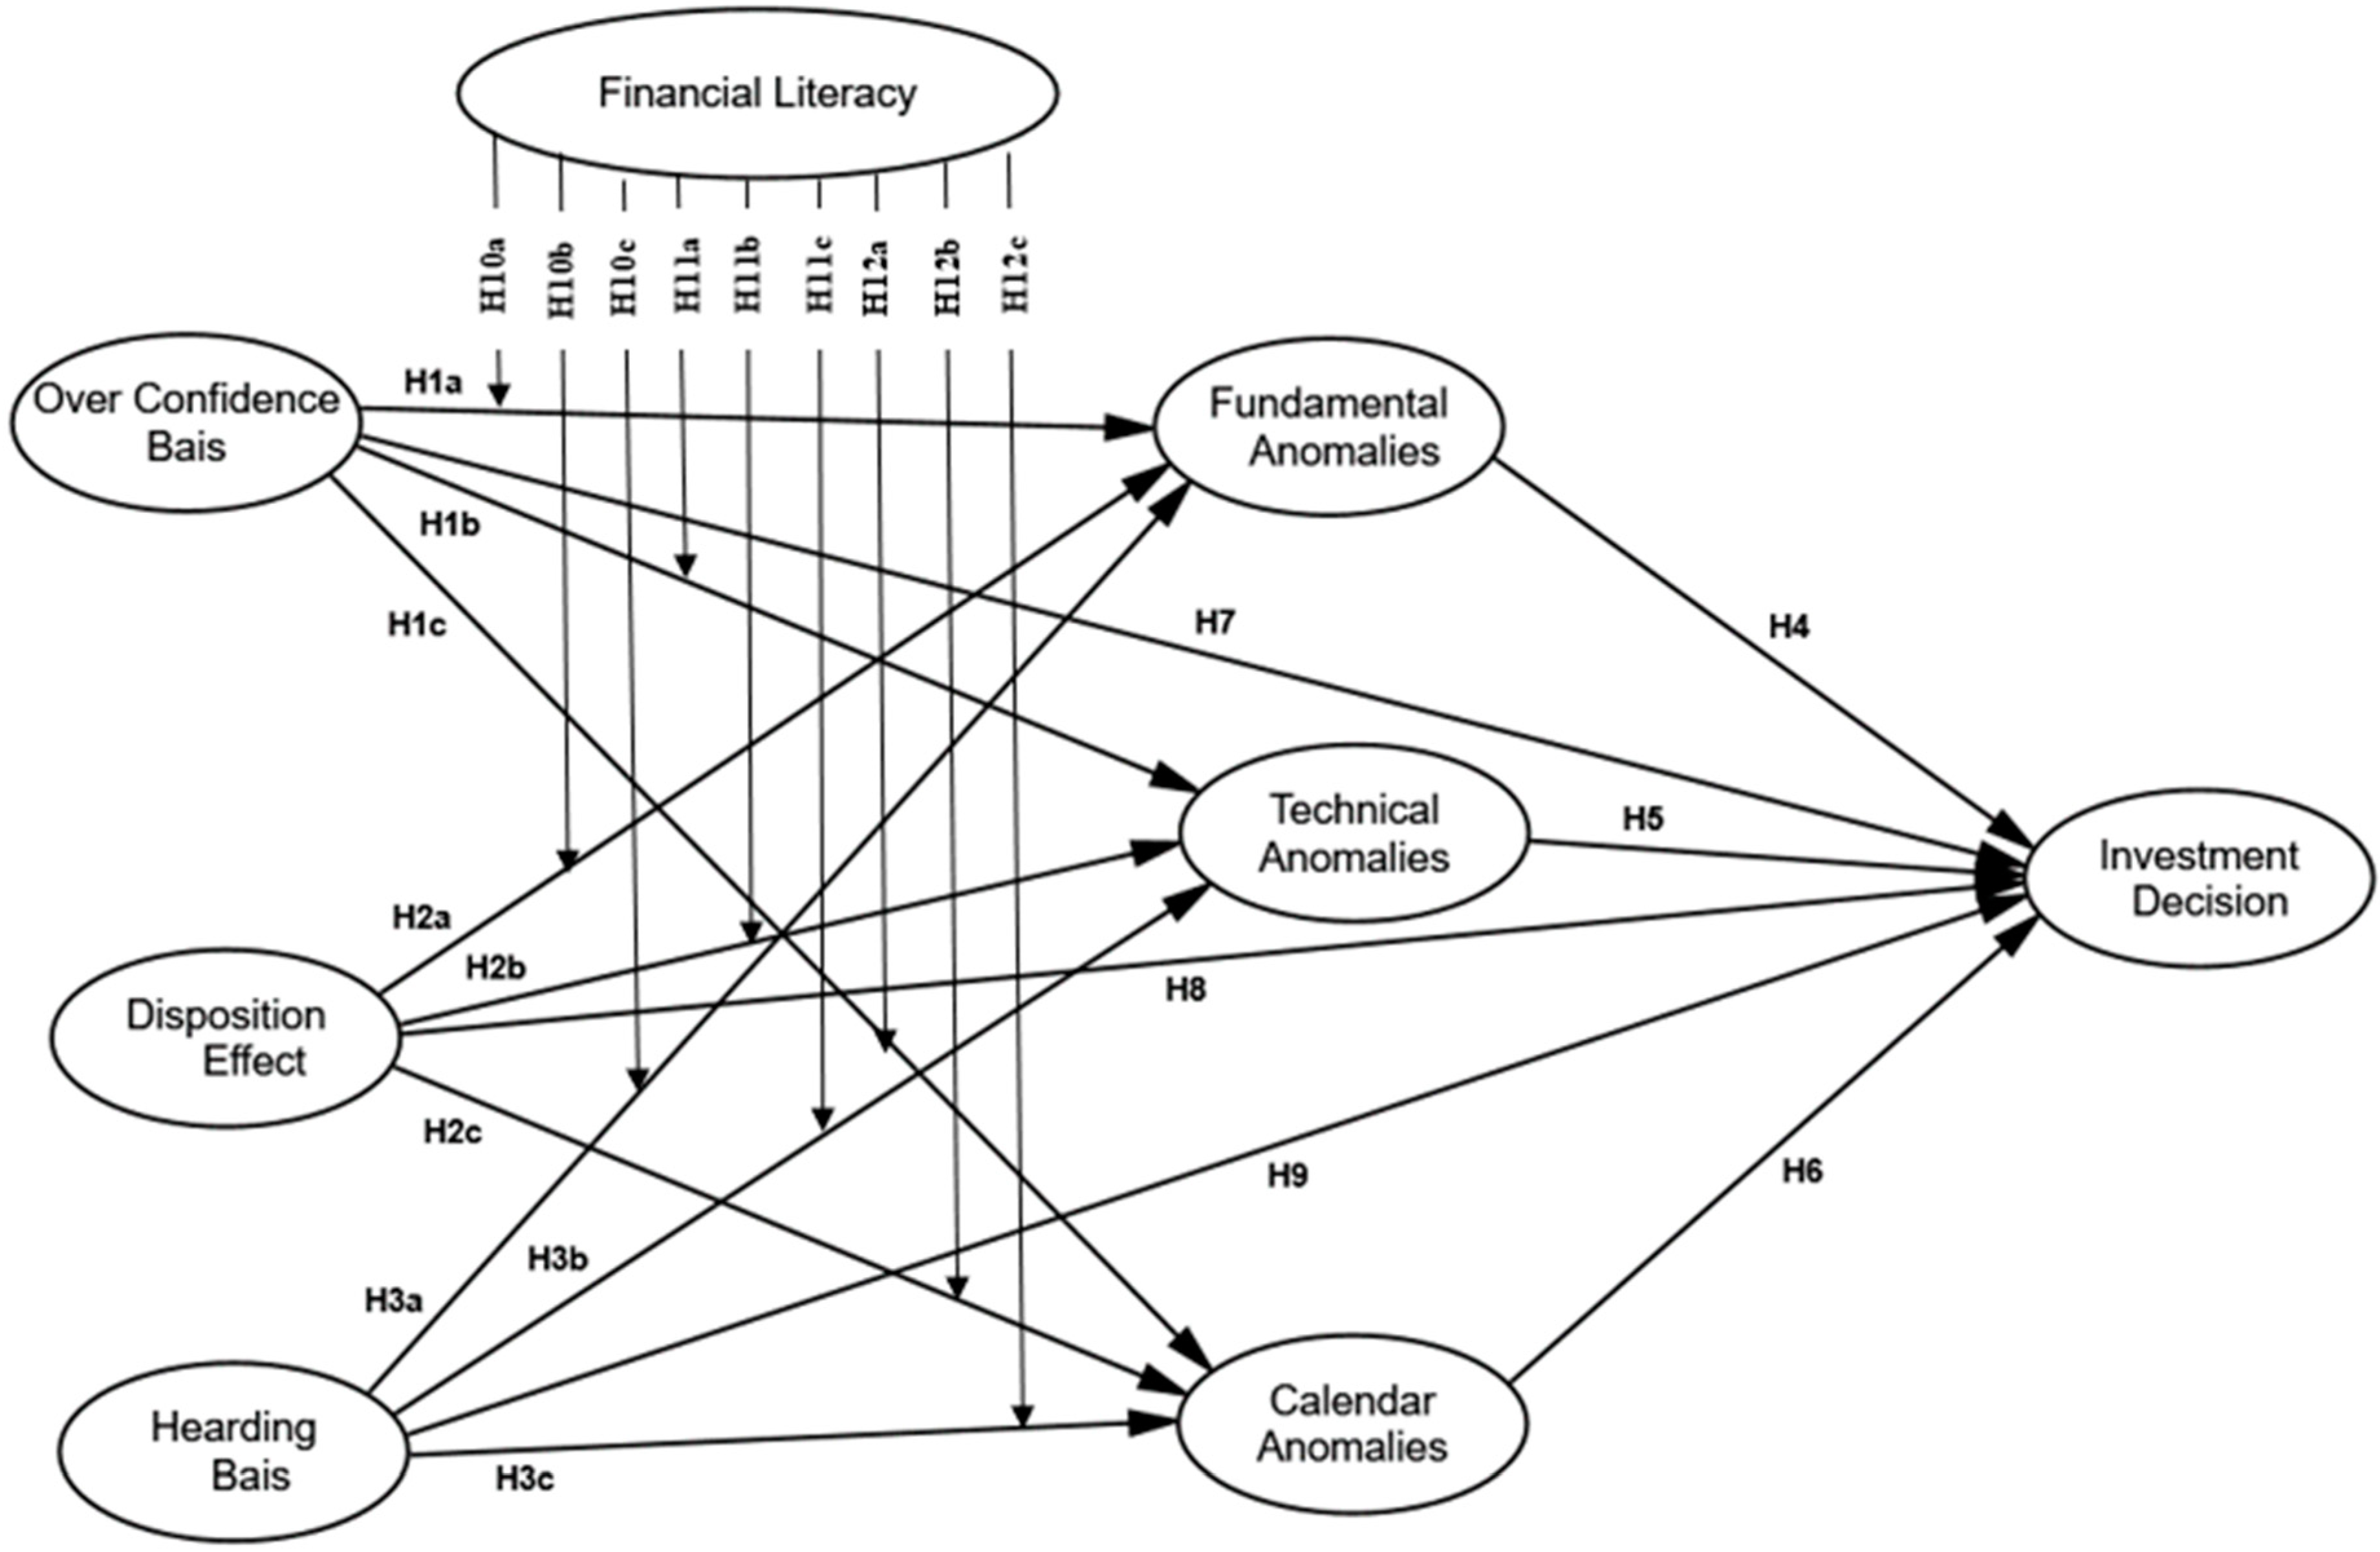
This study inspects the role of behavioral biases in investors’ investment decision making. For this purpose, we developed and distributed a questionnaire amongst the investors in the stock market in 2021. Thereafter, we collected the responses to the questionnaire from various respondents and used the data to conduct the analysis for the associations between behavioral biases, anomalies, financial literacy, and investment decisions. Specifically, this study is characterized by examining the mediating role of three modules of stock market anomalies (fundamental, technical, and calendar anomalies) between behavioral biases and investment decisions, especially the behavioral biases that integrate in their speculation choices escorting to illogical investment. Moreover, the study investigates the moderating role of financial literacy between the biases and the stock market anomalies.
The current analysis contributes to accessible writings by the accumulation of novel suggestions from an emergent economy such as that of Pakistan. Few research studies have been conducted on the perspective of behavioral finance in Pakistan. The study contributes to the existing literature in different ways, for instance, how behavioral biases affect investors’ investment decision making, how stock market anomalies mediate the association between behavioral biases and investors’ investment decision making, how financial literateness moderates the association between investors’ behavioral biases and market anomalies, and the joint effects amongst all three factors on the investors’ overall investment decision making. Furthermore, this study contributes to the literature by establishing an integrated model to identify the mediated and moderated relationship between biases of behavioral finance and decisions of investment. Moreover, the study has some important practical implications. As the evidence from the study highlights the importance of financial literacy in terms of optimal investment decision making of individuals and the stability of the overall stock market, all the relevant parties, including policymakers, financial advisers, or even individual investors, should pay special attention to financial literacy. For example, policymakers need to think about how to appropriately develop policy to improve financial literacy among market participants and to build a strong and secure financial system; financial advisers should provide proper financial education when working with clients; investors, particularly the individual investors, should pay attention to seeking proper financial training to mitigate behavioral biases in their personal investment.
The remainder of the paper is organized as follows: Section 2 discusses the existing literature and develops hypotheses; Section 3 presents the sample construction and research design; Section 4 reports the main empirical results; Section 5 provides a further discussion on the empirical results; Section 6 concludes the paper.

2. Literature Review

Standard finance makes judgements within a defined set of outcomes, knowing all the possible consequences and alternatives for an optimum solution to wealth maximization. The individual behavior in practice differs from theory and classical financial models (Raiffa 1968; Kahneman and Tversky 1979). People tend to forget the general principles in investment theory and follow the intuitions and others, which contradicts rational theory (De Bondt 1998). In such a situation, the efficient market hypothesis and rational behavior theory become incapable of predicting the market. The efficient market ideas and investment rationality conflict with behavioral biases and investors’ psychology.
Prospect theory is an assessment or review of expected utility theory that provides an eloquent representation of hesitation, and the value function evaluates only a single outcome (Kahneman and Tversky 1979). The multiple outcomes in individual decision making interpret the value functions through prospect factors, explaining that individuals demonstrate different behavior in different situations. This happens due to the uncertain and unreliable predictions that delay the investment decisions of investors. Investors develop more risk to circumvent the shortfalls, but the same investor takes less risk when confronted with a slight increase in turnover and profits regarding future prospects. This altered risk behavior is the fundamental part of prospect theory. Investors present themselves with the possibility to upsurge or decline in shortfalls and the likelihood of declining the deficits (Zunino et al. 2008). Moreover, investors divide their portfolios into various mental accounts, which are commonly referred to as mental buckets. There might be downside mental account protection due to fear of poverty or upside mental account protection for the chance of richness. Investors might behave as risk averse in downside mental account protection and risk seekers in upside mental account protection.
The adaptive expectation theory (Tinbergen 1939), bounded rational theory (Simon 1955), regret theory (Loomes and Sugden 1982), and prospect theory (Kahneman and Tversky 1979) collectively explain the role of heterogeneity in investors’ preferences and decisions. However, prospect theory is more appropriate when dealing with behavioral biases, anomalies, and investment in the stock market (Barberis 2013; Barberis et al. 2001; Shiller 1999). They formulate their decisions based on bounded rationality, as described by the decision theory (Barberis and Thaler 2003). The decision theory has incorrect assumptions because an investor’s judgements are not clearly defined in relation to a problem, but it is due to limited knowledge about possible outcomes. The cognitive and emotional factors influence the investor risk perception while making investment choices. They use those factors in their judgement process for various investment instruments, such as overconfidence, loss aversion, herding, and disposition effect. Moreover, the heuristic biases directly explain the investment decisions in Pakistan (Mumtaz et al. 2018; Malik et al. 2022; Farooq and Sajid 2015). However, heuristic biases have markedly decreased the investment decisions of Pakistani investors due to perceived market efficiency (Shah et al. 2018).
The aggregate effects of emotional and cognitive biases in the investors’ investment decision making lead to the stock market anomalies (Thanki et al. 2022), whereas stock market anomalies, in turn, affect the performance of the stock market and decision making of individual investors. These anomalies are usually associated with certain kinds of securities, causing them to under- or over perform (Thaler 2005). Such anomalies describe the events or movements of stock price that are not defined by the efficient market hypothesis (Silver 2011). Three types of anomalies existing in the inefficient markets are fundamental anomalies, calendar anomalies, and technical anomalies. Fundamental anomalies are associated with elements of fundamental analysis (Thushara and Perera 2013). Technical anomalies are related to technical analysis, which predicts the expected stock returns based on stock prices movement and trading volume (Mizrach and Weerts 2009; Bako and Sechel 2013). This refers particularly to price patterns and volume spikes (Turner 2017) and predictive charts (Achelis 2001). Investors attempt to make logical conjectures to navigate between stock prices and signals due to asymptotic behavior of stock prices (Brown and Jennings 1989). Finally, the stock prices are different at different times in calendar anomalies, which is the seasonal variation in stock prices (Thushara and Perera 2013; Thaler 2005). These stock market anomalies occur due to irrational investor behavior and play a critical role in measuring the investment decisions of Pakistani investors (Abdin et al. 2017). All three classes of anomalies apply under prospect theory, which helps to understand the market conditions under which individual investors behave.

2.1. Behavioral Biases and Stock Market Anomalies

2.1.1. Overconfidence and Fundamental Anomalies

Overconfidence is the risk propensity and thinking behavior of investors to be superior and better as compared to others (De Bondt et al. 2013). They undervalue the observations and predictions of other investors but overvalue their own skills (Forbes et al. 2016). Overconfident investors overestimate their own abilities as they ponder performing well as compared to others but in fact are not (Lin 2012). These investors misprice the securities and overrate their observations due to overconfidence bias (Elizabeth et al. 2020; Parikh 2009). Overconfident investors invest in value stocks to gain profit and avoid future loss, thus indicating the value effect of fundamental anomalies (Kudryavtsev et al. 2013; Abdin et al. 2017). Overconfidence is the most prominent bias that adversely affects the investment decisions of individual investors and makes the market inefficient (Waweru et al. 2008). It is most influential factor of change in stock prices and trading volume. The changes in the preferences show that changes in the price of stocks affect the perception of investors (Doyle et al. 2021).
H1a: 
Degree of overconfidence bias has a significant positive affiliation with fundamental anomalies.

2.1.2. Overconfidence and Technical Anomalies

The most organized psychological attribute or bias in behavioral finance is overconfidence (Baker et al. 2017). It is the self-attribution that addresses the earnings announcement anomaly in the stock market (Chou et al. 2021). Technical anomalies are the bullish and bearish trend in respect of stock prices and trading volume. Overconfident investors have astonishing behavior towards the stock market in the creation of bullish market trends and high trading volume (Ahmad et al. 2017a). Trading volume is expectedly high due to overconfidence and the depth of market increases and decreases due to overconfident traders’ expected utility. The overconfident behavior of investors affects the volatility and price quality of stocks (Kinoshita et al. 2012). They make their decisions on the basis of available information about the market and the previous performance of stocks (Mitroi and Stancu 2014). A decrease in stock prices from the support level (technical analysis) creates a fear of loss in the market, which induces investors to sell their stock in equilibrium. In this case, the investment decisions of the investors completely rely on technical analysis, which is the key reason for creation of technical anomalies in the stock market (Kamoto 2014). On the other hand, the perception about the decline in stock’s worth lowers the substance level (technical analysis), and any additional forfeiture would encourage the investors to trade the security at equilibrium. They seriously depend upon the technical anomalies under such situations, which outline the technical anomalies in the securities market (Chen et al. 2020). Different technical analyses are used to predict the future price of stock on the basis of historical stock prices by overconfident investors for making their investment decision (Hoffmann and Shefrin 2014; Mizrach and Weerts 2009). The historical price pattern deviates the investors from the efficient market hypothesis and generates technical anomalies in the Pakistani market (Abdin et al. 2018).
H1b: 
Degree of overconfidence bias has a significant positive affiliation with technical anomalies.

2.1.3. Overconfidence and Calendar Anomalies

Overconfident investors overestimate their own abilities and personal knowledge against the information that is publicly available (Musciotto et al. 2018). They believe that they possess more knowledge, self-achievement, superior abilities, and experience regarding the stock market, which makes them more overconfident investors (Mitroi and Stancu 2014; Pompian 2011). Calendar anomalies are in different categories, such as day anomaly, moon anomaly, and holiday anomaly (Barak 2008). The poorly performed stocks in December are more probably retrieved in January, which is the driving force for discrete investors to trade in those stocks and receive tax benefits (Branch and Chang 1990). Most overconfident investors prefer to sell their stock at the end of the year to reap tax benefits. This suggests that they are overconfident in terms of calendar anomalies (Lee et al. 2013). Ahn et al. (2014) investigated that overconfident investors seem very active during the year end and weekend, which creates the calendar anomalies in the stock market.
H1c: 
Degree of overconfidence bias has a significant positive affiliation with calendar anomalies.

2.1.4. Disposition Effect and Fundamental Anomalies

Disposition effect narrates the inclination or propensity of investors to sell the winning stocks immediately with the increase in stock prices and hold the stocks that have dropped in value (Singh 2016). This happens due to loss aversion behavior in connection with loss and a rapid increase in wealth transformation (Niehaus and Shrider 2014; Pompian 2011). Disposition effects seem to occur more in male investors rather than female investors. These are emotions that cause the occurrence of disposition effect, causing the investors to trade stocks without regret after knowing the monetary turnover on them (Summers and Duxbury 2012). Prospect theory derives the disposition effect in connection with intrinsic value and equilibrium price of stocks (Hasler and Lusardi 2019). It all depends upon news in stocks that divert the investment decisions of investors (Pelster and Hofmann 2018). A news announcement creates a fundamental anomaly in the stock market because stock prices go up or down accordingly with the announcement (Ahmed and Doukas 2021).
H2a: 
Degree of disposition effect has a significant positive affiliation with fundamental anomalies.

2.1.5. Disposition Effect and Technical Anomalies

Regarding the phenomenon to avoid loss, retail investors sell or quit winning stock speedily and keep loser stocks for an extended period in disposition effect (Taffler et al. 2017). Shefrin and Statman (1985) revealed that the investors who kept their losing investment for a long time and sell winning stock too early may cause disposition for different asset classes. This kind of forecasting about stock returns is grounded in preceding risk and uncertainty (Azzopardi 2010). Investors make financial decisions with some prospects in mind (Thaler 2005). Investors use technical analysis to predict future stock prices with the help of past stock prices (Konstantinidis et al. 2012). This entire phenomenon about disposition effect and technical analysis is based upon prospect theory (Grinblatt and Han 2005). This theory suggests that the investor cannot act rationally all the time (Kumar and Goyal 2015). Since investors in disposition effect do not involve reasonable conclusions while handling each element of an investment discretely (Bekiros et al. 2017), they might depend upon technical analysis to make investment decisions that generate the technical anomalies in stock market.
H2b: 
Degree of disposition bias has a significant positive affiliation with technical anomalies.

2.1.6. Disposition Effect and Calendar Anomalies

Investors consider the gains and losses before making any investment decision. The prospect-theory-based disposition effect identifies that every single investor frames their prospects in accordance with the value function relative to a reference point (Thaler 2005; Kahneman and Tversky 1979). Investors evaluate the gains and losses separately and treat the assets accordingly (Lewis 2017). It is observed that losses have a very strong emotional effect on investors (Azzopardi 2010). The loss aversion theory explained that individual investors are more concerned with losses and gains. However, rational investors do this oppositely for tax benefits (Singh 2016). Investors minimize the taxes at the end of the year and less disposition effect is observed at the end of the year (Taffler et al. 2017). They are reluctant to incur any loss but choose to sell losing stocks in December for tax reasons and start to invest in smaller firms’ stocks that are likely to provide huge returns in January (Haug and Hirschey 2006). The convinced improvement in January indicates the investors as risk averse in calendar anomalies.
H2c: 
Degree of disposition effect has a significant positive affiliation with calendar anomalies.

2.1.7. Herding Bias and Fundamental Anomalies

Every single investor in the stock market without any proper direction creates the herding bias (Braha 2012). It is observed that uncertainty and fear of loss might influence the investors in selling their stocks. They armed themselves with inferior information and others have superior information (Shukla et al. 2020). This happens due to fear of loss and greed (Landberg 2003). The occurrence of herding bias in the stock market is due to the enormity of risk perception with returns of stock (Shah et al. 2017). The herding bias of the investor is created due to the investors’ intent to avoid or reduce the level of risk they take (Ullah and Elahi 2015). Individuals behave irrationally during herding behavior in response to a change in stock price. For instance, they see the large investors are selling their stocks and start following them in selling their stocks quickly (Dodonova and Khoroshilov 2005). It all depends upon an announcement effect in the stock market that describes the tendency of fluctuations in stock prices to continue even after the very first declarations. Simply, investors follow the positive and negative news announcements and react accordingly (Joo and Durri 2017).
H3a: 
Degree of herding bias has a significant positive affiliation with fundamental anomalies.

2.1.8. Herding Bias and Technical Anomalies

The factors of herding behavior greatly influence the financial choice and trading behavior of individual investors (Baddeley et al. 2010). Moreover, demographic traits determine the risk-taking behavior and financial behavior in the stock market (Bashir et al. 2013). Investors with herding behavior concentrate to follow the directions and information of other investors in lieu of their own (Elizabeth et al. 2020). They act irrationally and set forth the others’ judgment with the increase in herding behavior in the stock market (Kumar and Goyal 2015). These investors do not have an idea about how and where to invest due to low-risk propensity, which causes them to follow the opinion or direction of other investors (Islam 2012). Huang et al. (2016) investigated that institutional investors have a positive strong relationship with herding behavior with respect to risk and return since herding behavior does not always entail rational decisions and investors may rely on technical analysis to make investment decisions, thereby creating technical anomalies in the stock market (Pompian 2011).
H3b: 
Degree of herding bias has a significant positive affiliation with technical anomalies.

2.1.9. Herding Bias and Calendar Anomalies

In financial markets, herding is the inclination of the market investors to observe the stock, ignoring their own private information (Braha 2012). They follow the choice of majority investors instead of anticipating their personal information due to return fluctuations (Lin 2012). The herding behavior of investors can also be influenced by information unavailability (Ben Mabrouk 2018). It is a common likelihood in human nature to follow, imitate, and notice the behavior of other investors during irregular market conditions (Yu et al. 2018). Investors and managers prefer to follow others’ beliefs and opinions that affect the investment (Filiz et al. 2018). Herding behavior is more profound in unstable market conditions, such as misrepresentation, price bubbles, and rumors (Mertzanis and Allam 2018). Investors are reluctant to incur any losses and choose to sell their losing stocks in December for tax reasons and then invest in smaller firms that are likely to provide a high return in January (Haug and Hirschey 2006). This tendency to follow most likely occurs at diverse times of the month that create the calendar anomalies in the stock market.
H3c: 
Degree of herding bias has a significant positive affiliation with calendar anomalies.

2.2. Stock Market Anomalies and Investment Decisions

2.2.1. Fundamental Anomalies and Investment Decisions

The stock price does not show the intrinsic or fundamental value in fundamental anomalies that increase the price in the stock market (Foorthuis 2021). There are many factors that influence stock prices (Graham et al. 2009). According to those factors, investors follow the growing stocks in the stock market rather than overvalued stocks. This concentrating behavior about stocks affects the investment trading behavior of investors. Value stocks are abandoned with the reason of risk and inaccurate investors’ decisions (Abdin et al. 2018). This component is categorized as a fundamental anomaly that impacts the investment decisions. The irregularities that are linked with a stock’s value are referred to as the fundamental anomalies (Pompian 2011). These anomalies are the reasons to create fundamental analysis while trading the stocks. They change the stock prices, which has a huge impact on investment behavior and investment performance (Waweru et al. 2008). Investors tend to select stocks attracting their attention whatever their fundamentals are in Pakistan, thus influencing the investment performance (Abdin et al. 2018). As a result, fundamental anomalies positively impact the investment performance in Pakistan (Malik et al. 2022). However, fundamental anomalies restrained them from investments in Pakistan due to inability in obtaining abnormal returns (Zafar and Siddiqui 2020).
H4: 
There is a significant positive affiliation between fundamental anomalies and individuals’ investment decisions.

2.2.2. Technical Anomalies and Investment Decisions

The affiliation between technical anomalies and efficient market hypothesis is not consistent (Pompian 2011). The anomalies determine the trends in the stock market, which are based on past stock prices and volume. This trend in stock prices and anomalies has a huge influence on investors’ investment decisions (Latif et al. 2011). Therefore, technical analysis is performed to predict the future price behavior based on previous stock prices and trading volume in the stock market (Bako and Sechel 2013). The behavioral pattern gives rise to technical analysis to opt for prompt investment choices. The past prices and volumes of stock are being used to perform technical analysis to predict stock returns (Mizrach and Weerts 2009). An investor’s investment decisions heavily rely on technical anomalies to gain abnormal returns from the market (Taylor 2011). The technical anomalies influence the investors to use technical analysis for ease of interpretation and to highlight future prices for making investment decisions, affecting the investment performance (Abdin et al. 2018). The technical anomalies increase the investment performance in Pakistan (Malik et al. 2022). Another study in Pakistan indicates that technical analysis is useless in semi-strong and strong forms of market efficiency because investors cannot obtain abnormal returns that restrain them from investments (Zafar and Siddiqui 2020).
H5: 
There is a significant positive affiliation between technical anomalies and individuals’ investment decisions.

2.2.3. Calendar Anomalies and Investment Decisions

Calendar anomalies are comprised of the January effect or weekend effect (Taylor 2011; Singal 2014), which imitate the value of stocks (Joo and Durri 2017). It is difficult to regulate the stock prices in these circumstances. The seasonal outcome endangers the stock prices, which makes the market unproductive and forces the investors to cross the market in a definite way. Investors sell losing stocks at the end of year with the goal of avoiding taxes. This induces them to capitalize on small companies that propose advance returns (Schultz 1985). A contradictory and weak January effect is testified to in relation to utmost stock returns (Tonchev and Kim 2004). During the last 15 min of a day, the stock prices and trading volumes tend to increase (Guin 2005). For instance, investors seem to be very active at the end of the year (Abdin et al. 2018). Giovanis (2016) test the month of year effect through the GARCH model and experience the uppermost return in December in twenty stock markets, February effect in nine markets, January effect in seven, while April effect in six stock markets. The same situation happens in Pakistan that stock returns are highest at the end of the calendar year but the return lowers afterwards (Anjum 2020). The Pakistan equity market exhibits positive returns in the last day of the week and illustrates negative returns in the last day of the week (Alvi et al. 2021). This trend of stock prices is due to the calendar effect that influences the investment decisions.
H6: 
There is a noteworthy optimistic affiliation amidst calendar anomalies and individuals’ investment decisions.

2.3. Behavioral Biases and Investment Decisions

2.3.1. Herding Bias and Investment Decisions

Herding is the psychological element that has an impact on an investor’s decisions (Abul 2019). It is the mutual tendency of human nature to mention, witness, and replicate someone’s conduct in an asymmetrical disorder in stock markets (Rompotis 2018). However, the existence of herding enforces them to act irrationally for investment decisions. They desire to follow the other investors with certainty and for accurate speculation. Herd behavior designates how a cluster of people performs and invests altogether (Braha 2012). It is perceived that investors discard their own investment choices during panics and subsequently follow other investors with the vision that they possess additional information about market conduct (Gao et al. 2021). They hesitate to invest because of greed and fear of loss (Landberg 2003). Generally, investors perform a similar thing for investment in stocks under the shadow of other investors. This happens due to idle and less trained behavior of investors (Persaud 2000). Some agents are equipped to follow the people possessing the richest information, a behavior called herding (Mello et al. 2010). Herd investors are inclined to confine their choices and follow other investors. Herding overwhelms the stock market, such as market anomalies and bubbles in the market (Mertzanis and Allam 2018). The positive feedback strategy influences every individual investor to follow the crowd (herd) for the purpose of buying and selling of stock during bullish market trends (Kim and Ryu 2021). Herding behavior interacts negatively in a bullish market trend, but it positively interacts in a bearish market trend (Shah et al. 2019). Investment decision making is significantly affected by herding behavior (Raheja and Dhiman 2019; Boda and Sunitha 2018; Almansour and Arabyat 2017; Dominic and Gupta 2020). Shah et al. (2017) stated that herding exists in the Pakistan stock market, which affects the investment. However, this herding behavior does not affect the investment decisions in some circumstances (Ahmed et al. 2022). The herding behaviors do not change the investment policy and preference of investors that belong to stocks. Investors’ sentiments in such situations are aligned with the phenomenon “slow rise and sharp fall” (Gong et al. 2022). In the case of a fall in prices, the herding is more obvious in the market. Herding behavior occurs more frequently in investment decisions of investors in Pakistan (Aftab 2020; Katper et al. 2019). However, herding bias is insignificantly related to investment decisions of investors in Pakistan (Ahmed et al. 2022; Quddoos et al. 2020).
H7: 
Herding bias has significant and positive influence on investment decision making.

2.3.2. Overconfidence Bias and Investment Decisions

Individuals think that they are better informed about the stock market and they can predict the true direction of stocks as compared to others (Larrick et al. 2007). They overestimate their abilities in respect of knowledge, information that is publicly available, and underestimate risks (Barak 2008; Etzioni 2014). Overconfidence is essentially the overvaluation of investor aptitudes that they perform better but in fact do not. Overconfident investors are self-confident about their facts and expertise and overlook the risk allied with investment decisions (Mirza et al. 2022; Prosad et al. 2017; Kamoto 2014; Ul Abdin et al. 2022). Optimism is the best way to express the best possible outcome expectation from individual investment decisions (Iqbal 2015). Investors are considerably self-confident in trading the securities and rational inclination; the investor is prejudiced regarding overconfidence bias (Huang et al. 2014). Overconfidence behavior catalyzes advanced operating capacities and investment choices (Pachur et al. 2012; Darrat et al. 2007; Phan et al. 2018; Mushinada and Veluri 2018; Khan et al. 2017). It impairs the quality of investment performance, investment decisions, and risk perception (Ahmad and Shah 2020). Sometimes, the overconfidence bias due to irrationality of investors adversely impacts the investment decisions (Siraji et al. 2021). This overconfidence bias distorts investors’ rationality in Pakistan and leads them to make more frequent but inefficient investment decisions (Naveed and Taib 2021). Moreover, overconfidence bias is a significant factor of investment decisions in Pakistan (Aftab 2020; Katper et al. 2019). This cognitive bias directly explains the investment decisions of investors in Pakistan (Quddoos et al. 2020; Chhapra et al. 2018; Ishfaq et al. 2020; Khan et al. 2021; Rehan and Umer 2017). However, Adil et al. (2022) find an insignificant influence of overconfidence on investment choices.
H8: 
Overconfidence has a substantial and confident effect on investment decisions.

2.3.3. Disposition Effect and Investment Decisions

The disposition effect indicates to hold stocks when prices go down and sell immediately whenever prices go up (Pelster and Hofmann 2018). This happens for the reason that they are losing indifferently and want to produce principal advances rapidly (Lin 2011). The proposition of disposition effect depends upon investment styles and market cycles (Bernard et al. 2018). The presence of the disposition effect helps the speculative investors in speculation activities (Summers and Duxbury 2012). Likewise, disposition bias is more pronounced in broader situations as compared to precise situations (Bekiros et al. 2017). Moreover, discrete investors are more susceptible to the disposition effect as compared to external and established investors (Roger 2009). The amount of instruction of discrete investors has a confident affiliation with the disposition effect. The disposition effect fluctuates the cross-market situations and exhibits its role in mutual fund investments (Lee et al. 2013). The disposition effect has a strong impact on investment decisions (Ploner 2017). The impact of disposition effect on investment is strong in long position rather than short position (Madaan and Singh 2019). The investors that are following the disposition effect would be likely to make more investment decisions (Siraji et al. 2021; Ahmed et al. 2022). However, Adil et al. (2022) found an insignificant influence of disposition effect on investment choices.
H9: 
Disposition Effect has substantial and optimistic influence on investment decision making.

2.4. Role of Financial Literacy among Behavioral Biases and Stock Market Anomalies

2.4.1. Financial Literacy Has Moderating Role Amidst Behavioral Biases and Fundamental Anomalies

The financial knowledge in relation to investment describes the sum of information about monetary benefits and is a key component of cognitive behavior (Mirza et al. 2022). The financial literacy is the investor’s competence to understand the money market and the way to wealth maximization (Giesler and Veresiu 2014). The financial literacy incredibly contributes to accurate speculation, investment choices, and reserves (Idris et al. 2013). The financial monetary knowledge helps to perform the monetary decisions in an understandable way (Hilgert et al. 2003; Robb and Woodyard 2011). Well-educated investors in the stock market continuously use accurate methods and tools before making investment choices. They consider the value of firm and firm size for investment decisions, which lead to fundamental anomalies in the stock market. On the other hand, low-literacy investors always follow the instructions of other investors or follow the advice of family, friends, and stockbrokers. Due to the low literacy of investors in the financial market, different kinds of behavioral biases are raised in stock market (Al-Tamimi and Kalli 2009).
H10a: 
Financial literacy moderates amidst overconfidence bias and fundamental anomalies.
H10b: 
Financial literacy moderates amidst disposition effect and fundamental anomalies.
H10c: 
Financial literacy moderates amidst herding bias and fundamental anomalies.

2.4.2. Financial Literacy Has Moderating Role Amidst Behavioral Biases and Technical Anomalies

The financially literate investors overvalue their skills, talent, and occupation, which is depicted as overoptimism, which is injurious for speculations (Mandell and Klein 2009). The financial literacy is quite an extensive expression that recognizes the financial literateness of investors and helps them in changing their financial decisions. Investors who have financial knowledge can make different calculations and analysis before making an investment decision, and this creates the technical anomaly in the stock market (Hayat and Anwar 2016). However, lower financial knowledge leads them to yield to the guidance of acquaintances, family associates, or stock agents. These investors typically demonstrate themselves as overoptimistic, displaying herding behavior and disposition effect for the reason that they were uneducated. Thus, they are incapable of making decisions and make incorrect investment choices (Al-Tamimi and Kalli 2009).
H11a: 
Financial literacy moderates amidst overconfidence bias and technical anomalies.
H11b: 
Financial literacy moderates amidst disposition effect and technical anomalies.
H11c: 
Financial literacy moderates amidst herding bias and technical anomalies.

2.4.3. Financial Literacy Has Moderating Role Amidst Behavioral Biases and Calendar Anomalies

The level of financial knowledge and calendar anomalies determine that investors who are financially more literate are more active at the end of the year or beginning of the month. It is observed that financially literate investors are active during the start of the week and end of the week due to calendar anomalies in these days. Nevertheless, some investors follow others because of low financial knowledge, leading to the creation of different kinds of behavioral biases in the stock market. Investors widely integrate these behavioral biases in their investment choices (Kahneman and Tversky 1979; Odean 1998; Dhar and Zhu 2002; Weber and Camerer 1998). These biases and the announcement effect are subject to biased results (Idris et al. 2013; Hilgert et al. 2003; Robb and Woodyard 2011).
H12a: 
Financial literacy moderates amidst overconfidence bias and calendar anomalies.
H12b: 
Financial literacy moderates amidst disposition effect and calendar anomalies.
H12c: 
Financial literacy moderates amidst herding bias and calendar anomalies.

3. Methodology

The study aims to identify the potential dark and bright aspects of behavioral biases in investors’ investment decisions with the mediating role of stock market anomalies and moderating role of financial literacy. The target population is the individual investors in the Pakistan Stock Exchange. For this purpose, we designed a structured questionnaire to collect the data from investors through random sampling method; specifically, we distributed 687 questionnaires among the investors in two floors of Pakistan Stock Exchange, i.e., Islamabad Stock Exchange and Lahore Stock Exchange, and collected the filled-up questionnaires from respondents in 2021. The questions in the questionnaire are short and precise to ensure that the respondents do not face too much difficulty in filling the questionnaire. After collecting the data, we observed that some investors did not provide data properly, did not complete the questionnaire correctly, or only provided the answer to a few questions, and we thereby rejected these questionnaires. A minimum sample of 380 respondents is required for unknown population, which yields consistent results at 95% confidence interval (Krejcie and Morgan 1970). An efficient method for determining the sample size is needed to be a good representative of a given population. The increase in population increases the sample size at a diminishing rate and it remains relatively constant with a sample greater than 380 (Krejcie and Morgan 1970). Total correctly filled up questionnaires for this study are 600 out of 687 and the data collected from the correctly filled up questionnaires serve as our primary data for empirical test. To start with, we tabulate and refine data into SPSS. After achieving normality regarding the data, we use the data for the advanced analysis through structural equation modeling (SEM) in AMOS to test hypotheses in conceptual framework. The model measures the statistical parameters about structural relations with explained variance of latent variables (Götz et al. 2009). This process helps extract the results from structural equation model for the conceptual framework of the study. During the empirical analysis, we apply the methods of descriptive statistics, correlation analysis, Cronbach alpha, simple regression, and multiple regression tests and, thereafter, use the empirical results to analyze the relationships between different variables in the regression models.

The Measures

The designed questionnaire includes nine different sections, of which the first section contains nine questions/items for the bios of the respondents and each of the remaining sections incorporates various questions/items related to one main variable for the study. It is worth noting that we follow the extant literature stated below (right after each variable) to design the questions for each variable. Specifically, the second section includes three questions/items for the investment decisions (ID) as the dependent variable in Figure 1 (Le Luong and Thi Thu Ha 2011; Waweru et al. 2008); the next three sections consist of questions/items related to the behavioral biases as the independent variables in Figure 1; for instance, section three, four, and five contain seven, six, and six questions/items for the herding bias (HB) (Kengatharan and Kengatharan 2014), the disposition effect (DE) (Pompian 2011), and the overconfidence bias (OB) (Pompian 2011), respectively; each of the following three sections contains four questions/items for the stock market anomalies, i.e., the fundamental anomalies (FA) (Waweru et al. 2008), the technical anomalies (TA) (Waweru et al. 2008; Achelis 2001), and the calendar anomalies (CA) (Keim and Stambaugh 1984; Wachtel 1942), which serve the mediator in Figure 1; the last section involves seven questions/items for the financial literacy (FL) as the moderator in Figure 1 (Alessie et al. 2011). Please refer to Appendix A for the detailed description of the questionnaire.
It is also worth noting that we collected the answers from the respondents and used the average rating of a section to proxy for the value of a variable for the empirical analysis.

4. Results and Findings

This section reports the results of the empirical analysis, which includes the descriptive statistics, correlation analysis, Cronbach alpha, simple regression, and multiple regression tests.

4.1. Descriptive Statistics

Table 1 reports the summary statistics of respondents. The descriptive statistics show that our sample contains 488 male and 188 female respondents, which accounts for 68.67% and 31.33% of the sample population, respectively. Among the respondents, 66.33% are married while 33.67% are unmarried. The findings indicate that married respondents involve more in stock trading as compared to unmarried. As for the “Qualification”, interestingly, 52.17% of the respondents carry master’s degrees, while the percentage of respondents who carry an intermediate, bachelor, Mphil, and PhD degree are 7%, 19%, 19.33%, and 2.5%, respectively. In terms of “Experience”, the highest percentage of respondents (36.17%) have “5 to 6 years’ experience in the stock market, followed by “7 To onward” (24.5%), “1 To 2 years” (21.17%), and “3 To 4 Years” (18.16%).

4.2. Cronbach’s Alpha, Summary Statistics, and Correlation Analysis

We used the Pearson correlation to measure the direction or strength of relationship of continuous data and report the result in Table 2. The table represents the Cronbach’s alpha value, mean, and standard deviation for each variable, except for the demographic factors, such as gender (GDR), marital status (MS), qualification (Qual), and experience (Expr), in the first three columns and the correlation between the variables in the remaining columns. The figures from the third column of the table show that the mean value of all the variables is close to 4, indicating that the respondents agreed with the questions. In correlation analysis, investment decision (ID) has a positive correlation with herding bias (HB), disposition effect (DE), fundamental anomalies (FA), technical anomalies (TA), calendar anomalies (CA), and financial literacy (FL). It has a negative correlation with overconfidence bias. Moreover, herding bias (HB) has a positive correlation with all variables except overconfidence bias (OB). The results in this correlation analysis show that disposition effect (DE) has a positive correlation with herding bias (HB), disposition effect (DE), fundamental anomalies (FA), technical anomalies (TA), calendar anomalies (CA), and financial literacy (FL). However, it has a negative correlation with overconfidence bias (OB). Overconfidence bias (OB) has a positive correlation with fundamental anomalies (FA) and calendar anomalies (CA), but it has a negative correlation with technical anomalies (TA) and financial literacy (FL). Fundamental anomalies (FA) has a negative correlation with technical anomalies (TA), calendar anomalies (CA), and financial literacy (FL).
Accordingly, for all the elements of each scale to be internally consistent and reliable, the value of the Cronbach’s alpha should be greater than 0.70. As can be seen from the table, the values of Cronbach’s alpha for all the variables are above 0.70; specifically, the values of Cronbach’s alpha for investment decision, herding bias, disposition effect, overconfidence bias, fundamental anomalies, technical anomalies, calendar anomalies, and financial literacy are 0.879, 0.929, 0.896, 0.927, 0.806, 0.893, 0.939, and 0.889, respectively. The results indicate the high reliability within the tested items of the questionnaire.

4.3. Factor Loadings, Composite Reliability, and Average Variance Extracted (Measurement Model)

We use confirmatory factor analysis (CFA) to determine the factor loading of every observed variable on the latent variable. This technique is applied to verify the factor structure for a set of observed variables. By implementing the analysis, we can test the hypothesis for the existence of relationships between the observed variables and the underlying latent constructs. The analysis also examines the factor loadings of primary variables to emerge from regression analysis. This analysis evaluates the construct validity. We use two models in CFA analysis that include measurement model and structural model. The convergent validity and divergent validity are checked in the measurement model. The factor loading, composite reliability (CR) and average variance extracted (AVE) for convergent validity are utilized for the construct’s validity. In Table 3, the value of items is above the value of the threshold, i.e., 0.50 (Hinkin 1998). Furthermore, the values of composite reliability (CR) and average various extracted (AVE) are also in an acceptable range. The divergent validity is checked through discriminant validity (Table 4) and model fit indices (Table 5). The structural model is shown in Figure 2.
For discriminant validity assessment, the square root of AVE on diagonal must be greater than the correlation on off diagonal values (Barclay et al. 1995; Fornell and Larcker 1981). Table 4 reports the results for the discriminant validity. As is shown in the table, the diagonal values of all constructs are greater than off diagonal values, indicating no discriminant validity issue or strong discriminant validity.

4.4. Model Fit Indices

As stated previously, we used confirmatory factor analysis to check the structural validity of the measurement model. Table 5 demonstrates that the model is in acceptable range and has good validity and reliability of the variables. Table 5 also defines the value of model fit indices for the eight-factor model and all the values are accordingly within the threshold, i.e., normed chi-square X2/DF = 1.45, comparative fit index CFI = 0.96, Tucker–Lewis index TLI = 0.97, goodness-of-fit index GFI = 0.98, incremental fit index IFI = 0.86, root mean square error of approximation RMSEA = 0.04, and root mean square residual RMR = 0.03. The above figures indicate that the eight-factor model used in this study is best matched with data. The eight-factor model describes that our structural equation model is fit for regression analysis because the value of each variable is in an acceptable range. Overall, the model demonstrates a good fit to the data based on the full range of model fit indices.

4.5. Direct Effect

We ran fifteen simple regressions to test the direct effect between variables as hypothesized in H1 to H9 and report the results in Table 6; in particular, the confirmation or rejection of the hypotheses is shown in column (5) of Table 6. Critical ratio and P are used to measure the significance of the hypotheses. The (CR) critical value must be greater than 1.96, and this is based on the significance level of 0.05.
The empirical results in Table 6 indicate that overconfidence bias (OB) has a direct relationship with technical anomalies (TA) (β = 0.057 ***, p < 0.05) and calendar anomalies (CA) (β = 0.848 ***, p < 0.05), which lends support to accepting hypotheses H1b and H1c. However, overconfidence bias (OB) does not have any significant association with fundamental anomalies (β = −0.003, p > 0.05), leading to the rejection of H1a. Disposition effect (DE) has a direct relationship with fundamental anomalies (β = 0.380 ***, p < 0.05), technical anomalies (β = 0.247 ***, p < 0.05), and calendar anomalies (CA) (β = 0.205 ***, p < 0.05), which presents the acceptance of hypotheses H2a, H2b, and H2c. The table also reveals that herding bias (HB) has a direct association with fundamental anomalies (FA) (β = 0.447 ***, p < 0.05), technical anomalies (TA) (β = 0.390 ***, p < 0.05), and calendar anomalies (CA) (β = 0.309 ***, p < 0.05), supporting hypotheses H3a H3b, and H3c. Fundamental anomalies have a direct relationship with investment decision (β = 00.100 **, p < 0.05) and that leads to the acceptance of hypothesis H4. However, we do not find any significant evidence on the direct effect of technical anomalies (β = 0.031, p > 0.05) and calendar anomalies (β = −0.014, p > 0.05) on investment decisions and thus reject hypotheses H5 and H6. We also find a direct effect of herding bias (HB) on investment decision (ID) (β = 0.875 ***, p < 0.05), lending support to accepting hypothesis H7. Overconfidence bias and disposition effect insignificantly explain the investment decisions and we thus reject hypotheses H8 and H9.

4.6. Indirect Effect of Behavioral Biases on Investment Decisions through the Mediators

As we can see from Table 6, the behavioral biases and market anomalies are closely associated and both factors influence investors’ investment decision making. Therefore, we are interested in examining whether the market anomalies may serve as a mediator for the association between the behavioral biases and the investors’ decision making. Completing the test helps to clarify the nature of the relationship between behavioral biases and investors’ decision making. For this purpose, we use the bootstrap method on AMOS software and run a “path analysis” to test the relationship amongst the mediators and report the results in Table 7.
The general rule to determine whether the mediation effect of the stock market anomalies exists is to see whether 0 lies in between the values of the “lower bound” and the “upper bound”. If so, the mediation role is rejected. The results from the first two rows of the table confirm the mediating role of fundamental anomalies (FA) and technical anomalies (TA) between the overconfidence bias (OB) and the investment decisions (ID). The result reveals that overconfidence biases from investors lead to certain aggregate market anomalies (e.g., fundamental and technical anomalies), and that, in turn, influences the investors’ further investment decision making (Abdin et al. 2018). Furthermore, as can be seen from the sixth row of the table, calendar anomalies (CA) mediate between the disposition effect (DE) and the investment decisions (ID). The result indicates that investors’ different treatment towards their assets (e.g., investors may evaluate their gains and losses separately) cause the calendar anomalies, such as the January effect documented in the literature (e.g., Haug and Hirschey 2006), and that, in turn, influences the investors’ investment decision making. Lastly, the result from the last row of the table unveils that the calendar anomalies (CA) also have a mediation role between the herding bias (HB) and the investment decisions (ID). The result has some practical implications. For example, information asymmetry in the market probably influences the herding behavior (Ben Mabrouk 2018) as human nature has a common tendency to imitate, refer to, and observe others’ behavior during irregular conditions in the market (Yu et al. 2018). In aggregate, the herding behaviors of investors may cause some market anomalies (e.g., calendar anomalies) that, in turn, will further impact the investors’ investment decision making and may potentially harm the investment performance (Filiz et al. 2018). It is also worth noting that herding may be more profound during market stress, such as misrepresentation, price bubbles, and rumors (Mertzanis and Allam 2018).

4.7. Moderating Role of Financial Literacy between Behavioral Biases and Fundamental Anomalies

As hypothesized in Section 2, we are interested in testing whether the financial literacy moderates the association between the behavioral biases and the market anomalies. We first use a multiregression model to test the role of financial literacy between behavioral biases and fundamental anomalies and present the results in Table 8. In all the regressions, the dependent variable is the fundamental anomalies (FA); the independent variable is one of the behavioral biases, such as overconfidence bias (OB), disposition effect (DE), or herding (HB); and the moderating variable is the financial literacy (FL). It is worth noting that in each regression, we interact the financial literacy (FL) with one behavioral bias to test whether financial literacy (FL) can moderate the effect between the behavioral biases and the fundamental anomalies (FA). Specifically, if the association between behavioral biases and the fundamental anomalies (FA) is positive and significant while financial literacy (FL) can moderate the association, we expect the coefficients for the interaction terms to be negative and significant. As evident in column (1) of Table 8, we find a negative and significant coefficient for the interaction between overconfidence bias (OB) and fundamental anomalies (FA) (β = −0.419 ***, p < 0.05), and the results thereby lend support to hypothesis 10a that the financial literacy (FL) significantly moderates the association between overconfidence bias (OB) and fundamental anomalies (FA). However, we fail to find any empirical evidence to support the moderation effect of the financial literacy (FL) for the association between disposition effect (DE) and fundamental anomalies (FA) and between herding bias (HB) and fundamental anomalies (FA) as the coefficients for both interaction terms are positive but insignificant. Thus, we only accept hypothesis 10a but reject 10b and 10c.

4.8. Moderating Role of Financial Literacy between Behavioral Biases and Technical Anomalies

Similarly, the study uses the multiregression model to test the role of financial literacy between behavioral biases and technical anomalies (TA) and reports the results in Table 9. The regression model is similar to the one in Table 8, except that the dependent variable is the technical anomalies (TA) and the variables of interest are the interaction terms between behavioral biases and the technical anomalies (TA). The empirical result from column (1) of Table 9 reveals that there is a negative and significant coefficient on the interaction term between overconfidence bias (OB) and financial literacy (FL) (β = −0.344 ***, p < 0.05), indicating that there exists a moderating role of financial literacy (FL) between overconfidence bias (OB) and technical anomalies (TA), thus supporting hypothesis 11a. However, the coefficients on the interactions between disposition effect (DE) and financial literacy (FL) and between herding bias (HB) and financial literacy (FL) are negative and insignificant (β = −0.041, p > 0.05) and positive and insignificant (β = 0.047, p > 0.05), respectively, suggesting a rejection of hypotheses 11b and 11c.

4.9. Moderating Role of Financial Literacy between Behavioral Biases and Calendar Anomalies

Table 10 reports the results for the moderating role of financial literacy (FL) between behavioral biases and calendar anomalies (CA). Similar to the regression model in Table 8 and Table 9, multiregression is used in Table 10, except that the dependent variable is the calendar anomalies (CA) and the variables of interest are the interaction terms. The results from column (1) of Table 10 reveal that hypothesis 12a is rejected because the coefficient for the interaction term between overconfidence bias (OB) and financial literacy (FL) is positive but insignificant (β = 0.079, p > 0.05). However, the results from columns (2) and (3) lend support to both hypotheses 12b and 12c as the coefficients for both interaction terms are negative and significant (β = −1.264 ***, p < 0.05) and (β = −1.050 ***, p < 0.05), respectively. The results indicate that financial literacy significantly and negatively moderates the association between disposition effect (DE) and calendar anomalies (CA) and the association between herding bias (HB) and calendar anomalies (CA).
Overall, the Figure 3 summarizes the results of the structural model of the study.

5. Discussion

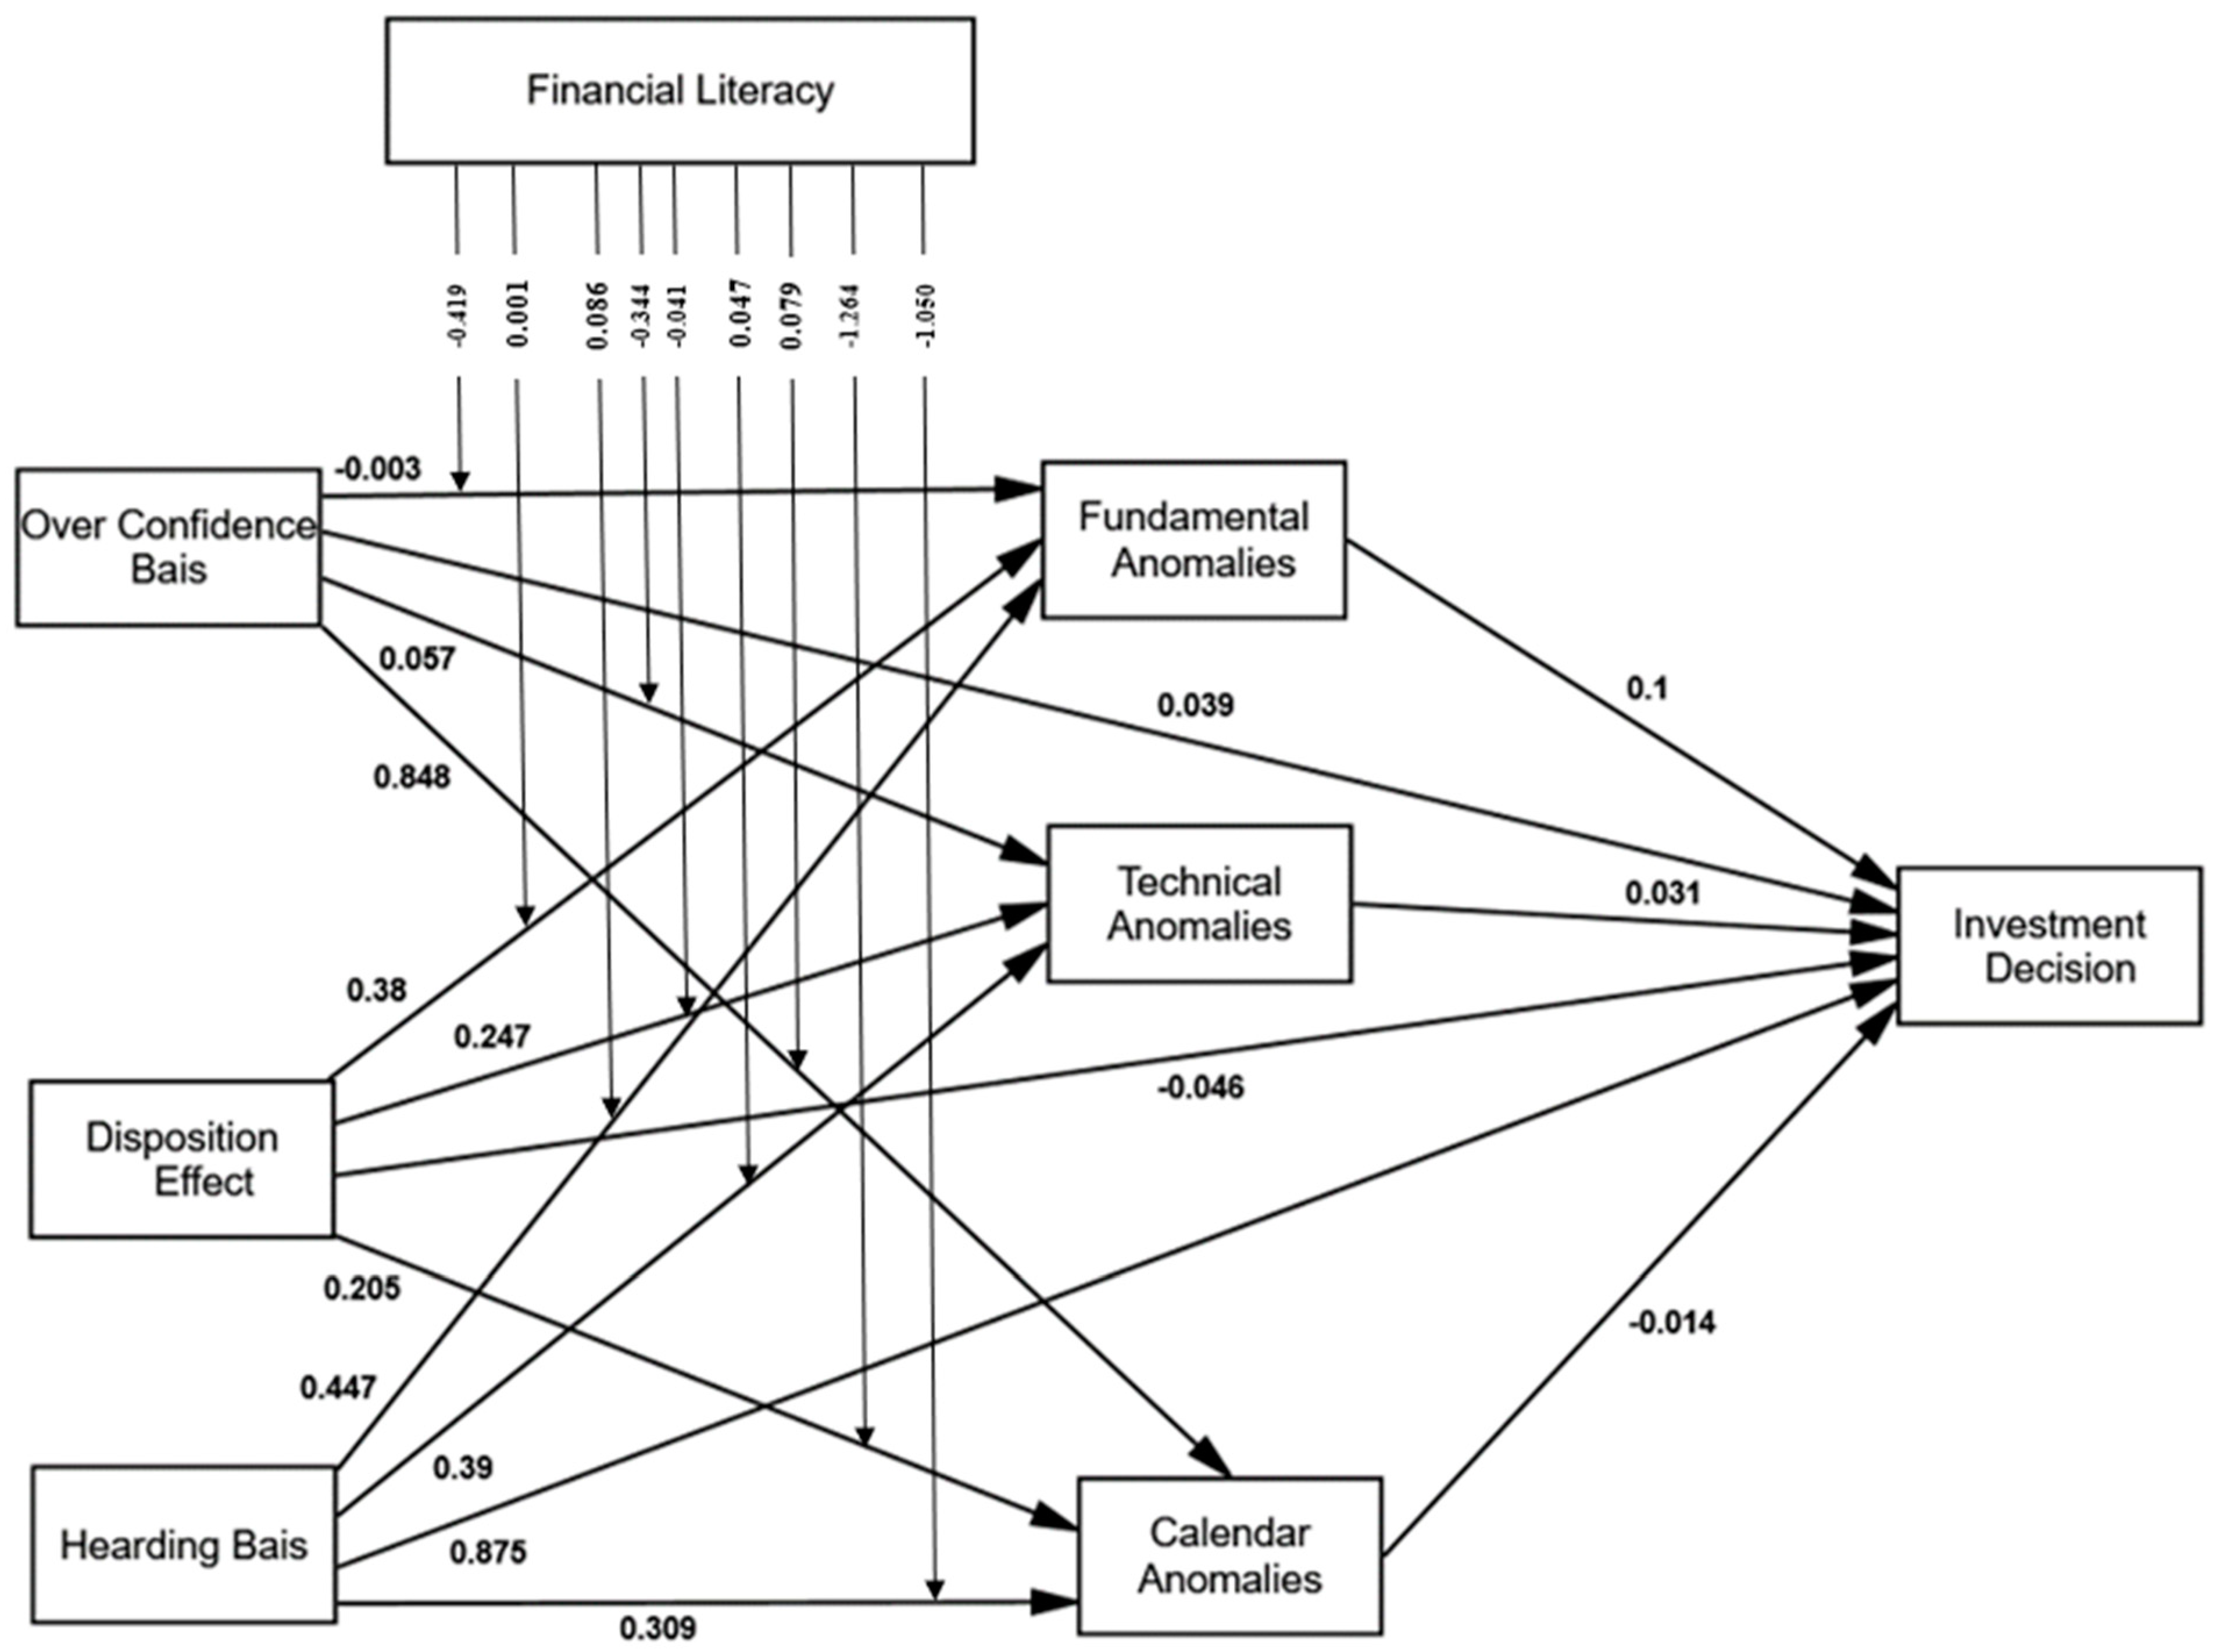
This section provides a summary and further discussion on the empirical results. The results from Table 6 indicate that overconfidence bias (OB) has no significant relationship with fundamental anomalies, lending support to the rejection of H1a. This result suggests that fundamental anomalies (FA) are not explained by the overconfidence behavior of investors, although the extant literature suggests that investors’ behavior can cause fundamental anomalies in the market (Abdin et al. 2018). However, the results from Table 6 also suggest that overconfidence bias (OB) has a direct relationship with technical anomalies (TA), leading to the acceptance of H1b. The evidence does support findings from the extant literature that investors’ behavior in the stock market can lead to the creation of technical anomalies (TA), such as earnings announcement anomalies, the creation of an unusually bullish or bearish market, and high trading volume in the market (Baker et al. 2007; Chou et al. 2021; Ahmad et al. 2017a). Furthermore, the results from Table 6 reveal that overconfidence bias (OB) also has a direct positive relationship with calendar anomalies, ensuring the acceptance of hypothesis H1c. The results suggest that the overconfidence behavior in the market would create calendar anomalies, such as a January effect, as documented in the extant literature (e.g., Khan et al. 2017; Mitroi and Stancu 2014; Lee et al. 2013).
The results from Table 6 also demonstrate that the disposition effect (DE) has a direct relationship with stock market anomalies (i.e., fundamental, technical and calendar anomalies), accepting hypotheses H2a, H2b, and H2c. The extant literature has documented multiple pieces of evidence that the presence of a disposition effect in the stock market resultantly strengthens the stock market anomalies (Taffler et al. 2017; Singh 2016). For example, investors are inclined to sell winning stocks and hold losing stocks. Investors who kept their losing investment for a long time and sold winning stock too early may cause disposition for different asset classes (Shefrin and Statman 1985). This happens due to risk aversion behavior and perceived risk, which is in support of prospect theory (Grinblatt and Han 2005). Overall, the study accepts H2a, H2b, and H2c.
Similarly, the results from Table 6 confirm the direct link between herding behaviors (HB) and stock market anomalies, supporting H3a, H3b, and H3c. The results imply that the herding behaviors of the investors in the stock market is also the reason for stock market anomalies. Investors provided themselves with inferior information and others have superior information (Shukla et al. 2020). Herding behavior in the stock market is because of loss and risk avoidance (Ullah and Elahi 2015). It depends upon market fundamentals and stock price fluctuations. Investors act irrationally in their judgments, which most likely causes anomalies in the market (Pompian 2011). Overall, the study accepts H3a, H3b, and H3c.
Furthermore, the results from Table 6 suggest that the fundamental anomalies (FA) have a positive and significant association with the investment decisions (ID), lending support to H4. The result implies that investors do rely on the existing fundamental anomalies in the market, such as the deviation of stock price from its intrinsic value, to make further investment decisions, which is consistent with some empirical findings in the extant literature (Pompian 2011; Abdin et al. 2018; Singh 2016). For instance, investors may follow growing stocks and abandon value stocks for their investment decisions. However, the results from Table 6 do not support H5 or H6, indicating that technical and calendar anomalies are less attractive in terms of investors’ investment decision making.
Moreover, the results from Table 6 indicate that the herding bias (HB) has a direct positive relationship on the investment decisions of investors, accepting hypothesis H7. The findings reveal that the investors in the stock market follow the moves of other investors during their stock trading because of risk averse and loss averse attitudes; the herding behavior of the investors, in turn, influences the investors’ further investment decision making (Daniel et al. 2002; Krugman 2009; Ullah and Elahi 2015). Inversely, overconfidence bias (OB) and disposition effect (DE) are far less attractive in terms of investors’ investment decision making, and the result does reject H8 and H9. It is worth noting that the results from Table 7 confirm the mediating role of certain stock market anomalies for the association between certain behavioral biases and investment decisions.
Table 8, Table 9 and Table 10 report the results related to the moderation role of financial literacy (FL) between various behavioral biases and stock market anomalies, representing hypotheses 10, 11, and 12. As can be seen from the tables, financial literacy (FL) plays a significant role between certain behavioral biases and stock market anomalies. The overall results from the tables thereby lend support to H10a, H11a, H12b, and H12c, but not H10b, H10c, H11b, H11c, and H12a. Our findings are consistent with some empirical evidence from the extant literature; for instance, financial literacy lessens the level of behavioral biases of the investors as investors with better financial literacy can continuously use the appropriate tools and methods to estimate equity value more accurately and thus make more rational investment decisions (Mirza et al. 2022; Thanki et al. 2022; Giesler and Veresiu 2014).
Interestingly, most of our findings, as well as some investors’ irrational behaviors, can be explained by the behavioral finance theories, such as prospect theory. For example, the investors in the stock market are psychologically biased and are more sensitive to loss rather than gain. Psychologically biased investors create biases in the market, due to which the investor deviates from the actual returns. The existence of behavioral biases in the market can create anomalies in the stock market, which effects the investment decisions of the investor.

6. Conclusions

The study aims to identify the effect of behavioral biases on the investors’ investment decision making, as well as the roles that stock market anomalies and financial literacy play during the decision making process. For this purpose, we design a structured questionnaire, distribute the questionnaire to the investors from the two floors of the Pakistan Stock Exchange (i.e., Lahore and Islamabad Stock Exchange), and collect the responses from the investors as our primary data. Specifically, we collect the responses of 687 investors, but only 600 out of 687 reports are correctly completed, and the information from the reports, in turn, serves as our primary data for the empirical study. Through the empirical analysis, we first document the empirical evidence to support that the behavioral biases and market anomalies are closely associated and that these two factors significantly influence the investors’ investment decision making. The additional empirical findings also confirm the mediating roles of certain market anomalies in the association between the investors’ behavioral biases and their investment decision making. Furthermore, empirical evidence reveals that financial literacy moderates the association between behavioral biases and market anomalies, and eventually influences the investors’ investment decision making. Although the results are inconclusive from different regression models, the study does provide us a better understanding of behavioral finance theories (e.g., prospect theory). In addition, the study helps to identify the causes of stock market inefficiency and, in turn, helps investors make optimal investment decisions. Furthermore, the empirical results of the study highlight the importance of financial literacy biases in terms of optimal investment decision making of individuals and the stability of the overall stock market. We admit that there are some scope limitations for the study; for instance, we obtain data from a limited source, so the empirical evidence documented in the study may be biased. For future research, we suggest that the data collection needs to cover a wide range of investors from different countries. Moreover, a more comprehensive questionnaire (e.g., including some additional behavioral biases) needs to be designed, and more detail-oriented guidance needs to be provided for investors to answer the questionnaire. It is also worth noting that, through the mediation analyses, we attempt to potentially address the causality effect between behavioral bias, market anomalies, and investment decision making; however, due to the scope limit, we cannot identify a good instrument and run the instrumental variable method to fully address the endogeneity concern in our analysis.1 Thus, the empirical evidence we document in the study has limitations in terms of the causality effect between different variables. We thereby suggest that future research in this area should seek appropriate instruments and apply the instrumental variable method to further address the issue.

Author Contributions

Conceptualization, Z.U.A. and Z.A.; Methodology, Z.A. and H.Q.; Software, Z.A.; Validation, Z.A., H.Q. and Y.Z.; Formal analysis, Z.U.A. and Z.A.; Investigation, H.Q. and Y.Z.; Resources, Z.U.A. and Z.A.; Data curation, Z.U.A. and Z.A.; Writing—original draft preparation, Z.U.A. and Z.A.; Writing—review and editing, H.Q. and Y.Z.; Visualization, H.Q.; Supervision, H.Q. and Y.Z.; Project administration, H.Q. and Y.Z.; Funding acquisition, Y.Z. All authors have read and agreed to the published version of the manuscript.

Funding

This research received no external funding.

Data Availability Statement

The data presented in this study are available on request.

Acknowledgments

We thank the Risks’ editors and anonymous reviewers for their critical intellectual contributions pertaining to our current manuscript. We also greatly appreciate the financial support from the Longwood University College of Business and Economics Mini-Grant.

Conflicts of Interest

The authors declare no conflict of interest.

Appendix A. Questionnaire

I am conducting research on behavioral biases and investment decision. The information obtained through this questionnaire will be confidential and only be used for research purpose. Therefore, it is requested you to please cooperate. Thank you.
Risks 11 00109 i002
1. Name:______________________ 2. Designation:__________________________
3. Gender: Risks 11 00109 i001 Male Risks 11 00109 i001 Female  4. Marital Status: Risks 11 00109 i001 Married Risks 11 00109 i001 Un-Married
5. Qualification: _______________________ 6. Experience: _______________
7. Investment Level Current Year 8. Investment Level Last Year
The following statements relate to your opinion about Investment Decision
  • Please indicate the extent of agreement with each of the below question.
Strongly DisagreeDisagreeNeutralAgreeStrongly Agree
Please tick only one number.
1The return rate of your recent stock investment meets your expectation.12345
2Your rate of return is equal to or higher than the average return rate of the market.12345
3You feel satisfied with your investment decisions in the last year (including selling, buying, choosing stocks, and deciding the stock volumes).12345
The following statements relate to your opinion about Herding Bias
  • Please indicate the extent of agreement with each of the below question.
Strongly DisagreeDisagreeNeutralAgreeStrongly Agree
Please tick only one number.
1Other investors’ decisions of choosing stock types have impact on your investment decisions12345
2Other investors’ decisions of the stock volume have impact on your investment decisions12345
3Other investors’ decisions of buying and selling stocks have impact on your investment decisions12345
4You usually react quickly to the changes of other investors’ decisions and follow their reactions to the stock market12345
5You believe that your skills and knowledge of stock market can help you to outperform the market.12345
6You rely on your previous experiences in the market for your next investment12345
7You forecast the changes in stock prices in the future based on the recent stock prices12345
The following statements relate to your opinion about Disposition Effect
  • Please indicate the extent of agreement with each of the below question.
Strongly DisagreeDisagreeNeutralAgreeStrongly Agree
Please tick only one number.
1You believe to sell your stock early when it gives you a small profit.12345
2You believe to sell your stock early when it gives you a small loss.12345
3You hold your losing stock until it gives you a profit.12345
4You did not want a huge profit on your stock12345
5You did not hold a stock for a long period of time12345
6You prefer selling the wining stock rather than holding it12345
The following statements relate to your opinion about Overconfidence Bias
  • Please indicate the extent of agreement with each of the below question.
Strongly DisagreeDisagreeNeutralAgreeStrongly Agree
Please tick only one number.
1Do you think that your decision on investment is always right?12345
2Do you think that your decision is better as compares to others?12345
3You believe that your analysis related to stock is always right?12345
4Do you think that other people have less knowledge of stock as compare to you?12345
5You never follow other people decision.12345
6You always give a priority to your own decision because you think that you are right.12345
The following statements relate to your opinion about Fundamental Anomalies
  • Please indicate the extent of agreement with each of the below question.
Strongly DisagreeDisagreeNeutralAgreeStrongly Agree
Please tick only one number.
1How the value of firm effects your investment decision.12345
2The neglected stocks have a priority in your investment decision.12345
3Did you prefer those firms during your investment decision Who give high dividend?12345
4Small cap Firms always attract you during investment decision.12345
The following statements relate to your opinion about Technical Anomalies
  • Please indicate the extent of agreement with each of the below question.
Strongly DisagreeDisagreeNeutralAgreeStrongly Agree
Please tick only one number.
1The Analysis before making you investment is always useful.12345
2Did you always make analysis before investment decision?12345
3Do you think that analysis before investment is necessary?12345
4Do you think that movement in stock market can be measured Through analysis?12345
The following statements relate to your opinion about Calendar Anomalies
  • Please indicate the extent of agreement with each of the below question.
Strongly DisagreeDisagreeNeutralAgreeStrongly Agree
Please tick only one number.
1How the different days in a week effects your investment decision.12345
2Did your investment decision change during the whole year due to Change in calendar?12345
3How the financial year end effects your investment decision?12345
4Did you withdrawal your investment on weekend?12345
The following statements relate to your opinion about Financial Literacy
  • Please indicate the extent of agreement with each of the below question.
Strongly DisagreeDisagreeNeutralAgreeStrongly Agree
Please tick only one number.
1I know how the stock market works.12345
2I am somewhat knowledgeable of stock market activities on the PSX.12345
3I usually give advice about finances to my friends.12345
4I believe that personal financial literacy can help lead a financially secure investment.12345
5I usually attend seminars, conferences & workshops hosted by the PSX at least 3 times a year.12345
6I usually visit the PSX website (at least every 3 months).12345
7I usually follow the stock market through financial News (TV, Newspaper, Financial reports, prospectus and manuals).12345

Note

1
We thank the anonymous reviewer for pointing out the limitations on the causality analysis in our analyses.

References

  1. Abdin, Syed Zain Ul, Naheed Sultana, Mariam Farooq, and Syed Zulfiqar Ali Shah. 2017. Stock market anomalies as mediators between prospect factors and investment decisions and performance: Findings at the individual investor level. The Lahore Journal of Business 6: 22–40. [Google Scholar]
  2. Abdin, Syed Zain Ul, Omer Farooq, Naheed Sultana, and Mariam Farooq. 2018. The impact of heuristics on investment decision and performance: Exploring multiple mediation mechanisms. Research in International Business and Finance 42: 674–88. [Google Scholar] [CrossRef]
  3. Abul, Sadeq. 2019. Factors influencing individual investor behaviour: Evidence from the Kuwait stock exchange. Asian Social Science 15: 27–39. [Google Scholar] [CrossRef] [Green Version]
  4. Achelis, Steven B. 2001. Technical Analysis from A to Z. New York: McGraw Hill. [Google Scholar]
  5. Adil, Mohd, Yogita Singh, and Mohd Shamim Ansari. 2022. How financial literacy moderate the association between behaviour biases and investment decision? Asian Journal of Accounting Research 7: 17–30. [Google Scholar] [CrossRef]
  6. Aftab, Mahmooda. 2020. Behavioral Biases as Predictors of Investment Decision of Individual Investors in Pakistan. Available online: https://ssrn.com/abstract=3619580 (accessed on 19 May 2023). [CrossRef]
  7. Ahmad, Maqsood, and Syed Zulfiqar Ali Shah. 2020. Overconfidence heuristic-driven bias in investment decision-making and performance: Mediating effects of risk perception and moderating effects of financial literacy. Journal of Economic and Administrative Sciences 38: 60–90. [Google Scholar] [CrossRef]
  8. Ahmad, Zamri, Haslindar Ibrahim, and Jasman Tuyon. 2017a. Behavior of fund managers in Malaysian investment management industry. Qualitative Research in Financial Markets 9: 205–39. [Google Scholar] [CrossRef]
  9. Ahmad, Zamri, Haslindar Ibrahim, and Jasman Tuyon. 2017b. Institutional investor behavioral biases: Syntheses of theory and evidence. Management Research Review 40: 578–603. [Google Scholar] [CrossRef]
  10. Ahmed, Mohamed S., and John A. Doukas. 2021. Revisiting disposition effect and momentum: A quantile regression perspective. Review of Quantitative Finance and Accounting 56: 1087–28. [Google Scholar] [CrossRef]
  11. Ahmed, Zeeshan, Shahid Rasool, Qasim Saleem, Mubashir Ali Khan, and Shamsa Kanwal. 2022. Mediating role of risk perception between behavioral biases and investor’s investment decisions. Sage Open 12: 1–18. [Google Scholar] [CrossRef]
  12. Ahn, David, Syngjoo Choi, Douglas Gale, and Shachar Kariv. 2014. Estimating ambiguity aversion in a portfolio choice experiment. Quantitative Economics 5: 195–223. [Google Scholar] [CrossRef] [Green Version]
  13. Akbar, Mona, Aneel Salman, Khurrum S. Mughal, Fahad Mehmood, and Nedim Makarevic Akbar. 2016. Factors affecting the individual decision making: A case study of Islamabad Stock Exchange. European Journal of Economic Studies 15: 242–58. [Google Scholar]
  14. Alessie, Rob, Maarten Van Rooij, and Annamaria Lusardi. 2011. Financial literacy and retirement preparation in the Netherlands. Journal of Pension Economics and Finance 10: 527–45. [Google Scholar] [CrossRef]
  15. Almansour, Bashar Yaser, and Yaser Ahmad Arabyat. 2017. Investment decision making among gulf investors: Behavioural finance perspective. International Journal of Management Studies 24: 41–71. [Google Scholar] [CrossRef]
  16. Al-Tamimi, Hassan, and Al Anood Bin Kalli. 2009. Financial literacy and investment decisions of UAE investors. The Journal of Risk Finance 10: 500–16. [Google Scholar] [CrossRef] [Green Version]
  17. Alvi, Jahanzaib, Muhammad Rehan, and Ismat Mohiuddin. 2021. Calendar Anomalies or illusions? Evidence from Pakistan Stock Market. Ege Academic Review 21: 285–98. [Google Scholar] [CrossRef]
  18. Anjum, Sadia. 2020. Impact of market anomalies on stock exchange: A comparative study of KSE and PSX. Future Business Journal 6: 1–11. [Google Scholar] [CrossRef] [Green Version]
  19. Azzopardi, Paul V. 2010. Behavioral Technical Analysis. Petersfield: Harriman House Limited. [Google Scholar]
  20. Babajide, Abiola Ayopo, and Kehinde Adekunle Adetiloye. 2012. Investors’ behavioral biases and the security market. An empirical study of the Nigerian security market. Accounting and Finance Research 1: 219–29. [Google Scholar] [CrossRef]
  21. Baddeley, Michelle, Chris Burke, Wolfram Schultz, and T. Tobler. 2010. Impacts of Personality on Herding in Financial Decision-Making. Cambridge Working Papers in Economics. Cambridge: Faculty of Economics, University of Cambridge. [Google Scholar]
  22. Baker, H. Kent, Greg Filbeck, and Victor Ricciardi. 2017. How behavioural biases affect finance professionals? The European Financial Review, 25–29. Available online: https://ssrn.com/abstract=2899214 (accessed on 19 May 2023).
  23. Baker, Malcolm, Richard S. Ruback, and Jeffrey Wurgler. 2007. Behavioral corporate finance. In Handbook of Empirical Corporate Finance. Amsterdam: Elsevier, pp. 145–86. [Google Scholar]
  24. Bako, Dana-Elena, and Ioana-Cristina Sechel. 2013. Technical and fundamental anomalies. Paradoxes of modern stock exchange markets. The Annals of the University of Oradea 6: 37–39. [Google Scholar]
  25. Barak, Osman. 2008. Davranışsal Finans Teori ve Uygulama. Ankara: Gazi Kitabevi. [Google Scholar]
  26. Barber, Brad M., and Terrance Odean. 2008. All that glitters: The effect of attention and news on the buying behavior of individual and institutional investors. The Review of Financial Studies 21: 785–818. [Google Scholar] [CrossRef] [Green Version]
  27. Barberis, Nicholas C. 2013. Thirty years of prospect theory in economics: A review and assessment. Journal of Economic Perspectives 27: 173–96. [Google Scholar] [CrossRef] [Green Version]
  28. Barberis, Nicholas, and Richard Thaler. 2003. A survey of behavioral finance. Handbook of the Economics of Finance 1: 1053–128. [Google Scholar]
  29. Barberis, Nicholas, Ming Huang, and Tano Santos. 2001. Prospect theory and asset prices. The Quarterly Journal of Economics 116: 1–53. [Google Scholar] [CrossRef] [Green Version]
  30. Barclay, Donald, Christopher Higgins, and Ronald Thompson. 1995. The partial least squares approach to causal modeling: Personal computer adoption and use as illustration. Technology Studies 2: 285–309. [Google Scholar]
  31. Bashir, Taqadus, Tajalli Fatima, Hafsa Ilyas, and Amir Chudhary. 2013. Impact of cognitive profile and information uncertainty on herding behavior of investor. IOSR Journal of Business and Management 16: 68–74. [Google Scholar] [CrossRef]
  32. Bekiros, Stelios, Mouna Jlassi, Brian Lucey, Kamel Naoui, and Gazi Salah Uddin. 2017. Herding behavior, market sentiment and volatility: Will the bubble resume? North American Journal of Economics and Finance 42: 107–31. [Google Scholar] [CrossRef]
  33. Ben Mabrouk, Houda. 2018. Cross-herding behavior between the stock market and the crude oil market during financial distress. Managerial Finance 44: 439–58. [Google Scholar] [CrossRef]
  34. Bernard, Sabine, Benjamin Loos, and Martin Weber. 2018. The Disposition Effect in Boom and Bust Markets. Available online: https://ssrn.com/abstract=3265135 (accessed on 19 May 2023). [CrossRef]
  35. Boda, Jhansi Rani, and G. Sunitha. 2018. Investor’s psychology in investment decision making: A behavioral finance approach. International Journal of Pure and Applied Mathematics 119: 1253–61. [Google Scholar]
  36. Braha, Dan. 2012. Global civil unrest: Contagion, self-organization, and prediction. PLoS ONE 7: e48596. [Google Scholar] [CrossRef] [Green Version]
  37. Branch, Ben, and Kyungchun Chang. 1990. Low price stocks and the January effect. Quarterly Journal of Business and Economics 29: 90–118. [Google Scholar]
  38. Brealey, Richard, Stewart Myers, and Franklin Allen. 2012. Principles of Corporate Finance. New York: Tata McGraw-Hill Education. [Google Scholar]
  39. Brown, David P., and Robert H. Jennings. 1989. On technical analysis. The Review of Financial Studies 2: 527–51. [Google Scholar] [CrossRef]
  40. Chen, Shu-Bo, Hadi Jahanshahi, Oumate Alhadji Abba, J. E. Solís-Pérez, Stelios Bekiros, J. F. Gómez-Aguilar, Amin Yousefpour, and Yu-Ming Chu. 2020. The effect of market confidence on a financial system from the perspective of fractional calculus: Numerical investigation and circuit realization. Chaos, Solitons and Fractals 140: 110–23. [Google Scholar] [CrossRef]
  41. Chhapra, Imran Umer, Muhammad Kashif, Raja Rehan, and Ashow Bai. 2018. An empirical investigation of investor’s behavioral biases on financial decision making. Asian Journal of Empirical Research 8: 99–109. [Google Scholar] [CrossRef]
  42. Chou, Hsin-I., Mingyi Li, Xiangkang Yin, and Jing Zhao. 2021. Overconfident institutions and their self-attribution bias: Evidence from earnings announcements. Journal of Financial and Quantitative Analysis 56: 1738–70. [Google Scholar] [CrossRef]
  43. Daniel, Kent, David Hirshleifer, and Avanidhar Subrahmanyam. 1998. Investor psychology and security market under and overreactions. The Journal of Finance 53: 1839–85. [Google Scholar] [CrossRef] [Green Version]
  44. Daniel, Kent, David Hirshleifer, and Siew Hong Teoh. 2002. Investor psychology in capital markets: Evidence and policy implications. Journal of Monetary Economics 49: 139–209. [Google Scholar] [CrossRef]
  45. Dar, Nishwa Iqbal, Syed Zulfiqar Ali Shah, and Zeeshan Ahmed. 2021. Behavioral cost of managerial decisions under risk perception and culture: A comparative study between the United States and Pakistan. SAGE Open 11: 1–14. [Google Scholar] [CrossRef]
  46. Darrat, Ali F., Maosen Zhong, and Louis T. W. Cheng. 2007. Intraday volume and volatility relations with and without public news. Journal of Banking and Finance 31: 2711–29. [Google Scholar] [CrossRef]
  47. De Bondt, Werner F. M. 1998. A portrait of the individual investor. European Economic Review 42: 831–44. [Google Scholar] [CrossRef]
  48. De Bondt, Werner, Rosa M. Mayoral, and Eleuterio Vallelado. 2013. Behavioral decision-making in finance: An overview and assessment of selected research. Spanish Journal of Finance and Accounting 42: 99–118. [Google Scholar] [CrossRef]
  49. Dhar, Ravi, and Ning Zhu. 2002. Up Close and Personal. An Individual Level Analysis of the Disposition Effect. Yale ICF Working Paper No. 02-20. Available online: https://ssrn.com/abstract=302245 (accessed on 3 June 2023). [CrossRef] [Green Version]
  50. Dodonova, Anna, and Yuri Khoroshilov. 2005. Applications of Regret Theory to Asset Pricing. Available online: https://ssrn.com/abstract=301383 (accessed on 19 May 2023). [CrossRef]
  51. Dominic, Christy, and Ambuj Gupta. 2020. Psychological factors affecting investors decision making. Journal of Xi’an University of Architecture and Technology 7: 169–81. [Google Scholar]
  52. Doyle, Jake, Udechukwu Ojiako, Alasdair Marshall, Ian Dawson, and Mario Brito. 2021. The anchoring heuristic and overconfidence bias among frontline employees in supply chain organizations. Production Planning and Control 32: 1–18. [Google Scholar] [CrossRef]
  53. Elizabeth, Jessica, Werner Ria Murhadi, and Bertha Silvia Sutejo. 2020. Investor behavioral bias based on demographic characteristics. Paper presented at 17th International Symposium on Management, Vũng Tàu, Vietnam, February 19–21; Amsterdam: Atlantis Press, pp. 6–12. [Google Scholar]
  54. Etzioni, Amitai. 2014. Humble decision-making theory. Public Management Review 16: 611–19. [Google Scholar] [CrossRef]
  55. Farooq, Aisha, and Muhammad Sajid. 2015. Factors affecting investment decision making: Evidence from equity fund managers and individual investors in Pakistan. Research Journal of Finance and Accounting 6: 62–69. [Google Scholar]
  56. Filiz, Ibrahim, Thomas Nahmer, Markus Spiwoks, and Kilian Bizer. 2018. Portfolio diversification: The influence of herding, status-quo bias, and the gambler’s fallacy. Financial Markets and Portfolio Management 32: 167–205. [Google Scholar] [CrossRef]
  57. Foorthuis, Ralph. 2021. On the nature and types of anomalies: A Review. arXiv arXiv:2007.15634. [Google Scholar]
  58. Forbes, William Patrick, Michael Pogue, and Lynn Hodgkinson. 2016. CEO pay in UK FTSE 100: Pay inequality, board size and performance. The European Journal of Finance 22: 712–31. [Google Scholar] [CrossRef] [Green Version]
  59. Fornell, Claes, and David F. Larcker. 1981. Structural equation models with unobservable variables and measurement error: Algebra and statistics. Journal of Marketing Research 18: 39–50. [Google Scholar] [CrossRef]
  60. Frydman, Cary, and Antonio Rangel. 2014. Debiasing the disposition effect by reducing the saliency of information about a stock’s purchase price. Journal of Economic Behavior and Organization 107: 541–52. [Google Scholar] [CrossRef] [Green Version]
  61. Gao, Huasheng, Donghui Shi, and Bin Zhao. 2021. Does good luck make people overconfident? Evidence from a natural experiment in the stock market. Journal of Corporate Finance 68: 101933. [Google Scholar] [CrossRef]
  62. Giesler, Markus, and Ela Veresiu. 2014. Creating the responsible consumer: Moralistic governance regimes and consumer subjectivity. Journal of Consumer Research 41: 840–57. [Google Scholar] [CrossRef]
  63. Giles, Emma L., Shannon Robalino, Elaine McColl, Falko F. Sniehotta, and Jean Adams. 2014. The effectiveness of financial incentives for health behavior change: Systematic review and meta-analysis. PLoS ONE 9: e90347. [Google Scholar] [CrossRef] [PubMed] [Green Version]
  64. Giovanis, Eleftherios. 2016. The month-of-the-year effect: Evidence from GARCH models in fifty-five stock markets. Aydın İktisat Fakültesi Dergisi 1: 20–49. [Google Scholar] [CrossRef] [Green Version]
  65. Gong, Weili, Silin Li, and Hongxin Yu. 2022. Herding behavior in China’s stock market under the background of implementation of the SHKSC policy. Discrete Dynamics in Nature and Society 2022: 1–10. [Google Scholar] [CrossRef]
  66. Götz, Oliver, Kerstin Liehr-Gobbers, and Manfred Krafft. 2009. Evaluation of Structural Equational Models Using the Partial Least Square (PLS) Approach. Berlin: Springer. [Google Scholar]
  67. Graham, John R., Campbell R. Harvey, and Hai Huang. 2009. Investor competence, trading frequency, and home bias. Management Science 55: 1094–106. [Google Scholar] [CrossRef] [Green Version]
  68. Grinblatt, Mark, and Bing Han. 2005. Prospect theory, mental accounting, and momentum. Journal of Financial Economics 78: 311–39. [Google Scholar] [CrossRef]
  69. Guin, L. 2005. Handout on Market Anomalies in the Course Investment Management. Ph.D. dissertation, Professor in Finance, Department of Economics and Finance, Murray State University, Murray, KY, USA. [Google Scholar]
  70. Hasler, Andrea, and Annamaria Lusardi. 2019. Financial Fragility among Middle-Income Households: Evidence beyond Asset Building. GFLEC Working Paper. Available online: https://gflec.org/wp-content/uploads/2019/04/Financial-Fragility-among-Middle-Income-Households-WP-2019-1-v2-3.pdf (accessed on 19 May 2023).
  71. Haug, Mark, and Mark Hirschey. 2006. The January effect. Financial Analysts Journal 62: 78–88. [Google Scholar] [CrossRef]
  72. Hayat, Amir, and Muhammad Anwar. 2016. Impact of Behavioral Biases on Investment Decision. Moderating Role of Financial Literacy. Available online: https://ssrn.com/abstract=2842502 (accessed on 19 May 2023). [CrossRef]
  73. Hilgert, Marianne A., Jeanne M. Hogarth, and Sondra G. Beverly. 2003. Household financial management: The connection between knowledge and behavior. Federal Reserve Bulletin 89: 309. [Google Scholar]
  74. Hinkin, Timothy R. 1998. A brief tutorial on the development of measures for use in survey questionnaires. Organizational Research Methods 1: 104–21. [Google Scholar] [CrossRef]
  75. Hoffmann, Arvid OI, and Hersh Shefrin. 2014. Technical analysis and individual investors. Journal of Economic Behavior and Organization 107: 487–511. [Google Scholar] [CrossRef]
  76. Hsiao, Yu-Jen, and Wei-Che Tsai. 2018. Financial literacy and participation in the derivatives markets. Journal of Banking and Finance 88: 15–29. [Google Scholar] [CrossRef]
  77. Huang, Jian-bai, Na Tan, and Mei-rui Zhong. 2014. Incorporating Overconfidence into Real Option Decision-Making Model of Metal Mineral Resources Mining Project. Discrete Dynamics in Nature and Society 2014: 232516. [Google Scholar] [CrossRef] [Green Version]
  78. Huang, Teng-Ching, Ching-Chih Wu, and Bing-Huei Lin. 2016. Institutional herding and risk–return relationship. Journal of Business Research 69: 2073–80. [Google Scholar] [CrossRef]
  79. Idris, Faoziah Haji, K. Sarojani Devi Krishnan, and Norfiza Azmi. 2013. Relationship between financial literacy and financial distress among youths in Malaysia. An empirical study. Geografia-Malaysian Journal of Society and Space 9: 106–17. [Google Scholar]
  80. Iqbal, Arslan, Farooq Ahmed, and Ali Raza Shafi. 2014. The effect of dividend bubble on share price: Evidence from KSE-30 index. Research Journal of Finance and Accounting 5: 83–87. [Google Scholar]
  81. Iqbal, Naveed. 2015. Impact of optimism bias on investment decision: Evidence from Islamabad Stock Exchange Pakistan. Research Journal of Finance and Accounting 6: 74–79. [Google Scholar]
  82. Ishfaq, Muhammad, Mian Sajid Nazir, Muhammad Ali Jibran Qamar, and Muhammad Usman. 2020. Cognitive bias and the Extraversion personality shaping the behavior of investors. Frontiers in Psychology 11: 1–11. [Google Scholar] [CrossRef]
  83. Islam, Sohani. 2012. Behavioral finance of an inefficient market. Global Journal of Management and Business Research 12. Available online: https://www.journalofbusiness.org/index.php/GJMBR/article/view/770 (accessed on 19 May 2023).
  84. Joo, Bashir Ahmad, and K. Durri. 2017. Influence of overconfidence, optimism and pessimism on the rationality of the individual Investors: An empirical analysis. Pacific Business Review International 9: 7–13. [Google Scholar]
  85. Kahneman, Daniel, and Amos Tversky. 1979. Prospect theory: An analysis of decision under risk. Econometrica 47: 263–91. [Google Scholar] [CrossRef] [Green Version]
  86. Kamoto, Shinsuke. 2014. Impacts of internal financing on investment decisions by optimistic and overconfident managers. European Financial Management 20: 107–25. [Google Scholar] [CrossRef]
  87. Katper, Naveeda K., Muhammad Azam, Nazima Abdul Karim, and Syeda Zinnaira Zia. 2019. Behavioral biases and investors’ decision-making: The moderating role of socio-demographic variables. International Journal of Financial Engineering 6: 1–15. [Google Scholar] [CrossRef]
  88. Keim, Donald B., and Robert F. Stambaugh. 1984. A further investigation of the weekend effect in stock returns. The Journal of Finance 39: 819–35. [Google Scholar] [CrossRef]
  89. Kengatharan, Lingesiya, and Navaneethakrishnan Kengatharan. 2014. The influence of behavioral factors in making investment decisions and performance: Study on investors of Colombo Stock Exchange, Sri Lanka. Asian Journal of Finance and Accounting 6: 1–23. [Google Scholar] [CrossRef]
  90. Khan, Imran, Mustafa Afeef, Muhammad Adil, and Waheed Ullah. 2021. Behavioral factors influencing investment decisions of institutional investors: Evidence from asset management industry in Pakistan. Ilkogretim Online 20: 603–14. [Google Scholar]
  91. Khan, Mohammad Tariqul Islam, Siow-Hooi Tan, Lee-Lee Chong, and Hway-Boon Ong. 2017. Investment characteristics, stock characteristics and portfolio diversification of finance professionals. Borsa Istanbul Review 17: 164–77. [Google Scholar] [CrossRef]
  92. Kim, Karam, and Doojin Ryu. 2021. Does sentiment determine investor trading behaviour? Applied Economics Letters 28: 811–16. [Google Scholar] [CrossRef]
  93. Kim, Kenneth A., and John R. Nofsinger. 2008. Behavioral finance in Asia. Pacific-Basin Finance Journal 16: 1–7. [Google Scholar] [CrossRef]
  94. Kinoshita, Kanta, Kyoko Suzuki, and Tetsuya Shimokawa. 2012. Evolutionary foundation of bounded rationality in a financial market. IEEE Transactions on Evolutionary Computation 17: 528–44. [Google Scholar] [CrossRef]
  95. Konstantinidis, Anastasios, Androniki Katarachia, George Borovas, and Maria Eleni Voutsa. 2012. From efficient market hypothesis to behavioral finance: Can behavioral finance be the new dominant model for investing. Scientific Bulletin–Economic Sciences 11: 16–26. [Google Scholar]
  96. Krejcie, Robert V., and Daryle W. Morgan. 1970. Determining sample size for research activities. Educational and Psychological Measurement 30: 607–10. [Google Scholar] [CrossRef]
  97. Krugman, Paul. 2009. Finance Myth Busting, Third World Edition. New York Times, November 9. [Google Scholar]
  98. Kudryavtsev, Andrey, Gil Cohen, and Shlomit Hon-Snir. 2013. ‘Rational’ or ‘Intuitive’: Are behavioral biases correlated across stock market investors? Contemporary Economics 7: 31–53. [Google Scholar] [CrossRef]
  99. Kumar, Satish, and Nisha Goyal. 2015. Behavioral biases in investment decision making—A systematic literature review. Qualitative Research in Financial Markets 7: 88–108. [Google Scholar] [CrossRef]
  100. Lam, Kin, Taisheng Liu, and Wing-Keung Wong. 2008. The magnitude effect in the over-and under-correction in international markets. International Journal of Finance 20: 4833–62. [Google Scholar]
  101. Landberg, William. 2003. Fear, greed and the madness of markets. Journal of Accountancy 195: 79–82. [Google Scholar]
  102. Larrick, Richard P., Katherine A. Burson, and Jack B. Soll. 2007. Social comparison and confidence: When thinking you’re better than average predicts overconfidence (and when it does not). Organizational Behavior and Human Decision Processes 102: 76–94. [Google Scholar] [CrossRef]
  103. Latif, Madiha, Shanza Arshad, Mariam Fatima, and Samia Farooq. 2011. Market efficiency, market anomalies, causes, evidences, and some behavioral aspects of market anomalies. Research Journal of Finance and Accounting 2: 1–13. [Google Scholar]
  104. Le Luong, Phuoc, and Doan Thi Thu Ha. 2011. Behavioral Factors Influencing Individual Investors’ Decision-Making and Performance: A Survey at the Ho Chi Minh Stock Exchange. Master thesis, Umea Universitet, Umeå, Sweden. [Google Scholar]
  105. Lee, Jen-Sin, Pi-Hsia Yen, and Kam C. Chan. 2013. Market states and disposition effect: Evidence from Taiwan mutual fund investors. Applied Economics 45: 1331–42. [Google Scholar] [CrossRef]
  106. Lewis, Tucker. 2017. Fit Statistics Commonly Reported for CFA and SEM. Cornell Statistics Department. Available online: https://www.cscu.cornell.edu/news/Handouts/SEM_fit.pdf (accessed on 3 June 2023).
  107. Lin, Huei-Wen. 2011. Does the disposition effect exhibit during financial crisis? International Conference on Economics and Finance Research 4: 1–10. [Google Scholar]
  108. Lin, Huei-Wen. 2012. How herding bias could be derived from individual investor types and risk tolerance. World Academy of Science, Engineering and Technology 6: 1395–400. [Google Scholar]
  109. Loomes, Graham, and Robert Sugden. 1982. Regret theory: An alternative theory of rational choice under uncertainty. Economic Journal 92: 805–24. [Google Scholar] [CrossRef]
  110. Madaan, Geetika, and Sanjeet Singh. 2019. An analysis of behavioral biases in investment decision making. International Journal of Financial Research 10: 55–67. [Google Scholar] [CrossRef] [Green Version]
  111. Malik, Kaleem Ullah, Muhammad Shaukat Malik, Muhammad Irfan, and Hussain Mehdi. 2022. The role of heuristic factors in investment performance: Exploring the market anomalies in a volatile environment. Apuntes del Cenes 41: 61–82. [Google Scholar]
  112. Mandell, Lewis, and Linda Schmid Klein. 2009. The impact of financial literacy education on subsequent financial behavior. Journal of Financial Counseling and Planning 20. Available online: https://ssrn.com/abstract=2224231 (accessed on 19 May 2023).
  113. Mello, Bernardo A., Vitor MCS Souza, Daniel O. Cajueiro, and Roberto Fernandes Silva Andrade. 2010. Network evolution based on minority game with herding behavior. The European Physical Journal 76: 147–56. [Google Scholar] [CrossRef]
  114. Mertzanis, Charilaos, and Noha Allam. 2018. Political instability and herding behavior: Evidence from Egypt’s stock market. Journal of Emerging Market Finance 17: 29–59. [Google Scholar] [CrossRef]
  115. Mirza, Nawazish, Syed Kumail Abbas Rizvi, Irum Saba, Bushra Naqvi, and Larisa Yarovaya. 2022. The resilience of Islamic equity funds during COVID-19: Evidence from risk adjusted performance, investment styles and volatility timing. International Review of Economics & Finance 77: 276–95. [Google Scholar]
  116. Mitroi, Adrian, and Ion Stancu. 2014. Biases, anomalies, psychology of a loss and individual investment decision making. Economic Computation and Economic Cybernetics Studies and Research 48: 1–17. [Google Scholar]
  117. Mizrach, Bruce, and Susan Weerts. 2009. Highs and lows: A behavioral and technical analysis. Applied Financial Economics 19: 767–77. [Google Scholar] [CrossRef]
  118. Mumtaz, Adeel, Tahir Saeed, and M. Ramzan. 2018. Factors affecting investment decision-making in Pakistan stock exchange. International Journal of Financial Engineering 5: 1850033. [Google Scholar] [CrossRef]
  119. Musciotto, Federico, Luca Marotta, Jyrki Piilo, and Rosario N. Mantegna. 2018. Long-term ecology of investors in a financial market. Palgrave Communications 4: 1–12. [Google Scholar] [CrossRef] [Green Version]
  120. Mushinada, Venkata Narasimha Chary, and Venkata Subrahmanya Sarma Veluri. 2018. Investors overconfidence behaviour at Bombay Stock Exchange. International Journal of Managerial Finance 14: 613–32. [Google Scholar] [CrossRef]
  121. Naveed, Farrukh, and Hasniza Mohd Taib. 2021. Overconfidence bias, self-attribution bias and investor decisions: Moderating role of information acquisition. Pakistan Journal of Commerce and Social Sciences 15: 354–77. [Google Scholar]
  122. Niehaus, Greg, and David Shrider. 2014. Framing and the disposition effect: Evidence from mutual fund investor redemption behaviour. Quantitative Finance 14: 683–97. [Google Scholar] [CrossRef]
  123. Odean, Terrance. 1998. Do investors trade too much? American Economic Review 89: 1279–98. [Google Scholar] [CrossRef]
  124. Pachur, Thorsten, Ralph Hertwig, and Florian Steinmann. 2012. How do people judge risks? Availability heuristic, affect heuristic, or both? Journal of Experimental Psychology 18: 314–30. [Google Scholar] [CrossRef] [Green Version]
  125. Parikh, Parag. 2009. Value Investing and Behavioral Finance. New York: Tata McGraw-Hill Education. [Google Scholar]
  126. Peloza, John. 2009. The challenge of measuring financial impacts from investments in corporate social performance. Journal of Management 35: 1518–41. [Google Scholar] [CrossRef]
  127. Pelster, Matthias, and Annette Hofmann. 2018. About the fear of reputational loss: Social trading and the disposition effect. Journal of Banking & Finance 94: 75–88. [Google Scholar]
  128. Persaud, Avinash. 2000. Sending the herd off the cliff edge: The disturbing interaction between herding and market-sensitive risk management practices. The Journal of Risk Finance 2: 59–65. [Google Scholar] [CrossRef] [Green Version]
  129. Phan, Thuy Chung, Marc Oliver Rieger, and Mei Wang. 2018. What leads to overtrading and under-diversification? Survey evidence from retail investors in an emerging market. Journal of Behavioral and Experimental Finance 19: 39–55. [Google Scholar] [CrossRef]
  130. Ploner, Matteo. 2017. Hold on to it? An experimental analysis of the disposition effect. Judgment and Decision Making 12: 118–27. [Google Scholar] [CrossRef]
  131. Pompian, Michael M. 2011. Behavioral Finance and Wealth Management: How to Build Investment Strategies That Account for Investor Biases? New York: John Wiley & Sons, vol. 667. [Google Scholar]
  132. Prosad, Jaya M., Sujata Kapoor, Jhumur Sengupta, and Saurav Roychoudhary. 2017. Overconfidence and disposition effect in Indian equity market: An empirical evidence. Global Business Review 19: 1303–21. [Google Scholar] [CrossRef]
  133. Quddoos, Muhammad Umer, Amir Rafique, Usama Kalim, and Muhammad Ramzan Sheikh. 2020. Impact of behavioral biases on investment performance in Pakistan: The moderating role of financial literacy. Journal of Accounting and Finance in Emerging Economies 6: 1199–205. [Google Scholar] [CrossRef]
  134. Raheja, Saloni, and Babli Dhiman. 2019. Relationship between behavioral biases and investment decisions: The mediating role of risk tolerance. DLSU Business and Economics Review 29: 31–39. [Google Scholar]
  135. Raiffa, Howard. 1968. Decision Analysis: Introductory Lectures on Choices under Uncertainty. Boston: Addison-Wesley. [Google Scholar]
  136. Rehan, Raja, and Imran Umer. 2017. Behavioural biases and investor decisions. Market Forces 12: 2. [Google Scholar]
  137. Robb, Cliff A., and Ann S. Woodyard. 2011. Financial knowledge and best practice behavior. Journal of Financial Counseling and Planning 22. Available online: https://ssrn.com/abstract=2061308 (accessed on 19 May 2023).
  138. Roger, Patrick. 2009. Does the consciousness of the disposition effect increase the equity premium? The Journal of Behavioral Finance 10: 138–51. [Google Scholar] [CrossRef]
  139. Rompotis, Gerasimos G. 2018. Herding behavior among exchange-traded funds. Journal of Behavioral Finance 19: 483–97. [Google Scholar] [CrossRef]
  140. Sanfey, Alan G., James K. Rilling, Jessica A. Aronson, Leigh E. Nystrom, and Jonathan D. Cohen. 2003. The neural basis of economic decision-making in the ultimatum game. Science 300: 1755–58. [Google Scholar] [CrossRef] [Green Version]
  141. Schultz, Paul. 1985. Personal income taxes and the January effect: Small firm stock returns before the War Revenue Act of 1917: A note. The Journal of Finance 40: 333–43. [Google Scholar] [CrossRef]
  142. Shah, Mohay Ud Din, Attaullah Shah, and Safi Ullah Khan. 2017. Herding behavior in the Pakistan Stock Exchange: Some new insights. Research in International Business and Finance 42: 865–73. [Google Scholar] [CrossRef]
  143. Shah, Sayyed Sadaqat Hussain, Muhammad Asif Khan, Natanya Meyer, Daniel F. Meyer, and Judit Oláh. 2019. Does herding bias drive the firm value? Evidence from the Chinese equity market. Sustainability 11: 5583. [Google Scholar] [CrossRef] [Green Version]
  144. Shah, Syed Zulfiqar Ali, Maqsood Ahmad, and Faisal Mahmood. 2018. Heuristic biases in investment decision-making and perceived market efficiency: A survey at the Pakistan stock exchange. Qualitative Research in Financial Markets 10: 85–110. [Google Scholar] [CrossRef]
  145. Shefrin, Hersh. 2002. Beyond Greed and Fear: Understanding Behavioral Finance and the Psychology of Investing. Oxford: Oxford University Press on Demand. [Google Scholar]
  146. Shefrin, Hersh, and Meir Statman. 1985. The disposition to sell winners too early and ride losers too long. Journal of Finance 40: 777–90. [Google Scholar] [CrossRef]
  147. Shiller, Robert J. 1999. Human behavior and the efficiency of the financial system. In Handbook of Macroeconomics. Amsterdam: Elsevier, vol. 1, pp. 1305–40. [Google Scholar]
  148. Shukla, Anurag, Dr Rushdi, Naela Jamal, Dr Katiyar, and Rakesh Chandra. 2020. Impact of behavioral biases on investment decisions ‘a systematic review’. International Journal of Management 11: 68–76. [Google Scholar]
  149. Silver, Mick. 2011. House price indices: Does measurement matter? World Economics Abingdon 12: 1–17. [Google Scholar]
  150. Simon, Herbert A. 1955. A behavioral model of rational choice. Quarterly Journal of Economics 69: 99–118. [Google Scholar] [CrossRef]
  151. Singal, Manisha. 2014. The link between firm financial performance and investment in sustainability initiatives. Cornell Hospitality Quarterly 55: 19–30. [Google Scholar] [CrossRef]
  152. Singh, Sandeep. 2016. The role of behavioral finance in modern age investment. Pacific Business Review International 8: 234–40. [Google Scholar] [CrossRef]
  153. Siraji, M., M. C. Nazar, and Ishar Ali. 2021. Irrational behaviour and stock investment decision. Does gender matter? Evidence from Sri Lanka. Revista Geintec-Gestao Inovacao E Technologies (Journal of Management, Innovation and Technologies) 11: 2185–204. [Google Scholar]
  154. Summers, Barbara, and Darren Duxbury. 2012. Decision-dependent emotions and behavioral anomalies. Organizational Behavior and Human Decision Processes 118: 226–38. [Google Scholar] [CrossRef]
  155. Taffler, Richard J., Crawford Spence, and Arman Eshraghi. 2017. Emotional economic man: Calculation and anxiety in fund management. Accounting, Organizations and Society 61: 53–67. [Google Scholar] [CrossRef] [Green Version]
  156. Taylor, Stephen J. 2011. Asset Price Dynamics, Volatility, and Prediction. Princeton: Princeton University Press. [Google Scholar]
  157. Thaler, Richard H. 2005. Advances in Behavioral Finance. Princeton: Princeton University Press, vol. 2. [Google Scholar]
  158. Thanki, Heena, Sweety Shah, and Anushree Karani. 2022. Exploring the linkages between financial literacy, behavioral biases, and stock market decisions. The Journal of Wealth Management 25: 82–104. [Google Scholar] [CrossRef]
  159. Thushara, S. C., and Prabath Perera. 2013. The month of the year effect: Empirical evidence from Colombo stock exchange. Paper presented at 2nd International Conference on Management and Economics, Matara, Sri Lanka, February 26–27; pp. 1–6. [Google Scholar]
  160. Tinbergen, Jan. 1939. The dynamics of share-price formation. Review of Economic Statistics 21: 153–60. [Google Scholar] [CrossRef] [Green Version]
  161. Tonchev, Dimitar, and Tae-Hwan Kim. 2004. Calendar effects in Eastern European financial markets: Evidence from the Czech Republic, Slovakia and Slovenia. Applied Financial Economics 14: 1035–43. [Google Scholar] [CrossRef]
  162. Turner, Adair. 2017. Between Debt and the Devil: Money, Credit, and Fixing Global Finance. Princeton: Princeton University Press. [Google Scholar]
  163. Ul Abdin, Syed Zain, Fiza Qureshi, Jawad Iqbal, and Sayema Sultana. 2022. Overconfidence bias and investment performance: A mediating effect of risk propensity. Borsa Istanbul Review 22: 780–93. [Google Scholar] [CrossRef]
  164. Ullah, Saif, and Muhammad Ather Elahi. 2015. Analysis of Herd Behavior Using Quantile Regression: Evidence from Karachi Stock Exchange (KSE). Available online: https://ssrn.com/abstract=2622413 (accessed on 19 May 2023). [CrossRef] [Green Version]
  165. Ullah, Zain. 2019. Individual investment behavior and trade returns: Moderating role of financial literacy. City University Research Journal 9: 112–29. [Google Scholar]
  166. Wachtel, Sidney B. 1942. Certain observations on seasonal movements in stock prices. The Journal of Business of the University of Chicago 15: 184–93. [Google Scholar] [CrossRef]
  167. Waweru, Nelson Maina, Evelyne Munyoki, and Enrico Uliana. 2008. The effects of behavioural factors in investment decision-making: A survey of institutional investors operating at the Nairobi Stock Exchange. International Journal of Business and Emerging Markets 1: 24–41. [Google Scholar] [CrossRef]
  168. Weber, Martin, and Colin F. Camerer. 1998. The disposition effect in securities trading: An experimental analysis. Journal of Economic Behavior and Organization 33: 167–84. [Google Scholar] [CrossRef] [Green Version]
  169. Yu, Haihong, MengHan Dan, Qingguo Ma, and Jia Jin. 2018. They all do it, will you? Event-related potential evidence of herding behavior in online peer-to-peer lending. Neuroscience Letters 68: 1–5. [Google Scholar] [CrossRef] [PubMed]
  170. Zafar, Zareen, and Danish Ahmed Siddiqui. 2020. Behavioral finance perspectives on Pakistan stock market efficiency: Assessing the prospect theory empirically with an adaptive pattern of efficiency across military and democratic regimes. International Journal of Organi-zational Leadership 9: 20–38. [Google Scholar] [CrossRef]
  171. Zunino, Luciano, Benjamin Miranda Tabak, Alejandra Figliola, Darío G. Pérez, Mario Garavaglia, and Osvaldo A. Rosso. 2008. A multifractal approach for stock market inefficiency. Physica A 387: 6558–66. [Google Scholar] [CrossRef]
Figure 1. Conceptual framework.
Risks 11 00109 g001
Figure 2. Structural Equation Model.
Risks 11 00109 g002
Figure 3. Structured model.
Risks 11 00109 g003
Table 1. Descriptive statistics.
Description Frequency Percentage
GenderMale41268.67%
Female18831.33%
Marital StatusMarried39866.33%
Unmarried20233.67%
QualificationIntermediate427%
Bachelor11419%
Master31352.17%
MPhil11619.33%
PhD152.5%
Experience1 To 2 Years12721.17%
3 To 4 Years10918.16%
5 To 6 Years21736.17%
7 To onward14724.5%
Note: Coding Scheme: {Gender (“Male = 1, Female = 2”)} {“{Marital Status” (“Married = 1, Un-married = 2”)} {“Qualification (Intermediate = 1”, “Bachelors = 2”, “Masters = 3”, “Mphil = 4”, “PhD = 5”)} {“Experience 1 to 2 years = 1”, “3 to 4 years = 2”, “5 to 6 years = 3”, “7 and above = 4”}.
Table 2. Descriptive statistics, correlation matrix, and Cronbach alpha value.
Sr. #VariablesCronbach’s Alpha ValueMeanS. D123456789101112
1GDR 1
2MS 164 **1
3Qual 0.138 **0.0161
4Expr −0.156 **−0.0630.177 **1
5ID0.8794.04940.9410−0.0250.0490.196 **0.094 *1
6HB0.9294.06380.87160.0010.0630.206 **0.122 **0.370 **1
7DE0.8964.06970.8917−0.0410.0750.195 **0.101 *0.211 **0.482 **1
8OB0.9273.72671.0839−0.005−0.043−0.125 **0.101 *−0.248 **−0.271 **−0.298 **1
9FA0.8064.21130.6935−0.020−0.0760.036−0.162 **0.0150.0230.0420.082 *1
10TA0.8933.99670.9286−0.0060.086 *0.186 **0.117 **0.340 **0.106 **0.292 **−0.281 **−0.0151
11CA0.9393.54751.24160.0130.122 **0.0140.255 **0.333 **0.391 **0.349 **0.471 **−0.285 **0.494 **1
12FL0.8894.05600.8375−0.109 **0.0670.136 **0.134 **0.464 **0.250 **0.235 **−0.330 **−0.060.495 **0.286 **1
Note: The above table presents the correlation matrix between the dependent variable and the explanatory variables. It shows the direction of relationship between the variables. The correlation is among gender, marital status, qualification, experience, investment decision, herding bias, disposition effect, overconfidence bias, fundamental anomalies, technical anomalies, calendar anomalies, and financial literacy. The above table also describes the reliability analysis of our main variables. We have 8 variables in our study, and, for performing the reliability analysis, we follow Cronbach alpha value to check the reliability of our variables; all the calculations were completed on the SPSS. “Sr #” shows the serial number. “*”. Correlation is significant at the 0.05 level (2-tailed). “**”. Correlation is significant at the 0.01 level (2-tailed).
Table 3. Factor loading.
ConstructsItemsFactor LoadingCR AVE
Investment DecisionsID10.840.840.78
ID20.82
ID30.88
Overconfidence BiasOB10.840.850.71
OB20.82
OB30.88
OB40.77
OB50.9
OB60.89
Disposition EffectDE10.750.790.82
DE20.82
DE30.79
DE40.79
DE50.76
DE60.81
Herding BehaviorHB10.750.790.71
HB20.81
HB30.81
HB40.77
HB50.73
HB60.78
HB70.88
Fundamental AnomaliesFA10.750.780.74
FA20.78
FA30.79
FA40.81
Technical AnomaliesTA10.730.770.64
TA20.75
TA30.82
TA40.79
Calendar AnomaliesCA10.750.780.67
CA20.81
CA30.8
CA40.77
Financial LiteracyFL10.750.80.71
FL20.78
FL30.79
FL40.8
FL50.84
FL60.82
FL70.81
Note: The above table presents factor loadings of every observed variable on the latent variable. This allows the evaluation of constructs in terms of validity. There are four columns in the above table; the first column contains the items of each variable, the second column has the values of factor loading, and the third and fourth columns contain the Composite Reliability and Average Variance Extracted values.
Table 4. Discriminant validity.
ConstructsIDOBDEHBFLFATACA
ID0.763
OB0.4260.791
DE0.3250.3560.801
HB0.2970.4480.4520.814
FL0.3840.4010.4040.3770.782
FA0.4110.2640.3460.3810.3350.771
TA0.4630.3030.3170.4180.3760.4390.788
CA0.4070.2570.4190.4270.2840.350.2670.799
Note: ID is Investment Decision, OB is Overconfidence Bias, DE is Disposition Effect, HB is Herding Behavior, FL is Financial Literacy, FAT is Fundamental Anomalies, TA is Technical Anomalies, and CA is Calendar Anomalies.
Table 5. Competition model of confirmatory factor analysis.
MODELSX2/dfCFITLIGFIIFIRMSEARMR
Eight-Factor Model1.450.960.970.980.860.040.03
(ID, OB, DE, HB, TA, CA, FA, FL)
Threshold≤3.000≥0.900≥0.900≥0.900≥0.900≤0.060≤0.080
Note: This table provides a single-factor model fit in which all the items comprising the seven constructs are loaded on a single factor. The results show that the indices fit the data poorly. However, the seven-factor model fit in which the items are loaded on their respective factors yields a good fit. The key variables are defined as ID = Investment Decision, OB = Overconfidence Bias, DE = Disposition Effect, HB = Herding Bias, TA = Technical Anomalies, CA = Calendar Anomalies, FA = Fundamental Anomalies, and FL = Financial Literacy.
Table 6. Estimation results of direct effect.
HypothesesPathCoefficientCRResult
H1aOB ➝ FA−0.003−0.116Not Accepted
H1bOB ➝ TA0.057 ***2.718Accepted
H1cOB ➝ CA0.848 ***30.35Accepted
H2aDE ➝ FA0.380 ***7.383Accepted
H2bDE ➝ TA0.247 ***4.995Accepted
H2cDE ➝ CA0.205 ***3.117Accepted
H3aHB ➝ FA0.447 ***8.911Accepted
H3bHB ➝ TA0.390 ***8.083Accepted
H3cHB ➝ CA0.309 ***4.806Accepted
H4FA ➝ ID0.100 **2.259Accepted
H5TA➝ ID0.0310.67Not Accepted
H6CA ➝ ID−0.014−0.41Not Accepted
H7HB➝ ID0.875 ***15.33Accepted
H8OB ➝ ID0.0391.083Not Accepted
H9DE ➝ ID−0.046−0.846Not Accepted
Note: The above table shows the direct relationship between all the variables of the study. It contains 4 columns; first column explains the hypothesis of our study, second column explains the path of relationship between 2 variables, third and fourth column define the beta and CR values, based on which the rejection or acceptance of the hypothesis depends. Last column reveals the acceptance and rejection of hypothesis. The variables before and after ➝ are the independent and dependent variables, respectively. The key variables are defined as ID = Investment Decision, OB = Overconfidence Bias, DE = Disposition Effect, HB = Herding Bias, TA = Technical Anomalies, CA = Calendar Anomalies, FA = Fundamental Anomalies, and FL = Financial Literacy. ***, **, and * show the 1%, 5%, and 10% significance levels, respectively.
Table 7. Hypotheses confirmation: indirect effect.
PathBeta CoefficientLowerUpperResult
BoundBound
OB ➝ FA ➝ ID0.274 **3.3193.911Accepted
OB ➝ TA ➝ ID0.213 **3.2163.712Accepted
OB ➝ CA ➝ ID0.706−2.4031.703Not Accepted
DE ➝ FA ➝ ID0.334−2.0981.556Not Accepted
DE ➝ TA ➝ ID0.213−3.2161.652Not Accepted
DE ➝ CA ➝ ID0.334 **2.0981.993Accepted
HB ➝ FA ➝ ID0.2743.319−3.911Not Accepted
HB ➝ TA ➝ ID0.2132.584−3.712Not Accepted
HB ➝ CA ➝ ID0.706 *2.4031.703Accepted
Note: The above table shows the indirect association among “behavioral biases” and “investment decision” via the mediating role of stock market anomalies. The table contains 5 columns. First and second columns show the path on which the regression was run and second was the results of beta coefficient. Third and fourth columns reveal the lower and upper bound values, respectively. The last column represents the acceptance and rejection of relationship. The variables before and after ➝ are the independent and dependent variables, respectively. The variables in the middle are mediator variables. The key variables are defined as ID = Investment Decision, OB = Overconfidence Bias, DE = Disposition Effect, HB = Herding Bias, TA = Technical Anomalies, CA = Calendar Anomalies, FA = Fundamental Anomalies, and FL = Financial Literacy. ***, **, and * show the 1%, 5%, and 10% significance levels, respectively.
Table 8. Estimation results of moderation effect.
PathCoefficientsCRCoefficientsCRCoefficientsCRResults
(1)(2)(3)
OB ➝ FA1.871 ***9.433
DE ➝ FA 0.499 **2.046
HB ➝ FA 0.2090.973
FL ➝ FA2.075 ***13.0750.3871.433−0.02−0.081
OB × FL➝ FA−0.419 ***−9.149 Accepted
DE × FL➝ FA 0.0010.019 Not Accepted
HB × FL➝ FA 0.0861.482Not Accepted
Note: n = 600, HE = Herding Bias, DE = Disposition Effect, FL = Financial Literacy, and OB = Overconfidence Bias. ***, **, and * show the 1%, 5%, and 10% significance levels, respectively.
Table 9. Hypotheses confirmation: moderation effect.
PathCoefficientsCRCoefficientsCRCoefficientsCRResults
(1)(2)(3)
OB ➝ TA1.478 ***7.773
DE ➝ TA 0.533 **2.239
HB ➝ TA 0.2571.244
FL ➝ TA1.643 ***10.80.474 *1.8020.0480.205
OB × FL➝ TA−0.344 ***−7.845 Accepted
DE × FL➝ TA −0.041−0.66 Not Accepted
HB × FL➝ TA 0.0470.828Not Accepted
Note: n = 600, HE = Herding Bias, DE = Disposition Effect, FL = Financial Literacy, and O = Overconfidence Bias. ***, **, and * show the 1%, 5%, and 10% significance levels, respectively.
Table 10. Hypotheses confirmation: moderation effect.
PathCoefficientsCRCoefficientsCRCoefficientsCRResults
(1)(2)(3)
OB ➝ CA0.525 **2.105
DE ➝ CA 4.811 ***10.038
HB ➝ CA 4.301 ***10.335
FL ➝ CA−0.216−1.0834.885 ***9.2213.657 ***7.764
OB × FL➝ CA0.0791.366 Not Accepted
DE × FL➝ CA −1.264 ***−10.038 Accepted
HB × FL➝ CA −1.050 ***−9.293Accepted
Note: n = 600, HE = Herding Bias, DE = Disposition Effect, FL = Financial Literacy, and O = Overconfidence Bias. ***, **, and * show the 1%, 5%, and 10% significance levels, respectively.
Disclaimer/Publisher’s Note: The statements, opinions and data contained in all publications are solely those of the individual author(s) and contributor(s) and not of MDPI and/or the editor(s). MDPI and/or the editor(s) disclaim responsibility for any injury to people or property resulting from any ideas, methods, instructions or products referred to in the content.

