
Regulation and De-Risking: Theoretical and Empirical Insights

School of Business and Law, University of Brighton, Brighton BN2 4AT, UK
*
Author to whom correspondence should be addressed.
Risks 2023, 11(6), 104; https://doi.org/10.3390/risks11060104
Submission received: 25 March 2023
/
Revised: 18 May 2023
/
Accepted: 22 May 2023
/
Published: 2 June 2023
(This article belongs to the Special Issue Risks: Feature Papers 2023)
Abstract
:The purpose of the Bank for International Settlements regulatory agenda, as implemented by financial regulators globally, has been to make banks safer and reduce the likelihood of systemic events. Using an original model of bank profit maximisation under a regulatory constraint, we statistically examine how market risk exposure has interacted with financial performance and capital structure, to see if the Basel regulatory agenda concerning the quantity, quality and liquidity of capital, has prompted changes in banking behaviour as measured by exposure to market risk. Breaking new ground, we empirically explore how the regulatory agenda has affected the largest banks. We analyse if the regulatory agenda has succeeded in aligning the cost of capital with their exposure to market risk, measured by Value at Risk; or if regulations have induced changes to banking activities. We find rather than regulation inducing changes to the rate at which unchanged risk exposure is capitalised; it leads to changes in the nature of exposures. Risk has declined along with financial performance while the cost of capital is largely unchanged. A consequence of regulation may be to encourage the migration of riskier activities to organisations where it may be borne more cheaply.
1. Introduction
The social importance of banks in facilitating a payment system and their perceived fragility have long supported the premise that banks must be regulated. Since the 2008 Financial Crisis, the perception has grown that the cost of capital faced by banks remains too cheap encouraging allocatively inefficient asset creation and risk-taking. Three phenomena are widely acknowledged explanations for a cost of capital not being aligned with its risks: Banks can use deposits as a medium of exchange through the cheque drawing system, their depositors benefit from insurance lowering the cost of deposit finance and as we have observed, when insolvency is threatened, national governments through their central banks offer support especially when there may be systemic implications. To redress perceived allocative inefficiency in the use of capital, in the last several decades, a host of new regulations based upon the various initiatives originating from the Bank for International Settlements in Basel Switzerland (BIS), regulation have been promulgated.1 However, concerns persist over their benefits and consequences.
In this paper, within the received Capital Asset Pricing framework, we pose a theoretical model to examine empirically the consequences of the regulatory agenda of the last two decades going back to the Basel II regime. We will assess if the regulation has aligned the cost of capital with exposure to market risk, as measured by Value at Risk (VaR): That unchanged risk is now capitalised correctly; or alternatively, that risk itself has changed leaving unaffected the rate at which it is capitalised.2 The remainder of the paper is organised in the following manner. In Section 2, we provide a summary of prior work, theoretical and empirical, leading to Section 3, our method and research hypotheses. In Section 4, we explain the data with regard to the composition of trading revenues, taking of market risk, capital structure, cost of capital and regulatory metrics. We report the outcome of the statistical analysis in Section 5. In Section 6, we discuss our findings and offer some general policy observations on the consequences of regulation.
2. Literature, Research Issues and Hypotheses
2.1. Why Regulation
The rationale for regulating financial institutions is based upon recognition of their critical economic function and their inherent fragility in credit, liquidity and maturity transformation (Klein 1971). Historically, the focus of regulation was on credit risk, ensuring that banks had sufficient capital if borrowers failed to repay loans but it has now grown to encompass capital to absorb trading losses from market risk, specification of liquidity of assets to safeguard deposits, insurance to protect depositors and lastly, being a lender-of-last-resort, i.e., a central bank lending to institutions when assets cannot be liquidated. Moving from Basel I to Basel II, market risk became an additional reason for holding capital especially as the complexity of trading activity grew. Identifying a reason for holding capital leads to the question of how much is appropriate for credit, market and operational exposure. Under Basel II, the notional valuation of the asset, not its face value, determined the capital charge. As the capital requirement is calculated as a percentage of the bank’s assets, it can be adjusted by changing both the numerator, the bank’s capital or the denominator, its assets. With the financial crisis of 2008, operational risk joined the pantheon of reasons for banks holding additional capital. Under Basel III, the quality of capital and its liquidity became a major focus. With advances in regulation, both theoretical and empirical debates as discussed below, have continued around the following policy concerns (Van Der Weide and Zhang 2019):
- How should capital be defined?
- How much capital is sufficient?
- How liquid should capital be?
- Should there be a maximum level of leverage?
- Against which risks capital should be held?
- Should capital requirements be a percentage of face value or be risk weighted?
- How should systemic issues such as pro-cyclicality be addressed?
However, none of the above concerns addresses the fundamental issue of why markets cannot price and allocate capital to the financial system correctly according to the nature of its risks. Through regulation, will the cost of capital be aligned with the risk or will changes to the nature of risk-taking be induced, leaving capital costs unchanged?
2.2. Theoretical Perspectives
Notwithstanding the critical role performed by banks as financial intermediaries and their importance in credit, maturity and liquidity transformation, various justifications for their regulation have been advanced. A recurring theoretical argument is that shareholders and debtholders, ignoring the social costs including systemic risks, under-price the cost of debt and equity, encouraging excessive asset creation and supra-normal profits through risk-taking. By being systemically important, regulation confers protection for stakeholders. However, according to other researchers, banks are not earning supra-normal returns and financial capital is not too cheap. Individually, it is argued, risk is properly capitalised, but regulation is needed to make banks into lower return and lower risk institutions, in the capital asset pricing framework, reducing the potential for systemic impacts (Hoque et al. 2015; Hirtle et al. 2020). Argued theoretically, the purpose of regulation is to induce changes in the nature of asset creation by transforming banks into lower-return and lower-risk institutions (Brandao-Marques et al. 2020). It is argued that through this transformation, the potential for stress transmitting systemic shocks is reduced (Shahzad et al. 2019).
Whether forcing banks to reduce risk by de-leveraging will have a wider impact depends upon how one views the Modigliani–Miller (MM) Theorem (Modigliani and Miller 1958). Ignoring taxes, transaction costs and information heterogeneity, changes to capital structure should have no impact on valuation (Boyd and Nicolo 2005). Hence making banks safer through more capital, should not impact valuation as capitalisation is risk-adjusted. However, Armour et al. (2016) argue that because the value of banking lies in financing credit claims with deposits, then as the proportion of equity rises, valuation must fall. Some researchers while accepting the MM thesis of capital structure irrelevance, still argue against excessive leverage from a risk perspective. Through guaranteeing deposits according to Verdoes (2013) debt finance has been encouraged, making banks riskier. Consistent with MM theory, by reducing leverage, according to Admati et al. (2012, 2013) the cost of equity falls because of the market perception of reduced risk. Yet, according to Hanson et al. (2011) requiring more equity from banks has minimal effect on the Weighted Average Cost of Capital (WACC). On this basis, Admati and Hellwig (2013) argue that though valuation may not change, excessive leverage should be restricted as it distorts the financial system. While according to Allen et al. (2011) reducing leverage and increasing equity produce a more equitable means of protecting depositors; private benefits should not entail social costs.
The unintended consequences of regulation have also been explored. Earlier in the Basel agenda, using a mean-variance framework, it was argued that capital regulation has the opposite effect intended by regulators: According to Kahane (1977); Koehn and Santomero (1980); Kim and Santomero (1988) a regulatory constraint on bank leverage encourages the holding of riskier assets as a means of compensating. Post Basel II, it was argued that liquidity regulation leads to substitution effects as financial institutions favour holding central banking debt over private debt creating moral hazard (Neri 2012).3 Risk-reducing regulation, according to Pandit (2010), by increasing Tier 1 and Tier 2 capital and raising the cost of financial intermediation, discourages risk-taking, hurts capital formation and ultimately the greater economy. The general opinion is that regulation leads to risks migrating to where they are more lightly regulated, creating systemic issues (Pelligrinia et al. 2017; Culp and Neves 2017; Megaw and Beioley 2018). Indeed, according to Arthur and Booth (2010), rather than being a reaction to excessive risk-taking, regulation has encouraged it.
In other research, the fluidity between risk exposure and capital levels was examined. According to Shrieves and Dahl (1992), the majority of banks mitigate the effects of increases in capital levels by increasing asset risk posture and vice versa. Similarly, imposing constraints on market risk exposure, as measured by VaR, leads ironically to greater risk as banks compensate for lower returns by taking bigger bets with remaining risk capital, which may be exacerbated when previously uncorrelated assets classes become correlated during crises (Guo et al. 2021). In the work of Basak and Shapiro (2001), an exogenously imposed bound on the maximum VaR leads to riskier trading and greater losses: The fat left-tail phenomena. This result resembles the theoretical insights of Alexander and Baptista (2006), in which regulation through a constraint upon VaR, produces greater risk (as measured by standard deviation, or probability of extreme losses), increasing a bank’s fragility. In research by Daníelsson et al. (2004), myopic VaR constraints exacerbate financial shocks. Similarly, in the work of Leippold et al. (2006), VaR constraints lead to changes in inter-temporal hedging behaviour increasing risk exposure. The potential for unintended consequences of regulation appears in the research of Kaplanski and Levy (2015): Using the Mean-Variance, CAPM, framework, they argue that through VaR regulation, the CML is shifted downwards.4 Theoretically, they show how regulation induces a bank to select a less risky portfolio, relative to the unregulated, optimal risky portfolio. Regulation results in a cap on market risk producing sub-optimal returns and allocative distortion. Offering political-economy insights, some researchers argue that Basel regulations and their capital adequacy rules would not have prevented failures but are designed to placate political constituencies and banking interests (Kobrak and Troege 2015).
2.3. Empirical Research
There is a considerable body of empirical research on the role of regulation in ensuring the adequacy of risk capitalisation and the nature of risk-taking. Some researchers maintain that changes to capital structure yield real economic changes while others, aligned with MM theory, hold it does not matter: Valuation is unchanged as reduced returns are capitalised for risk at a lower rate. In a study by the European Central Bank of 54 financial institutions, the benefits of increasing the risk-weighted capital ratio were shown while similar results were reported by Miles et al. (2012), who, looking at UK banks, found that changes to the capital structure do not impact risk-taking and the nature of banking activity. Similarly, Yang and Tsatsaronis (2012) showed that reducing leverage, consistent with MM theory, reduces the cost of equity. Moreover, according to Admati and Hellwig (2013), while equity may be more expensive than debt for banks, the benefits to banks are private while the costs of cheaper debt are social. Brandao-Marques et al. (2020) found that both government support, as well as regulations and supervisory practices, may encourage moral hazard; restricting the activities of banks is more effective than requiring changes to capital structure.
Looking at research into how regulation has affected commercial banking, the prevailing view is that greater capital in whatever form adversely impacts financial performance. Hogan (2015) found that capital ratios and risk-based capital ratios were useful predictors of the variability of earnings. While the deteriorating financial performance of U.S. European and Japanese banks has been attributed to capital and liquidity regulation (Weigand 2016). In a study of Chinese banks, it was observed that when capital is increased to conform with regulations, other measures are undertaken to reduce the riskiness of assets (Zhang et al. 2008). In a study by Jiang et al. (2020) of 135 Chinese banks, it was shown that imposing capital buffers does not monotonically reduce risk-taking but follows a U-shaped curve. According to Abbas et al. (2021) looking at loan loss reserves, the reliance on risk-based capital ratios is not enough to control risk-taking. Based upon imperfections, some researchers, using the “low-risk anomaly”, have argued that by making banks less risky, their cost of capital surprisingly may increase risk (Baker and Wurgler 2015). Examining systemic issues, it was argued that because equity is more expensive than debt, net interest income will fall, with adverse implications for economic growth (Gropp et al. 2016). Similarly, according to Asal (2015), decreasing leverage reduces the explicit and implicit guarantees of debt enjoyed by the banking sector, thereby raising the cost of equity and reducing performance.
Research into the sectoral impact of the Basel agenda supports the view that regulatory changes have aligned the cost of capital to unchanged risk exposure, i.e., that prior to regulation it was under-priced. Using historic return on equity as a proxy for the cost of equity, McCauley and Zimmer (1991) found large differences between countries notwithstanding similar exposures. According to Maccario et al. (2002), using a ratio of earnings to share price as a proxy for the cost of equity, its cost of equity has fallen between 1993 and 2001 with greater regulation arguing that banks are now perceived as less risky. Applying the CAPM approach with data using banks from six countries, King (2009) reports that the real cost of equity had fallen between 1990 and 2005 but then increased after 2006. Relying upon a multi-factor approach (Fama–French model) Chan-Lau et al. (2012) found that higher capitalisation and lower leverage rendered returns to bank equity more resilient to negative economic shocks. Examining equity returns since the 2008 financial crisis, Demirguc-Kunt and Huizinga (2010) argue that a stronger capital position measured by the leverage ratio is associated with superior share performance, especially for larger banks. According to official stress tests as required by the authorities in most countries, banks individually are better equipped to withstand shocks while it is believed the threat of systemic events has been reduced (Haldane and May 2011; Eichberger and Summer 2010).
Summarising both theoretical and empirical research, we see various views on the purpose and optimality of regulation. On the one hand, we have that the role of regulation is to ensure debt and equity risk are properly capitalised, that banks do not earn supra-normal returns and that private benefits are aligned with social costs; or, on the other hand, it is to transform banks into lower return but lower risk institutions, inducing changes in the nature of asset creation. Whether changing capital structure through regulation will impact valuation, along with any wider consequences, depends upon how one views the MM theorem, including its imperfections. Opponents of greater capital regulation highlight the imperfections of the MM theorem—that imposing changes to capital structure will alter behaviour and adversely impact valuation. To reconcile these conflicting views on the impact of banking regulations, we examine how regulatory-induced changes have impacted exposure to market risk as measured by VaR.5 Through regulation, will the cost of capital be aligned with the risk or will changes to the nature of risk-taking be induced, leaving capital costs unchanged? To address these questions, in the next section, we propose a heuristic model of constrained optimising behaviour, leading to alternative hypotheses on how banks respond to regulation.
3. Method and Research Hypotheses
Given the fragility of banks, the economic assumption underlying their regulation is that shareholders and debtholders, ignoring the social costs, under-price the cost of debt and equity, encouraging excessive asset creation, risk-taking and socially undesirable levels of bank failures. Regardless of the critical role performed by financial intermediaries, the magnitude and nature of their “output”, is sub-optimal. If the excessive provision of financial services resembled a social cost such as pollution, then as shown in Figure 1, such a cost might be internalised through a Pigouvian tax, raising the weighted average cost of capital.6
Rather than taxing the social costs of banking services (e.g., banking failures and systemic risks) per se, an objective of regulation is to influence the nature and quantity of asset creation and risk by making it more expensive, through reduced leverage and increasing the quantity and quality of capital. Moving the above paradigm to the Mean-Variance paradigm of the Capital Asset Pricing Model (CAPM), because expected returns are capitalised too cheaply, banks earn supra-normal profits attracting capital and taking risks through asset creation, imposing social costs, represented by Point A above the CML of Figure 2, below.
Whatever the form and mix of regulation7, a key premise is that by increasing the cost of capital, excessive asset creation and risk-taking activity might be reduced, aligning social costs with private benefits. Thus, we can look at regulation from alternative perspectives: Debt and equity are too cheap, and banks earn supra-normal returns, making the purpose of regulation to move a bank from point A to either point B or point C as depicted in Figure 2. At point C, the rate at which returns are capitalised is unchanged, but returns are reduced; while the move to point B means returns are reduced along with the rate at which they are capitalised. However, many researchers disagree with this depiction offering a different perspective: Returns are not supra-normal; banks are simply high-risk and high-return institutions: Point C. So, the purpose of regulation is to move the institution leftward along the Capital Market Line (CML), from points C to B of Figure 2. In this perspective, correcting for externalities and supra-normal returns from the mispricing of debt and equity is not the rationale for regulation. Formalising the focus of our research, can examining the impact of regulation on one form of risk-taking, market risk as measured by VaR, help us choose between these alternative perspectives? Through regulation, has the cost of capital of banks changed? Are risks now properly capitalised? Has this occurred through adjustments to the rate at which markets capitalise risk or through changes to the riskiness of bank activities such as trading as measured by VaR?
In an ordinary business, in equilibrium, economically efficient capital markets ensure that the cost of equity and the cost of debt reflect the risks inherent to the nature of the organisation’s activities and through its capital structure are a deterrent to unbridled growth and risk-taking: organisations expand their activities to the point where the marginal return to capital equals the marginal cost of capital. Whilst, according to the MM Theorem, if debt holders can accurately assess and accordingly price the chances that equity holders will try to increase leverage, then the value of shareholder wealth is unaffected by changes to capital structure.8 In contrast, in banks, according to some researchers, the cost of capital, was historically too cheap, leading to unbridled risk-taking and even failures while increasing the wealth of shareholders through excessive leverage. Formally, the marginal social cost of banking exceeded the private benefits and despite the long history of regulation, Pareto Inefficient outcomes occurred. Regulations such as depository insurance and the readiness to support systemically important institutions create moral hazards.9 (As was remarked during the 2008 financial crisis: heads—a bank wins while tails, the tax-payer pays.) However, if through new enhanced capital regulation and liquidity regulation, the cost of capital remains unchanged, have social costs been internalised and aligned with private benefits? Is this evidence of continued market failure, allocative inefficiency and the resilience of externalities inherent to banking? Hence, the perennial issue in regulating financial institutions remains one of allocative efficiency: Is the cost of capital aligned to the risks facing an individual institution, as well as collectively to the greater economy?10
To articulate our research question and formalise our hypotheses, we present a heuristic neo-classical model of profit maximisation by a representative bank to explore the effects of capital regulation.11 Banks maximise profits as the difference between their Revenue and their Costs, i.e., their return on capital, R, and their cost of capital where ke and kd, respectively, are the costs of debt and equity capital:
Given a proportion of Debt, ρ, in total assets, A, and a proportion of Equity, 1 − ρ, in total assets, A, the bank’s WACC is simply
So, we can rewrite the profit expression as the difference between their revenue from Return to capital and their WACC:
Without a regulatory specification of the composition of required capital, banks would optimally use Debt and Equity capital according to their relative costs, the Marginal Rate of transformation between Debt and Equity would be equal to the ratio of their respective productivities and prices: The familiar first-order conditions for profit maximisation are12:
Now suppose a bank had a constraint on its capital structure setting a maximum level of Debt as a proportion of total assets:
Manipulating Equation (5) implies that by restricting the level of debt in capital structure, the allowed cost of debt, kr, regulated cost of debt, is less than it would be in the absence of capital regulation:
The bank is restricted in its cost of debt and therefore must reduce gearing. To summarise, the numerator equals the total revenue from debt and equity capital divided by the proportion of equity must be less than the regulatory implied cost of debt. For a firm with too much leverage, the inequality would not hold. The result assumes that the regulated level of debt is less than what the firm would undertake without a constraint of Equation (4). Solving for the Lagrangian multiplier, λ, we reach the following result, where α is negative, equal to how much less the cost of debt would be if the regulatory constraint on the amount of debt as a proportion of total capital structure were imposed, or, α = kr − kd.
The result shows a causal link between regulation and optimising behaviour: by restricting the level of gearing, the bank maximises profit on a required lower cost of capital. Under the constraint on gearing, the bank optimises the difference between its return to Return on Debt and Equity Capital, R(E, D), of Equation (1) and the reduced cost of capital through altering the nature of risk-taking activities, i.e., the firm has moved leftwards on the Security Market Line of Figure 2. Do empirical facts support the above theoretical result? To explore these alternatives and in a departure from previous research, we investigate the market risk by asset classes of major banks, as measured by VaR, to see the effects, if any, of Basel-inspired regulation.13 We identify market risk as a systematic risk because it is not unique to a particular investment. Based upon the above model connecting regulation to bank behaviour, we examine two alternative hypotheses:
Hypothesis 1.
Through regulation the cost of capital has changed to be aligned with unchanged market risk exposure; or.
Hypothesis 2.
Regulation has induced adjustments to market risk exposure leaving the cost of capital unchanged.
Looking at systemically important financial institutions, we begin with general metrics for performance and risk. We examine the cost of equity and the cost of debt, the instruments of regulatory policy. Have beta and alpha changed? Has capital structure and performance changed? We inquire if regulation through changing the cost of capital, has succeeded in internalising the social cost of banking. Has the evolution of regulation made banking less risky and the financial system more stable through macro-prudential efforts? Critically, have capital markets recalibrated the cost of equity and debt to financial institutions? Are capital markets ‘correct’, Pareto Optimal, in pricing the risk of trading activity, or have the efforts to ensure the liquidity and adequacy of capital led to changes in risky activities such as trading with possibly unintended consequences?
4. Data and Descriptive Statistics
To conduct our empirical analysis, data were gathered for 21 of the largest global banks as displayed in Table 1. They are ranked by market capitalisation at the time of the study, from JP Morgan at nearly USD 400 billion to Barclays at USD 32 billion.14 The criteria for selection were the availability of full financial accounts, as retrievable from Bloomberg and critically VaR by asset class.
Although financial data as found below in Table 2 are generally available for all publicly listed banks and institutions, VaR by asset class is not. Using Bloomberg®, for these 21 institutions alone, can one obtain market risk exposure by asset class, although there are gaps in the time series partially constraining our methods. Where available, all-time series begin in January 2000.
For each of the data series found in Table 2, we computed averages and standard deviations for our sample of the world’s largest financial institutions, comparing three time periods: The beginning of Basel II (2000 to 2009), the transition from Basel II to Basel III (2009 to 2016) and post Basel III (2016 through 2020), as shown in Table 3 below.16 Although aggregation for the purposes of summary statistics might conflate differences between institutions, looking at the group as a whole, can still yield insights.
Examining each financial metric in turn, we begin with Alpha, defined as the premium a security earns above a certain benchmark (such as the Standard and Poor’s 500). A positive alpha indicates that the investor earns a premium over an index. We observe that Alpha has declined slightly as regulation has progressed, although it was very small from the beginning. Looking next at Adjusted Beta, there was a slight upward trend during the transition from Basel II to Basel III, 2009 to 2016 increasing to 1.2 but thereafter declining to 1.07, hardly different from the pre-Basel II period of 0.98. The standard deviation across banks fell as well. While the purpose of Banking regulations has been to make financial institutions less risky, measured by Beta, the changes have been very minor. We next look at the effective cost of debt for the world’s largest banks. As computed by Bloomberg®, it is the cost of interest on what a firm pays on current debt considering the deductibility of interest expense at the effective rate of taxation. As observed in Table 3, the cost of debt has declined for the world’s largest banks especially during the period as we move from Basel II to Basel III. As the cost of Debt has fallen, its variation has declined as well.
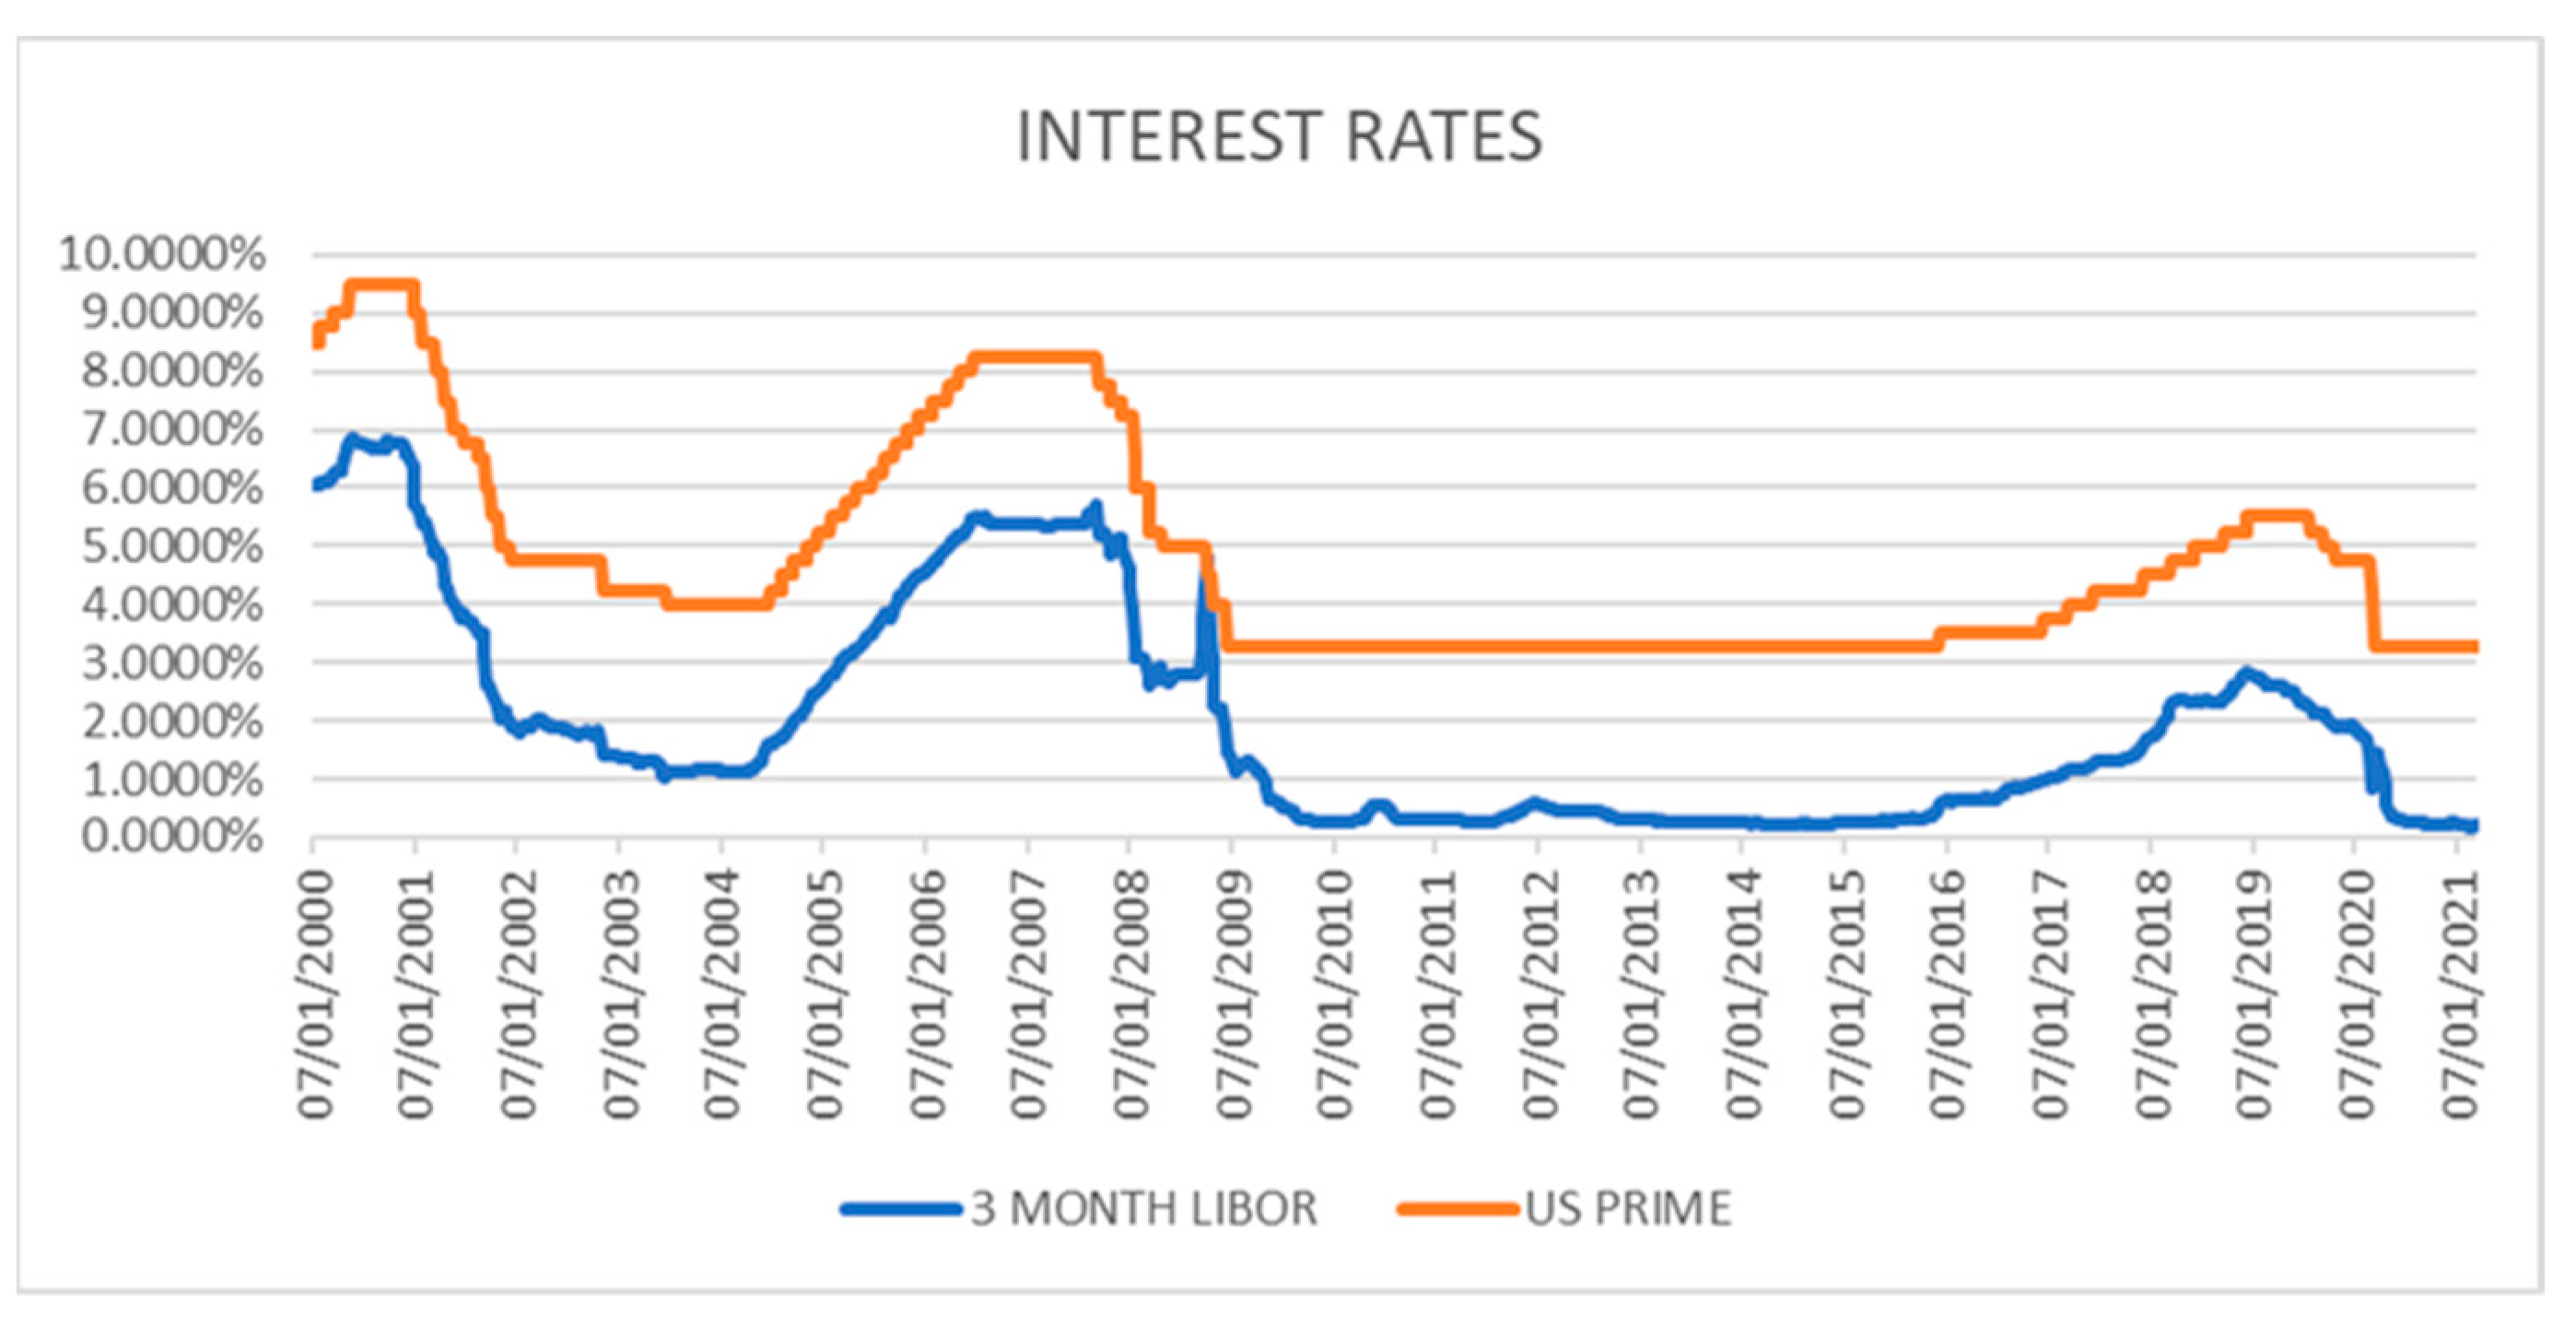
Can the fall in the Cost of Debt for the world’s largest banks be attributed to reduced leverage and/or these banks becoming less risky? As we can see, the average for the group fell 228 basis points between the roll-out of Basel II and the Basel III period, but explaining this result is less easy. As we see in Figure 3 below, a sustained expansionary monetary policy known as Quantitative Easing has led to lower interest rates. So, while the cost of debt has fallen for the largest financial institutions, this may be because they are less leveraged and less risky or simply because of the general trends of interest rates, as a control variable. To shed light on these conjectures, we continue examining empirical data.
The Cost of Equity for the world’s largest financial institutions also presents an interesting picture. According to theory, reduced leverage and lower risk should decrease the cost of equity. The cost of equity or the equity risk premium is the return a company requires to decide if an investment is sufficient compensation for bearing the risk of ownership. Using Bloomberg® data, it is computed from the CAPM model with a country risk premium included.17 As we observe in Table 3 above, there was a 445-basis point increase between Base II implementation and the transition from Basel II to Basel III, but afterwards, the cost of equity fell by 240 basis points. As the aforementioned regulatory reforms were designed to make banks less risky, the increase in the Cost of Equity is somewhat surprising. We also see about a 30% increase in variability in the Cost of Equity across banks from the beginning of Basel II to the post-Basel-III implementation. At the beginning of the millennium, the variability in the cost of equity between banks was quite narrow. As the financial crisis unfolded, variations in the cost of equity increased sharply but grew narrower as we approach 2020. Overall, the transition from Basel II through to Basel III of reducing leverage, capital and liquidity regulation had a fairly modest impact on the risk requirements for ownership. If banks were less risky, it was not evident to the market.18 The combination of reduced leverage and more expensive equity capital cannot have been helpful from a financial performance perspective and may help to explain the above-observed decline in Alpha and the sharp decrease in the Return to Equity discussed below.
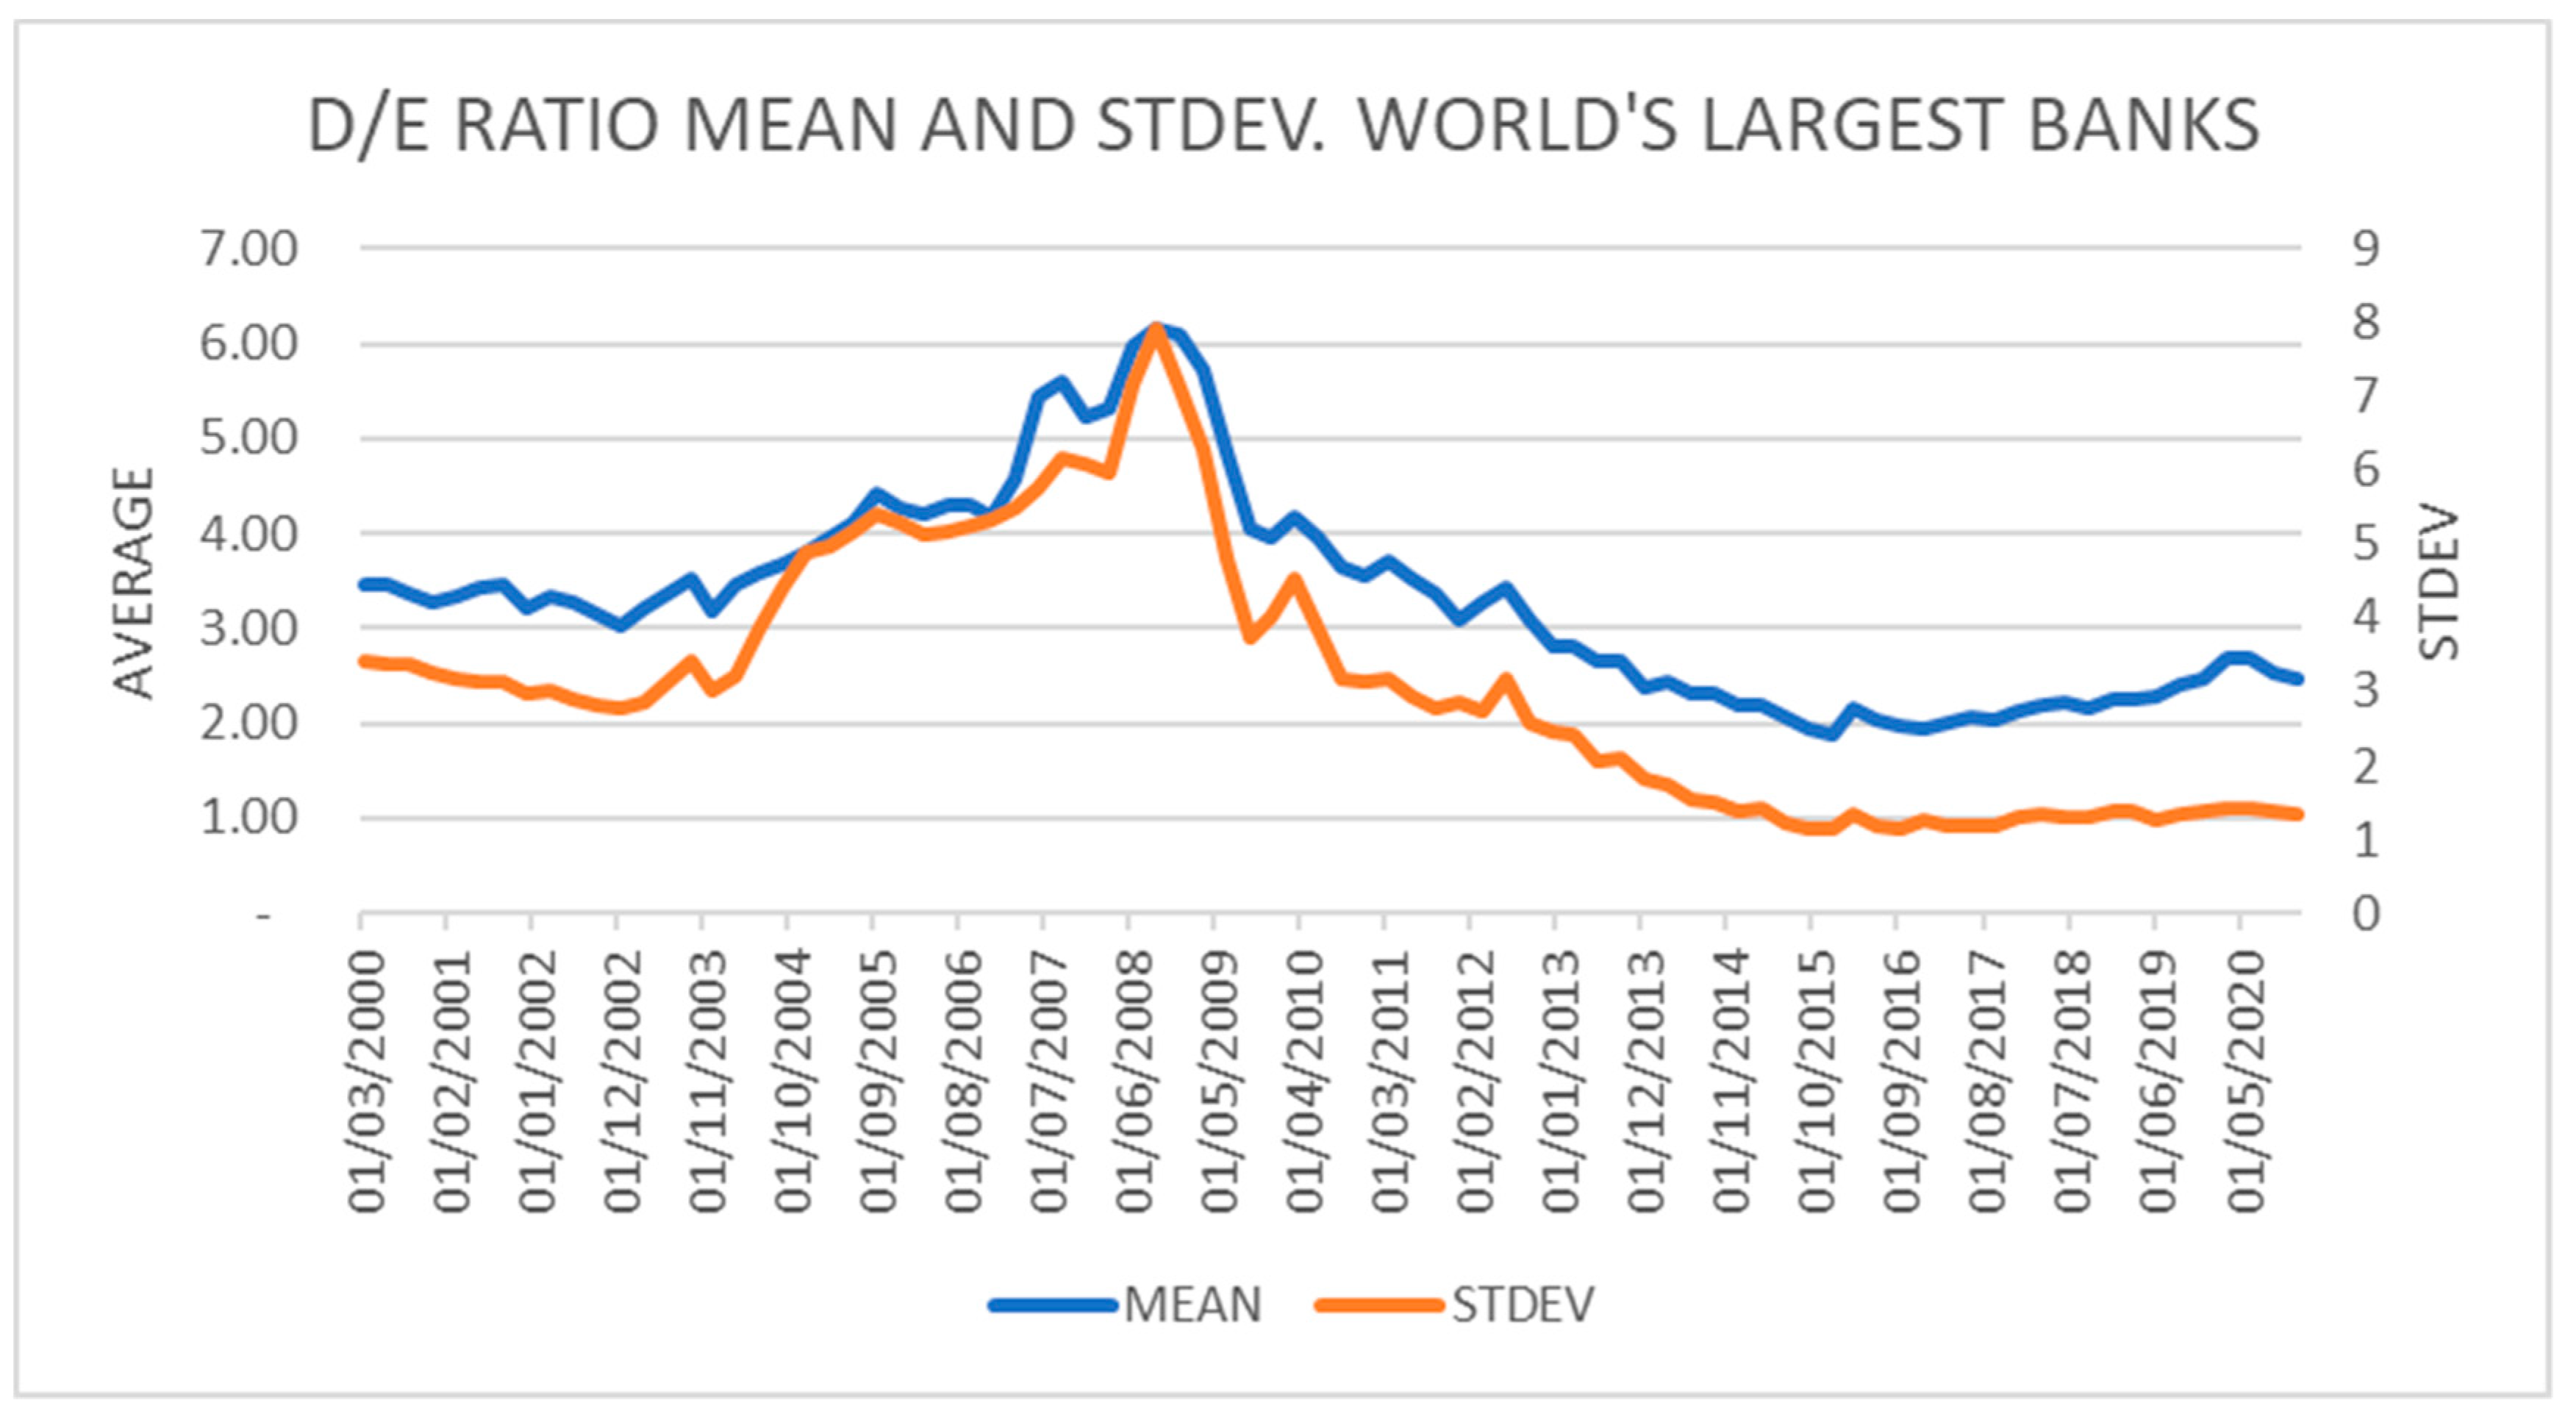
We next look at the Ratio of Debt to Equity. Excessive leverage has long been a concern of regulators. Not surprisingly, given the changes in regulatory requirements from Basel II to Basel III: Increasing common equity, creation of capital buffer, introduction of Leverage Ratio calculated by dividing Tier 1 capital by the bank’s average total consolidated assets (sum of the exposures of all assets and non-balance sheet items), we see reduced leverage across the world’s largest financial institutions. As we observe in Table 3 above, and summarised in Figure 4 below, gearing has fallen steadily beginning with Basel II roll-out through the transition from Basel II to Basel III and eventually to post Basel III. We also note that the variance across institutions in the ratio of Debt to Equity has narrowed.
A key objection by the banking industry to raising more equity, as well as implementing liquidity regulation, has been that it would reduce their profitability, impairing their role as facilitators of economic growth. To analyse whether performance has been affected by regulation, we next examine Return on Equity (ROE) as computed from the latest fiscal year’s after-tax income divided by book value. It measures how well a company used reinvested earnings to generate additional earnings. As we see above in Table 3, there has been a sharp decline in average ROE as the regulatory changes of Basel II moved forward into Basel III. Before 2009, the average return exceeded 14%. With the implementation of Basel III, ROE declined to an average of below 10% or about a 30% fall in financial performance. Prior to and during the transition from Basel II to Basel III, post financial crisis, there was also greater variation in ROE. After 2016, we see a decline in standard deviation. These results support the earlier observations based on Table 3, which reveal a decline in Alpha. The results are consistent with other research comparing the lacklustre performance of U.S., European and Japanese banks post financial crisis in which the increased efficiency ratio (non-interest expense/Revenue) is attributed to new regulatory requirements (Weigand 2016). Although banking may have become less profitable for many reasons, we can observe that the decline coincided with the implementation of enhanced capital and liquidity requirements. Without control variables, excluding other explanations is not possible. The results are interesting because as we discussed above, Beta was now greater, meaning we have even lower returns on a risk-adjusted basis. Although business cycles and other factors may have played a role, putting the observations together paints a picture of declining profitability despite an increasing level of systematic risk, prompting the question if banks are earning their cost of capital (Dombret et al. 2017).
The data with respect to the WACC are intriguing. The WACC combines the variations in Cost of Debt and Equity through changes to leverage. Many detractors of regulation believe that greater capital and liquidity regulation would increase WACC. For the world’s largest financial institutions, we see that the WACC reached its zenith at 5.59% during the implementation of Basel III, ultimately finishing at only 76 basis points greater than what was observed at the beginning of Basel II to the implementation phase of Basel III. Comparing the WACC in 2000 with the figure in 2020, we find in fact that for 15 of the 21 largest institutions, the WACC was lower, as shown below in Table 4.
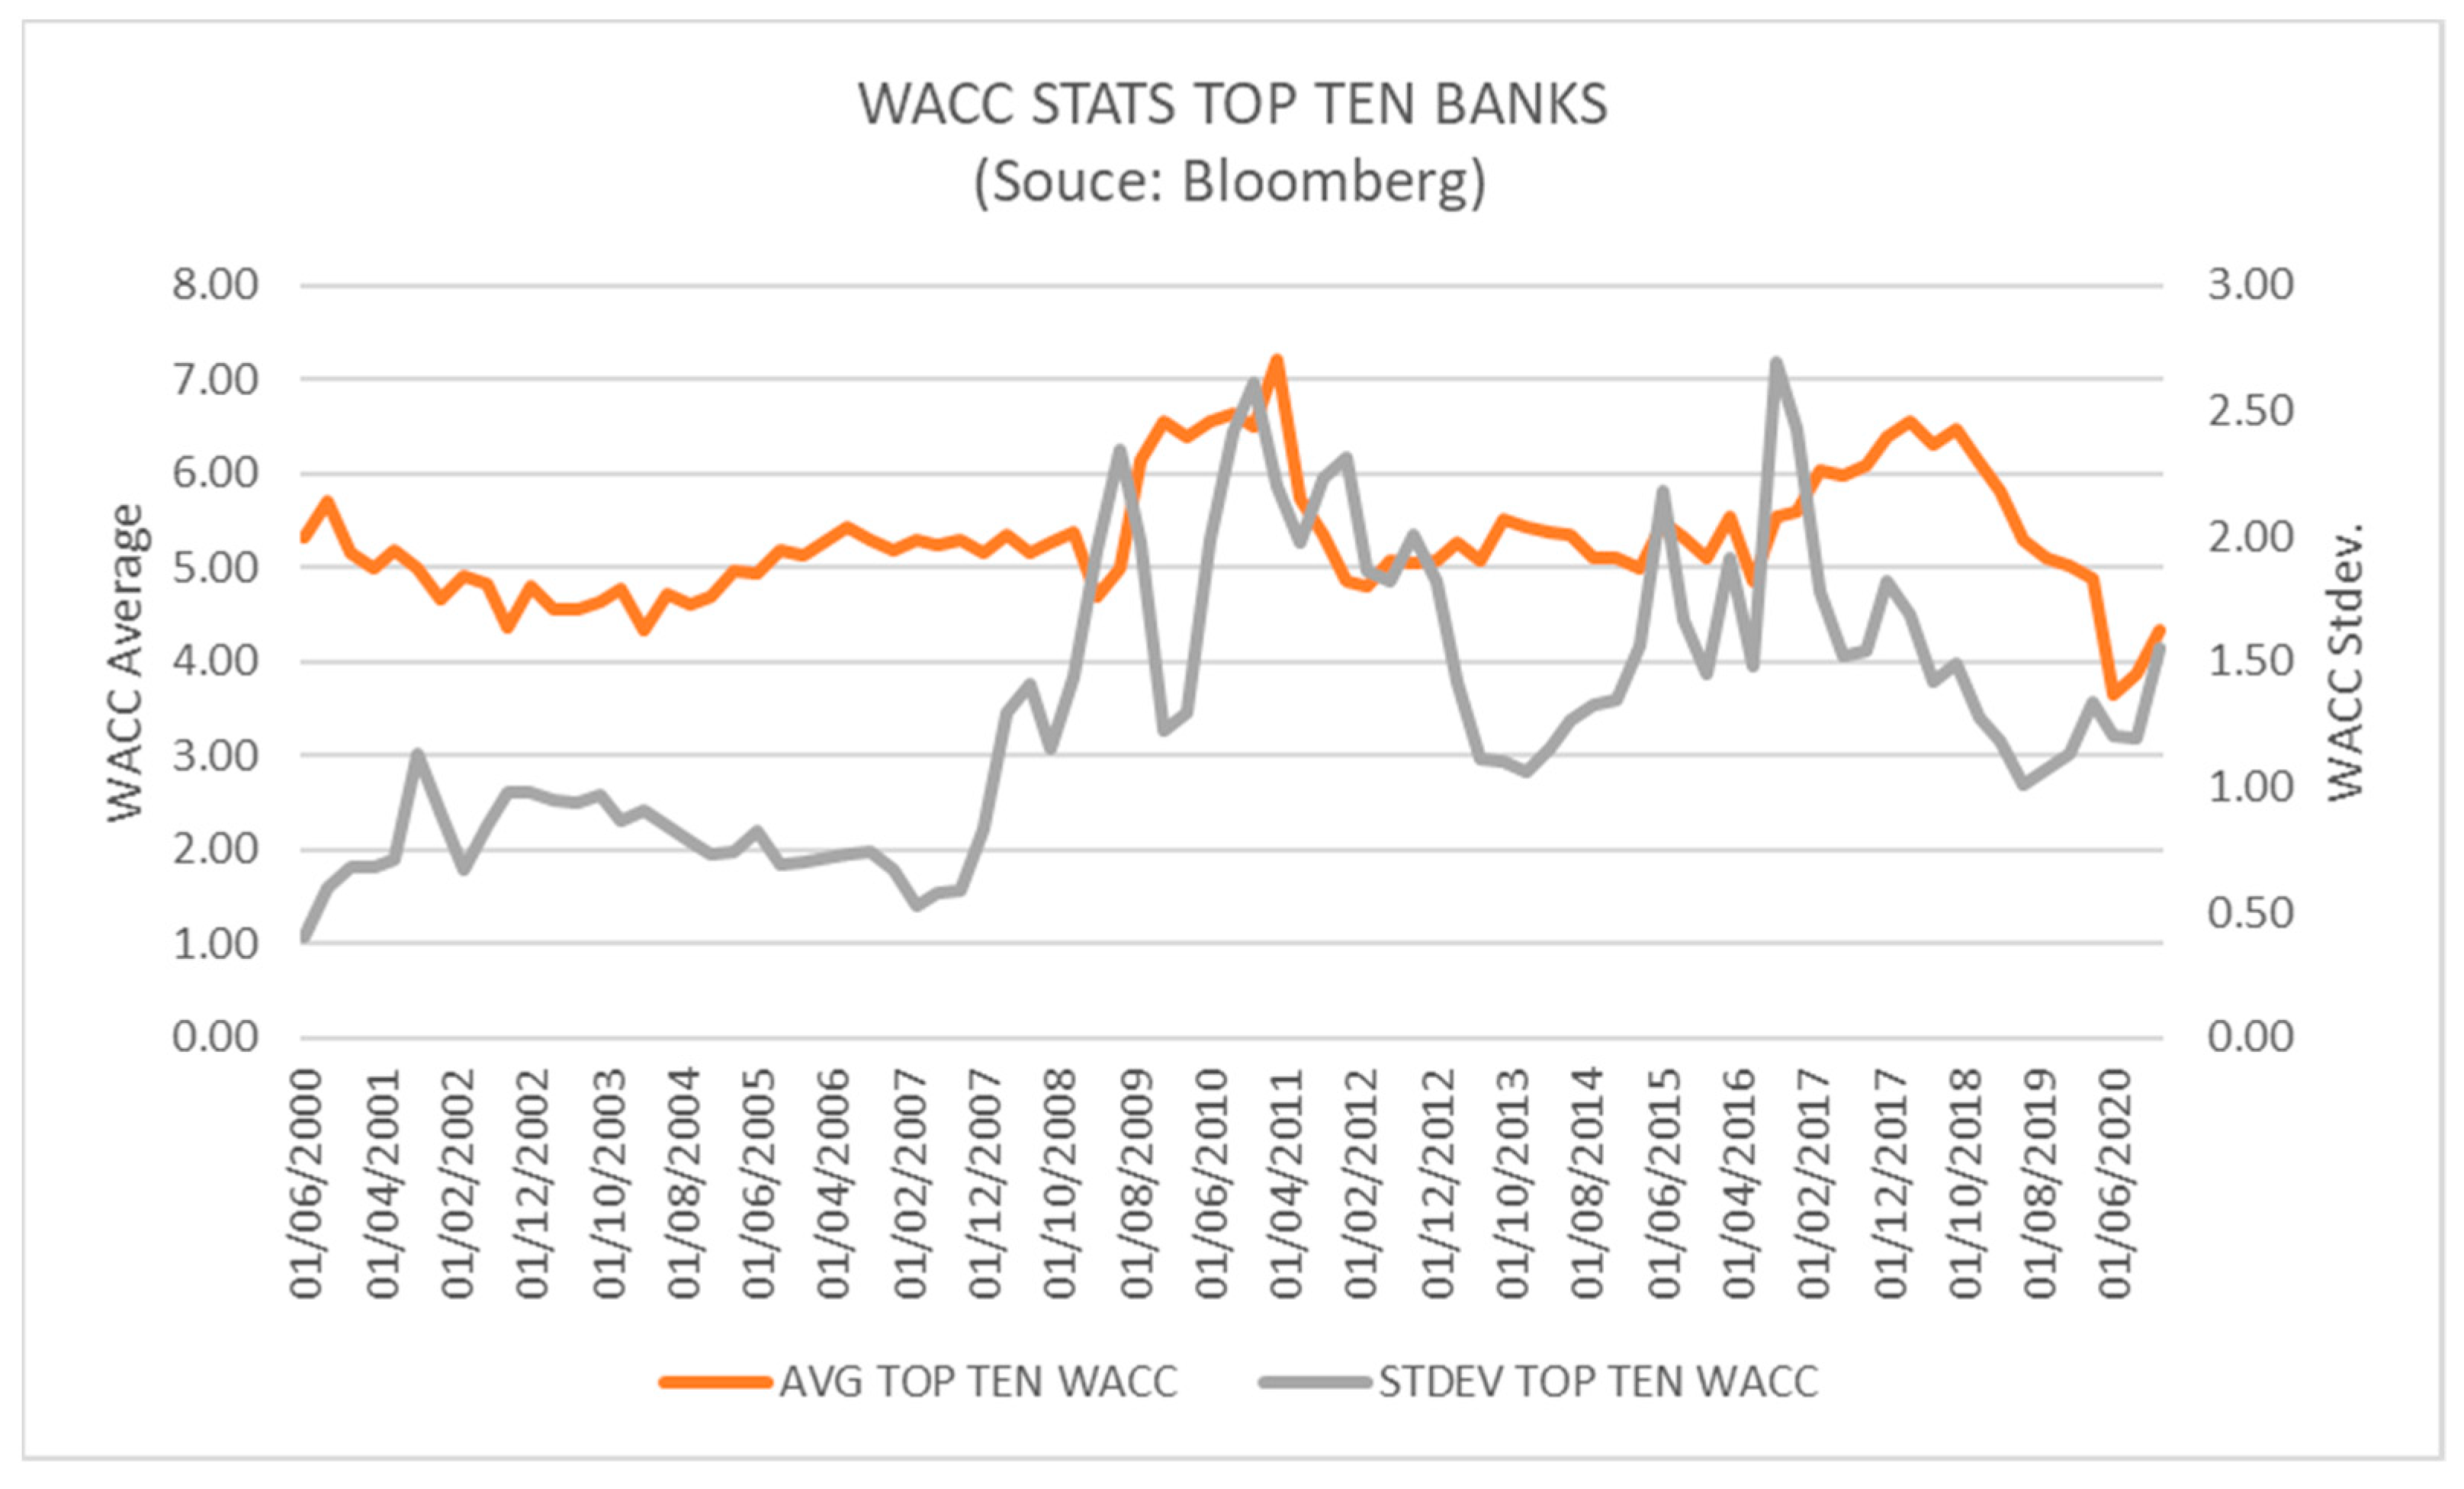
Narrowing our focus to just the top 10 financial institutions in Figure 5, we see that the WACC, despite rising slightly during the transition period between Basel II to Basel III, in fact, finished the period at 4.33%, below the level observed in 2000 of 5.69% although the variance across the sub-group has increased.
Altogether, the results with regard to the WACC are surprising, as supporters of regulation have argued, cheap capital and excessive leverage encouraged risky trading activity producing moral hazard and hence warranted increasing. The results are also surprising because the banks themselves have generally argued that new regulations would increase their cost of capital, reduce profitability and hurt the economy. In reality, we see that the WACC has hardly changed and indeed, for the largest institutions, is now lower, raising the question if regulations have “failed” or whether financial institutions have adjusted their businesses to an unaltered cost of capital—Hypothesis 2. Following the 2007–2008 Financial Crisis when rates fell, as shown in Figure 3 above, the WACC actually increased. The data at least do not support the claim that greater regulation would increase the cost of capital, aligning it with unchanged risks of bank trading, as policy makers aspired. For two-thirds of the banks in Table 4, the WACC of 2021 is lower than that of 2000. While we cannot claim that banking activities have become less risky, we can observe that along with reduced gearing and lower returns on equity, the cost of capital has fallen. As shown in Table 3, from the transition period of Basel II to Basel III, beta fell as well. Altogether, banking appears to have become less risky and less profitable, adjusting its activities to a largely unchanged cost of capital.
To see if the riskiness of banking has changed, we review data on trading-related market risk-taking by the world’s largest banks. Although there are a few gaps in some time series, we can report total Value at Risk (with diversification benefit) in the aggregate as well as VaR by asset-class components.19 Comparing changes to VaR from the beginning of Basel II with the post-Basel-III period, we see in Table 5 considerable declines in risk exposure across all asset classes, averaging approximately 76% while overall VaR with Diversification benefits fell by 35%. Risk exposure to Equity markets reached its highest during the 2007–2008 financial crisis and since then, with greater capital requirements and liquidity regulation, followed a downward trend. The fall in Equity market exposure between the pre-Basel-II period and the post-Basel-III period was greatest at 88% followed by that in interest rates at 74%. We also report that the standard deviation in VaR across all asset classes declined sharply on average, 73% between the beginning of the period and the Basel III implementation as financial institutions appear to have adopted similar business models. As with interest rate risk, having exposure to foreign exchange risk is inherent to operating a multi-national financial institution. Again, like interest rate risk, we see from Table 5 below that exposure to foreign exchange markets has dropped sharply with the advance of financial market regulation. FX VaR has fallen by over 73% for the world’s largest banks between the beginning of Basel II and the implementation of Basel III. The standard deviation has also declined.
Finally, we analyse the changes in exposure to Commodity markets. Commodity trading by banks has traditionally been a niche activity with some institutions avoiding the asset class entirely and others such as JPMorgan embracing it, including participation in the physical market.20 Of late, however, the trend has been one of reducing involvement. In 2018, the top 12 banks generated commodities trading revenue of less than $4 billion down from nearly $16 billion in 2008. Such areas as electricity trading have been abandoned entirely.21 Even large banks such as Goldman have reduced their exposure to commodities (Reuters, 24-12-12) while industry experts have predicted an end of commodity trading by banks (Barnes 2014). Though other factors may have contributed to the decline in commodity trading by financial institutions along with capital and liquidity regulation making it less viable, as shown in Table 5 where we see VaR has halved from its peak in the pre-Basel II period. Having reviewed at an aggregate level key statistics for the performance, cost of capital and risk data for the world’s largest financial institutions during the period from the beginnings of Basel II to the implementation of Basel III, we turn to Analysis and Interpretation of the results.
5. Statistical Analysis and Interpretation of Results
We now move from descriptive results to their interpretation using statistical inferences. For the group as a whole, comparing the beginnings of Basel II with the implementation period of Basel III, we have that Alpha has fallen slightly from a positive value to a negative value while Adjusted Beta increased between the beginning of Basel II from 0.9828 to 1.2120 during the transition period, falling to 1.0739 during the implementation of Basel III. We found that the Cost of Debt over the three periods declined steadily from 3.52% to 1.55% and finally to 1.24% post-Basel-III implementation; while the Cost of Equity rose from 9.43% at the beginning of Basel II and then increased substantially between the transition from Basel II to Basel III to 13.88% after which it fell post Basel III implementation to 11.48%. Our results also show that leverage has fallen sharply over the two decades of regulatory progression especially during the transition from Basel II to Basel III with the variance in capital structure narrowing across the largest banks. Turning to performance, we found that Return on Equity fell sharply from the beginning of Basel II when it was 14.23% to 9.17% during the transition phase afterwards rising slightly to 9.98%. The WACC has increased slightly for the 21 largest banks as a whole while it has in fact, fallen for the top 10 financial institutions. Critically, we found that across all Asset Classes, we see a sizable decline in VaR.
From the above observations, it appears that bank trading activity has become less risky and coincided with a fall in profitability although changes to other forms of risk, such as credit risk, which has not been examined, may have played a role as well. Rather than aligning the equity risk premium to expected returns, it appears that the nature of banking activities, such as trading, has changed. Testing if the changes in WACC were statistically significant by treating our data base of banks as a sample of the greater population, we see from Table 6 below that the small changes between the pre-Basel II period versus the Transition period and Pre-Basel versus Post Basel III (after 2015) were statistically significant. The change in WACC between the Transition period and the Post Basel III was not significant at 95% as would be expected. Given the modest fall in WACC from 5.59 to 5.20 for the group, the results are unsurprising. Next looking at VaR, in contrast, we see that the observed changes were all statistically significant. As we saw in Table 5 the VaR rose during the transition period and ultimately declined post Basel III, from 2016 onwards. For all asset classes, Rates, Equities, FX and Commodities, we witness a similar trend. Validating the results statistically, we see in Table 6 that the results for the largest 21 banks with respect to reductions in VaR are statistically significant.
Recalling our heuristic model results and alternative hypotheses, we now statistically test if market risk exposure, as measured by VaR, has remained invariant to regulatory-induced changes to the Cost of Capital and Capital Structure, Hypothesis 1; or, if the nature and extent of risk exposure have responded to such changes, Hypothesis 2. The regulatory agenda was premised on the notion that one could raise costs by modifying capital structure while leaving intact the capacity to take risks. Prudence would be encouraged by having more capital at risk, but the changes would leave activities and their accompanying risks unaffected, as measured, at least in market risk exposure—VaR. Hence, there would be no relation between changes to capital and liquidity and banking activities and their risks. By performing Least Squares regressions of VaR upon WACC with the Debt to Equity as explanatory variables, as expressed in Equation (9) below, we test the hypothesis that risk exposure has been affected by the cost of capital and capital structure.
The regression results are reported in Table 7 for the sub-set of institutions on which continuous time series of VaR observations are available. We observe that in general both independent variables, cost of capital and capital structure are useful in predicting changes to VaR, i.e., that regulatory changes induced changes in risk exposure. The adjusted R-Squared results have an average of 74%. All F-statistics are significant along with t-statistics on estimated coefficients although for three banks, WFC, PNC and BNP, as an explanatory variable WACC were excluded as statistically insignificant at 95%. As shown, the P-values are all very small. As we saw from Figure 2, leverage has declined, which should have led to an increase in WACC as equity replaces debt. However, as we saw from Table 4 for 15 banks, the WACC is now slightly below the level found in 2000 and for the group as a whole, the change was minimal, although we acknowledge other factors may have played a role, as we investigate below. Although Basel-inspired regulations were designed to align financial structure and the cost of capital with the risks of banking, encouraging prudence and discouraging moral hazard, it appears that the nature of risk exposure has responded to the very modest changes in financial structure and the cost of capital. Altogether, the results support our Hypothesis 2 that regulatory changes have led to adjustments in the nature and extent of taking market risk. Rather than our Hypothesis 1, that regulations have succeeded in aligning the cost of capital to financial institutions the nature and extent of market risk exposure, we see instead that, as per Hypothesis 2, regulations appear to have altered the nature of bank trading activities, aligning its risks to only marginally affected cost of capital.
These results are consistent with the observed fall in ROE, i.e., lower return following from lower risk arising from trading activity. Although the regulation was designed to promote prudence and discourage moral hazard by aligning the cost of capital with the risks of trading by banks, the various changes led to a reduction of risk exposure supported by the observed statistical relationships. Leverage has fallen along with risk exposure, making banks less profitable. The falling ROE for the group as a whole is consistent with the de-risking trend across all asset classes. It appears regulatory changes were premised upon the notion that banks could be made safer, though less profitable while leaving exposure to market risk unchanged. Instead, banks responded by reducing exposure to market risk becoming lower-return institutions, conforming to our heuristic model.
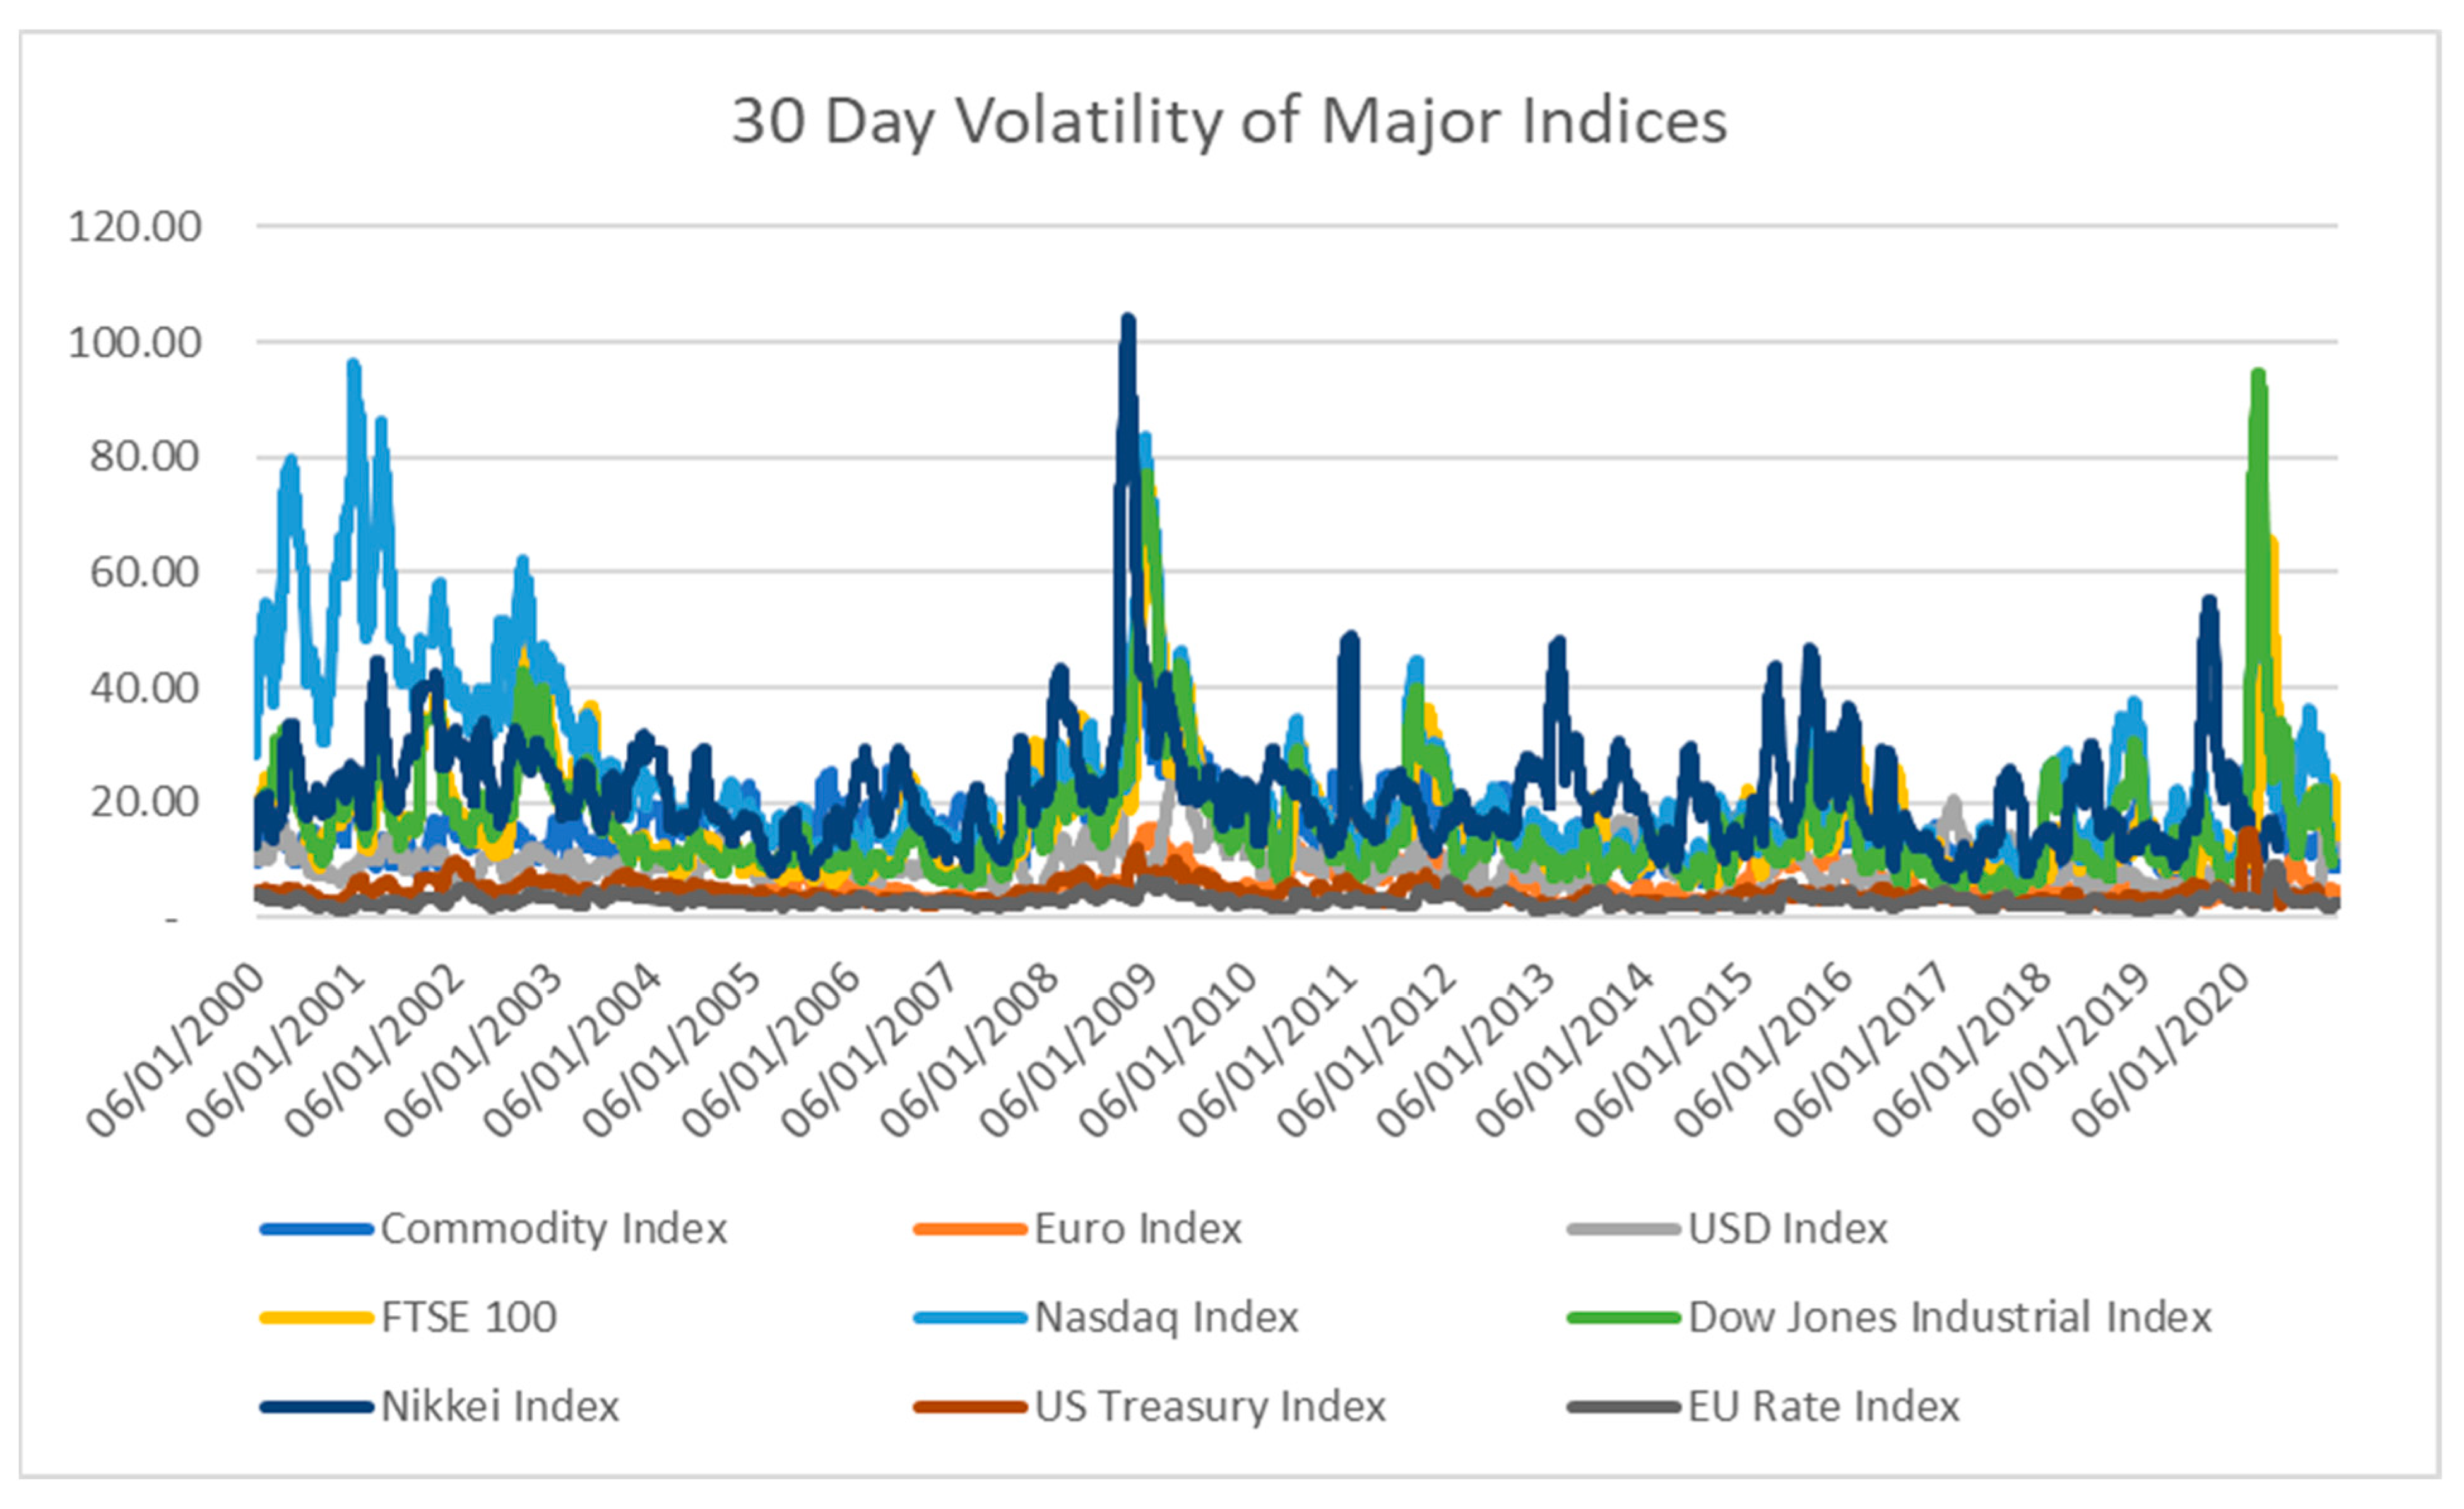
As a control variable, to address the possibility that the observed changes in VaR arose because of changes to market conditions, we have examined volatility data. As conjecture, perhaps markets have become less volatile, reducing the VaR of similar notional positions: that the nature of market risk-taking was unchanged?22 We looked at 30-day volatility for various Commodity, FX, Equity and Rate Indices as shown in Figure 6 below. As we can see, there does not appear to be any discernible trend in observed volatility. In addition, to further analyse if changes in market conditions contributed to the observed fall in VaR, we compared the averages of 30-day volatility for the various Basel implementation periods, shown in Table 8. While volatility has fallen slightly, it is markedly less than the observed reductions in VaR for major financial institutions. The observed stationarity of volatility supports the de-risking trend. Rather than banks retaining their exposure but having expected returns capitalised appropriately, it appears that market risk exposures were reduced in line with changes in regulatory-induced changes in capital structure, etc. Or, in our model framework, banks adjusted their trading activities by reducing risk exposure with lower profitability. Greater capital requirements appear to have encouraged the reduction in risk exposure, leading to lower profitability. However, slight declines in volatility across asset classes may have reinforced the trend, as markets became less attractive to trade, favouring the de-risking trend.
6. Discussion and Conclusions
The Basel-inspired regulatory agenda was premised on the notion that one could raise the cost of capital through a stronger capital base, encourage prudence while not impeding the capacity to take risks and leave the scope and nature of banking unaffected. By increasing the cost of risk capital, the social costs of banking arising from systemic risk would be reduced. Instead, we have posited theoretically and shown empirically that the costs of regulation appear to have led to a reduction in market risk as measured by VaR and reduced profits. Market risk is consistent with our CAPM framework because it is not unique to a particular investment (it can be hedged but not eliminated through portfolio diversification). As a limitation of our research, we are constrained by the availability of VaR data using only a sample of financial institutions from Europe, North America and the United Kingdom. This limitation as well means that there is no scope for a “control” group sub-sample. Further, as a limitation, we acknowledge that policy-induced changes to other forms of risk, notably credit exposure, may also have played a role but are not considered in the present research and are arguably less relevant although under stress situations it is easy to imagine credit risk and market risk becoming correlated.23 Motivated by a model of bank optimising behaviour under a regulatory constraint, our research is the first to statistically test the relationship between capital structure and the cost of capital with market risk as measured using VaR. We have found that risk and reward travel together; the regulatory agenda has made bank trading activity less risky but also less profitable.
Returning to contentious debates over the impact of regulation, we recall that opinions divide over interpretations of the MM Theorem. Starting from equilibrium, under MM theory, the prices of equity and debt are a function of capital structure and hence, ignoring taxes, transaction costs and information heterogeneity, there should be no “cost” in lower returns to making banks safer through more capital. Changes to capital structure yield offsetting changes in the respective costs of debt and equity. However, if the cost of capital were not Pareto Optimal and expected returns were capitalised at an artificially low rate allowing supra-normal returns above the CML, then the alternative hypotheses on the effects of regulation would be supported.
From our findings, it appears that the debate around MM theory is unhelpful. Rather than arguing whether one can change capital structure with or without affecting the cost of capital and profitability, we see from our data set that changing capital structure, hoping to affect the rate at which exposure is capitalised, has not happened in practise. Recalling our hypotheses, rather than regulation inducing changes to the rate at which unchanged risk exposure is capitalised; we see regulation leads to changes in the nature of exposures. Reflecting on our literature review, putting aside possible control issues, banks have reacted to the Basel regime by changing the riskiness of their trading activities and modifying their exposure according to the cost of capital. The proposition that requiring significantly more equity and reducing gearing would not impact WACC and therefore would not affect taking market risk, is not supported empirically. Whether because of frictions or transaction costs or other related regulatory changes, the respective costs of equity and debt are not aligned to capital structure. Faced with changes in the rate used to capitalise risky cash flows, consistent with our heuristic model and our statistical evidence, banks react by transforming their trading exposures and thereby the accompanying cash flows. By implication, increasing the rate at which risky cash flows from trading are capitalised, has led banks to re-optimise, modifying such activities as predicted by Equations (7) and (8) of our model. The results are ironic because all of these banks might be characterised as “too big to fail” yet in response to regulation the market risk exposure has been reduced. Moral hazard aside, maybe management does not see relying upon “bail-out” as an option.
Statistically, we have tested the results of our optimising model of banking behaviour under a regulatory constraint. Apart from the control variable of volatility already addressed, we acknowledge that other possible explanations for our results cannot be dismissed, including general economic conditions. There have been several regulatory interventions, near-zero interest rates and other macroeconomic factors all of which may have influenced the observed changes. Across geographies, similar regulations may not have been applied in a uniform manner. Although idiosyncratic and diversifiable within the CAPM framework, we have not examined in our research how regulations impact taking credit risk. Notwithstanding, using two decades of quarterly data, the results suggest that regulatory changes have led to banks becoming less profitable by reducing leverage and increasing the cost of capital, de-risking. Whilst in earlier research (Shrieves and Dahl 1992) it was shown that banks without constraints, may offset regulatory-induced capital increases through greater asset risk, such as riskier lending, we now show how constraints induce a reduction in the riskiness of market risk from trading activity. The increased burden of regulations raises the cost of trading activities, leading to lower profits, to which financial institutions responded by reducing market risk exposure. The observed trend of banks pursuing less risky activities, such as private banking and wealth management as fresh sources of income, mirrors research on the growth in shadow banking and grey markets (Culp and Neves 2017). However, arguably, risk itself does not vanish but may have migrated to where it is more lightly regulated, such as private equity. Although capital and liquidity regulation may have made systemically important institutions individually more stable, by moving market-related risk to where it is lightly regulated, from a macro-prudential perspective, we may be worse-off leaving the social costs of systemic risk less internalised.
Author Contributions
Conceptualization, L.H.; methodology, L.H.; validation, A.G.; formal analysis, L.H.; investigation, L.H.; resources, L.H.; writing—original draft, L.H.; writing—review and editing, L.H. and A.G.; supervision, L.H. and A.G. All authors have read and agreed to the published version of the manuscript.
Funding
This research received no external funding.
Data Availability Statement
Data is all public material downloadable from Bloomberg.
Conflicts of Interest
The authors declare no conflict of interest.
| 1 |
|
| 2 | In focusing on VaR, our concern is market risk as regulated under Basel-inspired regulations. Other types of risk such as Credit Risk and Operational risk also have regulatory capital requirements but are not examined in our research. Arguably, Market Risk is the most identifiable with systematic risk, as per the Capital Asset Pricing Model. |
| 3 | See Note 9 concerning Silicon Valley Bank. |
| 4 | The work of Kaplanski and Levy (2015) is distinct in positing more than one CML, i.e., one with and without regulatory impositions. While intriguing, we ask, how can there be more than one Capital Market Line? Moreover, in their work, a constraint is imposed upon VaR, which is curious. Subject to model approval, VaR is not regulated; rather, the amount of capital required to support a level of VaR is regulated. |
| 5 | We do not discuss the optimality of aligning private benefits with social costs through other means such as restricting the quantity of asset creation and lending by banks. How regulation has affected the nature and scope of credit creation are beyond the scope of the present research. |
| 6 | We examine the impact of the various Basel accords regulating the inputs to the creation of market risk through trading. As per the previous Note 5, examining the creation of credit risk and even examining how the two types of risk are jointly affected by regulation may be an area for future research. |
| 7 | See Note 1. |
| 8 | In contrast, according to the option valuation theory, unanticipated redistributions to wealth are possible, see (Copeland and Weston 1992, pp. 507–9). |
| 9 | According to some experts, the recent protection of large deposits of the non-systemically important Silicon Valley Bank in the USA is yet another example of moral hazard and lax oversight (Wall Street Journal, https://www.wsj.com/articles/did-esg-help-sink-svb-progressive-climate-bank-bailout-federal-reserve-treasury-biden-insurance-9db64b0b (accessed on 21 September 2021). |
| 10 | Non-linearity of systemic risk means that the “macro-prudential” exposure facing the economy may exceed the aggregate risks facing individual institutions. |
| 11 | We follow the approach found in chapter 8 of Mathematical Optimisation and Economic Theory by Michael D. Intriligator, Philadelphia, USA: Society for Industrial and Applied Mathematics (Intriligator 1971). |
| 12 | We assume that a bank is a “price-taker” with regard to the cost of debt and equity according to its capital structure. |
| 13 | We note that banks are required by their regulators to report VaR along with related statistics. Though it has been argued that banks may have an incentive to under-estimate their exposure, according to research, the opposite is possible as well as diversification benefits are under-estimated (Pérignon et al. 2008). Notwithstanding such concerns, as officially reported metrics, we assume the validity of the reported VaR. |
| 14 | Although the various major financial centres where these banks are head-quartered may have implemented the Basel Accords in not entirely consistent manners hypothetically leaving scope for regulatory arbitrage, all these banks operate globally. The major regulators moreover regularly compare how their respective institutions and non-headquartered institutions measure their risk exposures. |
| 15 | Adjusted Beta vs. Raw Beta—The beta of a share may be presented as either an Adjusted Beta or a Raw Beta. A Raw Beta is obtained from the linear regression of a stock’s historical data. Raw Beta, also known as Historical Beta, is based on the observed relationship between the security’s return and the returns of an index. The Adjusted Beta is an estimate of a security’s future Beta. Adjusted Beta is derived from historical data but modified by the assumption that a security’s true Beta will move towards the market average, of 1. The formula used to adjust Beta is (0.67) × Raw Beta + (0.33) × 1.0. All Betas are computed using the relevant markets-exchanges on which they trade. |
| 16 | The regulatory changes moving from Basel I to II to III are well known but importantly with the last phase, there has been a greater focus on the quality of capital and its liquidity reflecting the lessons of the 2008 financial crisis. |
| 17 | ). |
| 18 | To address the inherent funding risk of banks, creating illiquid assets from liquid deposits, two new liquidity constraints were introduced under Basel III: The Liquidity Coverage Ratio (LCR) to promote the short-term resilience of banks and the Net Stable Funding Ratio (NSFR) to incentivise a stable and reliable source of funds. Compared to capital regulation, there has been less theoretical and empirical investigation of their respective impacts. To the extent that the two ratios encourage banks to behave differently than they would otherwise, holding more liquid assets for stress events, there may be a cost in impeding the transformation function but measuring the impact is difficult (Elliot et al. 2012). According to research on the EU’s largest banks, both the LCR and the NSFR increased capital requirements by reducing bank fragility (Chiaramonte and Casub 2017). Both ratios may lead to holding greater capital, but this may have occurred for other reasons as well. If Liquidity Regulation makes banks safer, then the cost of both debt and equity should fall if everything else were equal…but it is not. Assessing the impact of these two ratios hinges on whether the cost of capital is appropriate to its risks both individually as well as for the sector, but controlling for other effects would be difficult. |
| 19 | While acknowledging the many limitations of VaR, we utilise it as a widely accepted summary measure of market risk (See, Lesnevski et al. (2007)). Its identification, measurement, reporting and management are regulatory requirements. Credit risk and Operational Risk while also falling within the Basel agenda are not examined in this research. |
| 20 | Some smaller but prominent institutions, such as Standard & Chartered, through their antecedents have been involved in edible oils and minerals on behalf of their clients going back to the 19th Century. The origins of Rabo Bank of the Netherlands Bank began with agricultural credit unions. |
| 21 | As reported by Consultancy Coalition, the commodity trading performance of the top 12 banks improved somewhat in 2019 through involvement in metals and petroleum markets (Reuters, 21 February 2020. https://www.reuters.com/article/banks-commodities-revenue/top-banks-2019-commodities-revenue-climbs-11-consultancy-coalition-idUSL8N2AL2R4, accessed on 3 March 2020). |
| 22 | This situation is unlikely as banks tend to set position limits according to VaR. If VaR were to fall because of a secular reduction in volatility, permitted positions might be increased. VaR is regulated by stipulating the required capital. |
| 23 | Further, the risk of bankruptcy is not rewarded by higher returns with the CAPM framework (Dichev 1998). |
References
- Abbas, Faisal, Omar Masood, Shoaib Ali, and Sohail Rizwan. 2021. How Do Capital Ratios Affect Bank Risk-Taking: New Evidence from the United States. Sage Open Journal 11: 2158244020979678. [Google Scholar] [CrossRef]
- Admati, Anat R., and Martin F. Hellwig. 2013. Does Debt Discipline Bankers? An Academic Myth about Bank Indebtedness. Available online: https://admati.people.stanford.edu/sites/g/files/sbiybj1846/f/publications/3031_1.pdf (accessed on 12 September 2021).
- Admati, Anat R., Peter M. DeMarzo, Martin F. Hellwig, and Paul C. Pfleiderer. 2012. Debt Overhang and Capital Regulation (March 23). Rock Center for Corporate Governance at Stanford University Working Paper No. 114, MPI Collective Goods Preprint, No. 2012/5. Available online: https://ssrn.com/abstract=2031204 (accessed on 2 February 2022).
- Admati, Anat R., Peter M. DeMarzo, Martin Hellwig, and Paul Pfleiderer. 2013. Fallacies, Irrelevant Facts, and Myths in the Discussion of Capital Regulation: Why Bank Equity Is Not Expensive. Stanford Graduate School of Business Working Paper No. 2065. Available online: https://www.gsb.stanford.edu/faculty-research/working-papers/fallacies-irrelevant-facts-myths-discussion-capital-regulation-why (accessed on 2 February 2022).
- Alexander, Gordon J., and Alexandre M. Baptista. 2006. Does the Basel Capital Accord reduce bank fragility? An assessment of the value-at-risk approach. Journal of Monetary Economics, Elsevier, Amsterdam 53: 1631–60. [Google Scholar] [CrossRef]
- Allen, Franklin, Elena Carletti, and Agnese Leonetto. 2011. Deposit Insurance and Risk Taking. Oxford Review of Economic Policy 27: 464–78. [Google Scholar] [CrossRef]
- Armour, John, Dan Awrey, Paul Davies, Luca Enriques, Jeffrey N. Gordon, Colin Mayer, and Jennifer Payne. 2016. Principles of Financial Regulation. Oxford: Oxford University Press. [Google Scholar]
- Arthur, Terry, and Philip Booth. 2010. Does Britain Need a Financial Regulator. Paris: IEA. [Google Scholar]
- Asal, Maher. 2015. Estimating the Cost of Equity Capital of the Banking. Journal of Applied Finance & Banking 5: 69–96. [Google Scholar]
- Baker, Malcolm, and Jeffrey Wurgler. 2015. Do Strict Capital Requirements Raise the Cost of Capital? Bank Regulation, Capital Structure, and the Low-Risk Anomaly. American Economic Review 105: 315–20. [Google Scholar] [CrossRef]
- Barnes, Samantha. 2014. Is This the End of Commodity Trading in Banks? International Banker. July. Available online: https://internationalbanker.com/brokerage/end-commodity-trading-banks/ (accessed on 2 February 2022).
- Basak, Suleyman, and Alexander Shapiro. 2001. Value-at-Risk-Based Risk Management: Optimal Policies and Asset Prices. The Review of Financial Studies 14: 371–405. Available online: http://www.jstor.org/stable/2696745 (accessed on 2 February 2022). [CrossRef]
- Boyd, John H., and Gianni. De Nicolo. 2005. The Theory of Bank Risk Taking and Competition Revisited. Journal of Finance 60: 1329–43. [Google Scholar] [CrossRef]
- Brandao-Marques, Luis, Ricardo Correa, and Horacio Sapriza. 2020. Government support, regulation, and risk taking in the banking sector. Journal of Banking & Finance 112: 105284. [Google Scholar]
- Chan-Lau, Jorge Antonio, Estelle Liu, and Jochen Schmittmann. 2012. Equity Returns in the Banking Sector in the Wake of the Great Recession and the European Sovereign Debt Crisis (July 1). Available online: https://ssrn.com/abstract=2101635 (accessed on 2 February 2022).
- Chiaramonte, Laura, and Barbara Casub. 2017. Capital and liquidity ratios and financial distress. Evidence from the European banking industry. The British Accounting Review 49: 138–61. [Google Scholar] [CrossRef]
- Copeland, Thomas E., and J. Fred Weston. 1992. Financial Theory and Corporate Policy: Pearson New International Edition, 3rd ed. Boston: Addison Wesley. ISBN 0-201-10648-5. [Google Scholar]
- Culp, Christopher L., and Andrea M. P. Neves. 2017. Shadow Banking, Risk Transfer, and Financial Stability. Journal of Applied Corporate Finance 29: 45–64. [Google Scholar] [CrossRef]
- Daníelsson, Jón, Hyun Song Shin, and Jean-Pierre Zigrand. 2004. The impact of risk regulation on price dynamics. Journal of Banking and Finance 28: 1069–87. [Google Scholar] [CrossRef] [Green Version]
- Demirguc-Kunt, Asli, and Harry Huizinga. 2010. Bank activity and funding strategies: The impact on risk and returns. Journal of Financial Economics 98: 626–50. [Google Scholar] [CrossRef] [Green Version]
- Dichev, Ilia D. 1998. Is the Risk of Bankruptcy a Systematic Risk? The Journal of Finance 53: 1131–47. Available online: http://www.jstor.org/stable/117389 (accessed on 21 August 2021). [CrossRef]
- Dombret, Andreas, Yalin Gündüz, and Joerg Rocholl. 2017. Will German Banks Earn Their Cost of Capital? Bundesbank Discussion Paper, No. 01/2017. Frankfurt: Deutsche Bundesbank. [Google Scholar] [CrossRef]
- Eichberger, Jürgen, and Martin Summer. 2010. Bank Capital, Liquidity and Systemic Risk. Journal of the European Economic Association 3: 547–55. [Google Scholar] [CrossRef] [Green Version]
- Elliott, Douglas, Suzanne Salloy, and Andre Oliveira Santos. 2012. Assessing the Cost of Financial Regulation. September. IMF Working Paper No. 12/233. Washington, DC: International Monetary Fund. Available online: https://ssrn.com/abstract=2164587/233 (accessed on 2 February 2022).
- Gropp, Reint E., Thomas Mosk, Steven Ongena, and Carlo Wix. 2016. Bank Response to Higher Capital Requirements: Evidence from a Quasi-Natural Experiment. IWH Discussion Papers 33/2016. Halle: Halle Institute for Economic Research (IWH). [Google Scholar]
- Guo, Rui, Ying Jiang, Ao Li, Zhigang Qiu, and Hefei Wang. 2021. A model of delegation with a VaR constraint. Finance Research Letters 42: 101895. [Google Scholar] [CrossRef]
- Haldane, Aandrew, and Robert M. May. 2011. Systemic risk in banking ecosystems. Nature 469: 351–55. [Google Scholar] [CrossRef] [Green Version]
- Hanson, Samuel G., Anil K. Kashyap, and Jeremy C. Stein. 2011. A Macroprudential Approach to Financial Regulation. Journal of Economic Perspectives 25: 3–28. [Google Scholar] [CrossRef] [Green Version]
- Hirtle, Beverly, Anna Kovner, and Matthew Plosser. 2020. The Impact of Supervision on Bank Performance. The Journal of Finance 75: 2765–808. [Google Scholar] [CrossRef]
- Hogan, Thomas L. 2015. Capital and risk ratios in commercial banking: A comparison of capital and risk-based capital ratios. The Quarterly Review of Economics and Finance 57: 32–45. [Google Scholar] [CrossRef]
- Hoque, Hafiz, Dimitris Andriosopoulos, Kostas Andriosopoulos, and Douady Raphael. 2015. Bank regulation, risk and return: Evidence from the credit and sovereign debt crises. Journal of Banking and Finance 50: 455–74. [Google Scholar] [CrossRef] [Green Version]
- Intriligator, Michael D. 1971. Mathematical Optimization and Economic Theory Classics in Applied Mathematics. Philadelphia: Society for Industrial and Applied Mathematics. [Google Scholar]
- Jiang, Hai, Jinyi Zhang, and Chen Sun. 2020. How does capital buffer affect bank risk-taking? New evidence from China using quantile regression. China Economic Review 60: 101300. [Google Scholar] [CrossRef]
- Kahane, Yehuda. 1977. Capital adequacy and the regulation of financial intermediaries. Journal of Banking and Finance 1: 207–17. [Google Scholar] [CrossRef]
- Kaplanski, Guy, and Haim Levy. 2015. Value-at-risk capital requirement regulation, risk taking and asset allocation: A mean–variance analysis. The European Journal of Finance 21: 215–41. [Google Scholar] [CrossRef]
- Kern, Alexander. 2019. Principles of Banking Regulation. Cambridge: Cambridge University Press. [Google Scholar] [CrossRef]
- Kim, Daesik, and Anthony M. Santomero. 1988. Risk in banking and capital regulation. Journal of Finance 43: 1219–33. [Google Scholar] [CrossRef]
- King, Michael R. 2009. The cost of equity for global banks: A CAPM perspective from 1990 to 2009. BIS Quartery Review 59–73. Available online: https://www.bis.org/publ/qtrpdf/r_qt0909g.pdf (accessed on 2 February 2022).
- Klein, Michael A. 1971. A Theory of the Banking Firm. Journal of Money, Credit and Banking 3: 205–18. [Google Scholar] [CrossRef]
- Kobrak, Christopher, and Michael Troege. 2015. From Basel to bailouts: Forty years of international attempts to bolster bank safety. Financial History Review 22: 133–56. [Google Scholar] [CrossRef]
- Koehn, Michael, and Anthony M. Santomero. 1980. Regulation of bank capital and portfolio risk. Journal of Finance 35: 1235–50. [Google Scholar] [CrossRef]
- Leippold, Markus, Paolo Vanini, and Silvan Ebnoether. 2006. Optimal credit limit management under different information regimes. Journal of Banking & Finance 30: 463–87. [Google Scholar]
- Lesnevski, Vadim, Barry L. Nelson, and Jeremy Staum. 2007. Simulation of Coherent Risk Measures Based on Generalized Scenarios. Management Science 53: 1756–69. [Google Scholar] [CrossRef]
- Maccario, Aurelio, Andrea Sironi, and Cristiano Zazzara. 2002. “Is banks’ Cost of Equity Capital Different across Countries? Evidence from the G10 Countries Major Banks”, Libera Università Internazionale degli Studi Sociali (LUISS) Guido Carli, Working Paper. Available online: https://papers.ssrn.com/sol3/papers.cfm?abstract_id=335721 (accessed on 10 October 2021).
- McCauley, Robert N., and Steven A. Zimmer. 1991. Cost of Capital for Industry and Banks. Economics 26: 14–18. Available online: http://www.jstor.org/stable/23485845 (accessed on 10 October 2021).
- Megaw, Nicholas, and Kate Beioley. 2018. Big UK banks wade back into wealth management. Financial Times, August 12. Available online: https://www.ft.com/content/bd99a084-9c84-11e8-9702-5946bae86e6d(accessed on 2 February 2022).
- Miles, David, Jing Yang, and Gilberto Marcheggiano. 2012. Optimal Bank Capital. The Economic Journal 123: 1–37. [Google Scholar] [CrossRef]
- Modigliani, Franco, and Merton Miller. 1958. The Cost of Capital, Corporate Finance and the Theory of Investment. American Economic Review 48: 261–97. [Google Scholar]
- Neri, Massimiliano. 2012. The Unintended Consequences of the Basel III Liquidity Risk Regulation (June 30). Available online: https://ssrn.com/abstract=2096821 (accessed on 2 February 2022).
- Pandit, Vikram. 2010. We Must Rethink Basel or Growth Will Suffer. Financial Times, November 10. [Google Scholar]
- Pelligrinia, Carlo Bellavite, Michele Meolib, and Giovanni Urga. 2017. Money market funds, shadow banking and systemic risk in United Kingdom. Finance Research Letters 21: 163–71. [Google Scholar] [CrossRef]
- Pérignon, Christophe, Zi Yin Deng, and Zhi Jun Wang. 2008. Do banks overstate their Value-at-Risk? Journal of Banking & Finance 32: 783–94. [Google Scholar] [CrossRef]
- Shahzad, Syed Jawad Hussain, Thi Hong Van Hoang, and Jose Arreola-Hernandez. 2019. Risk spillovers between large banks and the financial sector: Asymmetric evidence from Europe. Finance Research Letters 28: 153–59. [Google Scholar] [CrossRef]
- Shrieves, Ronald E., and Drew Dahl. 1992. The relationship between risk and capital in commercial banks. Journal of Banking & Finance 16: 439–57. [Google Scholar] [CrossRef]
- Van Der Weide, Mark E., and Jeffery. Y. Zhang. 2019. Bank Capital Requirements after the Financial Crisis. In The Oxford Handbook of Banking, 3rd ed. Edited by Allen N. Berger, Philip Molyneux and John O. S. Wilson. Oxford: Oxford Academic. [Google Scholar]
- Verdoes, T. 2013. Basel III Capital Requirements: Costs and Benefits for Banks and Societies. Leidenlawblog. Available online: http://leidenlawblog.nl/articles/basel-iii-capital-requirements-costs-and-benefits-for-banks-and-societies (accessed on 15 October 2021).
- Weigand, Robert A. 2016. The performance and risk of banks in the U.S., Europe and Japan post financial crisis. Investment Management and Innovation 13: 75–93. [Google Scholar] [CrossRef] [Green Version]
- Yang, Jing, and Kostas Tsatsaronis. 2012. Bank stock returns, leverage and the business cycle. BIS Quarterly Review. March. Available online: https://ideas.repec.org/a/bis/bisqtr/1203g.html (accessed on 2 February 2022).
- Zhang, Zong-yi, Jun Wu, and Qiong-fang Liu. 2008. Impacts of Capital Adequacy Regulation on Risk-taking Behaviour of Banking. Systems Engineering–Theory and Practice 28: 183–89. [Google Scholar] [CrossRef]
Figure 1.
Stylised Graph of Internalising Social Cost Through Per Unit Taxation.

Figure 2.
Stylised Alternative Views of Basel Regulation in Mean-Variance Framework.

Figure 3.
Interest Rates. Data Source: Bloomberg®.

Figure 4.
D/E Ratio Mean and Standard Deviation of Selected Banks. Source: Bloomberg®.

Figure 5.
WACC results for top 10 banks by capitalisation from the selected database of 21 banks. Source: Bloomberg®.
Figure 5.
WACC results for top 10 banks by capitalisation from the selected database of 21 banks. Source: Bloomberg®.

Figure 6.
30-day Index Volatilities. Source: Bloomberg®.


Table 1.
Financial Institutions in our sample.
| Ticker | Full Name | Ticker | Full Name |
|---|---|---|---|
| JPM | JP Morgan | PNC | PNC FINANCIAL SERVICES GROUP |
| BAC | Bank of America | BNP | BNP Paribas |
| RY | Royal Bank of Canada | CM | Canadian Imperial Bank of Commerce |
| TD | Toronto Dominion Bank | ISP | Intesa Sanpaolo SpA |
| WFC | Wells Fargo Bank | INGA | ING Groep NV |
| C | Citibank | ACA | Credit Agricole |
| BNS | Bank of Nova Scotia | FRC | First Republic Bank |
| HSBA | HSBC Holdings | NA | National Bank of Canada |
| TFC | Truist Financial Corp. | LLOY | Lloyds Banking Group PLC |
| USB | U.S. Bancorp | BARC | Barclays PLC |
| BMO | Bank of Montreal |
Table 2.
Data Series and Frequency15.
Table 2.
Data Series and Frequency15.
| Data Series and Frequency | |
|---|---|
| Alpha | Daily |
| Adjusted Beta | Daily |
| Cost of Debt | Quarterly |
| Cost of Equity | Quarterly |
| Debt to Equity Ratio | Quarterly |
| Return on Equity | Quarterly |
| VaR by Asset Classes | Quarterly |
| Weighted Average Cost of Capital | Quarterly |
Table 3.
Financial Statistics for Selected Banks. Data Source: Bloomberg®.
| Financial Statistics for Selected Banks | ||||||
|---|---|---|---|---|---|---|
| Metric | Descriptive Statistics | 2000 to 2020 | Pre-Basel II 2000 to 2009 | Basel II to Basel III Transition 2009 to 2016 | Basel III Post 2016 | Percent Change Pre-Basel II to Post Basel III |
| Alpha | Mean | 0.0001 | 0.0003 | 0.0002 | −0.0002 | |
| Stdev. | 0.0010 | 0.0009 | 0.0012 | 0.0007 | ||
| Adjusted Beta | Mean | 1.08 | 0.98 | 1.21 | 1.07 | 8.87% |
| Stdev. | 0.26 | 0.21 | 0.31 | 0.16 | ||
| Cost of Debt | Mean | 2.21% | 3.52% | 1.55% | 1.24% | −104.49% |
| Stdev. | 1.38 | 1.16 | 0.74 | 0.80 | ||
| Cost of Equity | Mean | 11.62% | 9.43% | 13.88% | 11.48% | 19.67% |
| Stdev. | 3.58 | 1.97 | 4.01 | 2.56 | ||
| Debt to Equity Ratio | Mean | 3.31 | 4.05 | 3.14 | 2.24 | −59.25% |
| Stdev. | 3.61 | 4.63 | 3.02 | 1.29 | ||
| Return on Equity | Mean | 11.28% | 14.23% | 9.17% | 9.98% | −35.48% |
| Stdev. | 8.25 | 8.59 | 8.26 | 6.06 | ||
| WACC | Mean | 5.02 | 4.44 | 5.59 | 5.20 | 15.66% |
| Stdev. | 2.73 | 2.49 | 3.08 | 2.41 | ||
Table 4.
Fall in WACC 2000 versus 2020. Source: Bloomberg®.
| Fall in WACC 2000 versus 2020 | |||||
|---|---|---|---|---|---|
| BANK | BANK | BANK | |||
| JPM | −34% | HSBA | −108% | ISP | −62% |
| BAC | −48% | TFC | −6% | INGA | −123% |
| RY | 17% | USB | −26% | ACA | −261% |
| TD | 9% | BMO | 13% | FRC | −54% |
| WFC | −67% | PNC | −5% | NA | 27% |
| C | −82% | BNP | −274% | LLOY | 47% |
| BNS | 7% | CM | −3% | BARC | −187% |
Table 5.
VaR Metrics. Source: Bloomberg® (Note: Total VaR is less than components because of diversification benefit.).
Table 5.
VaR Metrics. Source: Bloomberg® (Note: Total VaR is less than components because of diversification benefit.).
| Summary Statistics on VaR for Selected Banks | ||||||
|---|---|---|---|---|---|---|
| Metric | Descriptive Statistics | 2000 to 2020 | Pre-Basel II 2000 to 2009 | Basel II to Basel III Transition 2009 to 2016 | Basel III Post 2016 | Percentage Change Pre-Basel II versus Post Basel III |
| Total VaR (USD, Millions) | Mean | 66.22 | 72.84 | 72.11 | 51.56 | −35% |
| Total VaR (USD, Millions) | Stdev. | 61.87 | 68.40 | 65.54 | 36.41 | −63% |
| Rate VaR (USD, Millions) | Mean | 51.47 | 75.26 | 48.93 | 36.01 | −74% |
| Rate VaR (USD, Millions) | Stdev. | 56.08 | 69.13 | 58.71 | 32.38 | −76% |
| Equity VaR (USD, Millions) | Mean | 19.26 | 30.24 | 18.99 | 12.49 | −88% |
| Equity VaR (USD, Millions) | Stdev. | 18.15 | 23.16 | 18.23 | 8.59 | −99% |
| FX VaR (Millions) | Mean | 11.43 | 14.77 | 13.80 | 7.13 | −73% |
| FX VaR (Millions) | Stdev. | 13.14 | 13.54 | 16.27 | 6.83 | −68% |
| Commodity VaR (Millions) | Mean | 9.03 | 13.04 | 8.64 | 6.50 | −70% |
| Commodity VaR (Millions) | Stdev. | 9.61 | 12.30 | 8.41 | 7.50 | −49% |
Table 6.
Z-Test for Difference in Mean WACC and Mean VaR during Pre-Basel II, II to III Transition and Post Basel III Periods. Data Source: Bloomberg®.
Table 6.
Z-Test for Difference in Mean WACC and Mean VaR during Pre-Basel II, II to III Transition and Post Basel III Periods. Data Source: Bloomberg®.
| Z-Test for Difference in Mean WACC and Mean VaR during Pre-Basel II, II to III Transition and Post Basel III Periods | |||
|---|---|---|---|
| Changes in WACC Z-Test for Sample of Two Means | One-Tail Z Value | P(Z ≤ z) One-Tail | Z Critical One-Tail 95% |
| WACC: Pre Basel II vs. Transition II to III | −2.6743 | 0.0037 | 1.6449 |
| WACC: Pre Basel II vs. Post Basel III | −1.7447 | 0.0405 | 1.6449 |
| WACC: Transition Basel II to III vs. Post Basel III | 0.8000 | 0.2119 | 1.6449 |
| VaR: Pre Basel II vs. Transition | −2.8335 | 0.0023 | 1.6449 |
| VaR: Pre Basel II vs. Post Basel III | 10.5448 | 0.0000 | 1.6449 |
| VaR: Transition Basel II to III vs. Post Basel III | 12.7669 | 0.0000 | 1.6449 |
Table 7.
Linear Regression Results. Data Source: Bloomberg®.
| Bank | Observations | Coefficient on WACC | T-Statistic on WACC | Coefficient on D/E | T-Statistic on D/E | Left-Tail T-Distribution WACC | Left-Tail T-Distribution D/E | Standard Error Y-Estimate | p-Value on WACC | p-Value on D/E | WACC | D/E | F-Statistic | F-Significance | Adjusted R-Squared | ||
|---|---|---|---|---|---|---|---|---|---|---|---|---|---|---|---|---|---|
| Lower 95% | Upper 95% | Lower 95% | Upper 95% | ||||||||||||||
| JPM | 79 | 3.80 | 1.39 | 17.63 | 5.94 | 80.11% | 94.69% | 52.49 | 0.1695 | 2.585 × 10−08 | −1.66 | 9.27 | 11.72 | 23.54 | 129.19 | 3.546 × 10⁻²⁵ | 75.44% |
| BAC | 80 | −5.78 | −1.58 | 29.07 | 6.19 | 82.00% | 94.90% | 52.68 | 0.1191 | 2.585 × 10−08 | −13.08 | 1.52 | 19.72 | 38.41 | 91.44 | 4.586 × 10⁻²¹ | 68.44% |
| TD | 39 | −1.20 | −1.44 | 17.00 | 4.93 | 80.72% | 93.64% | 8.17 | 0.1572 | 1.729 × 10−05 | −2.89 | 0.49 | 10.02 | 38.41 | 158.82 | 1.379 × 10⁻¹⁸ | 86.58% |
| WFC | 68 | excluded | n.a. | 13.66 | 7.14 | n.a. | 95.57% | 36.53 | n.a. | 8.664 × 10⁻¹⁰ | n.a. | n.a. | 9.84 | 17.49 | 50.91 | 9.298 × 10⁻¹⁰ | 41.69% |
| CITI | 79 | 4.62 | 1.52 | 19.35 | 7.88 | 81.48% | 95.98% | 57.19 | 0.1326 | 1.744 × 10⁻¹¹ | −1.43 | 10.68 | 14.46 | 24.24 | 197.13 | 8.359 × 10⁻³¹ | 82.15% |
| PNC | 49 | excluded | n.a. | 3.17 | 14.50 | n.a. | 97.81% | 2.66 | n.a. | 3.611 × 10⁻¹⁹ | n.a. | n.a. | 2.73 | 3.60 | 210.37 | 5.643 × 10⁻¹⁹ | 79.34% |
| BNP | 57 | excluded | n.a. | 3.14 | 16.53 | n.a. | 98.08% | 18.61 | n.a. | 3.345 × 10⁻²³ | n.a. | n.a. | 2.76 | 3.52 | 273.22 | 5.412 × 10⁻²³ | 81.20% |
| ACA | 55 | 13.56 | 12.97 | excluded | n.a. | 97.55% | n.a. | 18.52 | 3 × 10⁻¹⁸ | n.a. | 11.46 | 15.65 | n.a. | n.a. | 168.21 | 4.476 × 10⁻¹⁸ | 73.85% |
Table 8.
Average 30 Volatility during Basel Implementation Periods. Source: Bloomberg®.
| Average 30 Volatility during Basel Implementation Periods | |||||||||
|---|---|---|---|---|---|---|---|---|---|
| Periods | Commodity Index | Euro Index | USD Index | FTSE 100 | Nasdaq Index | Dow Jones Industrial Index | Nikkei Index | US Treasury Index | EU Rate Index |
| Pre Basel II-2000 to 2009 | 16.41 | 5.28 | 9.31 | 17.51 | 31.03 | 7.05 | 23.39 | 4.73 | 3.00 |
| Basel II to Basel III Transition 2009 to 2016 | 15.69 | 7.17 | 10.16 | 17.34 | 18.93 | 6.01 | 22.29 | 4.23 | 3.01 |
| Basel III Post 2016 | 12.39 | 5.29 | 8.31 | 15.13 | 19.01 | 5.50 | 17.62 | 3.89 | 2.85 |
| Percent Change First and Last Periods | −28% | 0% | −11% | 15% | −49% | −10% | −28% | −20% | −5% |
Disclaimer/Publisher’s Note: The statements, opinions and data contained in all publications are solely those of the individual author(s) and contributor(s) and not of MDPI and/or the editor(s). MDPI and/or the editor(s) disclaim responsibility for any injury to people or property resulting from any ideas, methods, instructions or products referred to in the content. |
© 2023 by the authors. Licensee MDPI, Basel, Switzerland. This article is an open access article distributed under the terms and conditions of the Creative Commons Attribution (CC BY) license (https://creativecommons.org/licenses/by/4.0/).
Share and Cite
MDPI and ACS Style
Haar, L.; Gregoriou, A. Regulation and De-Risking: Theoretical and Empirical Insights. Risks 2023, 11, 104. https://doi.org/10.3390/risks11060104
AMA Style
Haar L, Gregoriou A. Regulation and De-Risking: Theoretical and Empirical Insights. Risks. 2023; 11(6):104. https://doi.org/10.3390/risks11060104
Chicago/Turabian StyleHaar, Lawrence, and Andros Gregoriou. 2023. "Regulation and De-Risking: Theoretical and Empirical Insights" Risks 11, no. 6: 104. https://doi.org/10.3390/risks11060104
Note that from the first issue of 2016, this journal uses article numbers instead of page numbers. See further details here.