Article

Risk Mitigation in Agriculture in Support of COVID-19 Crisis Management

by
Boris M. Leybert
1,
Oksana V. Shmaliy
2,
Zhanna V. Gornostaeva
3,* and
Daria D. Mironova
3
1
Higher School of Information and Social Technologies, Ufa State Petroleum Technological University, 450064 Ufa, Russia
2
Institute of Law and National Security, Faculty of Law Named after M.M. Speransky, Russian Presidential Academy of National Economy and Public Administration, 117571 Moscow, Russia
3
Faculty of Economics, Service and Entrepreneurship, Don State Technical University, 344000 Rostov-on-Don, Russia
*
Author to whom correspondence should be addressed.
Risks 2023, 11(5), 92; https://doi.org/10.3390/risks11050092
Submission received: 7 March 2023 / Revised: 9 April 2023 / Accepted: 5 May 2023 / Published: 15 May 2023
(This article belongs to the Special Issue The COVID-19 Crisis: Datasets and Data Analysis to Reduce Risks)

Abstract

:
The main focus of this article is the problem of exacerbating agricultural risks in the context of the COVID-19 crisis, which started against the background of the novel coronavirus (COVID-19) pandemic. The motivation for conducting the research presented in this article was the desire to increase the resilience of agricultural companies to economic crises. This paper is aimed at studying the Russian experience of changing the production and financial risks of agricultural companies during the COVID-19 crisis, substantiating the important role of innovations in reducing these risks, and determining the prospects for risk management in agriculture based on innovations to increase its crisis resilience. Using the structural equation modelling (SEM) method, we modelled the contribution of innovations to the risk management of agriculture during the COVID-19 crisis. The advantages of the SEM method, compared to other conventional methods (e.g., independent correlation analysis or independent regression analysis), include the increased depth of analysis, its systemic character, and the consideration of multilateral connections between the indicators. Using the case-study method, a “smart” vertical farm framework is being developed, the risks of which are resistant to crises through the use of datasets and machine learning. The originality of this article lies in rethinking the risks of agriculture from the standpoint of “smart” technologies as a new risk factor and a way to increase resilience to crises. The theoretical significance of the results obtained is that they make it possible to systematically study the changes in the risks of agriculture in the context of the COVID-19 crisis, while outlining the prospects for increasing resilience to crises based on optimising the use of “smart” technologies. The practical significance of the article is related to the fact that the authors’ conclusions and applied recommendations on the use of datasets and machine learning by agricultural companies can improve the efficiency of agricultural risk management and ensure successful COVID-19 crisis management by agricultural companies.

1. Introduction

The risks of agriculture are complex and require a special approach to their study. Firstly, they include financial risks, similar to other sectors of the economy (Panagiotou and Tseriki 2022). Financial risks are linked with the changes in the market (e.g., changes in input/output prices in production) and are manifested in the changes in the financial results of business activity (i.e., profits/losses). Entrepreneurial risks in agriculture represent a deterioration in the financial and economic performance of agricultural companies, the main manifestation of which is a decrease in the net financial result (i.e., decrease in profits, increase in losses) (Bai and Jia 2022; Polukhin and Panarina 2022).
Secondly, there are production risks, associated with reduced food production (Welsh et al. 2022). In this case, agricultural risks pose a threat to food security and, therefore, acquire economic significance (Franken et al. 2022; Liu 2022). Food forms the main, lower tier of Maslow’s pyramid of needs; therefore, meeting the need for it is critically important for individuals and society (Van Lenthe et al. 2015).
It is also advisable to consider the production risks of agriculture from the perspective of international trade (Zhang et al. 2022a). Unlike other commodities, domestic agricultural production cannot fully replace imports (Panagiotou and Tseriki 2022). Because of this, guided by the principle of the international division of labour, and specialising in the non-food sector, the countries of the world experience increased agricultural production risks in terms of food shortages (Sun et al. 2022).
It should also be taken into account that the establishment of agricultural production requires compliance with a number of serious conditions: the availability of fertile soil suitable for agriculture, a favourable climate, the availability of water supply and fertilisers, etc. (Popkova et al. 2022). Because of this, many countries cannot fully satisfy their domestic demand for agricultural products and must depend on imports. Therefore, the reduction in agricultural production in exporting countries increases the production risks of agriculture in terms of reducing the supply of food available on world markets (i.e., deficits and rising food prices) (Popkova 2022).
The COVID-19 crisis is a serious challenge for the modern economy and entrepreneurship, causing a situation of uncertainty and increasing overall business risks to a critical level (Litvinova 2022; Yelikbayev and Andronova 2022). At the same time, industrial markets reacted differently to the COVID-19 crisis (Inshakova et al. 2021). So, despite the overall decline in GDP—or at least a significant slowdown in economic growth (varying among countries around the world)—some sectors (for example, transport, due to the suspension of international transport links and domestic social distancing regimes) demonstrated a decline, while others (for example, healthcare—medical services, equipment, and pharmaceuticals) showed an increase (Dorczak et al. 2021; Yankovskaya et al. 2022).
Taking into account the noted differences in the consequences of the COVID-19 crisis, its interpretation from the standpoint of risk can provide the most complete and reliable picture of it in the economy and entrepreneurship. The risks of agriculture also deserve special attention due to their specificity, and due to the priority of agriculture as a sector of the economy—associated with low natural rent and good environmental characteristics (for example, compared to industry), as well as playing a major role in ensuring food security.
The purpose of this article is to study the impact of the COVID-19 crisis on the risks in agriculture and to determine the prospects for improving the resilience of agricultural companies to crises based on innovations, using the example of Russia. To achieve this goal, the following research tasks are sequentially resolved in this article: analysis of changes in the risks of agriculture in the context of the COVID-19 crisis; modelling the contribution of innovations (i.e., R&D costs) to agricultural risk management during the COVID-19 crisis; and development of a framework for a “smart” vertical farm, the risks of which are resistant to crises through the use of datasets and machine learning.
Agriculture is a sector that is unique due to the fact that it has not suffered any negative effects from COVID-19. On the contrary, it has grown. Therefore, it is particularly important to study the successful experience of agricultural companies in the sphere of managing the risks of the COVID-19 pandemic and crisis. The main question of this research was what allowed agricultural companies to achieve high resilience to the risks of the COVID-19 pandemic and crisis. This paper tests the hypothesis that this risk resilience is based on innovations. The originality of this article lies in rethinking the risks of agriculture from the standpoint of innovations and, in particular, “smart” technologies as a new risk factor and a way to increase resilience to crises.
The empirical framework of this research is the statistics on food production volume (using the example of grain), with the balanced financial results of agrarian companies and agricultural R&D costs in regions of Russia in 2019–2020. The relevance of this research is due to its revelation of the production risks that are connected with the reduction in food production volume (using the example of grain), as well as financial risks, which are manifested in the deterioration of the financial and economic indicators of agricultural companies’ activities (i.e., decrease in the balanced financial result).
The need to study these risks is due to the fact that they inevitably grow under the conditions of economic crises and hinder the sustainable development of agricultural entrepreneurship. The world grain market is destabilised in 2022–2023, and to restore its balance it is necessary to study the experience of managing the risks of agricultural entrepreneurship under the conditions of previous crises, of which the COVID-19 crisis is the most relevant. The experience of Russia is particularly useful and notable, since Russia is one of the largest grain producers and exporters in the world.
This paper’s novelty is in its opening a new (regional) aspect of the research of agriculture risks and describing the poorly studied and leading experience of Russia in risk management in grain production. Due to this new regional aspect, this paper’s contribution to the literature consists in determining the specifics of production and financial risks and the management of these risks given the climatic, geographical (regions belong to federal districts, with a clear division into southern and northern regions), and socioeconomic (new classification of regions by the level and rate of development) features of agricultural regions.

2. Theory

2.1. Literature Review and Gap Analysis

The conceptual framework of this research is the concept of the agrarian economy. According to this concept, the basis of food systems is agricultural entrepreneurship, which—under the conditions of the market economy—is a flexible market subject that faces risks and implements innovations (Bene et al. 2021). This article draws on the risk theory of agriculture, which has been deeply developed and widely represented in the available research literature.
Each of the identified types of agricultural risk depends on the relevant factors. Production risks depend on natural and climatic factors (Sohail et al. 2022). Deteriorating and unpredictable climate change, soil depletion, and shrinking agricultural land reduce the agricultural production capacity, as well as productivity, exacerbating the problem of food security (Ahmed et al. 2022; Zhang et al. 2022b).
Sales risks are influenced by market factors, including the crisis. The nature of these risks comes down to the ability of agricultural companies to profitably sell the entire volume of agricultural products that they produce on the market (Adhikari and Khanal 2022). This opportunity is determined by market conditions: the level and nature of competition among food producers, the degree of monopolisation at other stages of the value chain in the agro-industrial complex, solvent demand (which is especially important for natural/organic agricultural products), and government regulation of food prices (Bai and Jia 2022; Bai et al. 2022).
Innovations and, in particular, “smart” technologies make a huge contribution to reducing the risks of agriculture. Production risks are reduced by improving the resource provision of the AI-based horizontal farm: precision farming with automated irrigation, dosed fertiliser delivery to each plant, automated harvesting, etc. (Nayal et al. 2022). Sales risks are mitigated by intelligent AI-based sales decision support (Pena et al. 2022).
There are also arguments in the literature that agricultural risks have increased in the face of the COVID-19 crisis. Production risks have increased due to the increase in the cost of raw materials and equipment for agriculture (Prasad et al. 2022). Financial risks have increased due to the disruption of value chains, reduced effective demand, and government regulation of food prices (Gascón and Mamani 2022; Kuleh et al. 2022).
According to the features described in the existing literature, it is proposed to manage each type of risk in agriculture separately. Industrial risk management involves making agriculture more climate-resilient (Howland and Francois Le Coq 2022; Jones and Leibowicz 2022). Agricultural financial risk management involves strengthening the market position of agricultural companies (Ricome and Reynaud 2022; Wang et al. 2022).
The review of the literature presented a high degree of elaboration on the problem at hand. Along with this, an in-depth content analysis of scientific literature revealed two research gaps: The first gap is related to the lack of knowledge of the impact of the COVID-19 crisis on the risks in agriculture. The available literature is dominated by theoretical studies, while empirical experience remains underdeveloped. The existing literature is represented by scattered studies reflecting the experience of individual countries, while the experience of other (i.e., most) countries remains insufficiently studied—in particular, the experience of Russia.
The second gap lies in the lack of scientific research on the prospects for managing risks in agriculture based on “smart” technologies to increase resilience to crises. The existing literature offers scientific and methodological recommendations and applied solutions to reduce the risks of agriculture, but it does not guarantee their resilience to crises, and the role of “smart” technologies in this process is insufficiently researched. The resulting separate management causes inconsistency in the risk management of agriculture.
For example, improving the climate resilience of agriculture through “smart” technologies reduces production risks. However, it often increases financial risks due to the inability of agricultural companies to recoup the high capital costs of technological modernisation, because of their inability to influence market prices in the highly competitive environment (Tong et al. 2019; Yang et al. 2022a). In another example, agrarian companies often reduce their financial risks through artificial scarcity—through monopolistic collusion, causing a rush for food and, consequently, an increase in prices (Kakraliya et al. 2022; Yang et al. 2022b).
These examples point to the serious shortcomings of isolated agricultural risk management, and to the need for an alternative (i.e., new) approach to risk management. This article seeks to fill both identified gaps through a systematic study of the changing risks of agriculture in the context of the COVID-19 crisis and the prospects for increasing resilience to crises based on the optimisation of the use of “smart” technologies, based on a detailed study of the experience of Russia.

2.2. Research Questions and Hypotheses

The identified gaps in the literature determined the formulation of the following two research questions (RQ) in this article:
RQ1: How have the risks of agriculture changed during the COVID-19 crisis?
To correctly understand this issue, it should be noted that the COVID-19 crisis is an unfavourable general business climate in the economy in a certain period (the crisis peaked in 2020). There is no doubt that the impact of the COVID-19 crisis on the risks in agriculture was negative. At the same time, in addition to the COVID-19 crisis in 2020, the risks of agriculture were influenced by many other factors. An example of this is the factor of state regulation—increased state support for agriculture to help it in the context of the COVID-19 crisis, as a priority sector of the economy, could potentially prevent an increase or even reduce the risks of agriculture in 2020 (Sánchez et al. 2022).
The totality and nature of the influence of factors on the risks in agriculture differ between countries, making it advisable to study the experience of each country separately. Russia’s experience is noteworthy for several reasons. The country has a progressive, dynamic economy that is clearly showing the impact of the COVID-19 crisis. According to the International Monetary Fund (2022), the economic growth rate in Russia decreased from 2.033% in 2019 to −2.951% in 2020. At the same time, the COVID-19 crisis has not had a critical impact on the Russian economy, allowing for various consequences for agricultural risks (they have not necessarily increased and, therefore, need to be studied). Positive economic growth has already been achieved in 2021, more than doubling the pre-crisis level of 4.690%.
The experience of Russia is also interesting because it has a largely agrarian economy. According to World Bank (2022) estimates, the share of agriculture in the structure of Russia’s GDP in 2020 was quite large (more than in many other developed and dynamically developing post-industrial economies) and amounted to 3.7%—an increase compared to the 3.3% in 2010. The experience of Russian agriculture in the context of the COVID-19 crisis has been little studied from the standpoint of entrepreneurial risks. Therefore, to answer t RQ1, we took into account the aforementioned general recession of the Russian economy in 2020, and we also relied on the literature of Manian et al. (2022) and Štreimikienė et al. (2022)—which presents international experience—to put forward the H1 hypothesis about the risks of agriculture that have increased in Russia in the context of the COVID-19 crisis.
The choice of financial and production risks in this research is explained by the fact that, according to the works of Melekhova et al. (2022) and Wegren (2021), agricultural business is most exposed to these risks in the context of the COVID-19 pandemic and crisis. Assumptions regarding an increase in production risk are explained by the agricultural businesses facing coronavirus limitations because of the lockdown, which could have led to a reduction in the level of loading and production capacity. Financial risks could grow due to the increase in expenditures for fighting the viral threat with fixed prices, which could have led to a decrease in profits—and even losses.
RQ2: Do innovations facilitate better management of agricultural risks, to increase its resilience to the risks of crises?
For the correct understanding of this issue, it should be noted that the foundations of risk management in agriculture are laid down in the works of Capitanio (2022) and of Jones and Leibowicz (2022), studied in sufficient detail, and they are well known. However, the existing management approach can only mitigate—not completely neutralise—the negative impact of the economic crisis on the risks in agriculture. In this regard, it is important to develop a new, alternative approach. Building on the works of Menaga and Vasantha (2022), Qureshi et al. (2022), and Rani et al. (2022), this article puts forward the H2 hypothesis: that “smart” technologies can increase the resilience of agricultural risks to crises.
In this regard, the experience of Russia as a country with a well-formed digital economy is also interesting. R&D costs in the analysed companies include “smart” technologies—in particular, AI and machine learning. According to the National Research University “Higher School of Economics” (2022), in Russia, 17.2% of agricultural companies used big data collection, processing, and analysis technologies in their activities; 11.6% of agricultural companies in 2020 actively used the Internet of things (IoT); 2.2 % used artificial intelligence (AI); and 4.1% used industrial robots/automated lines.
Therefore, 2.2–35.1% (17.2 + 11.6 + 2.2 + 4.1) of companies from the sample use “smart” technologies in their activity. More precise information on the sample is provided by its creator: automation and digitalisation are used only in 10–13% of enterprises in the sphere of precision farming, and in 15–20% of enterprises in the sphere of precision livestock farming. The main motive of digitalisation is the optimisation of costs. Innovations are implemented mainly in large agro holdings, which have a better technical base and financial risk resilience (Expert 2022).
Answers to the set RQs can be found in this paper with the help of econometric modelling of the systemic interconnection between the balanced financial results (i.e., profit minus loss) of agricultural companies in 2019–2020 and the yield of grain and legumes (weight after processing, in farms of all categories) in 2020, along with R&D costs for agricultural sciences in 2019. The research covers all regions of Russia.

3. Materials and Methods

The main estimation method used to obtain the main results in this paper was structural equation modelling (SEM). The advantages of SEM compared to other conventional methods (e.g., independent correlation analysis or independent regression analysis) are the increased depth of analysis, its systemic character, and the consideration of multilateral connections between the indicators (Crăciun et al. 2023).
The weaknesses of other methods that could have been applied in this research are as follows: (1) insufficient depth of analysis—superficial reflection of only generalised connections between the indicators, with the impossibility of determining the regularities of change in certain indicators under the influence of the change in other indicators (weakness of correlation analysis) (Tseytlin and Grebneva 2022); (2) fragmented results of the analysis—the presence of only one dependent variable, while factor variables can influence several dependent variables at the same time, but each case is considered in isolation, due to which the general picture remains unclear (weakness of regression analysis) (Park and Yi 2023); (3) analysis limited by unilateral connections of the indicators—only the influence of the factor variable on the dependent variable is reflected, but possible reverse influence, through which variables exchange places—i.e., the resulting variable becomes the factor variable, and vice versa—is ignored (weakness of regression analysis) (Pimentel et al. 2023).
The above drawbacks reduce the precision of the results, make them fragmentary, and complicate their interpretation, causing inaccuracies and errors in their treatment. SEM overcomes these disadvantages and allows, first, a quantitative description—with high precision—of the regularities of change in some indicators under the influence of the change in other indicators (Singh et al. 2023) and, second, systemic reflection of the entire totality of connections among the large set of indicators (Yu et al. 2023).
Third, SEM demonstrates multilateral connections among the indicators, which in some cases may be resulting variables, and in other cases factor variables (Syafriana et al. 2023). Due to the above advantages of SEM, using it as the basis for this research methodology guarantees the receipt of the most comprehensive, correct, and precise results, as well as their correct qualitative treatment and scientific interpretation (Yuan et al. 2023). In this article, the study is carried out according to the following structural and logical scheme (Table 1):
As shown in Table 1, to answer RQ1, the first task of this study was to analyse the risks of agriculture in the context of the COVID-19 crisis. The methodology for solving this problem was based on a theoretical understanding of risks as deterioration in the economic performance of agricultural companies. Two key types of risk faced by agricultural companies were taken into account: Firstly, financial risks, manifested in the deterioration of the financial and economic performance of agricultural companies, and the decrease in the net financial result (i.e., decreased profits, increased losses).
Secondly, production risks are associated with a reduction in the volume of food production (e.g., grain). Using the horizontal analysis method, the changes in the yield of grain and legumes (weight after processing, in farms of all categories) and the changes in the balanced financial results of agricultural companies in the regions of Russia in 2020 compared to 2019 were determined. Negative growth indicates the presence of risks in agriculture during the COVID-19 crisis.
The method of analysis of variance was used to discover trends in the annual variation in the production of grain and the balance of agricultural companies. The method of correlation analysis was used to determine the connections between the innovation performance in agriculture before the pandemic (2018–2019), during the acute phase of the pandemic (2020), and after the end of the acute phase of the pandemic (2021). The methods of analysis of variance and correlation analysis were used as part of a preliminary analysis to obtain important information for the subsequent application of the main method of this research: structural equation modelling (SEM).
The balanced financial result (i.e., profit minus loss) of agricultural companies (unit: million RUB in the Appendix A) reflects the average profit/losses of companies in each region. The research was performed at the meso level (the level of Russian regions) in the context of categories of regions designated by the Institute of Scientific Communications (2022) in the dataset “Interactive statistics and intellectual analytics of the balance of the Russian regional economy based on big data and blockchain—2022”: (1) Rockets: leading and quickly developing regions; (2) Racers: regions with a large potential for development; (3) Parachutists: progressive regions with slow development; (4) Turtles: lagging regions.
This allows consideration of the specifics of risk management based on innovations and the differences in the risk resilience of agricultural companies that are predetermined by the meso-economic environment, i.e., the level and rate of the region’s socioeconomic development. To take into account the influence of natural and climatic factors on the risk management of agrarian companies with the help of innovations, we analysed the model in the context of federal districts, which are based on geographical factors.
To answer RQ2, the second objective of this study was to model the contribution of smart technology to agricultural risk management during the COVID-19 crisis. Using the structural equation modelling (SEM) method, systemic relationships were modelled between the costs of agricultural R&D in 2019 and in 2020, and between the production and balanced financial results of agricultural companies in the regions of Russia in 2020.
The SEM method was used for the same purposes (RQ2) in previous works by Luu et al. (2019) and Sohail and Chen (2022). The choice of SEM can be explained by its high precision and its ability to obtain the most explicit results, which describe not only unilateral but also bilateral (which cannot be discovered with the help of regression analysis) links between indicators.
The economic point is the systemic relationship between the risks of agricultural companies, and it takes into account the delayed effects of these risks. As a key risk factor for agricultural companies, the costs of research and development (R&D) in agricultural sciences must be taken into account. According to Rosstat (2023), R&D costs are not necessarily the implementation of smart technologies, but the implementation of any innovations. Dependencies between indicators are determined using the regression analysis method, and the so-called SEM errors are determined using the variation analysis method as a measure of the spread of indicator values. The research model is written as follows:
B a l a n c e 20 = a 1 + b 1 R D 19 + b 2 R D 20 + b 3 R P r o d u c t i o n 20 ; P r o d u c t i o n 20 = a 2 + b 4 R D 20 + b 5 B a l a n c e 19 ,
where Balance19 is the balanced financial result (profit minus loss) of agricultural companies in 2019 (million RUB);
Balance20 is the balanced financial result (profit minus loss) of agricultural companies in 2020 (million RUB);
Production20 is the yield of grain and legumes (weight after processing, in farms of all categories) in 2020 (centners per hectare of harvested area);
R&D19 is the cost of R&D in agricultural sciences in 2019 (million RUB);
R&D20 is the cost of R&D in agricultural sciences in 2020 (million RUB).
The research model (1) aims to demonstrate the impact of R&D and the net financial result of 2019–2020 on the volume of production and, as a result, the net financial results of agricultural companies in 2020. The reliability of the regression models was tested using Fisher’s F-test and correlation coefficients (Sureiman and Mangera 2020). To test the regression model, we also performed Student’s t-test (Marcoulides and Yuan 2016). Only reliable regression results were included in the SEM model.
The study sample included all regions of Russia, because sufficiently detailed statistics have been collected to study agricultural risks at the regional level. The data source was Rosstat (2023). The empirical basis for this study is given in Appendix A.1. A list of the main agricultural companies in Russia and a description of their activities based on the materials of Expert (2022) are given in Appendix A.2.
According to Rosstat (2023), there are 102,900 agricultural companies in Russia. Therefore, the 50 companies of the sample account for 0.05% of agricultural entrepreneurship in Russia. At the same time, the sample includes the 50 largest agricultural companies in Russia, which are leaders in the food markets, and to which other market players look up. This allows the extension of the studied experience of the top 50 companies to the agricultural entrepreneurship of Russia on the whole. The data on agricultural companies were taken from the dataset of Expert (2022).
As part of the third task of this study, a “smart” vertical farm framework was developed, the risks of which are resistant to crises through the use of datasets and machine learning. With the help of the case-study method, the case experience of organising the work of a “smart” vertical farm by the Institute of Scientific Communications (ISC) and the Consortium for Sustainable Development and Technology Leadership (CSDTL)—based on datasets and machine learning—is described, reflecting its advantages in the form of increased risk resistance of this farm to crises (in particular, the COVID-19 crisis).

4. Results

4.1. Risk Analysis of Agriculture during the COVID-19 Crisis

To search for an answer to RQ1 within the first task of this research, we performed an analysis of the risks to agriculture during the COVID-19 crisis. The methods of horizontal analysis and analysis of variance, based on the data from Table A1, were used to determine the changes in the yield of grain and legumes (weight after processing, in farms of all categories), the changes in the balanced financial results of agricultural companies, and the changes in agricultural R&D costs in regions of Russia in 2018–2021 (Figure 1, Figure 2 and Figure 3).
According to Figure 1, agricultural companies in Russia, on the whole, faced financial and production risks during the COVID-19 crisis, but the effect of these risks was delayed in time. Thus, at the level of agricultural entrepreneurship on the whole, the yield of grain and legumes (weight after processing, in farms of all categories) in 2020 (27.63 centners per hectare of harvested area) grew by 7.16% compared to 2019 (25.78 centners per hectare of harvested area).
According to Figure 2, the growth in the yield of grain and legumes in 2020 decreased compared to the pre-pandemic growth in 2019 (7.16%). In 2021, the delayed effect of the pandemic manifested: a reduction in the yield of grain and legumes by 9.12%. Variation in the yield of grain and legumes also grew in 2021 (54%) compared to 2018–2020 (48–49%).
According to Figure 3, the balanced financial result of agricultural companies in 2020 (RUB 5865.2 million) grew by 158.03% compared to 2019 (RUB 2273.1 million). In 2021, the growth of the balance of agricultural companies reduced to 57.79%, which was much lower than its growth in 2020 (+158.03%), although before the pandemic this growth was negative (−27.82% in 2019). Therefore, the balance of agricultural companies was determined not only by the pandemic in 2020–2021, but also by the influence of other factors that, perhaps, were more significant.
However, certain agricultural companies faced agricultural risks under the conditions of the COVID-19 crisis. Out of 75 objects of the sample, the reduction in the yield of grain and legumes (weight after processing, in farms of all categories) in 2020 compared to 2019 took place in 12 (16%) objects, and deterioration of financial and economic indicators of agricultural companies’ activity (i.e., reduction in profit; increased losses) was observed in 30 (40%) objects.
Expenditures for agricultural R&D in 2020 (14.88%) and 2021 (11.23%) were doubled compared to the pre-pandemic level (the growth in 2019, compared to 2018, was 5.35%). To determine how the role of innovations changed before and after the COVID-19 pandemic, a correlation analysis of the connections between the risks to agriculture and innovations (i.e., costs of R&D in agricultural sciences) in Russia in 2018–2021 was performed, as shown in Figure 4 (based on the data from Table A1).
As shown in Figure 4, the connection (correlation) between the yield of grain/legumes and innovations (i.e., costs of R&D in agricultural sciences) before the pandemic was 0.16 in 2018 and 0.13 in 2019, but during the pandemic it increased to 0.19 in 2020, and in 2021 it returned to the highest pre-pandemic level of 0.16.
The connection between the balanced financial result of agricultural companies and innovations (i.e., costs of R&D in agricultural sciences) before the pandemic was 0.23 in 2018; in 2019, it was negative (−0.04). During the pandemic, it reached 0.43 in 2020 and decreased in 2021, remaining at a much higher level compared to the pre-pandemic level (0.25).
The results obtained show that no serious risks to agriculture appeared during the COVID-19 crisis; thus, this crisis did not create a threat to Russia’s food security. However, certain agricultural companies faced risks; thus, there is a need for risk management. The financial and production risks faced by agricultural companies in Russia grew substantially after the end of the acute phase of the pandemic (2021), compared to the acute phase of the pandemic (2020) and, in particular, to the pre-pandemic level (in 2018–2019). This is a sign of the delayed effect of the risks caused by COVID-19 in agriculture and the necessity of strategic risk management.
The quick (i.e., doubled) growth in the innovative activity of agricultural companies in Russia allowed for a substantial reduction in COVID-19 risks. As a result, the connections between innovations and the production (by 46% in 2020 compared to 2019: from 0.13 to 0.19) and financial (by 87% in 2020 compared to 2018: from 0.23 to 0.43) risks of agricultural companies grew significantly. Thus, innovations should be set on the basis of risk management in agriculture during the pandemic.

4.2. Modelling the Contribution of Smart Technologies to Agricultural Risk Management during the COVID-19 Crisis

To answer RQ2, the second task of this study was to model the contribution of smart technologies to agricultural risk management during the COVID-19 crisis. The relationships between the yield of grain and legumes (weight after processing, in farms of all categories), the segregated financial results of agricultural companies, and the volume of R&D costs in agriculture were determined by the research model (1) and empirical data from Table 1 using the regression analysis method:
B a l a n c e 20 = 2671.2945 79.6784 R D 19 + 84.2098 R D 20 + + 180.6058 R P r o d u c t i o n 20 ; P r o d u c t i o n 20 = 25.6342 + 0.0067 R D 20 + 0.0002 B a l a n c e 19 ,
The system of Equation (2) refines the research model (1) and indicates that the costs of R&D in agricultural sciences act as a key risk factor for agricultural companies. Thus, an increase in the volume of costs of R&D in agricultural sciences in 2020 by RUB 1 million led to an increase in the yield of grain and legumes (weight after processing, in farms of all categories) in 2020 by 0.0067 centners per hectare of harvested area.
An increase in the costs of R&D in agricultural sciences in 2020 by RUB 1 million led to an increase in the balanced financial result (i.e., profit minus loss) of agricultural companies in 2020, by RUB 84.2098 million. An increase in the balanced financial results (profit minus loss) of agricultural companies in 2019 by RUB 1 million led to an increase in the yield of grain and legumes (weight after processing, in farms of all categories) in 2020, by 0.0002 centners per hectare of harvested area.
An increase in the yield of grain and legumes (weight after processing, in farms of all categories) in 2020 by 1 centner per hectare of harvested area led to an increase in the balanced financial result (profit minus loss) of agricultural companies in 2020, by RUB 180.6058 million. The results obtained demonstrate a close systemic interconnection between the considered indicators. Innovations have a quick effect on the production of grain, but a delayed (long-term, manifesting after a year) effect on the balance of agricultural companies.
To check the reliability of the regression models obtained in the system of Equation (2), let us turn to the detailed regression statistics and the results of the dispersion analysis (Table 2 and Table 3).
As shown in Table 2, the multiple correlation was 0.7804, and R2 was 0.6091. Therefore, 60.91% of the change in the balanced financial result (profit minus loss) of agricultural companies in 2020 is explained by the changes in the costs of agricultural R&D in 2019 and the yield of grain and legumes (weight after processing, in farms of all categories) in 2020. The obtained value of significance F (1.77 × 10⁻¹⁴) demonstrates that the considered regression model must be correct at the level of significance of α = 0.01. For 75 observations and three factor variables (k1 = 3; k2 = 75 − 3 − 1 = 71), F-table was 4.0701. F-observed was 36.8721, exceeding F-table (the F-test was passed).
T-table at a 0.01 level of significance and 74 degrees of freedom was 2.6439. The observed t-Stat for all independent variables exceeded this value modulo, equalling 7.3553 for R&D19, 8.1080 for R&D20, and 3.1120 for Production20. This means that the regression model is significant at the 0.01 level of significance.
The independent variable R&D19 did not demonstrate a positive contribution to the balance of agricultural companies in Russia in 2020 (the regression coefficients acquired a negative value: −79.6784). Therefore, the delayed/long-term effect of R&D was not discovered, although we could see the short-term effect of R&D conducted in 2020.
The p-value for the constant a1 (2671.2945) was 0.1250. Thus, a1 is different from zero. The p-value for the independent variable R&D20 was 1.1 × 10⁻¹¹, while that for the independent variable Production20 was 0.0024; therefore, both factor variables had a statistically significant impact on the balance of agricultural companies in Russia in 2020. This allows us to conclude that the balance of agricultural companies in Russia in 2020 was determined by the following: (1) yield of grain and legumes (weight after processing, in farms of all categories) in 2020, and (2) costs of R&D in agricultural sciences in 2020.
As shown in Table 3, the multiple correlation was 0.2514, and R2 was 0.0632. Therefore, 25.14% of the change in the yield of grain and legumes (weight after processing, in farms of all categories) in 2020 was explained by the change in the costs of agricultural R&D in 2020 and the balanced financial result (profit minus loss) of agricultural companies in 2019. This relatively small value is a sign of lower predictability of the dependent variable Production20 on independent variables (i.e., R&D20, Balance19).
Both factor variables were statistically significant; their p-values were 0.0831 and 0.1437, respectively, both of which were <α (0.15). The obtained value of significance F (0.0953) shows that the considered regression model must be correct at the level of significance α = 0.15. For 75 observations and three factor variables (k1 = 2; k2 = 75 − 2 − 1 = 72), F-table was 1.9480; F-observed was 2.4288, exceeding F-table (the F-test was passed). T-table at the level of significance of 0.15, at 74 degrees of freedom, was 1.4546. The observed t-Stat for all independent variables exceeded this value, equalling 1.7575 for R&D20 and 1.4782 for Balance19. This means that the regression model is reliable at the 0.15 level of significance.
Based on the system of Equation (2), using the SEM method, the authors modelled systemic relationships between the costs of agricultural R&D in 2019–2020 and the production and balanced financial results of agricultural companies in the regions of Russia in 2020 (Figure 5).
The SEM model in Figure 5 reflects the systemic relationships among risks faced by agricultural companies and takes into account the delayed effects of these risks. The model also shows that the spread of all considered indicators was huge in the context of the COVID-19 crisis, increasing the agricultural risks. The key to reducing them is to increase spending on agricultural R&D.
To take into account the specifics of risk management based on innovations and the differences in the risk resilience of agricultural companies, predetermined by the meso-economic environment (i.e., the level and rate of the region’s socioeconomic development), the model (Figure 2) was analysed in the context of the categories of regions designated by the Institute of Scientific Communications (2022) in the dataset “Interactive statistics and intellectual analytics of the balance of the Russian regional economy based on big data and blockchain—2022”. The results obtained are given in Table 4.
The results from Table 4 show that in “parachutist” regions (progressive regions with slow development), R&D’s correlation with the production (0.9915) and balanced financial result of agricultural companies (0.5895) is particularly high. In “turtle” regions, R&D’s correlation with the production (0.6161) and balanced financial result of agricultural companies’ activity is also high (0.5090).
However, in the “rocket” and “racer” regions, the contribution of innovations to risk management is far less visible. This allows us to conclude that innovations increase the risk resilience of agricultural companies only in the case of a stable meso-economic environment. Rapid socioeconomic development of a region reduces the useful effect of innovations for the risk management of agricultural companies.
To take into account the influence of natural and climatic factors on the risk management of agricultural companies with the help of innovations, we analysed the model at the level of federal districts, which are based on geographical factors (Table 5).
The results from Table 5 show that in regions with the most favourable natural and climatic conditions for agriculture and a developed agricultural economy, the contribution of innovations to risk management is most vivid. In regions of the Southern Federal District (SFD), the correlation between R&D and production (0.8206) and between R&D and the balanced financial results of agricultural companies’ activity (0.8062) is very high.
In regions of the North Caucasus Federal District (NCFD), R&D’s correlation with production (0.7575) and the balanced financial result of agricultural companies’ activity (0.8557) is also high. In regions of the Siberian Federal District (SFD), R&D’s correlation with production (0.7428) and the balanced financial result of agricultural companies’ activity is also high (0.6107). In other regions, the useful effect of innovations for the risk management of agricultural companies is moderate or zero.
Thus, the performed detailed analysis of the model reveals two conditions for increasing the risk resilience of agricultural companies through risk management based on innovations: The first condition is a favourable meso-economic environment, i.e., a moderate or low level of regional socioeconomic development. The second condition is favourable natural and climatic conditions for agriculture in the region.

4.3. Development of a Framework for a “Smart” Vertical Farm, the Risks of Which Are Resistant to Crises through the Use of Datasets and Machine Learning

As part of the third task of this study, a “smart” vertical farm framework was developed, the risks of which are resistant to crises through the use of datasets and machine learning. Using the case-study method, the authors considered the practical experience of organising the work of a “smart” vertical farm by the Institute of Scientific Communications (ISC) and the Consortium for Sustainable Development and Technology Leadership (CSDTL) based on datasets and machine learning, reflecting its advantages in the form of increased risk resistance of this farm to crises—in particular, the COVID-19 crisis.
The ISC’s “Smart” vertical farm is a scientific experimental platform. It is located in the Volgograd region of Russia (Southern Federal District). For three years, numerous experiments were carried out in this farm on the cultivation of various species and seeds of plants. The main attention was focused on the cultivation of cucumbers and tomatoes, as the most significant types of agricultural products for the region under consideration.
Numerous experiments have shown that hydroponics is vastly superior to the outdoor and indoor growing of tomatoes and cucumbers. Therefore, the ISC has developed its hydroponic installation “Continuous Flow System”, as well as unique three-component fertilisers for growing plants in hydroponic “Mineral Solution” and the technology for the optimal use of these fertilisers at all stages of plant cultivation. Continuous automated phytomonitoring has been established, which controls the growth and productivity of plants, as well as environmental parameters (air humidity and temperature, watering plants, lighting, etc.), using the author’s “Photon” touch sensors.
Data from phytomonitoring are collected in datasets. Thanks to the use of machine learning technology for the processing and analysis of dataset materials, more and more optimal environmental parameters and plant-care technologies (irrigation, fertilisers, etc.) are constantly being selected. The varieties of tomatoes and cucumbers that take root most successfully and give the greatest yields have already been selected, and multiple year-round yields have also been achieved. The ISC’s “smart” vertical farm is resilient to climate and economic risks and crises through the use of datasets and machine learning.
The implications of the results obtained lie in their demonstrating the unique and leading experience of Russia in the management of production and financial risks to agricultural entrepreneurship in the segment of grain production in the agrarian economy. This allowed us to form a systemic view of these risks, which is particularly useful for managing the production and financial risks of agricultural companies during crises. In particular, the experience of COVID-19 is useful for improving risk management, in the interests of stabilisation of the world grain market in 2022–2023.
The new regional aspect described here allows us to increase the effectiveness of the management of production and financial risks in agriculture, given the climatic, geographical, and socioeconomic features of regions’ development. At the same time, a critical view of the obtained results shows that the unique experience of Russia’s regions cannot be extended to regions of other countries. Hence, this paper sets the basis for subsequent scientific studies of the regional features of agricultural risk management, which should elaborate on the national experience and country specifics.

5. Discussion

This article contributes to the literature through the development of scientific provisions of the theory of risks in agriculture. The article clarifies the essence and nature of the impact of the COVID-19 crisis on the risks faced by agricultural companies (using the example of Russia in 2020), while also outlining the prospects for reducing the risks in agriculture, in support of COVID-19 crisis management. A comparative analysis of the new scientific results obtained in this article with the existing literature is presented in Table 6.
As shown in Table 6, unlike Adhikari and Khanal (2022), Ahmed et al. (2022), Bai and Jia (2022), Bai et al. (2022), Sohail et al. (2022), and Zhang et al. (2022b), we proved that the risks of agriculture are closely interrelated and determined by technological factors. Agricultural R&D makes it possible to systematically manage and reduce the production and financial risks of agricultural companies.
Unlike Nayal et al. (2022) and Pena et al. (2022), we substantiated—using the example of a “smart” vertical farm of ISC—that the contribution of “smart” technologies to reducing risks in agriculture is complex. This contribution lies in the system automation of the production and distribution processes of a “smart” vertical farm based on datasets and machine learning, which are preferable for agricultural risk management compared to artificial intelligence.
Unlike Gascón and Mamani (2022), Kuleh et al. (2022), and Prasad et al. (2022), we proved that changes in the risks of agriculture in the context of the COVID-19 crisis are driven by technology and innovation. Agricultural risks in Russia have increased only in such economic systems and agricultural companies that are too automated, while “smart” technologies make it possible to achieve crisis resilience. Based on this, unlike Howland and Francois Le Coq (2022), Jones and Leibowicz (2022), Ricome and Reynaud (2022), and Wang et al. (2022), we substantiated the need for systematic risk management in agriculture based on “smart” technologies.
The financial and production risks faced by agricultural companies in Russia increased significantly after the end of the acute phase of the pandemic (2021) compared to the acute phase of the pandemic (2020) and, in particular, the pre-pandemic level (in 2018–2019). The growth rate of the yield of grain crops in Russia in 2019 was 8.37%, and it decreased to 7.16% in 2020, before becoming negative in 2021 (−9.12%). The growth of the balanced financial result of agricultural companies in 2018 was 156.20%, and in 2021 it was 57.79%. This was the argument for the scientific substantiation of the existence of the delayed effects of COVID-19 risks in agriculture and the necessity for strategic risk management.
The quick growth (i.e., double—the annual growth of costs of R&D in agricultural sciences in 2019 was 5.35%, growing to 14.88% in 2020) of the innovative activity of agricultural companies in Russia allowed for a significant reduction in the COVID-19 risks. As a result, the connection between innovations and the production (by 46% in 2020 compared to 2019: from 0.13 to 0,19) and financial (by 87% in 2020 compared to 2018: from 0.23 to 0.43) risks of agricultural companies grew significantly. Thus, it is expedient to set innovations on the basis of risk management in agriculture during the pandemic.

6. Conclusions

The main goal of our research was achieved—we studied the Russian experience of change in the production and financial risks faced by agricultural companies during the COVID-19 crisis, proved the significant contribution of innovations to reducing these risks, and discovered the prospects for risk management in agriculture based on innovations to increase crisis resilience of agricultural companies. The article answered RQ1. The analysis of the risks of agriculture in the context of the COVID-19 crisis showed that in Russia in 2020, instead of the expected reduction, there was a general growth.
In Russia, in the context of the COVID-19 crisis, there was a deterioration of agricultural risks—they increased only in certain economic systems. The identified key role of technology and innovation in managing agricultural risks suggests that they increased only in those agricultural companies that are automated, while “smart” technologies make it possible to achieve crisis resistance.
The results of modelling the contribution of “smart” technologies to agricultural risk management during the COVID-19 crisis proved the existence of close systemic links between the costs of agricultural R&D in 2019–2020 and the production (quick effect, manifesting in the same year) and balanced financial results (delayed effect, manifested in one year) of agricultural companies in the regions of Russia in 2020. The developed framework of a “smart” vertical farm proves that in order to increase the resilience of agricultural companies to crises, it is advisable to manage the risks of agriculture using datasets and machine learning.
The theoretical significance of the results obtained lies in the fact that they make it possible to systematically study the changes in the risks of agriculture in the context of the COVID-19 crisis, while outlining the prospects for increasing resilience to crises by optimising the use of “smart” technologies, based on a detailed study of the experience of Russia. With the help of these results, the article presents a new view on the risks of agriculture, from the standpoint of “smart” technologies—which, as proven in this article, are a key risk factor and a way to increase the resilience of agricultural companies to crises.
The practical significance of this article is related to the fact that the authors’ conclusions and applied recommendations on the use of datasets and machine learning by agricultural companies can improve the efficiency of agricultural risk management and ensure successful COVID-19 crisis management by agricultural companies. The case study described in this article—organising the operation of a “smart” vertical farm based on datasets and machine learning—can be useful for agricultural companies in Russia and other countries, and it will also allow for more flexible and systematic management of agricultural risks.
The social implications of this research lie in the fact that the authors’ recommendations provide comprehensive practical implementation of SDG2 (by ensuring food security while reducing production risks) and SDG8 (by supporting the growth of the agricultural economy while increasing agricultural companies’ resilience to crises). The article also provides practical recommendations for the implementation of SDG13 and SDG9 (Sustainable Development Goals) in the activities of agricultural companies while increasing the resilience of agriculture to the adverse effects of climate and the market (crises) through modernisation based on “smart” technologies.
The results of the performed research show the unique experience of the risk management of agricultural companies, the success of which is based—as proven in this paper—on innovations. Nevertheless, it remains unclear whether this successful experience of risk management could be extended to other sectors of the economy—this is a limitation of the results obtained. Further studies should elaborate on the prospects and develop practical recommendations to increase the risk resilience of companies in other sectors of the economy based on innovations.

Author Contributions

Methodology, O.V.S.; Investigation, B.M.L.; Writing—original draft, Z.V.G.; Writing—review & editing, D.D.M. All authors have read and agreed to the published version of the manuscript.

Funding

This research received no external funding.

Data Availability Statement

Not applicable.

Conflicts of Interest

The authors declare no conflict of interest.

Appendix A

Appendix A.1

Table A1. Costs of agricultural R&D in 2019; yield of grain and legumes and balanced financial result of agricultural companies in regions of Russia in 2019–2020.
RegionFederal District *Type of Region **Yield of Grain and Legumes (Weight after Processing, in Farms of All Categories) (Centners per Hectare of Harvested Area)Balanced Financial Result (Profit Minus Loss) of Agricultural Companies (Million RUB)Costs of R&D in Agricultural Sciences (Million RUB)
201820192020202120182019202020212018201920202021
Belgorod RegionCFDP46.148.753.245.235,63432,24239,23959,929275224.0345.6358.9
Bryansk RegionCFDT46.544.950.449.9−89967353404512,4429498.4116.9118.3
Vladimir RegionCFDT21.222.530.222.4714116212011734709.1739.1934.51084.9
Voronezh RegionCFDP32.935.039.130.912,11412,43730,97138,015547.8668.0837.8853.3
Ivanovo RegionCFDT18.720.224.017.15844538950327.558.1114.50
Kaluga RegionCFDT25.129.229.123.0952−3095−2098−8610135.8130.899.8138.7
Kostroma RegionCFDT13.216.216.813.728926530664938.127.638.145.2
Kursk RegionCFDT46.851.556.245.019,76512,88811,60443,296139.7152.3147.7148.2
Lipetsk RegionCFDP39.742.851.336.917,16014,88927,52142,752192.9191.9273.1177.9
Moscow RegionCFDRO27.326.533.027.84335−7623293−11813039.62902.52761.23635.1
Orel RegionCFDT36.741.345.442.34700909119,26224,278164.9258.8336.1353.4
Ryazan RegionCFDT28.632.841.332.02236283057597535264.8243.2251.5296.8
Smolensk RegionCFDT23.925.923.519.917777−28331018.161.456.376.5
Tambov RegionCFDT33.631.844.635.010,654984821,72238,651365.1276.7400.3425.4
Tver RegionCFDT12.317.915.415.425361695−14121217151.7141.7148.9140.3
Tula RegionCFDT32.134.640.635.855730234467739123.530.930.70
Yaroslavl RegionCFDT17.721.219.613.6162220813275188636.640.788.991.6
Republic of KareliaNWFDT0.00.00.00.0163633693203353655.949.732.40
Komi RepublicNWFDRA0.00.00.00.0411349431−7184.581.569.963.4
Arkhangelsk RegionNWFDRA18.717.620.913.261966559425919,03886.383.382.9110.2
Vologda RegionNWFDRA15.923.517.00.0297329172988632460.170.990.4100.2
Kaliningrad RegionNWFDT38.851.852.648.4494353388712942417.617.618.919.7
Leningrad RegionNWFDRO31.337.038.832.953936415578811,14771.379.273.80
Novgorod RegionNWFDT20.129.429.527.3−134853−191−73215.315.915.40
Pskov RegionNWFDT18.236.935.830.2335958634596660030.730.636.936
Republic of AdygeyaSFDT38.443.551.246.4552−4057344763.581.977.681
Republic of KalmykiaSFDT22.923.322.122.622222598−17823.724.023.824
Republic of CrimeaSFDT15.026.616.425.1456131020871524237.4267.6373.1411.7
Krasnodar TerritorySFDP52.956.548.157.527,46426,02240,38759,6701192.41355.81664.72019.6
Astrakhan RegionSFDT27.130.931.237.214126384553105.3144.6125.4144
Volgograd RegionSFDT19.321.325.522.74047404211,13410,903310.7330.3528.2591
Rostov RegionSFDT31.934.134.538.0−4315−98,45852,06431,994547.2639.31001.21010.0
Republic of DaghestanNCFDT25.326.027.327.5264154253631115.8134.1172.6188.3
Republic of IngushetiaNCFDT23.019.823.631.25−54326−63432.133.9340
Kabardino-Balkarian RepublicNCFDT54.154.856.757.6240169147205104115.3124.3148.7
Karachayevo-Chircassian RepublicNCFDT46.450.537.845.44511023477622.20.600
Republic of North Ossetia—AlaniaNCFDT55.465.361.361.3−605182−12937.560.3145.875.7
Chechen Republic NCFDT24.718.225.324.2−5−127−12338975.1142.890.157.2
Stavropol TerritoryNCFDT36.633.726.137.416,49510,094701329,480385.1414.0450.1595
Republic of BashkortostanVFDT18.619.822.014.0−662−4914678749196.876.891.476.9
Republic of Mari ElVFDT18.619.923.614.86762−487261819.419.117.818.9
Republic of MordoviaVFDT26.227.834.023.554344567925716,11821.320.4240
Republic of TatarstanVFDRO24.828.633.514.92090507455665665565.6574.0630.3759
Udmurtian RepublicVFDT18.221.320.215.8271628153345406139.339.944.748
Chuvash RepublicVFDT23.727.032.219.1745−221−622−387624.818.923.80
Perm TerritoryVFDT15.814.715.412.16418182583481.1131.2122.6107.7
Kirov RegionVFDT19.121.721.316.93498271931604464164.3181.1213.7237.3
Nizhny Novgorod RegionVFDT21.222.328.020.796915741981387777.564.068.772.1
Orenburg RegionVFDT8.88.913.58.0−493−54539896233.8230.0180.2255.6
Penza RegionVFDT25.424.838.426.5−15872555946213,34851.350.958.866.1
Samara RegionVFDT17.517.726.117.4177599747998254151.1172.3180.2165.4
Saratov RegionVFDT15.114.723.817.3−363190758466377433.9504.2504637.5
Ulyanovsk RegionVFDT19.819.131.118.0−201−1874791490127.8100.2173186.7
Kurgan RegionUFDT16.216.913.511.1298481878100185.180.780.982.6
Sverldlovsk RegionUFDT19.422.320.916.73578283133524590277.5308.8329.3380
Tyumen RegionUFDRO20.022.419.916.32350320532653526115.1136.6140169.1
Chelyabinsk RegionUFDP13.413.08.69.2352613432612−1739101.771.786.6104.1
Republic of AltaySFDT9.513.915.316.5−46−41−45−227.814.92829.5
Republic of TyvaSFDT13.519.413.612.79−81312.410.711.90
Republic of KhakassiaSFDT12.319.421.019.092−6630333827.823.223.80
Altay TerritorySFDT15.614.612.617.35081445011,68417,823131.6258.7283.3265.6
Krasnoyarsk TerritorySFDT20.523.928.828.416594442769411,445191195.8286.8302.5
Irkutsk RegionSFDRO19.918.720.722.4224219992907521691.778.089.6100.4
Kemerovo RegionSFDT18.720.122.425.8434−33814963208149.3156.0840
Novosibirsk RegionSFDT18.217.217.822.62865385948239274440.6448.5444.6504.9
Omsk RegionSFDT16.715.815.314.72102271830983668227.7265.0420.7643.2
Tomsk RegionSFDT21.621.225.224.4311747393303566852.351.05458.7
Republic of BuryatiaSFDT12.614.114.618.741553842959166.458.854.663.9
Republic of Sakha (Yakutia)FFDRO10.610.410.29.6−23748153102191.8202.8208.3213.9
Trans-Baikal TerritoryFFDRO14.913.113.515.7−18−20−318−470.743.439.940.1
Kamchatka TerritoryFFDRA24.616.125.045.314,63017,75316,35440,02440.842.944.90
Primorye TerritoryFFDT39.139.435.245.4311216,599813935,103170.3168.6208.3221
Khabarovsk TerritoryFFDRA19.317.919.420.0−6371101387514,964154.3154.1176.6203.4
Amur RegionFFDT18.718.121.023.61106181633536375206.7218.3268.4288.2
Jewish Autonomous RegionFFDT17.613.618.916.642119−2−5300.000
* CFD—Central Federal District; NWFD—Northwestern Federal District; SFD—Southern Federal District; NCFD—North Caucasus Federal District; VFD—Volga Federal District; UFD—Ural Federal District; SFD—Siberian Federal District; FFD—Far Eastern Federal District. ** Rockets: leading and quickly developing regions; Racers: regions with a large potential for development; Parachutists: progressive regions with slow development; Turtles: lagging regions. Source: compiled by the authors based on materials from Rosstat (2023).

Appendix A.2

Table A2. List of the main agricultural companies in Russia, and characteristics of their activities.
Ranking Position in 2020 (2019)CompanySpecialisationRevenue in 2020 (Million RUB)Change (%)Net Profit in 2020 (Million RUB)Average Number of Employees (Persons)Registration RegionTrade MarksRegions of Presence
1 (1)Group of companies “Sodruzhestvo”Processing of oil-bearing crops287,00042.08No data2950Kaliningrad regionKaliningrad, Omsk, Amur regions
2 (2)Group of companies “Rusagro”Production of sugar, pork, oil, and fat products; cultivation of agricultural crops158,97115.0524,29719,300MoscowRusskiy Sakhar, Brownie, Chaikofsky, Mon Caf?, Tyopliye Traditsii, Moskovsky Provansal, Ya lublu gotovit, EZHK, Mechta Khosiaiki, Stolichnaya, Schedroye leto, Rossiyanka, Benefitto, Saratovskiy, Zhar-pechka, Milie, Syrnaya kultura, Buterbrodnoe utro, Slovo MyasnikaPresence in 80 regions of Russia
3 (3)Group of companies “Efko”Production of refined vegetable oils and fats145,00018.8518,00017,000Voronezh regionSloboda, AlteroVoronezh, Belgorod, Moscow, Sverdlovsk, Krasnodar regions, CIS countries
4 (5)Agroholding “Miratorg”Livestock and crop production and processing139,24516.8728,05438,277MoscowMiratorg, GurmamaVoronezh, Belgorod, Bryansk, Kursk, Kaliningrad, and Moscow regions, Moscow, St. Petersburg. Export to 30 countries of the world
5 (4)Group “Cherkizovo”Breeding of pigs and poultry, processing and production of meat products and animal feed128,8037.2415,14531,100MoscowCherkizovo, Petelinka Kurinoe Tsartvo, PAVA-PAVA, Cherkizovo Premium, Domashnya Kurochka, Mosselprom Dajajti, Imperiya Vkusa, Myasnaya Gubernia, PIT product, Latifa, Fileya, Samson Family dinner, Grilmania, Samson, Altai BroilerBryansk, Lipetsk, Kaliningrad, Kursk, Moscow, Orel, Penza, Rostov, Samara, Tambov, Tula, Ulyanovsk regions, St. Petersburg, Moscow
6 (10)JSC “Aston Foods and Food Ingredients”Production of foodstuffs, oils, grains, and food ingredients115,76873.3544841921Rostov regionAston, Zateya, Volshebniy Krai, SvetlitsaRostov and Ryazan regions
7 (6)Group of companies “Danone”Production of milk, milk drinks, juices, water, and other food products110,7421.159032800MoscowActivia, Actimel, Actual’, Alpro, Bebelac, Bio Balance, Danissimo, Danone, Prostokvashino, Petmol, Rastishka, Tyoma, Frendiki, Nutrilon, MalyutkaVladimir, Vologda, Kurgan, Lipetsk, Samara, Sverdlovsk, Tyumen regions, the Republics of Tatarstan and Mordovia, Krasnodar, Krasnoyarsk regions, Moscow, St. Petersburg
8 (13)Group of companies “Agropromkomplektatsiya”*Crop production, animal husbandry, and feed production99,22425.85No data10,000Tver regionBlizhnie Gorki, Dmitrogorsky produkt, Iskrenne Vash, Provence BakeryRyazan, Tver, Kursk, Moscow regions, Moscow
9 (7)JSC WBD
(PepsiCo)
Beverage and food production98,982−1.3130769455MoscowLove Juice, Domik v Derevne, Agousha, Chudo, Imunele, J7, Mazhitel, Veselyi Molochnik, Kuban Burenka, Rodniki Rossii, 100% Gold, Frugurt, Chudo YagodaMoscow, Krasnodar, Volgograd, Voronezh, Irkutsk, Kirov, Samara, Saratov, Sverdlovsk Tyumen regions, the Republic of Tatarstan, and other regions
10 (8)Ltd “Cargill”, Ltd. “Provimi”Production of starch and starch products; production of sugars and sugar syrups; animal feed97,49319.9919501625Tula regionVoronezh, Moscow, Rostov, Tula, Krasnodar regions, Moscow
11 (11)GAP “Resource”Production of food products from poultry meat; cultivation of grain and oilseed crops81,76533.53No data19,000MoscowBlagoyar, Nasha Ptichka, URUSSA, An-NoorStavropol and Krasnodar, Rostov, Tambov, and Orenburg regions, the Republics of Adygea, Kabardino-Balkaria, and Karachay-Cherkessia
12 (9)Group of companies “Agro-Belogorye”*Animal husbandry, meat processing, plant growing, and fodder production68,426−13No data10,000Belgorod regionDalnie Dali, Grill Menu Myasnoe ZastolieBelgorod region
13 (12)“Norebo Holding”Fishing and seafood65,9459No data3000Murmansk regionBorealis, SeroglazkaLeningrad, Moscow, Murmansk, Kamchatka regions, St. Petersburg
14 (14)“Velikoluksky agro-industrial holding”*Breeding and rearing of stock of pigs; meat processing61,6327No data14,500Pskov regionVelikoluksky MyasokombinatRepublic of Karelia, Astrakhan, Bryansk, Vologda, Volgograd, Kaliningrad, Leningrad, Moscow, Novgorod, Pskov, Rostov, Ryazan, Smolensk, Tver regions, St. Petersburg
15 (26)Group of companies “Yug Rusi”Production of vegetable oils, mayonnaises and sauces, flour, and canned food60,58817.9919714,600Rostov regionZolotaya Semechka, Avedov, Zlato, Milora, YUG RUSI Ryzhikovoe, Sto Retseptov, Anninskoye, Razdolye, Provençal, Vkusnaya Pochta, Krasnodarskiy, Healthy nutritionRostov, Voronezh, Volgograd, Krasnodar regions
16 (15)Firm “Agrocomplex named after N. I. Tkachev”*Crop production combined with animal husbandry (mixed agriculture)57,2787.67267321,235Krasnodar regionAgrocomplex, Nikolaevskie Syrovarni, Ptitsa Kubani, Mramornaya Govyadina Krasnodar region
17 (17)Agroholding “KOMOS Group”*Pig breeding, poultry farming, meat and milk processing, and feed production52,3455.32142713,600Udmurt RepublicSelo Zelenoye, Molochnaya Rechka, Kezskiy Syrzavod, Glazovptica, Kungur Myasokombinat, Toptyzhka, Vostoc, Platoshino, Dobromyasov, Angelato, Villa Romana, Fitness time, Minions, Immunolact, Varvara Krasa, Danar, Izhmoloko, Suharev-moloko, Dlya Vsei Semyi, To be, Izhevskoye, Sozvezdie, GOST, Favorit, Udmurtryiba, Rybatskie BaikiUdmurt Republic, Perm region, Republic of Bashkortostan, Republic of Tatarstan
18 (16)Agro-industrial holding
“BEZRK-Belgrankorm”
Animal husbandry combined with crop production; production of poultry, pork, beef, and sausages50,5480.7651225597Belgorod regionYasnie Zori, Utka YasnozorenskayaBelgorod, Novgorod regions
19 (18)LTD “Prodimex”Production of sugar, grain, and sunflower seeds48,5797.6728517,000MoscowRepublic of Bashkortostan, Belgorod, Voronezh Kursk, Penza regions,
20 (23)JSK “Agrosila”*Cultivation of grain, technical and fodder crops, production of feed and oils, livestock production, poultry farming, and purchase46,500216008700Republic of TatarstanZainskiy Sahar, Chelny-broiler, Prosto moloko, Vkysnie traditsii, Sochnaya Gamma, Delicur, Chicken hanRepublic of Tatarstan, Republic of Bashkortostan, Yekaterinburg
21 (23)IPC “Atyashevo”*Production of sausage products and meat delicacies45,67781No data4721Republic of MordoviaAtyashevo, DauriyaRepublic of Mordovia, Ulyanovsk region
22 (33)Group of companies ASTProduction, storage, and processing of cereals; horticulture44,67697.9859No dataMoscowKaluga, Lipetsk, Moscow, Volgograd, Saratov, Voronezh, Altai, and Krasnodar regions, Chechen Republic
23 (22)JSC NMGKProduction of margarine and foodstuffs44,62026.388393790Nizhny Novgorod regionRyaba, Sdobri, Nezhny, Astoria, Khozyayushka, Slivochnik, Toplenaya, Stepanovna, Kremlevskoe, Postnoye, Slivochnik, Delicato, Retsepty chistoty, Moy malysh, Mylo Suvenirnoye, Vanda, Monpari Provence, Dushistoye oblako, Glitserinovoye, Svetloyar, Podsolnechnoye, Originalnoye, UNIPAVNizhny Novgorod, Samara, Orenburg, Uryupinsk, Sorochinsk, Volgograd, Orenburg, Samara, and Saratov regions, Republic of Bashkortostan
24 (19)OJSC “Ostankino Meat Processing Plant”Pig breeding; production of meat processing products and semi-finished products44,3456.1912274103MoscowPapa mozhet, Ostankino, Slivochnye, Sosiska ruMoscow and Moscow region, Smolensk region
25 (31)“Econiva—AIC Holding”*Animal husbandry combined with crop production39,84034.7920512,049Voronezh regionEconivaVoronezh, Kursk, Novosibirsk, Kaluga, Ryazan, Moscow, Tyumen, Orenburg, Leningrad, Samara, Altai regions, Republics of Tatarstan and Bashkortostan
26 (21)“PRODO” GroupPoultry farming, pig breeding and processing, and grain production38,0000No data12,000MoscowTroekurovo, Klinsky, Omsky bacon, Rokoko, Nasha Ryaba, Rosa na trave, Yasnaya gorka, Umka, Chukchum, Cherny Kaban, Khalif, UMKK, Yarkoe utro, Nazionalny standart, Permsky myasokombinatKaluga, Moscow, Novosibirsk, Omsk, Tyumen, Perm regions, Republic of Bashkortostan
27 (20)JSK “PRIOSKOLE”Poultry farming35,952−7.2155916,000Belgorod regionPrioskole, Al Safa, Coco Pullet, Fly de lunch, Slavnaya marka, Odnazhdy v derevne, Kurinye delicatesy, Kolbasnye delicatesyBelgorod region
28 (30)JSK “Sibagro”Agriculture, pig breeding, and food production34,07121.0977699015Tomsk regionSibagro, Myasnaya temaTomsk, Sverdlovsk, Kemerovo, Tyumen regions,
29 (—)Group of companies “Concern Pokrovsky”Sugar production; meat processing34,00031.255007900Rostov regionKanevskoy, Solntsem SogretyKrasnodar, Stavropol, Astrakhan, Volgograd, Nizhny Novgorod, Rostov regions, Chechen Republic
30 (29)Agro-holding “Horoshee Delo” Sphere group*Production and processing of agricultural products33,57933.5412686500Republic of MordoviaHoroshee deloRepublic of Mordovia, Ulyanovsk region
31 (25)Agro-holding “Steppe” with PJSFC “Sistema”Crop production, dairy farming, intensive horticulture, and trading of agricultural products32,80015.239006150Rostov regionSteppeKrasnodar, Stavropol, Rostov regions
32 (38)Group of companies “Renna”*Production of canned milk, whole milk products, and ice cream from natural cream32,600131705000MoscowKorovka iz Korenovki, Alekseevskoe, Oblaka iz moloka, Ruslada, Gustiyar, Korenovskoe, Risovashka, Milkimony, Chizby, Kubanskie tvorozhnikiKrasnodar region
33 (32)LLC “Blago”Vegetable oil production30,10028.2No dataNo dataSt. PetersburgAlmador, Freya, Blago PRO, Dary KubaniAltai, Krasnodar, Voronezh, Omsk regions
34 (35)JSC “Molvest”Dairy product production28,70012.52865000Voronezh regionVkusnoteevo, Molvest, Fruate, Nezhny vozrast, Ivan Poddybny, Vilzhskie prostory, Kubanskiy hutorok, FelicitaMoscow, St. Petersburg, Volgograd, Kursk, Lipetsk, Rostov, Samara, Saratov, Ulyanovsk, Krasnodar regions, Republic of Crimea
35 (27)Group of companies “Damate”Agricultural production (cultivation and processing of turkey; production and processing of milk)26,3900.34No data9000Penza regionIndilite, Ozerka, MolkomPenza, Tyumen, Rostov, Stavropol regions
36 (24)Agro-holding “Kopitaniya”*Agro-industrial holding of a full cycle, from crop production to the production and sale of meat products25,700−18.24No data4000MoscowLavla, Ilovliskie tsyplyata, ZMKMoscow, Tver, Saratov, and Volgograd regions
37 (37)Holding “Avangard-agro”Agricultural production23,14611.9118744700MoscowAvangard-agroVoronezh, Orel, Kursk, Tula, Lipetsk, Belgorod regions, Moscow
38 (36)JSFEC “Exima”Meat processing and preservation23,11011.3324506500MoscowMikoyan, Okhotny ryad, Pivchiki, Snexi, Russkiy fermerMoscow, Moscow, Kaluga, Vladimir regions
39 (28)JSC “Russian Fish Company”Catch and sale of fish and seafood23,000−7.948122000MoscowRussian Fish CompanySt. Petersburg, Murmansk, Arkhangelsk regions, Primorsky krai
40 (—)Group of companies “Foodland”Dairy production22,43010No data2000MoscowRadost vkusa, VardeVaal, Excelsior, Lvinoe serdtse, Korol’ severa,
GoldenGot, Veselyy Rodzher, Dontaler, Lyubimyy khutorok, Monarkh, Produkty is Elani, HeidiHeidi, La Paulina, Lattesso, Mlekara, Shabats, Ricrem, Meggle, Bonfesto, CooKing, Rama, Pyshka, Mamontovskaya syrovarnya, Basni o syre, Novogrudskie dary, Syrnaya volost, Savushkin product
Volgograd, Saratov regions
41 (44) JSC “Makfa”Production of flour from grain, vegetable crops, and ready-made flour mixtures and dough for baking20,80216.4723002000MoscowMakfa, Smak, Grand di Pasta, Grand di Oliva, Mishkinskiy ProductSverdlovsk, Chelyabinsk, Kurgan regions, Altai, Stavropol regions
42 (—)Group of companies “Agroeco”Crop production, feed production, animal husbandry, and meat processing20,76942.239133614Voronezh regionAgroecoVoronezh, Tula regions
43 (40)LLC Poultry Farm “Akashevskaya”Poultry breeding and processing20,7242.2219915822Mari El RepublicAkashevo, Tsarevoslobodskie kolbasy, Prostomyasovo, Znatny perekus, Akashevskaya Mari El Republic
44 (39)Poultry farm “Severnaya”Poultry farming20,104−2.7120351400Leningrad regionSevernayaLeningrad region
45 (46)Group of companies “Yanta” (main assets—Irkutsk oil and fat plant, Angarsk poultry farm)*Production of high-quality food products, raw materials for the food and processing industry, and agricultural feed20,07015.34No dataNo dataIrkutsk regionBaikalskoe, Vilkin, Salatny provence, Favorite cup, Standart professionalnoy kucshni, Lugovoe, Angarskaya kurochkaPrimorsky Krai, Irkutsk, Amur regions
46 (42)Agro-holding “Trio”*Sugar production, dairy farming, and crop production19,4595.3No dataNo dataLipetsk regionNo dataLipetsk region
47 (41)“Aladushkin Group”*Production of flour from cereals, vegetable crops, and ready-made flour mixtures and dough for baking; cereals, granules, and other products from cereals; production of prepared feed18,099−3.33No data950St. PetersburgYasno solnyshko, Muka predportovaya, Kudesnitsa, Aladushkin, Hleburg, FarmerGood, Gornitsa St. Petersburg, Leningrad, Samara, Tyumen regions
48 (43)“Okeanrybflot”Fishing and seafood17,382−5.0827412331Kamchatka kraiOkeanrybflotMoscow, St. Petersburg, Astrakhan, Murmansk regions, Kamchatka, Primorsky krai
49 (—)Holding company “Ak Bars”*Animal husbandry, crop production, poultry farming, and grain processing; production of milk, eggs, sugar, and bakery products16,85922.48No data10,000Republic of TatarstanTsyplenok pod solntsem, Gosudarev, Ambar, Pestrechinka, Kuriny gurman, Kyrinye istorii, Ak BarsRepublic of Tatarstan, Chuvashia
50 (—)Agro-holding “Zvenigov”Animal husbandry and crop production; processing16,3449.446402675Mari El RepublicZvenigovMari El Republic
-Total-2,828,18216.7153,569408,380---
Source: Compiled by the authors based on Expert (2022).

References

  1. Adhikari, Sudip, and Aditya Khanal. 2022. Business risk, financial risk and savings: Does perceived higher business risk induce savings among small agricultural operations in the USA? Agricultural Finance Review 83: 107–23. [Google Scholar] [CrossRef]
  2. Ahmed, Zobaer, Aaron M. Shew, Manoranjan K. Mondal, Sudhir Yadav, S. V. Krishna Jagadish, P. V. Vara Prasad, Marie-Charlotte Buisson, Mahanambrota Das, and Mustafa Bakuluzzaman. 2022. Climate risk perceptions and perceived yield loss increases agricultural technology adoption in the polder areas of Bangladesh. Journal of Rural Studies 94: 274–86. [Google Scholar] [CrossRef]
  3. Bai, Shizhen, and Xuelian Jia. 2022. Agricultural Supply Chain Financing Strategies under the Impact of Risk Attitudes. Sustainability 14: 8787. [Google Scholar] [CrossRef]
  4. Bai, Ssi-zhen, Yong-gan Wang, Sheng-hua Zheng, and Shao-juan Huang. 2022. Green investment mechanism of agricultural supply chain considering risk aversion and bargaining power. Kongzhi yu Juece/Control and Decision 37: 1862–72. [Google Scholar] [CrossRef]
  5. Bene, Szabolcs, Péter Polgár, Márton Szűcs, Judit Márton, Eszter Szabó, and Ferenc Szabó. 2021. Environmental effects, population genetic parameters, breeding value, phenotypic and genetic trend for age at first calving of limousin cows. Journal of Central European Agriculture 22: 240–49. [Google Scholar] [CrossRef]
  6. Capitanio, Fabian. 2022. Risk, uncertainty, crises management and public intervention in agriculture. Italian Review of Agricultural Economics 77: 3–14. [Google Scholar] [CrossRef]
  7. Crăciun, Andreea-Florentina, Alexandra-Mădălina Țăran, Gratiela Georgiana Noja, Marlien Gabriel Pirtea, and Raluca-Ioanna Răcătăian. 2023. Advanced Modelling of the Interplay between Public Governance and Digital Transformation: New Empirical Evidence from Structural Equation Modelling and Gaussian and Mixed-Markov Graphical Models. Mathematics 11: 1168. [Google Scholar] [CrossRef]
  8. Dorczak, Roman, Marzanna Farnicka, and Inetta Nowosad. 2021. Dilemmas in managing the COVID-19 crisis. Risks 9: 80. [Google Scholar] [CrossRef]
  9. Expert. 2022. Rating of the Largest Agricultural Companies in Russia. Available online: https://expert.ru/expert/2021/48/spetsdoklad/44/ (accessed on 1 April 2022).
  10. Franken, Jason, Michael Cook, and Joost Pennings. 2022. Producer risk aversion and participation in agricultural cooperatives. Journal of Co-operative Organization and Management 10: 100171. [Google Scholar] [CrossRef]
  11. Gascón, Jordi, and Kevin Mamani. 2022. Community-based tourism, peasant agriculture and resilience in the face of COVID-19 in Peru. Journal of Agrarian Change 22: 362–77. [Google Scholar] [CrossRef]
  12. Howland, Fanny, and Jean Francois Le Coq. 2022. Disaster risk management, or adaptation to climate change? The elaboration of climate policies related to agriculture in Colombia. Geoforum 131: 163–72. [Google Scholar] [CrossRef]
  13. Inshakova, Agnessa, Anastasia Sozinova, and Tatiana Litvinova. 2021. Corporate fight against the COVID-19 risks based on technologies of industry 4.0 as a new direction of social responsibility. Risks 9: 212. [Google Scholar] [CrossRef]
  14. Institute of Scientific Communications. 2022. Dataset “Interactive Statistics and Intellectual Analytics of the Balance of the Russian Regional Economy Based of Big Data and Blockchain—2022”. Available online: https://datasets-isc.ru/data2/data-set-po-regionalnoj-ekonomike-rossii (accessed on 13 December 2022).
  15. International Monetary Fund. 2022. World Economic Outlook Database, October 2021. Available online: https://www.imf.org/en/Publications/WEO/weo-database/2021/October (accessed on 1 April 2022).
  16. Jones, Erick, Jr., and Benjamin Leibowicz. 2022. Climate risk management in agriculture using alternative electricity and water resources: A stochastic programming framework. Environment Systems and Decisions 42: 117–35. [Google Scholar] [CrossRef]
  17. Kakraliya, S. K., H. S. Jat, Ishwar Singh, M. K. Gora, Manish Kakraliya, Deepak Bijarniya, P. C. Sharma, and M. L. Jat. 2022. Energy and economic efficiency of climate-smart agriculture practices in a rice–wheat cropping system of India. Scientific Reports 12: 8731. [Google Scholar] [CrossRef] [PubMed]
  18. Kuleh, Yohanes, Zainal Ilmi, and M. Amin Kadafi. 2022. The Intensity of Agriculture in the COVID-19 from Indonesia—A Systematic Literature Review. Journal of Agriculture and Crops 8: 94–104. [Google Scholar] [CrossRef]
  19. Litvinova, Tatiana. 2022. Risks of Entrepreneurship amid the COVID-19 Crisis. Risks 10: 163. [Google Scholar] [CrossRef]
  20. Liu, Xuan. 2022. Calibration of agricultural risk programming models using positive mathematical programming: A reply. Australian Journal of Agricultural and Resource Economics 66: 729–30. [Google Scholar] [CrossRef]
  21. Luu, The Anh, An Thinh Nguyen, Quoc Anh Trinh, Van Tuan Pham, Ba Bien Le, Duc Thanh Nguyen, Quoc Nam Hoang, Ha T. T. Pham, The Kien Nguyen, Van Nang Luu, and et al. 2019. Farmers’ intention to climate change adaptation in agriculture in the Red River Delta Biosphere Reserve (Vietnam): A combination of Structural Equation Modeling (SEM) and Protection Motivation Theory (PMT). Sustainability 11: 2993. [Google Scholar] [CrossRef]
  22. Manian, Muhammad ali, Korous Khoshbakht, Hossein Mahmoudi, and Houman Liaghati. 2022. Dynamic Conservation in Risk Society: A Case Study of COVID-19 Pandemic Risk in Kashan Qanat Irrigated Agriculture. Frontiers in Public Health 10: 882–943. [Google Scholar] [CrossRef]
  23. Marcoulides, Katerina M., and Ke-Hai Yuan. 2016. New Ways to Evaluate Goodness of Fit: A Note on Using Equivalence Testing to Assess Structural Equation Models. Structural Equation Modeling A Multidisciplinary Journal 24: 1–6. [Google Scholar] [CrossRef]
  24. Melekhova, Kseniya A., Xenia G. Yankovskaya, and Alevtina G. Demidova. 2022. Potential and Opportunities of Organic Agriculture in Russia. In Environmental Footprints and Eco-Design of Products and Processes. Singapore: Springer, pp. 75–82. [Google Scholar] [CrossRef]
  25. Menaga, A., and S. Vasantha. 2022. Smart Sustainable Agriculture Using Machine Learning and AI: A Review. Lecture Notes in Networks and Systems 356: 447–58. [Google Scholar] [CrossRef]
  26. National Research University “Higher School of Economics”. 2022. Digital Economy: A Brief Statistical Collection. Available online: https://issek.hse.ru/news/551331807.html (accessed on 1 April 2022).
  27. Nayal, Kirti, Rakesh Raut, Pragati Priyadarshinee, Balkrishna Eknath Narkhede, Yigit Kazancoglu, and Vaibhav Narwan. 2022. Exploring the role of artificial intelligence in managing agricultural supply chain risk to counter the impacts of the COVID-19 pandemic. International Journal of Logistics Management 33: 744–72. [Google Scholar] [CrossRef]
  28. Panagiotou, Dimitrios, and Alkistis Tseriki. 2022. Directional predictability between trading volume and price returns in the agricultural futures markets: Risk implications for traders. Journal of Risk Finance 23: 264–88. [Google Scholar] [CrossRef]
  29. Park, Sang-June, and Youjae Yi. 2023. Assessing moderation effects with a heterogeneous moderated regression analysis. Quality and Quantity 57: 701–19. [Google Scholar] [CrossRef]
  30. Pena, Alejandro, Juan C. Tejada, Juan David Gonzalez-Ruiz, and Mario Gongora. 2022. Deep Learning to Improve the Sustainability of Agricultural Crops Affected by Phytosanitary Events: A Financial-Risk Approach. Sustainability 14: 6668. [Google Scholar] [CrossRef]
  31. Pimentel, João, Paulo J. Azevedo, and Luis Torgo. 2023. Subgroup mining for performance analysis of regression models. Expert Systems 40: e13118. [Google Scholar] [CrossRef]
  32. Polukhin, Andrey A., and Veronika I. Panarina. 2022. Financial Risk Management for Sustainable Agricultural Development Based on Corporate Social Responsibility in the Interests of Food Security. Risks 10: 17. [Google Scholar] [CrossRef]
  33. Popkova, Elena Gennadievna. 2022. Vertical Farms as a Promising Direction for the Development of Sustainable Agriculture. In Environmental Footprints and Eco-Design of Products and Processes. Singapore: Springer, pp. 273–78. [Google Scholar] [CrossRef]
  34. Popkova, Elena Gennadievna, Anastasia A. Sozinova, and Elena V. Sofiina. 2022. Model of Agriculture 4.0 Based on Deep Learning: Empirical Experience, Current Problems and Applied Solutions. Smart Innovation, Systems and Technologies 264: 333–46. [Google Scholar] [CrossRef]
  35. Prasad, M. V., T. Madhuridevi, K. Rajesh, S. S. N. M. Mahesh, K. Srikanth, M. Siva, and R. K. Mathur. 2022. Perception of farmers on the impact of lockdown due to COVID-19 on agriculture and oil palm cultivation in the state of Andhra Pradesh, India. Journal of Plantation Crops 50: 20–25. [Google Scholar] [CrossRef]
  36. Qureshi, Mohamed Rafik Noor Mohamed, Ali Saeed Almuflih, Janpriy Sharma, Mohit Tyagi, Shubhendu Singh, and Naif Almakayeel. 2022. Assessment of the Climate-Smart Agriculture Interventions towards the Avenues of Sustainable Production–Consumption. Sustainability 14: 8410. [Google Scholar] [CrossRef]
  37. Rani, S. V. Jansi, P. Senthil Kumar, R. Priyadharsini, S. Jahnavi Srividya, and S. Harshana. 2022. Automated weed detection system in smart farming for developing sustainable agriculture. International Journal of Environmental Science and Technology 19: 9083–94. [Google Scholar] [CrossRef]
  38. Ricome, Aymeric, and Arnaud Reynaud. 2022. Marketing contract choices in agriculture: The role of price expectation and price risk management. Agricultural Economics 53: 170–86. [Google Scholar] [CrossRef]
  39. Rosstat (Federal State Statistics Service). 2023. Regions of Russia. Socio-Economic Indicators—Statistical Collections for 2020, 2021 and 2022. Available online: https://rosstat.gov.ru/folder/210/document/13204 (accessed on 1 March 2023).
  40. Sánchez, Marco V., Martin Cicowiez, and Araceli Ortega. 2022. Prioritizing public investment in agriculture for post-COVID-19 recovery: A sectoral ranking for Mexico. Food Policy 109: 102251. [Google Scholar] [CrossRef]
  41. Singh, Paramjit Singh Jamir, Ayodeji Emmanuel Oke, Ahmed Farouk Kineber, Oludolapo Ibrahim Olanrewaju, Olayinka Omole, Mohamad Shaharudin Samsurijan, and Rosfaraliza Azura Ramli. 2023. A Mathematical Analysis of 4IR Innovation Barriers in Developmental Social Work—A Structural Equation Modeling Approach. Mathematics 11: 1003. [Google Scholar] [CrossRef]
  42. Sohail, Muhammad Tayyab, and Shaoming Chen. 2022. A systematic PLS-SEM approach on assessment of indigenous knowledge in adapting to floods; A way forward to sustainable agriculture. Frontiers in Plant Science 13: 990785. [Google Scholar] [CrossRef]
  43. Sohail, Muhammad Tayyab, Sohaib Mustafa, Mazurina Mohd Ali, and Sidra Riaz. 2022. Agricultural Communities’ Risk Assessment and the Effects of Climate Change: A Pathway Toward Green Productivity and Sustainable Development. Frontiers in Environmental Science 10: 948016. [Google Scholar] [CrossRef]
  44. Štreimikienė, Dalia, Tomas Baležentis, Artiom Volkov, Erika Ribašauskienė, Mangirdas Morkūnas, and Agnė Žičkienė. 2022. Negative effects of COVID-19 pandemic on agriculture: Systematic literature review in the frameworks of vulnerability, resilience and risks involved. Economic Research-Ekonomska Istrazivanja 35: 529–45. [Google Scholar] [CrossRef]
  45. Sun, Qingru, Meiyi Hou, Shuaiwei Shi, Liwei Cui, and Zenglei Xi. 2022. The Influence of Country Risks on the International Agricultural Trade Patterns Based on Network Analysis and Panel Data Method. Agriculture 12: 361. [Google Scholar] [CrossRef]
  46. Sureiman, Onchiri, and Callen Moraa Mangera. 2020. F-test of overall significance in regression analysis simplified. Journal of the Practice of Cardiovascular Sciences 6: 116–22. [Google Scholar] [CrossRef]
  47. Syafriana, Tamara Rezti, Ni Wayan Surya Solimun Wardhani, Atiek Iriany, and Adji Achmad Rinaldo Fernandes. 2023. Development of Nonparametric Structural Equation Modeling on Simulation Data Using Exponential Functions. Mathematics and Statistics 11: 1–12. [Google Scholar] [CrossRef]
  48. Tong, Qingmeng, Brent Swallow, Lu Zhang, and Junbiao Zhang. 2019. The roles of risk aversion and climate-smart agriculture in climate risk management: Evidence from rice production in the Jianghan Plain, China. Climate Risk Management 26: 100199. [Google Scholar] [CrossRef]
  49. Tseytlin, Evgeniy Michailovich, and Angelina Alekseevna Grebneva. 2022. On the advantages and disadvantages of the extrapolation method and of correlation and regression analysis for predicting the volume of waste generation of enterprises of the mineral resource complex. Mining Informational and Analytical Bulletin 11: 80–94. [Google Scholar] [CrossRef]
  50. Van Lenthe, Frank J., Tessa Jansen, and Carlin B. M. Kamphuis. 2015. Understanding socio-economic inequalities in food choice behaviour: Can Maslow’s pyramid help? British Journal of Nutrition 113: 1139–47. [Google Scholar] [CrossRef] [PubMed]
  51. Wang, Youzhi, Xinwei Guo, Fan Zhang, Huijuan Yin, Ping Guo, Wenge Zhang, and Qiangkun Li. 2022. The spatially-distributed ANN-optimization approach for water-agriculture-ecology nexus management under uncertainties and risks. Agricultural Water Management 271: 107–780. [Google Scholar] [CrossRef]
  52. Wegren, Stephen K. 2021. Prospects for Sustainable Agriculture in Russia. European Countryside 13: 193–207. [Google Scholar] [CrossRef]
  53. Welsh, Jonathon Michael, Andrea S. Taschetto, and James P. Quinn. 2022. Climate and agricultural risk: Assessing the impacts of major climate drivers on Australian cotton production. European Journal of Agronomy 140: 126–604. [Google Scholar] [CrossRef]
  54. World Bank. 2022. World Development Indicators: Structure of Output. Available online: http://wdi.worldbank.org/table/4.2 (accessed on 1 April 2022).
  55. Yang, Jiachen, Guipeng Lan, Yang Li, Yicheng Gong, Zhuo Zhang, and Sezai Ercisli. 2022b. Data quality assessment and analysis for pest identification in smart agriculture. Computers and Electrical Engineering 103: 108322. [Google Scholar] [CrossRef]
  56. Yang, Jiachen, Xiaolan Guo, Yang Li, Francesco Marinello, Sezai Ercisli, and Zhuo Zhang. 2022a. A survey of few-shot learning in smart agriculture: Developments, applications, and challenges. Plant Methods 18: 28. [Google Scholar] [CrossRef]
  57. Yankovskaya, Veronika V., Timur A. Mustafin, Dmitry A. Endovitsky, and Artem V. Krivosheev. 2022. Corporate Social Responsibility as an Alternative Approach to Financial Risk Management: Advantages for Sustainable Development. Risks 10: 106. [Google Scholar] [CrossRef]
  58. Yelikbayev, Kuanysh, and Inna Andronova. 2022. The Interaction of the EEU Member States and Risks of Their Mutual Trade during the COVID-19 Pandemic: Implications for the Management of Corporate Social Responsibility. Risks 10: 27. [Google Scholar] [CrossRef]
  59. Yu, Xi, Florian Schuberth, and Jörg Henseler. 2023. Specifying composites in structural equation modeling: A refinement of the Henseler–Ogasawara specification. Statistical Analysis and Data Mining 1: 1–10. [Google Scholar] [CrossRef]
  60. Yuan, Ke-Hai, Yong Wen, and Jiashan Tang. 2023. Sensitivity Analysis of the Weights of the Composites Under Partial Least-Squares Approach to Structural Equation Modeling. Structural Equation Modeling 30: 53–69. [Google Scholar] [CrossRef]
  61. Zhang, Junlong, Yongping Li, Li You, Guohe Huang, Xiaomei Xu, and Xiaoya Wang. 2022a. Optimizing effluent trading and risk management schemes considering dual risk aversion for an agricultural watershed. Agricultural Water Management 269: 107716. [Google Scholar] [CrossRef]
  62. Zhang, Weijia, Jie Huang, Tianyuan Zhang, and Qian Tan. 2022b. A risk-based stochastic model for supporting resources allocation of agricultural water-energy-food system under uncertainty. Journal of Hydrology 610: 127864. [Google Scholar] [CrossRef]
Figure 1. Arithmetic mean of agricultural risks during the COVID-19 crisis in Russia in 2018–2021. Source: developed and compiled by the authors.
Risks 11 00092 g001
Figure 2. Analysis of variance of agricultural risks during the COVID-19 crisis in Russia in 2018–2021. Source: developed and compiled by the authors.
Risks 11 00092 g002
Figure 3. Trend analysis of agricultural risks during the COVID-19 crisis in Russia in 2018–2021. Source: developed and compiled by the authors.
Risks 11 00092 g003
Figure 4. Correlation analysis of the connections between the risks to agriculture and innovations in Russia in 2018–2021. Source: developed and created by the authors.
Risks 11 00092 g004
Figure 5. SEM model of systemic relationships of agricultural R&D costs in 2019–2020 with production and net financial results of agricultural companies in Russian regions in 2020. Source: developed and compiled by the authors.
Risks 11 00092 g005
Table 1. Structural and logical scheme of the study.
Research QuestionResearch ObjectiveResearch MethodEssence of the Research
RQ1: How have the risks of agriculture changed during the COVID-19 crisis?Risk analysis of agriculture during the COVID-19 crisisHorizontal analysis methodAnalysis of changes in the volume of production and the net financial results of agricultural companies in the regions of Russia in 2020 compared to 2019
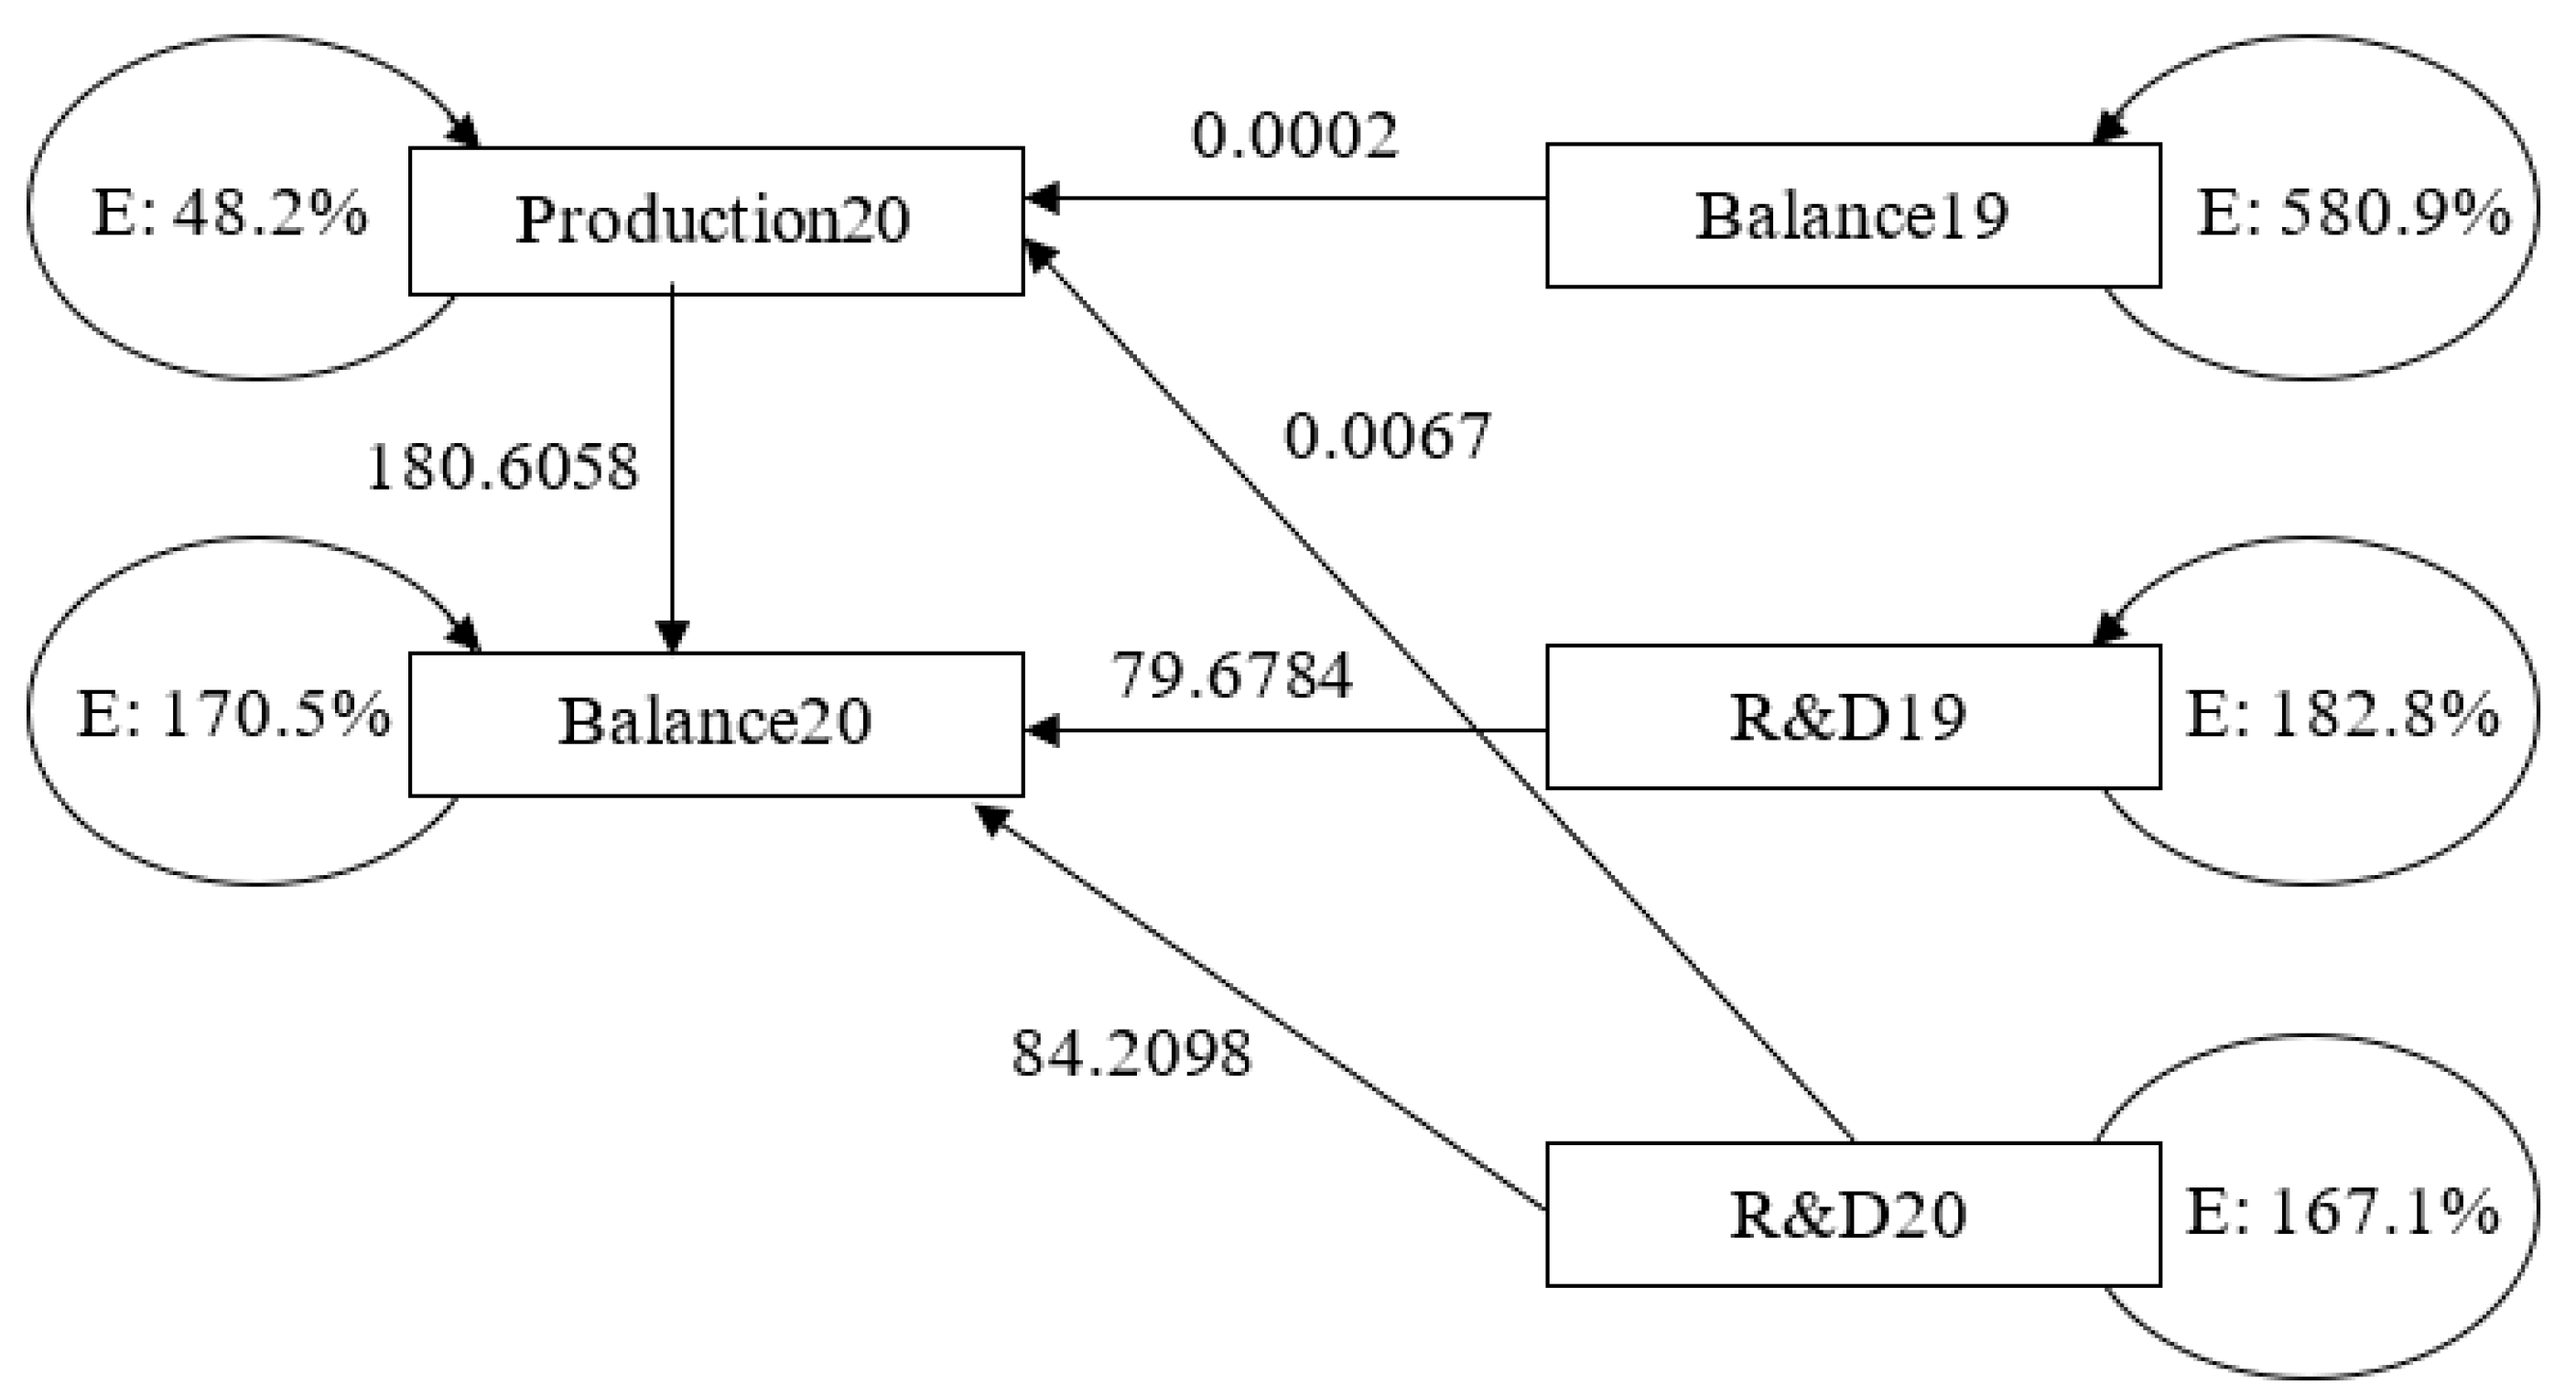
RQ2: Do innovations facilitate better management of agricultural risks, to increase resilience to the risks of a crisis?Modelling the contribution of smart technologies to agricultural risk management during the COVID-19 crisisStructural equation modelling (SEM) methodModelling systemic links between the costs of agricultural R&D in 2019 and the production and balanced financial results of agricultural companies in Russian regions in 2020
Development of a framework for a “smart” vertical farm, the risks of which are resistant to crises through the use of datasets and machine learningCase-study methodDescription of the case experience of organising the work of a “smart” vertical farm of ISC * and CSDTL * based on datasets and machine learning, reflecting its advantages in the form of increased risk resistance of this farm to crises—in particular, the COVID-19 crisis
* ISC—Institute of Scientific Communications: a research institute in Volgograd (Russia), one of the main areas of which is the agrarian economy and agriculture. * CSDTL—Consortium for Sustainable Development and Technology Leadership: a consortium that brings together a number of universities and research institutes (Russia), one of the main areas of which is the agrarian economy and agriculture. Source: developed and compiled by the authors
Table 2. Regression statistics and factor analysis of variance of the balance of agricultural companies in Russia in 2020.
Regression statistics
Multiple R0.7804
R-squared0.6091
Adjusted R-squared0.5925
Standard error6382.1391
Observations75
ANOVA
dfSSMSFSignificance F
Regression34,505,592,4331,501,864,14436.87211.77 × 10−14
Residual712,891,950,68040,731,699.7130
Total747,397,543,113
CoefficientsStandard Errort-Statp-ValueLower 95%Upper 95%
Y-intercept−2671.29451720.8633−1.55230.1250−6102.5985760.0095
R&D19−79.678410.8327−7.35532.6 × 10−10−101.2782−58.0785
R&D2084.209810.38618.10801.1 × 10−1163.5006104.9190
Production20180.605858.03573.11200.0026864.8859296.3257
Source: compiled by the authors.
Table 3. Regression statistics and factor analysis of variance of the yield of grain and legumes in Russia in 2020.
Regression Statistics
Multiple R0.2514
R-squared0.0632
Adjusted R-squared0.0372
Standard error13.0653
Observations75
ANOVA
dfSSMSFSignificance F
Regression2829.2160414.60802.42880.0953
Residual7212,290.6259170.7031
Total7413,119.8419
CoefficientsStandard Errort-Statp-ValueLower 95%Upper 95%
Y-intercept25.63421.794114.28810.000022.057829.2107
R&D200.00670.00381.75750.0831−0.00090.0143
Balance190.00020.00011.47820.1437−0.00010.0004
Source: compiled by the authors.
Table 4. Analysis of the model by region, categorised by the level and rate of socioeconomic development.
Categories of Regions by the Level and
Rate of Socioeconomic Development
Correlation of R&D in 2019 with Production in 2020Correlation of R&D in 2019 with Balance in 2020
Rockets: leading and quickly developing regions−0.10410.1384
Racers: regions with large potential for development0.4428−0.5048
Parachutists: progressive regions with slow development0.99150.5895
Turtles: lagging regions0.61610.5090
Source: authors.
Table 5. Analysis of the model at the level of federal districts of the Russian Federation.
Categories of Regions by the Level and
Rate of Socioeconomic Development
Correlation between R&D in 2019 and Production in 2020Correlation between R&D in 2019 and Balance in 2020
CFD—Central Federal District;−0.0815−0.0185
NWFD—Northwestern Federal District;−0.4581−0.1482
SFD—Southern Federal District;0.82060.8062
NCFD—North Caucasus Federal District;0.75750.8557
VFD—Volga Federal District;0.20370.1955
UFD—Ural Federal District;−0.78370.6037
SFD—Siberian Federal District;0.74280.6107
FFD—Far Eastern Federal District.−0.0255−0.1014
Source: authors.
Table 6. Comparative analysis of the new scientific results obtained in this article with the existing literature.
Area of ComparisonExisting LiteratureNew Scientific Results Obtained in the Article
PostulatesSources
Determinants of agricultural risksProduction risksNatural and climatic factorsAhmed et al. (2022),
Sohail et al. (2022),
Zhang et al. (2022b)
Technological factors
Financial risksMarket factors (including crisis)Adhikari and Khanal (2022),
Bai and Jia (2022),
Bai et al. (2022)
The contribution of “smart” technologies to reduce the risks of agricultureProduction risksAI-based horizontal farm resource improvementNayal et al. (2022)System automation of production and distribution processes of a “smart” vertical farm based on datasets and machine learning
Financial risksIntelligent sales decision support based on AIPena et al. (2022)
Changing risks in agriculture during the COVID-19 crisisProduction risksIncreased due to the growth of the cost of raw, materials, equipment for agriculturePrasad et al. (2022)Increased only in those economic systems and only in those agricultural companies that are to a small extent automated, while “smart” technologies make it possible to achieve crisis resilience
Financial risksIncreased due to the disruption of value chains, a decrease in effective demand, and government regulation of food pricesGascón and Mamani (2022),
Kuleh et al. (2022)
Agricultural risk managementProduction risksIncreasing the climate resilience of agricultureHowland and Francois Le Coq (2022),
Jones and Leibowicz (2022)
Systemic risk management in agriculture based on “smart” technologies
Financial risksStrengthening the market positions of agricultural companiesRicome and Reynaud (2022),
Wang et al. (2022)
Source: developed and compiled by the authors.
Disclaimer/Publisher’s Note: The statements, opinions and data contained in all publications are solely those of the individual author(s) and contributor(s) and not of MDPI and/or the editor(s). MDPI and/or the editor(s) disclaim responsibility for any injury to people or property resulting from any ideas, methods, instructions or products referred to in the content.

