
A Mixed-Longitudinal Study of Height Velocity of Greek Schoolchildren and the Milestones of the Adolescent Growth Spurt

 , , ,
, , ,
Abstract
:1. Introduction
2. Materials and Methods
Statistical Analysis
3. Results
4. Discussion
5. Conclusions
Author Contributions
Funding
Institutional Review Board Statement
Informed Consent Statement
Data Availability Statement
Conflicts of Interest
Abbreviations
References
- Butler, G. Assessment of growth and puberty. In Growth Hormone Therapy in Pediatrics–20 Years of KIGS.; Ranke, M.B., Price, D.A., Reiter, E.O., Eds.; Karger: Basel, Switzerland, 2007; pp. 6–15. ISBN 9783805582568. [Google Scholar]
- Haymond, M.; Kappelgaard, A.M.; Czernichow, P.; Biller, B.M.; Takano, K.; Kiess, W.; Global Advisory Panel Meeting on the Effects of Growth Hormone. Early recognition of growth abnormalities permitting early intervention. Acta Paediatr. 2013, 102, 787–796. [Google Scholar] [CrossRef] [PubMed]
- Tanner, J.M. Normal growth and techniques of growth assessment. Clin. Endocrinol. Metab. 1986, 15, 411–451. [Google Scholar] [CrossRef]
- Roche, A.F.; Himes, J.H. Incremental growth charts. Am. J. Clin. Nutr. 1980, 33, 2041–2052. [Google Scholar] [CrossRef] [PubMed] [Green Version]
- Hägg, U.; Taranger, J. Height and height velocity in early, average and late maturers followed to the age of 25: A prospective longitudinal study of Swedish urban children from birth to adulthood. Ann. Hum. Biol. 1991, 18, 47–56. [Google Scholar] [CrossRef]
- Berkey, S.; Dockery, D.W.; Wang, X.; Wypij, D.; Ferris, B. Longitudinal height velocity standards for U.S. adolescents. Stat. Med. 1993, 12, 403–414. [Google Scholar] [CrossRef]
- Xu, X.; Wang, W.; Guo, Z.; Karlberg, J. Longitudinal growth during infancy and childhood in children from Shanghai: Predictors and consequences of the age at onset of the childhood phase of growth. Pediatr. Res. 2002, 51, 377–385. [Google Scholar] [CrossRef] [Green Version]
- Kelly, A.; Winer, K.K.; Kalkwarf, H.; Oberfield, S.E.; Lappe, J.; Gilsanz, V.; Zemel, B.S. Age-based reference ranges for annual height velocity in US children. J. Clin. Endocrinol. Metab. 2014, 99, 2104–2112. [Google Scholar] [CrossRef]
- Khadilkar, V.; Khadilkar, A.; Arya, A.; Ekbote, V.; Kajale, N.; Parthasarathy, L.; Patwardhan, V.; Phanse, S.; Chiplonkar, S. Height Velocity Percentiles in Indian Children Aged 5–17 Years. Indian Pediatr. 2019, 56, 23–28. [Google Scholar] [CrossRef]
- Kemper, H.C.; van Mechelen, W.; Post, G.B.; Snel, J.; Twisk, J.W.; van Lenthe, F.J.; Welten, D.C. The Amsterdam Growth and Health Longitudinal Study. The past (1976–1996) and future (1997–?). Int. J. Sports Med. 1997, 18 (Suppl. 3), S140–S150. [Google Scholar] [CrossRef]
- Richter, L.; Norris, S.; Pettifor, J.; Yach, D.; Cameron, N. Cohort Profile: Mandela’s children: The 1990 Birth to Twenty study in South Africa. Int. J. Epidemiol. 2007, 36, 504–511. [Google Scholar] [CrossRef] [Green Version]
- Beunen, G.; Ostyn, M.; Simons, J.; Renson, R.; Claessens, A.L.; Vanden Eynde, B.; Lefevre, J.; Vanreusel, B.; Malina, R.M.; van’t Hof, M.A. Development and tracking in fitness components: Leuven longtudinal study on lifestyle, fitness and health. Int. J. Sports Med. 1997, 18 (Suppl. 3), S171–S178. [Google Scholar] [CrossRef] [PubMed] [Green Version]
- Tanner, J.M.; Whitehouse, R.H. Clinical longitudinal standards for height, weight, height velocity, weight velocity, and stages of puberty. Arch. Dis. Child. 1976, 51, 170–179. [Google Scholar] [CrossRef] [PubMed] [Green Version]
- Tanner, J.M.; Whitehouse, R.H.; Takaishi, M. Standards from birth to maturity for height, weight, height velocity and weight velocity: British children, 1965. Arch. Dis. Child. 1996, 41, 454–613. [Google Scholar] [CrossRef] [PubMed] [Green Version]
- Papadimitriou, A. Timing of puberty and secular trend in human maturation. In Puberty; Springer: Cham, Switzerland, 2016; pp. 121–136. [Google Scholar]
- Papadimitriou, A.; Pantsiotou, S.; Douros, K.; Papadimitriou, D.T.; Nicolaidou, P.; Fretzayas, A. Timing of pubertal onset in girls: Evidence for non-Gaussian distribution. J. Clin. Endocrinol. Metab. 2008, 93, 4422–4425. [Google Scholar] [CrossRef] [Green Version]
- Papadimitriou, A.; Douros, K.; Kleanthous, K.; Papadimitriou, D.T.; Attilakos, A.; Fretzayas, A. Pubertal maturation of contemporary Greek boys: No evidence of a secular trend. J. Adolesc. Health 2011, 49, 434–436. [Google Scholar] [CrossRef]
- Taranger, J.; Hägg, U. The timing and duration of adolescent growth. Acta Odontol. Scand. 1980, 38, 57–67. [Google Scholar] [CrossRef]
- Aksglaede, L.; Olsen, L.W.; Sørensen, T.I.; Juul, A. Forty years trends in timing of pubertal growth spurt in 157,000 Danish school children. PLoS ONE. 2008, 3, e2728. [Google Scholar] [CrossRef] [Green Version]
- Wehkalampi, K.; Hovi, P.; Dunkel, L.; Strang-Karlsson, S.; Järvenpää, A.-L.; Eriksson, J.G.; Andersson, S.; Kajantie, E. Advanced Pubertal Growth Spurt in Subjects Born Preterm: The Helsinki Study of Very Low Birth Weight Adults. J. Clin. Endocrinol. Metab. 2011, 96, 525–533. [Google Scholar] [CrossRef]
- Gasser, T.; Molinari, L.; Largo, R. A comparison of pubertal maturity and growth. Ann. Hum. Biol. 2013, 40, 341–347. [Google Scholar] [CrossRef]
- Malina, R.M.; Kozieł, S.M. Validation of maturity offset in a longitudinal sample of Polish boys. J. Sports Sci. 2014, 32, 424–437. [Google Scholar] [CrossRef]
- Malina, R.M.; Kozieł, S.M. Validation of maturity offset in a longitudinal sample of Polish girls. J. Sports Sci. 2014, 32, 1374–1382. [Google Scholar] [CrossRef] [PubMed]
- Hermanussen, M. Growth in childhood and puberty. In Puberty; Springer: Cham, Switzerland, 2016; pp. 65–76. [Google Scholar]
- Papadimitriou, A.; Marakaki, C.; Papadimitriou, D.T. Growth variations with opposite clinical outcomes and the emerging role of IGF-1. Trends Endocrinol. Metab. 2022, 33, 359–370. [Google Scholar] [CrossRef] [PubMed]
- Brabant, G.; von zur Mühlen, A.; Wüster, C.; Ranke, M.B.; Kratzsch, J.; Kiess, W.; Ketelslegers, J.M.; Wilhelmsen, L.; Hulthén, L.; Saller, B.; et al. Serum insulin-like growth factor I reference values for an automated chemiluminescence immunoassay system: Results from a multicenter study. Horm. Res. 2003, 60, 53–60. [Google Scholar] [CrossRef] [PubMed]
- Frederiksen, H.; Johannsen, T.H.; Andersen, S.E.; Albrethsen, J.; Landersoe, S.K.; Petersen, J.H.; Andersen, A.N.; Vestergaard, E.T.; Schorring, M.E.; Linneberg, A.; et al. Sex-specific Estrogen Levels and Reference Intervals from Infancy to Late Adulthood Determined by LC-MS/MS. J. Clin. Endocrinol. Metab. 2020, 105, 754–768. [Google Scholar] [CrossRef] [PubMed]
- Kulle, A.E.; Riepe, F.G.; Melchior, D.; Hiort, O.; Holterhus, P.M. A novel ultrapressure liquid chromatography tandem mass spectrometry method for the simultaneous determination of androstenedione, testosterone, and dihydrotestosterone in pediatric blood samples: Age- and sex-specific reference data. J. Clin. Endocrinol. Metab. 2010, 95, 2399–2409. [Google Scholar] [CrossRef] [Green Version]
- Marshall, W.A.; Tanner, J.M. Variations in the Pattern of Pubertal Changes in Boys. Arch. Dis. Child. 1970, 45, 13–23. [Google Scholar] [CrossRef] [Green Version]
- Marshall, W.A.; Tanner, J.M. Variations in pattern of pubertal changes in girls. Arch. Dis. Child. 1969, 44, 291–303. [Google Scholar] [CrossRef] [Green Version]
- Dabas, A.; Khadgawat, R.; Gahlot, M.; Surana, V.; Mehan, N.; Ramot, R.; Pareek, A.; Sreenivas, V.; Marwaha, R.K. Height Velocity in Apparently Healthy North Indian School Children. Indian J. Endocrinol. Metab. 2018, 22, 256–260. [Google Scholar]
- Papadimitriou, A.; Fytanidis, G.; Douros, K.; Papadimitriou, D.T.; Nicolaidou, P.; Fretzayas, A. Greek young men grow taller. Acta Paediatr. 2008, 97, 1105–1107. [Google Scholar] [CrossRef]
- Hauspie, R.C.; Das, S.R.; Preece, M.A.; Tanner, J.M. A longitudinal study of the growth in height of boys and girls of West Bengal (India) aged six months of 20 years. Ann. Hum. Biol. 1980, 7, 429–440. [Google Scholar] [CrossRef]
- Tanner, J.M.; Davies, P.S. Clinical longitudinal standards for height and height velocity for North American children. J. Pediatr. 1985, 107, 317–329. [Google Scholar] [CrossRef]
- Chae, H.K.; Suh, I.; Kwon, A.R.; Kim, Y.J.; Kim, Y.H.; Kang, D.R.; Kim, H.Y.; Oh, S.M.; Kim, H.C.; Kim, D.H.; et al. Longitudinal standards for height and height velocity in Korean children and adolescents: The Kangwha study. J. Korean Med. Sci. 2013, 28, 1512–1517. [Google Scholar] [CrossRef] [Green Version]
- Mirwald, R.L.; Bailey, D.A. Seasonal height velocity variation in boys and girls 8–18 years. Am. J. Hum. Biol. 1997, 9, 709–715. [Google Scholar] [CrossRef]
- Allen, D.B.; Cuttler, L. Clinical practice. Short stature in childhood—Challenges and choices. N. Engl. J. Med. 2013, 368, 1220–1228. [Google Scholar] [CrossRef] [Green Version]


| Grade | All Children | Gender | Number | Age (Years), Mean (SD) |
|---|---|---|---|---|
| 1st | 321 | Male | 174 | 6.60 (0.31) |
| Female | 147 | 6.42 (0.13) | ||
| 4th | 352 | Male | 171 | 9.52 (0.10) |
| Female | 181 | 9.46 (0.16) | ||
| 7th | 456 | Male | 265 | 12.50 (0.08) |
| Female | 191 | 12.46 (0.12) | ||
| 10th | 385 | Male | 199 | 15.46 (0.16) |
| Female | 186 | 15.41 (0.08) | ||
| Total | 1514 |
| Age, Years | Height (SD) cm | Height Velocity (SD) cm/yr (6 Months) | Height Velocity (SD) cm/yr (12 Months) | Height (SD) cm | Height Velocity (SD) cm/yr (6 Months) | Height Velocity (SD) cm/yr (12 Months) |
|---|---|---|---|---|---|---|
| Boys | Girls | |||||
| 6.0 | 117.7 (4.5) | 6.0 (2.2) | 6.1 (1.2) | 118.0 (5.9) | 6.4 (1.3) | 6.2 (1.8) |
| 6.5 | 121.8 (5.3) | 6.4 (0.9) | 120.9 (5.2) | 6.3 (1.6) | ||
| 7.0 | 123.9 (5.6) | 6.0 (1.4) | 6.1 (1.3) | 123.9 (5.7) | 6.5 (1.5) | 6.3 (1.5) |
| 7.5 | 127.4 (5.4) | 5.9 (1.2) | 126.6 (5.7) | 5.9 (1.4) | ||
| 8.0 | 129.9 (6.1) | 5.6 (1.2) | 5.7 (1.2) | 129.9 (5.6) | 5.7 (1.3) | 5.8 (1.3) |
| 8.5 | 133.3 (5.9) | 5.6 (1.2) | 132.1 (5.7) | 5.8 (1.2) | ||
| 9.0 | 135.3 (6.8) | 5.8 (1.0) | 5.8 (1.2) | 135.8 (5.6) | 6.7 (1.6) | 6.4 (1.7) |
| 9.5 | 138.7 (5.6) | 5.9 (1.5) | 136.9 (5.7) | 6.2 (2.0) | ||
| 10.0 | 141.4 (6.5) | 5.2 (1.5) | 5.4 (1.5) | 140.7 (6.3) | 6.7 (1.9) | 6.5 (2.0) |
| 10.5 | 144.5 (6.2) | 5.5 (1.6) | 144.2 (6.2) | 6.7 (2.0) | ||
| 11.0 | 146.4 (7.0) | 5.7 (1.9) | 5.8 (1.9) | 147.2 (6.5) | 6.8 (1.8) | 6.8 (1.8) |
| 11.5 | 150.2 (7.1) | 6.7 (2.1) | 150.4 (6.8) | 6.6 (1.8) | ||
| 12.0 | 153.1 (7.7) | 8.1 (2.8) | 7.7 (2.7) | 154.0 (6.4) | 6.0 (2.4) | 6.1 (2.3) |
| 12.5 | 157.7 (8.3) | 8.3 (2.9) | 156.0 (6.1) | 4.9 (3.0) | ||
| 13.0 | 161.5 (8.5) | 7.8 (2.8) | 7.7 (2.7) | 158.9 (6.3) | 3.5 (2.3) | 3.7 (2.5) |
| 13.5 | 165.3 (8.1) | 7.3 (2.5) | 159.8 (6.2) | 2.9 (2.2) | ||
| 14.0 | 168.8 (8.1) | 6.1 (2.7) | 6.1 (2.8) | 161.5 (6.2) | 2.0 (1.8) | 2.0 (1.8) |
| 14.5 | 171.3 (7.7) | 4.6 (2.5) | 161.8 (6.2) | 1.6 (1.5) | ||
| 15.0 | 172.7 (7.3) | 3.4 (2.0) | 3.7 (2.3) | 163 (6.7) | 1.2 (1.0) | 1.1 (1.0) |
| 15.5 | 173.8 (6.5) | 2.9 (2.6) | 162.1 (5.9) | 0.8 (1.1) | ||
| 16.0 | 174.6 (6.6) | 2.2 (2.0) | 2.2 (2.0) | 162.5 (7.0) | 0.8 (0.9) | 0.8 (0.9) |
| 16.5 | 175.1 (5.9) | 1.4 (1.2) | 163.1 (6.7) | 0.6 (0.7) | ||
| 17.0 | 175.7 (6.1) | 1.0 (1.0) | 1.0 (0.9) | 163.1 (7.4) | 0.3 (0.4) | 0.4 (0.5) |
| 17.5 | 176.6 (6.4) | 0.7 (0.7) | 163.2 (7.1) | 0.2 (0.3) | ||
| 18.0 | 176.8 (6.0) | 0.7 (0.8) | 0.8 (0.7) | 163.3 (7.1) | 0.2 (0.3) | 0.2 (0.3) |
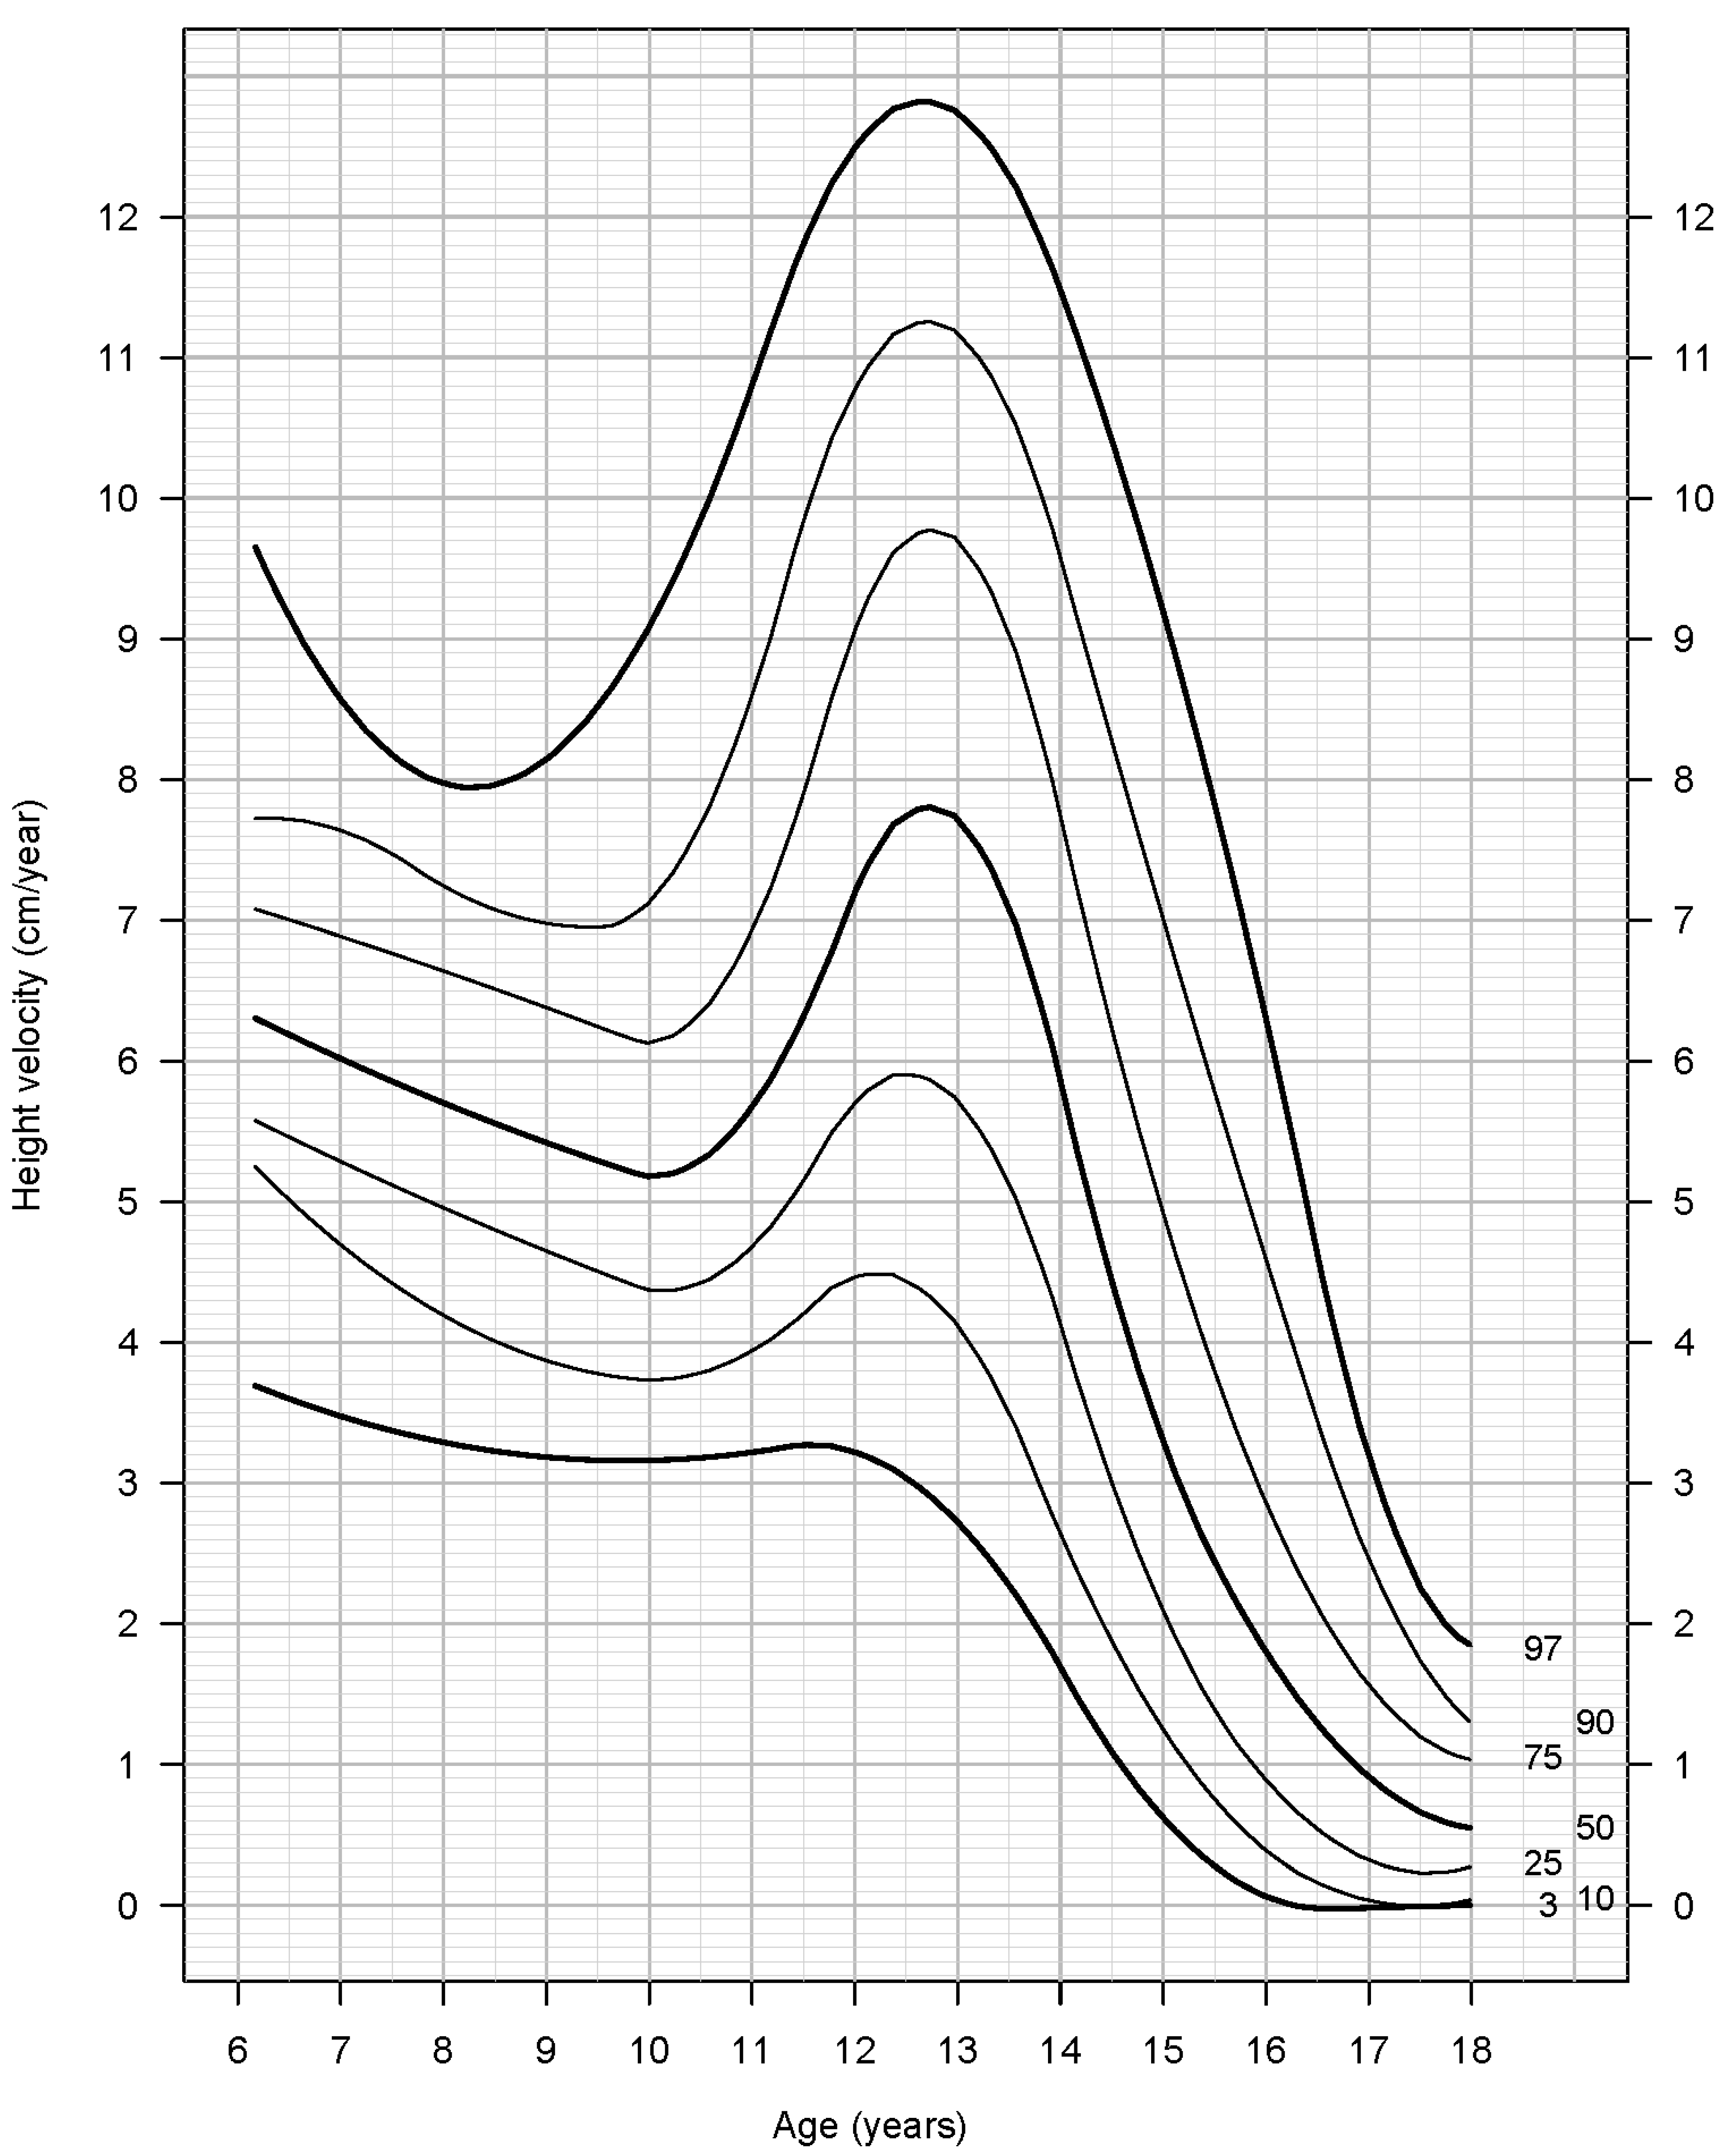
| Age (Years) | 3rd | 10th | 25th | 50th | 75th | 90th | 97th |
|---|---|---|---|---|---|---|---|
| 6 | 3.5 | 4.2 | 5.1 | 5.4 | 6.4 | 8.2 | 9.5 |
| 6.5 | 5.1 | 5.4 | 5.7 | 6.2 | 6.9 | 7.7 | 8.2 |
| 7 | 3.2 | 4.3 | 5.2 | 6.2 | 7.0 | 7.4 | 8.3 |
| 7.5 | 3.8 | 4.6 | 5.2 | 5.8 | 6.7 | 7.6 | 8.4 |
| 8 | 3.2 | 4.1 | 4.8 | 5.5 | 6.3 | 7.1 | 7.8 |
| 8.5 | 3.7 | 4.1 | 4.8 | 5.6 | 6.5 | 7.1 | 7.4 |
| 9 | 3.7 | 4.3 | 5.3 | 5.9 | 6.5 | 7.0 | 7.5 |
| 9.5 | 4.0 | 4.2 | 4.9 | 5.8 | 7.0 | 7.9 | 9.0 |
| 10 | 2.8 | 3.6 | 4.2 | 5.0 | 6.1 | 7.0 | 7.6 |
| 10.5 | 2.8 | 3.7 | 4.6 | 5.4 | 6.4 | 7.2 | 8.4 |
| 11 | 3.3 | 3.7 | 4.3 | 5.2 | 6.5 | 8.2 | 10.6 |
| 11.5 | 3.5 | 4.3 | 5.3 | 6.4 | 7.8 | 9.8 | 11.5 |
| 12 | 4.3 | 5.1 | 5.8 | 7.7 | 10.0 | 11.8 | 14.2 |
| 12.5 | 3.5 | 4.7 | 6.0 | 8.5 | 10.6 | 11.9 | 13.4 |
| 13 | 2.9 | 4.3 | 5.8 | 7.8 | 9.7 | 11.0 | 13.1 |
| 13.5 | 2.3 | 4.2 | 5.4 | 7.4 | 9.1 | 10.6 | 12.1 |
| 14 | 2.0 | 2.8 | 4.1 | 6.1 | 7.6 | 9.9 | 11.2 |
| 14.5 | 0.9 | 1.5 | 2.6 | 4.2 | 6.0 | 8.3 | 9.8 |
| 15 | 0.6 | 1.3 | 2.1 | 3.2 | 4.5 | 5.7 | 8.1 |
| 15.5 | −0.2 | 0.6 | 1.0 | 2.2 | 4.0 | 6.1 | 8.5 |
| 16 | −0.1 | 0.1 | 1.0 | 1.9 | 3.1 | 5.3 | 6.7 |
| 16.5 | −0.1 | 0.1 | 0.5 | 1.3 | 2.0 | 2.8 | 4.2 |
| 17 | 0.0 | 0.0 | 0.3 | 0.8 | 1.5 | 2.3 | 3.4 |
| 17.5 | 0.0 | 0.0 | 0.2 | 0.5 | 1.3 | 1.6 | 2.1 |
| 18 | 0.0 | 0.0 | 0.3 | 0.6 | 1.0 | 1.3 | 2.6 |
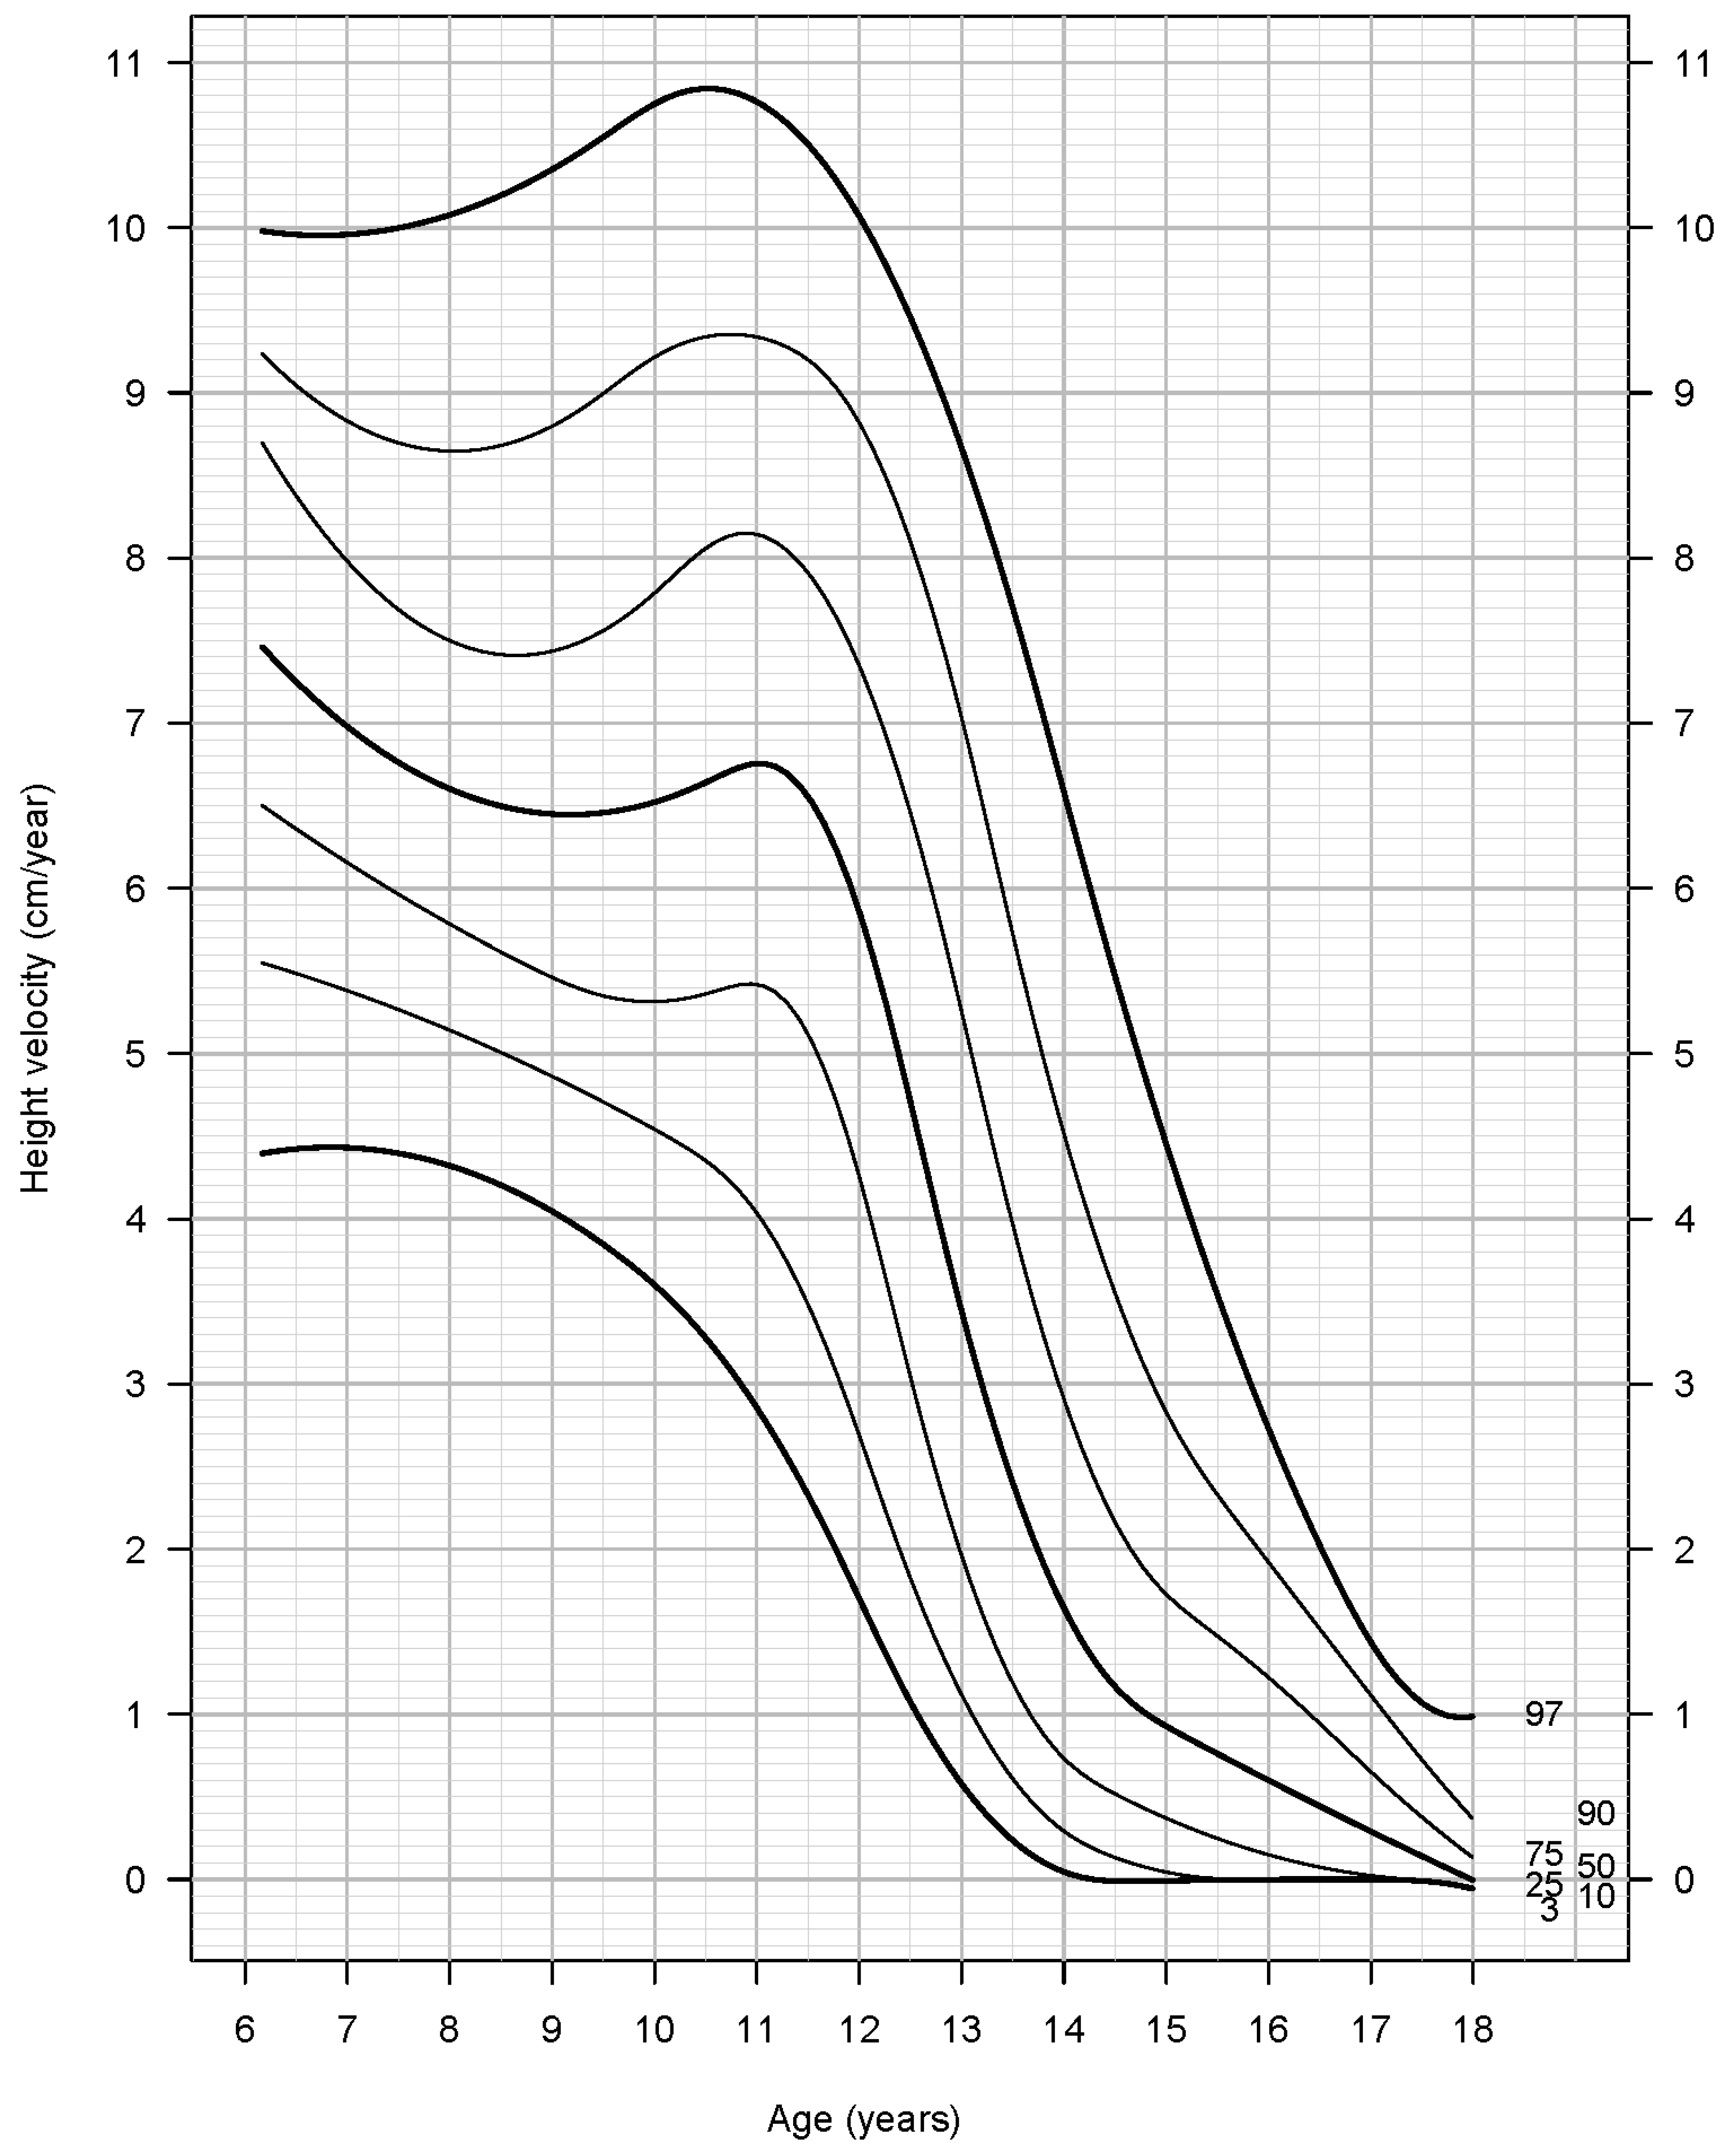
| Age (Years) | 3rd | 10th | 25th | 50th | 75th | 90th | 97th |
|---|---|---|---|---|---|---|---|
| 6 | 5.4 | 5.5 | 6.4 | 7.3 | 8.4 | 8.7 | 8.7 |
| 6.5 | 4.5 | 5.3 | 6.1 | 6.8 | 8.0 | 8.9 | 10.6 |
| 7 | 5.1 | 5.5 | 6.4 | 7.3 | 8.2 | 9.4 | 10.3 |
| 7.5 | 4.5 | 5.0 | 5.8 | 6.7 | 7.5 | 8.7 | 9.2 |
| 8 | 4.3 | 5.0 | 5.7 | 6.4 | 7.3 | 8.3 | 9.2 |
| 8.5 | 4.2 | 5.2 | 6.0 | 6.6 | 7.4 | 8.1 | 9.2 |
| 9 | 4.6 | 5.0 | 5.8 | 7.1 | 8.1 | 9.0 | 10.5 |
| 9.5 | 3.2 | 4.1 | 5.0 | 5.7 | 7.2 | 8.9 | 11.1 |
| 10 | 3.7 | 4.3 | 5.4 | 6.5 | 7.8 | 9.7 | 10.6 |
| 10.5 | 3.5 | 4.4 | 5.3 | 6.5 | 8.1 | 9.4 | 11.1 |
| 11 | 3.6 | 4.5 | 5.4 | 7.0 | 8.1 | 9.1 | 10.0 |
| 11.5 | 3.0 | 4.2 | 5.4 | 6.7 | 7.7 | 8.7 | 9.6 |
| 12 | 2.2 | 2.9 | 4.2 | 6.0 | 7.6 | 8.9 | 10.2 |
| 12.5 | 0.5 | 1.3 | 2.2 | 4.8 | 7.4 | 8.9 | 10.6 |
| 13 | 0.3 | 0.9 | 1.8 | 3.0 | 5.3 | 6.7 | 8.0 |
| 13.5 | 0.3 | 0.7 | 1.2 | 2.3 | 4.0 | 6.0 | 7.9 |
| 14 | 0.0 | 0.2 | 0.7 | 1.6 | 2.8 | 4.0 | 6.3 |
| 14.5 | 0.0 | 0.3 | 0.5 | 1.3 | 2.2 | 3.3 | 4.3 |
| 15 | 0.0 | 0.3 | 0.5 | 0.8 | 1.5 | 2.5 | 3.5 |
| 15.5 | 0.0 | 0.0 | 0.0 | 0.8 | 1.4 | 2.4 | 3.3 |
| 16 | 0.0 | 0.0 | 0.2 | 0.6 | 1.5 | 2.1 | 2.5 |
| 16.5 | 0.0 | 0.0 | 0.2 | 0.5 | 1.0 | 1.7 | 2.4 |
| 17 | 0.0 | 0.0 | 0.0 | 0.2 | 0.4 | 0.9 | 1.2 |
| 17.5 | 0.0 | 0.0 | 0.0 | 0.2 | 0.5 | 0.6 | 1.0 |
| 18 | 0.0 | 0.0 | 0.0 | 0.0 | 0.3 | 0.6 | 0.9 |
Publisher’s Note: MDPI stays neutral with regard to jurisdictional claims in published maps and institutional affiliations. |
© 2022 by the authors. Licensee MDPI, Basel, Switzerland. This article is an open access article distributed under the terms and conditions of the Creative Commons Attribution (CC BY) license (https://creativecommons.org/licenses/by/4.0/).
Share and Cite
Kleanthous, K.; Papadimitriou, D.T.; Gryparis, A.; Papaevangelou, V.; Papadimitriou, A. A Mixed-Longitudinal Study of Height Velocity of Greek Schoolchildren and the Milestones of the Adolescent Growth Spurt. Children 2022, 9, 790. https://doi.org/10.3390/children9060790
Kleanthous K, Papadimitriou DT, Gryparis A, Papaevangelou V, Papadimitriou A. A Mixed-Longitudinal Study of Height Velocity of Greek Schoolchildren and the Milestones of the Adolescent Growth Spurt. Children. 2022; 9(6):790. https://doi.org/10.3390/children9060790
Chicago/Turabian StyleKleanthous, Kleanthis, Dimitrios T. Papadimitriou, Alexandros Gryparis, Vassiliki Papaevangelou, and Anastasios Papadimitriou. 2022. "A Mixed-Longitudinal Study of Height Velocity of Greek Schoolchildren and the Milestones of the Adolescent Growth Spurt" Children 9, no. 6: 790. https://doi.org/10.3390/children9060790