
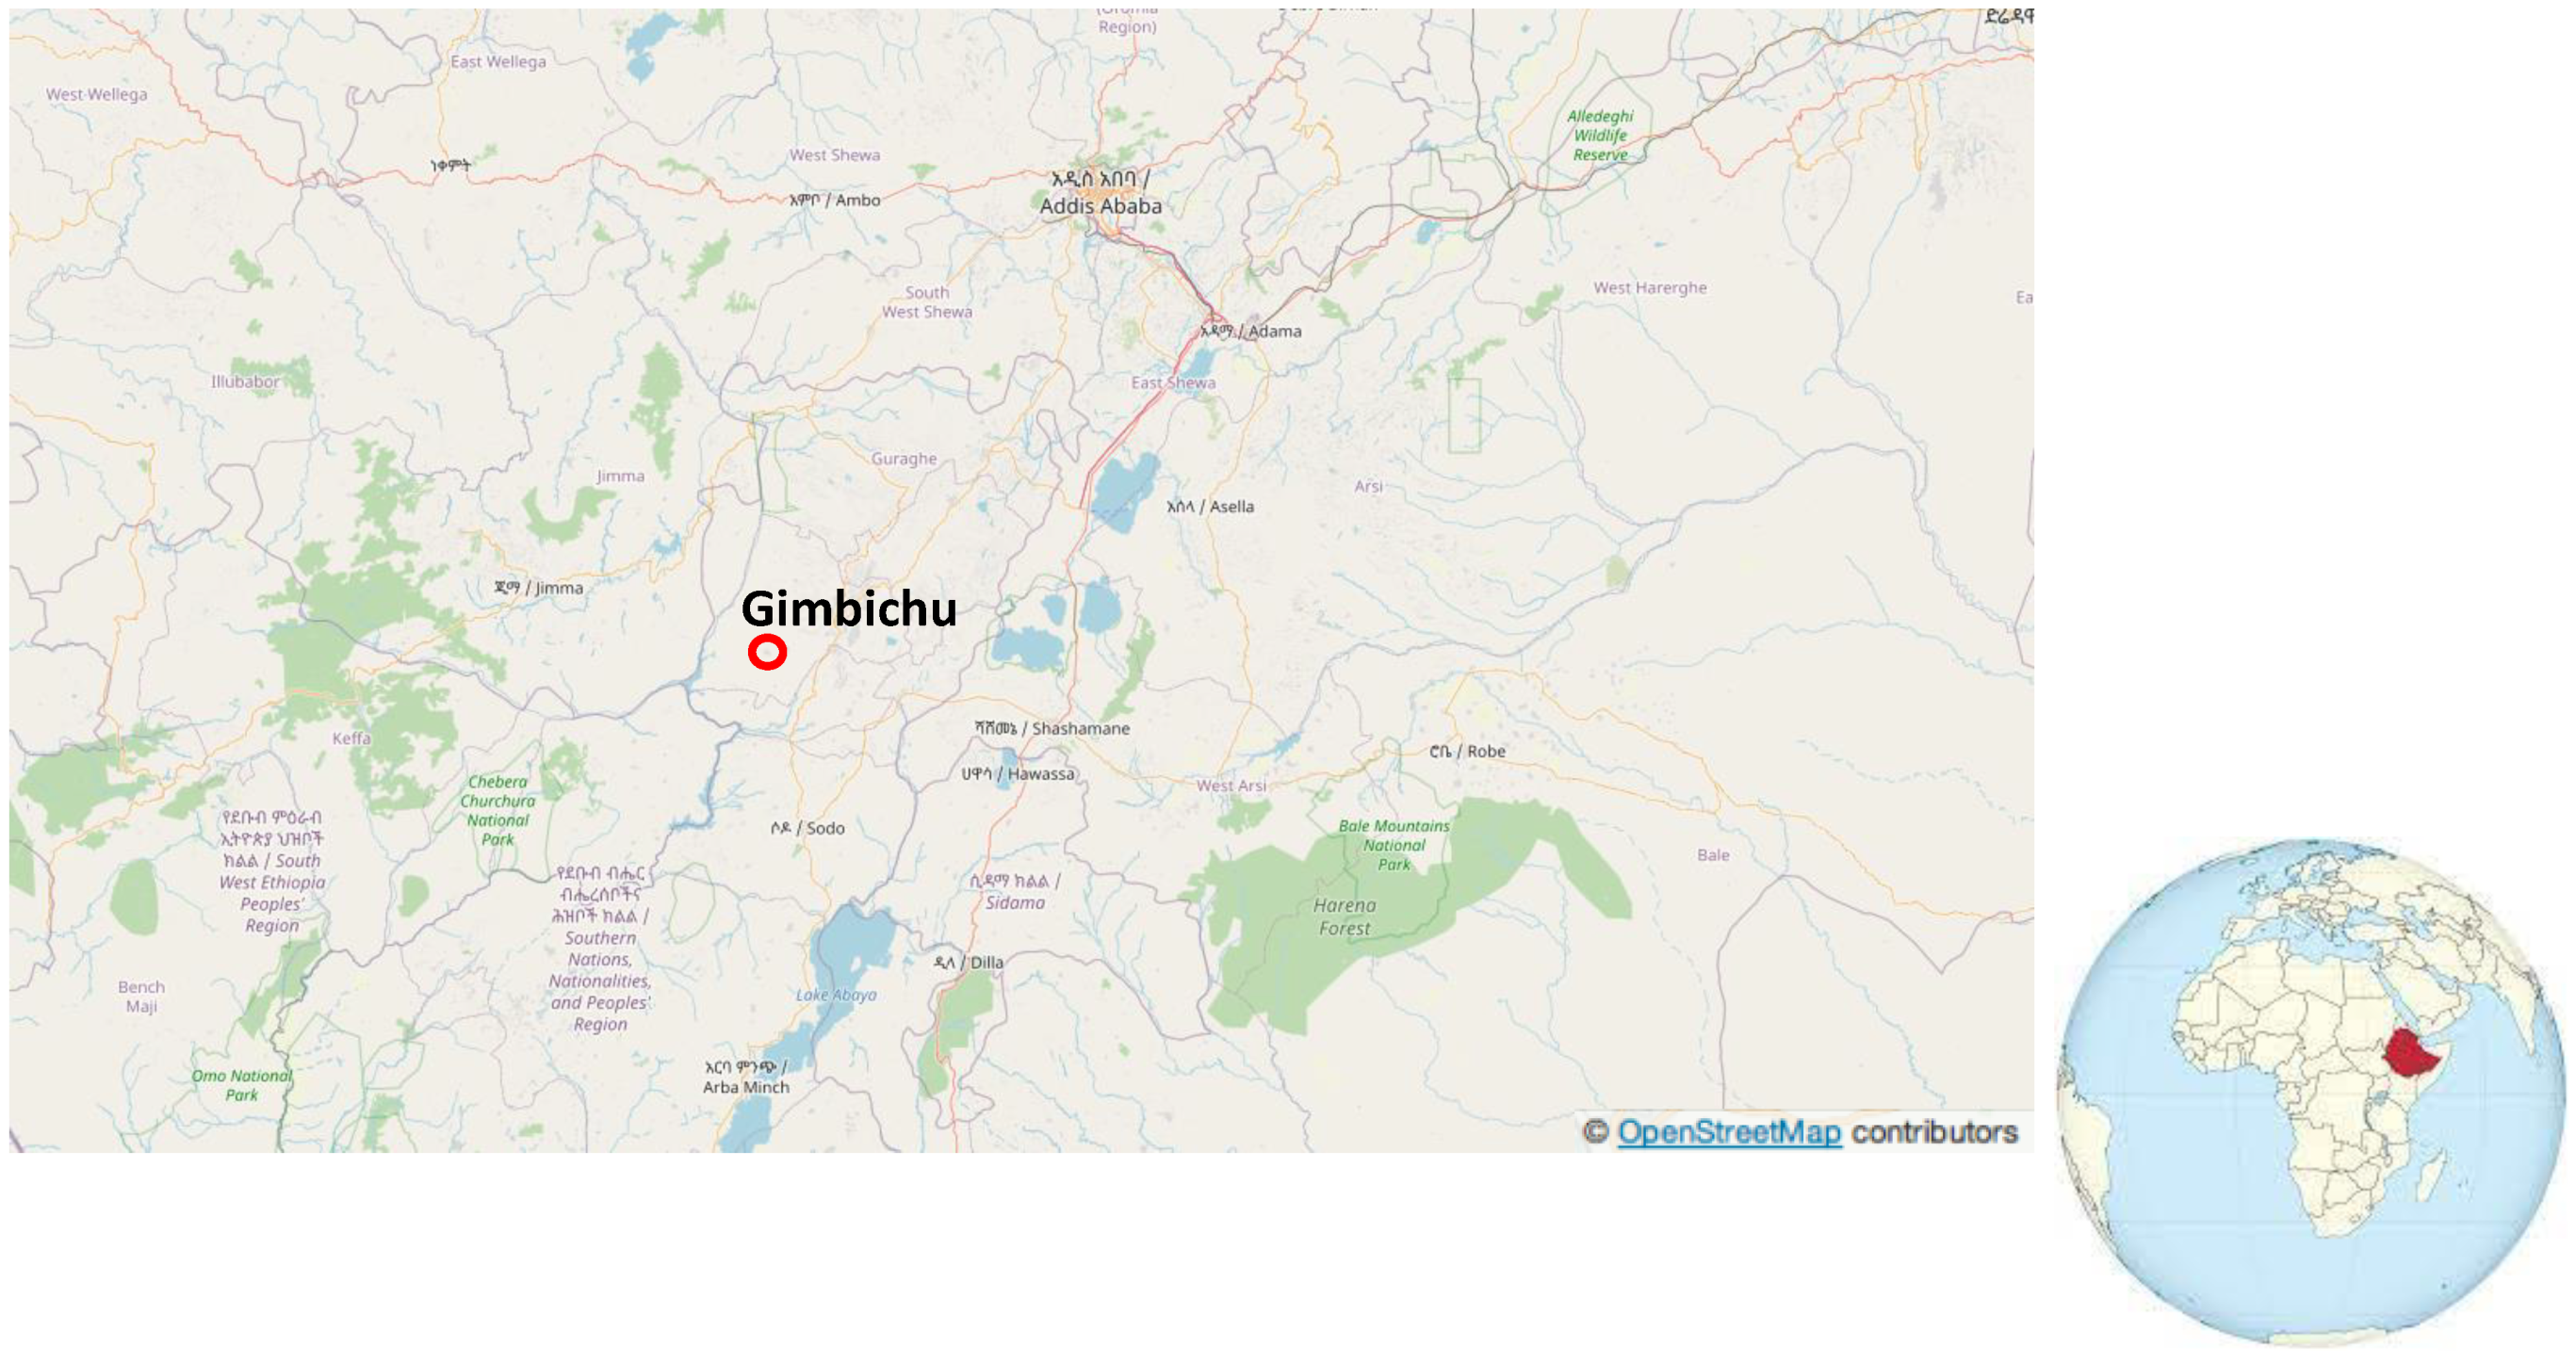
Assessment of Malnutrition among Children Presenting in a Nutrition Center in Gimbichu, Ethiopia


Abstract
:1. Introduction
2. Materials and Methods
2.1. Participants
2.2. Anthropometric Measurements
2.3. Statistical Analysis
3. Results
4. Discussion
5. Conclusions
Author Contributions
Funding
Institutional Review Board Statement
Informed Consent Statement
Data Availability Statement
Acknowledgments
Conflicts of Interest
References
- Our World in Data. Human Development Index (HDI)—Our World in Data. 2021. Available online: https://ourworldindata.org/human-development-index (accessed on 28 February 2023).
- The World Bank. Ethiopia. 2021. Available online: https://data.worldbank.org/country/ethiopia?view=chart (accessed on 28 February 2023).
- The World Bank. Urban Population (% of Total Population)-Ethiopia. 2021. Available online: https://data.worldbank.org/indicator/SP.URB.TOTL.IN.ZS?locations=ET (accessed on 28 February 2023).
- Jackson, T.T. Ethiopia: A Multistep Solution to the Growing Population in a Country with Untapped Agricultural Potential. Available online: https://www.worldfoodprize.org/documents/filelibrary/youth_programs/2022_gyi_student_papers/Jackson_Trey_29D74E702F04B.pdf (accessed on 28 February 2023).
- Getahun, Z.; Urga, K.; Ganebo, T.; Nigatu, A. Review of the status of malnutrition and trends in Ethiopia. Ethiop. J. Health Dev. 2001, 15, 55–74. [Google Scholar] [CrossRef]
- Mulugeta, A.; Gebregziabher, M. Saving children from man-made acute malnutrition in Tigray, Ethiopia: A call to action. Lancet Glob. Health 2022, 10, e469–e470. [Google Scholar] [CrossRef] [PubMed]
- UNICEF. Nutrition in Numbers from Ethiopia. Available online: https://www.unicef.org/ethiopia/nutrition (accessed on 28 February 2023).
- The Missionary Community of Saint Paul the Apostle. Available online: https://mcspa.org/ (accessed on 28 February 2023).
- MOS Solidaria. Available online: http://mossolidaria.org/ (accessed on 28 February 2023).
- World Medical Association. WMA Declaration of Helsinki—Ethical Principles for Medical Research Involving Human Subjects. Available online: https://www.wma.net/policies-post/wma-declaration-of-helsinkiethical-principles-for-medical-research-involving-human-subjects (accessed on 28 February 2023).
- U.S. National Bioethics Advisory Commission. Ethical and Policy Issues Research: Clinical Trials in Developing Countries. Available online: http://bioethics.georgetown.edu/nbac/clinical/Vol1.pdf (accessed on 28 February 2023).
- European Commission. EU Directive 2001/20/EC. Off. J. Eur. Communities 2001, 121, 34–44. [Google Scholar]
- Office for Human Research Protections (OHRP); Office of the Assistant Secretary for Health (OASH); U.S. Department of Health and Human Services (HHS). International Compilation of Human Research Standards. Available online: https://www.hhs.gov/sites/default/files/ohrp-international-compilation-2021-africa.pdf (accessed on 28 February 2023).
- Onis, M.D.; Onyango, A.W.; Borghi, E.; Siyam, A.; Nishida, C.; Siekmann, J. Development of a WHO growth reference for school-aged children and adolescents. Bull. World Health Organ. 2007, 85, 660–667. [Google Scholar] [CrossRef]
- WHO. WHO Child Growth Standards: Length/Height-for-Age, Weight-for-Age, Weight-for-Length, Weight-for-Height and Body Mass Index-for-Age. World Health Organization: Geneva, Switzerland, 2006. Available online: https://apps.who.int/iris/handle/10665/43413 (accessed on 28 February 2023).
- Yimer, G. Malnutrition among children in Southern Ethiopia: Levels and risk factors. Ethiop. J. Health Dev. 2000, 14, 283–292. [Google Scholar] [CrossRef]
- Abate, K.H.; Belachew, T. Chronic malnutrition among under five children of Ethiopia may not be economic. A systematic review and meta-analysis. Ethiop. J. Health Sci. 2018, 29, 265–277. [Google Scholar] [CrossRef]
- Motbainor, A.; Worku, A.; Kumie, A. Stunting is associated with food diversity while wasting with food insecurity among underfive children in East and West Gojjam Zones of Amhara Region, Ethiopia. PLoS ONE 2015, 10, e0133542. [Google Scholar] [CrossRef]
- Getaneh, Z.; Melku, M.; Geta, M.; Melak, T.; Hunegnaw, M.T. Prevalence and determinants of stunting and wasting among public primary school children in Gondar town, northwest, Ethiopia. BMC Pediatr. 2019, 19, 207. [Google Scholar] [CrossRef]
- Gari, T.; Loha, E.; Deressa, W.; Solomon, T.; Lindtjørn, B. Malaria increased the risk of stunting and wasting among young children in Ethiopia: Results of a cohort study. PLoS ONE 2018, 13, e0190983. [Google Scholar] [CrossRef]
- Tariku, A.; Bikis, G.A.; Woldie, H.; Wassie, M.M.; Worku, A.G. Child wasting is a severe public health problem in the predominantly rural population of Ethiopia: A community based cross–sectional study. Arch. Public Health 2017, 75, 26. [Google Scholar] [CrossRef] [Green Version]
- Mulu, N.; Mohammed, B.; Woldie, H.; Shitu, K. Determinants of stunting and wasting in street children in Northwest Ethiopia: A community-based study. Nutrition 2022, 94, 111532. [Google Scholar] [CrossRef] [PubMed]
- Anato, A. Predictors of wasting among children under-five years in largely food insecure area of north Wollo, Ethiopia: A cross-sectional study. J. Nutr. Sci. 2002, 11, e8. [Google Scholar] [CrossRef] [PubMed]
- Derso, T.; Tariku, A.; Biks, G.A.; Wassie, M.M. Stunting, wasting and associated factors among children aged 6–24 months in Dabat health and demographic surveillance system site: A community based cross-sectional study in Ethiopia. BMC Pediatr. 2017, 17, 96. [Google Scholar] [CrossRef] [PubMed]
- Grimes, J.E.; Tadesse, G.; Gardiner, I.A.; Yard, E.; Wuletaw, Y.; Templeton, M.R.; Harrison, W.E.; Drake, L.J. Sanitation, hookworm, anemia, stunting, and wasting in primary school children in southern Ethiopia: Baseline results from a study in 30 schools. PLoS Negl. Trop. Dis. 2017, 11, e0005948. [Google Scholar] [CrossRef] [Green Version]
- Roba, A.A.; Assefa, N.; Dessie, Y.; Tolera, A.; Teji, K.; Elena, H.; Fawzi, W. Prevalence and determinants of concurrent wasting and stunting and other indicators of malnutrition among children 6–59 months old in Kersa, Ethiopia. Matern. Child Nutr. 2021, 17, e13172. [Google Scholar] [CrossRef]
- Woldeamanuel, B.T.; Tesfaye, T.T. Risk factors associated with under-five stunting, wasting, and underweight based on Ethiopian demographic health survey datasets in Tigray region, Ethiopia. J. Nutr. Metab. 2019, 2019, 6967170. [Google Scholar] [CrossRef] [Green Version]
- Jima, B.; Hassen, H.; Bahwere, P.; Gebreyesus, S. Diagnostic ability of mid-upper arm circumference-to-length ratio in detecting wasting among infants aged 1–6 months in Ethiopia. J. Nutr. Sci. 2022, 11, E23. [Google Scholar] [CrossRef]
- Teshome, B.; Kogi-Makau, W.; Getahun, Z.; Taye, G. Magnitude and determinants of stunting in children underfive years of age in food surplus region of Ethiopia: The case of west gojam zone. Ethiop. J. Health Dev. 2009, 23, 98–106. [Google Scholar] [CrossRef] [Green Version]
- Lisanu Mazengia, A.; Andargie Biks, G. Predictors of stunting among school-age children in Northwestern Ethiopia. J. Nutr. Metab. 2018, 2018, 7521751. [Google Scholar] [CrossRef] [Green Version]
- Berhanu, G.; Mekonnen, S.; Sisay, M. Prevalence of stunting and associated factors among preschool children: A community based comparative cross sectional study in Ethiopia. BMC Nutr. 2018, 4, 28. [Google Scholar] [CrossRef] [Green Version]
- Tasic, H.; Akseer, N.; Gebreyesus, S.H.; Ataullahjan, A.; Brar, S.; Confreda, E.; Conway, K.; Endris, B.S.; Bhutta, M.I.; Keats, E.; et al. Drivers of stunting reduction in Ethiopia: A country case study. Am. J. Clin. Nutr. 2020, 112 (Suppl. 2), 875S–893S. [Google Scholar] [CrossRef] [PubMed]
- Fantay Gebru, K.; Mekonnen Haileselassie, W.; Haftom Temesgen, A.; Oumer Seid, A.; Afework Mulugeta, B. Determinants of stunting among under-five children in Ethiopia: A multilevel mixed-effects analysis of 2016 Ethiopian demographic and health survey data. BMC Pediatr. 2019, 19, 176. [Google Scholar] [CrossRef] [PubMed] [Green Version]
- Afework, E.; Mengesha, S.; Wachamo, D. Stunting and associated factors among under-five-age children in West Guji Zone, Oromia, Ethiopia. J. Nutr. Metab. 2021, 2021, 8890725. [Google Scholar] [CrossRef] [PubMed]
- Muche, A.; Dewau, R. Severe stunting and its associated factors among children aged 6–59 months in Ethiopia; multilevel ordinal logistic regression model. Ital. J. Pediatr. 2021, 47, 161. [Google Scholar] [CrossRef] [PubMed]
- Tosheno, D.; Mehretie Adinew, Y.; Thangavel, T.; Bitew Workie, S. Risk factors of underweight in children aged 6–59 months in Ethiopia. J. Nutr. Metab. 2017, 2017, 6368746. [Google Scholar] [CrossRef] [Green Version]
- Nigatu, G.; Assefa Woreta, S.; Akalu, T.Y.; Yenit, M.K. Prevalence and associated factors of underweight among children 6–59 months of age in Takusa district, Northwest Ethiopia. Int. J. Equity Health 2018, 17, 106. [Google Scholar] [CrossRef] [Green Version]
- Fenta, H.M.; Tesfaw, L.M.; Derebe, M.A. Trends and determinants of underweight among under-five children in Ethiopia: Data from EDHS. Int. J. Pediatr. 2020, 2020, 3291654. [Google Scholar] [CrossRef]
- Degarege, A.; Erko, B. Association between intestinal helminth infections and underweight among school children in Tikur Wuha Elementary School, Northwestern Ethiopia. J. Infect. Public Health 2013, 6, 125–133. [Google Scholar] [CrossRef] [Green Version]
- Hailemariam, T.W.; Nekemte, E. Prevalence of underweight and its determinant factors of under two children in a rural area of Western Ethiopia. FSQM 2014, 31, 59–69. [Google Scholar]
- Tufa, E.G.; Dake, S.K.; Bekru, E.T.; Tekle, H.A.; Bobe, T.M.; Angore, B.N.; Solomon, F.B. Magnitude of wasting and underweight among children 6–59 months of age in Sodo Zuria District, South Ethiopia: A community based cross-sectional study. BMC Res. Notes 2018, 11, 790. [Google Scholar] [CrossRef]
- Desalegn, T.A.; Gebremedhin, S.; Stoecker, B.J. Effect of school feeding program on the anthropometric and haemoglobin status of school children in Sidama region, Southern Ethiopia: A prospective study. J. Nutr. Sci. 2022, 11, e69. [Google Scholar] [CrossRef] [PubMed]
- Mekonnen, Z.; Meka, S.; Zeynudin, A.; Suleman, S. Schistosoma mansoni infection and undernutrition among school age children in Fincha’a sugar estate, rural part of West Ethiopia. BMC Res. 2014, 7, 763. [Google Scholar] [CrossRef] [Green Version]
- Tulu, B.; Taye, S.; Zenebe, Y.; Amsalu, E. Intestinal Parasitic Infections and Nutritional Status among Primary School Children in Delomena District, South Eastern Ethiopia. Iran. J. Parasitol. 2016, 11, 549–558. [Google Scholar] [PubMed]
- Dinku, A.M.; Mekonnen, T.C.; Adilu, G.S. Child dietary diversity and food (in) security as a potential correlate of child anthropometric indices in the context of urban food system in the cases of north-central Ethiopia. J. Health Popul. Nutr. 2020, 39, 11. [Google Scholar] [CrossRef] [PubMed]
- Bitew, M.S.; Zewde, M.F.; Wubetu, M.; Alemu, A.A. Consumption of alcohol and binge drinking among pregnant women in Addis Ababa, Ethiopia: Prevalence and determinant factors. PLoS ONE 2020, 15, e0243784. [Google Scholar] [CrossRef]
- Statistical Agency C, International I. Ethiopia 2011 Demographic and Health Survey. Available online: https://dhsprogram.com/pubs/pdf/fr255/fr255.pdf (accessed on 28 February 2023).
- Tesfaye, G.; Demlew, D.; Habte, F.; Molla, G.; Kifle, Y.; Gebreegziabhier, G. The prevalence and associated factors of alcohol use among pregnant women attending antenatal care at public hospitals Addis Ababa, Ethiopia, 2019. BMC Psychiatry 2020, 20, 337. [Google Scholar]
- Abetew, M.M.; Alemu, A.A.; Zeleke, H.; Ayenew, A.A.; Aynalem, F.G.; Kassa, G.M.; Khajehei, M. Alcohol consumption and its determinants among pregnant women in Gozamin district, Amhara, Ethiopia, 2020. SAGE Open Med. 2022, 10, 1–10. [Google Scholar] [CrossRef]
- Anteab, K.; Demtsu, B.; Megra, M. Assessment of prevalence and associated factors of alcohol use during pregnancy among the dwellers of Bahir-Dar City, Northwest Ethiopia, 2014. Int. J. Pharma. Sci. Res. Assess. 2014, 5, 939–946. [Google Scholar]
- Addila, A.E.; Azale, T.; Gete, Y.K.; Yitayal, M. The effects of maternal alcohol consumption during pregnancy on adverse fetal outcomes among pregnant women attending antenatal care at public health facilities in Gondar town, Northwest Ethiopia: A prospective cohort study. Subst. Abuse: Treat. Prev. Policy 2021, 16, 64. [Google Scholar] [CrossRef]
- Tafere, G. A review on traditional fermented beverages of Ethiopian. J. Nat. Sci. Res. 2015, 5, 94–102. [Google Scholar]
- Tafese, Z.; Berhan, Y.; Stoecker, B.J. Tella intake among pregnant and lactating mothers: May it affect child growth? J. Nutr. Sci. 2022, 11, e42. [Google Scholar] [CrossRef] [PubMed]
- Eyasu, K.; Gebremariam, L.W.; Gebrearegay, F.; Hadush, Z.; Mulugeta, A. Community food beliefs during pregnancy in rural kebeles of Ofla Woreda, Northern Ethiopia: An explorative qualitative study. BMC Pregnancy Childb. 2022, 22, 256. [Google Scholar] [CrossRef] [PubMed]
- Debele, M.L.; Tolla, T.T.; Zekiros, B.K.; Abegaz, H.A.; Ayalew, M.Z. Societal and cultural norms that expose children to early alcohol use in Amhara Region rural community, Ethiopia. Acta Psychol. 2023, 232, 103801. [Google Scholar] [CrossRef] [PubMed]
- Sahiledengle, B.; Mwanri, L.; Agho, K.E. Association between maternal stature and household-level double burden of malnutrition: Findings from a comprehensive analysis of Ethiopian Demographic and Health Survey. J. Health Popul. Nutr. 2023, 42, 7. [Google Scholar] [CrossRef]
- Berbada, D.A.; Haidar, J.; Gebremichael, G.; Haftu, D. Magnitude of double burden of malnutrition and its associated factors among selected in-school adolescents: Evidence from South Ethiopia. Int. J. Nutr. Metab. 2017, 9, 30–37. [Google Scholar]
- Taklual, W.; Baye, S.; Mekie, M.; Andualem, T. Double burden of malnutrition among female adolescent students in Bahir Dar City, Amhara, Ethiopia. BioMed. Res. Int. 2020, 2020, 6249524. [Google Scholar] [CrossRef]
- Black, M.M.; Lutter, C.K.; Trude, A.C. All children surviving and thriving: Re-envisioning UNICEF’s conceptual framework of malnutrition. Lancet Glob. Health 2020, 8, e766–e767. [Google Scholar] [CrossRef]
- World Health Organization. Nurturing Care for Early Childhood Development: A Framework for Helping Children Survive and Thrive to Transform Health and Human Potential. Available online: https://apps.who.int/iris/bitstream/handle/10665/272604/WHO-FWC-MCA-18.02-eng.pdf (accessed on 28 February 2023).
- UNICEF. Strategy for Improved Nutrition of Children and Women in Developing Countries, New York. Indian J. Pediatr. 1991, 58, 13–24. [Google Scholar] [CrossRef]
- Lula, A.; Tsegaye, D.; Yoseph, H. Under nutrition and associated factors among adult on highly active antiretroviral therapy in Wolaita Sodo teaching and referral hospital, southern nations nationalities peoples region, Ethiopia. Int. J. Nutr. Metab. 2017, 9, 10–19. [Google Scholar] [CrossRef] [Green Version]
- An Evidence-Informed Policy Brief. Reducing Stunting in Ethiopia: “From Promise to Impact”. Available online: http://rackmintsys.com/ephi/wp-content/uploads/2014/04/B-Stunting-policy-brief-full-report-05-23-19.pdf (accessed on 28 February 2023).
- Kang, Y. Effectiveness of a Community-Based Participatory Nutrition Promotion Program to Improve Child Nutritional Status in Eastern Rural Ethiopia: A Cluster Randomized Trial. Doctoral Dissertation, Johns Hopkins University, Baltimore, MD, USA, 2015. Available online: https://www.proquest.com/docview/2332081742?pq-origsite=gscholar&fromopenview=true (accessed on 28 February 2023).
- Grantham-McGregor, S.M.; Fernald, L.C.; Kagawa, R.M.; Walker, S. Effects of inte-grated child development and nutrition interventions on child development and nutritional status. Ann. N. Y. Acad. Sci. 2014, 308, 11–32. [Google Scholar] [CrossRef]
- Prado, E.L.; Larson, L.M.; Cox, K.; Bettencourt, K.; Kubes, J.N.; Shankar, A.H. Do effects of early life interventions on linear growth correspond to effects on neurobehavioural development? A systematic review and meta-analysis. Lancet Glob. Health 2019, 7, e1398–e1413. [Google Scholar] [CrossRef] [PubMed] [Green Version]
- De Romana, D.L.; Greig, A.; Thompson, A.; Arabi, M. Successful delivery of nutrition programs and the sustainable development goals. Curr. Opin. Biotechnol. 2021, 70, 97–107. [Google Scholar] [CrossRef] [PubMed]


| Variable | n (%) | p-Value |
|---|---|---|
| Gender | ||
| Male | 48 (53.9) | 0.500 * |
| Female | 41 (46.1) | |
| Age (months) | ||
| 1–9 months | 23 (25.8) | 0.001 * |
| 10–16 months | 24 (27.0) | |
| 17–22 months | 25 (28.1) | |
| 23–28 months | 14 (15.7) | |
| ≥29 months | 3 (3.4) | |
| Male | 15.47 ± 6.98 months | 0.431 ** |
| Female | 15.29 ± 7.12 months | |
| Total | 15.39 ± 7.01 months | |
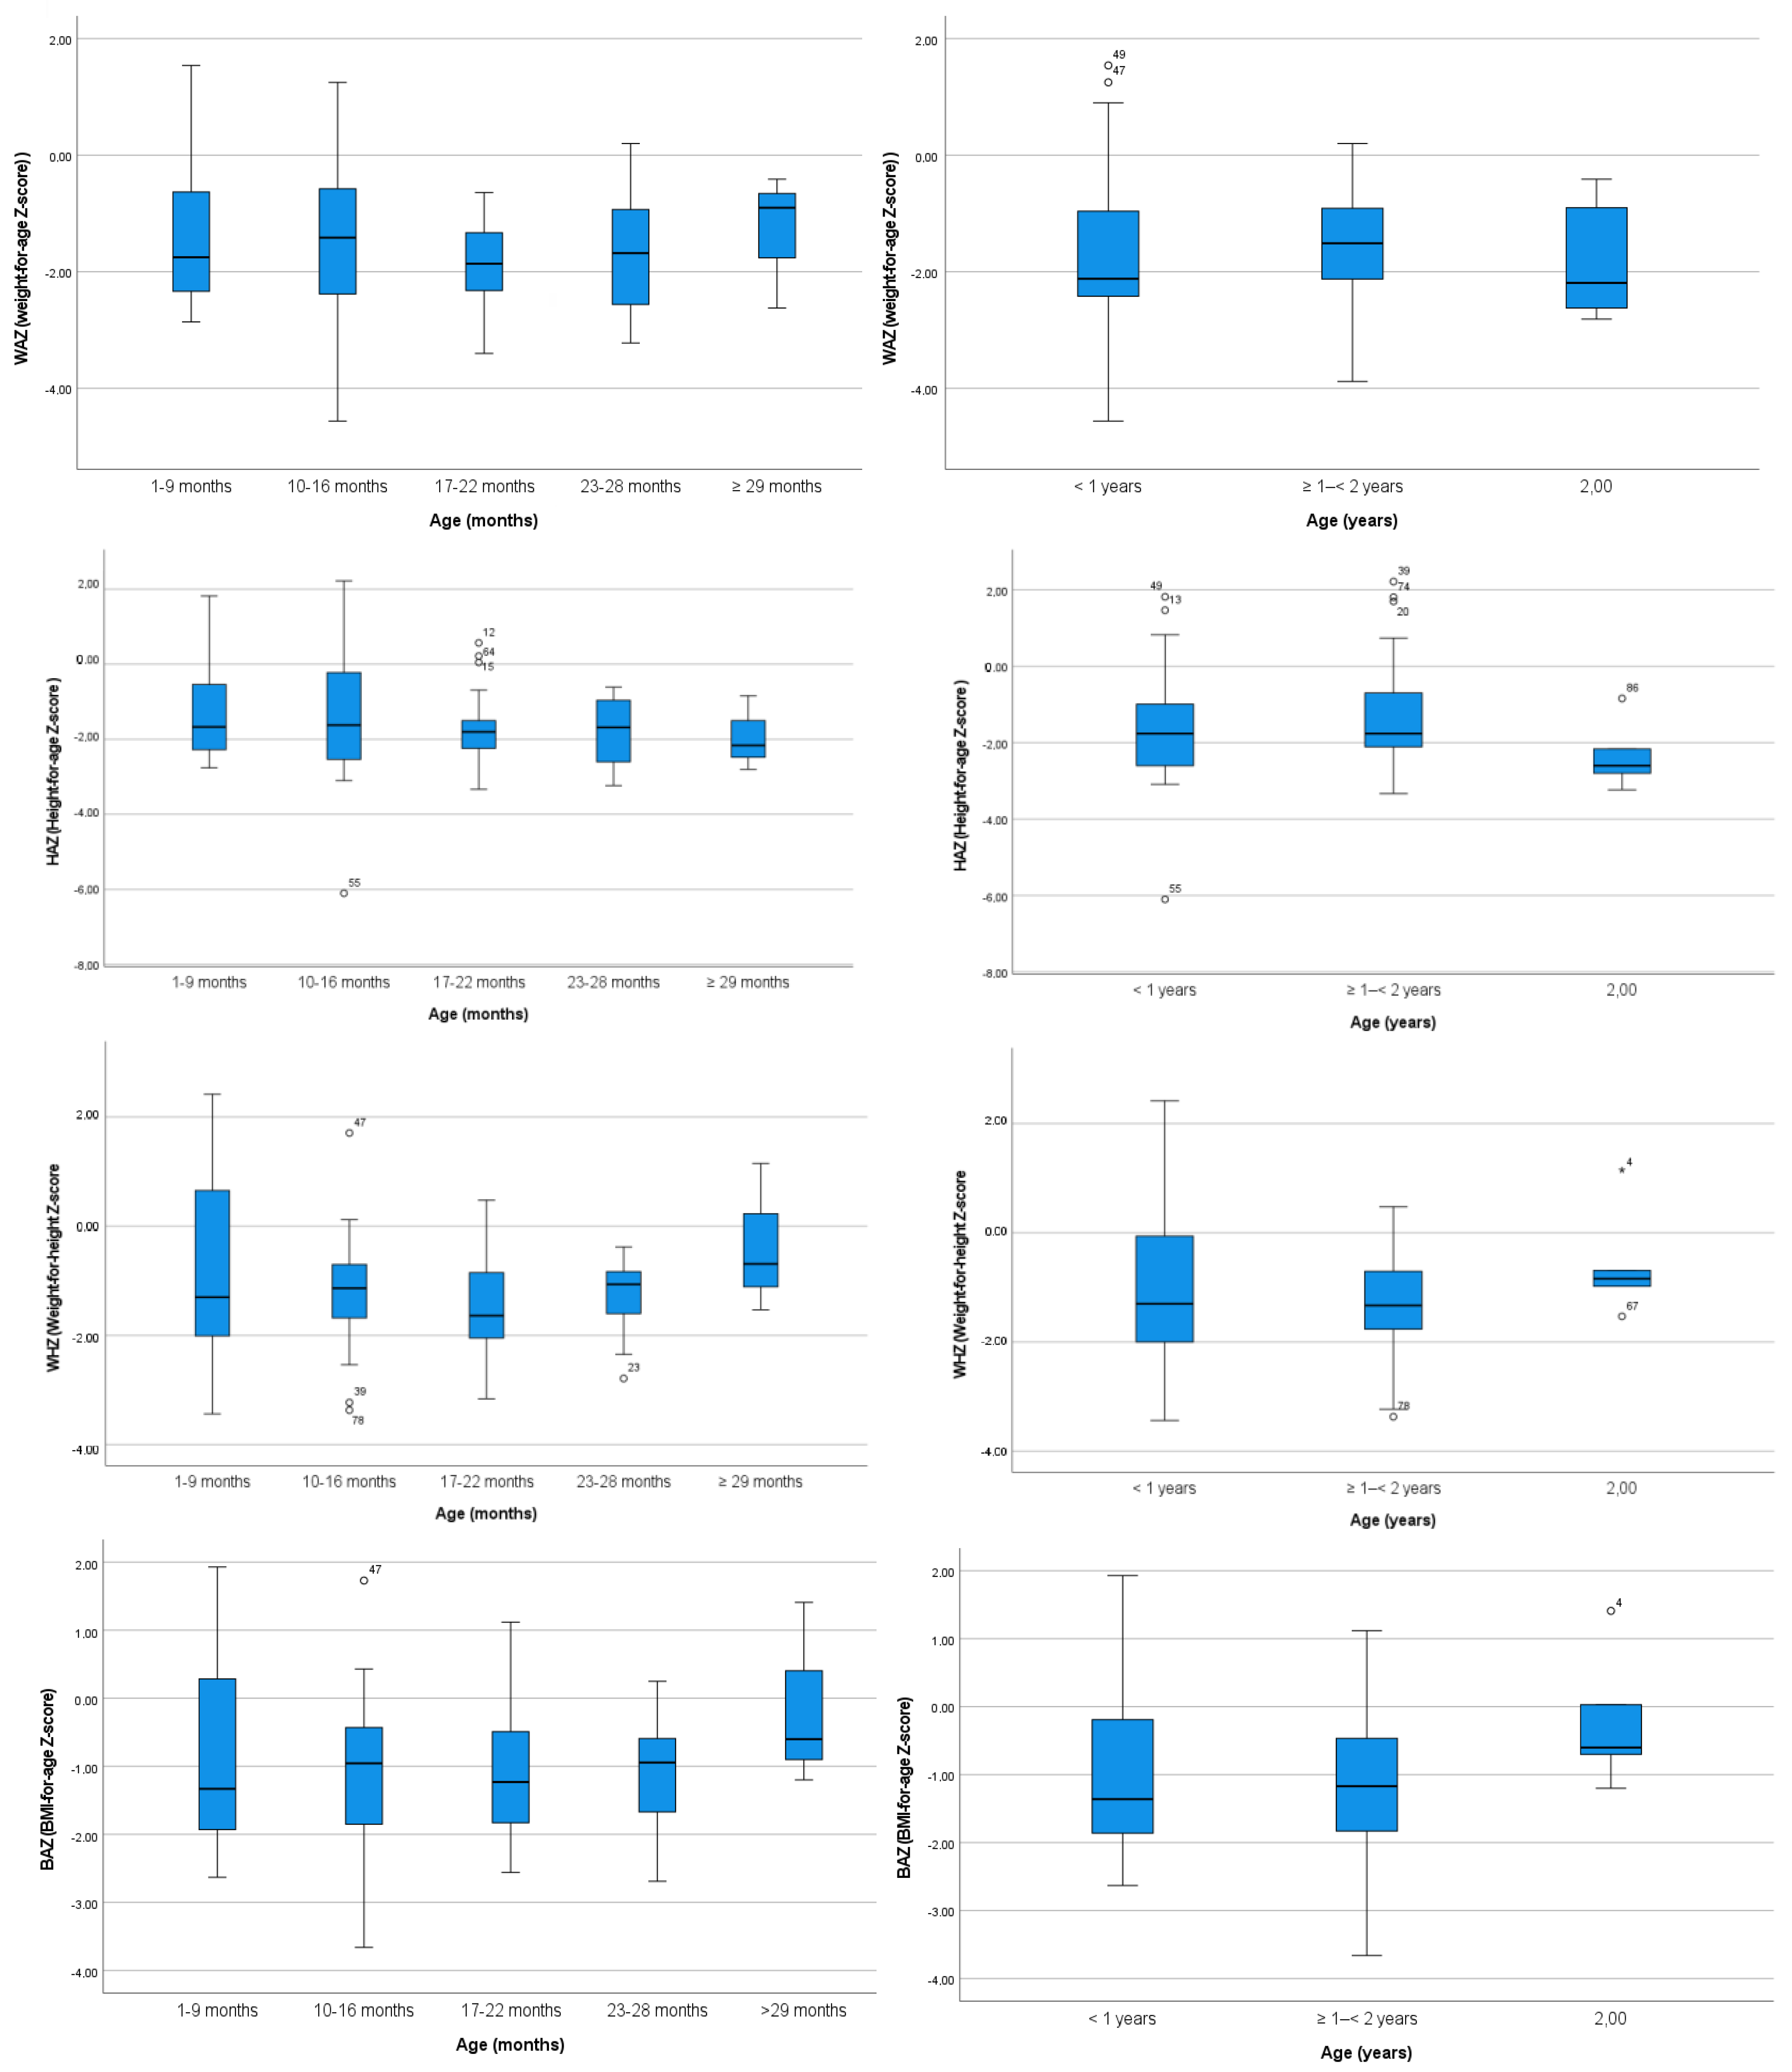
| Age | HAZ | WAZ | WHZ | BAZ | |
|---|---|---|---|---|---|
| 1–9 months | Mean | −1.28 | −1.39 | −0.73 | −0.82 |
| (N = 23) | Standard deviation | 1.35 | 1.17 | 1.64 | 1.45 |
| 10–16 months | Mean | −1.28 | −1.55 | −1.20 | −1.12 |
| (N = 24) | Standard deviation | 1.85 | 1.32 | 1.07 | 1.13 |
| 17–22 months | Mean | −1.74 | −1.85 | −1.38 | −1.08 |
| (N = 25) | Standard deviation | 0.94 | 0.72 | 0.95 | 1.02 |
| 23–28 months | Mean | −1.81 | −1.64 | −1.29 | −1.06 |
| (N = 14) | Standard deviation | 0.95 | 1.06 | 0.73 | 0.90 |
| >29 months | Mean | −1.93 | −1.31 | −0.35 | −0.13 |
| (N = 3) | Standard deviation | 0.99 | 1.16 | 1.37 | 1.36 |
| Total | Mean | −1.51 | −1.60 | −1.11 | −0.13 |
| (N = 89) | Standard deviation | 1.35 | 1.08 | 1.19 | 1.36 |
| p-value * | 0.555 | 0.685 | 0.268 | 0.623 |
| Age | HAZ | WAZ | WHZ | BAZ | |
|---|---|---|---|---|---|
| <1 year | Mean | −1.65 | −1.65 | −0.87 | −0.89 |
| (N = 33) | Standard deviation | 1.50 | 1.31 | 1.52 | 1.36 |
| 1–2 years | Mean | −1.34 | −1.55 | −1.20 | −1.13 |
| (N = 51) | Standard deviation | 1.26 | 1.55 | −1.32 | 1.01 |
| >2 years | Mean | −2.32 | −1.78 | −0.57 | −0.21 |
| (N = 5) | Standard deviation | 0.91 | 1.07 | 1.01 | 1.00 |
| Total | Mean | −1.51 | −1.60 | −1.11 | −0.99 |
| (N = 89) | Standard deviation | 1.35 | 1.08 | 1.19 | 1.16 |
| p-value * | 0.234 | 0.846 | 0.142 | 0.199 |
| Gender | Weight (kg) | Height/Length (cm) | HAZ | WAZ | WHZ | BAZ | |
|---|---|---|---|---|---|---|---|
| Female | Mean | 8.35 | 73.50 | −1.17 | −1.28 | −0.87 | −0.80 |
| (N = 41) | Standard deviation | 1.53 | 7.53 | 1.28 | 0.94 | 1.23 | 1.25 |
| Male | Mean | 8.19 | 73.12 | −1.93 | −1.99 | −1.40 | −1.22 |
| (N = 48) | Standard deviation | 1.67 | 8.70 | 1.33 | 1.13 | 1.10 | 1.02 |
| Total | Mean | 8.27 | 73.33 | −1.52 | −1.60 | −1.12 | −1.00 |
| (N = 89) | Standard deviation | 1.59 | 8.05 | 1.35 | 1.08 | 1.20 | 1.16 |
Disclaimer/Publisher’s Note: The statements, opinions and data contained in all publications are solely those of the individual author(s) and contributor(s) and not of MDPI and/or the editor(s). MDPI and/or the editor(s) disclaim responsibility for any injury to people or property resulting from any ideas, methods, instructions or products referred to in the content. |
© 2023 by the authors. Licensee MDPI, Basel, Switzerland. This article is an open access article distributed under the terms and conditions of the Creative Commons Attribution (CC BY) license (https://creativecommons.org/licenses/by/4.0/).
Share and Cite
Olcina Simón, M.A.; Soriano, J.M.; Morales-Suarez-Varela, M. Assessment of Malnutrition among Children Presenting in a Nutrition Center in Gimbichu, Ethiopia. Children 2023, 10, 627. https://doi.org/10.3390/children10040627
Olcina Simón MA, Soriano JM, Morales-Suarez-Varela M. Assessment of Malnutrition among Children Presenting in a Nutrition Center in Gimbichu, Ethiopia. Children. 2023; 10(4):627. https://doi.org/10.3390/children10040627
Chicago/Turabian StyleOlcina Simón, M. Ascensión, Jose M. Soriano, and María Morales-Suarez-Varela. 2023. "Assessment of Malnutrition among Children Presenting in a Nutrition Center in Gimbichu, Ethiopia" Children 10, no. 4: 627. https://doi.org/10.3390/children10040627