

Time Duration of Post-Activation Performance Enhancement (PAPE) in Elite Male Sprinters with Different Strength Levels

 ,
,  and
and 
Abstract
:1. Introduction
2. Materials and Methods
2.1. Participants
2.2. Procedures
2.3. Data Collection and Analysis
2.4. Statistical Analysis
3. Results
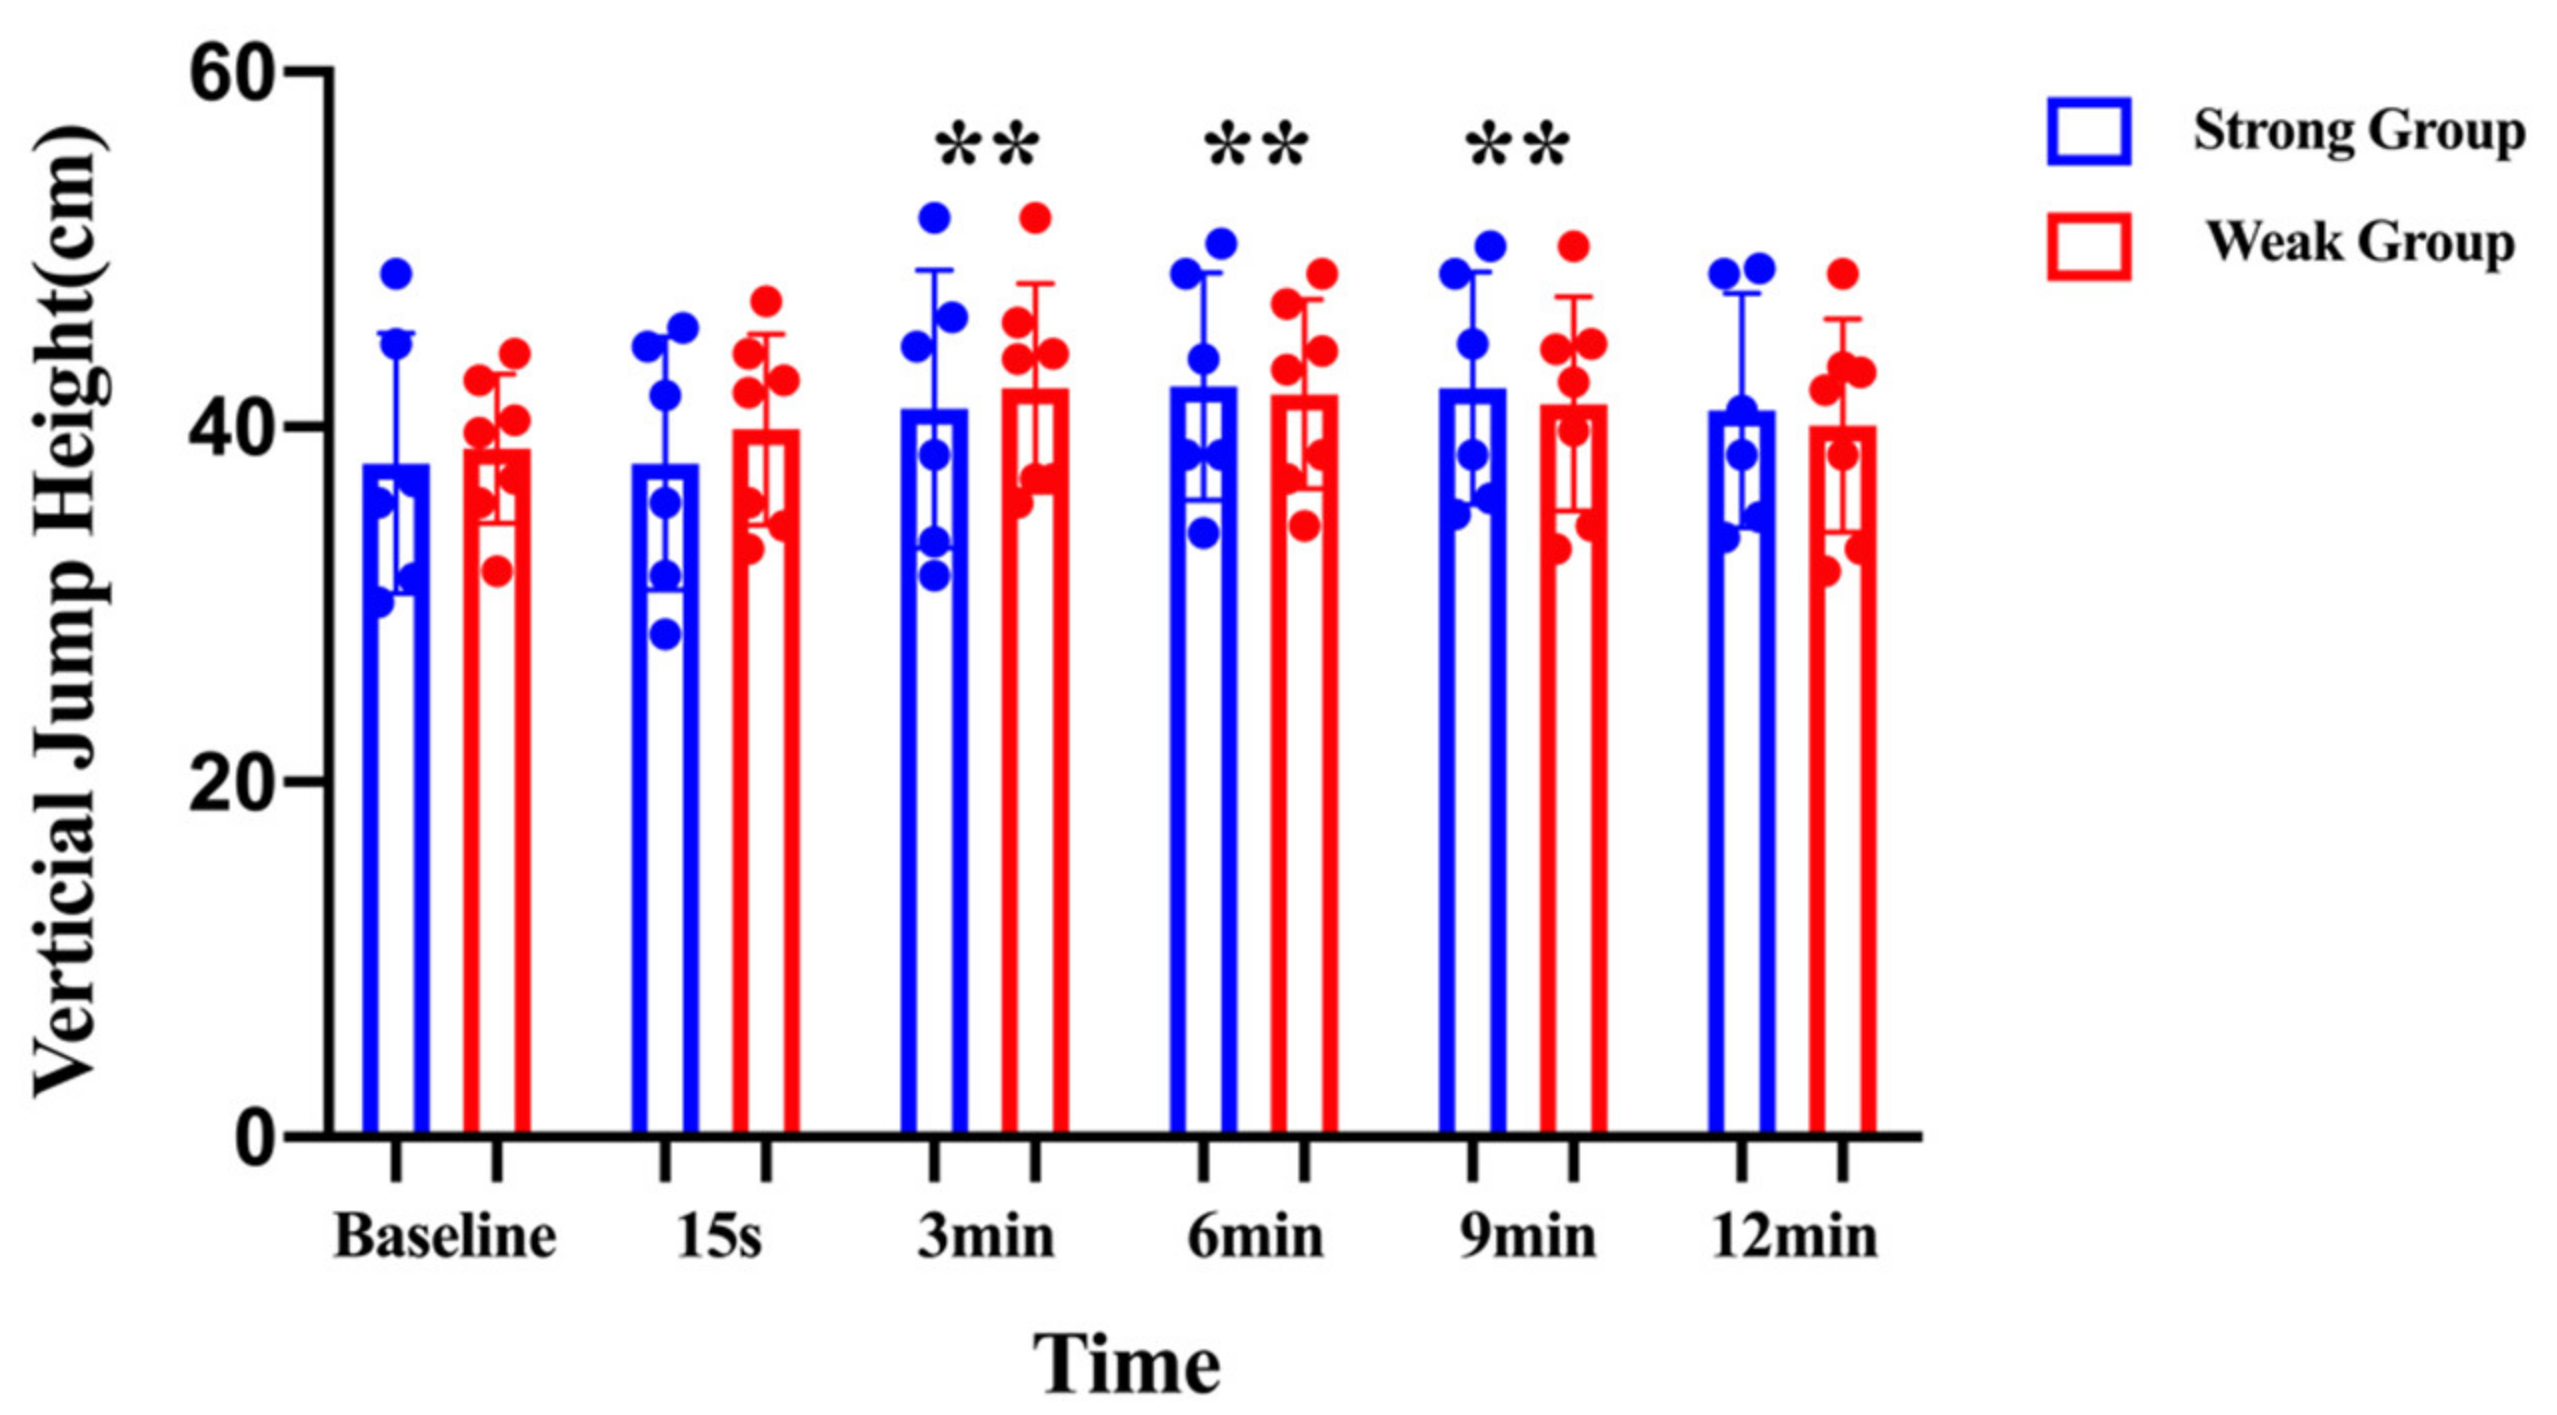
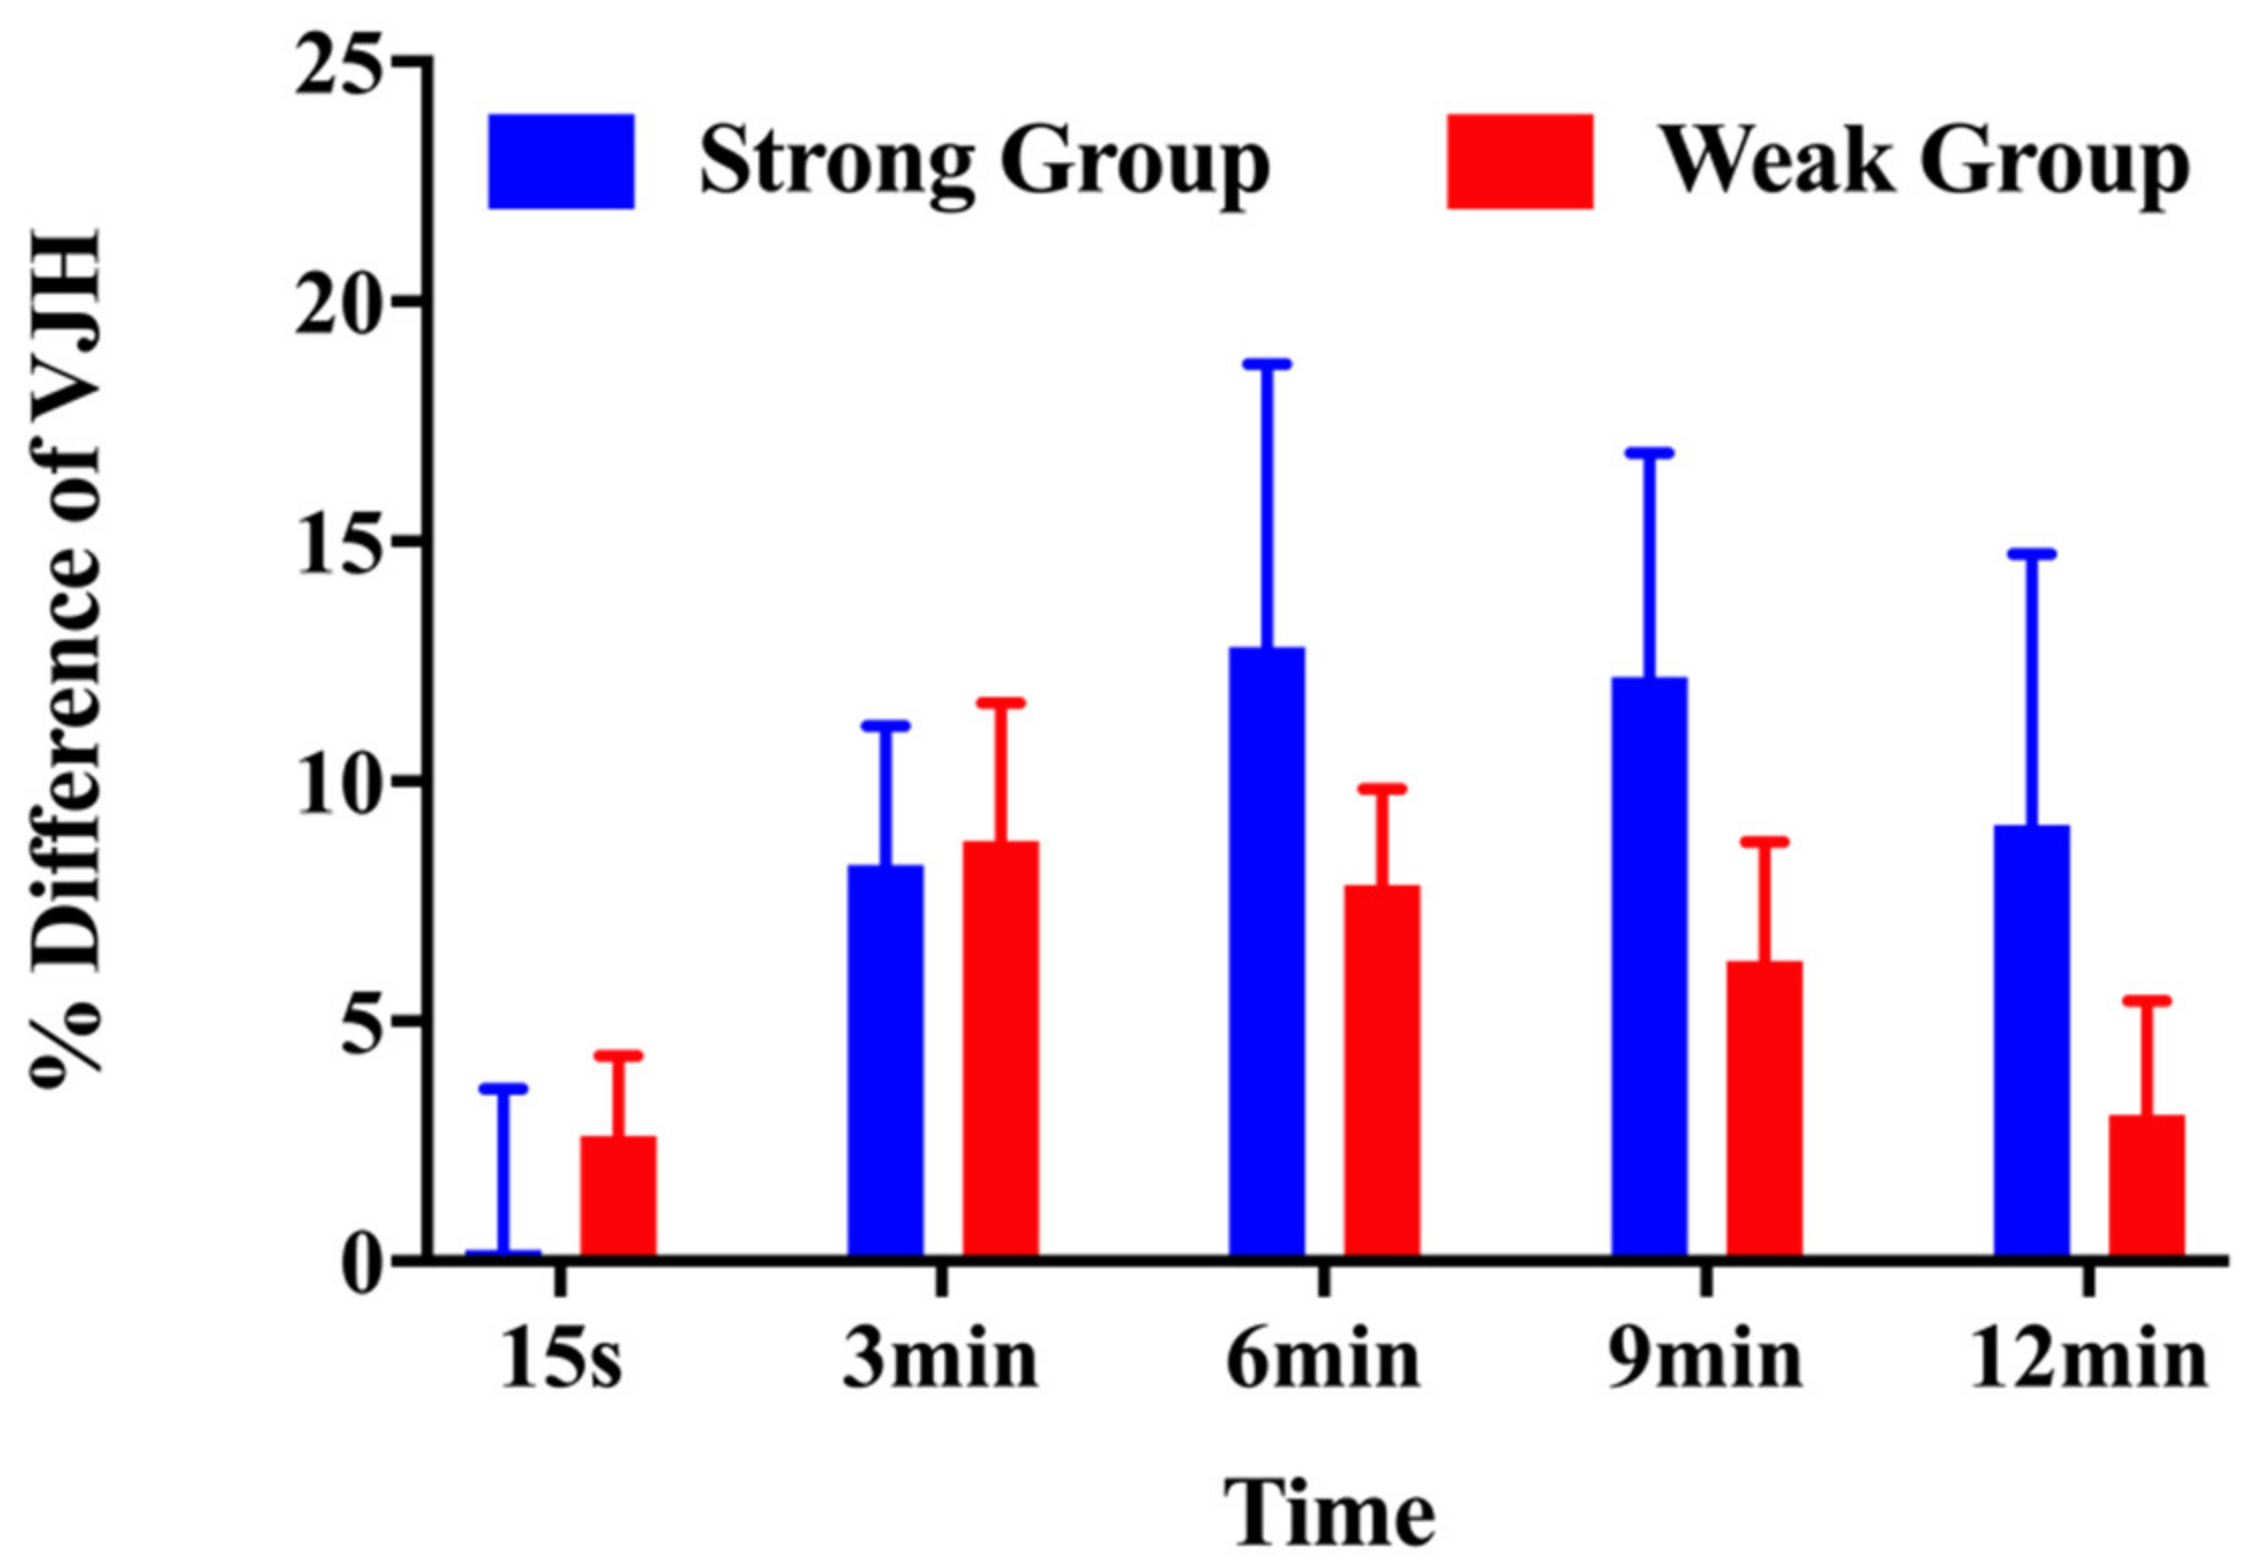
3.1. Vertical Jump Height
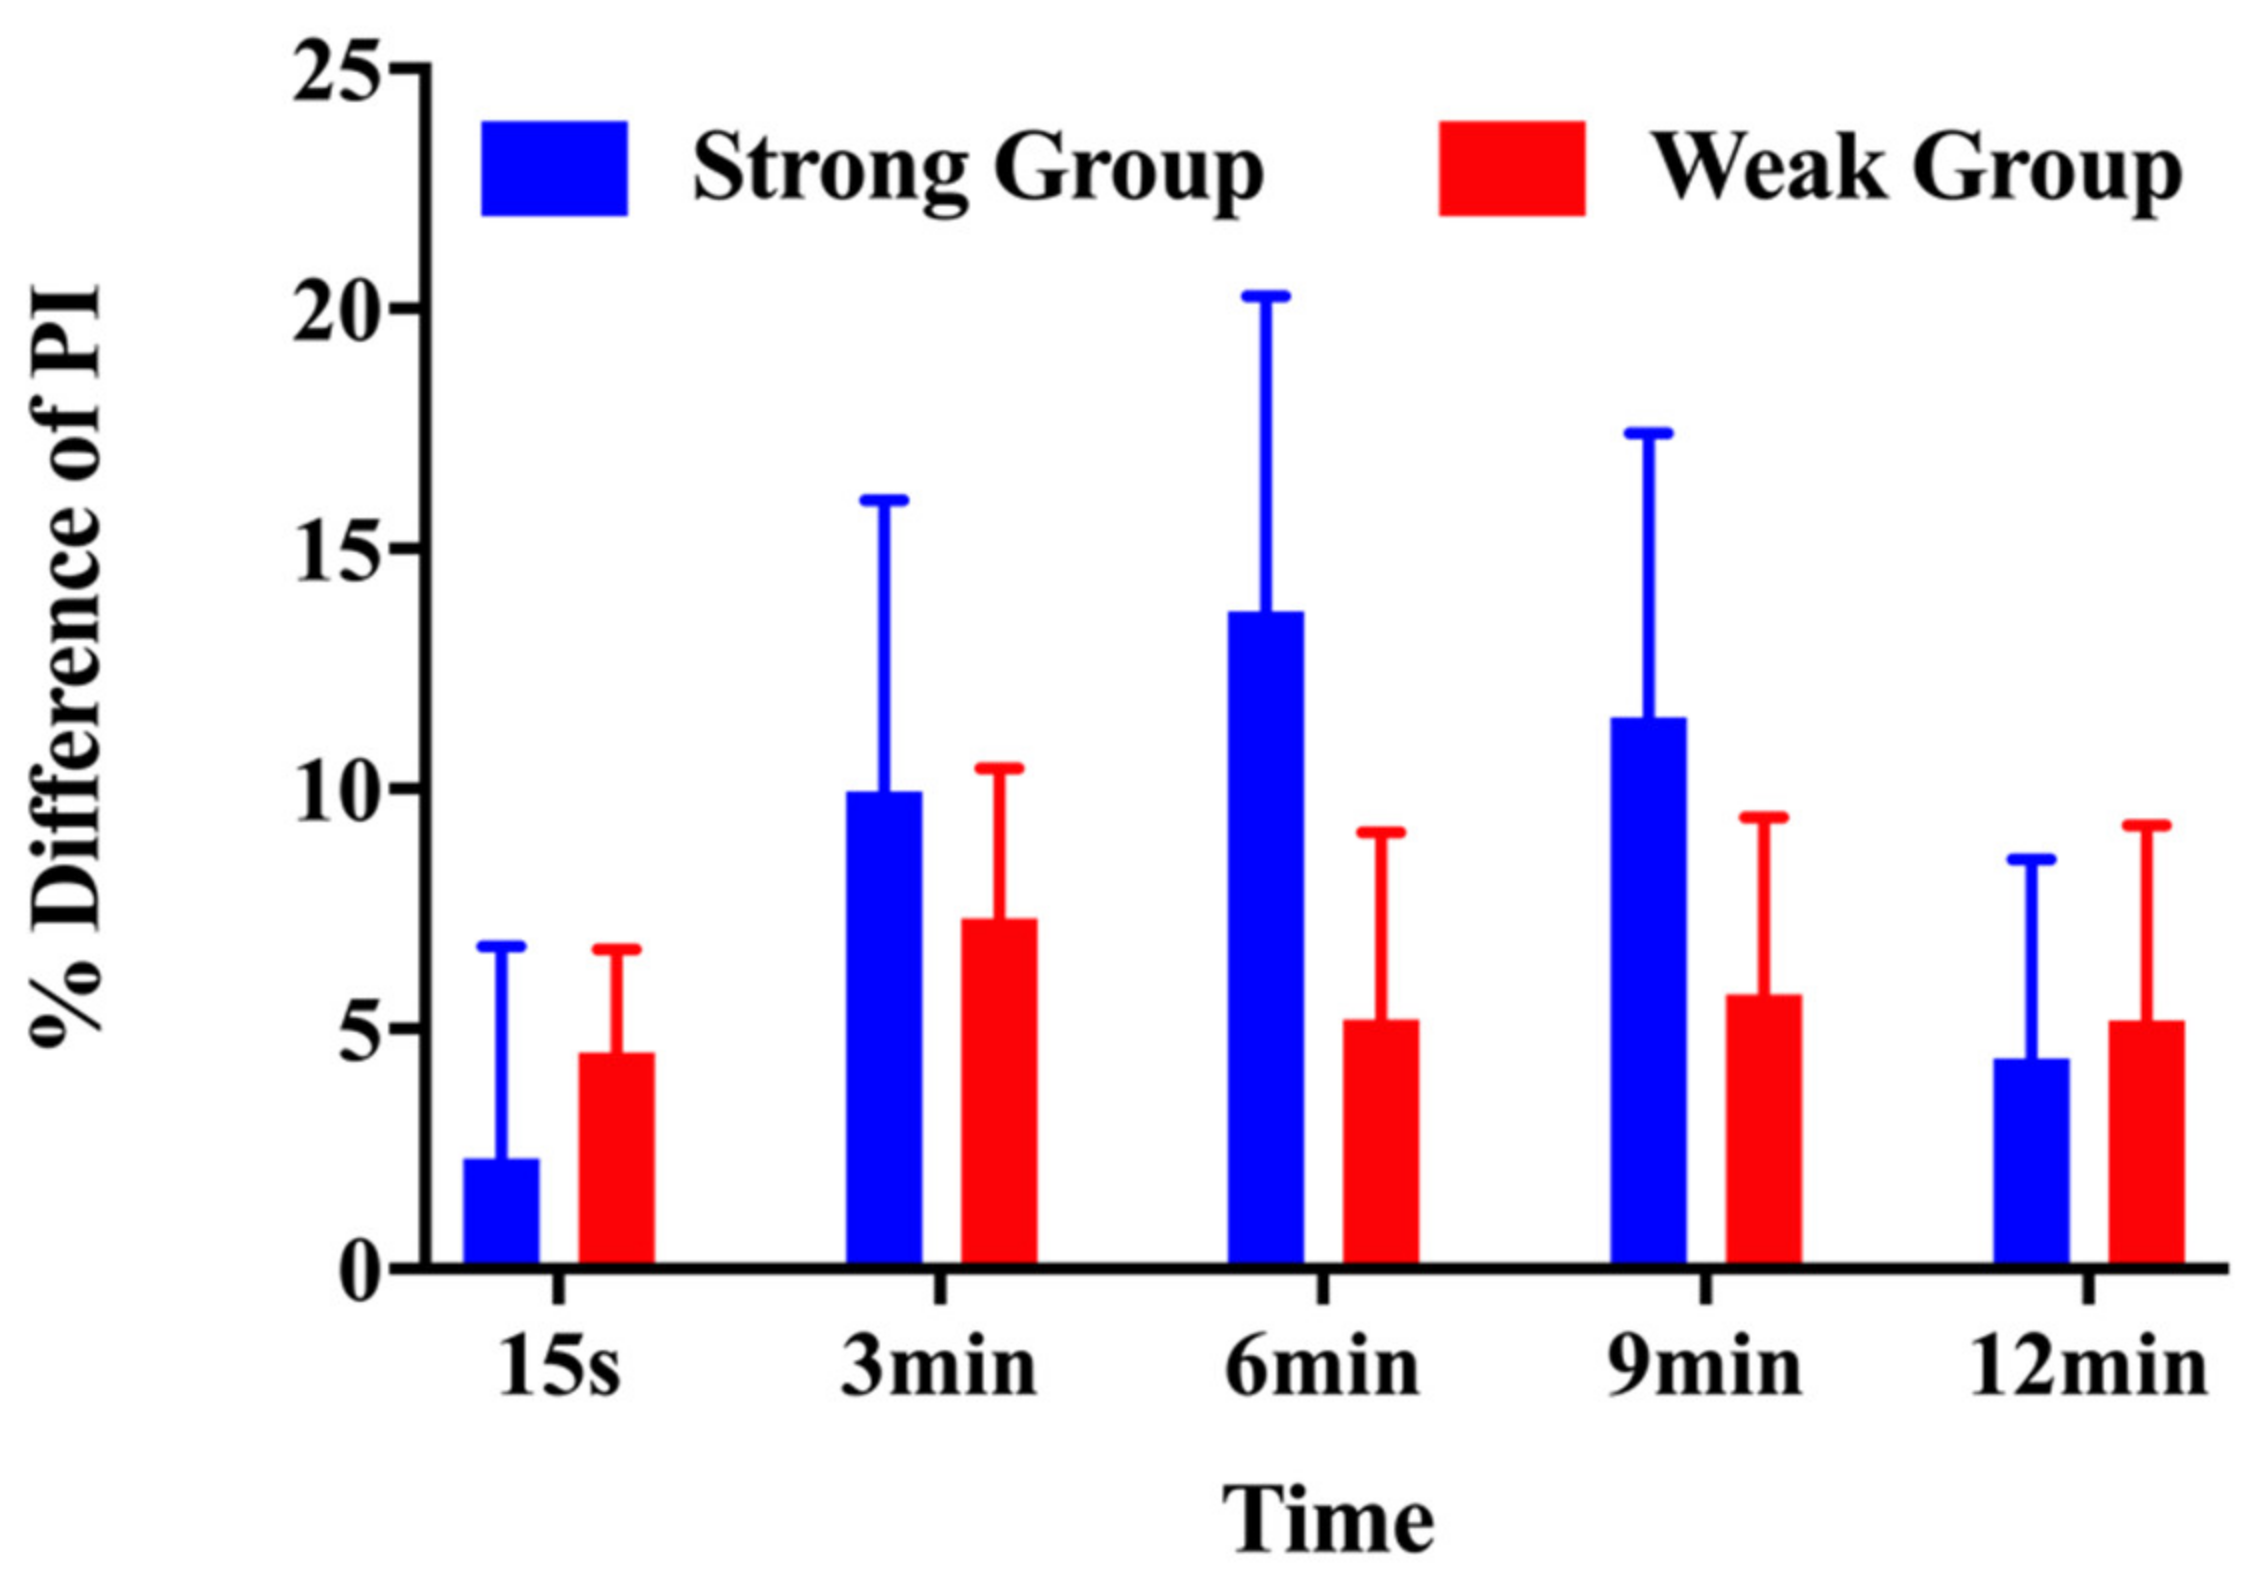
3.2. Peak Impulse
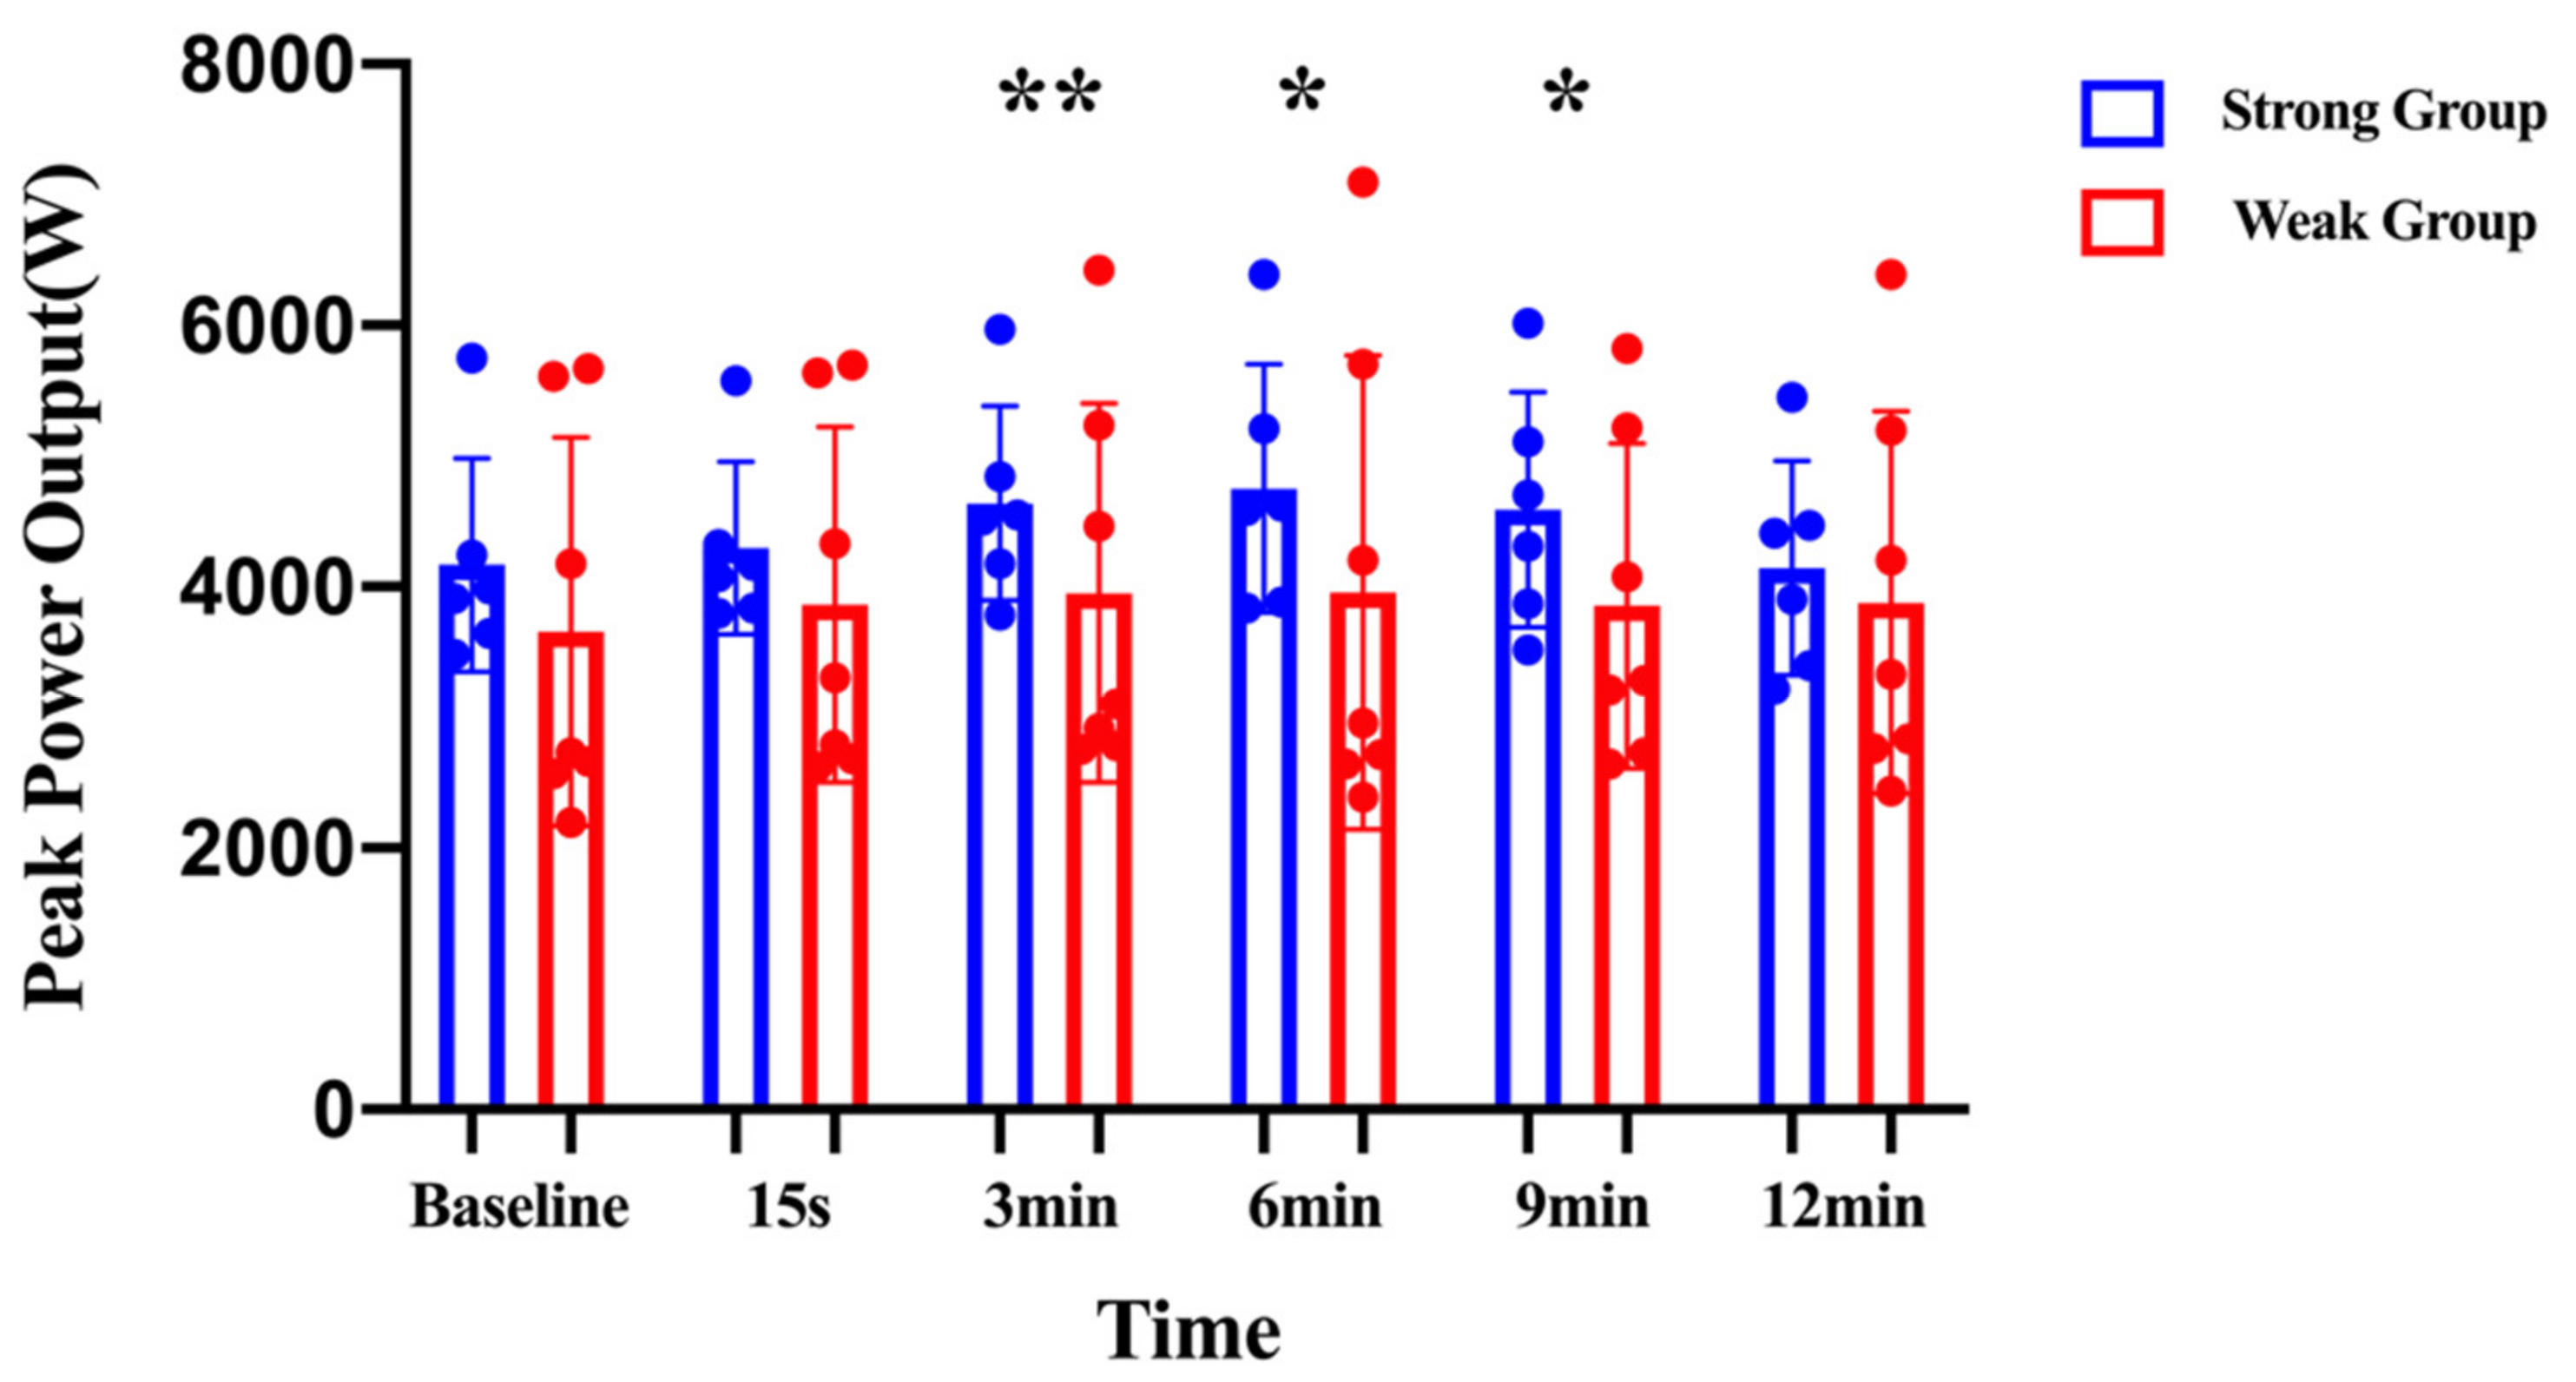
3.3. Peak Power
4. Discussion
5. Practical Applications
6. Perspective
7. Conclusions
Author Contributions
Funding
Institutional Review Board Statement
Data Availability Statement
Conflicts of Interest
References
- Prieske, O.; Behrens, M.; Chaabene, H.; Granacher, U.; Maffiuletti, N.A. Time to differentiate postactivation “Potentiation” from “Performance Enhancement” in the strength and conditioning community. Sport. Med. 2020, 50, 1559–1565. [Google Scholar] [CrossRef] [PubMed]
- Cuenca-Fernández, F.; Smith, I.C.; Jordan, M.J.; MacIntosh, B.R.; López-Contreras, G.; Arellano, R.; Herzog, W. Nonlocalized post-activation performance enhancement (PAPE) effects in trained athletes: A pilot study. Appl. Physiol. Nutr. Metab. 2017, 42, 1122–1125. [Google Scholar] [CrossRef] [PubMed]
- Zimmermann, H.B.; MacIntosh, B.R.; Pupo, J.D. Does postactivation potentiation (PAP) increase voluntary performance? Appl. Physiol. Nutr. Metab. 2020, 45, 349–356. [Google Scholar] [CrossRef] [PubMed]
- Sañudo, B.; Hoyo, M.D.; Haff, G.G.; Muñoz-López, A. Influence of strength level on the acute post-activation performance enhancement following flywheel and free weight resistance training. Sensors 2020, 20, 7156. [Google Scholar] [CrossRef]
- Blazevich, A.J.; Babault, N. Post-activation potentiation versus post-activation performance enhancement in humans: Historical perspective, underlying mechanisms, and current issues. Front. Physiol. 2019, 10, 1359. [Google Scholar] [CrossRef] [Green Version]
- Krzysztofik, M. Utilisation of post-activation performance enhancement in elderly adults. J. Clin. Med. 2021, 10, 2483. [Google Scholar] [CrossRef]
- Escobar Hincapié, A.; Agudelo Velásquez, C.A.; Ortiz Uribe, M.; García Torres, C.A.; Rojas Jaramillo, A. Unilateral and bilateral post-activation performance enhancement on jump performance and agility. Int. J. Environ. Res. Public Health 2021, 18, 10154. [Google Scholar] [CrossRef]
- Gourgoulis, V.; Aggeloussis, N.; Kasimatis, P.; Mavromatis, G.; Garas, A. Effect of a submaximal half-squats warm-up program on vertical jumping ability. J. Strength Cond. Res. 2003, 17, 342–344. [Google Scholar] [CrossRef]
- Doma, K.; Leicht, A.S.; Boullosa, D.; Woods, C.T. Lunge exercises with blood-flow restriction induces post-activation potentiation and improves vertical jump performance. Eur. J. Appl. Physiol. 2020, 120, 687–695. [Google Scholar] [CrossRef]
- Krzysztofik, M.; Wilk, M.; Stastny, P.; Golas, A. Post-activation performance enhancement in the bench press throw: A systematic review and meta-analysis. Front. Physiol. 2021, 11, 598628. [Google Scholar] [CrossRef]
- Dolan, M.; Sevene, T.G.; Berninig, J.; Harris, C.; Climstein, M.; Adams, K.J.; DeBeliso, M. Post-activation potentiation and the shot put throw. Int. J. Sport. Sci. 2017, 7, 170–176. [Google Scholar] [CrossRef]
- Tsoukos, A.; Brown, L.E.; Veligekas, P.; Terzis, G.; Bogdanis, G.C. Postactivation potentiation of bench press throw performance using velocity-based conditioning protocols with low and moderate loads. J. Hum. Kinet. 2019, 68, 81–98. [Google Scholar] [CrossRef] [PubMed] [Green Version]
- Carbone, L.; Garzón, M.; Chulvi-Medrano, I.; Bonilla, D.A.; Alonso, D.A.; Benítez-Porres, J.; Petro, J.; Vargas-Molina, S. Effects of heavy barbell hip thrust vs back squat on subsequent sprint performance in rugby players. Biol. Sport 2020, 37, 325–331. [Google Scholar] [CrossRef] [PubMed]
- Sanchez-Sanchez, J.; Rodriguez, A.; Petisco, C.; Ramirez-Campillo, R.; Martínez, C.; Nakamura, F.Y. Effects of different post-activation potentiation warm-ups on repeated sprint ability in soccer players from different competitive levels. J. Hum. Kinet. 2018, 61, 189–197. [Google Scholar] [CrossRef] [PubMed] [Green Version]
- Oliveira, J.; Salles, A.; Barbosa, C.; Silva, J.; Silva, A. Effect of post-activation potentiation and carbohydrate mouth rise on repeated sprint ability in university futsal players. J. Exerc. Physiol. Online 2020, 23, 29–40. Available online: https://www.researchgate.net/publication/340449340 (accessed on 1 November 2022).
- Orjalo, A.J.; Callaghan, S.J.; Lockie, R.G. The effects of the barbell hip thrust on post-activation performance enhancement of change of direction speed in college-aged men and women. Sports 2020, 8, 151. [Google Scholar] [CrossRef]
- Ying, S.S.; Aziz, A.R.; Lee, M. An attempt to induce postactivation potentiation to improve kayak sprint performance using an on-water kayak-specific warm up. J. Mech. Med. Biol. 2020, 20, 2050026. [Google Scholar] [CrossRef]
- Kilduff, L.P.; Cunningham, D.J.; Owen, N.J.; West, D.J.; Bracken, R.M.; Cook, C.J. Effect of postactivation potentiation on swimming starts in international sprint swimmers. J. Strength Cond. Res. 2011, 25, 2418–2423. [Google Scholar] [CrossRef]
- Krzysztofik, M.; Wilk, M.; Golas, A.; Lockie, R.G.; Maszczyk, A.; Zajac, A. Does eccentric-only and concentric-only activation increase power output? Med. Sci. Sport. Exerc. 2020, 52, 484–489. [Google Scholar] [CrossRef]
- Ebben, W.P.; Watts, P.B. A review of combined weight training and plyometric training modes: Complex training. Strength Cond. J. 1998, 20, 18–27. [Google Scholar] [CrossRef]
- Dinsdale, A.J.; Bissas, A. Eliciting postactivation potentiation with hang cleans depends on the recovery duration and the individual’s 1 repetition maximum strength. J. Strength Cond. Res. 2021, 35, 1817–1824. [Google Scholar] [CrossRef] [PubMed]
- Güllich, A.; Schmidtleicher, D. MVC-induced short term potentiation of explosive force. New Stud. Athl. 1996, 11, 67–81. Available online: https://www.researchgate.net/publication/235959534 (accessed on 1 November 2022).
- Bevan, H.R.; Cunningham, D.J.; Tooley, E.P.; Owen, N.J.; Cook, C.J.; Kilduff, L.P. Influence of postactivation potentiation on sprinting performance in professional rugby players. J. Strength Cond. Res. 2010, 24, 701–705. [Google Scholar] [CrossRef] [PubMed]
- Rassier, D.E.; Macintosh, B.R. Coexistence of potentiation and fatigue in skeletal muscle. Braz. J. Med. Biol. Res. 2000, 33, 499–508. [Google Scholar] [CrossRef] [PubMed] [Green Version]
- Maroto-Izquierdo, S.; Bautista, I.J.; Martín Rivera, F. Post-activation performance enhancement (PAPE) after a single bout of high-intensity flywheel resistance training. Biol. Sport 2020, 37, 343–350. [Google Scholar] [CrossRef] [PubMed]
- Ciocca, G.; Tschan, H.; Tessitore, A. Effects of post-activation performance enhancement (PAPE) induced by a plyometric protocol on deceleration performance. J. Hum. Kinet. 2021, 80, 5–16. [Google Scholar] [CrossRef]
- Min, K.E.; Lee, Y.S.; Park, J. Changes in spinal-reflex excitability during static stretch and/or explosive contraction. Appl. Sci. 2021, 11, 2830. [Google Scholar] [CrossRef]
- Jo, E.; Judelson, D.A.; Brown, L.E.; Coburn, J.W.; Dabbs, N.C. Influence of recovery duration after a potentiating stimulus on muscular power in recreationally trained individuals. J. Strength Cond. Res. 2010, 24, 343–347. [Google Scholar] [CrossRef]
- Bogdanis, G.C.; Tsoukos, A.; Veligekas, P.; Tsolakis, C.; Terzis, G. Effects of muscle action type with equal impulse of conditioning activity on postactivation potentiation. J. Strength Cond. Res. 2014, 28, 2521–2528. [Google Scholar] [CrossRef]
- Evetovich, T.K.; Conley, D.S.; McCawley, P.F. Postactivation potentiation enhances upper-and lower-body athletic performance in collegiate male and female athletes. J. Strength Cond. Res. 2015, 29, 336–342. [Google Scholar] [CrossRef]
- Beato, M.; Bigby, A.; Keijzer, K.; Nakamura, F.Y.; Coratella, G.; Mcerlain-Naylor, S.A. Post-activation potentiation effect of eccentric overload and traditional weightlifting exercise on jumping and sprinting performance in male athletes. PLoS ONE 2019, 14, e0222466. [Google Scholar] [CrossRef] [PubMed] [Green Version]
- Fletcher, I.M. An investigation into the effect of a pre-performance strategy on jump performance. J. Strength Cond. Res. 2013, 27, 107–115. [Google Scholar] [CrossRef] [PubMed]
- Young, W.B.; Jenner, A.; Griffiths, K. Acute enhancement of power performance from heavy load squats. J. Strength Cond. Res. 1998, 12, 82–84. [Google Scholar] [CrossRef]
- Jones, P.; Lees, A. A biomechanical analysis of the acute effects of complex training using lower limb exercises. J. Strength Cond. Res. 2003, 17, 694–700. [Google Scholar] [CrossRef] [PubMed]
- Khamoui, A.V.; Brown, L.E.; Coburn, J.W.; Judelson, D.A.; Uribe, B.P.; Nguyen, D.; Tran, T.; Eurich, A.D.; Noffal, G.J. Effect of potentiating exercise volume on vertical jump parameters in recreationally trained men. J. Strength Cond. Res. 2009, 23, 1465–1469. [Google Scholar] [CrossRef] [PubMed]
- Seitz, L.B.; Villarreal, E.S.; Haff, G.G. The temporal profile of postactivation potentiation is related to strength level. J. Strength Cond. Res. 2014, 28, 706–715. [Google Scholar] [CrossRef]
- Thorstensson, A.; Grimby, G.; Karlsson, J. Force-velocity relations and fibre composition in human knee extensor muscles. J. Appl. Physiol. 1976, 40, 12–16. [Google Scholar] [CrossRef]
- Maughan, R.J.; Watson, J.S.; Weir, J. Relationships between muscle strength and muscle cross-sectional area in male sprinters and endurance runners. Eur. J. Appl. Physiol. Occup. Physiol. 1983, 50, 309–318. [Google Scholar] [CrossRef]
- Aagaard, P.; Andersen, J.L. Correlation between contractile strength and myosin heavy chain isoform composition in human skeletal muscle. Med. Sci. Sport. Exerc. 1998, 30, 1217–1222. [Google Scholar] [CrossRef]
- Hamada, T.; Sale, D.G.; MacDougall, J.D.; Tarnopolsky, M.A. Interaction of fibre type, potentiation and fatigue in human knee extensor muscles. Acta Physiol. Scand. 2010, 178, 165–173. [Google Scholar] [CrossRef]
- Baechle, T.R.; Earle, R.W.; National Strength and Conditioning Association. Essentials of Strength Training and Conditioning, 3rd ed.; Human Kinetics: Champaign, IL, USA, 2008. [Google Scholar] [CrossRef]
- French, D.N.; Kraemer, W.J.; Cooke, C.B. Changes in dynamic exercise performance following a sequence of preconditioning isometric muscle actions. J. Strength Cond. Res. 2003, 17, 678–685. [Google Scholar] [CrossRef] [PubMed]
- Haff, G.G.; Stone, M.; O’Bryant, H.S.; Harman, E.; Dinan, C.; Johnson, R.; Han, K.-H. Force-time dependent characteristics of dynamic and isometric muscle actions. J. Strength Cond. Res. 1997, 11, 269–272. [Google Scholar] [CrossRef]
- Sayers, S.P.; Harackiewicz, D.V.; Harman, E.A.; Frykman, P.N.; Rosenstein, M.T. Cross-validation of three jump power equations. Med. Sci. Sport. Exerc. 1999, 31, 572–577. [Google Scholar] [CrossRef]
- Kilduff, L.P.; Bevan, H.R.; Kingsley, M.I.; Owen, N.J.; Bennett, M.A.; Bunce, P.J.; Hore, A.M.; Maw, J.R.; Cunningham, D.J. Postactivation potentiation in professional rugby players: Optimal recovery. J. Strength Cond. Res. 2007, 21, 1134–1138. [Google Scholar] [CrossRef] [PubMed]
- Crum, A.J.; Kawamori, N.; Stone, M.H.; Haff, G.G. The acute effects of moderately loaded concentric-only quarter squats on vertical jump performance. J. Strength Cond. Res. 2012, 26, 914–925. [Google Scholar] [CrossRef]
- Mola, J.N.; Bruce-Low, S.S.; Burnet, S.J. Optimal recovery time for postactivation potentiation in professional soccer players. J. Strength Cond. Res. 2014, 28, 1529–1537. [Google Scholar] [CrossRef]
- Dugan, E.L.; Doyle, T.L.; Humphries, B.; Hasson, C.J.; Newton, R.U. Determining the optimal load for jump squats: A review of methods and calculations. J. Strength Cond. Res. 2004, 18, 668–674. [Google Scholar] [CrossRef]
- Cohen, J. Eta-squared and partial eta-squared in fixed factor ANVOA designs. Educ. Psychol. Meas. 2016, 33, 107–112. [Google Scholar] [CrossRef]
- Villalon-Gasch, L.; Penichet-Tomas, A.; Sebastia-Amat, S.; Pueo, B.; Jimenez-Olmedo, J.M. Postactivation performance enhancement (PAPE) increases vertical jump in elite female volleyball players. Int. J. Environ. Res. Public Health 2022, 19, 462. [Google Scholar] [CrossRef]
- Krzysztofik, M.; Matykiewicz, P.; Celebanska, D.; Jarosz, J.; Gawel, E.; Zwierzchowska, A. The acute post-activation performance enhancement of the bench press throw in disabled sitting volleyball athletes. Int. J. Environ. Res. Public Health 2021, 18, 3818. [Google Scholar] [CrossRef]
- Crewther, B.T.; Kilduff, L.P.; Cook, C.J.; Middleton, M.K.; Bunce, P.J.; Yang, G.Z. The acute potentiating effects of back squats on athlete performance. J. Strength Cond. Res. 2011, 25, 3319–3325. [Google Scholar] [CrossRef] [PubMed]
- Wilson, J.M.; Duncan, N.M.; Marin, P.J.; Brown, L.; Loenneke, J.P.; Wilson, S.M.; Jo, E.; Lowery, R.P.; Ugrinowitsch, C. Meta-analysis of postactivation potentiation and power: Effects of conditioning activity, volume, gender, rest periods, and training status. J. Strength Cond. Res. 2013, 27, 854–859. [Google Scholar] [CrossRef] [PubMed]
- Pojskic, H.; Pagaduan, J.; Uzicanin, E.; Babajic, F.; Muratovic, M.; Tomljanovic, M. Acute effects of loaded whole body vibration training on performance. Asian J. Sport. Med. 2015, 6, e24054. [Google Scholar] [CrossRef] [PubMed] [Green Version]
- Seitz, L.B.; Haff, G.G. Factors modulating post-activation potentiation of jump, sprint, throw, and upper-body ballistic performances: A systematic review with meta-analysis. Sports. Med. 2016, 46, 231–240. [Google Scholar] [CrossRef] [PubMed]
- Simion, G. Constatative study on the level of physical training of u19 junior footballers in Romania. Bull. Transilv. Univ. Braşov Ser. IX Sci. Hum. Kinet. 2020, 13, 79–84. [Google Scholar] [CrossRef]
- Simion, G. The effects of using small-sided games on the development of endurance in elite youth football players (U17). Bull. Transilv. Univ. Braşov Ser. IX Sci. Hum. Kinet. 2020, 13, 87–92. [Google Scholar] [CrossRef]
- Ingle, L.; Sleap, M.; Tolfrey, K. The effect of a complex training and detraining programme on selected strength and power variables in early pubertal boys. J. Sport. Sci. 2006, 24, 987–997. [Google Scholar] [CrossRef]


| Variable | Strong Group (n = 6) Mean ± SD | Weak Group (n = 7) Mean ± SD |
|---|---|---|
| Age (y) | 19.7 ± 1.0 | 20.1 ± 1.4 |
| Body mass (kg) | 67.7 ± 5.5 | 70.7 ± 7.1 |
| Height (cm) | 175.7 ± 3.4 | 180.6 ± 3.8 |
| Training (y) | 6.7 ± 1.4 | 5.1 ± 1.1 |
| 1RM (kg) | 188.3 ± 21.4 | 138.6 ± 6.9 |
| 1RM/BM | 2.8 ± 0.3 | 2.0 ± 0.2 |
Disclaimer/Publisher’s Note: The statements, opinions and data contained in all publications are solely those of the individual author(s) and contributor(s) and not of MDPI and/or the editor(s). MDPI and/or the editor(s) disclaim responsibility for any injury to people or property resulting from any ideas, methods, instructions or products referred to in the content. |
© 2022 by the authors. Licensee MDPI, Basel, Switzerland. This article is an open access article distributed under the terms and conditions of the Creative Commons Attribution (CC BY) license (https://creativecommons.org/licenses/by/4.0/).
Share and Cite
Guo, W.; Liang, M.; Lin, J.; Zhou, R.; Zhao, N.; Aidar, F.J.; Oliveira, R.; Badicu, G. Time Duration of Post-Activation Performance Enhancement (PAPE) in Elite Male Sprinters with Different Strength Levels. Children 2023, 10, 53. https://doi.org/10.3390/children10010053
Guo W, Liang M, Lin J, Zhou R, Zhao N, Aidar FJ, Oliveira R, Badicu G. Time Duration of Post-Activation Performance Enhancement (PAPE) in Elite Male Sprinters with Different Strength Levels. Children. 2023; 10(1):53. https://doi.org/10.3390/children10010053
Chicago/Turabian StyleGuo, Wenxia, Meifu Liang, Junlei Lin, Ruihang Zhou, Ningning Zhao, Felipe J. Aidar, Rafael Oliveira, and Georgian Badicu. 2023. "Time Duration of Post-Activation Performance Enhancement (PAPE) in Elite Male Sprinters with Different Strength Levels" Children 10, no. 1: 53. https://doi.org/10.3390/children10010053