
Distinct Subtyping of Successful Weaning from Acute Kidney Injury Requiring Renal Replacement Therapy by Consensus Clustering in Critically Ill Patients

 , ,
, ,
Abstract
:
1. Background
2. Methods
2.1. Study Design and Population
2.2. Data Collection and Definitions of Variables
2.2.1. Baseline Measurements and Characteristics
2.2.2. Indication for Renal Replacement Therapy
2.2.3. Measurement of Urinary Biomarker Levels
2.2.4. Outcome Assessment
2.2.5. Statistical Analysis
3. Results
3.1. Study Population Characteristics
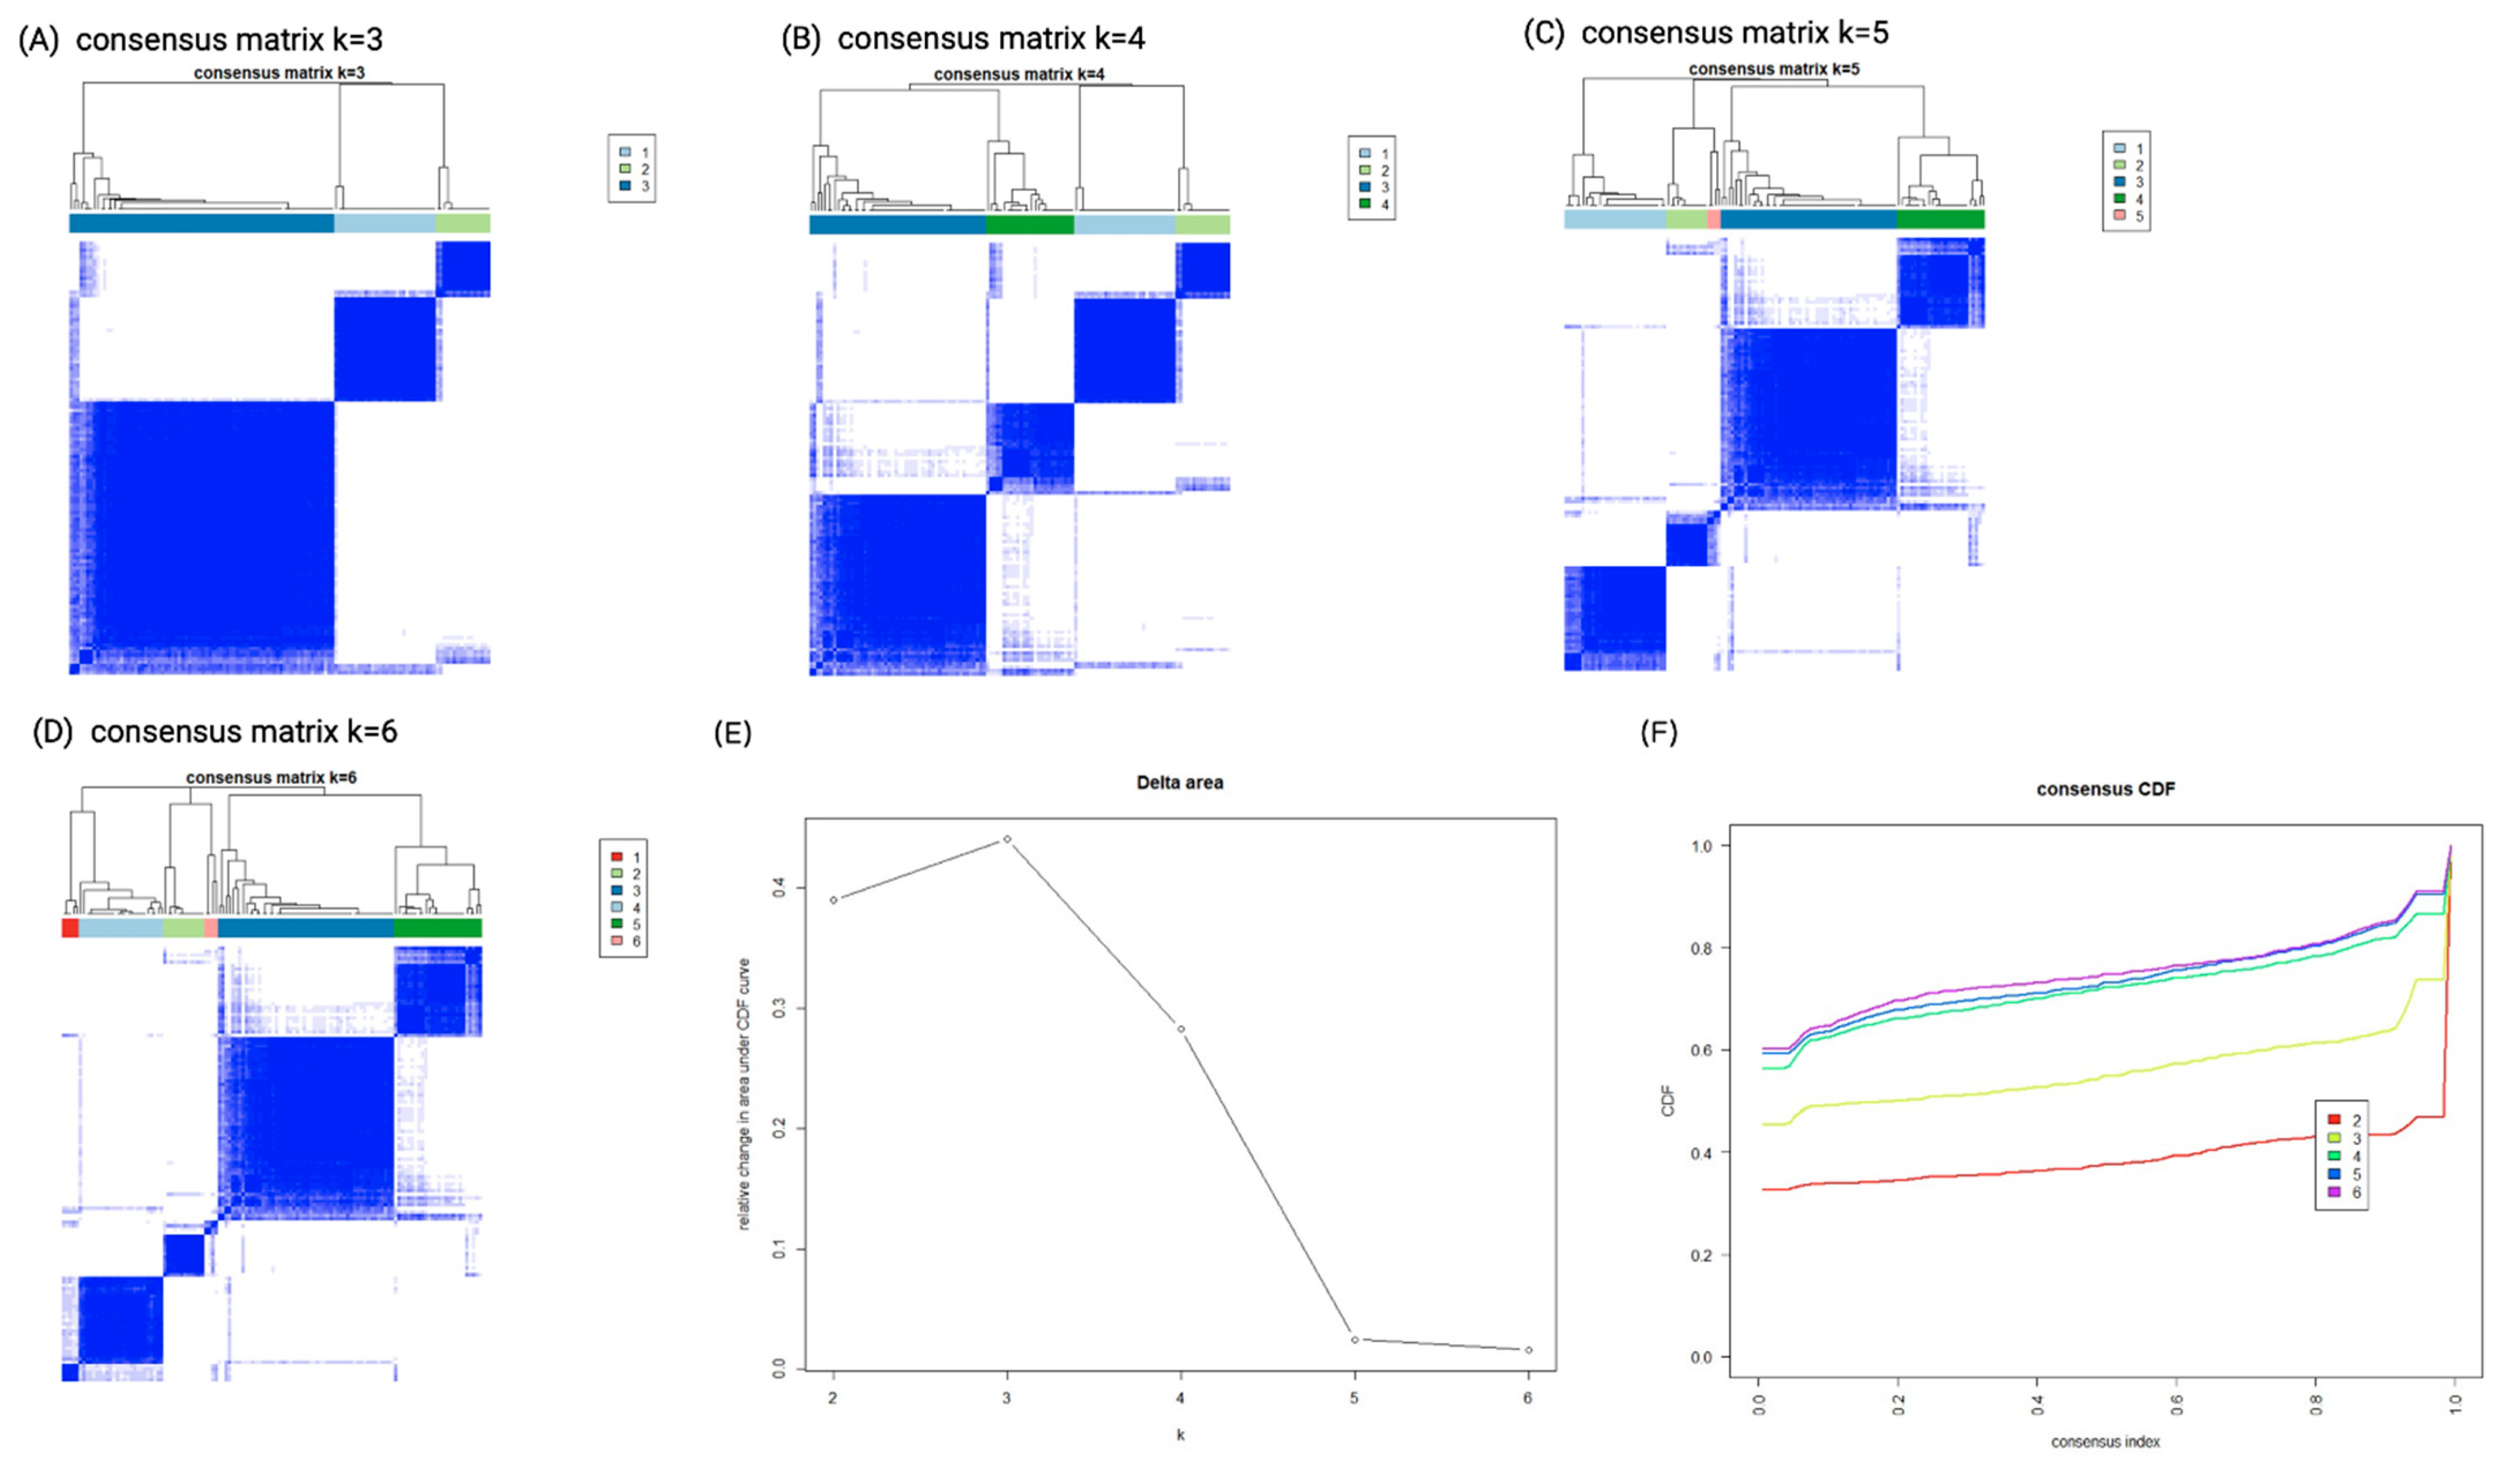
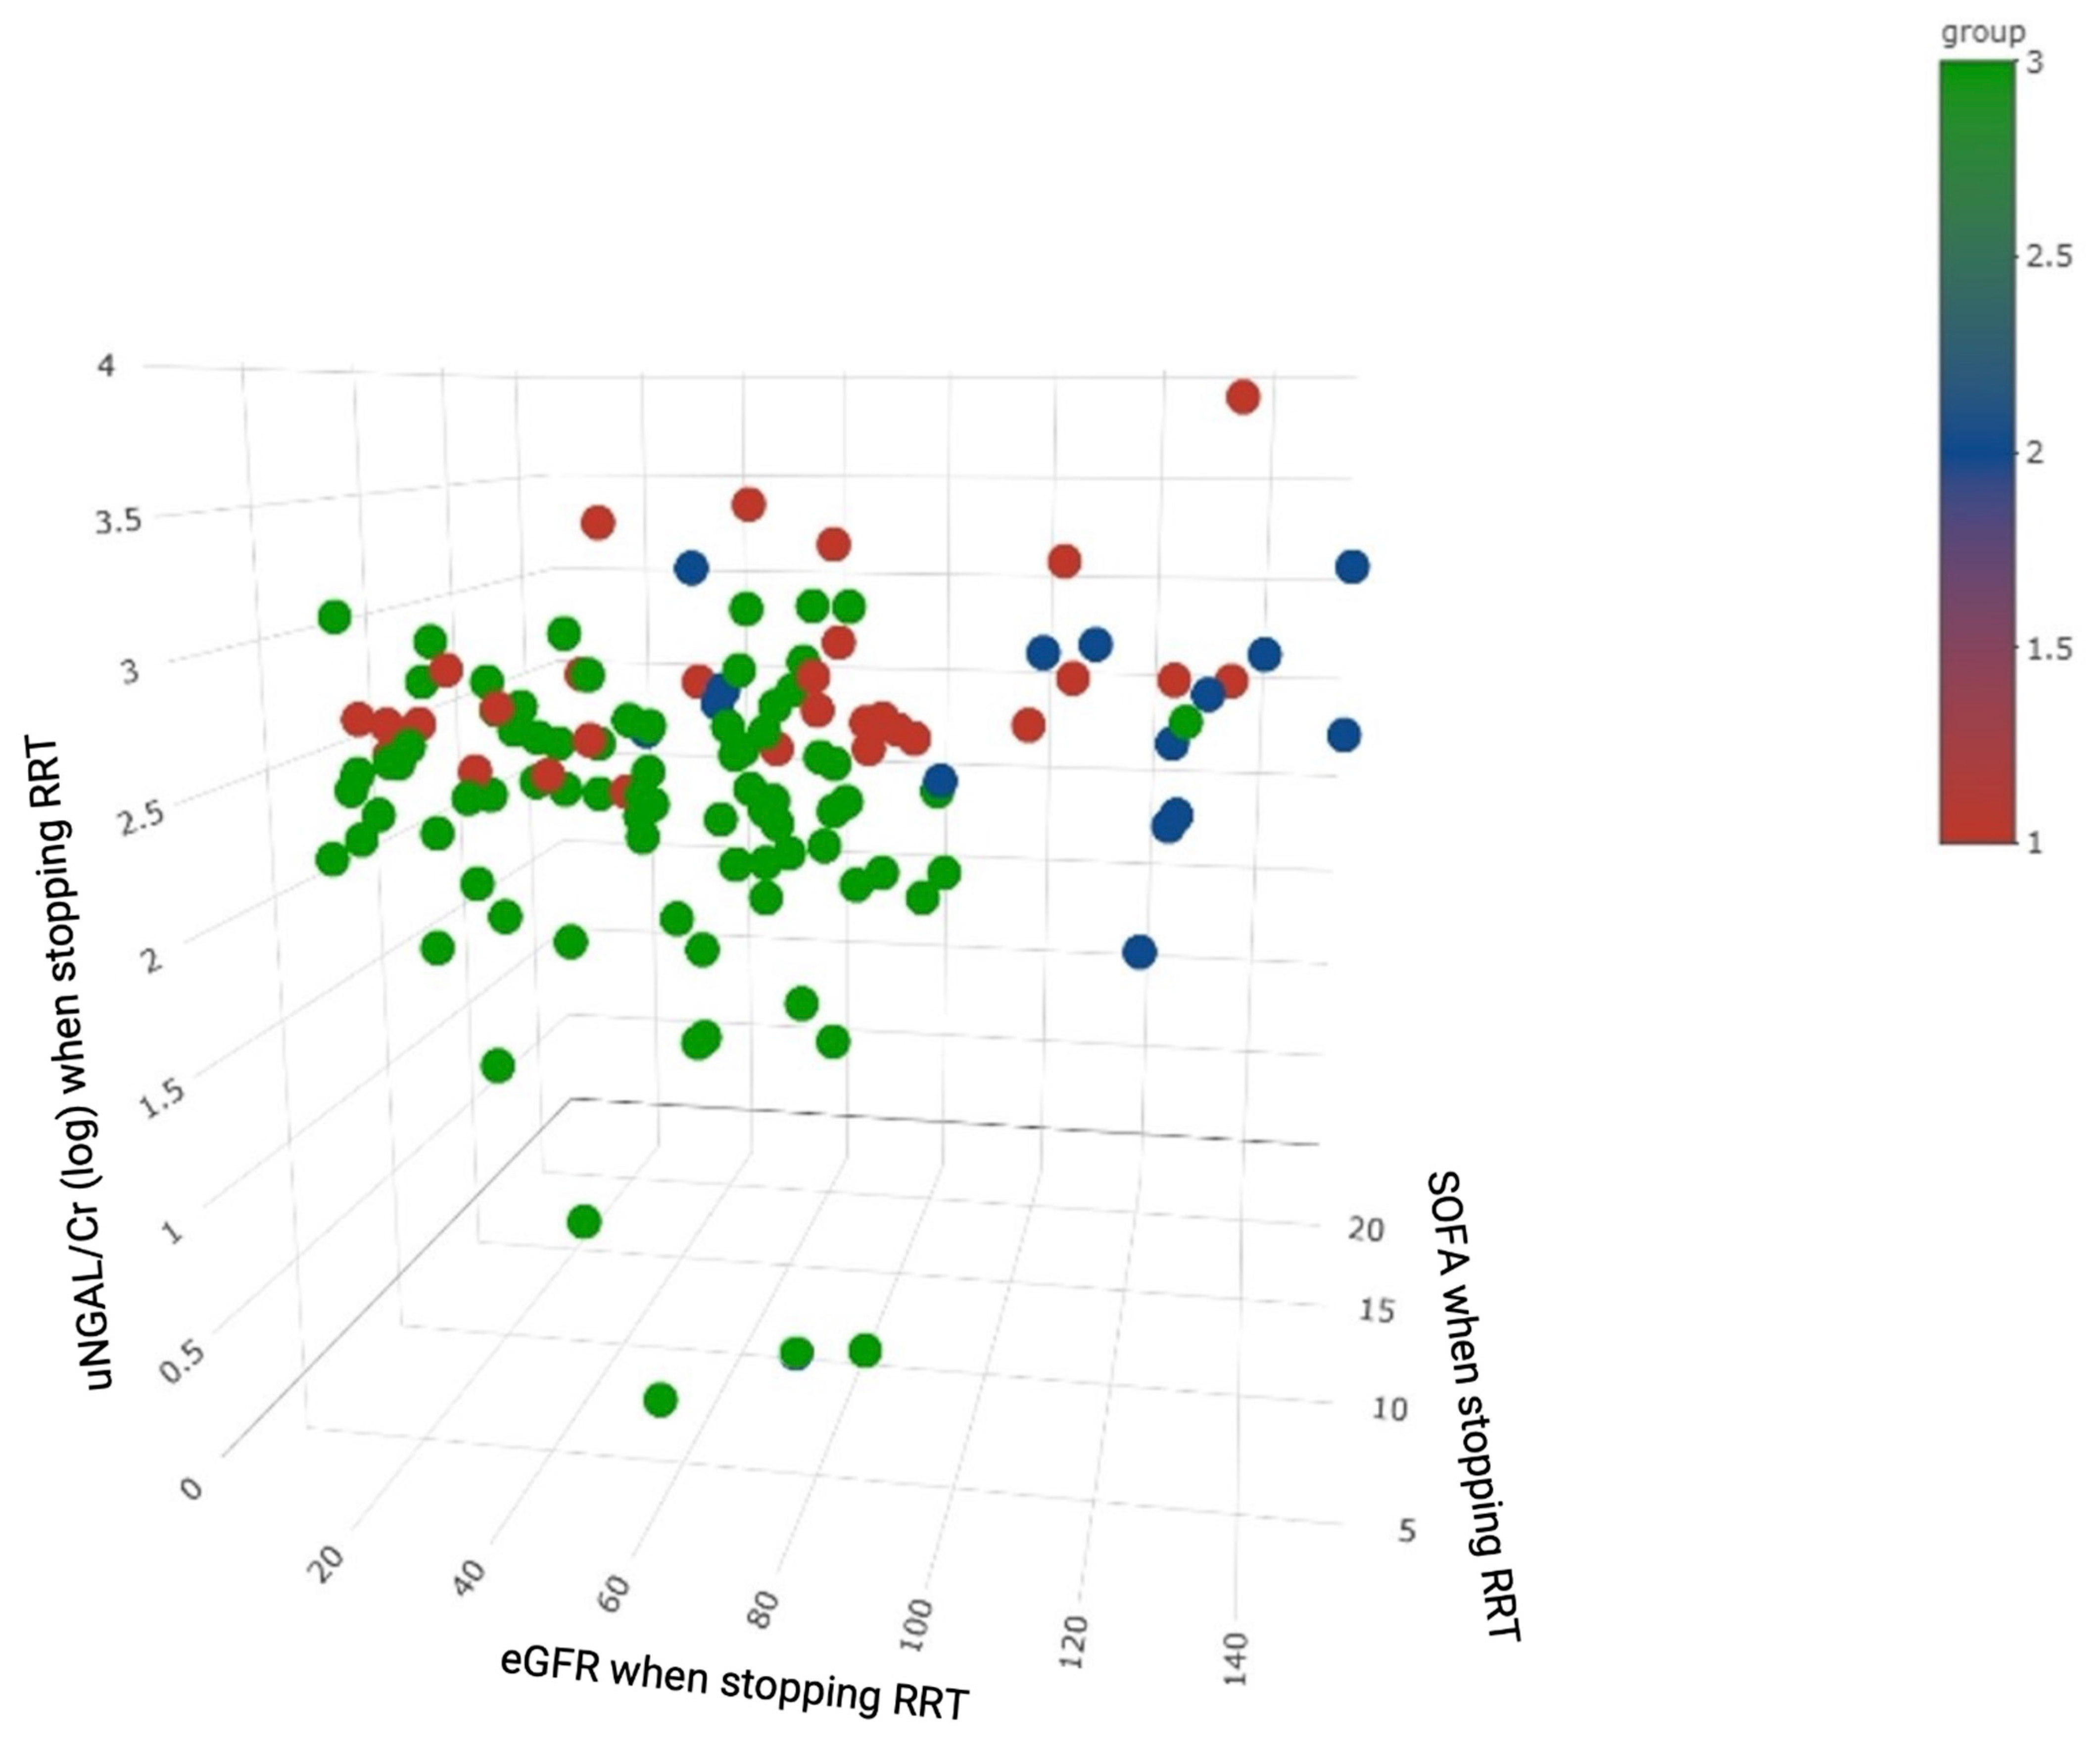
3.2. Unsupervised Cluster Analysis to Identify AKI Clusters
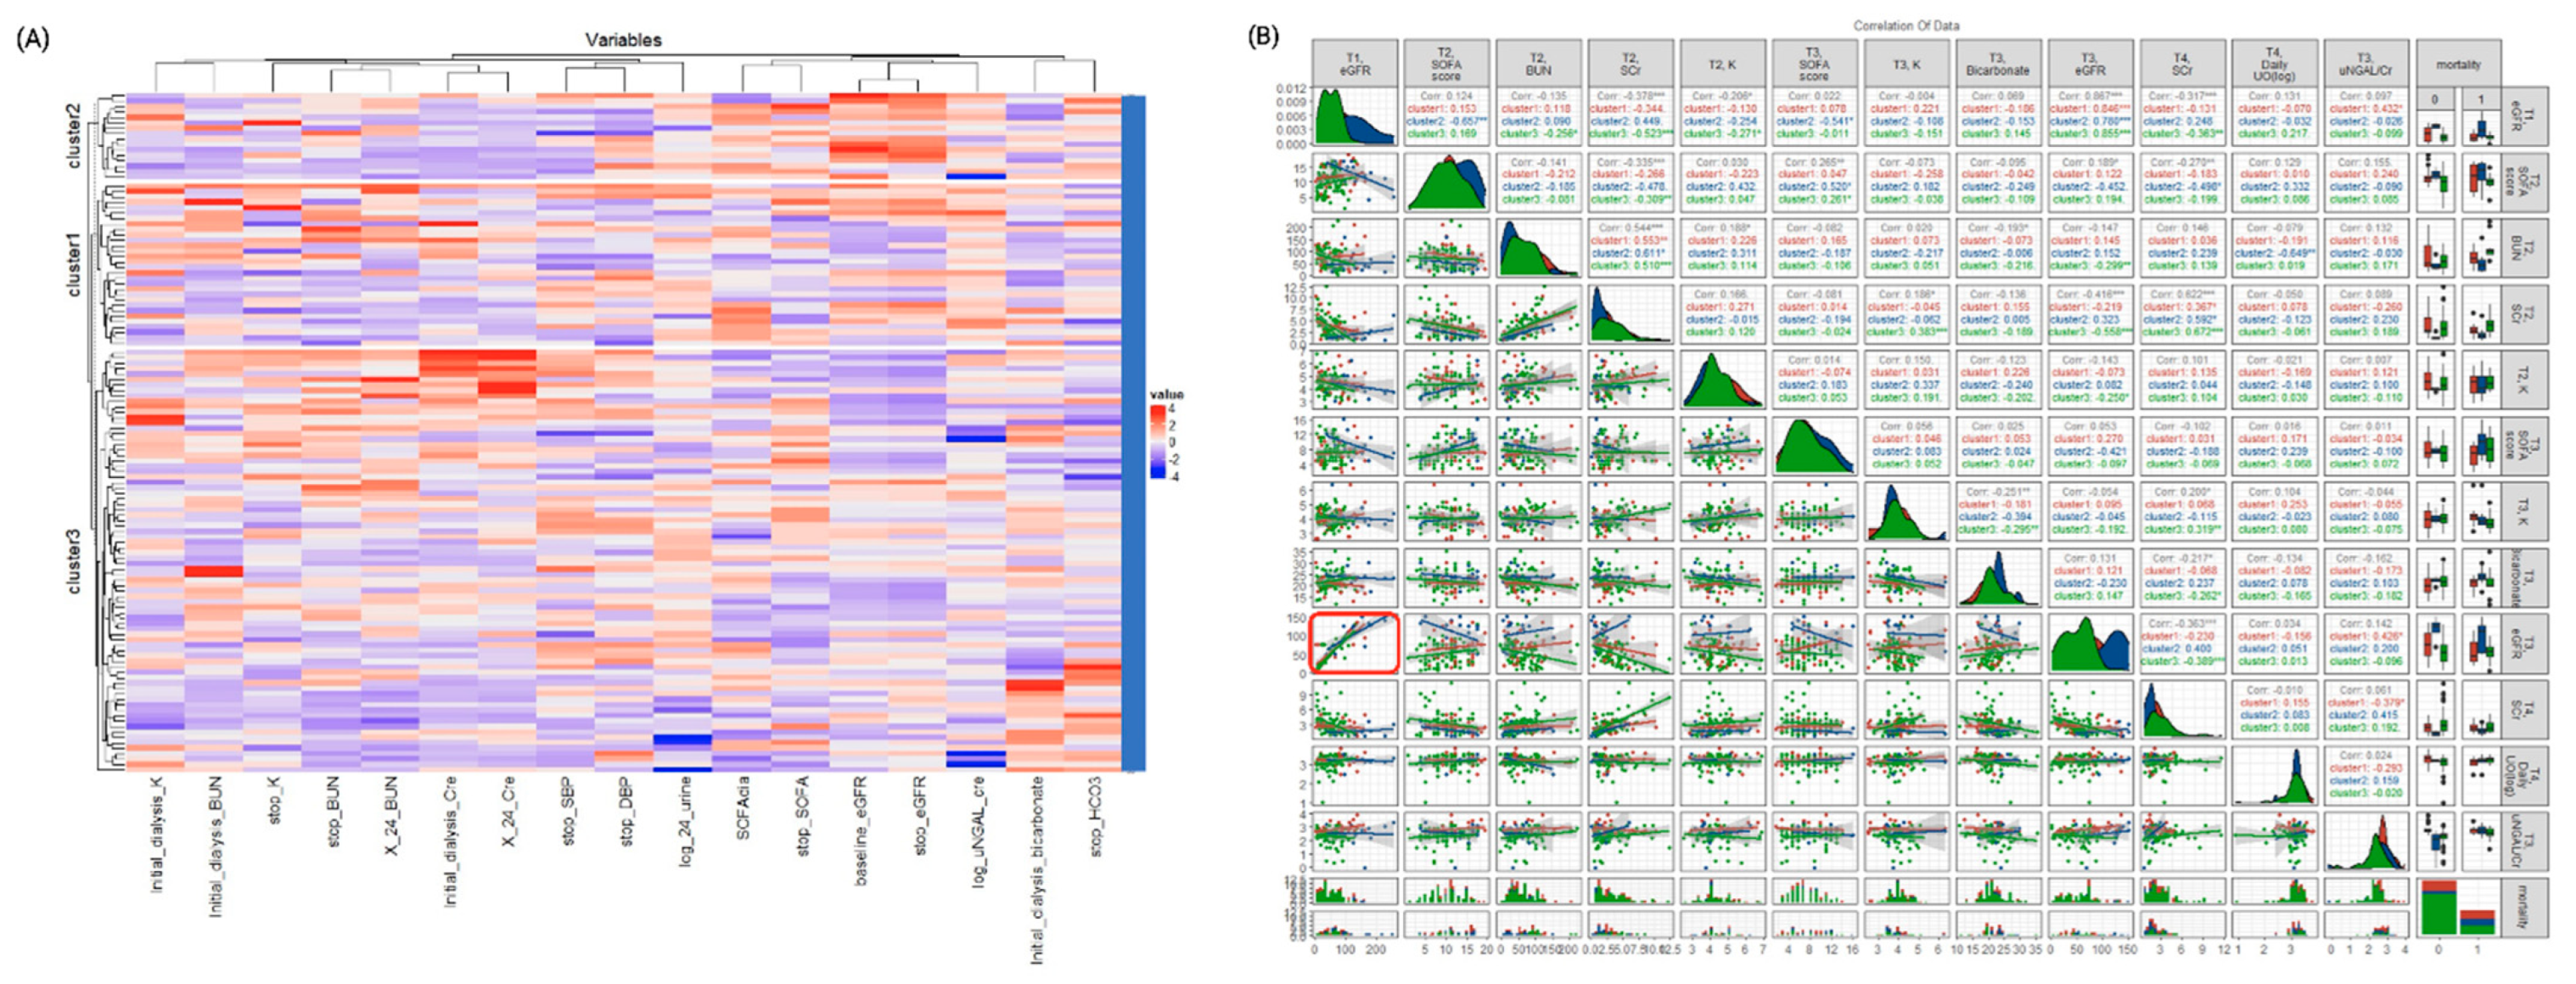
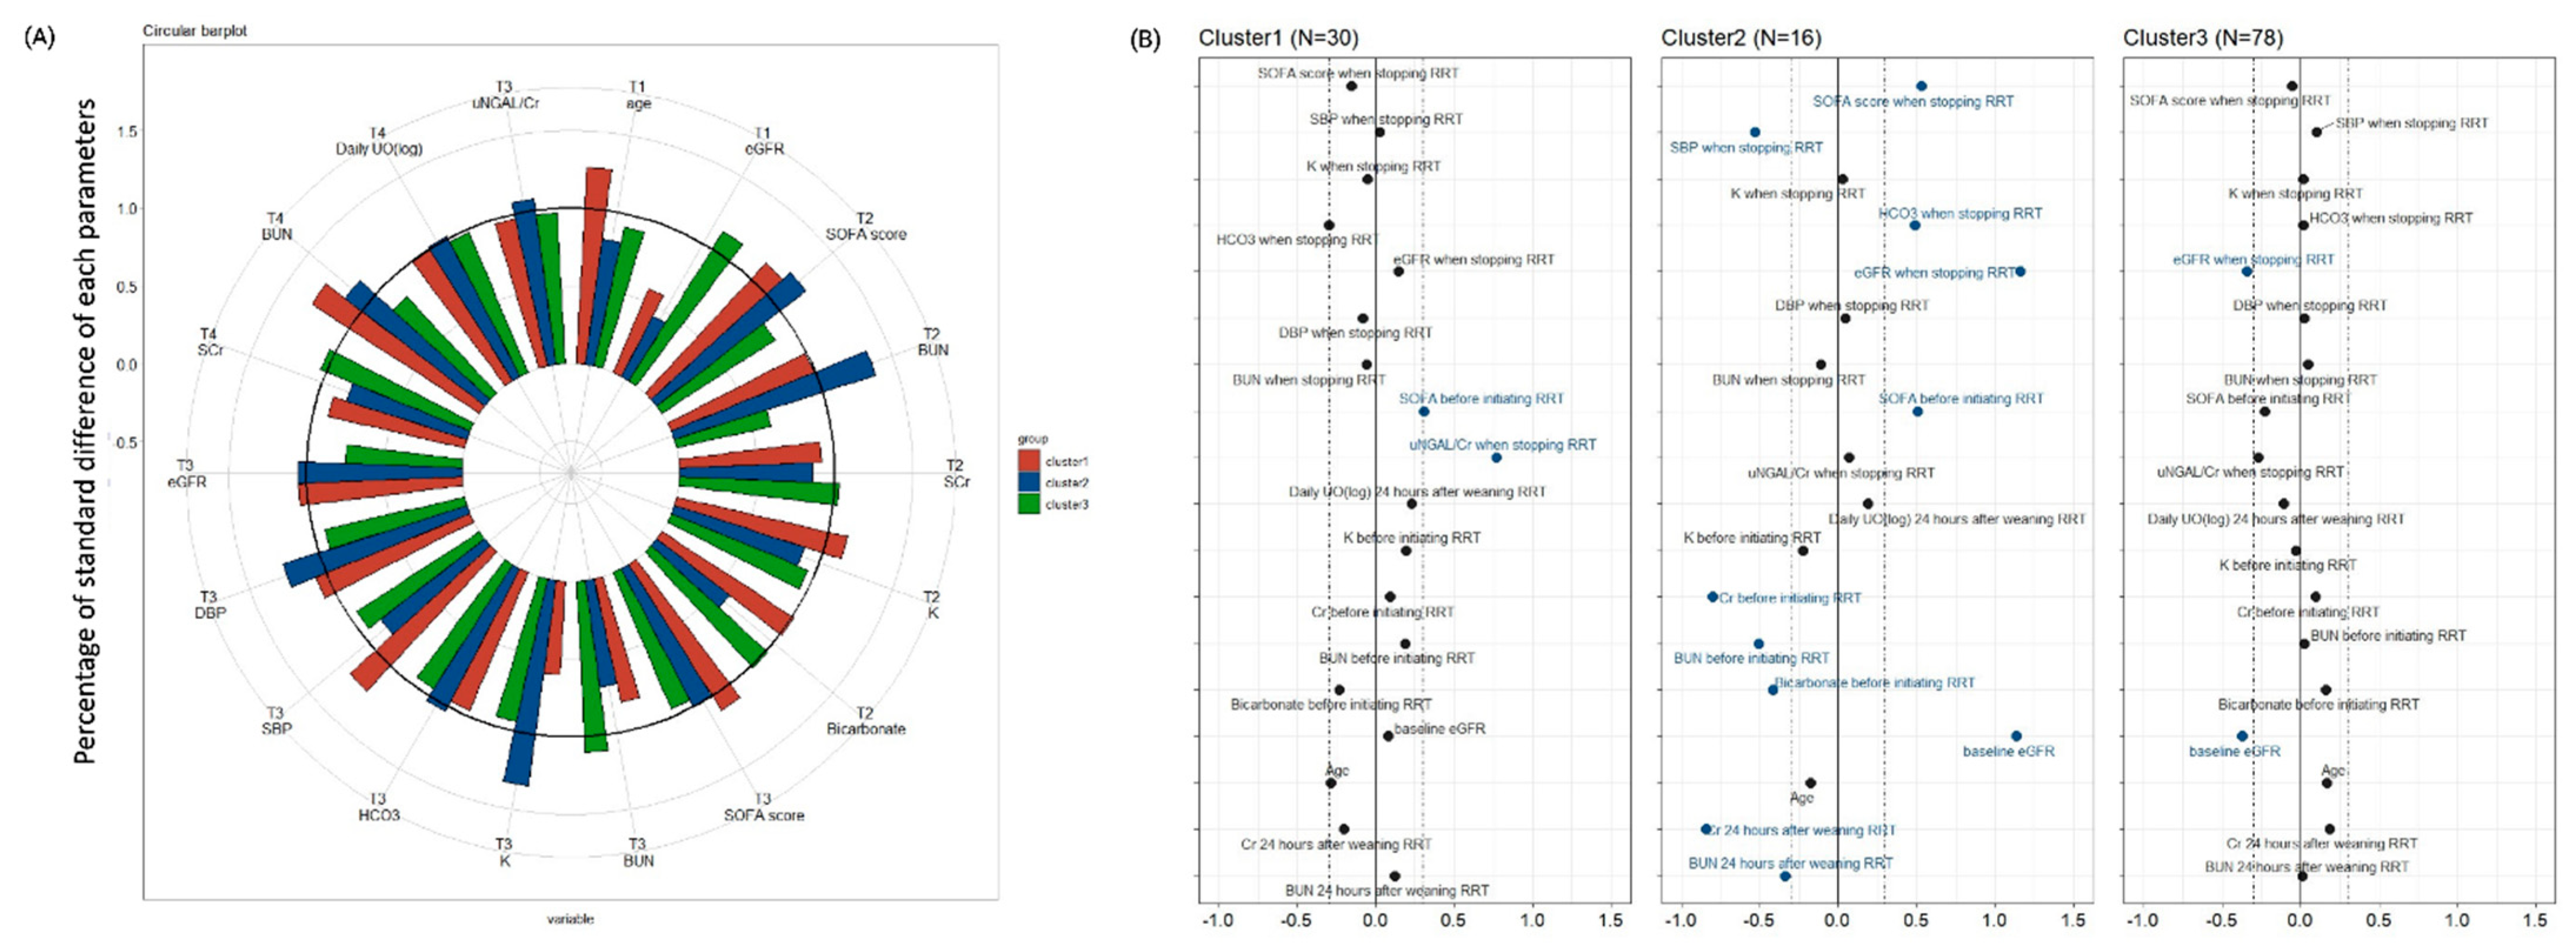
3.3. Clinical Characteristics of the Distinct Clusters
3.4. Etiologies of AKI and Dialysis
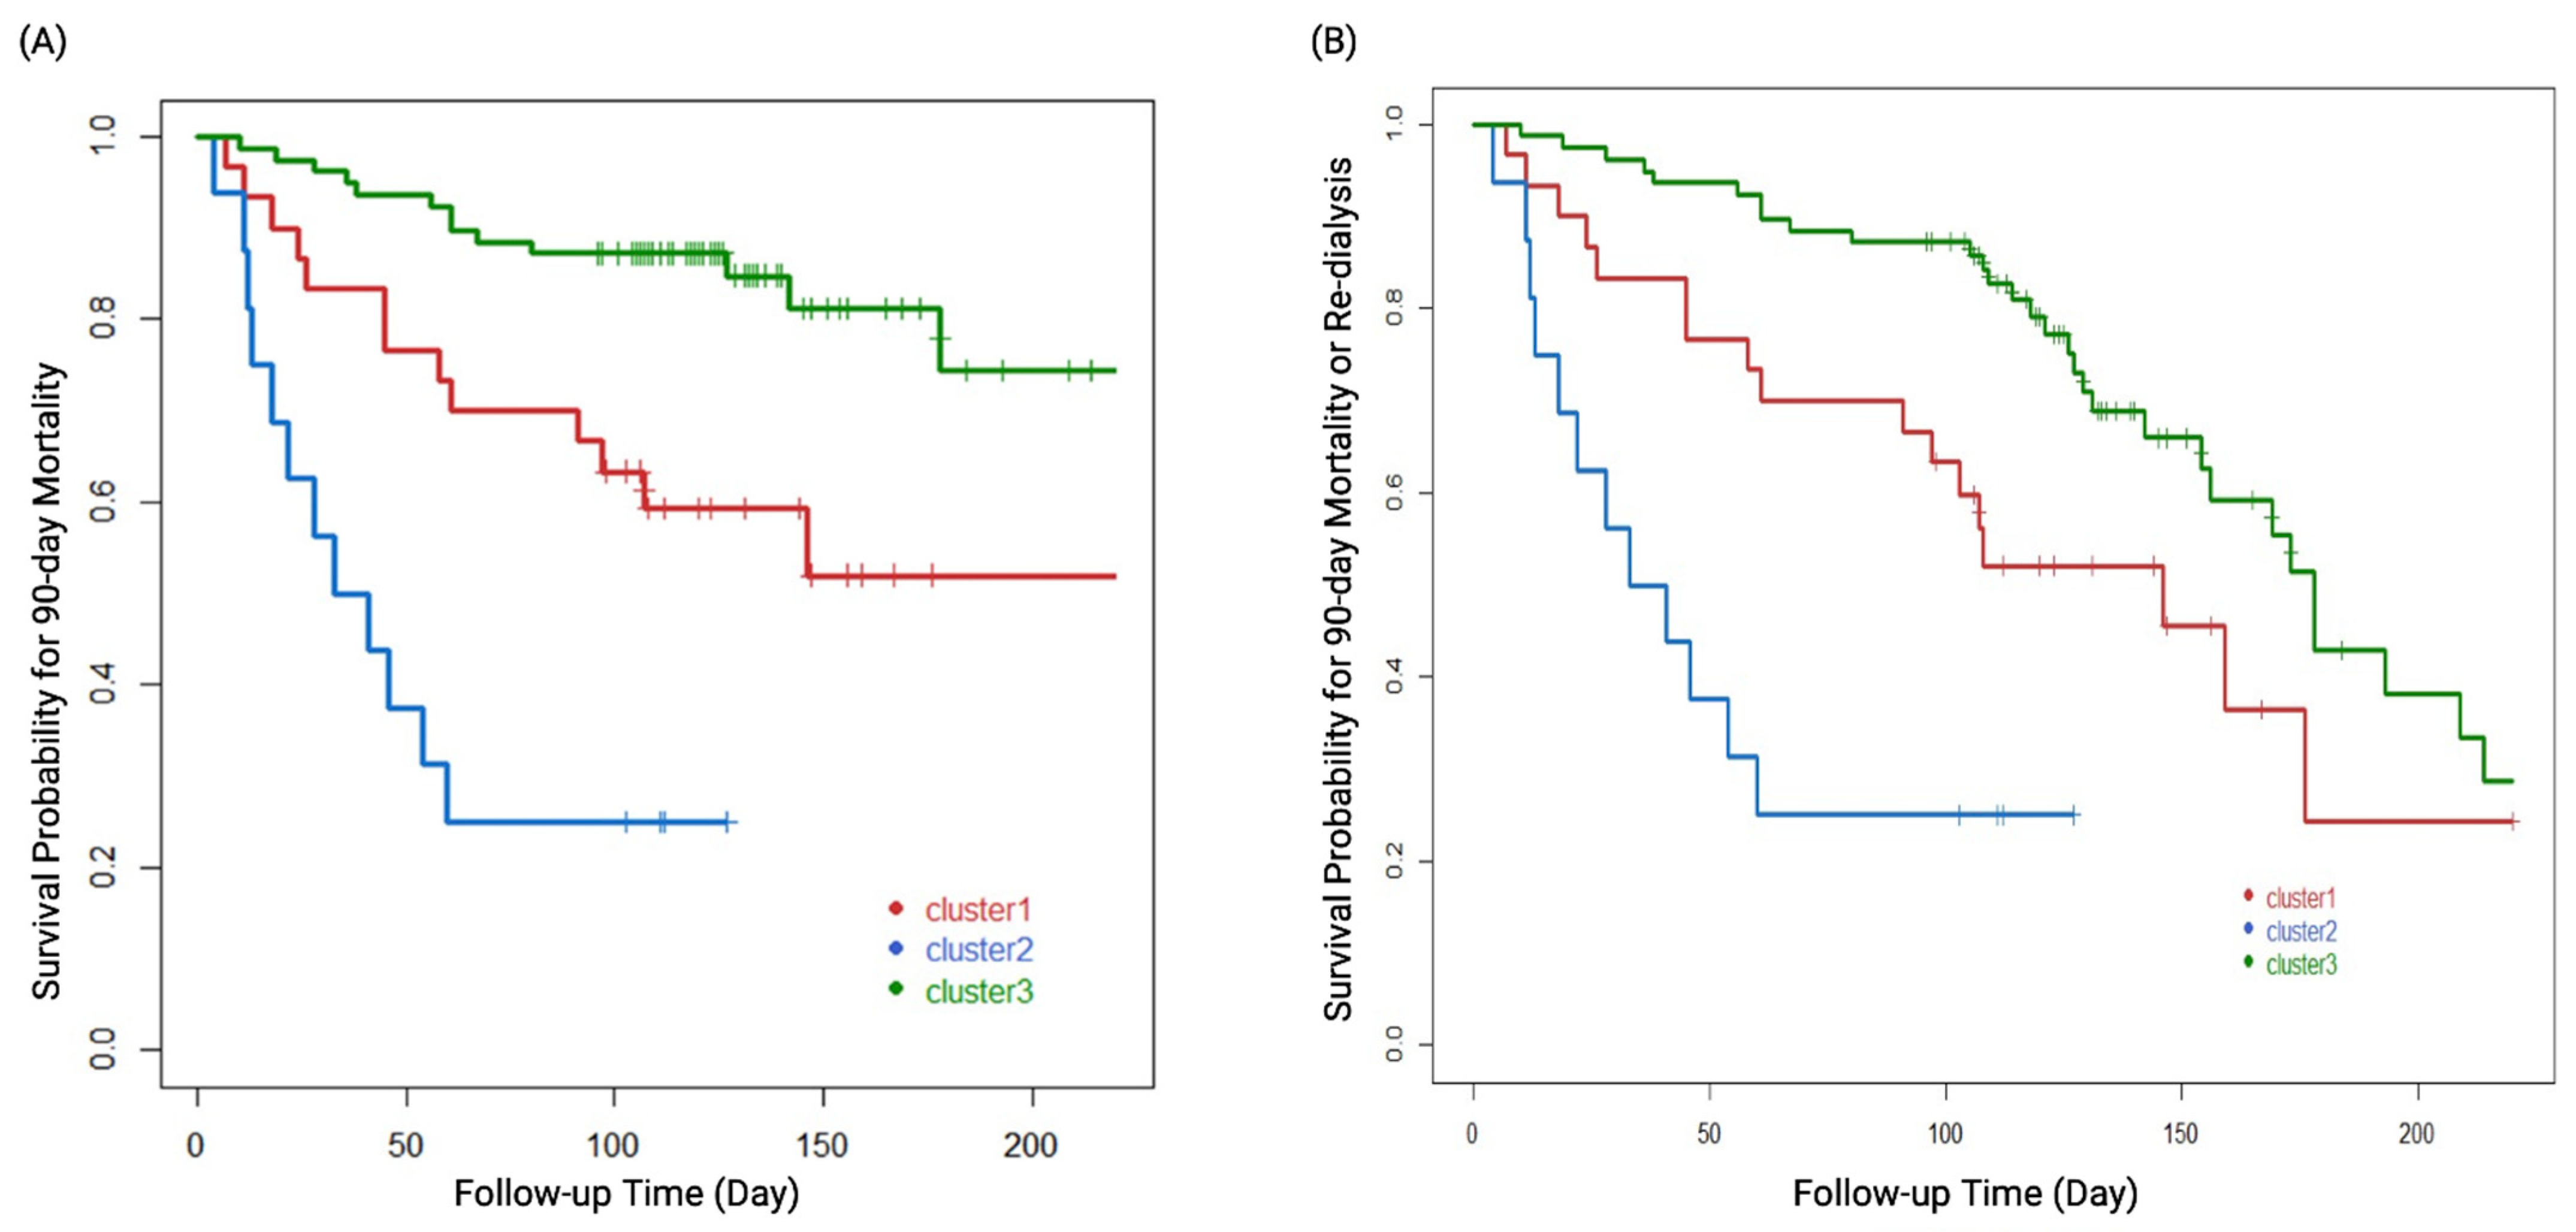
3.5. AKI Phenotypes Predicting Clinical Outcomes
4. Discussion
5. Conclusions
Supplementary Materials
Author Contributions
Funding
Institutional Review Board Statement
Informed Consent Statement
Data Availability Statement
Acknowledgments
Conflicts of Interest
References
- Neveu, H.; Kleinknecht, D.; Brivet, F.; Loirat, P.; Landais, P. Prognostic factors in acute renal failure due to sepsis. Results of a prospective multicentre study. The French Study Group on Acute Renal Failure. Nephrol Dial. Transpl. 1996, 11, 293–299. [Google Scholar] [CrossRef] [PubMed]
- Drazen, J.M.; Ingelfinger, J.R.; Curfman, G.D. Expression of concern: Schiffl H., et al. Daily hemodialysis and the outcome of acute renal failure. N Engl J Med 2002;346:305-10. N. Engl. J. Med. 2003, 348, 2137. [Google Scholar] [CrossRef] [PubMed]
- Chen, Y.Y.; Wu, V.C.; Huang, W.C.; Yeh, Y.C.; Wu, M.S.; Huang, C.C.; Wu, K.D.; Fang, J.T.; Wu, C.J.; Nsarf, T.; et al. Norepinephrine Administration Is Associated with Higher Mortality in Dialysis Requiring Acute Kidney Injury Patients with Septic Shock. J. Clin. Med. 2018, 7, 274. [Google Scholar] [CrossRef] [PubMed] [Green Version]
- Mehta, S.; Chauhan, K.; Patel, A.; Patel, S.; Pinotti, R.; Nadkarni, G.N.; Parikh, C.R.; Coca, S.G. The prognostic importance of duration of AKI: A systematic review and meta-analysis. BMC Nephrol. 2018, 19, 91. [Google Scholar] [CrossRef] [Green Version]
- Kellum, J.A.; Sileanu, F.E.; Bihorac, A.; Hoste, E.A.; Chawla, L.S. Recovery after Acute Kidney Injury. Am. J. Respir Crit. Care Med. 2017, 195, 784–791. [Google Scholar] [CrossRef] [Green Version]
- Yang, T.; Sun, S.; Zhao, Y.; Liu, Q.; Han, M.; Lin, L.; Su, B.; Huang, S.; Yang, L. Biomarkers upon discontinuation of renal replacement therapy predict 60-day survival and renal recovery in critically ill patients with acute kidney injury. Hemodial. Int. 2018, 22, 56–65. [Google Scholar] [CrossRef]
- Kelly, Y.P.; Waikar, S.S.; Mendu, M.L. When to stop renal replacement therapy in anticipation of renal recovery in AKI: The need for consensus guidelines. Semin. Dial. 2019, 32, 205–209. [Google Scholar] [CrossRef]
- Bhatraju, P.K.; Zelnick, L.R.; Herting, J.; Katz, R.; Mikacenic, C.; Kosamo, S.; Morrell, E.D.; Robinson-Cohen, C.; Calfee, C.S.; Christie, J.D. Identification of acute kidney injury subphenotypes with differing molecular signatures and responses to vasopressin therapy. Am. J. Respir. Crit. Care Med. 2019, 199, 863–872. [Google Scholar] [CrossRef]
- Chaudhary, K.; Vaid, A.; Duffy, Á.; Paranjpe, I.; Jaladanki, S.; Paranjpe, M.; Johnson, K.; Gokhale, A.; Pattharanitima, P.; Chauhan, K.; et al. Utilization of deep learning for subphenotype identification in sepsis-associated acute kidney injury. Clin. J. Am. Soc. Nephrol. 2020, 15, 1557–1565. [Google Scholar] [CrossRef]
- Zheng, Z.; Waikar, S.S.; Schmidt, I.M.; Landis, J.R.; Hsu, C.Y.; Shafi, T.; Feldman, H.I.; Anderson, A.H.; Wilson, F.P.; Chen, J.; et al. Subtyping CKD Patients by Consensus Clustering: The Chronic Renal Insufficiency Cohort (CRIC) Study. J. Am. Soc. Nephrol. 2021, 32, 639–653. [Google Scholar] [CrossRef]
- Susantitaphong, P.; Siribamrungwong, M.; Doi, K.; Noiri, E.; Terrin, N.; Jaber, B.L. Performance of urinary liver-type fatty acid–binding protein in acute kidney injury: A meta-analysis. Am. J. Kidney Dis. 2013, 61, 430–439. [Google Scholar] [CrossRef] [PubMed] [Green Version]
- Zdziechowska, M.; Gluba-Brzózka, A.; Poliwczak, A.R.; Franczyk, B.; Kidawa, M.; Zielinska, M.; Rysz, J. Serum NGAL, KIM-1, IL-18, L-FABP: New biomarkers in the diagnostics of acute kidney injury (AKI) following invasive cardiology procedures. Int. Urol. Nephrol. 2020, 52, 2135–2143. [Google Scholar] [CrossRef] [PubMed]
- Hamasaki, H. Urinary liver-type fatty-acid binding protein is a predictor of mortality in individuals with type 2 diabetes. Diabet. Med. 2021, 38, e14527. [Google Scholar] [CrossRef]
- Wang, J.-J.; Chi, N.-H.; Huang, T.-M.; Connolly, R.; Chen, L.W.; Chueh, S.-C.J.; Kan, W.-C.; Lai, C.-C.; Wu, V.-C.; Fang, J.-T. Urinary biomarkers predict advanced acute kidney injury after cardiovascular surgery. Crit. Care 2018, 22, 108. [Google Scholar] [CrossRef] [PubMed] [Green Version]
- Forni, L.; Darmon, M.; Ostermann, M.; Oudemans-van Straaten, H.; Pettilä, V.; Prowle, J.; Schetz, M.; Joannidis, M. Renal recovery after acute kidney injury. Intensive Care Med. 2017, 43, 855–866. [Google Scholar] [CrossRef] [PubMed]
- Wu, V.C.; Ko, W.J.; Chang, H.W.; Chen, Y.S.; Chen, Y.W.; Chen, Y.M.; Hu, F.C.; Lin, Y.H.; Tsai, P.R.; Wu, K.D. Early renal replacement therapy in patients with postoperative acute liver failure associated with acute renal failure: Effect on postoperative outcomes. J. Am. Coll. Surg. 2007, 205, 266–276. [Google Scholar] [CrossRef]
- Wu, V.C.; Ko, W.J.; Chang, H.W.; Chen, Y.W.; Lin, Y.F.; Shiao, C.C.; Chen, Y.M.; Chen, Y.S.; Tsai, P.R.; Hu, F.C.; et al. Risk factors of early redialysis after weaning from postoperative acute renal replacement therapy. Intensive Care Med. 2008, 34, 101–108. [Google Scholar] [CrossRef]
- Shiao, C.C.; Wu, V.C.; Li, W.Y.; Lin, Y.F.; Hu, F.C.; Young, G.H.; Kuo, C.C.; Kao, T.W.; Huang, D.M.; Chen, Y.M.; et al. Late initiation of renal replacement therapy is associated with worse outcomes in acute kidney injury after major abdominal surgery. Crit. Care 2009, 13, R171. [Google Scholar] [CrossRef] [Green Version]
- Wu, V.C.; Wang, C.H.; Wang, W.J.; Lin, Y.F.; Hu, F.C.; Chen, Y.W.; Chen, Y.S.; Wu, M.S.; Lin, Y.H.; Kuo, C.C.; et al. Sustained low-efficiency dialysis versus continuous veno-venous hemofiltration for postsurgical acute renal failure. Am. J. Surg. 2010, 199, 466–476. [Google Scholar] [CrossRef]
- Huang, T.M.; Wu, V.C.; Young, G.H.; Lin, Y.F.; Shiao, C.C.; Wu, P.C.; Li, W.Y.; Yu, H.Y.; Hu, F.C.; Lin, J.W.; et al. Preoperative proteinuria predicts adverse renal outcomes after coronary artery bypass grafting. J. Am. Soc. Nephrol. 2011, 22, 156–163. [Google Scholar] [CrossRef] [Green Version]
- Pan, H.-C.; Wu, P.-C.; Wu, V.-C.; Yang, Y.-F.; Huang, T.-M.; Shiao, C.-C.; Chen, T.-C.; Tarng, D.-C.; Lin, J.-H.; Yang, W.-S.; et al. A nationwide survey of clinical characteristics, management, and outcomes of acute kidney injury (AKI)–patients with and without preexisting chronic kidney disease have different prognoses. Medicine 2016, 95, e4987. [Google Scholar] [CrossRef] [PubMed]
- Shiao, C.-C.; Chang, Y.-H.; Yang, Y.-F.; Lin, E.-T.; Pan, H.-C.; Chang, C.-H.; Huang, C.-T.; Kao, M.-T.; Chuang, T.-F.; Chen, Y.-C. Association between regional economic status and renal recovery of dialysis-requiring acute kidney injury among critically ill patients. Sci. Rep. 2020, 10, 14573. [Google Scholar] [CrossRef] [PubMed]
- Khwaja, A. KDIGO clinical practice guidelines for acute kidney injury. Nephron Clin. Pract. 2012, 120, c179–c184. [Google Scholar] [CrossRef] [PubMed]
- Wu, V.C.; Huang, T.M.; Lai, C.F.; Shiao, C.C.; Lin, Y.F.; Chu, T.S.; Wu, P.C.; Chao, C.T.; Wang, J.Y.; Kao, T.W.; et al. Acute-on-chronic kidney injury at hospital discharge is associated with long-term dialysis and mortality. Kidney Int. 2011, 80, 1222–1230. [Google Scholar] [CrossRef] [Green Version]
- Shu, K.H.; Wang, C.H.; Wu, C.H.; Huang, T.M.; Wu, P.C.; Lai, C.H.; Tseng, L.J.; Tsai, P.R.; Connolly, R.; Wu, V.C. Urinary pi-glutathione S-transferase Predicts Advanced Acute Kidney Injury Following Cardiovascular Surgery. Sci. Rep. 2016, 6, 26335. [Google Scholar] [CrossRef] [PubMed]
- Wu, V.C.; Chueh, S.J.; Chang, J.T.; Hsu, B.G.; Ostermann, M.; Chu, T.S. Acute Kidney Injury and Septic Shock-Defined by Updated Sepsis-3 Criteria in Critically Ill Patients. J. Clin. Med. 2019, 8, 1731. [Google Scholar] [CrossRef] [Green Version]
- Monti, S.; Tamayo, P.; Mesirov, J.; Golub, T. Consensus Clustering: A Resampling-Based Method for Class Discovery and Visualization of Gene Expression Microarray Data. Mach. Learn. 2003, 52, 91–118. [Google Scholar] [CrossRef]
- Wickham, H. Use R v. Digital; Springer: New York, NY, USA, 2009. [Google Scholar]
- Emerson, J.W.; Green, W.A.; Schloerke, B.; Crowley, J.; Cook, D.; Hofmann, H.; Wickham, H. The Generalized Pairs Plot. J. Comput. Graph. Stat. 2013, 22, 79–91. [Google Scholar] [CrossRef]
- Wu, V.C.; Shiao, C.C.; Chi, N.H.; Wang, C.H.; Chueh, S.J.; Liou, H.H.; Spapen, H.D.; Honore, P.M.; Chu, T.S. Outcome Prediction of Acute Kidney Injury Biomarkers at Initiation of Dialysis in Critical Units. J. Clin. Med. 2018, 7, 202. [Google Scholar] [CrossRef] [Green Version]
- Srisawat, N.; Wen, X.; Lee, M.; Kong, L.; Elder, M.; Carter, M.; Unruh, M.; Finkel, K.; Vijayan, A.; Ramkumar, M. Urinary biomarkers and renal recovery in critically ill patients with renal support. Clin. J. Am. Soc. Nephrol. 2011, 6, 1815–1823. [Google Scholar] [CrossRef]
- Pan, H.-C.; Chien, Y.-S.; Jenq, C.-C.; Tsai, M.-H.; Fan, P.-C.; Chang, C.-H.; Chang, M.-Y.; Tian, Y.-C.; Fang, J.-T.; Yang, C.-W. Acute Kidney Injury Classification for Critically Ill Cirrhotic Patients: A Comparison of the KDIGO, AKIN, and RIFLE Classifications. Sci. Rep. 2016, 6, 23022. [Google Scholar] [CrossRef] [PubMed]
- Tripathi, S.; Pande, S.; Malhotra, P.; Mahindru, S.; Thukral, A.; Kotwal, A.S.; Majumdar, G.; Agarwal, S.K.; Gupta, A. Optimal timing of renal replacement therapy for favourable outcome in patients of acute renal failure following cardiac surgery. Indian J. Thorac. Cardiovasc. Surg. 2020, 36, 127–133. [Google Scholar] [CrossRef]
- Kjeldsen, L.; Johnsen, A.H.; Sengeløv, H.; Borregaard, N. Isolation and primary structure of NGAL, a novel protein associated with human neutrophil gelatinase. J. Biol. Chem. 1993, 268, 10425–10432. [Google Scholar] [CrossRef]
- Oh, D.-J. A long journey for acute kidney injury biomarkers. Ren. Fail. 2020, 42, 154–165. [Google Scholar] [CrossRef]
- Treeprasertsuk, S.; Wongkarnjana, A.; Jaruvongvanich, V.; Sallapant, S.; Tiranathanagul, K.; Komolmit, P.; Tangkijvanich, P. Urine neutrophil gelatinase-associated lipocalin: A diagnostic and prognostic marker for acute kidney injury (AKI) in hospitalized cirrhotic patients with AKI-prone conditions. BMC Gastroenterol. 2015, 15, 140. [Google Scholar] [CrossRef] [PubMed] [Green Version]
- Yi, A.; Lee, C.H.; Yun, Y.M.; Kim, H.; Moon, H.W.; Hur, M. Effectiveness of Plasma and Urine Neutrophil Gelatinase-Associated Lipocalin for Predicting Acute Kidney Injury in High-Risk Patients. Ann. Lab. Med. 2021, 41, 60–67. [Google Scholar] [CrossRef]
- Stanski, N.; Menon, S.; Goldstein, S.L.; Basu, R.K. Integration of urinary neutrophil gelatinase-associated lipocalin with serum creatinine delineates acute kidney injury phenotypes in critically ill children. J. Crit. Care 2019, 53, 1–7. [Google Scholar] [CrossRef] [PubMed]
- Srisawat, N.; Murugan, R.; Lee, M.; Kong, L.; Carter, M.; Angus, D.C.; Kellum, J.A. Plasma neutrophil gelatinase-associated lipocalin predicts recovery from acute kidney injury following community-acquired pneumonia. Kidney Int. 2011, 80, 545–552. [Google Scholar] [CrossRef] [Green Version]
- Meersch, M.; Schmidt, C.; Van Aken, H.; Martens, S.; Rossaint, J.; Singbartl, K.; Görlich, D.; Kellum, J.A.; Zarbock, A. Urinary TIMP-2 and IGFBP7 as early biomarkers of acute kidney injury and renal recovery following cardiac surgery. PLoS ONE 2014, 9, e93460. [Google Scholar] [CrossRef] [Green Version]
- Thomsen, J.; Sprogoe, U.; Toft, P. Urine neutrophil gelatinase-associated lipocalin and urine output as predictors of the successful discontinuation of continuous renal replacement therapy in critically ill patients with acute kidney injury. BMC Nephrol. 2020, 21, 375. [Google Scholar] [CrossRef]
- Lumlertgul, N.; Amprai, M.; Tachaboon, S.; Dinhuzen, J.; Peerapornratana, S.; Kerr, S.J.; Srisawat, N. Urine Neutrophil Gelatinase-associated Lipocalin (NGAL) for Prediction of Persistent AKI and Major Adverse Kidney Events. Sci. Rep. 2020, 10, 8718. [Google Scholar] [CrossRef] [PubMed]


| Predictors | Total (n = 124) | Cluster 1 (n = 30) | Cluster 2 (n = 16) | Cluster 3 (n = 78) | p Value |
|---|---|---|---|---|---|
| Demographic factors (T1) | |||||
| Age, years | 61.7 ± 16.7 | 56.6 ± 19.0 | 58.4 ± 20.2 | 64.4 ± 14.5 | 0.83 |
| Gender (male), n (%) | 89 (71.8%) | 18 (60.0%) | 10 (62.5%) | 61 (78.2%) | 0.11 |
| Baseline SCr, mg/dL | 1.9 ± 1.8 | 2.0 ± 2.2 | 0.8 ± 0.4 | 2.1 ± 1.7 | <0.001 |
| Baseline eGFR, mL/min/1.73 m2 | 64.6 ± 44.5 | 68.1 ± 44.1 | 124.9 ± 60.5 | 50.9 ± 27.7 | 0.19 |
| Diabetic mellitus, n (%) | 55 (44.4%) | 14 (46.7%) | 6 (37.5%) | 35 (44.9%) | 0.71 |
| Hypertension, n (%) | 66 (53.2%) | 16 (53.3%) | 7 (43.8%) | 43 (55.1%) | 0.025 |
| Cardiorenal syndrome, n (%) | 66 (53.2%) | 10 (33.3%) | 8 (50.0%) | 48 (61.5%) | 0.030 |
| Type 1 | 55 (44.4%) | 10 (33.3%) | 8 (50.0%) | 37 (47.4%) | 0.027 |
| Type 2 | 11 (8.9%) | 0 (0.0%) | 0 (0.0%) | 11 (14.1%) | <0.001 |
| Mechanical ventilator use | 94 (75.8%) | 26 (86.7%) | 13 (81.3%) | 55 (70.5%) | 0.017 |
| Infection | 93 (75.0%) | 25 (83.3%) | 14 (87.5%) | 54 (69.2%) | 0.15 |
| Time from diagnosis to RRT | 10.8 ± 35.6 | 17.9 ± 53.9 | 10.7 ± 19.4 | 8.1 ± 29.0 | 0.51 |
| Etiology of AKI | |||||
| AKI due to shock, n (%) | 93 (75.0%) | 23 (76.7%) | 10 (62.5%) | 60 (76.9%) | 0.47 |
| AKI due to sepsis, n (%) | 61 (49.2%) | 22 (73.3%) | 9 (56.3%) | 30 (38.5%) | 0.004 |
| AKI due to drug, n (%) | 7 (5.6%) | 2 (6.7%) | 1 (6.3%) | 4 (5.1%) | 0.87 |
| AKI due to contrast, n (%) | 13 (10.5%) | 3 (10.0%) | 2 (12.5%) | 8 (10.3%) | 0.91 |
| AKI due to all other cause *, n (%) | 17 (13.7%) | 4 (13.3%) | 3 (18.8%) | 10 (12.8%) | 0.80 |
| Etiology of Shock | |||||
| Septic shock, n (%) | 18 (14.5%) | 6 (20.0%) | 4 (25.0%) | 8 (10.3%) | 0.16 |
| Cardiogenic shock, n (%) | 17 (13.7%) | 2 (6.7%) | 3 (18.8%) | 12 (15.4%) | 0.40 |
| Hypovolemic shock, n (%) | 2 (1.6%) | 2 (6.7%) | 0 (0.0%) | 0 (0.0%) | 0.073 |
| Indication for dialysis | |||||
| Azotemia, n (%) | 46 (37.1%) | 12 (40.0%) | 5 (31.3%) | 29 (37.2%) | 0.44 |
| Fluid overload, n (%) | 53 (42.7%) | 11 (36.7%) | 9 (56.3%) | 33 (42.3%) | 0.69 |
| Electrolyte imbalance, n (%) | 13 (10.5%) | 2 (6.7%) | 1 (6.3%) | 10 (12.8%) | 0.99 |
| Acid base imbalance, n (%) | 24 (19.4%) | 6 (20.0%) | 3 (18.8%) | 15 (19.2%) | 1.00 |
| Uremic symptom, n (%) | 1 (0.8%) | 0 (0.0%) | 0 (0.0%) | 1 (1.3%) | 0.21 |
| Rhabdomyolysis, n (%) | 5 (4.0%) | 3 (10.0%) | 0 (0.0%) | 2 (2.6%) | 0.57 |
| Oliguria/anuria, n (%) | 66 (53.2%) | 18 (60.0%) | 7 (43.8%) | 41 (52.6%) | 0.001 |
| Clinical parameters before initiating RRT (T2) | |||||
| BUN, mg/dL | 67.8 ± 42.3 | 76.2 ± 47.7 | 47.7 ± 37.2 | 68.7 ± 40.2 | 0.003 |
| SCr, mg/dL | 3.4 ± 2.3 | 3.6 ± 2.3 | 1.9 ± 1.4 | 3.6 ± 2.3 | 0.38 |
| Potassium, mEq/L | 4.4 ± 0.8 | 4.6 ± 0.9 | 4.2 ± 0.8 | 4.4 ± 0.8 | 0.046 |
| Bicarbonate, mmol/L | 19.4 ± 4.2 | 18.4 ± 3.8 | 17.7 ± 3.6 | 20.1 ± 4.3 | 0.84 |
| SOFA score | 10.7 ± 3.9 | 11.9 ± 3.7 | 12.7 ± 4.0 | 9.8 ± 3.7 | 0.22 |
| qSOFA score | 1.0 ± 0.8 | 1.1 ± 0.8 | 1.3 ± 0.9 | 0.9 ± 0.8 | 0.048 |
| IE score | 9.5 ± 12.6 | 11.6 ± 10.7 | 14.8 ± 19.9 | 7.6 ± 11.1 | 0.10 |
| Clinical parameters when weaning off RRT (T3) | |||||
| SBP, mmHg | 128.7 ± 24.2 | 129.4 ± 24.1 | 115.8 ± 24.6 | 131.1 ± 23.6 | 0.87 |
| DBP, mmHg | 68.3 ± 14.6 | 67.1 ± 15.7 | 69.1 ± 18.2 | 68.6 ± 13.5 | <0.001 |
| Body weight, kg | 67.0 ± 14.4 | 65.6 ± 16.1 | 62.9 ± 16.5 | 68.4 ± 13.2 | 0.91 |
| Urine output, ml | 1030.3 ± 668.8 | 1003.9 ± 714.1 | 962.9 ± 516.5 | 1054.3 ± 684.7 | 0.07 |
| Platelet count, 103/uL | 125.5 ± 74.2 | 128.6 ± 82.8 | 88.4 ± 57.9 | 131.9 ± 72.2 | 0.10 |
| BUN, mg/dL | 50.0 ± 23.2 | 48.7 ± 29.5 | 47.8 ± 20.4 | 50.9 ± 21.1 | 0.76 |
| SCr, mg/dL | 1.8 ± 1.6 | 1.7 ± 1.6 | 0.9 ± 0.3 | 2.0 ± 1.7 | 0.07 |
| eGFR, mL/min/1.73 m2 | 62.8 ± 34.9 | 67.9 ± 36.9 | 104.3 ± 36.8 | 52.2 ± 26.2 | 0.001 |
| Potassium, mEq/L | 4.0 ± 0.6 | 4.0 ± 0.8 | 4.0 ± 0.7 | 4.0 ± 0.5 | 0.06 |
| Bicarbonate, mmol/L | 21.7 ± 3.8 | 20.7 ± 3.4 | 23.4 ± 3.1 | 21.8 ± 4.0 | 0.32 |
| SOFA score | 7.5 ± 2.9 | 7.1 ± 2.8 | 9.1 ± 3.1 | 7.4 ± 2.8 | 0.015 |
| qSOFA score | 0.8 ± 0.8 | 0.9 ± 0.8 | 1.3 ± 1.0 | 0.6 ± 0.7 | 0.59 |
| uLFABP/Cr (log), μg/gCr | 2.2 ± 0.7 | 2.7 ± 0.4 | 2.4 ± 0.8 | 2.0 ± 0.7 | <0.001 |
| uNGAL/Cr (log), μg/gCr | 2.5 ± 0.6 | 2.8 ± 0.4 | 2.5 ± 0.8 | 2.3 ± 0.6 | <0.001 |
| Clinical parameters after being weaned off RRT for 24 h (T4) | |||||
| SCr, mg/dL | 2.8 ± 1.8 | 2.5 ± 1.1 | 1.6 ± 0.8 | 3.2 ± 2.1 | 0.41 |
| BUN, mg/dL | 55.8 ± 24.6 | 56.9 ± 27.3 | 48.4 ± 21.5 | 56.9 ± 24.1 | 0.43 |
| Daily UO (log), mL | 3.1 ± 0.4 | 3.2 ± 0.3 | 3.2 ± 0.2 | 3.1 ± 0.4 | 0.71 |
| Outcome | |||||
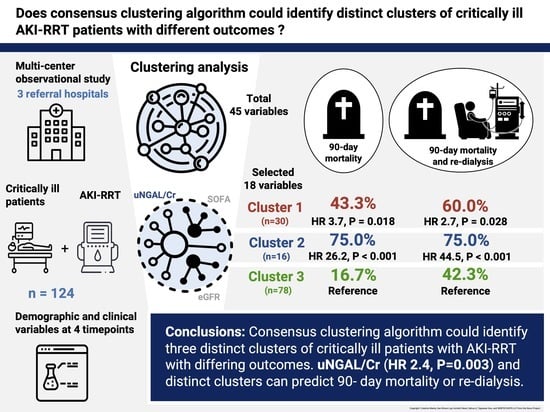
| Mortality, n (%) | 38 (30.7%) | 13 (43.3%) | 12 (75.0%) | 13 (16.7%) | <0.001 |
| Mortality and re-dialysis, n (%) | 63 (50.7%) | 18 (60.0%) | 12 (75.0%) | 33 (42.3%) | 0.015 |
| Parameter | Hazard Ratio | 95% Confidence Interval | p-Value |
|---|---|---|---|
| Demographic factors (T1) | |||
| Age, year | 1.06 | 1.02–1.10 | 0.001 |
| Gender, n (%) | 1.26 | 0.53–2.96 | 0.60 |
| Diabetic mellitus, n (%) | 1.55 | 0.63–3.83 | 0.35 |
| Baseline eGFR, mL/min/1.73 m2 | 1.02 | 1.00–1.05 | 0.049 |
| Indication for dialysis | |||
| Azotemia, n (%) | 0.56 | 0.20–1.64 | 0.29 |
| Fluid overload, n (%) | 0.66 | 0.24–1.82 | 0.42 |
| Electrolyte imbalance, n (%) | 0.62 | 0.12–3.38 | 0.59 |
| Acid-base imbalance, n (%) | 2.59 | 1.12–5.98 | 0.026 |
| Rhabdomyolysis, n (%) | 2.98 | 0.28–31.93 | 0.37 |
| Oliguria/anuria, n (%) | 0.47 | 0.17–1.25 | 0.13 |
| Clinical parameters before initiating RRT(T2) | |||
| BUN, mg/dL | 1.01 | 1.00–1.02 | 0.045 |
| SOFA score | 1.07 | 0.94–1.22 | 0.31 |
| Clinical parameters when weaning off RRT (T3) | |||
| SBP, mmHg | 0.99 | 0.97–1.01 | 0.26 |
| Body weight, kg | 0.99 | 0.96–1.02 | 0.44 |
| Daily UO (log), ml | 0.69 | 0.16–2.91 | 0.61 |
| BUN, mg/dL | 0.99 | 0.97–1.01 | 0.53 |
| eGFR, mL/min/1.73 m2 | 0.96 | 0.94–0.99 | 0.01 |
| Potassium, mEq/L | 1.33 | 0.66–2.66 | 0.43 |
| SOFA | 1.10 | 0.93–1.30 | 0.25 |
| uNGAL/Cr (log), μg/gCr | 3.68 | 1.63–8.31 | 0.002 |
| Clinical parameters after being weaned off RRT for 24 h (T4) | |||
| Daily UO (log), ml | 2.46 | 0.45–13.57 | 0.30 |
| BUN, mg/dL | 1.01 | 0.99–1.024 | 0.58 |
| Cluster 1 vs. 3 | 3.69 | 1.25–10.93 | 0.018 |
| Cluster 2 vs. 3 | 26.19 | 5.42–126.65 | <0.001 |
| Parameter | Hazard Ratio | 95% Confidence Interval | p-Value |
|---|---|---|---|
| Demographic factors (T1) | |||
| Age, year | 1.03 | 1.00–1.10 | 0.003 |
| Gender, n (%) | 1.41 | 0.66–3.01 | 0.38 |
| Diabetic mellitus, n (%) | 1.44 | 0.71–2.92 | 0.31 |
| Baseline eGFR, mL/min/1.73 m2 | 1.00 | 0.98–1.02 | 0.89 |
| Indication for dialysis | |||
| Azotemia, n (%) | 0.64 | 0.30–1.36 | 0.25 |
| Fluid overload, n (%) | 1.06 | 0.54–2.11 | 0.87 |
| Electrolyte imbalance, n (%) | 0.79 | 0.25–2.52 | 0.69 |
| Acid- base imbalance, n (%) | 1.98 | 0.97–4.06 | 0.06 |
| Rhabdomyolysis, n (%) | 3.12 | 0.69–14.21 | 0.14 |
| Oliguria/anuria, n (%) | 0.82 | 0.39–1.71 | 0.60 |
| Clinical parameters before initiating RRT(T2) | |||
| BUN, mg/dL | 1.01 | 1.00–1.02 | 0.23 |
| SOFA score | 0.99 | 0.89–1.10 | 0.87 |
| Clinical parameters when weaning off RRT (T3) | |||
| SBP, mmHg | 1.00 | 0.99–1.02 | 0.85 |
| Body weight, kg | 0.99 | 0.97–1.02 | 0.51 |
| Daily UO (log), ml | 1.75 | 0.63–4.86 | 0.29 |
| BUN, mg/dL | 1.00 | 0.99–1.02 | 0.59 |
| eGFR, mL/min/1.73 m2 | 0.98 | 0.96–1.00 | 0.05 |
| Potassium, mEq/L | 1.32 | 0.76–2.30 | 0.33 |
| SOFA | 1.08 | 0.95–1.23 | 0.24 |
| uNGAL/Cr (log), μg/gCr | 2.43 | 1.36–4.33 | 0.003 |
| Clinical parameters after being weaned off RRT for 24 h (T4) | |||
| Daily UO (log), mL | 0.85 | 0.32–2.27 | 0.75 |
| BUN, mg/dL | 1.00 | 0.99–1.02 | 0.64 |
| Cluster 1 vs. 3 | 2.70 | 1.11–6.57 | 0.028 |
| Cluster 2 vs. 3 | 44.53 | 11.92–166.39 | <0.001 |
Publisher’s Note: MDPI stays neutral with regard to jurisdictional claims in published maps and institutional affiliations. |
© 2022 by the authors. Licensee MDPI, Basel, Switzerland. This article is an open access article distributed under the terms and conditions of the Creative Commons Attribution (CC BY) license (https://creativecommons.org/licenses/by/4.0/).
Share and Cite
Pan, H.-C.; Sun, C.-Y.; Huang, T.T.-M.; Huang, C.-T.; Tsao, C.-H.; Lai, C.-H.; Chen, Y.-M.; Wu, V.-C. Distinct Subtyping of Successful Weaning from Acute Kidney Injury Requiring Renal Replacement Therapy by Consensus Clustering in Critically Ill Patients. Biomedicines 2022, 10, 1628. https://doi.org/10.3390/biomedicines10071628
Pan H-C, Sun C-Y, Huang TT-M, Huang C-T, Tsao C-H, Lai C-H, Chen Y-M, Wu V-C. Distinct Subtyping of Successful Weaning from Acute Kidney Injury Requiring Renal Replacement Therapy by Consensus Clustering in Critically Ill Patients. Biomedicines. 2022; 10(7):1628. https://doi.org/10.3390/biomedicines10071628
Chicago/Turabian StylePan, Heng-Chih, Chiao-Yin Sun, Thomas Tao-Min Huang, Chun-Te Huang, Chun-Hao Tsao, Chien-Heng Lai, Yung-Ming Chen, and Vin-Cent Wu. 2022. "Distinct Subtyping of Successful Weaning from Acute Kidney Injury Requiring Renal Replacement Therapy by Consensus Clustering in Critically Ill Patients" Biomedicines 10, no. 7: 1628. https://doi.org/10.3390/biomedicines10071628