Article

gldc Is Essential for Renal Progenitor Patterning during Kidney Development

Department of Biological Sciences, Center for Stem Cells and Regenerative Medicine, Center for Zebrafish Research, Boler-Parseghian Center for Rare and Neglected Diseases, Warren Center for Drug Discovery, University of Notre Dame, Notre Dame, IN 46556, USA
*
Author to whom correspondence should be addressed.
Biomedicines 2022, 10(12), 3220; https://doi.org/10.3390/biomedicines10123220
Submission received: 5 November 2022 / Revised: 4 December 2022 / Accepted: 7 December 2022 / Published: 12 December 2022
(This article belongs to the Special Issue Zebrafish Models for Development and Disease 4.0)

Abstract

:
The glycine cleavage system (GCS) is a complex located on the mitochondrial membrane that is responsible for regulating glycine levels and contributing one-carbon units to folate metabolism. Congenital mutations in GCS components, such as glycine decarboxylase (gldc), cause an elevation in glycine levels and the rare disease, nonketotic hyperglycinemia (NKH). NKH patients suffer from pleiotropic symptoms including seizures, lethargy, mental retardation, and early death. Therefore, it is imperative to fully elucidate the pathological effects of gldc dysfunction and glycine accumulation during development. Here, we describe a zebrafish model of gldc deficiency that recapitulates phenotypes seen in humans and mice. gldc deficient embryos displayed impaired fluid homeostasis suggesting renal abnormalities, as well as aberrant craniofacial morphology and neural development defects. Whole mount in situ hybridization (WISH) revealed that gldc transcripts were highly expressed in the embryonic kidney, as seen in mouse and human repository data, and that formation of several nephron segments was disrupted in gldc deficient embryos, including proximal and distal tubule populations. These kidney defects were caused by alterations in renal progenitor populations, revealing that the proper function of Gldc is essential for the patterning of this organ. Additionally, further analysis of the urogenital tract revealed altered collecting duct and cloaca morphology in gldc deficient embryos. Finally, to gain insight into the molecular mechanisms underlying these disruptions, we examined the effects of exogenous glycine treatment and observed analogous renal and cloacal defects. Taken together, these studies indicate for the first time that gldc function serves an essential role in regulating renal progenitor development by modulating glycine levels.

1. Introduction

Nonketotic hyperglycinemia (NKH) is a rare disease that affects 1:76,000 people, causing one-third of patients to succumb to the disease in their first year of life [1,2]. NKH patients experience a wide range of symptoms such as hypotonia, lethargy, seizures, coma, developmental delays, and apnea that occur at varying severities [3]. The disease is caused by a defect in the glycine cleavage system (GCS), a complex of four proteins that function to break down glycine into one-carbon units to be later utilized in folate metabolism. While NKH can be caused by a defect in any of the GCS enzymes, ~75% of cases are caused by glycine decarboxylase (GLDC) deficiency [4]. There are treatments to alleviate symptoms of the disease, but none can resolve the developmental defects patients experience [5]. Depending on where the mutation is located on GLDC and what type of mutations occurs, patients experience a variety of symptoms of differing severities [6,7]. To better understand this variability, computational models have been used to compare disease severity across multiple genetic lesions [6,8]. Mammalian models have also been useful in analyzing Gldc in brain development as many patients experience neurological symptoms [9,10,11,12,13]. However, prenatal lethality in these mouse models prevents studies into the specific effects Gldc has on other tissues. Further, while mammals are useful models for research, their growth in utero complicates early developmental studies [14].
The zebrafish provides a reliable, efficient model to systematically delineate the role of gldc in early developmental processes. Zebrafish are a tractable model as they have high genetic conservation with humans and other mammals, but develop ex utero in transparent chorions. Therefore, it is possible to genetically alter zebrafish embryos and analyze them over time with a larger sample size than mice [14]. While we can study the advancement and growth of various tissues in the zebrafish, the kidney is a particularly simplistic and relevant aspect of this model [15,16]. Vertebrate kidneys are comprised of structural and functional units known as nephrons, with dozens to millions depending on the species and stage of life [17]. In the zebrafish embryo, the kidney is anatomically simple, being composed of two nephrons that share a single blood filter at the midline, followed by tubules that selectively secrete and absorb solutes running parallel down the length of the body, which reconnect at the cloaca, a shared exit way for waste [18,19,20]. The nephron tubules include various segments made of specialized epithelial cells that function to transport ions [19]. Multiple tubule segments are conserved between mammals and zebrafish [17,19,20,21,22]. Many of the genetic pathways underlying the differentiation of the cells that make these tubules remain to be elucidated. While GLDC has previously been described as important in the formation of the central nervous system (CNS), here, we demonstrate for the first time that it has an essential role in the segmental patterning of the nephron during embryonic kidney development.

2. Materials and Methods

2.1. Ethics Statement and Zebrafish Husbandry

The Freimann Life Science Center at the University of Notre Dame tended to all adult zebrafish. All WT animals used in this study were the Tübingen strain. Embryonic zebrafish were maintained in E3 medium at 28.5 °C, staged at the desired time point, anesthetized in tricaine, and fixed in 4% paraformaldehyde (PFA) [23]. The University of Notre Dame Institutional Animal Care and Use Committee (IACUC) approved and oversaw all studies under protocol numbers 19-06-5412 and 20-09-6240. Analysis of all experimental work was performed in a blinded manner.

2.2. Morpholino Knockdown

Morpholino oligonucleotides (MO) were designed and then obtained from GeneTools, LLC, and stored at −20 °C. The gldc MOs targeted two sites to block splicing: 5′–CTCTCGGAGTTGAGgtaagagctgt–3′ and 5′–ctggttatttcagTCAGTCTCTCAG–3′. Splicing was assessed using reverse transcriptase polymerase chain reaction (RT-PCR) with the following pair of primers: 5′–GAACGAATTCTGCCCAGGCACGAT–3′, 5′–GTTTGAAAATGGACGATCCAGTGT–3′. Products were isolated by PCR purification and Sanger sequencing confirmed the retention of intron 1 led to the inclusion of multiple premature stop codons. For microinjections, MOs were diluted in RNase-free water and 1–2 nanoliters were injected into the 1-cell stage.

2.3. capped RNA (cRNA) Synthesis and Rescue Studies

The zebrafish gldc ORF was cloned into a pUC57 vector. The 5′ end included an SP6 promoter, EcoRV site, SacII site, and a Kozak consensus sequence. On the 3′ end, there was a T7 promoter, Xho1 site, XbaI site, Not1 site, an SV40 PolyA tail, and a series of stop codons. To make cRNA, the vector was linearized with Xno1 and synthesized with SP6 RNA polymerase then purified and stored at −80 °C. gldc cRNA was co-injected with the gldc MOs at a concentration of 66 pg.

2.4. Whole-Mount In Situ Hybridization (WISH)

WISH was conducted as previously described [24,25,26]. Linearized plasmids were transcribed in vitro with T7, T3, or SP6 enzymes to create digoxigenin (DIG) or fluorescein (FLU) anti-sense RNA probes. All WISH experiments were performed in triplicate with a sample size of greater than 30 animals for each replicate. Representative samples were imaged and analyzed.

2.5. Dextran FITC Injections

WT and gldc morphants were incubated in 0.003% PTU (Sigma-Aldrich, St. Louis, MO, USA). At 48 hpf, animals were anesthetized and 40 kDa Dextran FITC conjugate (5 mg/mL) [27] was injected into the somite in order to introduce it to circulation [28]. Embryos were imaged at 6 hpi, 24 hpi, and 48 hpi. The mean fluorescent intensity of the head and pericardium was calculated in ImageJ, and the percent fluorescence was calculated utilizing the 6 hpi fluorescent intensity as a baseline.

2.6. Acridine Orange (AO) Assay

AO experiments were conducted as described [28,29]. AO (Sigma-Aldrich, St. Louis, MO, USA) was prepared by dissolving 50 mg in 50 mL of MilliQ water to create a 100× solution and stored at −20 °C, protected from light. AO was diluted in E3 to a 1× working solution before being applied to 24 hpf live embryos. Embryos were incubated in AO/E3 for 30 min at room temperature, then washed 3 times for 10 min with E3. Samples were anesthetized in tricaine and imaged in methylcellulose.

2.7. Alcian Blue Stain

Alcian Blue staining was performed as described [30]. At 4 dpf, embryos were fixed in 4% PFA overnight at 4 °C in glass vials. They were dehydrated in 100% MeOH at −20 °C, then rehydrated. Animals were bleached at room temperature for 1 h, then rinsed in PBST before being digested in 1× proteinase K (10 mg/mL) for 15 min. After another PBST rinse, animals were incubated overnight at room temperature in 0.1% Alcian Blue dissolved in 70% ethanol and 5% concentrated HCl while rocking. Zebrafish larvae were destained with acidic ethanol for 4 h on the rocker, then rinsed in PBST. The samples were dehydrated in an ethanol series and stored in glycerol before imaging.

2.8. Dextran-Rhodamine Brain Ventricle Injections

Brain ventricle injections were performed as described [31]. In brief, zebrafish embryos were anesthetized with 0.2% tricaine at 24 hpf. The hindbrain ventricle was injected with ~6 nL of 40 kDa dextran conjugated rhodamine (5 mg/mL) [27]. Images were taken with brightfield and fluorescence microscopy on a compound microscope and superimposed with Adobe Photoshop.

2.9. Glycine Treatment

Glycine (Sigma-Aldrich, St. Louis, MO, USA). After embryos reached the 50% epiboly stage, they were bathed in the appropriate glycine/E3 concentration and protected from ambient light, as described for exogenous drug treatment [32,33,34,35]. The concentration range for exposure was based on previous studies [36]. Embryos were grown up to the appropriate time point, imaged, or fixed as previously described.

2.10. Image Acquisition and Statistical Analysis

Live and WISH images were taken on a Nikon Eclipse Ni with a DS-Fi2 camera. Live zebrafish were imaged in methylcellulose. Fixed samples were imaged in glycerol. WISH measurements of absolute length were completed on representative samples at 10× magnification. AO+ and multiciliated cells were imaged at 10× and counted with the multi-point tool on ImageJ/Fiji. Cloacal area was measured at 20× on ImageJ/Fiji with the polygon selection tool. Experiments were completed in triplicate with at least 30 samples each (except brain ventricle injections, n = 3). Measurements were inputted into GraphPad Prism 9 in which averages and standard deviations (SD) were calculated. Depending on the number of treatment groups, t-tests or ANOVA were completed and significance was determined. The survival curve was completed in triplicate, with a sample size of 75 each.

3. Results

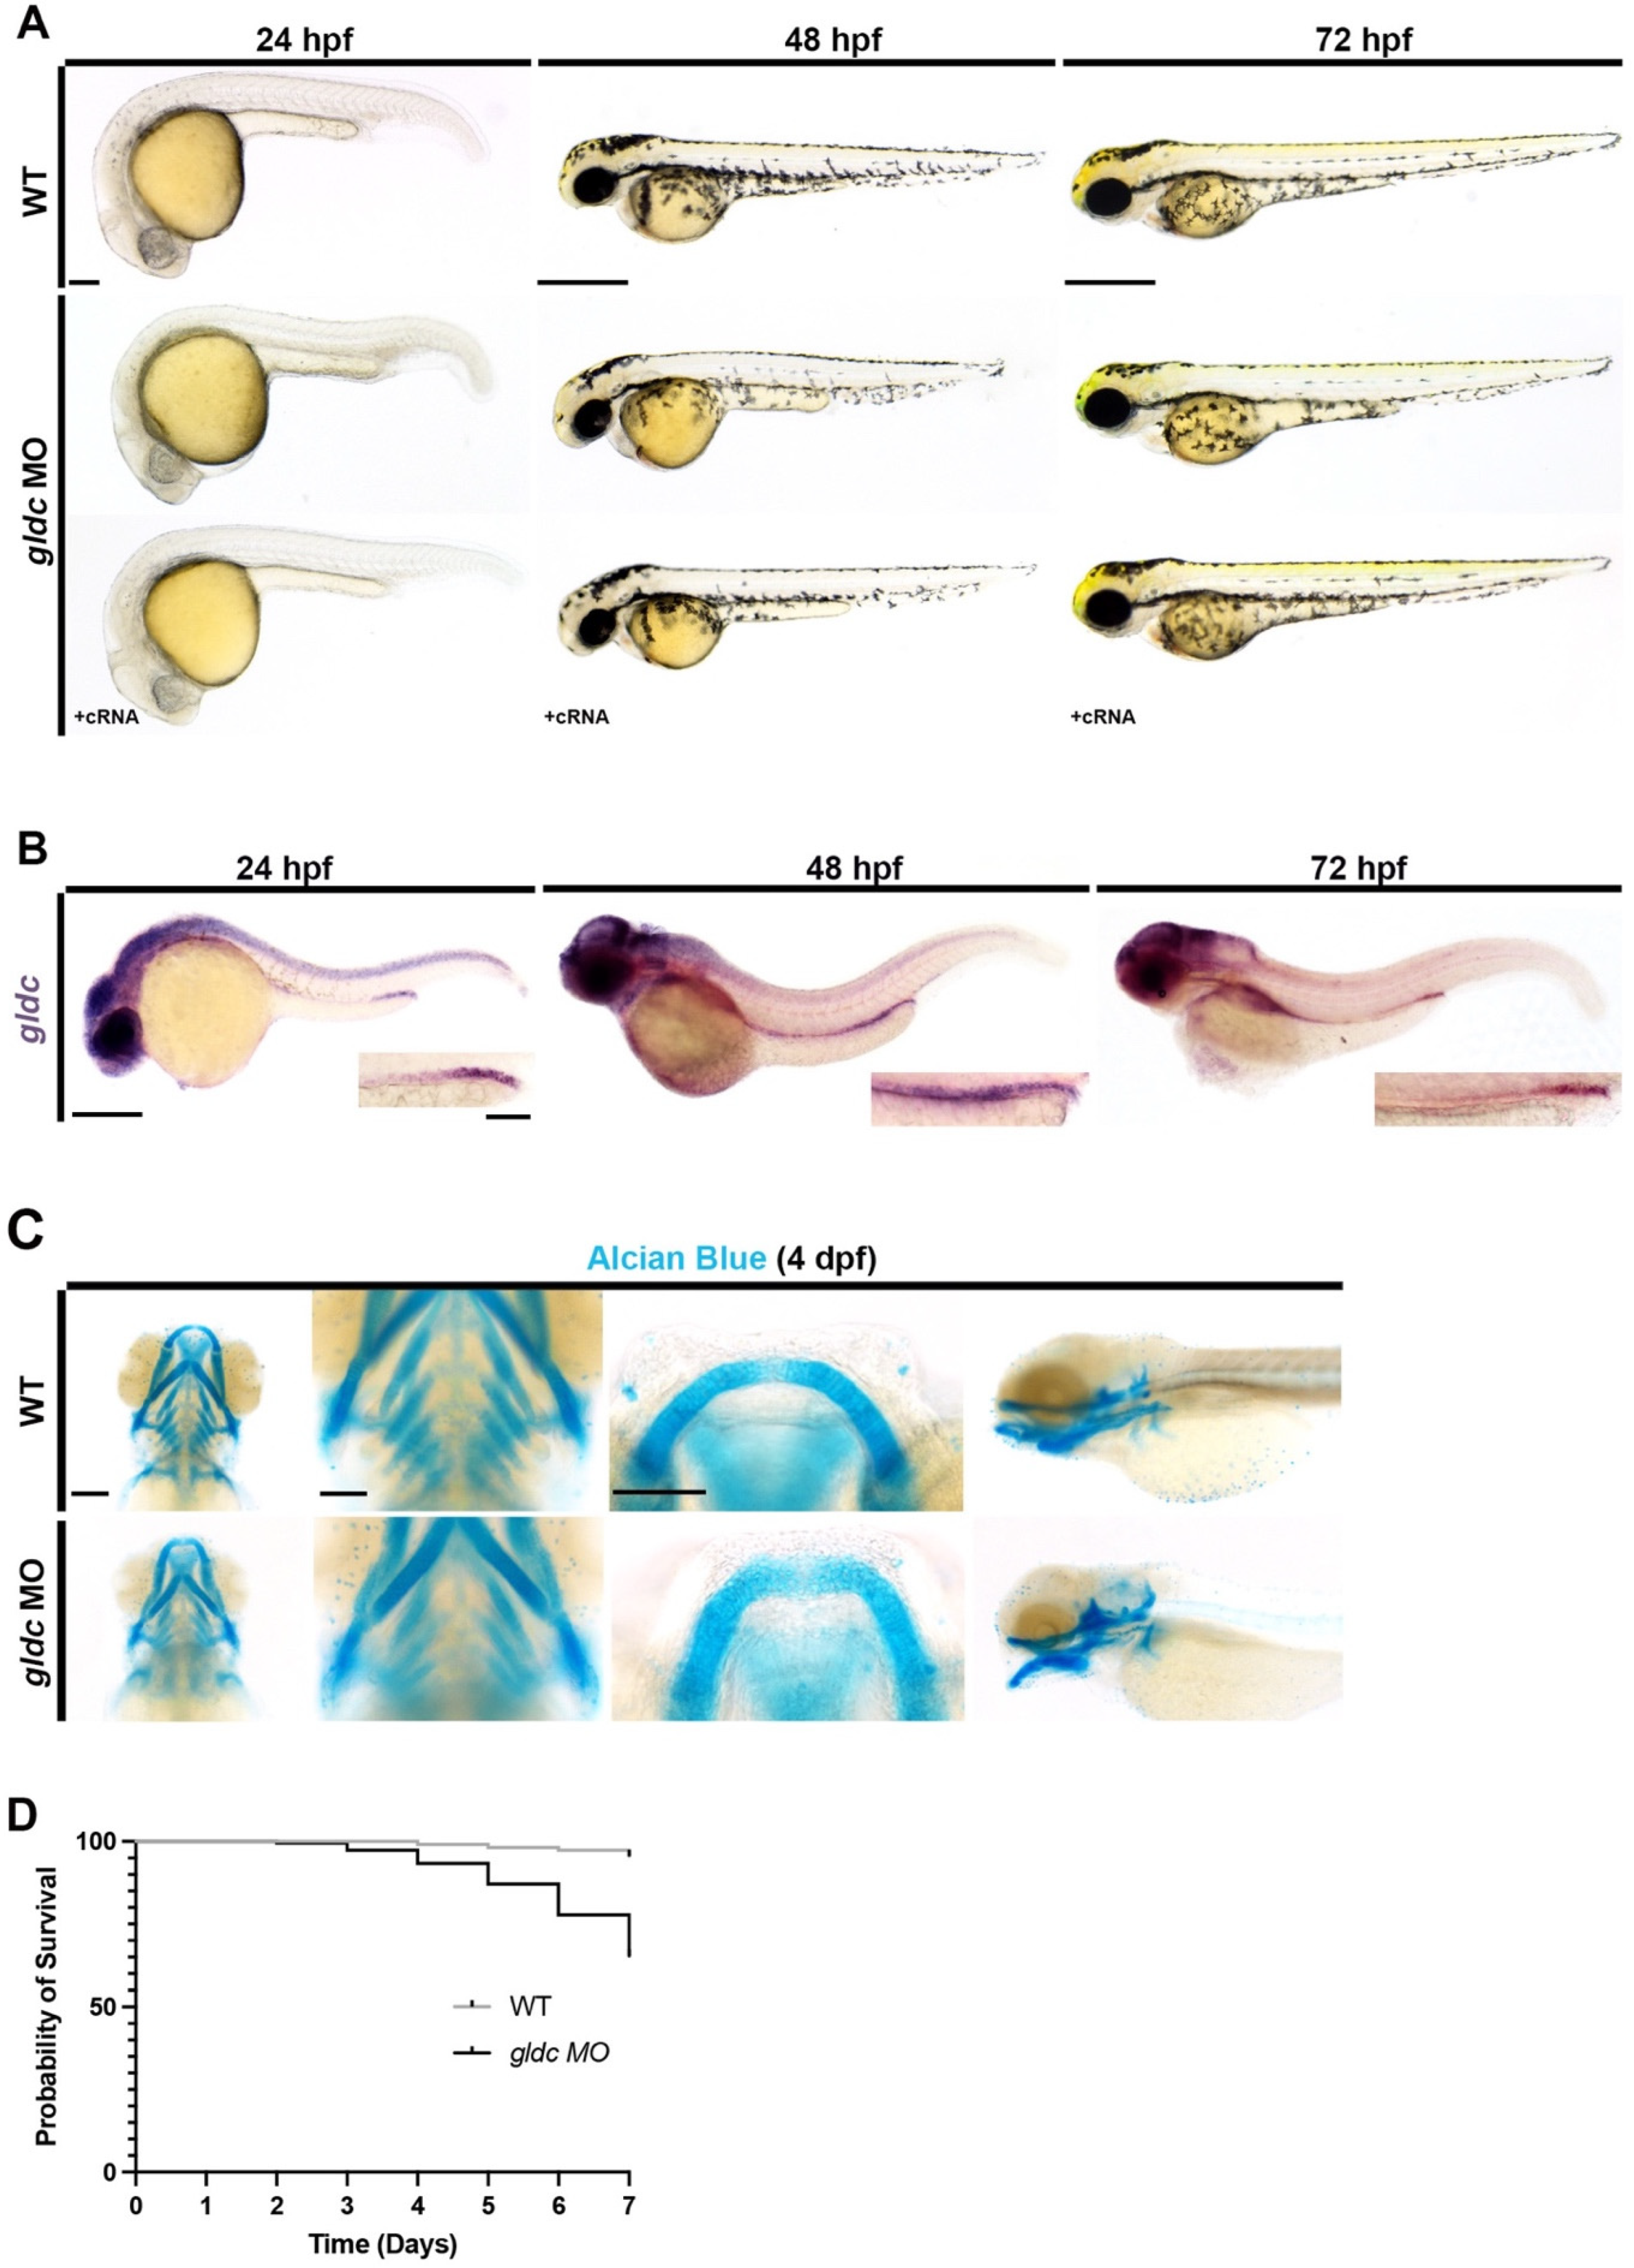
3.1. A Severe gldc Deficient Model Exhibits Phenotypes Consistent with Impaired Kidney Function

Previous studies reported a gldc deficient zebrafish model with behavioral characteristics similar to severe NKH cases [37]. However, these mutant larvae exhibited overall normal morphology [37]. This is intriguing, as data from human patients and murine Gldc knockout models suggest that severe physiological defects ensue across various tissues when normal expression of this gene is abrogated [9,10,11,12,13,38,39]. To expand on these previous studies, we aimed to create a severely gldc deficient zebrafish model recapitulating the defects observed in GLDC/Gldc deficient humans and mice.
To survey gldc deficiency in zebrafish, we performed a loss of function study utilizing a splice-blocking morpholino oligonucleotide (MO). Upon RT-PCR and Sanger sequencing analysis, we found the MO resulted in the inclusion of intron 1 which produced a transcript encoding multiple in-frame premature stop codons (Supplemental Figure S1A,B). Upon surveying live phenotypes, we found that gldc morphants exhibited gray pallor in the head at 24 h post-fertilization (hpf), which typically indicates cell death in the area (Figure 1A) [40,41]. At 48 and 72 hpf, gldc deficient embryos exhibited mild pericardial edema and hydrocephalus, indicating impaired kidney function (Figure 1A) [42]. These phenotypes were rescued by provision of gldc cRNA (Figure 1A). Compared to their wild-type (WT) siblings, gldc morphants had a decreased percent survivability, recapitulating the lethality noted in patients and mammalian models of NKH (Figure 1D) [9,10,11,12,13,38,39].
Previous studies have documented extensive Gldc expression within the CNS and the kidney of embryonic mice [43]. In humans, GLDC is heavily expressed in tubular precursor cells [44,45]. To interrogate the expression pattern in zebrafish, we utilized the whole mount in situ hybridization (WISH) on WT embryos. At 24 hpf, gldc transcripts localized to the CNS and distal portion of the pronephros (Figure 1B). Expression in the CNS and kidney was consistent across several time points, and at 72 hpf, gldc transcripts were observed within the neck of the kidney (Figure 1B). Given the conserved and consistent expression pattern over several time points, we hypothesized that gldc is vital for nephron segmentation patterning.
Surveying of live phenotypes at 72 hpf revealed abnormalities in the beginning stages of jaw formation in gldc deficient animals (Figure 1A). In some NKH patients, micrognathia (an abnormally small jaw) or retrognathia (unusual position of the mandible) were observed [46,47]. To analyze this further in our model, we utilized Alcian Blue staining at 4 dpf to visualize the craniofacial cartilage of gldc morphants [30]. Upon knockdown, an overall change in the structure of the jaw was observed, with obvious alterations in Meckel’s cartilage (Figure 1C). Additionally, the number of pharyngeal arches decreased in morphants (Figure 1C).

3.2. gldc Deficient Zebrafish Display Phenotypes Consistent with Gldc Deficient Mammals

Alterations in brain patterning, ventricle size, and neural tube development have been noted in mammalian models and humans with gldc deficiency [9,10,11,12]. Upon MRI imaging of the brains of NKH patients, the main phenotypes observed were ventriculomegaly and atrophy [10,11]. In Gldc deficient mice, some suffered from prenatal lethality due to neural tube defects, while those that survived exhibited enlarged ventricles and hydrocephalus [9,12]. We hypothesized that our morphant model would recapitulate some of the phenotypes seen in mammals.
First, we investigated migrating cranial neural crest cells, which migrate anteriorly to become a variety of tissues, including craniofacial cartilage and sensory ganglia [48]. The migrating neural crest cell population expressing dlx2 appeared disorganized, which may explain the alterations observed upon Alcian Blue staining (Figure 2A). Next, we analyzed several brain markers with WISH at 24 hpf. Upon analysis of MDS1 and EVI1 complex locus (mecom), a transcription factor known to be expressed in the rhombomeres [49], we found that gldc morphants exhibited altered patterning (Figure 2A). To further analyze rhombomere patterning, we utilized krox20, which is expressed in rhombomeres three and five. We found that the distance between rhombomere three and the back of the eye was increased in gldc morphants (Figure 2A,B). These changes suggest that gldc deficiency is impacting brain development in a similar manner to reports in mice and humans [9,10,11,12].
As ventriculomegaly is one of the main phenotypes of GLDC/Gldc deficiency in humans and mice, we aimed to examine the ventricles in gldc morphants [9,10,11,12]. After anesthesia, we injected dextran-rhodamine into the brain ventricles at 24 hpf and captured images immediately after [31]. gldc morphants exhibited enlarged ventricles compared to their WT siblings, recapitulating mammalian phenotypes (Figure 2B). To further analyze why the changes in brain morphology were occurring, we conducted an Acridine Orange (AO) assay to mark cells undergoing apoptosis in 24 hpf animals. A count of AO-positive cells revealed increased cell death in the head region of gldc deficient animals (Figure 2C,D). Additionally, we noted an increase in apoptosis within the pronephros (Figure 2C,E). Overall, we concluded that our model depicted more morphologically severe cases of gldc deficiency, reflecting what has been observed in humans and mice. Next, we strived to dissect how the kidney was affected by gldc knockdown.

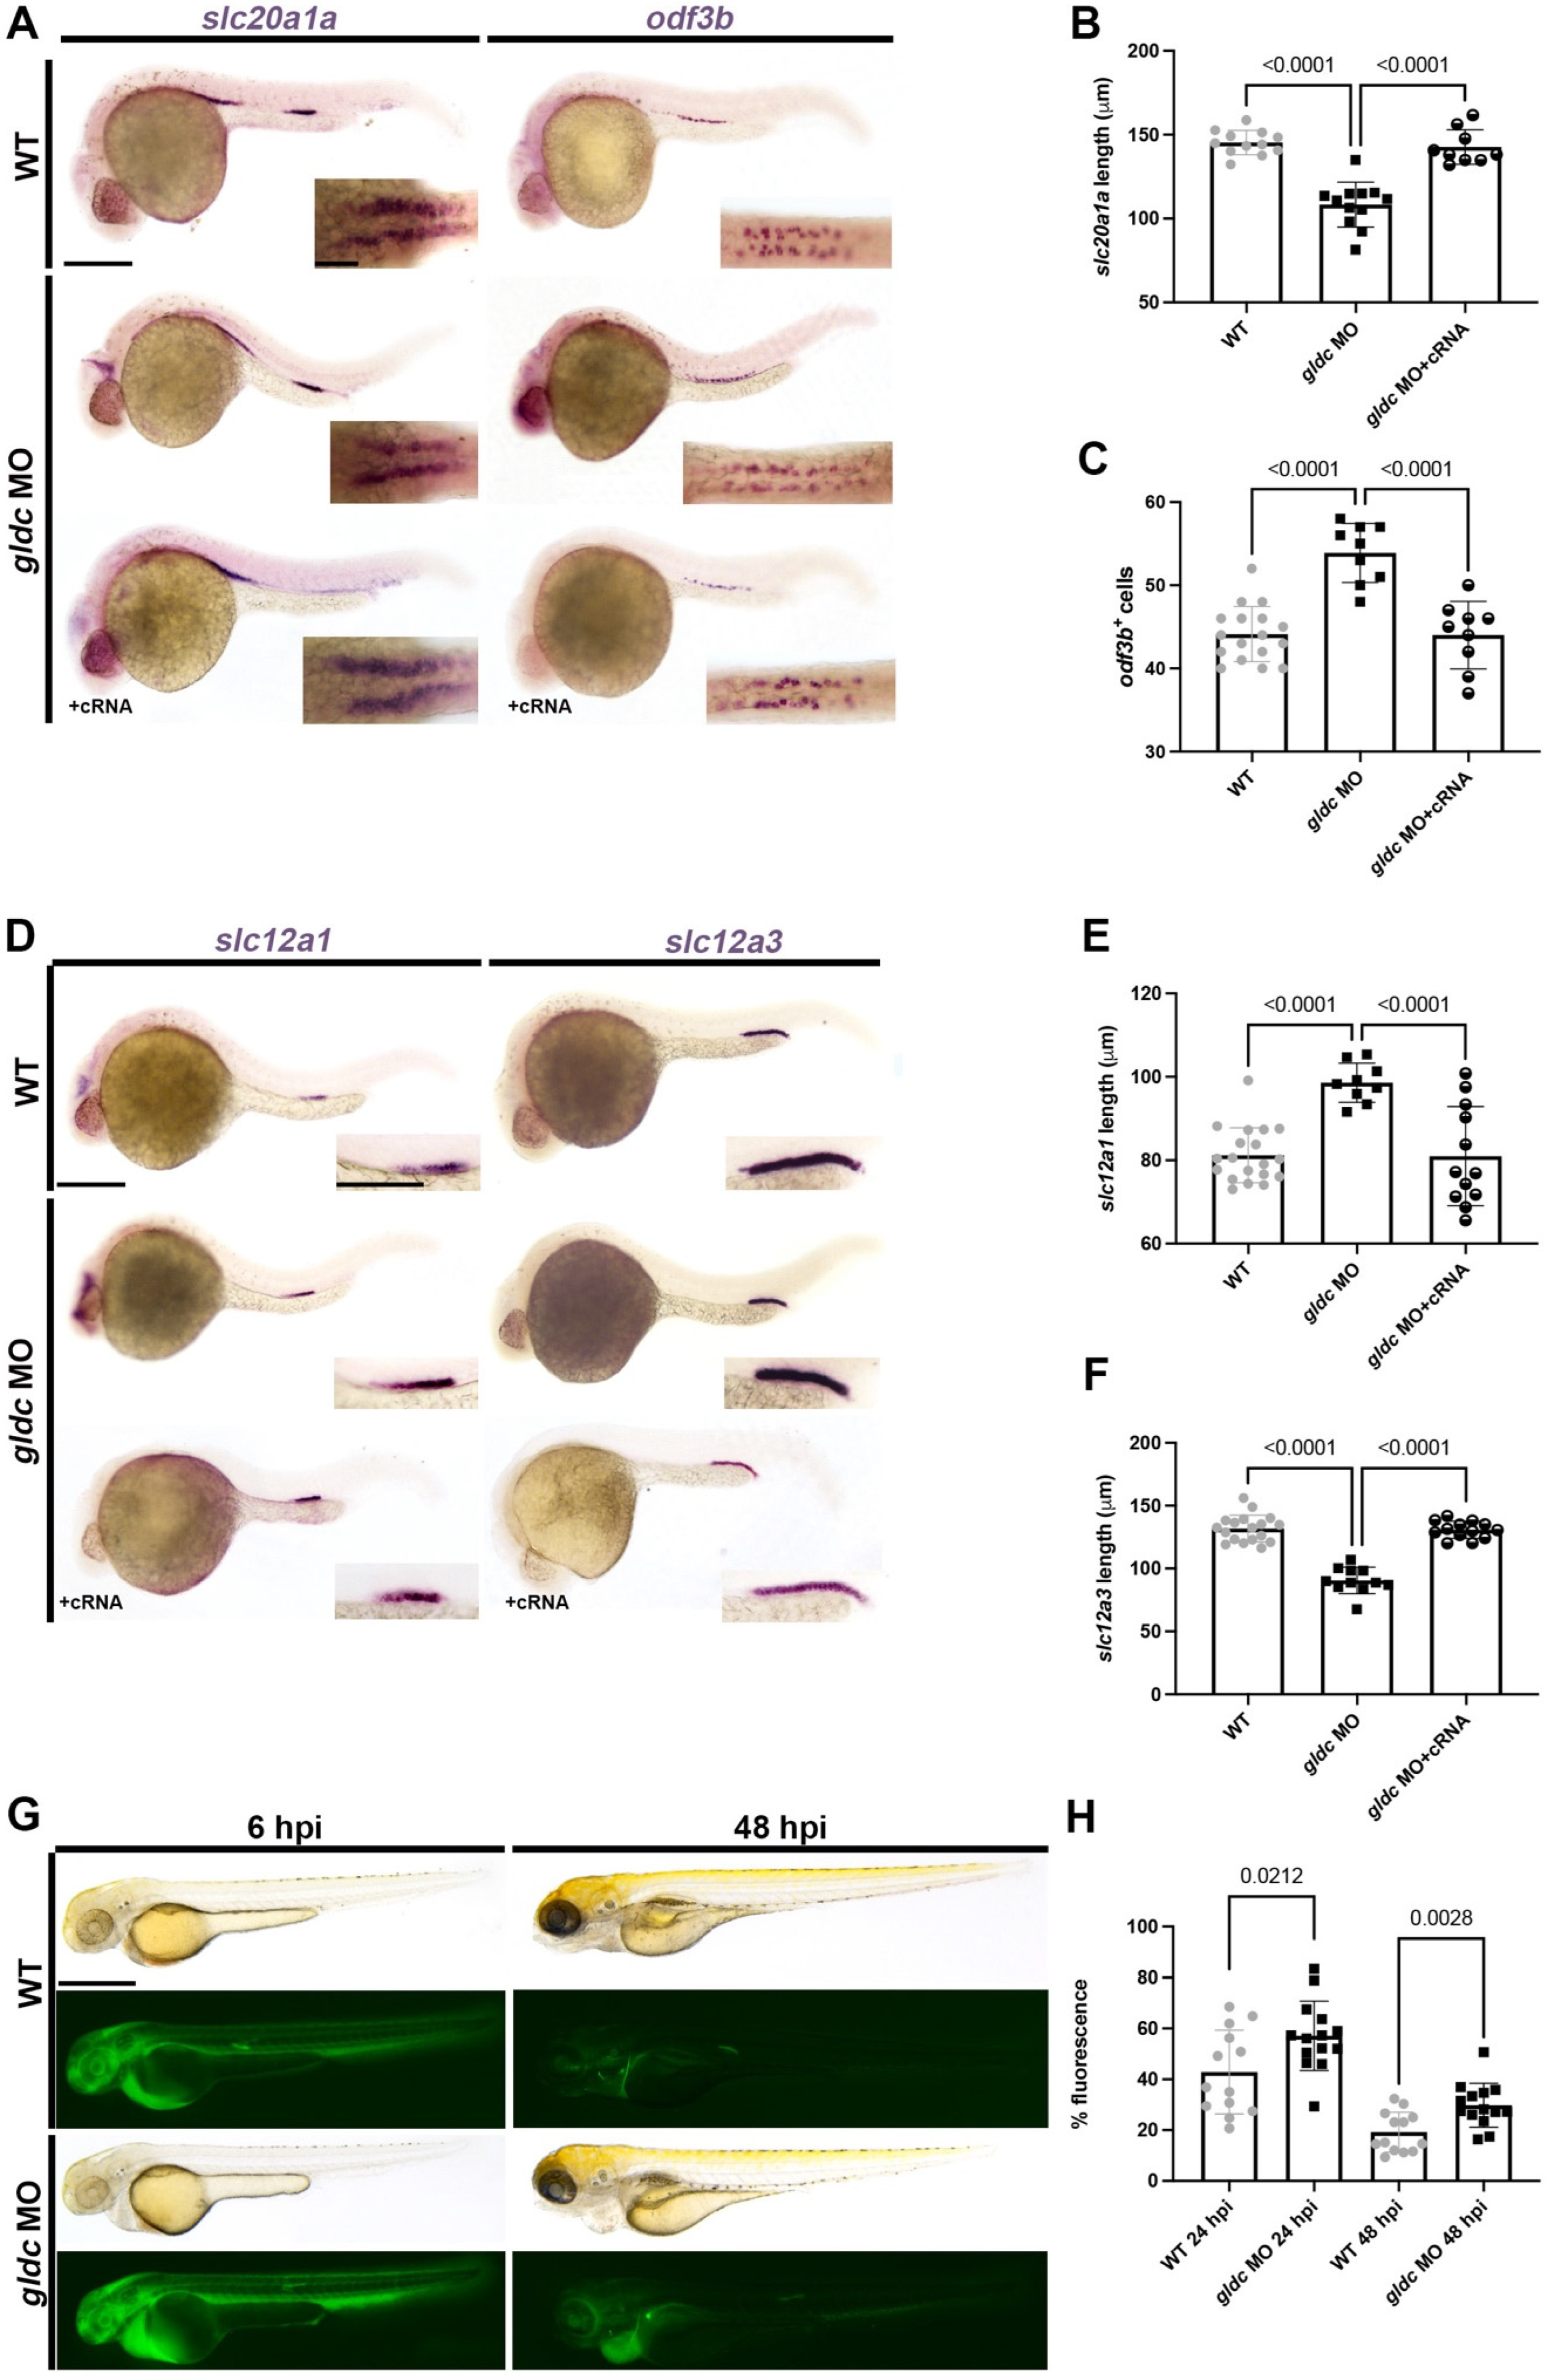
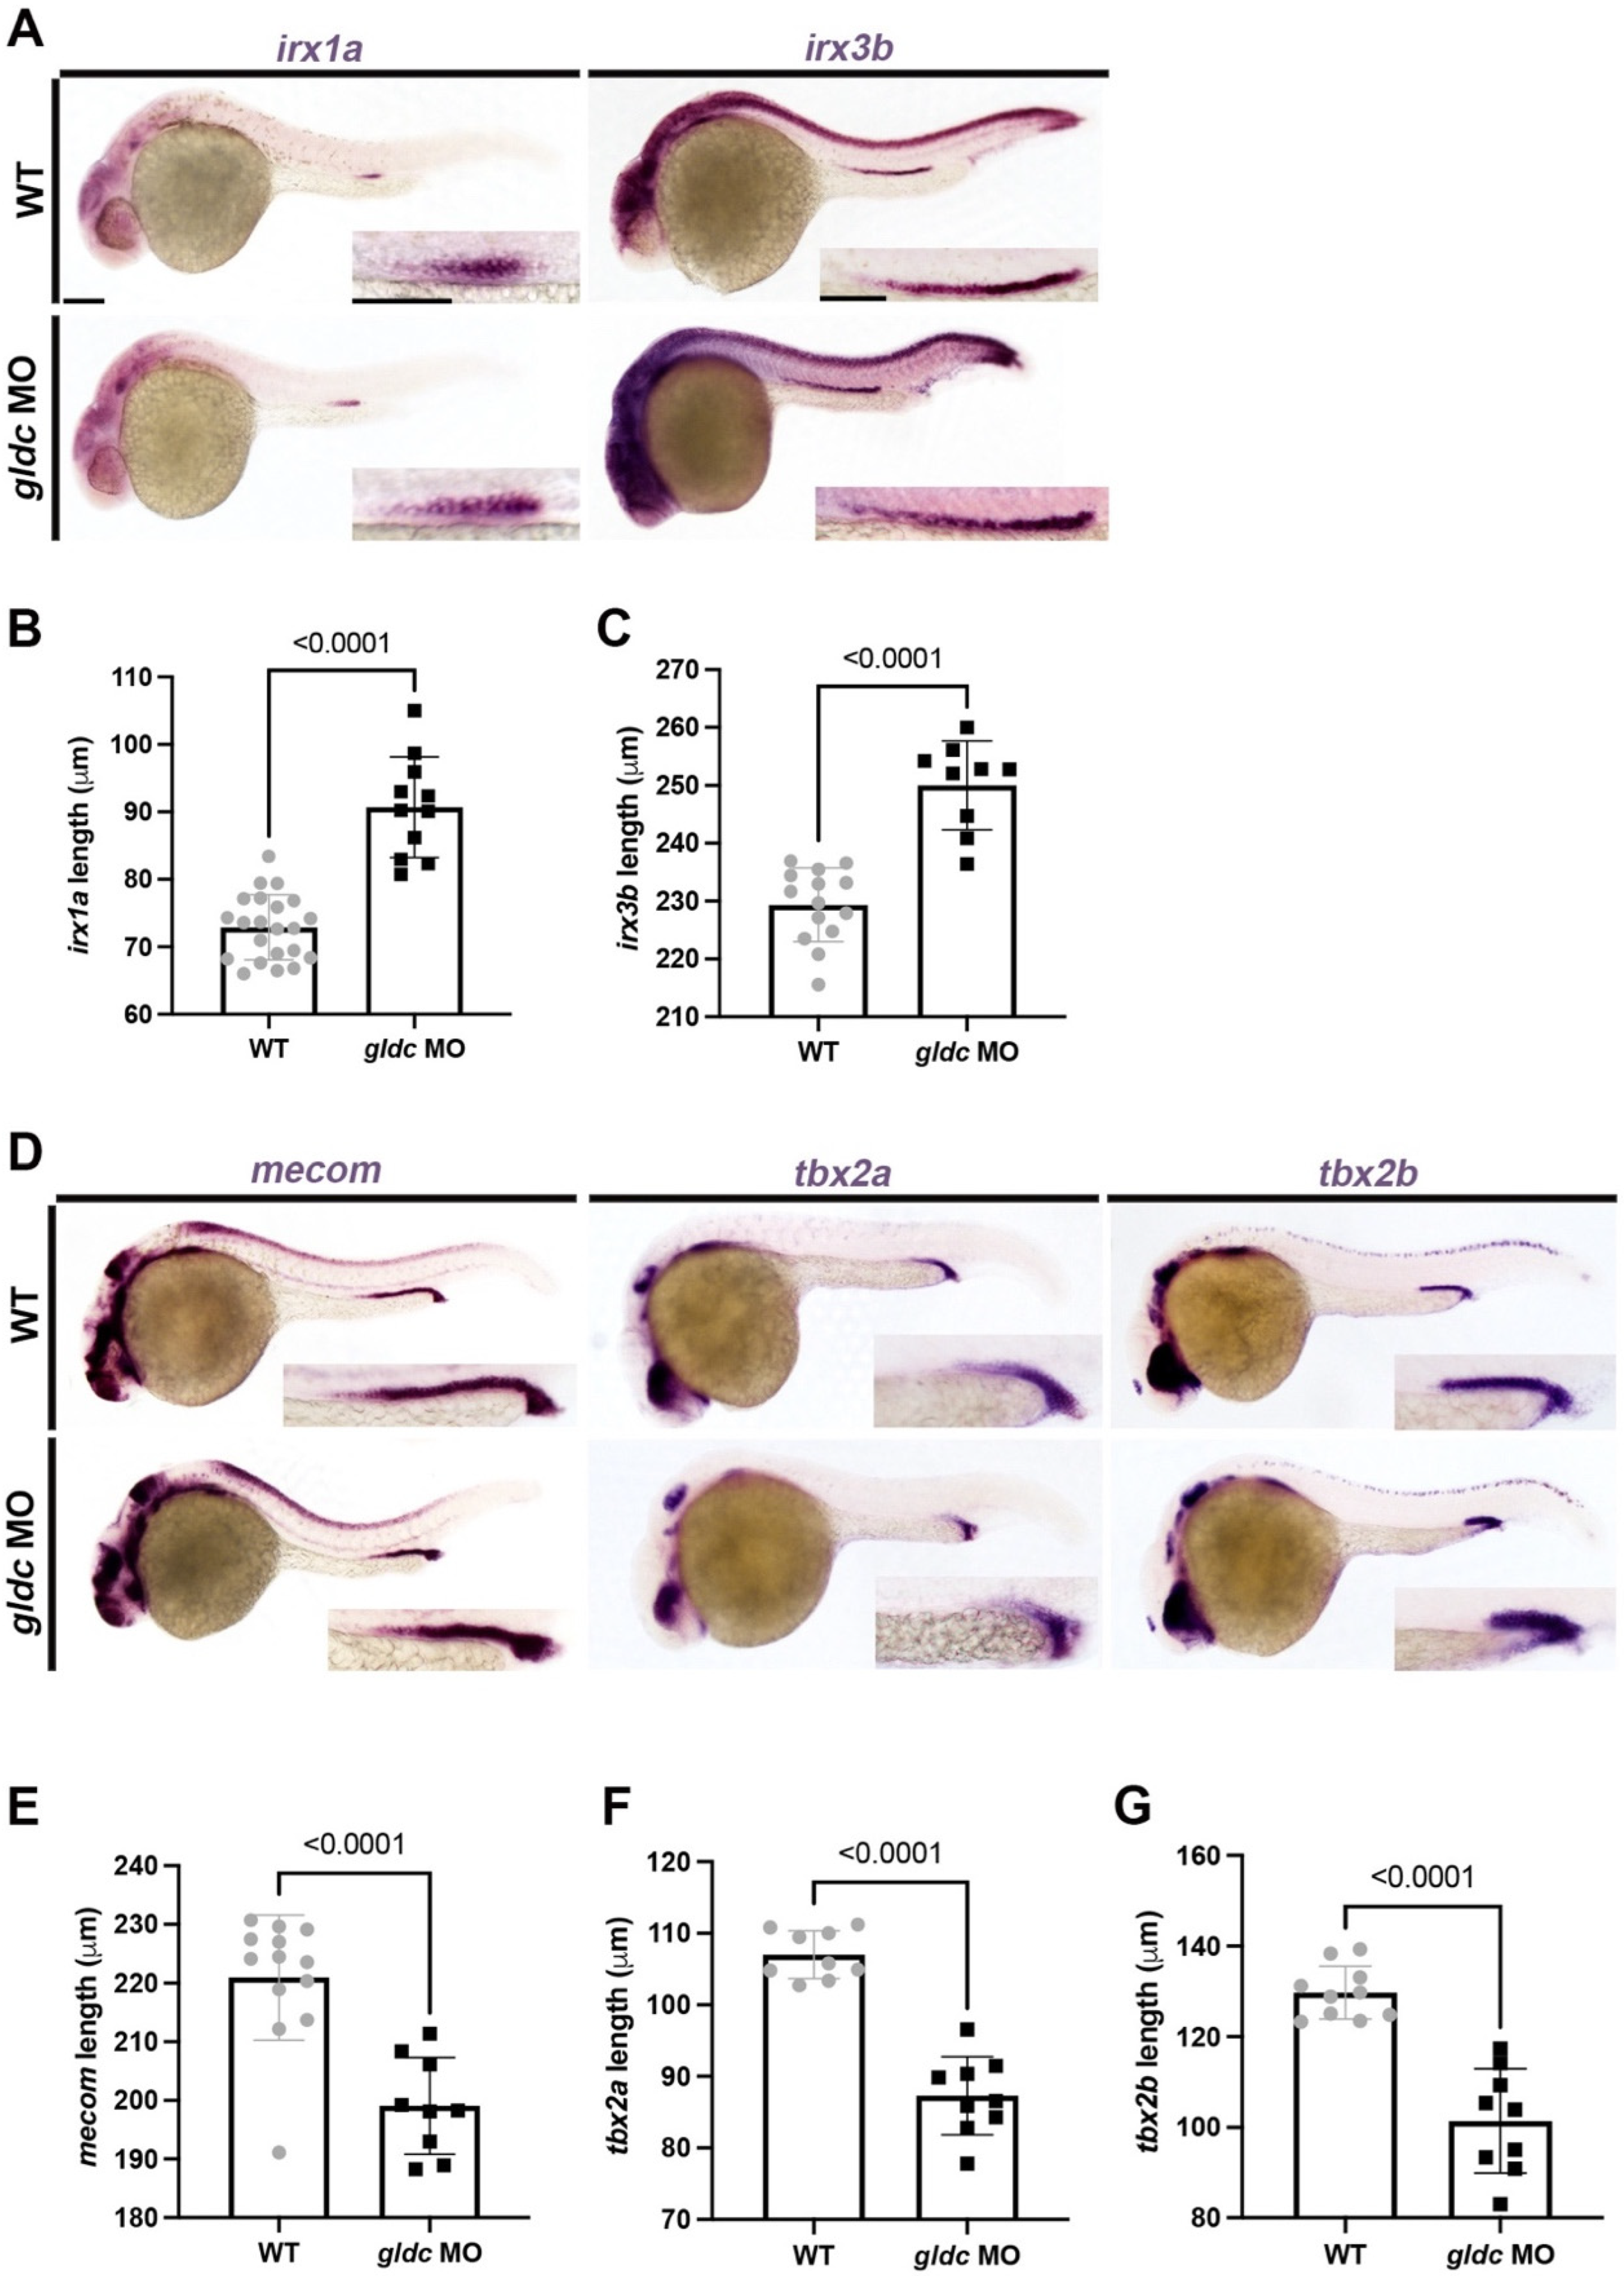
3.3. gldc Is Necessary for Proper Pronephros Segment Patterning

The zebrafish pronephros is composed of two nephrons that run parallel down the length of the body. The nephrons consist of a blood-filtering organ, the glomerulus, followed by two proximal and two distal segments [19]. Over the years, the zebrafish pronephros has provided a reliable and simplistic model to study kidney segmentation [15,16,17,20,22]. Nephron segmentation is a complex genetic process that involves the specification of transporter cells responsible for solute reabsorption and secretion [15], and occurs rapidly during zebrafish ontogeny over the first 24 hpf [19,21,49,50,51,52]. We have observed the presence of GLDC/Gldc/gldc transcripts within the developing kidney in human, mouse, and zebrafish (Figure 1C) [43,44,45]. Animals deficient in gldc exhibited fluid retention and increased cell death in the pronephros, suggesting kidney impairment (Figure 1A). Therefore, we hypothesized that gldc plays a role in pronephros development.
To assay for different populations within the zebrafish pronephros, we utilized WISH of 24 hpf animals to quantify alterations in gldc deficient animals. gldc morphants exhibited a reduction in the proximal convoluted tubule (PCT), marked by slc20a1a (Figure 3A,B) [19,21]. The trpm7 domain, which marks transporter cells in the proximal straight tubule (PST) [19,21], did not change upon gldc knockdown (Supplemental Figure S2A,B). We also assayed another population in the PST, the multiciliated cells (MCCs) [53,54,55]. MCCs are specialized cells for fluid propulsion [56]. gldc dysfunction led to an increased number of cells expressing odf3b, an established MCC marker (Figure 3A,C) [35,41,53,55,57]. Next, we analyzed the distal segments, which are homologous to the mammalian thick ascending limb (TAL) and distal convoluted tubule [19,21]. Knockdown of gldc caused a significant expansion of the distal early (DE) tubule and a significant reduction of the distal late tubule (DL) (Figure 3D–F). The segment and MCC phenotypes were rescued by co-injection of gldc cRNA, validating that gldc knockdown is specifically altering segment patterning (Figure 3A–F). There was no significant difference in the total length of the tubule when compared to the body length (Supplemental Figure S2C,D). This indicates that the changes in segments are not due to a decrease in body size, but alterations in the nephron structure.
Due to changes in both live phenotypes and nephron segmentation, we aimed to analyze whether the nephrons were properly functioning in our morphants by assessing renal clearance [42]. At 24 hpf, we performed intramuscular microinjections of dextran-FITC to introduce the fluorescent molecule into circulation (Figure 3G) [58,59,60]. At 6 hpi, we imaged injected animals to establish a baseline fluorescent intensity. The WT and gldc morphants were then imaged at 24 hpi and 48 hpi. We found that gldc morphants were unable to eliminate the dextran-FITC molecules as efficiently as their WT counterparts. Therefore, the gldc morphants had a higher percent fluorescence at both 24 hpi and 48 hpi (Figure 3H). Based on these results, we conclude that gldc has a role in proper nephron segmentation and kidney function. Due to the distal expression pattern of gldc, we aimed to further analyze the patterning of the distal domain.

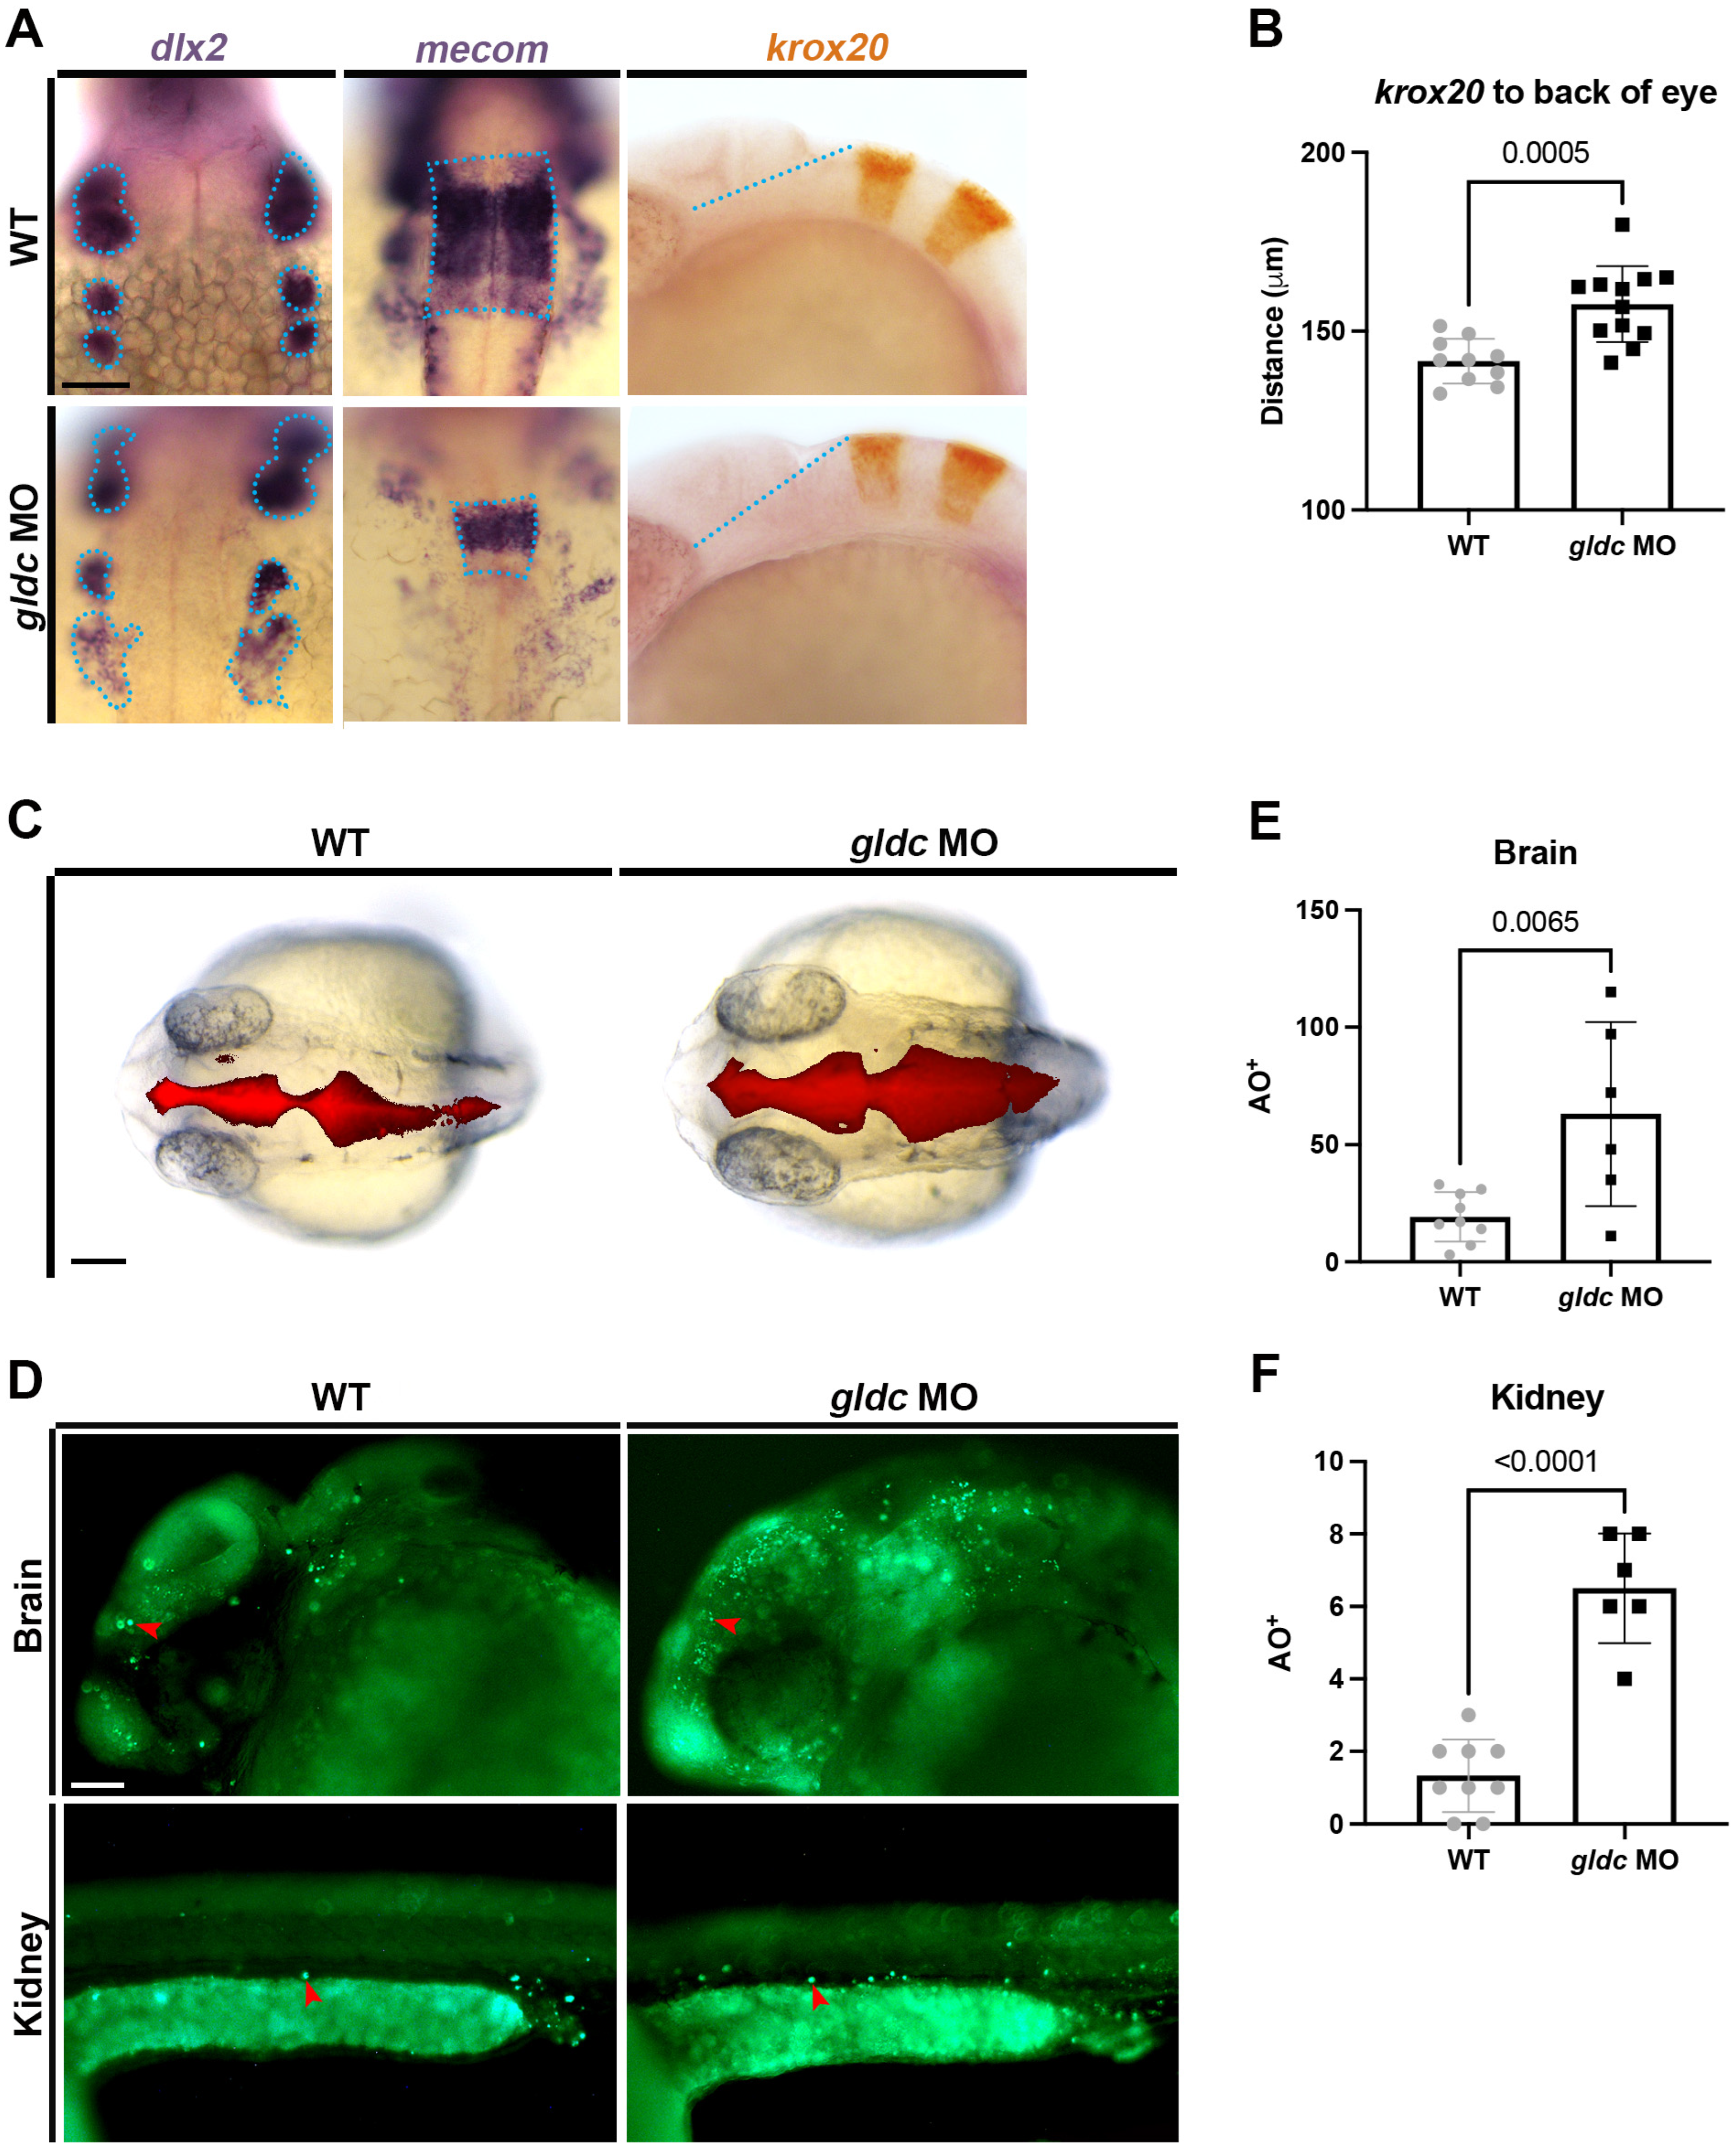
3.4. Loss of gldc Affects DE and DL Precursor Populations

Previous research has shown that Iroquois homeobox transcription factors irx1a and irx3b are necessary for DE differentiation in the embryonic nephron [21,61,62]. Specifically, irx3b works upstream of irx1a to eventually pattern slc12a1+ cells [21,61,62]. To analyze if gldc interacts with these factors, we began by utilizing WISH to examine the expression domains of irx1a and irx3b. We found that upon gldc knockdown, there was a significant expansion of both the irx1a and irx3b domains (Figure 4A–C).
The transcription factor, MECOM, is heavily expressed in the human kidney [63]. In the Xenopus, Mecom is an essential part of nephron patterning [64]. More specifically, the loss of function of mecom in the zebrafish leads to a decreased DL segment, suggesting an important role in the specification of this domain [49]. Other transcription factors have been reported to be important in distal patterning as well. For example, in Xenopus, Tbx2 is responsible for demarcating the boundaries of the pronephros [65]. Loss of function causes an elongation of the nephrons [65]. Conversely, in the zebrafish, T-box transcription factors tbx2a and tbx2b have been found to be sufficient to promote DL differentiation [66]. Additionally, these factors have been noted to be negatively regulated by retinoic acid signaling [66]. Because of the changes in the slc12a3+ population in our gldc morphants, we hypothesized that the mecom and tbx2a/b domains would be affected as well. To test this, we conducted WISH on 24 hpf animals and measured the domain lengths. We found that gldc deficiency caused a significant decrease in the length of the mecom, tbx2a, and tbx2b domains (Figure 4D–G). Therefore, dysfunction of gldc perturbs the expression patterns of these factors in renal progenitors, eventually causing alterations in segment domain size.

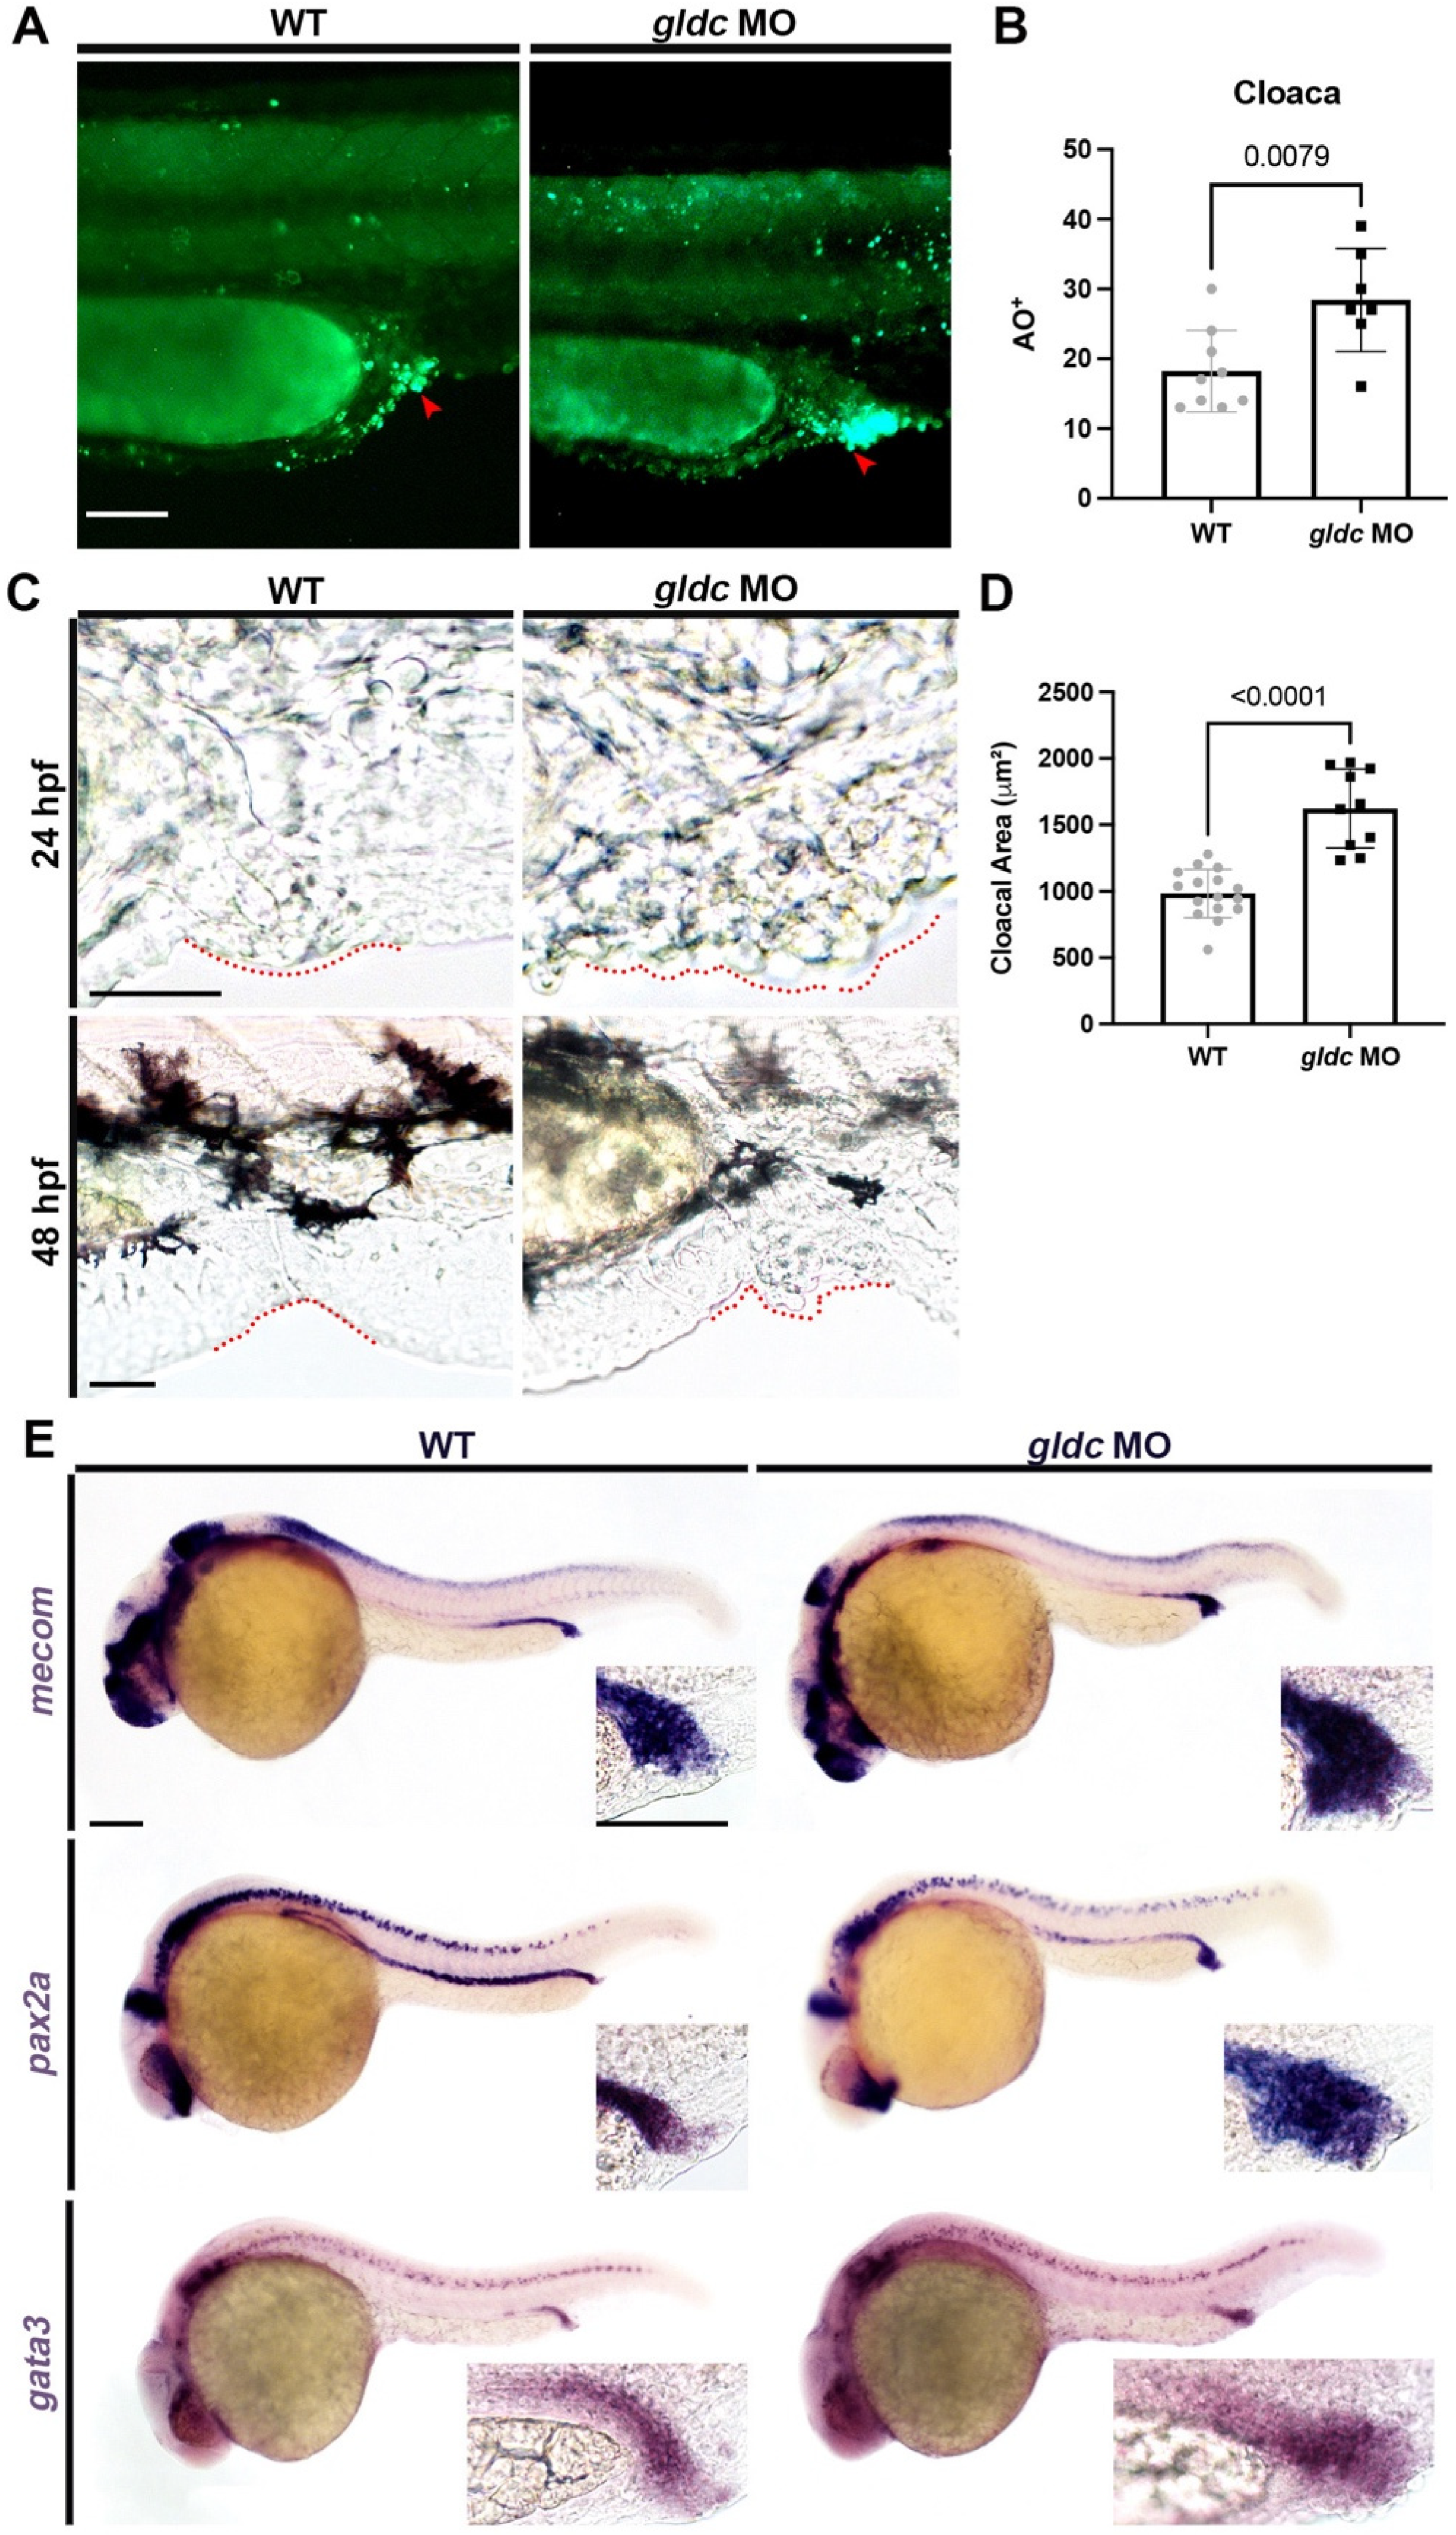
3.5. gldc Morphant Cloacae Exhibit Increased Levels of Apoptosis and Structural Abnormalities

While conducting the AO assay, we noted the cloaca had a significant increase in apoptosis upon gldc knockdown (Figure 5A,B). The cloaca functions as the common opening for the gut and urogenital tract in amphibians, reptiles, birds, and some species of fish [67]. Similar to the kidney, it is derived from ventral mesoderm [67]. Researchers have found that Bmp signaling is essential for the proper formation of the cloaca; however, little is known about the specific genetic signaling cascades that lead to its development [67]. In gldc morphants, we found an inability to properly filter out dextran-FITC once in circulation (Figure 3G). Besides alterations in nephron segmentation, another potential explanation for molecular retention is physical abnormalities in the urogenital opening. Upon live imaging, we found the cloacal structure was altered in gldc deficient animals (Figure 5C). At 24 hpf and 48 hpf, imaging revealed clusters of cells aggregating at the cloaca (Figure 5C). We utilized WISH of pax2a, mecom, and gata3 to better visualize this area (Figure 5E). Next, we measured the area of the cloaca and found that gldc deficient animals had an increased area compared to their WT siblings (Figure 5D). Overall, gldc deficiency leads to increased apoptosis in the cloaca, alterations in structure, and a significant increase in the cloacal area. The molecular mechanisms underlying morphological changes in gldc morphants were unclear. Due to the role of gldc in the GCS, we aimed to investigate whether excess glycine caused similar phenotypes to the morphants.

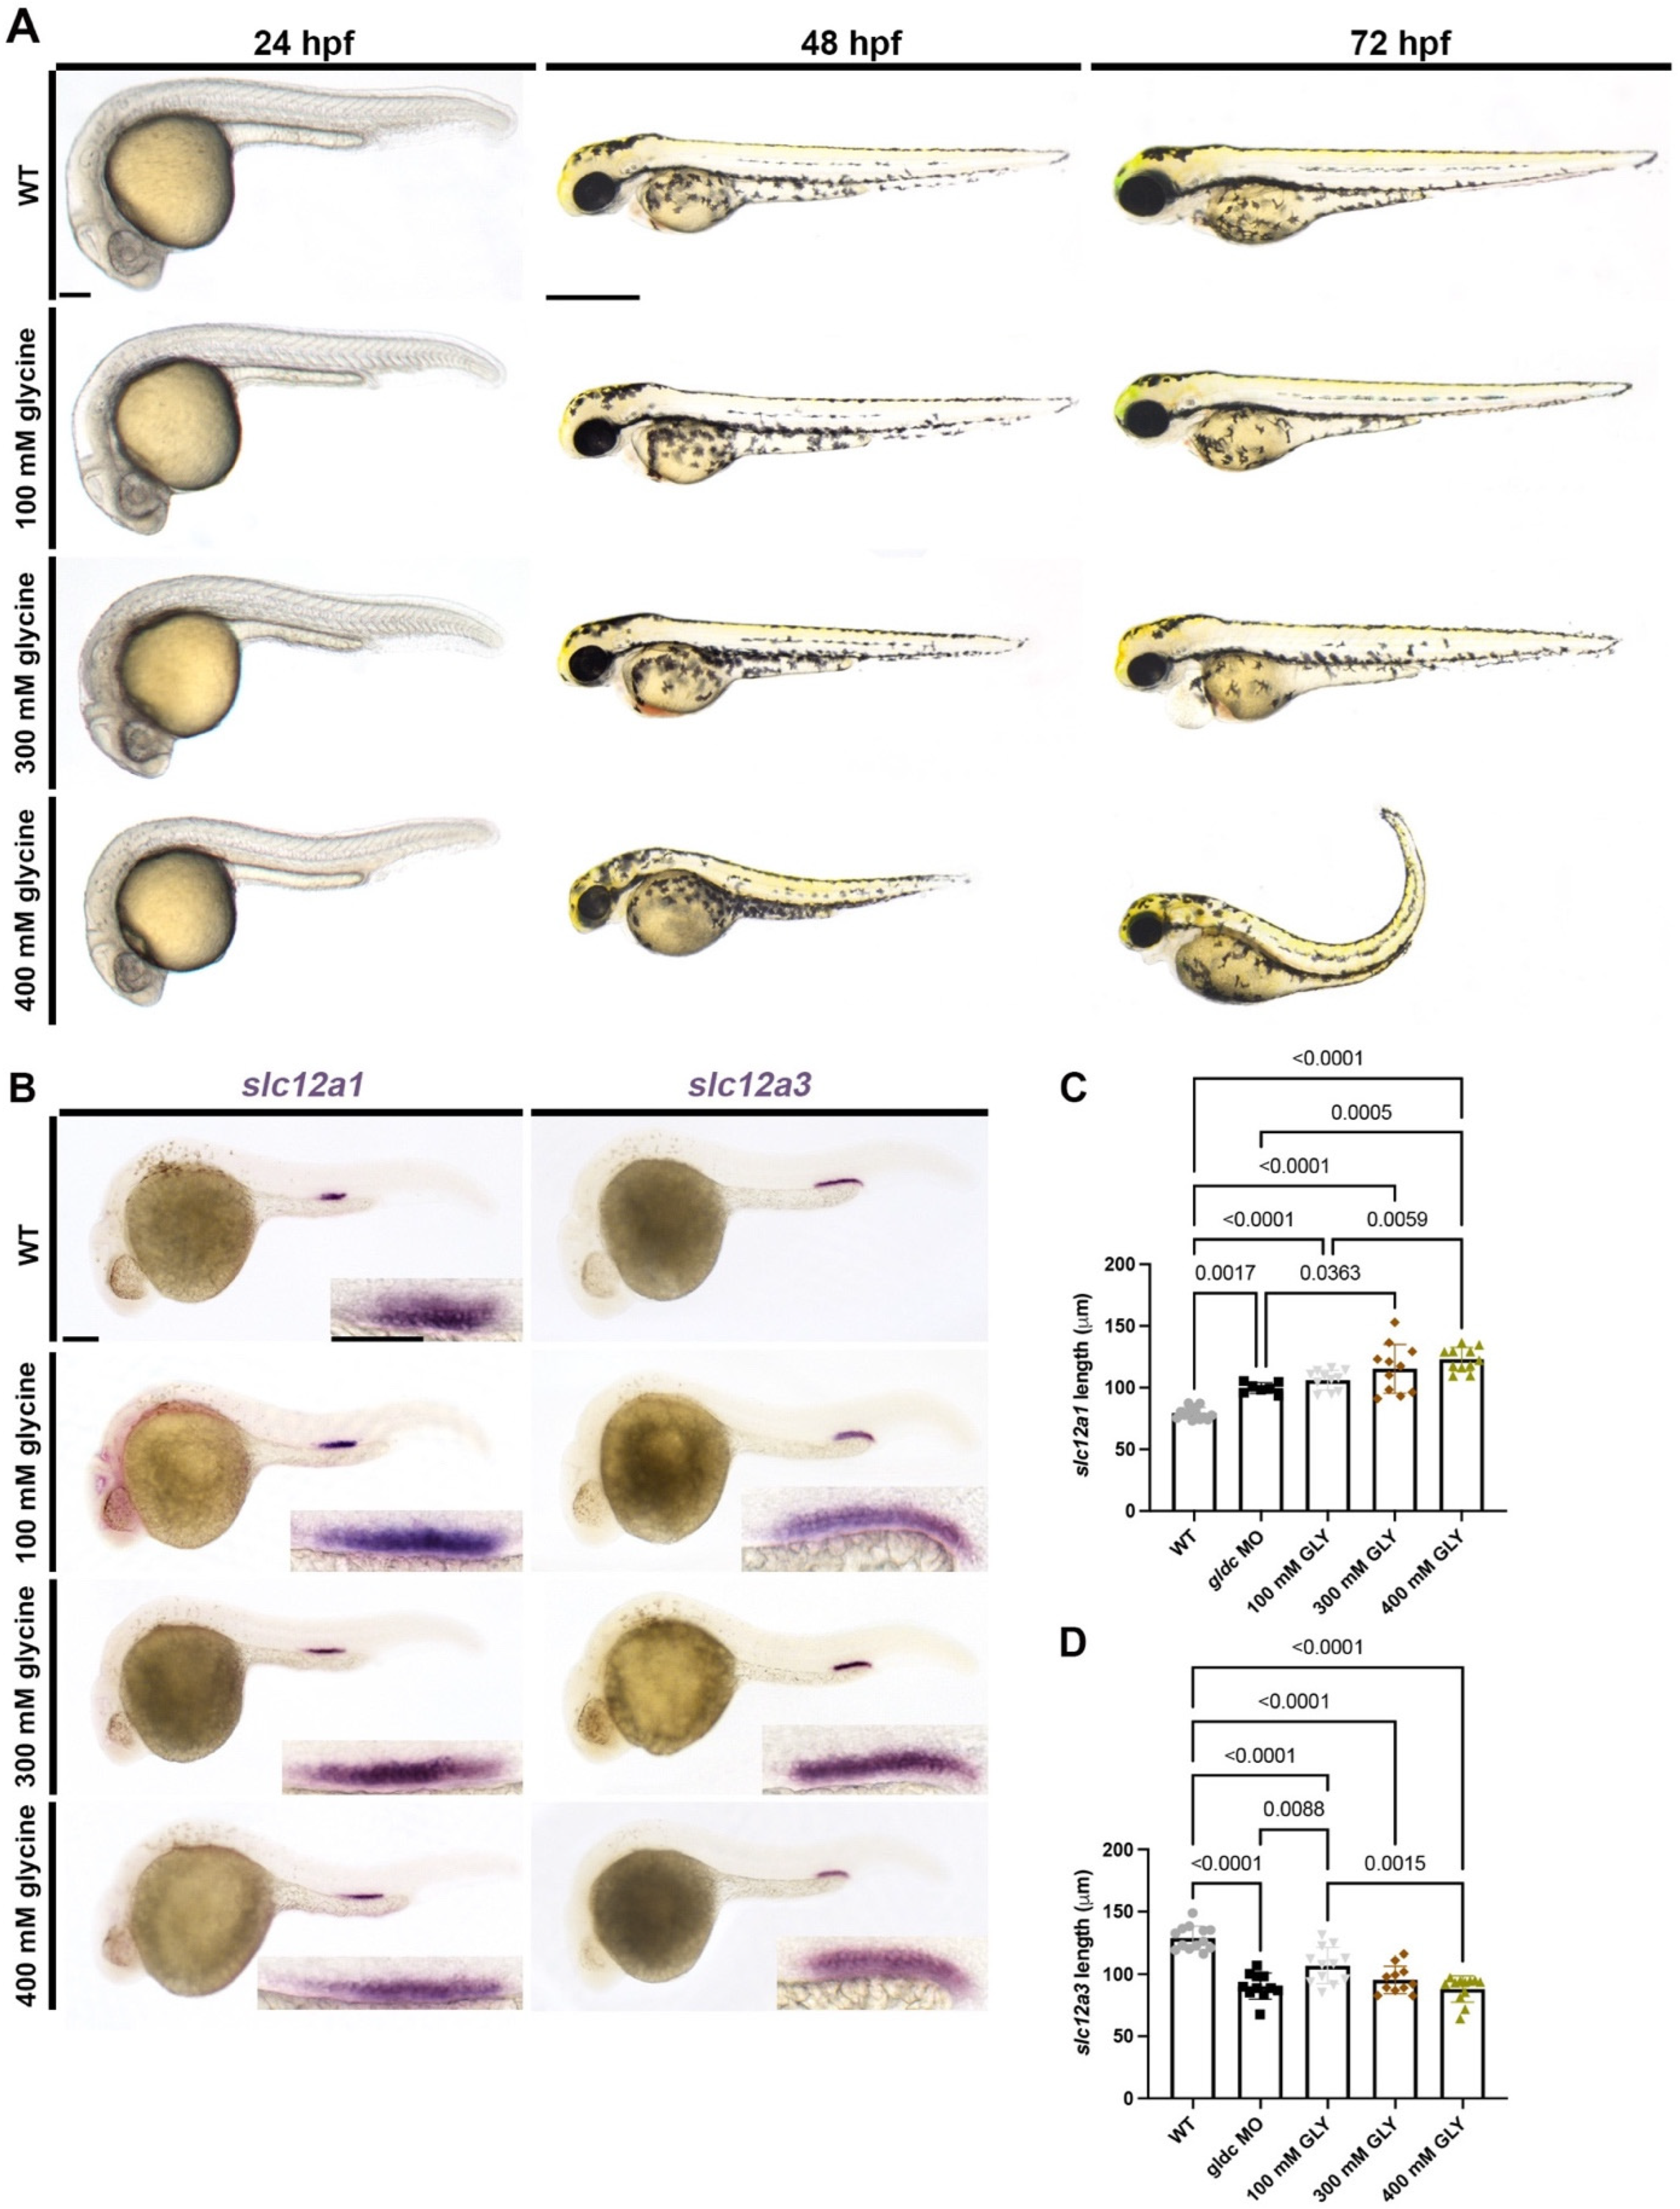
3.6. Exogenous Glycine Treatment Recapitulates the Live Morphology and Segment Patterning of gldc Deficient Embryos in a Dose-Dependent Manner

In humans and mice, dysfunctional GLDC/Gldc causes increased levels of glycine within the plasma and urine [9,38,68,69]. However, the exact implications excess glycine has on developmental processes are still unknown. Glycine is a simple amino acid that acts as both an excitatory and inhibitory neurotransmitter [70,71]. Additionally, glycine-treated zebrafish have been shown to have altered vasculature development in a dose-dependent manner [36]. To analyze whether glycine has an effect on kidney development, we began by bathing embryos in varying concentrations of glycine beginning at the 50% shield stage. Live imaging at 24 hpf revealed little differences between WT and treated embryos (Figure 6A). At 48 hpf, pericardial edema becomes evident at 300 mM and 400 mM doses (Figure 6A). Multiple phenotypes are observed at 72 hpf, such as pericardial edema, hydrocephalus, and aberrant jaw morphology (Figure 6A). These phenotypes become more severe with higher doses, and at 400 mM, extreme body curvature is present (Figure 6A). We utilized WISH to analyze whether differentiated distal kidney populations were altered in drug-treated animals. We found that glycine-treated embryos exhibit an expanded DE domain and a reduced DL domain in a dose-dependent manner (Figure 6B–D). These trends are consistent with what we noted in our gldc deficient embryos, suggesting that gldc knockdown causes an increase in glycine which influences tissue development and nephron segment patterning.

4. Discussion

Mutations in GLDC account for about 75% of NKH cases, causing a wide variety of symptoms including seizures and developmental delays [4]. Upon investigating Gldc deficiency in mice, researchers found animals exhibit dilation of brain ventricles, hydrocephalus, and alterations in brain structures [9,10,12,72]. Additionally, GLDC/Gldc has been linked to neural tube defects (NTDs) in humans and mice, further implicating its role in development [9,39,72,73]. Until our study, prenatal lethality in Gldc deficient mice prevented the analysis of early developmental processes. Here, our research suggests that we created a more morphologically severe model of gldc deficiency in zebrafish.
In a paper by Riché et al. [37], researchers created a gldc deficient zebrafish model to assess behavioral defects and metabolic disruptions. While their model had severe motor phenotypes, the overall morphology of the gldc mutant animals was relatively normal. Here, we aimed to create a zebrafish model to recapitulate the severe anatomical phenotypes observed in humans and mouse models with Gldc/GLDC genetic alterations. In Gldc deficient mice, hydrocephalus and ventriculomegaly were among the most prominent phenotypes [9,12,39,72]. At 48 hpf, initial surveillance of live phenotypes in our morphant zebrafish revealed mild hydrocephalus and pericardial edema, suggesting impaired fluid homeostasis. Additionally, morphants experienced decreased survival rate, similar to human patients and mice [3,9,12]. Surveying at 72 hpf revealed malformations of jaw development in gldc deficient embryos. In a study of NKH patients, ~30% of the test subjects presented with micrognathia [46]. Utilizing Alcian Blue, we found disturbances in the craniofacial cartilage. Specifically, there were disruptions in the Meckel’s cartilage and a decreased number of pharyngeal arches. We aimed to further analyze the patterning of the jaw and validate our model through analysis of neurological phenotypes.
Zebrafish craniofacial cartilage is patterned by cranial neural crest cells that migrate from the rhombomere regions anteriorly [30]. The migrating neural crest cells expressing dlx2 in gldc morphants were oriented in a disorganized pattern compared to their WT counterparts. Disorganization in migration may explain the abnormalities in craniofacial cartilage. We also aimed to analyze the rhombomeres as they are a vital aspect of brain development and house cranial neural crest cells [30]. In vertebrates, rhombomeres are a segmented phase of the neural tube that later gives rise to the hindbrain [74]. Upon WISH, we found rhombomere patterning in our morphants was altered. Analysis of mecom, found to be expressed in rhombomere four, revealed an atypical expression pattern [64]. Other rhombomeres were affected, as the location of rhombomere 3 (marked by krox20), shifted posteriorly.
NKH patients exhibit diffusion restriction in the cerebellum due to fluid accumulation and decreased myelination in the pons over time [3,8,11,75]. These areas are developed from the rhombomeres [76], which were altered in our gldc morphants. Additional phenotypes noted in MRIs are cortex atrophy, widened ventricles, and a thinning of the corpus callosum [3,8,11,75]. Murine models of Gldc deficiency exhibit hydrocephalus, ventriculomegaly, neural tube defects, impaired fluid flow, and aqueduct stenosis [9,12,72,76]. In gldc morphants, ventriculomegaly was evident, recapitulating what has been noted in Gldc deficient mice and NKH patients. We were curious how gldc knockdown was causing brain anatomy alterations in our morphants. Upon further research, we found that GLDC has many important roles including regulating glycine levels and glutathione production in the liver [77]. Glycine is a simple amino acid that enhances anti-oxidative functions, improves protein synthesis, and is a building block for a variety of compounds, including glutathione [78]. Glutathione is imperative to controlling immune responses, breaking down nutrients, and providing protection against reactive oxygen species (ROS) [77]. Because GLDC affects a wide variety of cellular processes, we decided to start by investigating cell death in knockdown animals. We visualized apoptosis patterns in our morphants with an Acridine Orange (AO) assay. In gldc morphants, we found an increase in apoptosis in the brain, and interestingly, we noted the same trend in the pronephric region. This apoptosis trend in the pronephros coupled with impaired fluid dynamics suggested abnormal kidney development.
The kidney is a vital organ that functions to transport and uptake solutes, eliminate waste, and maintain fluid homeostasis. In humans and mice, GLDC/Gldc is heavily expressed in the embryonic kidney [43,44,45]. Until now, gldc expression in the zebrafish has only been depicted in the central nervous system (CNS) [37,79]. However, across several time points, we found gldc transcripts expressed within the distal portion of the pronephros. Due to the conserved expression within vertebrates and consistent expression over time in the kidney, we hypothesized that gldc has an important role in nephron patterning. Upon WISH analysis, we found that gldc deficient animals had a decreased PCT domain length, which is the main region where glycine uptake occurs [80]. Another proximal cell type, MCCs, increased in number as a result of gldc knockdown. MCCs are important in maintaining proper fluid homeostasis as they help propel fluid along the tubule [35,41,53,54,55]. The distal segments, vital for ion uptake and water reabsorption, were affected by gldc knockdown. The DE tubule increased in length, while the DL tubule decreased in length, creating an imbalance in the specified cells in this region. Segment changes can lead to impaired kidney performance. To assess whether these alterations in differentiated cell populations were affecting kidney function, we utilized dextran conjugated FITC to visualize fluid retention. We found that gldc morphants were unable to excrete the dextran FITC as efficiently as WT animals. These results are similar to humans with GLDC deficiency, as kidney defects have been briefly described in addition to a wide variety of other symptoms [47,81,82]. To dissect how gldc knockdown perturbs the distal genetic pathway, we analyzed factors that pattern these tubules.
The DE and DL domains in the zebrafish are analogous to the mammalian thick ascending limb (TAL) and distal convoluted tubule (DCT), respectively [19,20]. The TAL and DCT have various functions but are vital to water and electrolyte balance and acid-base homeostasis [83,84]. The GCS functions on the mitochondrial membrane, and DCT cells are rich in mitochondria, making them relevant to our studies [84]. The genetic cascades that lead to the differentiation of the DE and DL are not well understood. However, there are transcription factors necessary for the proper formation of these domains. In the DE, these include Iroquois homeobox transcription factors, irx1a and irx3b [21,62,85]. WISH analysis on gldc morphants revealed an increase in length in the domains expressing irx1a and irx3b. Patterning of the DL domain includes interactions between mecom and tbx2a/b transcription factors [49,66,86]. We utilized WISH to assess the spatiotemporal domains of mecom, tbx2a, and tbx2b in WT and gldc morphants at 24 hpf. In gldc deficient animals, the number of cells expressing these transcription factors was diminished, correlating with the decrease in the DL domain. These upstream effects suggest that gldc has a role in earlier patterning processes of the nephron.
As each segment of the nephron carries out a specific job, changes in domain lengths can impair kidney function. However, morphological changes can also affect the excretion of waste. When assaying apoptosis trends in gldc morphants, we noted a large increase in death in the collecting duct/cloaca region. The cloaca is the common opening for the intestinal, urinary, and genital systems [67]. Live imaging revealed alteration in the cloacal structure as there was an aggregation of cells around the opening of the duct. Quantification of these phenotypes through area measurements revealed a significant increase in the area of the cloaca upon knockdown of gldc. Not much is known about cloaca development in zebrafish, however, sustained Bmp signaling is needed for proper formation [67]. Recently, slc20a1a has been identified as a candidate gene for cloacal exstrophy as knockdown animals exhibit cloacal anomalies with abnormal urinary outflow [87]. In gldc deficient animals, this morphological abnormality may block fluid excretion which provides another possible explanation for the abnormal fluid homeostasis. Further analysis would be needed to determine the cause of altered cell dynamics and patterning in this region, as gldc has a variety of important roles, including glycine regulation.
GLDC is a vital part of the GCS, and when dysfunctional, causes an increase in glycine globally [88]. Glycine is a neurotransmitter that has been shown to be vital to neuronal migration, MAPK signaling, and mitochondrial function in the brain [89,90,91]. In zebrafish, glycine-treated animals exhibited developmental defects in the heart, liver, and brain [92]. Another study determined that glycine treatment had dose-dependent biphasic effects on vasculature development in zebrafish [36]. These vascular alterations were impacted by levels of PI3K/Akt/mTor signaling [93], and several case reports have reported vascular abnormalities, namely hypertension, in some NKH patients [94,95,96,97]. Interestingly, there is a well-established relationship between the balance of renal and vascular progenitor fate choice and cell survival in developing zebrafish [98,99,100]. Here, our studies reveal nephron alterations in the process of segmentation consequent to elevated glycine levels. In NKH patients, a relationship has been reported between the increase in glycine concentration and the increase in the severity of symptoms [2]. We found a similar trend, as glycine-treated embryos increased in morphological severity with higher doses. Survivability also decreased as the concentration of glycine increased. In the kidney, glycine has been shown to increase renal plasma flow and glomerular filtration rate [80,101]. Glycine also affects ion uptake as it inhibits proximal and distal tubule Na+ reabsorption in rats [102]. In our treated animals, we found nephron segmentation was altered in the same fashion as our gldc morphants. We concluded that gldc knockdown causes an increase in glycine within the animal which impacts the genetic patterning pathways of the kidney. Further studies are needed to assess the physiological consequences of these developmental phenotypes due to exposure to high glycine during organogenesis.

5. Conclusions

Here, we have characterized a novel zebrafish model of gldc deficiency that displays classic NKH hallmarks of neural and craniofacial malformations, and discovered new features including several renal and urogenital tract malformations. We show that gldc is essential for determining patterning events of renal progenitors that give rise to the nephron functional units (Figure 7), which will be useful for understanding the genetic basis of kidney diseases [103]. These insights, along with this original gldc deficiency model, provide exciting new opportunities to expand our understanding of the roles of glycine metabolism in ontogeny.

Supplementary Materials

The following supporting information can be downloaded at: https://www.mdpi.com/article/10.3390/biomedicines10123220/s1, Figure S1: Design and validation of gldc knockdown tools; Figure S2: Additional nephron analysis in gldc deficient embryos.

Author Contributions

Conceptualization, R.A.W. and N.E.W.; methodology, R.A.W. and N.E.W.; validation, R.A.W. and N.E.W.; formal analysis, R.A.W. and N.E.W.; investigation, N.E.W. and A.H.; writing—original draft preparation, N.E.W.; writing—review and editing, R.A.W., N.E.W. and A.H.; supervision, R.A.W.; project administration, R.A.W.; funding acquisition, R.A.W. All authors have read and agreed to the published version of the manuscript.

Funding

This research was funded by a Boler-Parseghian Center for Rare and Neglected Disease (CRND) Catalyst Grant at the University of Notre Dame to R.A.W., the CRND-NKH Fund at the University of Notre Dame to R.A.W.; a Sean Cocchia Rare Disease Seed Grant from the Warren Center for Drug Discovery at the University of Notre Dame to R.A.W., an Arthur J. Schmitt Leadership Graduate Research Fellowship from the Graduate School at the University of Notre Dame awarded to N.E.W., and College of Science Summer Undergraduate Research Fellowship from the University of Notre Dame to A.H. We are very grateful to Elizabeth and Michael for their generous gift to the University of Notre Dame to support stem cell research, and all the support of the NKH community to the CRND at Notre Dame. The funders had no role in the study design, data collection and analysis, decision to publish, or manuscript preparation.

Institutional Review Board Statement

The study was approved and conducted according to the guidelines of the University of Notre Dame Institutional Animal Care and Use Committee.

Informed Consent Statement

Not applicable.

Data Availability Statement

All data are contained in this article and the Supplementary Materials.

Acknowledgments

We thank the Department of Biological Sciences, Boler-Parseghian Center for Rare and Neglected Diseases, Warren Center for Drug Discovery, and the Center for Stem Cells and Regenerative Medicine for their support. We particularly express our gratitude to staff of the Center for Zebrafish Research at the University of Notre Dame for their dedication and outstanding care of our vivarium. We are deeply grateful for the mentorship of K.H. We thank all the NKH patient families for their support: they inspire us every day with their love, grit, passion, and unwavering strength in the mission to better understand and identify new ways to combat this disease. Finally, we thank all current and previous members of our lab for their support, discussions, and insights about this work, particularly B.E.C. and J.M.C.

Conflicts of Interest

The authors declare no conflict of interest.

References

  1. Coughlin, C.R.; Swanson, M.A.; Kronquist, K.; Acquaviva, C.; Hutchin, T.; Rodríguez-Pombo, P.; Väisänen, M.-L.; Spector, E.; Creadon-Swindell, G.; Brás-Goldberg, A.M.; et al. The genetic basis of classic nonketotic hyperglycinemia due to mutations in GLDC and AMT. Anesthesia Analg. 2017, 19, 104–111. [Google Scholar] [CrossRef] [PubMed]
  2. Hamosh, A.; Johnston, M.V. Nonketotic hyperglycinemia. In The Online Metabolic and Molecular Bases of Inherited Disease; Valle, D.L., Antonarakis, S., Ballabio, A., Beaudet, A.L., Mitchell, G.A., Eds.; McGraw Hill: New York, NY, USA, 2019. [Google Scholar]
  3. van Hove, J.L.K.; Coughlin, C., II; Swanson, M.; Hennermann, J.B.; Adam, M.P.; Everman, D.B.; Mirzaa, G.M.; Pagon, R.A.; Wallace, S.E.; Bean, L.J.H.; et al. (Eds.) Nonketotic Hyperglycinemia. In GeneReviews® [Internet]; University of Washington: Seattle, WA, USA, 1993. [Google Scholar]
  4. Toone, J.R.; Applegarth, D.A.; Coulter-Mackie, M.; James, E.R. Recurrent Mutations in P- and T-Proteins of the Glycine Cleavage Complex and a Novel T-Protein Mutation (N145I): A Strategy for the Molecular Investigation of Patients with Nonketotic Hyperglycinemia (NKH). Mol. Genet. Metab. 2001, 72, 322–325. [Google Scholar] [CrossRef] [PubMed]
  5. Nowak, M.; Chuchra, P.; Paprocka, J. Nonketotic Hyperglycinemia: Insight into Current Therapies. J. Clin. Med. 2022, 11, 3027. [Google Scholar] [CrossRef] [PubMed]
  6. Farris, J.; Calhoun, B.; Alam, S.; Lee, S.; Haldar, K. Large scale analyses of genotype-phenotype relationships of glycine decarboxylase mutations and neurological disease severity. PLoS Comput. Biol. 2020, 16, e1007871. [Google Scholar] [CrossRef]
  7. Swanson, M.A.; Coughlin, C.R.; Scharer, G.H.; Szerlong, H.J.; Bjoraker, K.J.; Spector, E.B.; Creadon-Swindell, G.; Mahieu, V.; Matthijs, G.; Hennermann, J.B.; et al. Biochemical and molecular predictors for prognosis in nonketotic hyperglycinemia. Ann. Neurol. 2015, 78, 606–618. [Google Scholar] [CrossRef] [Green Version]
  8. Hübschmann, O.K.; Juliá-Palacios, N.A.; Olivella, M.; Guder, P.; Zafeiriou, D.I.; Horvath, G.; Kulhánek, J.; Pearson, T.S.; Kuster, A.; Cortès-Saladelafont, E.; et al. Integrative Approach to Predict Severity in Nonketotic Hyperglycinemia. Ann. Neurol. 2022, 92, 292–303. [Google Scholar] [CrossRef]
  9. Pai, Y.J.; Leung, K.-Y.; Savery, D.; Hutchin, T.; Prunty, H.; Heales, S.; Brosnan, M.E.; Brosnan, J.T.; Copp, A.; Greene, N.D. Glycine decarboxylase deficiency causes neural tube defects and features of non-ketotic hyperglycinemia in mice. Nat. Commun. 2015, 6, 6388. [Google Scholar] [CrossRef] [Green Version]
  10. Mademont-Soler, I.; Casellas-Vidal, D.; Trujillo, A.; Espuña-Capote, N.; Maroto, A.; García-González, M.D.M.; Ruiz, M.D.; Diego-Álvarez, D.; Queralt, X.; Perapoch, J.; et al. GLYT1 encephalopathy: Further delineation of disease phenotype and discussion of pathophysiological mechanisms. Am. J. Med. Genet. Part A 2021, 185, 476–485. [Google Scholar] [CrossRef]
  11. Press, G.A.; Barshop, B.A.; Haas, R.H.; Nyhan, W.L.; Glass, R.F.; Hesselink, J.R. Abnormalities of the brain in nonketotic hyperglycinemia: MR manifestations. AJNR Am. J. Neuroradiol. 1989, 10, 315–321. [Google Scholar]
  12. Santos, C.; Pai, Y.J.; Mahmood, M.R.; Leung, K.-Y.; Savery, D.; Waddington, S.N.; Copp, A.J.; Greene, N.D. Impaired folate 1-carbon metabolism causes formate-preventable hydrocephalus in glycine decarboxylase–deficient mice. J. Clin. Investig. 2020, 130, 1446–1452. [Google Scholar] [CrossRef]
  13. Farris, J.; Alam, S.; Rajashekara, A.M.; Haldar, K. Genomic analyses of glycine decarboxylase neurogenic mutations yield a large-scale prediction model for prenatal disease. PLoS Genet. 2021, 17, e1009307. [Google Scholar] [CrossRef] [PubMed]
  14. Molinari, E.; Sayer, J.A. Disease Modeling To Understand the Pathomechanisms of Human Genetic Kidney Disorders. Clin. J. Am. Soc. Nephrol. 2020, 15, 855–872. [Google Scholar] [CrossRef] [PubMed] [Green Version]
  15. Gerlach, G.F.; Wingert, R.A. Kidney organogenesis in the zebrafish: Insights into vertebrate nephrogenesis and regeneration. Wiley Interdiscip. Rev. Dev. Biol. 2013, 2, 559–585. [Google Scholar] [CrossRef] [PubMed] [Green Version]
  16. Poureetezadi, S.J.; Wingert, R.A. Little fish, big catch: Zebrafish as a model for kidney disease. Kidney Int. 2016, 89, 1204–1210. [Google Scholar] [CrossRef] [Green Version]
  17. Desgrange, A.; Cereghini, S. Nephron Patterning: Lessons from Xenopus, Zebrafish, and Mouse Studies. Cells 2015, 4, 483–499. [Google Scholar] [CrossRef] [Green Version]
  18. Drummond, I.A.; Majumdar, A.; Hentschel, H.; Elger, M.; Solnica-Krezel, L.; Schier, A.F.; Neuhauss, S.C.; Stemple, D.L.; Zwartkruis, F.; Rangini, Z.; et al. Early development of the zebrafish pronephros and analysis of mutations affecting pronephric function. Development 1998, 125, 4655–4667. [Google Scholar] [CrossRef] [PubMed]
  19. Wingert, R.A.; Selleck, R.; Yu, J.; Song, H.-D.; Chen, Z.; Song, A.; Zhou, Y.; Thisse, B.; Thisse, C.; McMahon, A.P.; et al. The cdx Genes and Retinoic Acid Control the Positioning and Segmentation of the Zebrafish Pronephros. PLoS Genet. 2007, 3, 1922–1938. [Google Scholar] [CrossRef] [PubMed] [Green Version]
  20. Wingert, R.A.; Davidson, A.J. The zebrafish pronephros: A model to study nephron segmentation. Kidney Int. 2008, 73, 1120–1127. [Google Scholar] [CrossRef] [Green Version]
  21. Wingert, R.A.; Davidson, A.J. Zebrafish nephrogenesis involves dynamic spatiotemporal expression changes in renal progenitors and essential signals from retinoic acid and irx3b. Dev. Dyn. 2011, 240, 2011–2027. [Google Scholar] [CrossRef] [Green Version]
  22. Fatma, S.; Nayak, U.; Swain, R.K. Methods to generate and evaluate zebrafish models of human kidney diseases. Int. J. Dev. Biol. 2021, 65, 475–485. [Google Scholar] [CrossRef]
  23. Kimmel, C.B.; Ballard, W.W.; Kimmel, S.R.; Ullmann, B.; Schilling, T.F. Stages of embryonic development of the zebrafish. Dev. Dyn. 1995, 203, 253–310. [Google Scholar] [CrossRef] [PubMed]
  24. Cheng, C.N.; Li, Y.; Marra, A.N.; Verdun, V.; Wingert, R.A. Flat Mount Preparation for Observation and Analysis of Zebrafish Embryo Specimens Stained by Whole Mount In situ Hybridization. J. Vis. Exp. 2014, 89, e51604. [Google Scholar] [CrossRef] [PubMed] [Green Version]
  25. Marra, A.N.; Ulrich, M.; White, A.; Springer, M.; Wingert, R.A. Visualizing Multiciliated Cells in the Zebrafish Through a Combined Protocol of Whole Mount Fluorescent In Situ Hybridization and Immunofluorescence. J. Vis. Exp. 2017, 129, e56261. [Google Scholar] [CrossRef] [PubMed] [Green Version]
  26. Marra, A.N.; Chambers, B.E.; Chambers, J.M.; Drummond, B.E.; Adeeb, B.D.; Wesselman, H.M.; Morales, E.E.; Handa, N.; Pettini, T.; Ronshaugen, M.; et al. Visualizing gene expression during zebrafish pronephros development and regeneration. Methods Cell. Biol. 2019, 154, 183–215. [Google Scholar] [CrossRef] [PubMed]
  27. McCampbell, K.K.; Springer, K.N.; Wingert, R.A. Analysis of nephron composition and function in the adult zebrafish kidney. J. Vis. Exp. 2014, 90, e51644. [Google Scholar] [CrossRef] [PubMed] [Green Version]
  28. Kroeger, P.T.; Drummond, B.E.; Miceli, R.; McKernan, M.; Gerlach, G.F.; Marra, A.N.; Fox, A.; McCampbell, K.K.; Leshchiner, I.; Rodriguez-Mari, A.; et al. The zebrafish kidney mutant zeppelin reveals that brca2/fancd1 is essential for pronephros development. Dev. Biol. 2017, 428, 148–163. [Google Scholar] [CrossRef] [PubMed]
  29. Tucker, B.; Lardelli, M. A Rapid Apoptosis Assay Measuring Relative Acridine Orange Fluorescence in Zebrafish Embryos. Zebrafish 2007, 4, 113–116. [Google Scholar] [CrossRef] [PubMed]
  30. Neuhauss, S.C.F.; Solnica-Krezel, L.; Schier, A.F.; Zwartkruis, F.; Stemple, D.L.; Malicki, J.; Driever, W. Mutations affecting craniofacial development in zebrafish. Development 1996, 123, 357–367. [Google Scholar] [CrossRef] [PubMed]
  31. Lowery, L.A.; Sive, H. Initial formation of zebrafish brain ventricles occurs independently of circulation and requires the nagie oko and snakehead/atp1a1a.1 gene products. Development 2005, 132, 2057–2067. [Google Scholar] [CrossRef] [Green Version]
  32. Poureetezadi, S.J.; Donahue, E.K.; Wingert, R.A. A manual small molecule screen approaching high-throughput using zebrafish embryos. J. Vis. Exp. 2014, 93, e52063. [Google Scholar] [CrossRef] [Green Version]
  33. Poureetezadi, S.J.; Cheng, C.N.; Chambers, J.M.; Drummond, B.E.; Wingert, R.A. Prostaglandin signaling regulates nephron segment patterning of renal progenitors during zebrafish kidney development. eLife 2016, 5, e17551. [Google Scholar] [CrossRef] [PubMed]
  34. Chambers, J.M.; Poureetezadi, S.J.; Addiego, A.; Lahne, M.; A Wingert, R. ppargc1a controls nephron segmentation during zebrafish embryonic kidney ontogeny. eLife 2018, 7, e40266. [Google Scholar] [CrossRef] [PubMed]
  35. Marra, A.N.; Adeeb, B.D.; Chambers, B.E.; Drummond, B.E.; Ulrich, M.; Addiego, A.; Springer, M.; Poureetezadi, S.J.; Chambers, J.M.; Ronshaugen, M.; et al. Prostaglandin signaling regulates renal multiciliated cell specification and maturation. Proc. Natl. Acad. Sci. USA 2019, 116, 8409–8418. [Google Scholar] [CrossRef] [PubMed] [Green Version]
  36. Tsuji-Tamura, K.; Sato, M.; Fujita, M.; Tamura, M. Glycine exerts dose-dependent biphasic effects on vascular development of zebrafish embryos. Biochem. Biophys. Res. Commun. 2020, 527, 539–544. [Google Scholar] [CrossRef] [PubMed]
  37. Riché, R.; Liao, M.; Pena, I.A.; Leung, K.-Y.; Lepage, N.; Greene, N.D.; Sarafoglou, K.; Schimmenti, L.A.; Drapeau, P.; Samarut, É. Glycine decarboxylase deficiency–induced motor dysfunction in zebrafish is rescued by counterbalancing glycine synaptic level. J. Clin. Investig. 2018, 3, e124642. [Google Scholar] [CrossRef] [Green Version]
  38. Applegarth, D.A.; Toone, J.R. Glycine encephalopathy (nonketotic hyperglycinaemia): Review and update. J. Inherit. Metab. Dis. 2004, 27, 417–422. [Google Scholar] [CrossRef]
  39. Narisawa, A.; Komatsuzaki, S.; Kikuchi, A.; Niihori, T.; Aoki, Y.; Fujiwara, K.; Tanemura, M.; Hata, A.; Suzuki, Y.; Relton, C.L.; et al. Mutations in genes encoding the glycine cleavage system predispose to neural tube defects in mice and humans. Hum. Mol. Genet. 2012, 21, 1496–1503. [Google Scholar] [CrossRef] [Green Version]
  40. Cheng, C.N.; Wingert, R.A. Nephron proximal tubule patterning and corpuscles of Stannius formation are regulated by the sim1a transcription factor and retinoic acid in zebrafish. Dev. Biol. 2015, 399, 100–116. [Google Scholar] [CrossRef] [Green Version]
  41. Marra, A.N.; Wingert, R.A. Epithelial cell fate in the nephron tubule is mediated by the ETS transcription factors etv5a and etv4 during zebrafish kidney development. Dev. Biol. 2016, 411, 231–245. [Google Scholar] [CrossRef] [Green Version]
  42. Hanke, N.; Staggs, L.; Schroder, P.; Litteral, J.; Fleig, S.; Kaufeld, J.; Pauli, C.; Haller, H.; Schiffer, M. “Zebrafishing” for novel genes relevant to the glomerular filtration barrier. BioMed. Res. Int. 2013, 2013, 658270. [Google Scholar] [CrossRef] [Green Version]
  43. Visel, A.; Thaller, C.; Eichele, G. GenePaint.org: An atlas of gene expression patterns in the mouse embryo. Nucleic Acids Res. 2004, 32, 552–556. [Google Scholar] [CrossRef] [PubMed]
  44. McMahon, A.P.; Aronow, B.J.; Davidson, D.R.; Davies, J.; Gaido, K.W.; Grimmond, S.; Lessard, J.L.; Little, M.; Potter, S.S.; Wilder, E.L.; et al. GUDMAP: The Genitourinary Developmental Molecular Anatomy Project. J. Am. Soc. Nephrol. 2008, 19, 667–671. [Google Scholar] [CrossRef] [PubMed] [Green Version]
  45. Harding, S.D.; Armit, C.; Armstrong, J.; Brennan, J.; Cheng, Y.; Haggarty, B.; Houghton, D.; Lloyd-MacGilp, S.; Pi, X.; Roochun, Y.; et al. The GUDMAP database—An online resource for genitourinary research. Development 2011, 138, 2845–2853. [Google Scholar] [CrossRef] [PubMed] [Green Version]
  46. Bayrak, H.; Yıldız, Y.; Olgaç, A.; Kasapkara, Ç.S.; Küçükcongar, A.; Zenciroğlu, A.; Yüksel, D.; Ceylaner, S.; Kılıç, M. Genotypic and phenotypic features in Turkish patients with classic nonketotic hyperglycinemia. Metab. Brain Dis. 2021, 36, 1213–1222. [Google Scholar] [CrossRef] [PubMed]
  47. Alfallaj, R.; Alfadhel, M. Glycine Transporter 1 Encephalopathy From Biochemical Pathway to Clinical Disease: Review. Child Neurol. Open 2019, 6, 2329048X19831486. [Google Scholar] [CrossRef] [Green Version]
  48. Méndez, K.; Vega-López, G.A.; Aybar, M.; Velasco, I. Neurogenesis From Neural Crest Cells: Molecular Mechanisms in the Formation of Cranial Nerves and Ganglia. Front. Cell Dev. Biol. 2020, 8, 635. [Google Scholar] [CrossRef]
  49. Li, Y.; Cheng, C.N.; Verdun, V.A.; Wingert, R.A. Zebrafish nephrogenesis is regulated by interactions between retinoic acid, mecom, and Notch signaling. Dev. Biol. 2014, 386, 111–122. [Google Scholar] [CrossRef] [Green Version]
  50. Naylor, R.W.; Przepiorski, A.; Ren, Q. HNF1B is essential for nephron segmentation during nephrogenesis. J. Am. Soc. Nephrol. 2013, 24, 77–87. [Google Scholar] [CrossRef] [Green Version]
  51. Gerlach, G.F.; Wingert, R.A. Zebrafish pronephros tubulogenesis and epithelial identity maintenance are reliant on the polarity proteins Prkc iota and zeta. Dev. Biol. 2014, 396, 183–200. [Google Scholar] [CrossRef] [Green Version]
  52. McKee, R.; Gerlach, G.F.; Jou, J.; Cheng, C.N.; Wingert, R.A. Temporal and spatial expression of tight junction genes during zebrafish pronephros development. Gene Expr. Patterns 2014, 16, 104–113. [Google Scholar] [CrossRef] [Green Version]
  53. Ma, M.; Jiang, Y.-J. Jagged2a-Notch Signaling Mediates Cell Fate Choice in the Zebrafish Pronephric Duct. PLoS Genet. 2007, 3, e18. [Google Scholar] [CrossRef] [PubMed]
  54. Liu, Y.; Pathak, N.; Kramer-Zucker, A.; Drummond, I.A. Notch signaling controls the differentiation of transporting epithelia and multiciliated cells in the zebrafish pronephros. Development 2007, 134, 1111–1122. [Google Scholar] [CrossRef] [PubMed] [Green Version]
  55. Marra, A.N.; Li, Y.; Wingert, R.A. Antennas of organ morphogenesis: The roles of cilia in vertebrate kidney development. Genesis 2016, 54, 457–469. [Google Scholar] [CrossRef] [PubMed]
  56. Boutin, C.; Kodjabachian, L. Biology of multiciliated cells. Curr. Opin. Genet. Dev. 2019, 56, 1–7. [Google Scholar] [CrossRef]
  57. Marra, A.N.; Cheng, C.N.; Adeeb, B.; Addiego, A.; Wesselman, H.M.; Chambers, B.E.; Chambers, J.M.; Wingert, R.A. Iroquois transcription factor irx2a is required for multiciliated and transporter cell fate decisions during zebrafish pronephros development. Sci. Rep. 2019, 9, 6454. [Google Scholar] [CrossRef] [Green Version]
  58. Hentschel, D.M.; Park, K.M.; Cilenti, L.; Zervos, A.S.; Drummond, I.; Bonventre, J.V. Acute renal failure in zebrafish: A novel system to study a complex disease. Am. J. Physiol. Physiol. 2005, 288, F923–F929. [Google Scholar] [CrossRef] [Green Version]
  59. Johnson, C.S.; Holzemer, N.F.; Wingert, R.A. Laser Ablation of the Zebrafish Pronephros to Study Renal Epithelial Regeneration. J. Vis. Exp. 2011, 54, e2845. [Google Scholar] [CrossRef] [Green Version]
  60. Bolten, J.S.; Pratsinis, A.; Alter, C.L.; Fricker, G.; Huwyler, J. Zebrafish (Danio rerio) larva as an in vivo vertebrate model to study renal function. Am. J. Physiol. Physiol. 2022, 322, F280–F294. [Google Scholar] [CrossRef]
  61. Reggiani, L.; Raciti, D.; Airik, R.; Kispert, A.; Brändli, A.W. The prepattern transcription factor Irx3 directs nephron segment identity. Genes Dev. 2007, 21, 2358–2370. [Google Scholar] [CrossRef] [Green Version]
  62. Chambers, B.E.; Gerlach, G.F.; Clark, E.G.; Chen, K.H.; Levesque, A.E.; Leshchiner, I.; Goessling, W.; Wingert, R.A. Tfap2a is a novel gatekeeper of nephron differentiation during kidney development. Development 2019, 146, dev172387. [Google Scholar] [CrossRef] [Green Version]
  63. Morishita, K.; Parganas, E.; Parham, D.M.; Matsugi, T.; Ihle, J.N. The Evi-1 zinc finger myeloid transforming gene is normally expressed in the kidney and in developing oocytes. Oncogene 1990, 5, 1419–1423. [Google Scholar] [PubMed]
  64. Van Campenhout, C.; Nichane, M.; Antoniou, A.; Pendeville, H.; Bronchain, O.J.; Marine, J.-C.; Mazabraud, A.; Voz, M.L.; Bellefroid, E.J. Evi1 is specifically expressed in the distal tubule and duct of the Xenopus pronephros and plays a role in its formation. Dev. Biol. 2006, 294, 203–219. [Google Scholar] [CrossRef] [PubMed]
  65. Cho, G.-S.; Choi, S.-C.; Park, E.C.; Han, J.-K. Role of Tbx2 in defining the territory of the pronephric nephron. Development 2011, 138, 465–474. [Google Scholar] [CrossRef] [PubMed] [Green Version]
  66. Drummond, B.E.; Li, Y.; Marra, A.N.; Cheng, C.N.; Wingert, R.A. The tbx2a/b transcription factors direct pronephros segmentation and corpuscle of Stannius formation in zebrafish. Dev. Biol. 2017, 421, 52–66. [Google Scholar] [CrossRef] [PubMed] [Green Version]
  67. Pyati, U.J.; Cooper, M.S.; Davidson, A.J.; Nechiporuk, A.; Kimelman, D. Sustained Bmp signaling is essential for cloaca development in zebrafish. Development 2006, 133, 2275–2284. [Google Scholar] [CrossRef] [Green Version]
  68. Prasad, M.; Iqbal, M.; Mordekar, S.R. Nonketotic hyperglycinemia case series. J. Pediatr. Neurosci. 2015, 10, 355–358. [Google Scholar] [CrossRef] [PubMed] [Green Version]
  69. Swanson, M.A.; Miller, K.; Young, S.P.; Tong, S.; Ghaloul-Gonzalez, L.; Neira-Fresneda, J.; Schlichting, L.; Peck, C.; Gabel, L.; Friederich, M.W.; et al. Cerebrospinal fluid amino acids glycine, serine, and threonine in nonketotic hyperglycinemia. J. Inherit. Metab. Dis. 2022, 45, 734–747. [Google Scholar] [CrossRef]
  70. Bowery, N.G.; Smart, T.G. GABA and glycine as neurotransmitters: A brief history. Br. J. Pharmacol. 2006, 147, S109–S119. [Google Scholar] [CrossRef] [Green Version]
  71. Ito, S. GABA and glycine in the developing brain. J. Physiol. Sci. 2016, 66, 375–379. [Google Scholar] [CrossRef]
  72. Autuori, M.C.; Pai, Y.J.; Stuckey, D.J.; Savery, D.; Marconi, A.M.; Massa, V.; Lythgoe, M.F.; Copp, A.J.; David, A.L.; Greene, N.D. Use of high-frequency ultrasound to study the prenatal development of cranial neural tube defects and hydrocephalus in Gldc-deficient mice. Prenat. Diagn. 2017, 37, 273–281. [Google Scholar] [CrossRef] [Green Version]
  73. Leung, K.-Y.; Pai, Y.J.; Chen, Q.; Santos, C.; Calvani, E.; Sudiwala, S.; Savery, D.; Ralser, M.; Gross, S.S.; Copp, A.J.; et al. Partitioning of One-Carbon Units in Folate and Methionine Metabolism Is Essential for Neural Tube Closure. Cell Rep. 2017, 21, 1795–1808. [Google Scholar] [CrossRef] [PubMed]
  74. Moens, C.B.; Prince, V.E. Constructing the hindbrain: Insights from the zebrafish. Dev. Dyn. 2002, 224, 1–17. [Google Scholar] [CrossRef] [PubMed]
  75. Kanekar, S.; Byler, D. Characteristic MRI findings in neonatal nonketotic hyperglycinemia due to sequence changes in GLDC gene encoding the enzyme glycine decarboxylase. Metab. Brain Dis. 2013, 28, 717–720. [Google Scholar] [CrossRef] [PubMed]
  76. Ichinohe, A.; Kure, S.; Mikawa, S.; Ueki, T.; Kojima, K.; Fujiwara, K.; Iinuma, K.; Matsubara, Y.; Sato, K. Glycine cleavage system in neurogenic regions. Eur. J. Neurosci. 2004, 19, 2365–2370. [Google Scholar] [CrossRef]
  77. Jog, R.; Chen, G.; Wang, J.; Leff, T. Hormonal regulation of glycine decarboxylase and its relationship to oxidative stress. Physiol. Rep. 2021, 9, e14991. [Google Scholar] [CrossRef]
  78. Wang, W.; Wu, Z.; Dai, Z.; Yang, Y.; Wang, J.; Wu, G. Glycine metabolism in animals and humans: Implications for nutrition and health. Amino Acids 2013, 45, 463–477. [Google Scholar] [CrossRef]
  79. Thisse, B.; Thisse, C. Fast Release Clones: A High Throughput Expression Analysis. ZFIN Direct Data Submission. 2004. Available online: http://zfin.org (accessed on 20 September 2020).
  80. Weinberg, J.M.; Davis, J.A.; Abarzua, M.; Kiani, T.; Kunkel, R. Protection by glycine of proximal tubules from injury due to inhibitors of mitochondrial ATP production. Am. J. Physiol. Physiol. 1990, 258, C1127–C1140. [Google Scholar] [CrossRef]
  81. Takayanagi, M.; Kure, S.; Sakata, Y.; Kurihara, Y.; Ohya, Y.; Kajita, M.; Tada, K.; Matsubara, Y.; Narisawa, K. Human glycine decarboxylase gene (GLDC) and its highly conserved processed pseudogene (ψGLDC): Their structure and expression, and the identification of a large deletion in a family with nonketotic hyperglycinemia. Hum. Genet. 2000, 106, 298–305. [Google Scholar]
  82. Steiman, G.S.; Yudkoff, M.; Berman, P.H.; Blazer-Yost, B.; Segal, S. Late-onset nonketotic hyperglycinemia and spinocerebellar degeneration. J. Pediatr. 1979, 94, 907–911. [Google Scholar] [CrossRef]
  83. Mount, D.B. Thick Ascending Limb of the Loop of Henle. Clin. J. Am. Soc. Nephrol. 2014, 9, 1974–1986. [Google Scholar] [CrossRef] [Green Version]
  84. Subramanya, A.R.; Ellison, D.H. Distal convoluted tubule. Clin. J. Am. Soc. Nephrol. 2014, 9, 2147–2163. [Google Scholar] [CrossRef] [PubMed] [Green Version]
  85. Chambers, B.E.; Clark, E.G.; Gatz, A.E.; Wingert, R.A. Kctd15 regulates nephron segment development by repressing Tfap2a activity. Development 2020, 147, dev191973. [Google Scholar] [CrossRef] [PubMed]
  86. Morales, E.E.; Handa, N.; Drummond, B.E.; Chambers, J.M.; Marra, A.; Addiego, A.; Wingert, R.A. Homeogene emx1 is required for nephron distal segment development in zebrafish. Sci. Rep. 2018, 8, 18038. [Google Scholar] [CrossRef] [PubMed] [Green Version]
  87. Rieke, J.M.; Zhang, R.; Braun, D.; Yilmaz, Ö.; Japp, A.S.; Lopes, F.M.; Pleschka, M.; Hilger, A.C.; Schneider, S.; Newman, W.G.; et al. SLC20A1 Is Involved in Urinary Tract and Urorectal Development. Front. Cell Dev. Biol. 2020, 8, 567. [Google Scholar] [CrossRef] [PubMed]
  88. Korman, S.H.; Gutman, A. Pitfalls in the diagnosis of glycine encephalopathy (non-ketotic hyperglycinemia). Dev. Med. Child Neurol. 2002, 44, 712–720. [Google Scholar] [CrossRef]
  89. Theisen, U.; Hey, S.; Hennig, C.D.; Schnabel, R.; Köster, R.W. Glycine is able to induce both a motility speed in- and decrease during zebrafish neuronal migration. Commun. Integr. Biol. 2018, 11, 1–7. [Google Scholar] [CrossRef]
  90. Moura, A.P.; Parmeggiani, B.; Gasparotto, J.; Grings, M.; Cardoso, G.M.F.; Seminotti, B.; Moreira, J.C.F.; Gelain, D.P.; Wajner, M.; Leipnitz, G. Glycine Administration Alters MAPK Signaling Pathways and Causes Neuronal Damage in Rat Brain: Putative Mechanisms Involved in the Neurological Dysfunction in Nonketotic Hyperglycinemia. Mol. Neurobiol. 2018, 55, 741–750. [Google Scholar] [CrossRef]
  91. Moura, A.P.; Grings, M.; Parmeggiani, B.D.S.; Marcowich, G.F.; Tonin, A.M.; Viegas, C.M.; Zanatta, A.; Ribeiro, C.A.J.; Wajner, M.; Leipnitz, G. Glycine Intracerebroventricular Administration Disrupts Mitochondrial Energy Homeostasis in Cerebral Cortex and Striatum of Young Rats. Neurotox. Res. 2013, 24, 502–511. [Google Scholar] [CrossRef]
  92. Dumitrescu, E.; Karunaratne, D.P.; Prochaska, M.K.; Liu, X.; Wallace, K.N.; Andreescu, S. Developmental toxicity of glycine-coated silica nanoparticles in embryonic zebrafish. Environ. Pollut. 2017, 229, 439–447. [Google Scholar] [CrossRef]
  93. Tsuji-Tamura, K.; Sato, M.; Fujita, M.; Tamura, M. The role of PI3K/Akt/mTOR signaling in dose-dependent biphasic effects of glycine on vascular development. Biochem. Biophys. Res. Commun. 2020, 529, 596–602. [Google Scholar] [CrossRef]
  94. Cataltepe, S.; van Marter, L.J.; Kozakewich, H.; Wessel, D.L.; Lee, P.J.; Levy, H.L. Pulmonary hypertension associated with nonketotic hyperglycinemia. J. Inherit. Metab. Dis. 2000, 23, 137–144. [Google Scholar] [CrossRef] [PubMed]
  95. Del Toro, M.; Arranz, J.A.; Macaya, A.; Riudor, E.; Raspall, M.; Moreno-Galdó, A.; Vazquez, E.; Ortega, A.; Matsubara, Y.; Kure, S.; et al. Progressive vacuolating glycine leukoencephalopathy with pulmonary hypertension. Ann. Neurol. 2006, 60, 148–152. [Google Scholar] [CrossRef] [PubMed]
  96. Rodríguez, C.E.; Arranz, J.A.; Colomé, N.; Bech-Serra, J.J.; Canals, F.; Del Toro, M.; Riudor, E. Proteomic analysis in cerebrospinal fluid of patients with atypical nonketotic hyperglycinemia and pulmonary hypertension—A pilot study. Proteom. Clin. Appl. 2009, 3, 1430–1439. [Google Scholar] [CrossRef] [PubMed]
  97. Suso, J.J.M.; Marín, M.J.D.C.; Martínez-Romillo, P.D.; de Lera, C.L.; García-Moya, L.F.; González, J.I.R. Nonketotic Hyperglycinemia Presenting as Pulmonary Hypertensive Vascular Disease and Fatal Pulmonary Edema in Response to Pulmonary Vasodilator Therapy. J. Pediatr. 2012, 161, 557–559. [Google Scholar] [CrossRef]
  98. Perens, E.A.; Garavito-Aguilar, Z.V.; Guio-Vega, G.P.; Peña, K.T.; Schindler, Y.L.; Yelon, D. Hand2 inhibits kidney specification while promoting vein formation within the posterior mesoderm. eLife 2016, 5, e19941. [Google Scholar] [CrossRef] [PubMed]
  99. Perens, E.A.; Diaz, J.T.; Quesnel, A.; Askary, A.; Crump, J.G.; Yelon, D. osr1 couples intermediate mesoderm cell fate with temporal dynamics of vessel progenitor cell differentiation. Development 2021, 148, dev198408. [Google Scholar] [CrossRef]
  100. Drummond, B.E.; Chambers, B.E.; Wesselman, H.M.; Gibson, S.; Arceri, L.; Ulrich, M.N.; Gerlach, G.F.; Kroeger, P.T.; Leshchiner, I.; Goessling, W.; et al. osr1 Maintains Renal Progenitors and Regulates Podocyte Development by Promoting wnt2ba via the Antagonism of hand2. Biomedicines 2022, 10, 2868. [Google Scholar] [CrossRef]
  101. Yin, M.; Zhong, Z.; Connor, H.D.; Bunzendahl, H.; Finn, W.F.; Rusyn, I.; Li, X.; Raleigh, J.A.; Mason, R.P.; Thurman, R.G. Protective effect of glycine on renal injury induced by ischemia-reperfusion in vivo. Am. J. Physiol. Physiol. 2002, 282, F417–F423. [Google Scholar] [CrossRef] [Green Version]
  102. Thomsen, K.; Nielsen, C.B.; Flyvbjerg, A. Effects Of Glycine On Glomerular Filtration Rate And Segmental Tubular Handling Of Sodium In Conscious Rats. Clin. Exp. Pharmacol. Physiol. 2002, 29, 449–454. [Google Scholar] [CrossRef]
  103. Morales, E.E.; Wingert, R.A. Zebrafish as a Model of Kidney Disease. Results Probl. Cell Differ. 2017, 60, 55–75. [Google Scholar] [CrossRef]
Figure 1. A severe gldc deficient model exhibits phenotypes consistent with impaired kidney function. (A) Live images of WT and gldc morphants at 24 hpf, 48 hpf, and 72 hpf. Images at 24 hpf reveal gray pallor within the head of gldc morphants. At 48 hpf, pericardial edema becomes evident and persists through 72 hpf. At 72 hpf, craniofacial cartilage begins to develop, and abnormalities are observed. Scale bars = 100 μM, 400 μM. (B) WISH of WT gldc expression at 24 hpf, 48 hpf, and 72 hpf reveals gldc transcripts within the CNS and pronephros. Scale bars = 200 μM (main image) and 50 μM (inset). (C) Alcian Blue cartilage staining in WT and gldc morphants at 4 dpf. Decreased number of pharyngeal arches and aberrant jaw morphology were seen in gldc morphants. Scale bars = 100 μM, 50 μM, 50 μM. (D) A survival curve of WT animals and gldc morphants reveals that gldc deficient animals have a decreased percent survivability over seven days.
Biomedicines 10 03220 g001
Figure 2. gldc deficient zebrafish display phenotypes consistent with Gldc deficient mammals. (A) WISH analysis of mecom in WT and gldc morphants revealed an altered rhombomere four. gldc morphants exhibited disorganized migrating neural crest cell populations marked with dlx2. krox20, a gene expressed in rhombomeres three and five, appeared shifted in comparison to the back of the eye. Scale bar = 50 μM. (B) Quantification of the distance between the edge of rhombomere three and the back of the eye. (C) Injections of dextran-rhodamine into the brain ventricles of live WT and gldc morphant animals at 24 hpf. In gldc morphants, brain ventricles appear enlarged. Scale bar = 50 μM. (D) Acridine Orange assay in WT and gldc morphants at 24 hpf; red arrowheads indicate example AO+ cells. Scale bar = 50 μM. (E,F) Quantification of AO+ cells in the brain and kidney, respectively. Distance measurements and cell counts were compared by unpaired T-tests. Significant differences are shown above the brackets.
Biomedicines 10 03220 g002
Figure 3. gldc is necessary for proper segment patterning. (A) WISH of slc20a1a and odf3b in WT, gldc MO, and gldc MO + cRNA at 24 hpf. Scale bars = 200 μM (main image) and 50 μM (inset). (B) Absolute length quantification of slc20a1a domain in control and treatment groups. (C) Quantification of odf3b+ cells in WT, gldc MO, and gldc MO + cRNA. (D) WISH of slc12a1 and slc12a3 in WT, gldc MO, and gldc MO + cRNA at 24 hpf. Scale bars = 200 μM (main image) and 50 μM (inset). (E,F) Absolute length quantification of slc12a1 and slc12a3 domains, respectively. (G) Animals were injected with dextran-FITC at 24 hpf, then imaged at 6 hpi and 48 hpi. Scale bar = 400 μM. (H) Quantifications of percent fluorescence at 24 hpi and 48 hpi. Percent fluorescence was calculated with 6 hpi fluorescent intensity as baseline. Data are mean ± s.d. quantified for each control and experimental group. Absolute lengths and odf3b+ cell counts were compared using ANOVA. Percent fluorescence measurements were compared with unpaired T-tests.
Biomedicines 10 03220 g003
Figure 4. Loss of gldc affects DE and DL precursor populations. (A) WISH of irx1a and irx3b in WT and gldc morphant embryos at 24 hpf. Scale bars = 100 μM (main image) and 50 μM (inset). (B,C) Absolute length measurements of irx1a and irx3b domains. (D) WISH of mecom, tbx2a, and tbx2b on WT and gldc MO embryos at 24 hpf. Scale bars = 100 μM (main image) and 50 μM (inset). (EG) Absolute length measurements of mecom, tbx2a, and tbx2b domains quantified for each control and experimental group. Data are mean ± s.d. Absolute lengths were compared using unpaired T-tests.
Biomedicines 10 03220 g004
Figure 5. gldc morphant cloacae demonstrate increased levels of apoptosis and structural abnormalities. (A) Cell death assay of the cloaca in WT and gldc morphants at 24 hpf. Scale bar = 50 μM. (B) Quantification of AO+ cells in the cloaca; red arrowheads indicate example AO+ cells. (C) Live images of the cloacal region (outlined in red) in WT and gldc morphants at 24 hpf and 48 hpf. Scale bars = 50 μM. (D) Measurement of the cloacal area in WT and gldc MO. (E) WISH of mecom, pax2a, and gata3 in WT and gldc morphants at 24 hpf revealed enlarged cloacal regions. Scale bars = 100 μM. Data are mean ± s.d. AO+ cell counts and cloacal area were compared with unpaired T-tests.
Biomedicines 10 03220 g005
Figure 6. Glycine-treated embryos altered live morphology and segment patterning in a dose-dependent manner, comparable to gldc morphants. (A) Live images of WT and glycine-treated animals at 24 hpf, 48 hpf, and 72 hpf. Animals were treated with three different concentrations of glycine: 100 mM, 300 mM, and 400 mM. Imaging revealed gray pallor in the brain at 24 hpf in 300 mM and 400 mM animals. Pericardial edema and hydrocephalus became evident in 300 mM zebrafish at 48 hpf and became severe at 72 hpf with aberrant jaw morphology. Mild fluid retention was seen in 100 mM animals at 72 hpf. Zebrafish treated with 400 mM glycine exhibited severe body curvature and overall altered morphology at 72 hpf. Scale bars = 100 μM (24 hpf) and 400 μM (48 hpf and 72 hpf). (B) WISH of WT and glycine-treated zebrafish at 24 hpf analyzing slc12a1 and slc12a3. The slc12a1 domain elongates in glycine-treated animals in a dose-dependent manner. The slc12a3 domain becomes reduced in the treatment group in a dose-dependent manner as well. Scale bars = 100 μM (main image) and 50 μM (inset). (C,D) Absolute length quantifications of slc12a1 and slc12a3 comparing WT and treatment groups. Data are mean ± s.d. Absolute lengths were compared with ANOVA.
Biomedicines 10 03220 g006
Figure 7. Nephrogenesis in the WT zebrafish embryo compared to gldc deficiency which leads to lethal elevated glycine levels. (Top) At 24 hpf, when the nephron segment pattern is established, WT embryos exhibit nephrons tubules with a series of four segments: the PCT (yellow-colored cells), PST (orange-colored cells), DE (turquoise-colored cells) and DL (dark blue colored cells). (Bottom) nephron tubule segment populations are altered in gldc deficient zebrafish, such that the PCT segment is decreased in size (arrow down), while the DE segment population is expanded (arrow up) and the DL segment is decreased (arrow down). These alterations correlate with changes in the expression of essential renal progenitor genes, observations that provide a crucial foundation for future studies to elucidate the underlying molecular mechanisms of these nephrogenesis defects.
Biomedicines 10 03220 g007
Publisher’s Note: MDPI stays neutral with regard to jurisdictional claims in published maps and institutional affiliations.

