
Study on Tissue Homogenization Buffer Composition for Brain Mass Spectrometry-Based Proteomics
 , , ,
, , ,
Abstract
:1. Introduction
2. Materials and Methods
2.1. Reagents
2.2. Tissue Collection
2.3. Sample Preparation
2.4. LC-MS/MS Analysis
2.5. Data Analysis
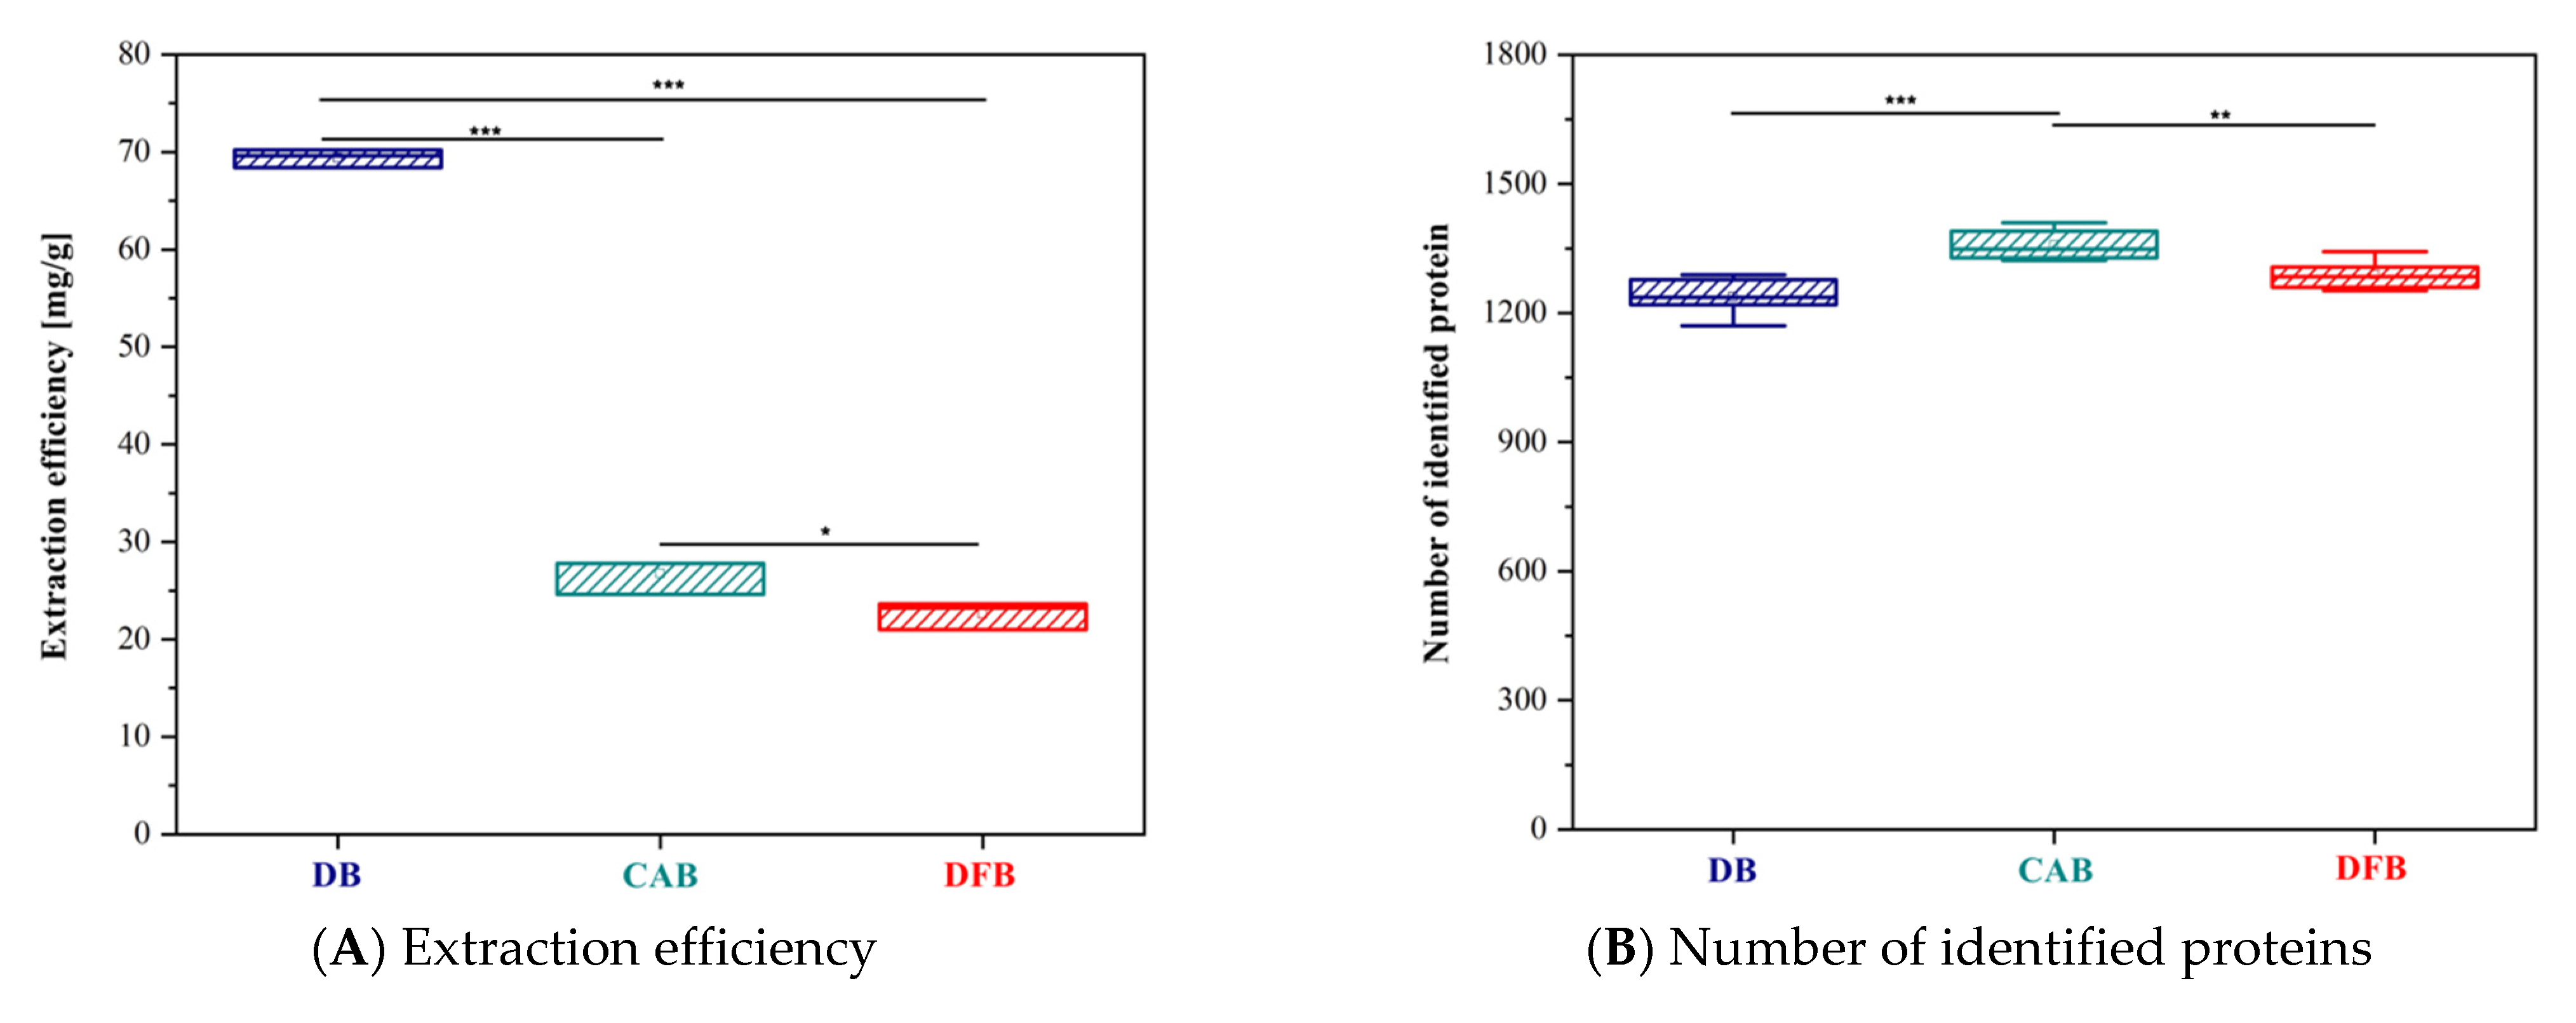
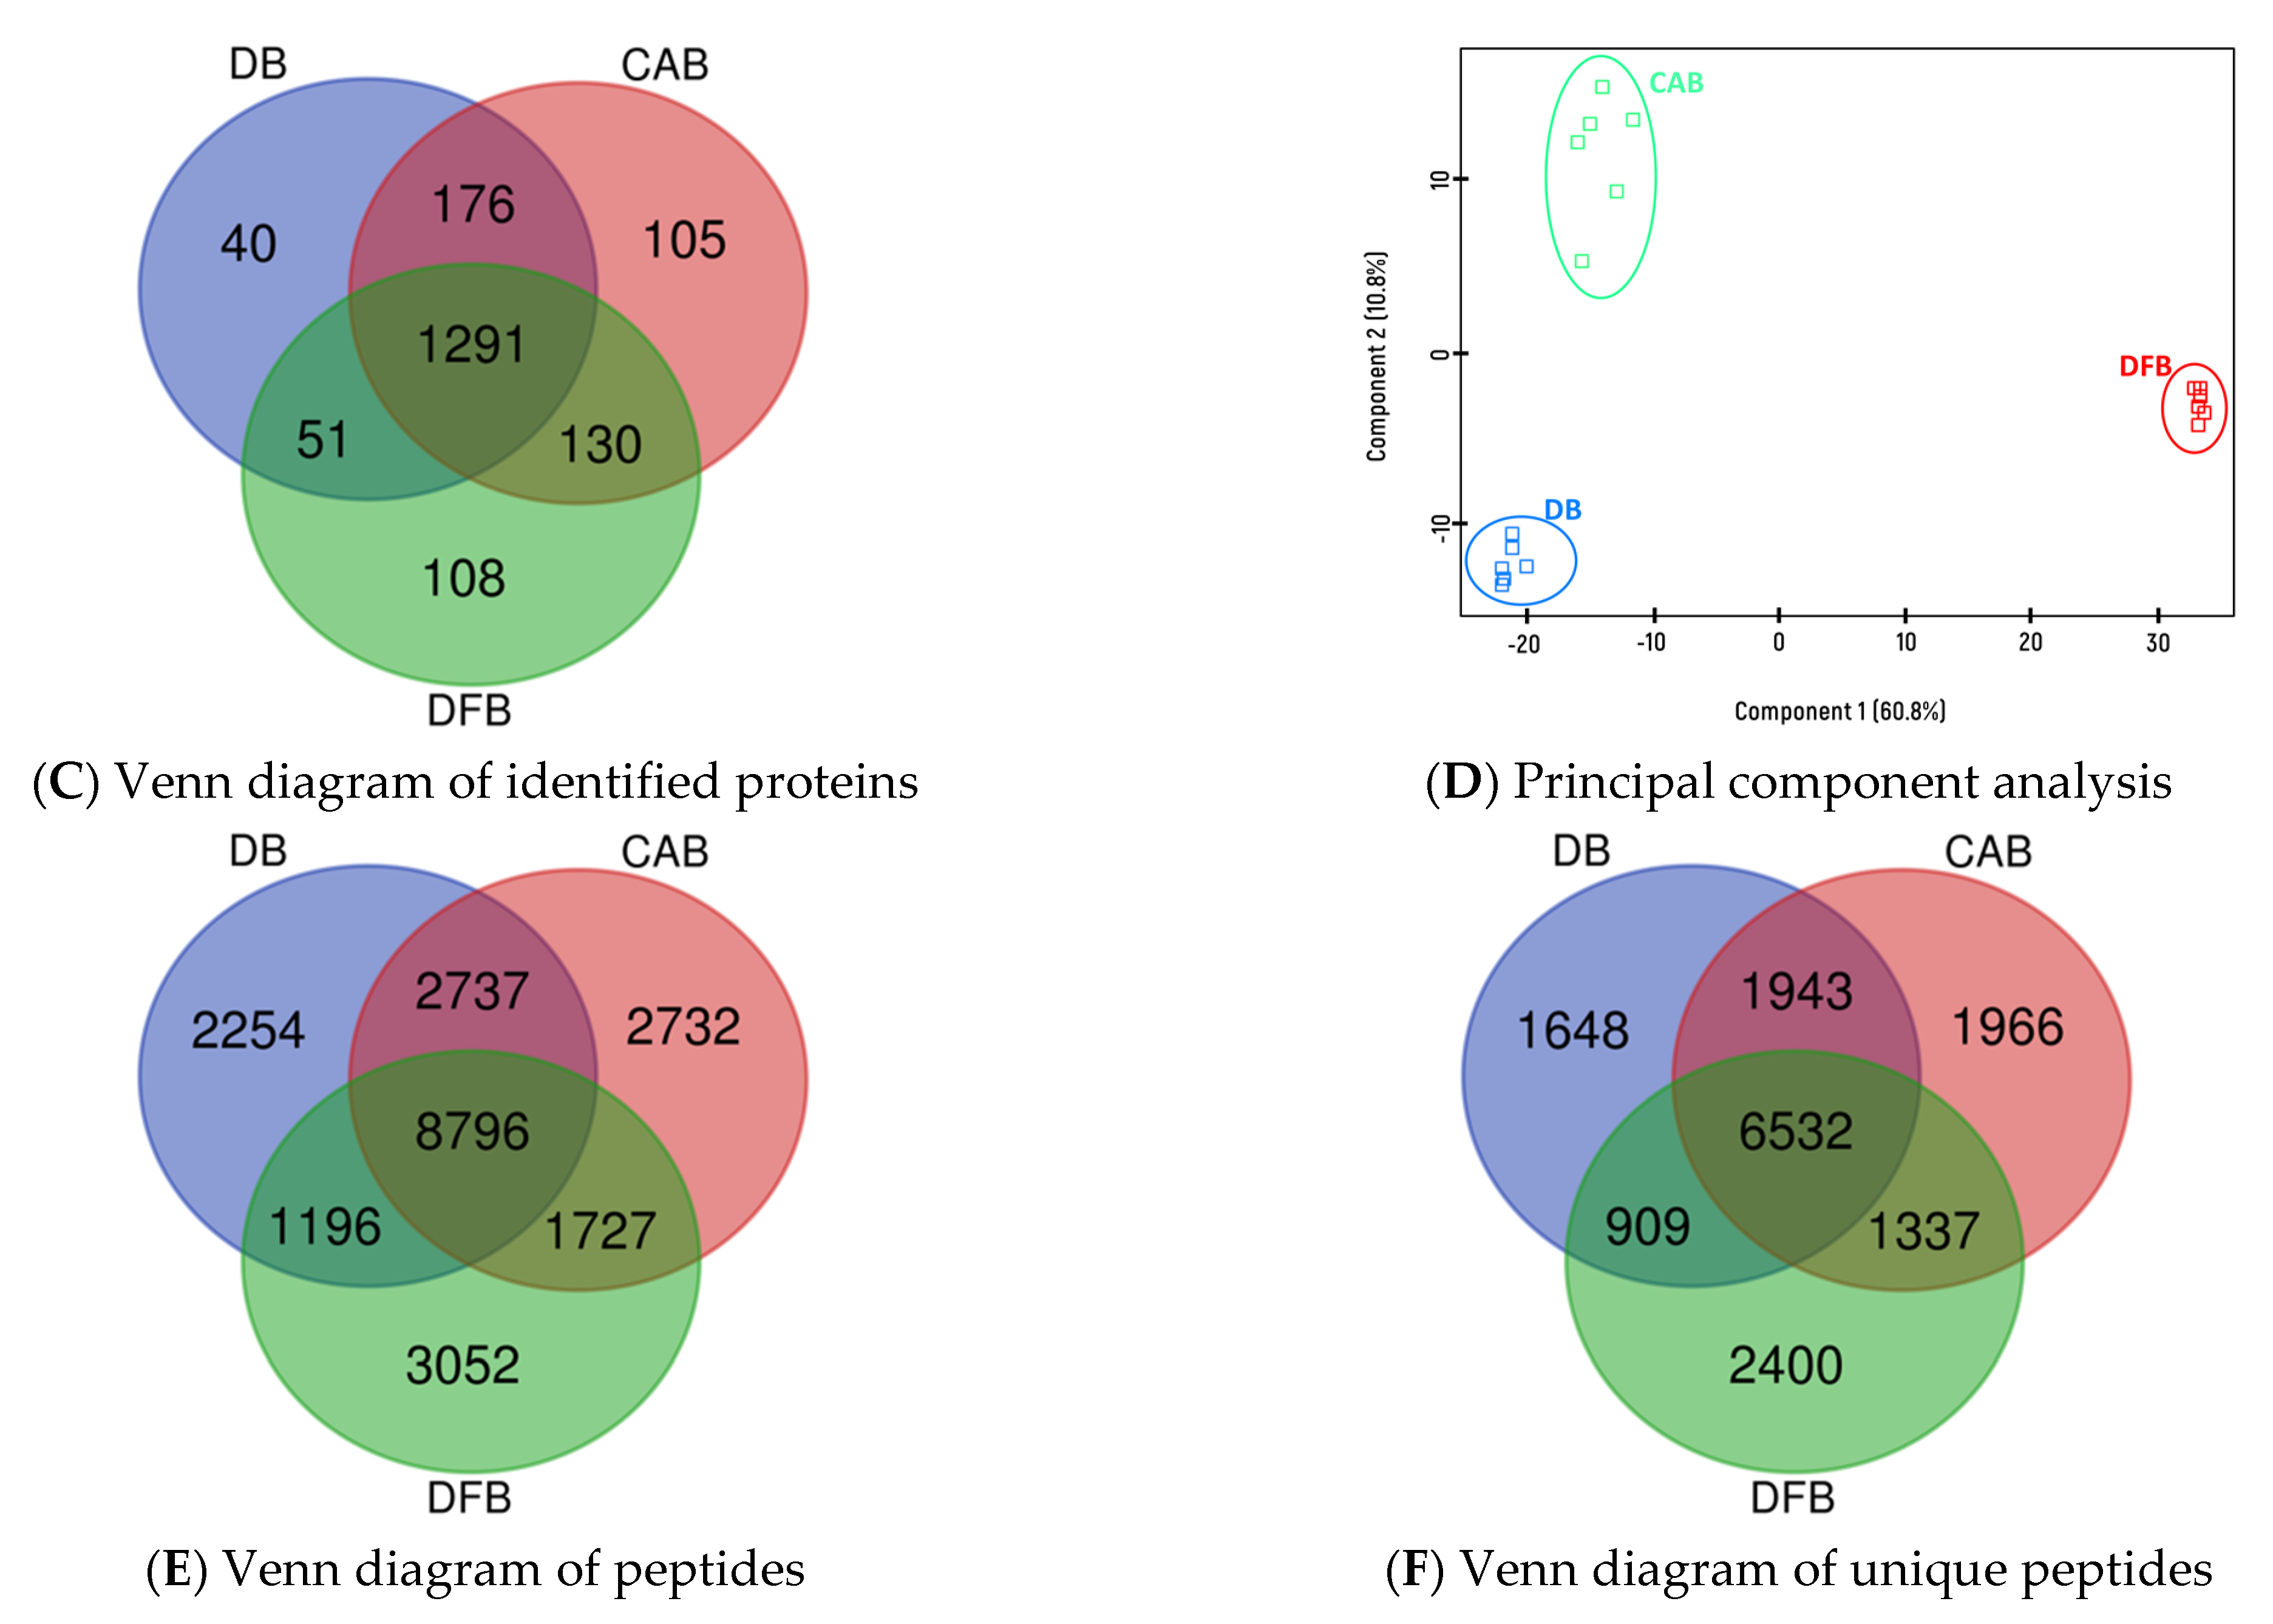
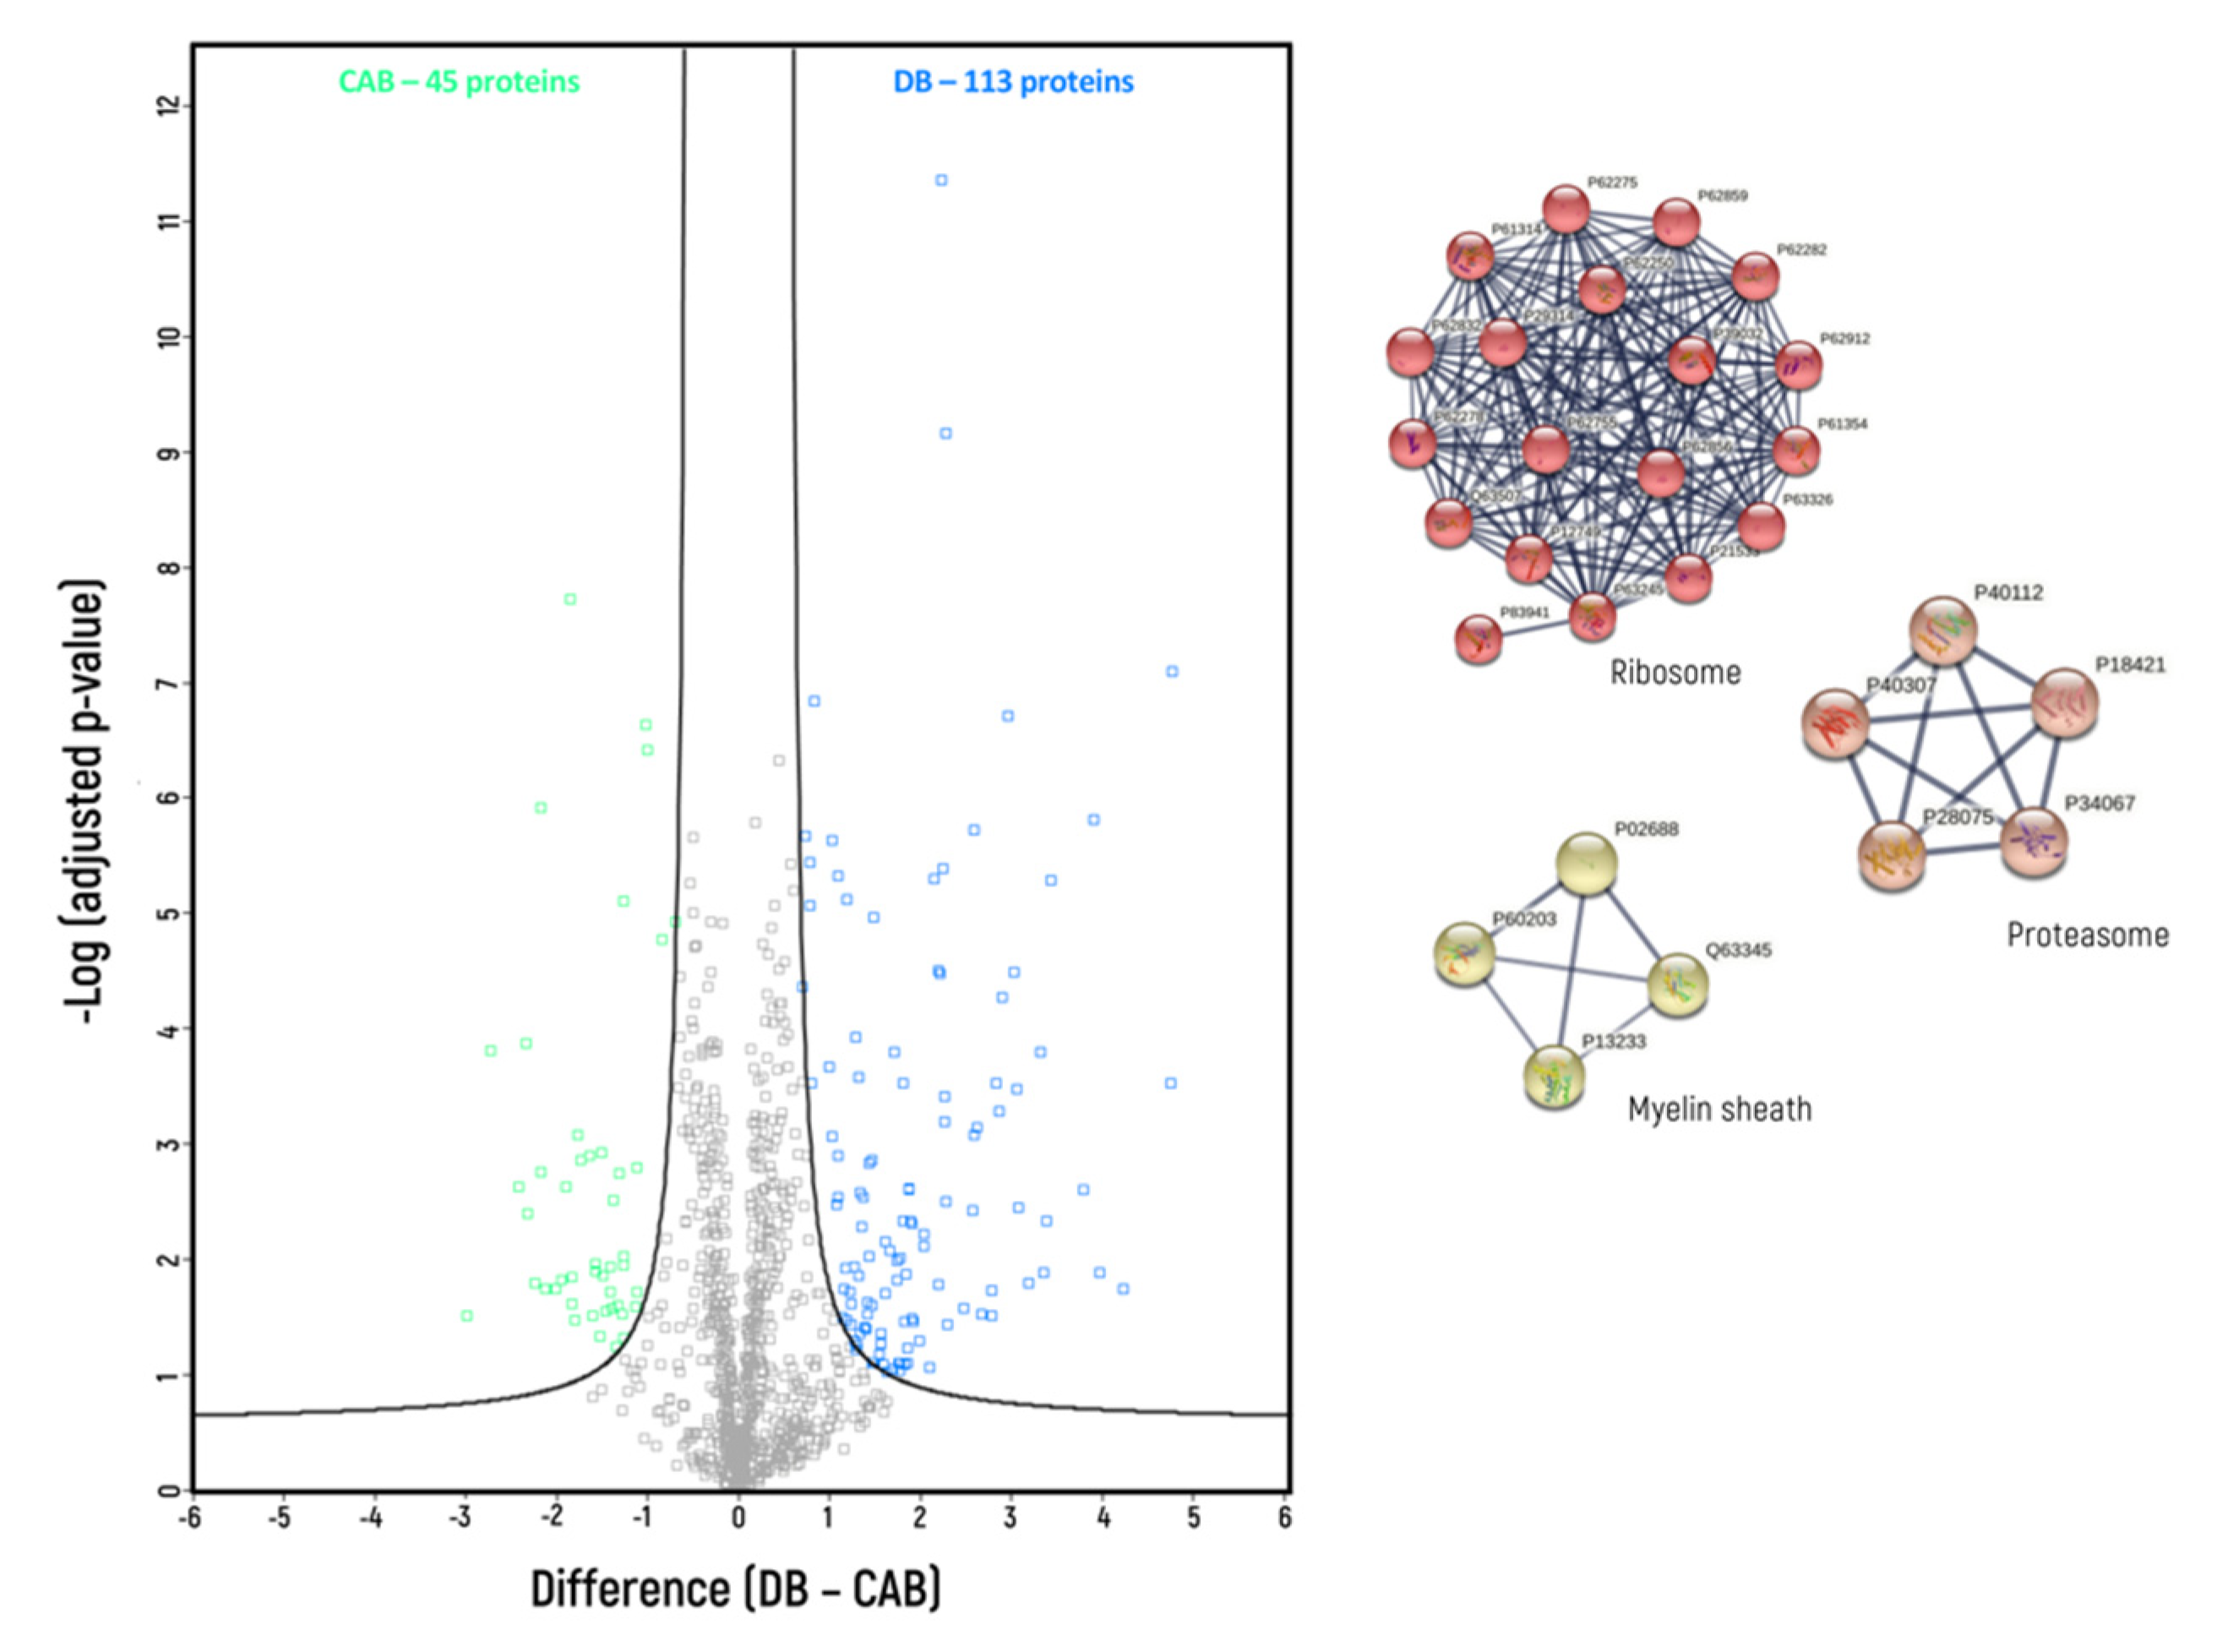
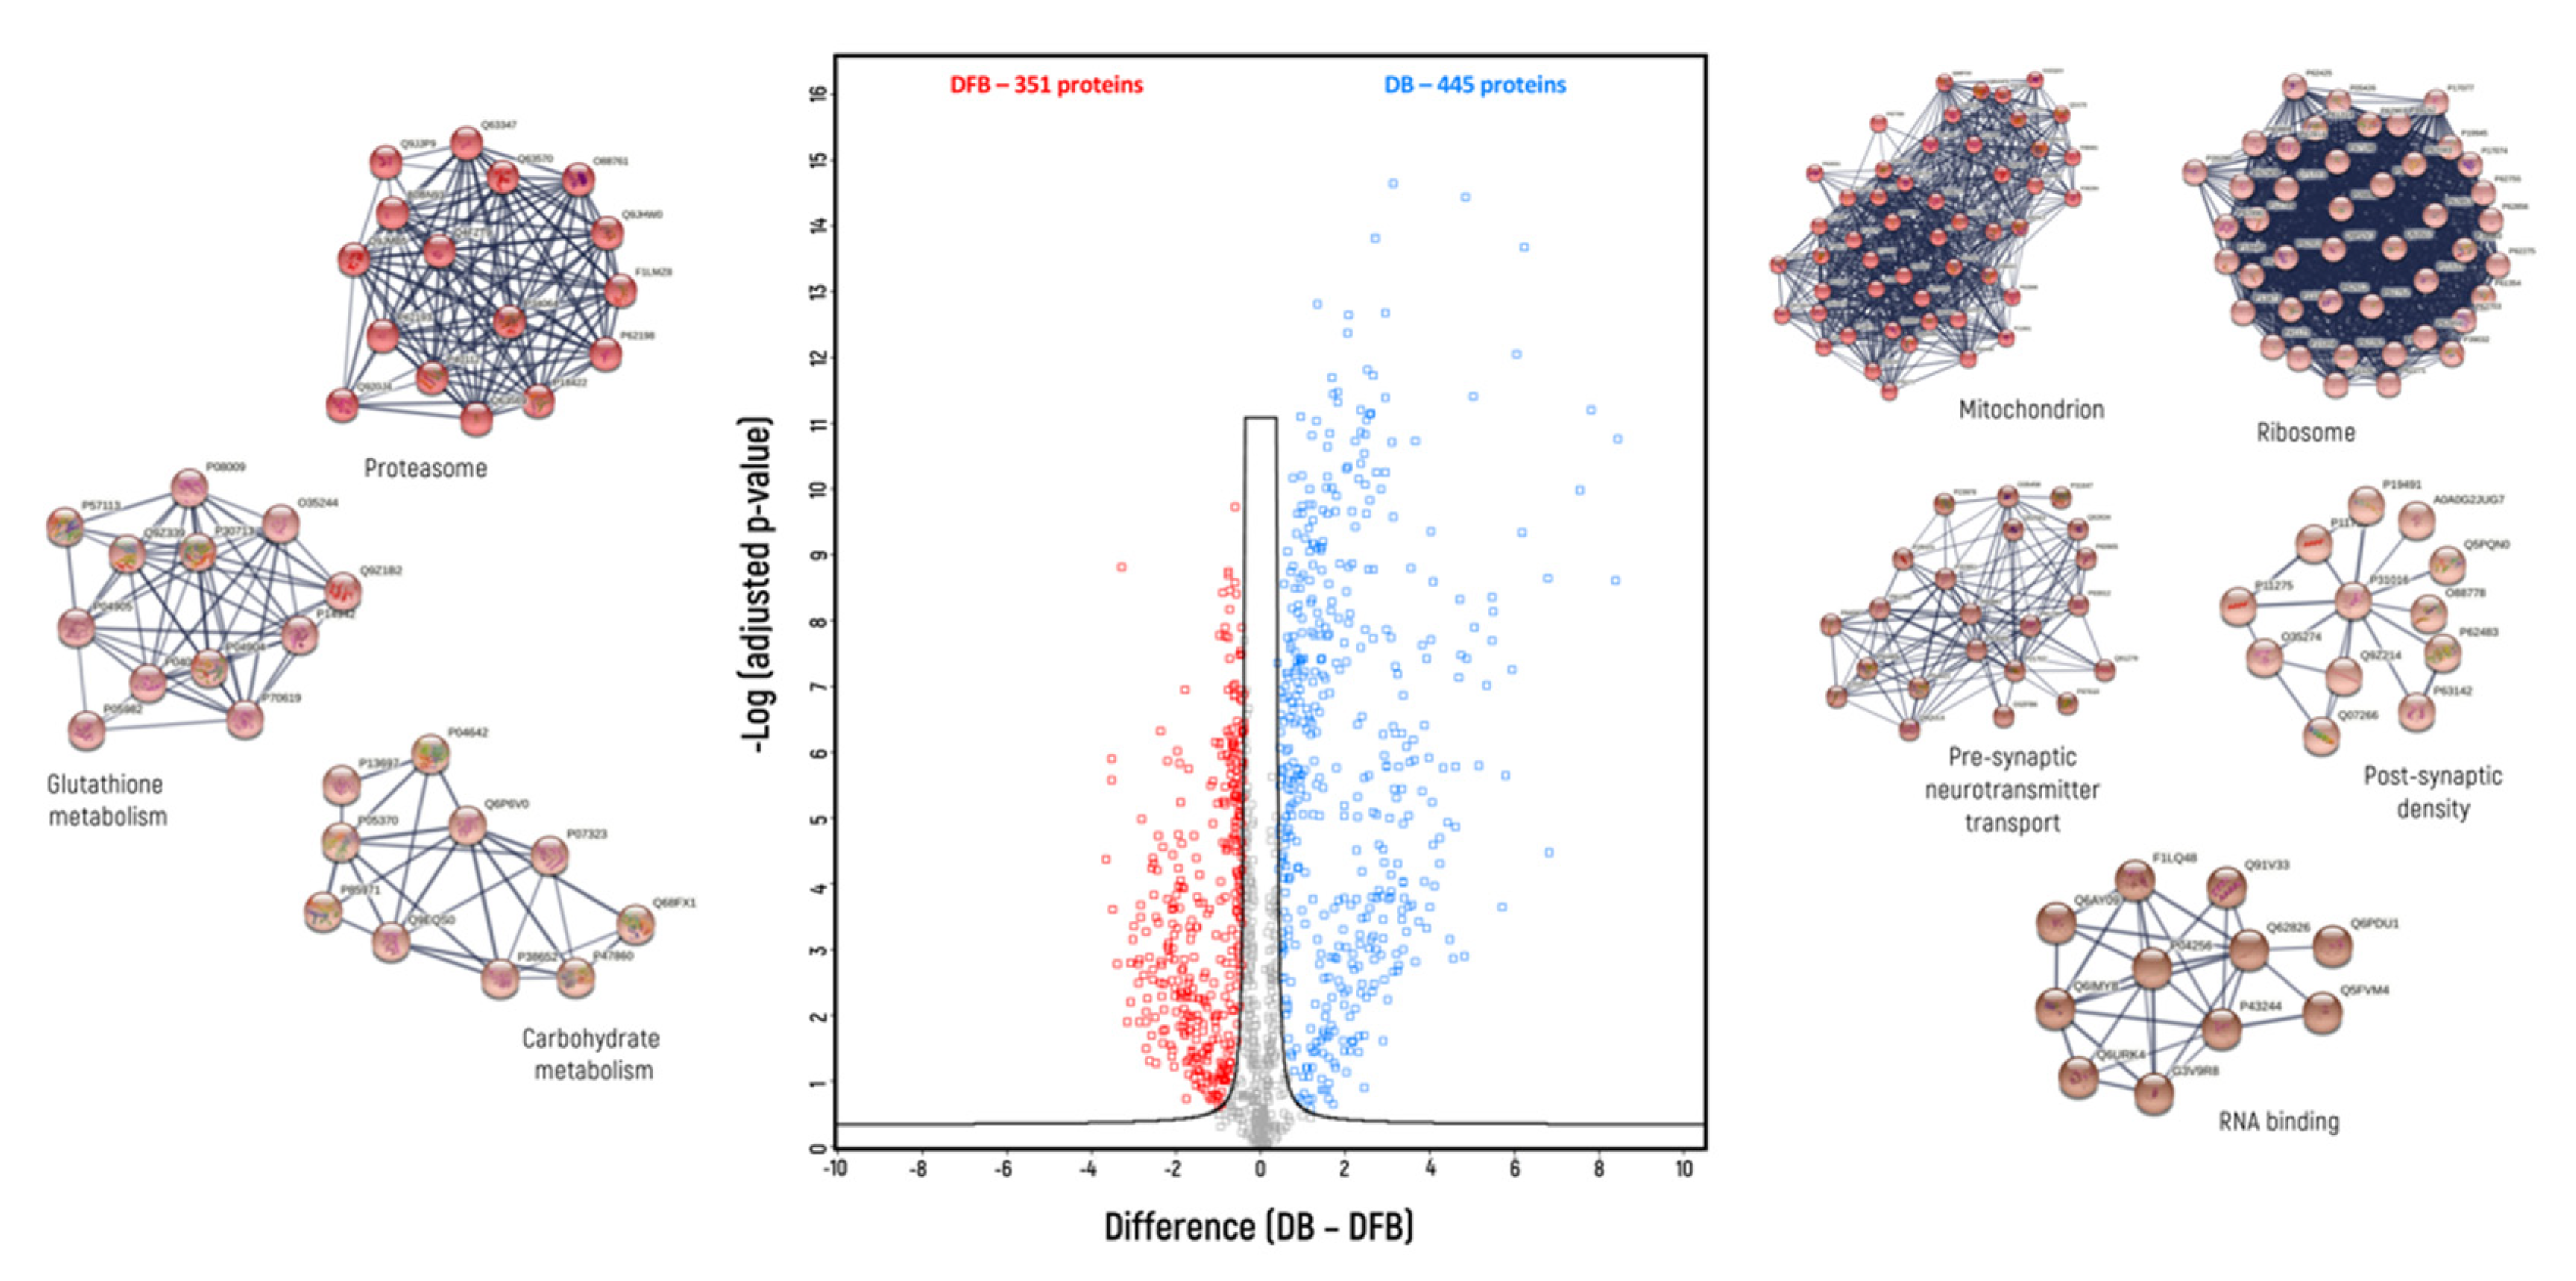
3. Results
4. Discussion
5. Conclusions
Author Contributions
Funding
Institutional Review Board Statement
Informed Consent Statement
Data Availability Statement
Conflicts of Interest
References
- Muntel, J.; Gandhi, T.; Verbeke, L.; Bernhardt, O.M.; Treiber, T.; Bruderer, R.; Reiter, L. Surpassing 10 000 identified and quantified proteins in a single run by optimizing current LC-MS instrumentation and data analysis strategy. Mol. Omics 2019, 15, 348–360. [Google Scholar] [CrossRef] [PubMed] [Green Version]
- Meier, F.; Geyer, P.E.; Virreira Winter, S.; Cox, J.; Mann, M. BoxCar acquisition method enables single-shot proteomics at a depth of 10,000 proteins in 100 minutes. Nat. Methods 2018, 15, 440–448. [Google Scholar] [CrossRef]
- Xu, Z.; Lee, A.; Nouwens, A.; Henderson, R.D.; McCombe, P.A. Mass spectrometry analysis of plasma from amyotrophic lateral sclerosis and control subjects. Amyotroph. Lateral Scler. Front. Degener. 2018, 19, 362–376. [Google Scholar] [CrossRef] [PubMed]
- Štalekar, M.; Yin, X.; Rebolj, K.; Darovic, S.; Troakes, C.; Mayr, M.; Shaw, C.E.; Rogelj, B. Proteomic analyses reveal that loss of TDP-43 affects RNA processing and intracellular transport. Neuroscience 2015, 293, 157–170. [Google Scholar] [CrossRef] [PubMed]
- Begcevic, I.; Brinc, D.; Brown, M.; Martinez-Morillo, E.; Goldhardt, O.; Grimmer, T.; Magdolen, V.; Batruch, I.; Diamandis, E.P. Brain-related proteins as potential CSF biomarkers of Alzheimer’s disease: A targeted mass spectrometry approach. J. Proteomics 2018, 182, 12–20. [Google Scholar] [CrossRef]
- Valdés, A.; García-Cañas, V.; Pérez-Sánchez, A.; Barrajón-Catalán, E.; Ruiz-Torres, V.; Artemenko, K.A.; Micol, V.; Bergquist, J.; Cifuentes, A. Shotgun proteomic analysis to study the decrease of xenograft tumor growth after rosemary extract treatment. J. Chromatogr. A 2017, 1499, 90–100. [Google Scholar] [CrossRef] [PubMed]
- Xu, G.; Li, Z.; Wang, L.; Chen, F.; Chi, Z.; Gu, M.; Li, S.; Wu, D.; Miao, J.; Zhang, Y.; et al. Label-free quantitative proteomics reveals differentially expressed proteins in high risk childhood acute lymphoblastic leukemia. J. Proteom. 2017, 150, 1–8. [Google Scholar] [CrossRef] [PubMed]
- Kessler, T.; Latzer, P.; Schmid, D.; Warnken, U.; Saffari, A.; Ziegler, A.; Kollmer, J.; Möhlenbruch, M.; Ulfert, C.; Herweh, C.; et al. Cerebrospinal fluid proteomic profiling in nusinersen-treated patients with spinal muscular atrophy. J. Neurochem. 2020, 153, 650–661. [Google Scholar] [CrossRef]
- Thompson, A.G.; Gray, E.; Thézénas, M.-L.; Charles, P.D.; Evetts, S.; Hu, M.T.; Talbot, K.; Fischer, R.; Kessler, B.M.; Turner, M.R. Cerebrospinal fluid macrophage biomarkers in amyotrophic lateral sclerosis. Ann. Neurol. 2018, 83, 258–268. [Google Scholar] [CrossRef]
- Wiśniewski, J.R.; Zougman, A.; Nagaraj, N.; Mann, M. Universal sample preparation method for proteome analysis. Nat. Methods 2009, 6, 359–362. [Google Scholar] [CrossRef]
- Hailemariam, M.; Eguez, R.V.; Singh, H.; Bekele, S.; Ameni, G.; Pieper, R.; Yu, Y. S-Trap, an Ultrafast Sample-Preparation Approach for Shotgun Proteomics. J. Proteome Res. 2018, 17, 2917–2924. [Google Scholar] [CrossRef] [PubMed]
- Hughes, C.S.; Moggridge, S.; Müller, T.; Sorensen, P.H.; Morin, G.B.; Krijgsveld, J. Single-pot, solid-phase-enhanced sample preparation for proteomics experiments. Nat. Protoc. 2019, 14, 68–85. [Google Scholar] [CrossRef] [PubMed]
- Wessel, D.; Flügge, U.I. A method for the quantitative recovery of protein in dilute solution in the presence of detergents and lipids. Anal. Biochem. 1984, 138, 141–143. [Google Scholar] [CrossRef]
- Crowell, A.M.J.; Wall, M.J.; Doucette, A.A. Maximizing recovery of water-soluble proteins through acetone precipitation. Anal. Chim. Acta 2013, 796, 48–54. [Google Scholar] [CrossRef] [PubMed]
- Rajalingam, D.; Loftis, C.; Xu, J.J.; Kumar, T.K.S. Trichloroacetic acid-induced protein precipitation involves the reversible association of a stable partially structured intermediate. Protein Sci. 2009, 18, 980–993. [Google Scholar] [CrossRef] [Green Version]
- Winter, D.; Steen, H. Optimization of cell lysis and protein digestion protocols for the analysis of HeLa S3 cells by LC-MS/MS. Proteomics 2011, 11, 4726–4730. [Google Scholar] [CrossRef]
- Zhou, J.; Zhou, T.; Cao, R.; Liu, Z.; Shen, J.; Chen, P.; Wang, X.; Liang, S. Evaluation of the Application of Sodium Deoxycholate to Proteomic Analysis of Rat Hippocampal Plasma Membrane. J. Proteome Res. 2006, 5, 2547–2553. [Google Scholar] [CrossRef]
- Yu, Y.-Q.; Gilar, M.; Lee, P.J.; Bouvier, E.S.P.; Gebler, J.C. Enzyme-Friendly, Mass Spectrometry-Compatible Surfactant for In-Solution Enzymatic Digestion of Proteins. Anal. Chem. 2003, 75, 6023–6028. [Google Scholar] [CrossRef]
- Johnson, E.C.B.; Dammer, E.B.; Duong, D.M.; Ping, L.; Zhou, M.; Yin, L.; Higginbotham, L.A.; Guajardo, A.; White, B.; Troncoso, J.C.; et al. Large-scale proteomic analysis of Alzheimer’s disease brain and cerebrospinal fluid reveals early changes in energy metabolism associated with microglia and astrocyte activation. Nat. Med. 2020, 26, 769–780. [Google Scholar] [CrossRef]
- Ping, L.; Duong, D.M.; Yin, L.; Gearing, M.; Lah, J.J.; Levey, A.I.; Seyfried, N.T. Global quantitative analysis of the human brain proteome in Alzheimer’s and Parkinson’s Disease. Sci. Data 2018, 5, 180036. [Google Scholar] [CrossRef]
- Gomez-Deza, J.; Shaw, C.E. Amyotrophic Lateral Sclerosis and Other TDP-43 Proteinopathies. In The Molecular and Cellular Basis of Neurodegenerative Diseases: Underlying Mechanisms; Elsevier: Amsterdam, The Netherlands, 2018; pp. 99–115. ISBN 9780128113059. [Google Scholar]
- Mol, M.O.; Miedema, S.S.M.; van Swieten, J.C.; van Rooij, J.G.J.; Dopper, E.G.P. Molecular Pathways Involved in Frontotemporal Lobar Degeneration with TDP-43 Proteinopathy: What Can We Learn from Proteomics? Int. J. Mol. Sci. 2021, 22, 10298. [Google Scholar] [CrossRef] [PubMed]
- Muller, T.; Winter, D. Systematic Evaluation of Protein Reduction and Alkylation Reveals Massive Unspecific Side Effects by Iodine-containing Reagents. Mol. Cell. Proteom. 2017, 16, 1173–1187. [Google Scholar] [CrossRef] [Green Version]
- Kong, A.T.; Leprevost, F.V.; Avtonomov, D.M.; Mellacheruvu, D.; Nesvizhskii, A.I. MSFragger: Ultrafast and comprehensive peptide identification in mass spectrometry–based proteomics. Nat. Methods 2017, 14, 513–520. [Google Scholar] [CrossRef] [PubMed] [Green Version]
- da Veiga Leprevost, F.; Haynes, S.E.; Avtonomov, D.M.; Chang, H.-Y.; Shanmugam, A.K.; Mellacheruvu, D.; Kong, A.T.; Nesvizhskii, A.I. Philosopher: A versatile toolkit for shotgun proteomics data analysis. Nat. Methods 2020, 17, 869–870. [Google Scholar] [CrossRef] [PubMed]
- Chambers, M.C.; Maclean, B.; Burke, R.; Amodei, D.; Ruderman, D.L.; Neumann, S.; Gatto, L.; Fischer, B.; Pratt, B.; Egertson, J.; et al. A cross-platform toolkit for mass spectrometry and proteomics. Nat. Biotechnol. 2012, 30, 918–920. [Google Scholar] [CrossRef] [PubMed]
- Keller, A.; Nesvizhskii, A.I.; Kolker, E.; Aebersold, R. Empirical Statistical Model To Estimate the Accuracy of Peptide Identifications Made by MS/MS and Database Search. Anal. Chem. 2002, 74, 5383–5392. [Google Scholar] [CrossRef] [PubMed]
- Nesvizhskii, A.I.; Keller, A.; Kolker, E.; Aebersold, R. A Statistical Model for Identifying Proteins by Tandem Mass Spectrometry. Anal. Chem. 2003, 75, 4646–4658. [Google Scholar] [CrossRef]
- Yu, F.; Haynes, S.E.; Nesvizhskii, A.I. IonQuant Enables Accurate and Sensitive Label-Free Quantification With FDR-Controlled Match-Between-Runs. Mol. Cell. Proteom. 2021, 20, 100077. [Google Scholar] [CrossRef]
- Cox, J.; Hein, M.Y.; Luber, C.A.; Paron, I.; Nagaraj, N.; Mann, M. Accurate Proteome-wide Label-free Quantification by Delayed Normalization and Maximal Peptide Ratio Extraction, Termed MaxLFQ. Mol. Cell. Proteom. 2014, 13, 2513–2526. [Google Scholar] [CrossRef] [Green Version]
- Tyanova, S.; Temu, T.; Sinitcyn, P.; Carlson, A.; Hein, M.Y.; Geiger, T.; Mann, M.; Cox, J. The Perseus computational platform for comprehensive analysis of (prote)omics data. Nat. Methods 2016, 13, 731–740. [Google Scholar] [CrossRef]
- Rudolph, J.D.; Cox, J. A Network Module for the Perseus Software for Computational Proteomics Facilitates Proteome Interaction Graph Analysis. J. Proteome Res. 2019, 18, 2052–2064. [Google Scholar] [CrossRef] [Green Version]
- Snel, B. STRING: A web-server to retrieve and display the repeatedly occurring neighbourhood of a gene. Nucleic Acids Res. 2000, 28, 3442–3444. [Google Scholar] [CrossRef] [PubMed] [Green Version]
- Mi, H.; Muruganujan, A.; Huang, X.; Ebert, D.; Mills, C.; Guo, X.; Thomas, P.D. Protocol Update for Large-scale genome and gene function analysis with PANTHER Classification System (v.14.0). Nat. Protoc. 2019, 14, 703. [Google Scholar] [CrossRef] [PubMed]
- Enright, A.J. An efficient algorithm for large-scale detection of protein families. Nucleic Acids Res. 2002, 30, 1575–1584. [Google Scholar] [CrossRef]
- Rossky, P.J. Protein denaturation by urea: Slash and bond. Proc. Natl. Acad. Sci. USA 2008, 105, 16825–16826. [Google Scholar] [CrossRef] [Green Version]
- Koza, P.; Beroun, A.; Konopka, A.; Górkiewicz, T.; Bijoch, L.; Torres, J.C.; Bulska, E.; Knapska, E.; Kaczmarek, L.; Konopka, W. Neuronal TDP-43 depletion affects activity-dependent plasticity. Neurobiol. Dis. 2019, 130, 104499. [Google Scholar] [CrossRef] [PubMed]
- Gill, T.J.; Smith, G.J.; Wissler, R.W.; Kunz, H.W. The Rat as an Experimental Animal. Science 1989, 245, 269–276. [Google Scholar] [CrossRef]
- Liu, X.; Guo, Z.; Liu, W.; Sun, W.; Ma, C. Differential proteome analysis of hippocampus and temporal cortex using label-free based 2D-LC-MS/MS. J. Proteom. 2017, 165, 26–34. [Google Scholar] [CrossRef]
- Cui, Y.; Liu, X.; Li, X.; Yang, H. In-Depth Proteomic Analysis of the Hippocampus in a Rat Model after Cerebral Ischaemic Injury and Repair by Danhong Injection (DHI). Int. J. Mol. Sci. 2017, 18, 1355. [Google Scholar] [CrossRef] [Green Version]
- Hamezah, H.S.; Durani, L.W.; Yanagisawa, D.; Ibrahim, N.F.; Aizat, W.M.; Bellier, J.P.; Makpol, S.; Ngah, W.Z.W.; Damanhuri, H.A.; Tooyama, I. Proteome profiling in the hippocampus, medial prefrontal cortex, and striatum of aging rat. Exp. Gerontol. 2018, 111, 53–64. [Google Scholar] [CrossRef]
- Alugubelly, N.; Mohammad, A.N.; Edelmann, M.J.; Nanduri, B.; Sayed, M.; Park, J.W.; Carr, R.L. Proteomic and transcriptional profiling of rat amygdala following social play. Behav. Brain Res. 2019, 376, 112210. [Google Scholar] [CrossRef] [PubMed]
- Shevchenko, G.; Musunuri, S.; Wetterhall, M.; Bergquist, J. Comparison of extraction methods for the comprehensive analysis of mouse brain proteome using shotgun-based mass spectrometry. J. Proteome Res. 2012, 11, 2441–2451. [Google Scholar] [CrossRef] [PubMed]
- Ericsson, C.; Peredo, I.; Nistér, M. Optimized protein extraction from cryopreserved brain tissue samples. Acta Oncol. 2007, 46, 10–20. [Google Scholar] [CrossRef] [PubMed]
- Evans, H.T.; Benetatos, J.; van Roijen, M.; Bodea, L.; Götz, J. Decreased synthesis of ribosomal proteins in tauopathy revealed by non-canonical amino acid labelling. EMBO J. 2019, 38, e101174. [Google Scholar] [CrossRef] [PubMed]
- Ettle, B.; Schlachetzki, J.C.M.; Winkler, J. Oligodendroglia and Myelin in Neurodegenerative Diseases: More Than Just Bystanders? Mol. Neurobiol. 2016, 53, 3046–3062. [Google Scholar] [CrossRef] [PubMed] [Green Version]
- Subramanian, J.; Savage, J.C.; Tremblay, M.-È. Synaptic Loss in Alzheimer’s Disease: Mechanistic Insights Provided by Two-Photon in vivo Imaging of Transgenic Mouse Models. Front. Cell. Neurosci. 2020, 14. [Google Scholar] [CrossRef] [PubMed]


| Detergent Buffer (DB) | Chaotropic Agent Buffer (CAB) | Detergent-Free Buffer (DFB) |
|---|---|---|
| 1% SDS 100 mM TEAB, pH 8.5 protease and phosphatase inhibitors | 8 M urea, 2 M thiourea 50 mM Tris-HCl, pH 8.5 protease and phosphatase inhibitors | 250 mM sucrose 150 mM NaCl 1 mM EDTA 50 mM HEPES, pH 7.0 protease and phosphatase inhibitors |
| Detergent Buffer (DB) | Chaotropic Agent Buffer (CAB) | Detergent-Free Buffer (DFB) | |
|---|---|---|---|
| membrane proteins | 773 | 843 | 729 |
| synaptic proteins | 434 | 454 | 416 |
| synaptic membrane proteins | 90 | 100 | 77 |
| cytosolic proteins | 600 | 641 | 662 |
| DB, CAB | DB, DFB | CAB, DFB | |
|---|---|---|---|
| membrane proteins | 64; 16 | 301;112 | 238; 103 |
| synaptic proteins | 29; 4 | 170; 50 | 129; 49 |
| synaptic membrane proteins | 4; 0 | 45; 5 | 41; 3 |
| cytosolic proteins | 43; 16 | 137; 198 | 95; 171 |
Publisher’s Note: MDPI stays neutral with regard to jurisdictional claims in published maps and institutional affiliations. |
© 2022 by the authors. Licensee MDPI, Basel, Switzerland. This article is an open access article distributed under the terms and conditions of the Creative Commons Attribution (CC BY) license (https://creativecommons.org/licenses/by/4.0/).
Share and Cite
Karpiński, A.A.; Torres Elguera, J.C.; Sanner, A.; Konopka, W.; Kaczmarek, L.; Winter, D.; Konopka, A.; Bulska, E. Study on Tissue Homogenization Buffer Composition for Brain Mass Spectrometry-Based Proteomics. Biomedicines 2022, 10, 2466. https://doi.org/10.3390/biomedicines10102466
Karpiński AA, Torres Elguera JC, Sanner A, Konopka W, Kaczmarek L, Winter D, Konopka A, Bulska E. Study on Tissue Homogenization Buffer Composition for Brain Mass Spectrometry-Based Proteomics. Biomedicines. 2022; 10(10):2466. https://doi.org/10.3390/biomedicines10102466
Chicago/Turabian StyleKarpiński, Adam Aleksander, Julio Cesar Torres Elguera, Anne Sanner, Witold Konopka, Leszek Kaczmarek, Dominic Winter, Anna Konopka, and Ewa Bulska. 2022. "Study on Tissue Homogenization Buffer Composition for Brain Mass Spectrometry-Based Proteomics" Biomedicines 10, no. 10: 2466. https://doi.org/10.3390/biomedicines10102466