Article

Near-Infrared Fluorescence Probe for Visualizing Fluctuations of Peroxynitrite in Living Cells and Inflammatory Mouse Models

1
Key Laboratory for Special Functional Materials of Ministry of Education, School of Materials Science and Engineering, Henan University, Kaifeng 475004, China
2
Key Laboratory of Natural Medicine and Immuno-Engineering of Henan Province, Henan University, Kaifeng 475004, China
*
Author to whom correspondence should be addressed.
These authors contributed equally to this work.
Chemosensors 2023, 11(6), 316; https://doi.org/10.3390/chemosensors11060316
Submission received: 25 April 2023 / Revised: 15 May 2023 / Accepted: 22 May 2023 / Published: 24 May 2023

Abstract

:
Inflammation is a vital protective response in living systems and closely related to various diseases. As a member of the reactive oxygen species (ROS) family, peroxynitrite (ONOO) is involved in the organism’s inflammatory process and considered as an important biomarker of inflammation. Therefore, the construction of a simple, rapid, and sensitive tool for detecting ONOO is of great importance for the diagnosis of inflammation. In this study, we constructed the new near-infrared fluorescence probe BDP-ENE-S-Py+ based on BODIPY dye, which has the advantages of fast response speed (2 min), good selectivity, and a high signal-to-noise ratio. Moreover, the probe had a good linear relationship (LOD = 120 nM) when the ONOO concentration was 10–35 µM. In addition, BDP-ENE-S-Py+ could detect exogenous ONOO in liver cancer cells without interference from other reactive oxygen species and visualize the fluctuations in ONOO concentrations in cells. More importantly, BDP-ENE-S-Py+ was able to track the upregulation of ONOO content in a mouse model of peritonitis induced by LPS. This work demonstrated that the near-infrared fluorescent probe for visualizing ONOO level fluctuations could provide a promising tool for inflammation-related studies.

1. Introduction

Inflammation is a kind of innate defense response of the biological body to tissue injury, which often occurs in the process of local or systemic inflammation after infection or injury [1,2,3]. In the process of inflammation, immune cells release a large number of soluble mediations, such as cytokines, reactive oxygen species (ROS), chemokines, reactive nitrogen species (RNS), etc., which can remove irritants by fighting pathogens or promoting tissue repair and healing [3,4,5,6]. However, the imbalance of inflammation regulation is closely related to a variety of diseases, such as atherosclerosis, rheumatoid arthritis, Alzheimer’s disease, tumors, and COVID-19 [7,8,9]. Therefore, it is of great importance to develop a reliable tool for detecting and diagnosing inflammation.
Peroxynitrite (ONOO), an active molecule of ROS and RNS, is produced in biological systems by coupling the diffusion control of nitric oxide (NO) and superoxide anion (O2•−) [10,11]. Numerous studies have shown that ONOO is more cytotoxic than NO and O2•− [10]. Excessive production of ONOO will cause damage to key components in cells, such as proteins, lipids, mercaptans, and DNA, and eventually lead to cell death [12,13,14,15,16,17,18,19]. Therefore, ONOO is concerned with various diseases, such as inflammation, diabetes, neurodegenerative diseases, and cancer [20,21,22]. In consequence, it is of great importance to construct a reliable, simple, and efficient method for the detection of ONOO in vivo and develop full understanding of the relationship between ONOO and inflammation. At present, the commonly used ONOO detection methods include high-performance liquid chromatography, spectrophotometry, electron spin resonance, and the fluorescent probe method [23]. Among them, the fluorescence probe method is widely used due to its advantages of non-invasive and real-time imaging, good selectivity, and high sensitivity [24,25,26,27,28,29,30,31,32,33,34,35,36]. In the last few years, all kinds of fluorescent probes have been reported for the detection of ONOO, and the detection groups commonly used in the construction of probes include phenyl borate [37,38,39], α-ketoamide [40,41,42], diphenyl phosphoric acid [43,44,45], hydrazine [46,47,48], and chalcogenide [49,50,51]. However, most of the probes are located in the visible region, with short emission wavelengths, large background interference, and poor tissue penetration ability; thus, they cannot perform in situ real-time in vivo imaging well. Therefore, it is imperative to construct a near-infrared fluorescence probe for in situ real-time in vivo imaging to visually detect ONOO level fluctuations in living cells and inflammatory mouse models.
BODIPY dyes have been widely used in many aspects due to their excellent properties, such as good chemical and optical stability, high quantum yield, and pH insensitivity [52,53,54]. Therefore, by regulating the substituents at positions 3 and 5 and expanding their conjugated degree, we constructed a near-infrared BODIPY dye as a fluorophore and used benzeneboronic acid pinacol ester as the detection group. The near-infrared fluorescence probe BDP-ENE-S-Py+ was constructed by connecting the two parts with a benzylpyridinyl group (Scheme 1). The fluorescence of the probe was quenched thanks to photoinduced electron transfer (PET) between the electron-deficient benzyl quaternary pyridine salt and the electron-rich BDP-ENE-S-Me. Unsurprisingly, the probe displayed a fast response to ONOO with high sensitivity, good selectivity, and a high signal-to-noise ratio. In addition, BDP-ENE-S-Py+ could detect exogenous ONOO in liver cancer cells without interference from other reactive oxygen species and was also able to visually detect the fluctuations in ONOO concentration levels in cells. More importantly, BDP-ENE-S-Py+ was able to detect upregulation of ONOO in a mouse model of peritonitis induced by LPS. These results indicated that the probe had broad applicability and could be utilized as a powerful tool for the diagnosis of inflammation through detection of ONOO fluctuations.

2. Experimental Section

2.1. Synthesis of Compounds

The details of synthesis are shown in Scheme S1.
Synthesis of BDP-Me: Under nitrogen, 2,4-dimethylpyrrole (1.03 mL, 10 mmol) and 4-pyridinecarboxaldehyde (471 mg, 5 mmol) were dissolved in 10 mL anhydrous dichloromethane, followed by addition of trifluoroacetic acid for overnight reaction at room temperature and pressure. After half an hour of reaction with chloranil (1.23 g, 5 mmol), triethylamine (10 mL, 7 mmol) and boron trifluoride diethyl etherate (10 mL, 8 mmol) were added in an ice bath. After stirring for three hours, the silica gel column was filtered. Orange crystals (200 mg, 25%) were purified by column chromatography.
Synthesis of BDP-ENE-S-Me: Under nitrogen, BDP-Me (98 mg, 0.3 mmol) and 5-methyl-2-thhene formaldehyde (0.13 mL, 1.2 mmol) were dissolved in 10 mL anhydrous acetonitrile, piperidine (0.3 mL, 10 mmol) was added, and the mixture was then stirred for 3 h at 80 °C reflux. After the reaction, the solvent was removed by using a rotary evaporator, and the green crystal (61 mg, 40% yield) was purified by column chromatography. And nuclear magnetic verification was carried out (Figures S7 and S8). 1H NMR (500 MHz, DMSO-d6) δ 8.784 (d, J = 6.0 Hz, 2H), 7.723 (s, 1H), 7.691 (s, 1H), 7.571 (d, J = 6.0 Hz, 2H), 7.168 (d, J = 4.0 Hz, 2H), 7.135 (s, 1H), 7.104 (s, 1H), 6.954 (s, 2H), 6.875 (d, J = 3.5 Hz, 2H), 2.520 (s, 6H), 1.147 (s, 6H). 13C NMR (125 MHz, CDCl3) δ 151.75, 149.50, 141.96, 139.90, 139.38, 132.31, 131.35, 128.75, 128.01, 125.49, 123.00, 117.12, 116.18, 14.89, 13.83. HRMS-ESI: calculated for [C30H26BF2N3S2 + H]+: 542.17075; found: 542.17086.
Synthesis of BDP-ENE-S-Py+: BDP-ENE-S-Me (30 mg, 0.055 mmol) and 4-bromomethyl benzeneboronic acid pinacol ester (49 mg, 0.165 mmol) were dissolved in 10 mL toluene and stirred for 24 h at 120 °C reflux. At the end of the reaction, the mixture was filtered and washed with toluene, which was followed by recrystallization with dichloromethanes and petroleum ether, finally yielding the green solid BDP-ENE-S-Py+ (15 mg, yield 36%). And nuclear magnetic verification was carried out (Figures S9 and S10). 1H NMR (500 MHz, DMSO-d6) δ 9.389 (d, J = 6.5 Hz, 2H), 8.521 (d, J = 6.5 Hz, 2H), 7.773 (d, J = 4 Hz, 2H), 7.749 (d, J = 4.5 Hz, 2H), 7.495 (d, J = 8.0 Hz, 2H), 7.202 (d, J = 3.5 Hz, 2H), 7.139 (s, 1H), 7.107 (s, 1H), 7.005 (s, 2H), 6.892 (d, J = 4.0 Hz, 2H), 6.017 (s, 2H), 2.526 (s, 6H), 1.423 (s, 6H), 1.304 (s, 12H). 13C NMR (125 MHz, DMSO-d6) δ 153.11, 152.26, 146.56, 143.96, 141.10, 137.88, 135.65, 135.35, 132.10, 131.66, 131.57, 130.33, 129.94, 128.32, 127.97, 127.74, 119.74, 116.20, 84.43, 63.98, 25.14, 24.96, 16.03, 16.00, 15.47. HRMS-ESI: calculated for [C43H44B2F2N3O2S2]+: 758.30236; found: 758.30254.

2.2. General Information

All the materials and reagents were purchased and used without further purification. 1H NMR spectra were taken using a Bruker AVANCE NEO 500 MHz spectrometer. 1H NMR data of chemical shifts (δ) are given in ppm (s = singlet, d = doublet, t = triplet, q = quartet, m = multiplet) using CDCl3 (δ = 7.26 ppm) and dimethyl sulfoxide (δ = 2.5 ppm) as a reference. 13C NMR spectra were recorded on a Bruker AVANCE NEO 125 MHz spectrometer, and the chemical shifts (δ) were reported in ppm with CDCl3 and DMSO-d6 at δ 77.0 and 39.4 ppm as the internal standard. Absorption spectra and fluorescence emission spectra were recorded on a LengGuang Tech. UV 1920 UV–vis spectrometer and F97 Pro spectrofluorophotometer, respectively. High-resolution mass spectra were measured from an Agilent 7250&JEOL-JMS-T100LP AccuTOF. The cell images were taken using the Leica DMI8 inverted fluorescence microscope (Leica, Germany). λex = 405/660 nm, λem = 420–500/662–738 nm. The live imaging was monitored using a fluorescence imaging system (IVIS Spectrum Live Imaging System, PerkinElmer, Waltham, MA, USA).

2.3. Spectroscopic Measurements in Solution

A stock solution of BDP-ENE-S-Py+ (1 mM) was prepared in acetonitrile and was subsequently diluted to appropriate concentration in acetonitrile/PBS (1:1, v/v, 10 mM, pH 7.4). The stock solutions (10 mM) of analytes were prepared in PBS. The analytes used in the stock aqueous solutions of analytes were 0: blank, 1: ONOO, 2: HClO, 3: H2O2, 4: OH, 5: 1O2, 6: NO, 7: Ca2+, 8: Cu2+, 9: Mg2+, 10: NO2, 11: HS, 12: SO32−, 13: SO42−, 14: Cys, 15: GSH, and 16: Hcy. All absorption and fluorescence measurements were performed in acetonitrile/PBS buffer (1:1, v/v, 10 mM, pH 7.4) at room temperature. In the selectivity studies, the test samples were prepared by adding the appropriate amount of the individual stock solution of analytes to 4 mL solution of BDP-ENE-S-Py+ (10 µM). In the anti-interference study, the sample was prepared by adding ONOO to 4 mL BDP-ENE-S-Py+ (10 µM) solution and the analyte of the same concentration. In the titration experiment, solutions of BDP-ENE-S-Py+ (10 µM) were incubated with different concentrations of ONOO. In the pH stability study, samples were prepared by adding BDP-ENE-S-Py+ (10 µM) and ONOO to 4 mL of buffer solution at different pH values.
The fluorescence spectra were recorded with the excitation at 620 nm and the emission was collected at 640–900 nm.

2.4. Determination of the Detection Limit

The detection limit was calculated based on the fluorescence titration. In the absence of ONOO, the fluorescence emission spectrum of BDP-ENE-S-Py+ was measured eight times and the standard deviation of blank measurement was obtained. To gain the slope, the fluorescence intensity at 694 nm was plotted to the concentration of ONOO. The detection limit was calculated with the following equation:
Detection limit = 3σ/k
where σ is the standard deviation of blank measurement and k is the slope between the fluorescence intensities versus the concentrations of ONOO.

2.5. Density Functional Theory

The density functional theory (DFT) calculations were performed in Materials Studio. M11-L meta-Generalized gradient approximation (GGA) was adopted. The structures were relaxed until the forces acting over all atoms were less than 0.05 eV/Å, and electronic energies converged in the range of 2 × 10⁻⁵ eV.
Prof. Changwei Gong from Taiyuan University of Science and Technology is thanked for his assistance in the theoretical calculations.

2.6. Cell Culture and Imaging

The HepG2 cells were cultured in high-glucose Dulbecco’s Modified Eagle Medium (DMEM) supplemented with 10% fetal bovine serum (FBS) and 1% penicillin–streptomycin and incubated under an atmosphere containing 5% CO2 in 37 °C humidified air for 24 h.

2.7. Cytotoxicity Assays

Cytotoxicity test: HepG2 cells were incubated in DMEM medium containing 10% fetal bovine serum in 96-well plates (5 × 10³) for 24 h. BDP-ENE-S-Py+ was diluted into different concentrations (2 μM, 5 μM, 10 μM, 20 μM, 30 μM, 40 μM, 50 μM) in medium and incubated cells. After HepG2 cells were placed in darkness for 24 h, the cytotoxicity of BDP-ENE-S-Py+ was evaluated using a CCK-8 assay. The cells were then cultured with CCK-8 (10 μL) for 1 h. After full mixing, the absorbance of the cells was measured at 450 nm using an enzyme label. Each result was averaged over the three wells and 100 percent survival was measured for untreated cells. Relative cell viability (%) was calculated as follows: cell viability = OD sample/OD control × 100%.

2.8. Cell Selectivity Experiment

Intracellular selective imaging ONOO experiment: The HepG2 cells could be divided into four groups. The first group of cells was incubated with 10 µM BDP-ENE-S-Py+ for 30 min, was incubated with Hoechst 33342 (1 μg/mL) (Biyuntian Biotechnology Co., Ltd., Shanghai, China) for 10 min, and then washed with PBS 3 times for fluorescence imaging. In the second group, cells were preincubated with H2O2 (500 μM) for 1 h and incubated with 10 µM BDP-ENE-S-Py+ for 30 min, incubated with Hoechst 33342 (1 μg/mL) for 10 min, and then washed with PBS 3 times for fluorescence imaging. In the third group, cells were preincubated with HClO (500 μM) for 1 h and incubated with 10 µM BDP-ENE-S-Py+ for 30 min, incubated with Hoechst 33342 (1 μg/mL) for 10 min, and then washed with PBS 3 times for fluorescence imaging. In the fourth group, cells were preincubated with 500 µM 3-morpholine pyridine imine hydrochloride (SIN-1) for 1 h and incubated with 10 µM BDP-ENE-S-Py+ for 30 min, incubated with Hoechst 33342 (1 μg/mL) for 10 min, and then washed with PBS 3 times for fluorescence imaging.

2.9. Experiments with Different Concentrations of SIN-1

The HepG2 cells could be divided into three groups. The first group of cells was incubated with 10 µM BDP-ENE-S-Py+ for 30 min. In the second group, cells were preincubated with SIN-1 (300 μM) for 1 h and then added to 10 µM BDP-ENE-S-Py+ for 30 min. The final group of cells was treated with BDP-ENE-S-Py+ (10 μM) for 30 min after incubation with SIN-1 (500 μM) for 2 h. Finally, Hoechst 33342 (1 μg·mL−1) was added to the three cell groups and they were incubated for another 10 min. Cell imaging was performed using an inverted fluorescence microscope after washing the cells with PBS three times.

2.10. Fluorescence Imaging in Mice

All animal care and experimental protocols for this study were approved by the Animal Experiment Ethics Committee of Henan University.
Mouse peritonitis induced by lipopolysaccharide (LPS) was tested. The LPS experimental group of mice was intraperitoneally injected with LPS (100 µg·kg−1) for 24 h, and the BDP-ENE-S-Py+ probe (100 μL, 10 µM) was then injected in the same region. The probe control group of mice was injected only with BDP-ENE-S-Py+ (100 μL, 10 µM). Fluorescence images were taken at 0, 10, 30, and 60 min after the addition of the probe. Images were taken using an excitation laser at 630 nm and an emission filter of 700 nm. All groups within the study contained n = 3 mice.

3. Results and Discussion

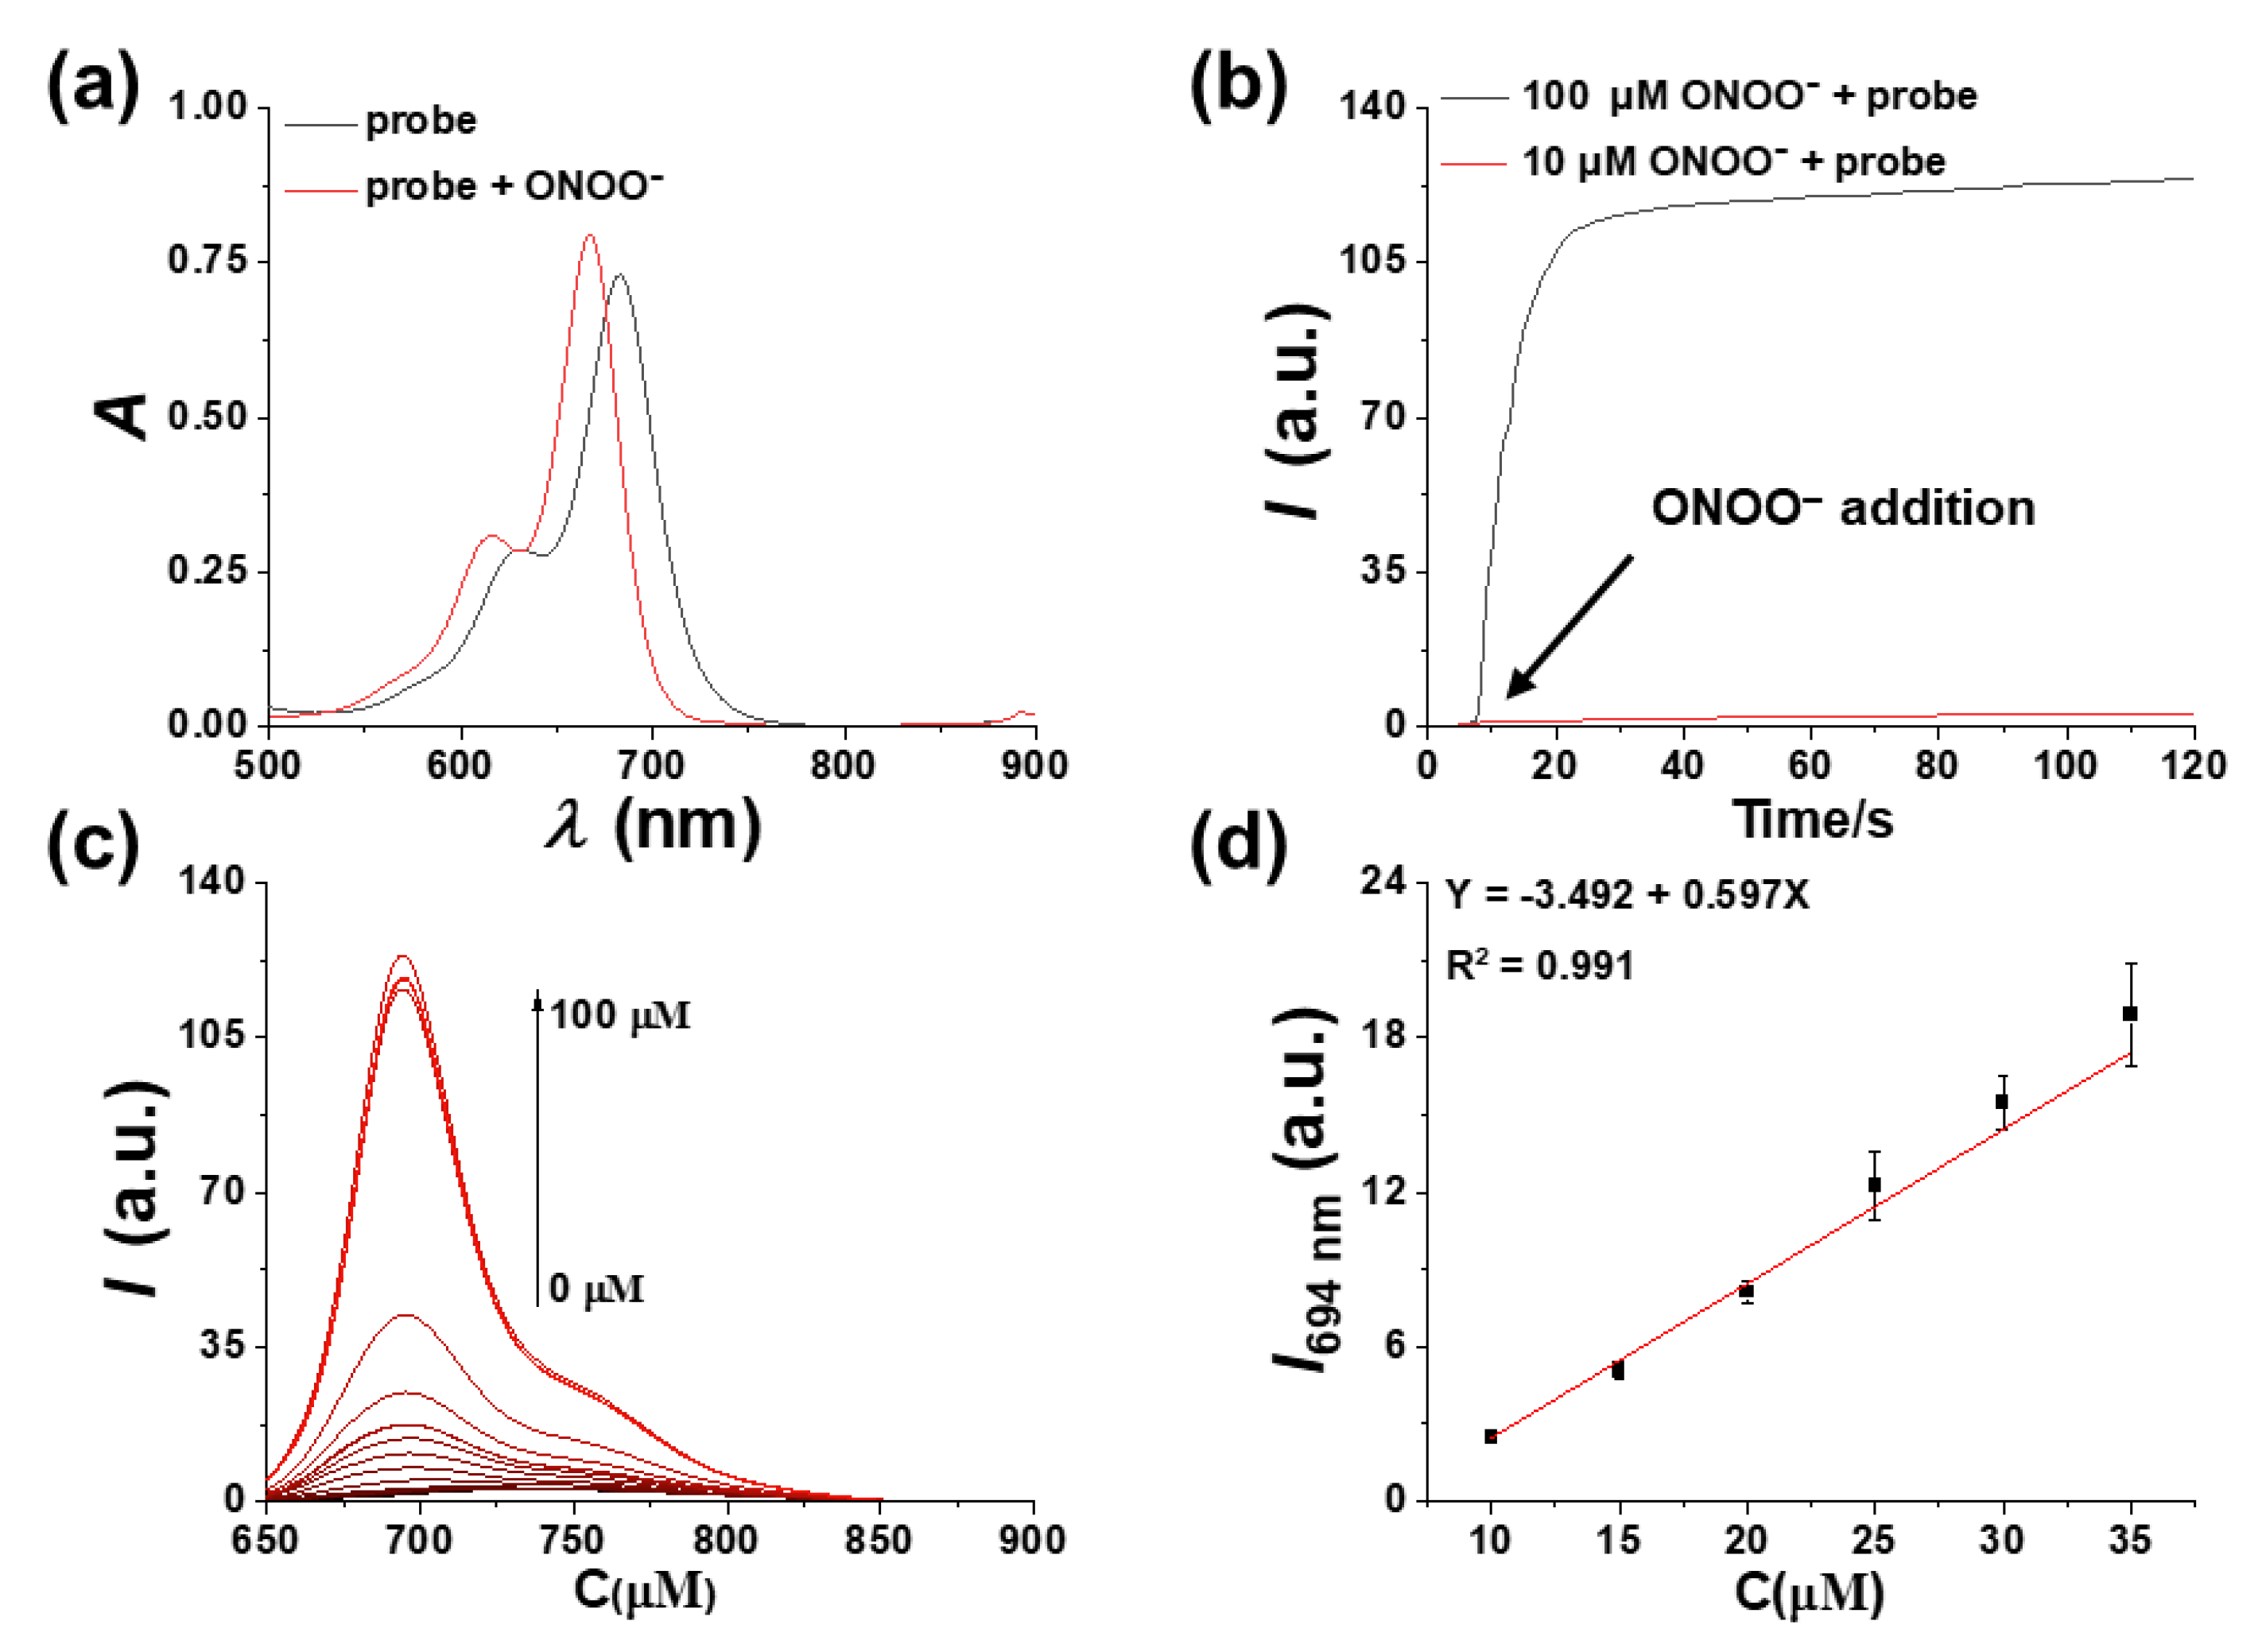
3.1. Spectral Properties of BDP-ENE-S-Py+ Responding to ONOO

Initially, we examined the response of the BDP-ENE-S-Py+ probe to ONOO at room temperature in a buffer system of PBS/acetonitrile (1:1, v/v, 10 mM, pH 7.4). It can be seen from the figure that the maximum absorption of the BDP-ENE-S-Py+ probe (Φ = 0.0138) occurred at 683 nm, and the maximum absorption peak shifted to 667 nm after reacting with ONOO (Figure 1a). However, before BDP-ENE-S-Py+ reacted with ONOO, no fluorescence emission was observed. After the probe reacted with ONOO, obvious fluorescence enhancement was observed at 694 nm, which increased by about 66 times (Figure S1). The high signal-to-noise ratio demonstrates BDP-ENE-S-Py+ could become an excellent tool for detecting ONOO. For the sake of studying the response speed of BDP-ENE-S-Py+ in the presence of ONOO, time-dependent spectral changes were measured. As shown in Figure 1b, when BDP-ENE-S-Py+ reacted with 100 µM ONOO, the fluorescence intensity increased rapidly at 694 nm, and the reaction was complete within two minutes. When the probe reacted with 10 µM ONOO, the fluorescence intensity slightly increased compared with the initial value and gradually stabilized.
Sensitivity is another important argument when estimating the feasibility of probe detection. Consequently, we investigated the response behavior of the probe at different concentrations of ONOO by fluorescence titration. As shown in Figure 1c, with augmented ONOO concentration (0–100 µM), the fluorescence strength at 694 nm gradually increased, showing a good linear relationship with 10–35 μM ONOO (Figure 1d); the detection limit was calculated to be 120 nM (LOD = 3σ/k). When the concentration of ONOO was small, it could not react quickly with the probe and the fluorescence intensity was low. Therefore, fluorescence intensity would be enhanced instantly when concentration increases from 50 µM to 60 µM. These results confirmed that the BDP-ENE-S-Py+ probe could respond to ONOO rapidly and sensitively, which is advantageous for the detection of ONOO in the biosystem.

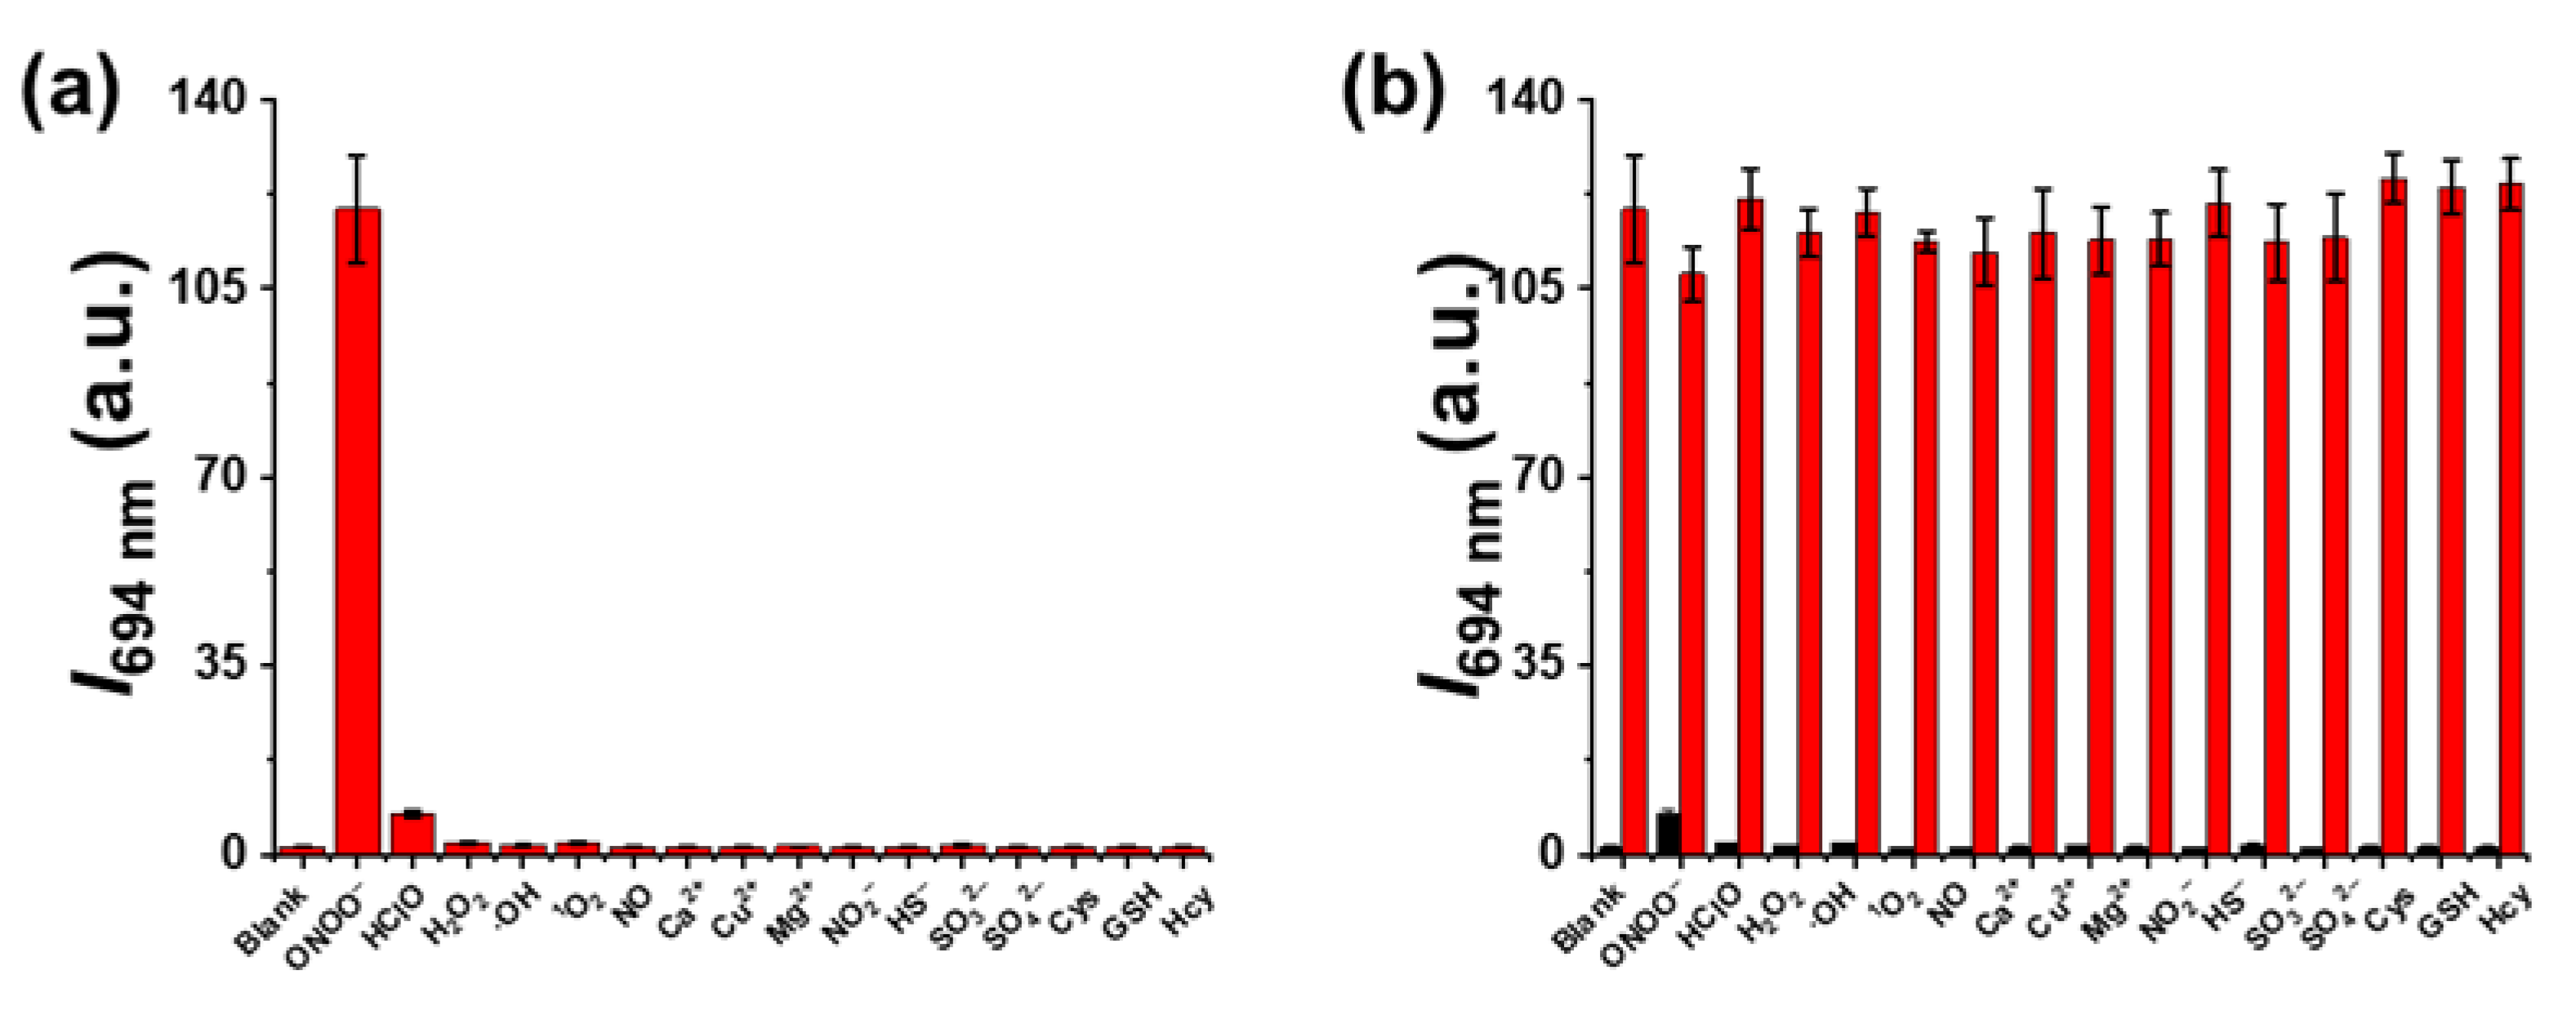
3.2. The Selective Response of BDP-ENE-S-Py+ to ONOO and the Effect of pH

On account of the complex environment of the biosystem, a probe with good capability needs to avert disturbance from other substances. To investigate this, we carried out a selectivity experiment with BDP-ENE-S-Py+. As shown in Figure 2a, various reactive nitrogen species (RNS), reactive sulfur species (RSS), reactive oxygen species (ROS), cations (Ca2+, Mg2+, Cu2+), biologically important amino acids (Cys, Hcy, GSH), and ONOO were added into the probe solution to observe changes in their fluorescence signals. The fluorescence intensity of BDP-ENE-S-Py+ solution only increased significantly when ONOO was added. In order to realize application in complex organisms, we further verified the anti-interference performance of the probe. Under the co-existence of various analytes, ONOO still caused a nearly 66-fold fluorescence enhancement (Figure 2b). The experimental results showed that BDP-ENE-S-Py+ had good selectivity for ONOO and could detect ONOO with high selectivity. In addition, we also studied the stability of BDP-ENE-S-Py+ in relation to pH. It can be seen from the figure that the fluorescence signal of the BDP-ENE-S-Py+ probe hardly changed when the pH value was 5–10 and gradually increased along with the increasing pH value when ONOO was added (Figure S2). We also measured the time stability of the probe within a 30 min time frame under the test system (Figure S3), and it can be seen from the experimental results that the probe was relatively stable under the system. The experimental results exhibited that BDP-ENE-S-Py+ had good pH stability and was appropriate for further application in the test of ONOO in complex physiological environments.

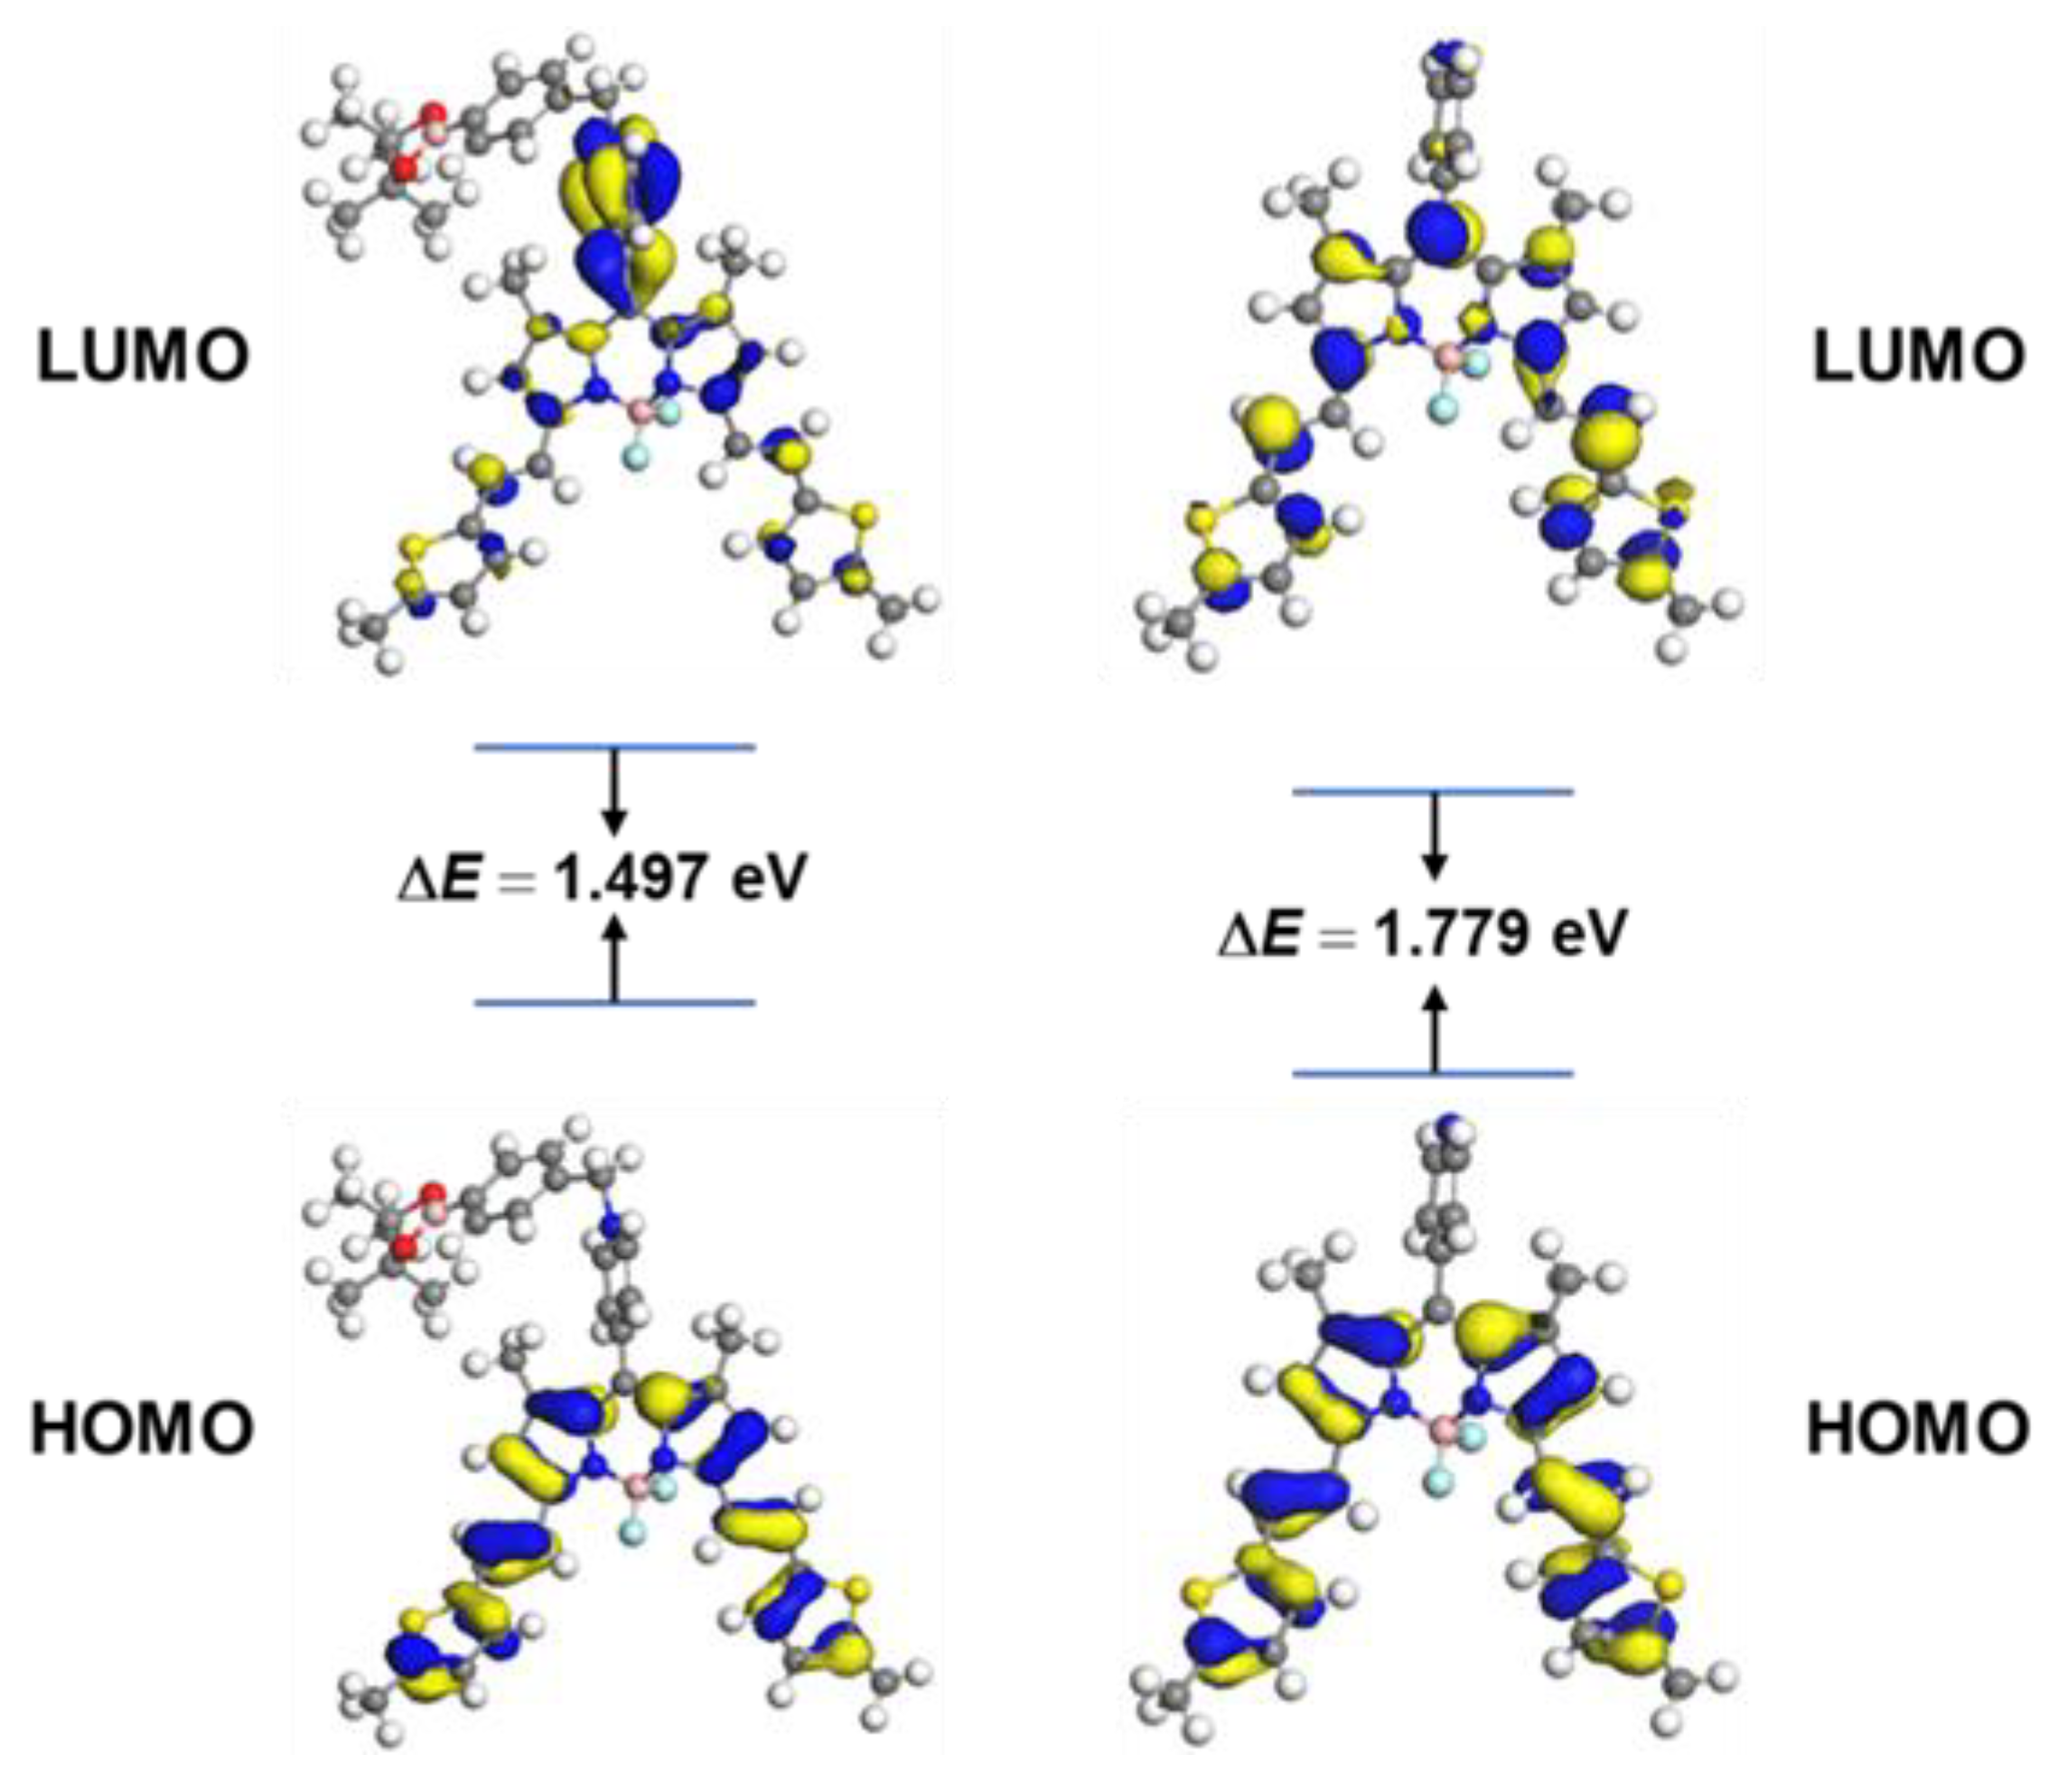
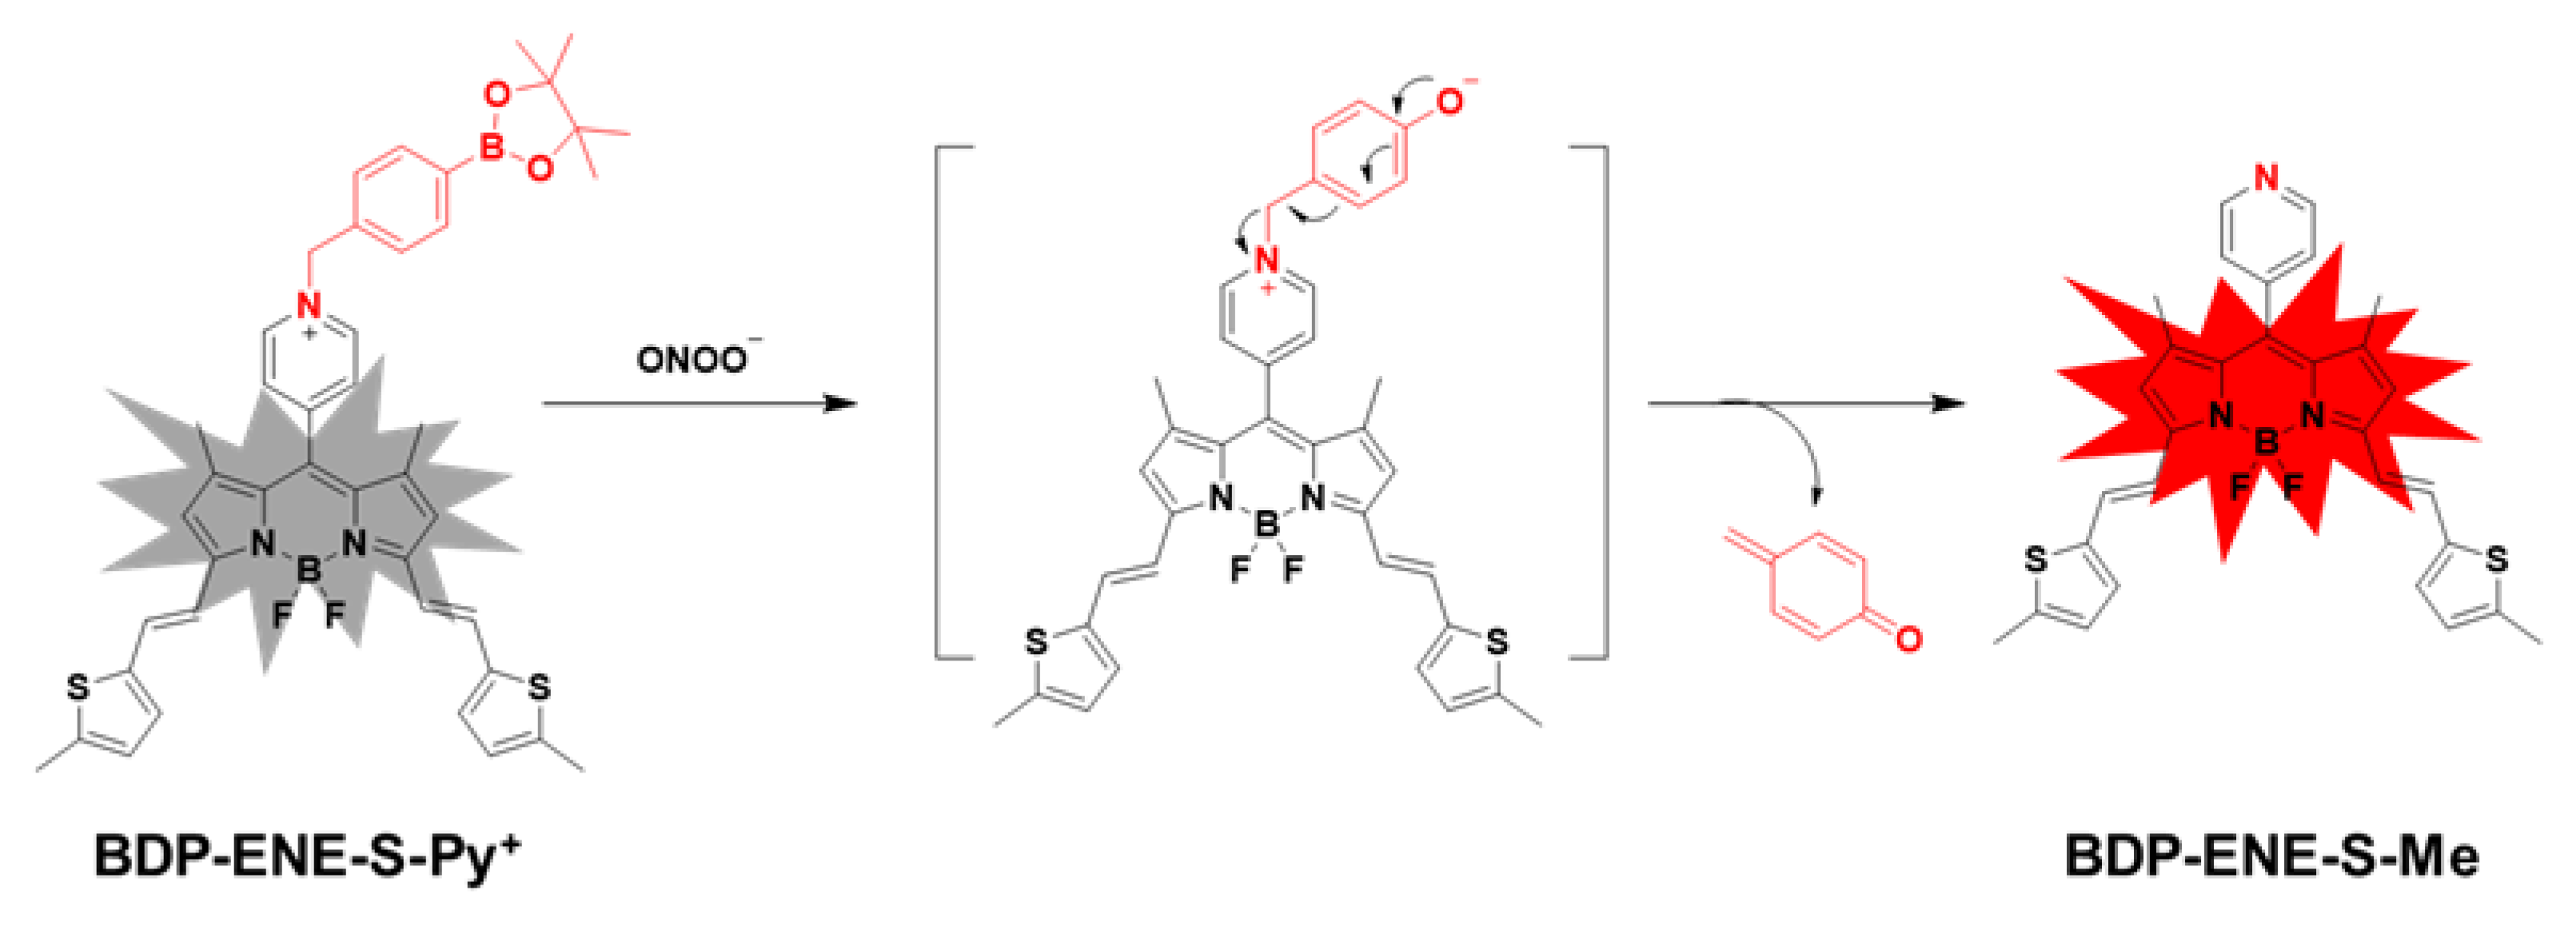
3.3. Sensing Mechanism of BDP-ENE-S-Py+

As displayed in Scheme 1, the detection mechanism of BDP-ENE-S-Py+ for ONOO is described as follows: the benzeneboronic acid pinacol ester is oxidized by ONOO to phenoxide, and then a self-elimination reaction occurs, resulting in obstruction of the PET process and the fluorescence of BDP-ENE-S-Me being released. The results are confirmed by ESI-MS analysis (Figures S4 and S5). For the sake of a better interpretation of the fluorescence response mechanism of BDP-ENE-S-Py+, we performed density functional theory (DFT) calculations for BDP-ENE-S-Py+ and BDP-ENE-S-Me. As shown in Figure 3, in the lowest molecular unoccupied orbital (LUMO), the π electron was predominantly found in the benzylpyridine group of the BDP-ENE-S-Py+ probe, while in the highest molecular occupied orbital (HOMO), the π electron was predominantly found in the parent nucleus of the BODIPY dye. The results show that the fluorescence quenching of BDP-ENE-S-Py+ was due to the PET process from the electron-rich BODIPY parent nucleus to the electron-deficient benzylpyridine group. In contrast, in the LUMO and HOMO orbitals of BDP-ENE-S-Me, π electrons were focused on the parent nucleus of BODIPY, and thus emitted bright fluorescence. The calculated HOMO–LUMO energy levels of the BDP-ENE-S-Py+ probe were −5.362 eV and −3.867 eV, respectively. After reaction of the BDP-ENE-S-Py+ probe with ONOO, the released BDP-ENE-S-Me dyes had energy levels of −4.074 eV and −5.853 eV, respectively. The energy gap between LUMO and HOMO increased from 1.479 eV to 1.779 eV, which was in accordance with the blue shift of the spectrum of absorption after BDP-ENE-S-Py+ reacted with ONOO. The results of theoretical arithmetic inosculated with the laboratory results, which testified to the reasonableness of DFT computation.

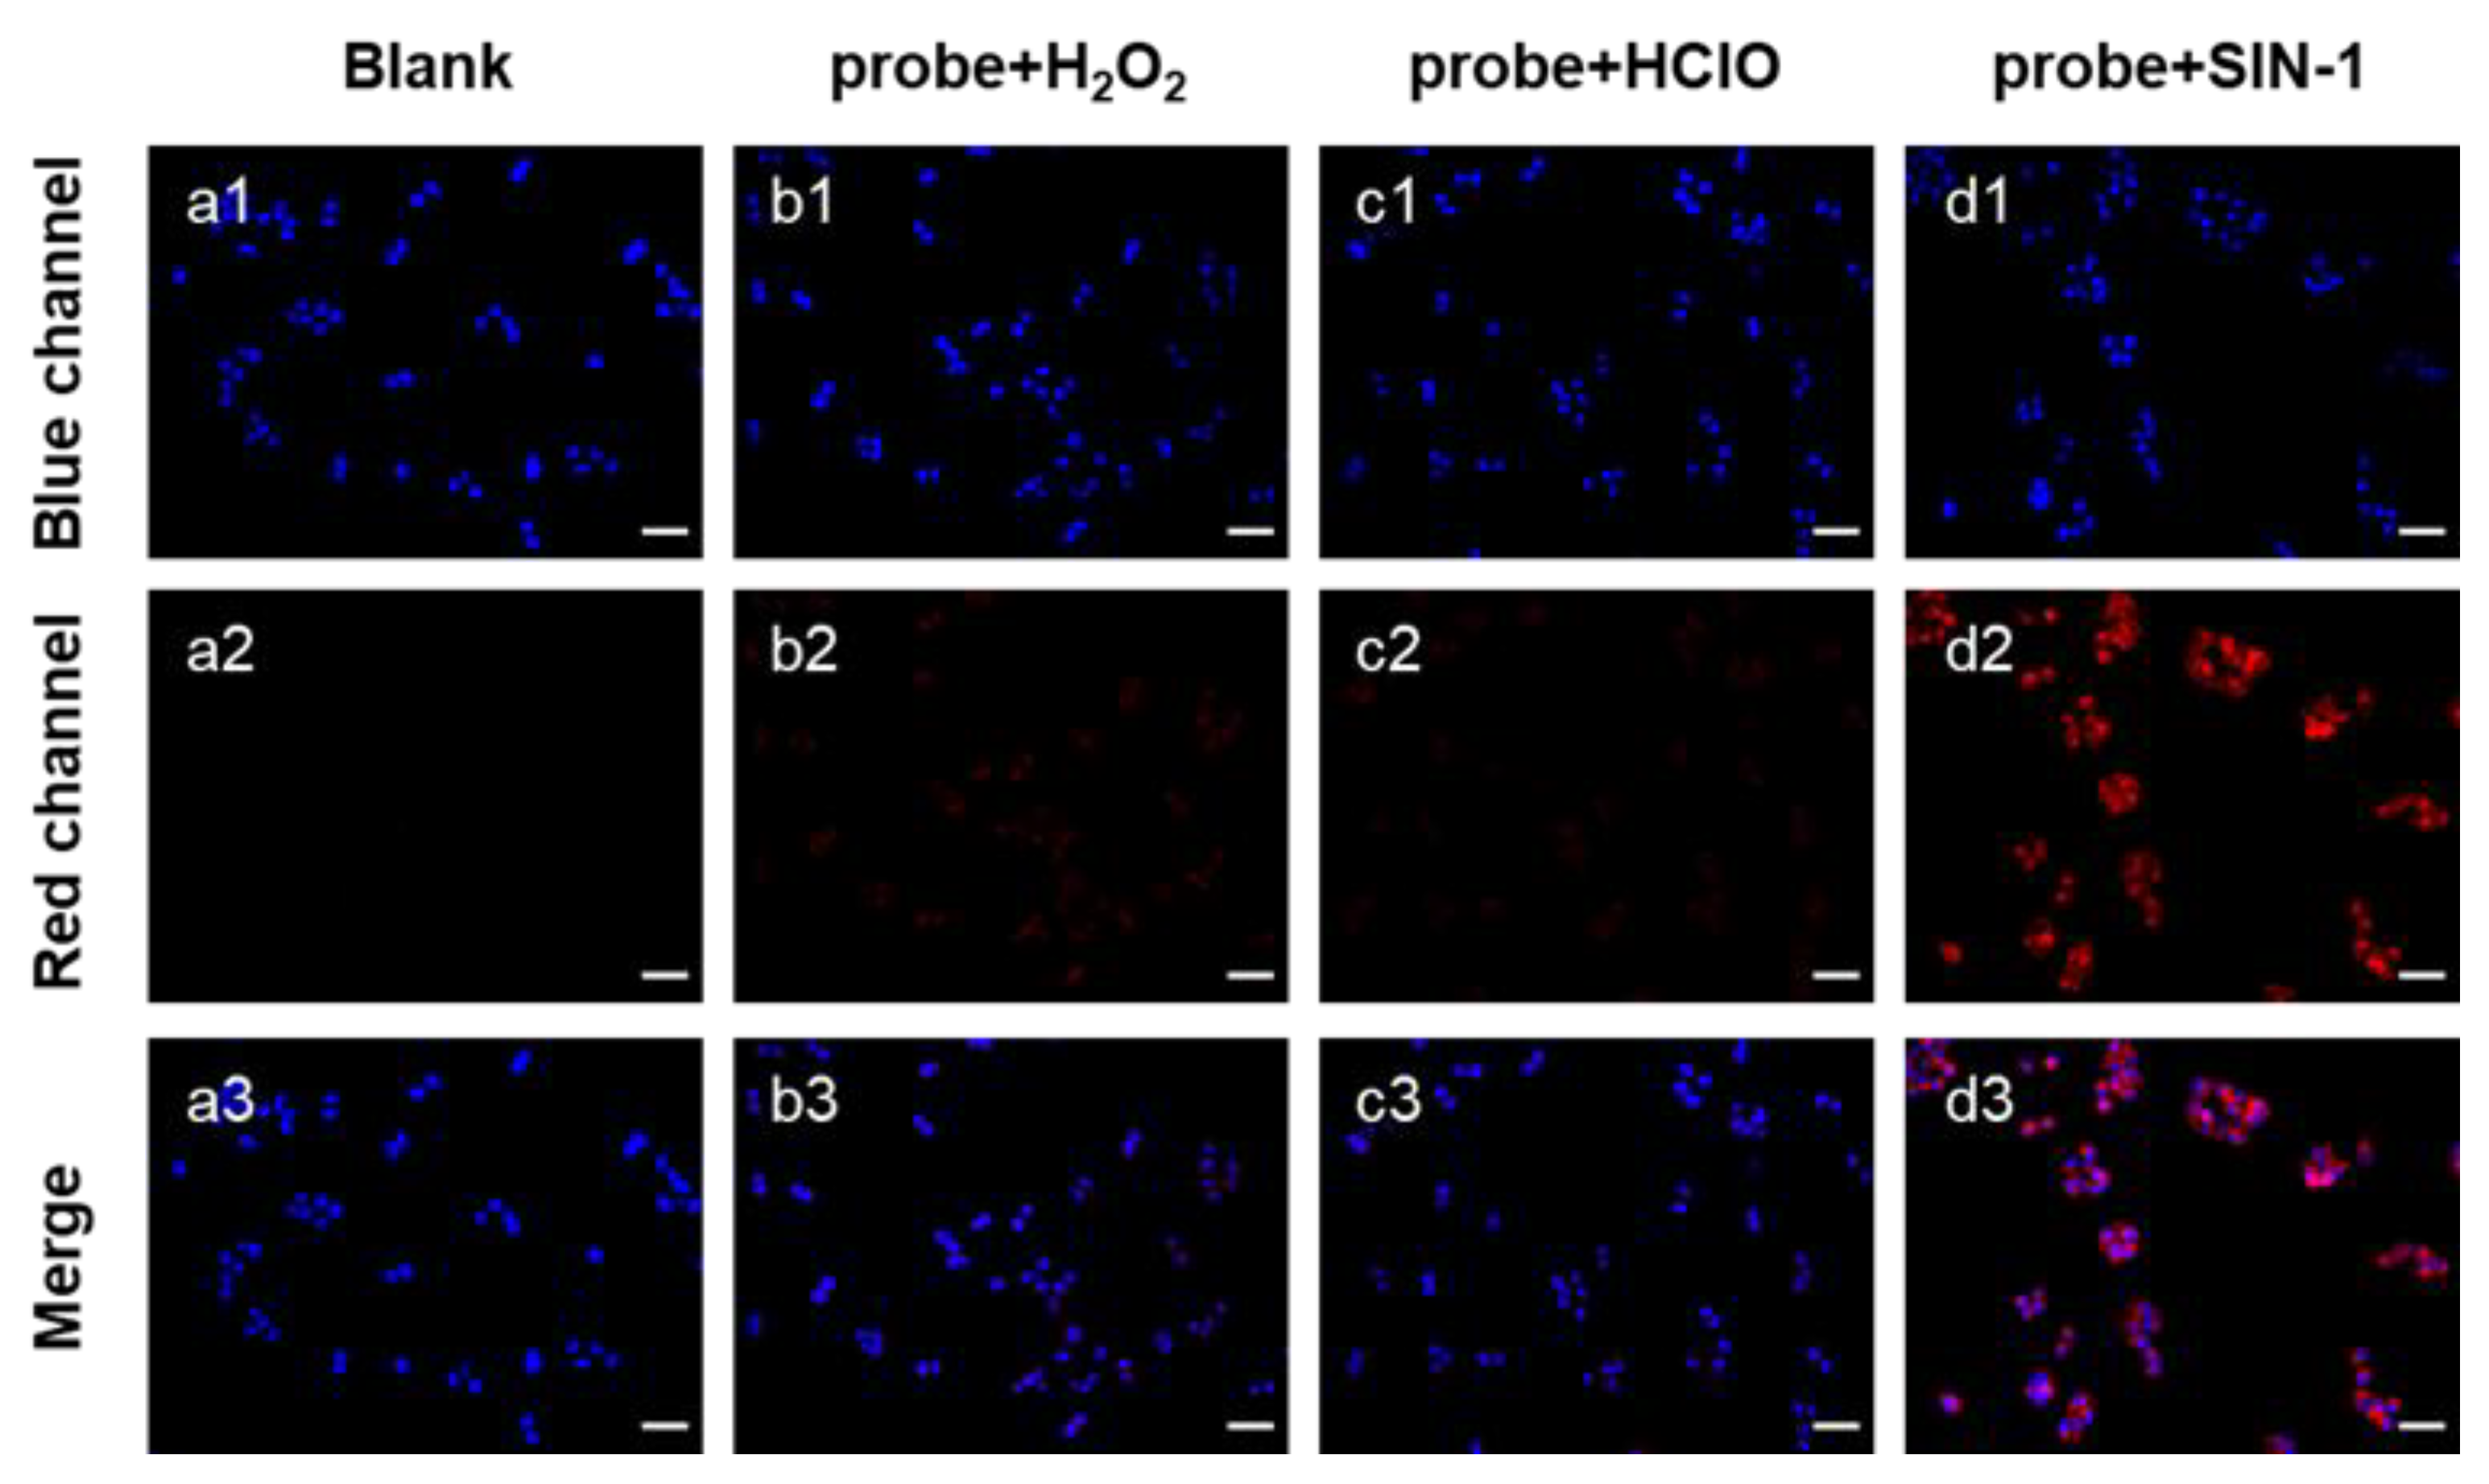
3.4. BDP-ENE-S-Py+ Intracellular Imaging
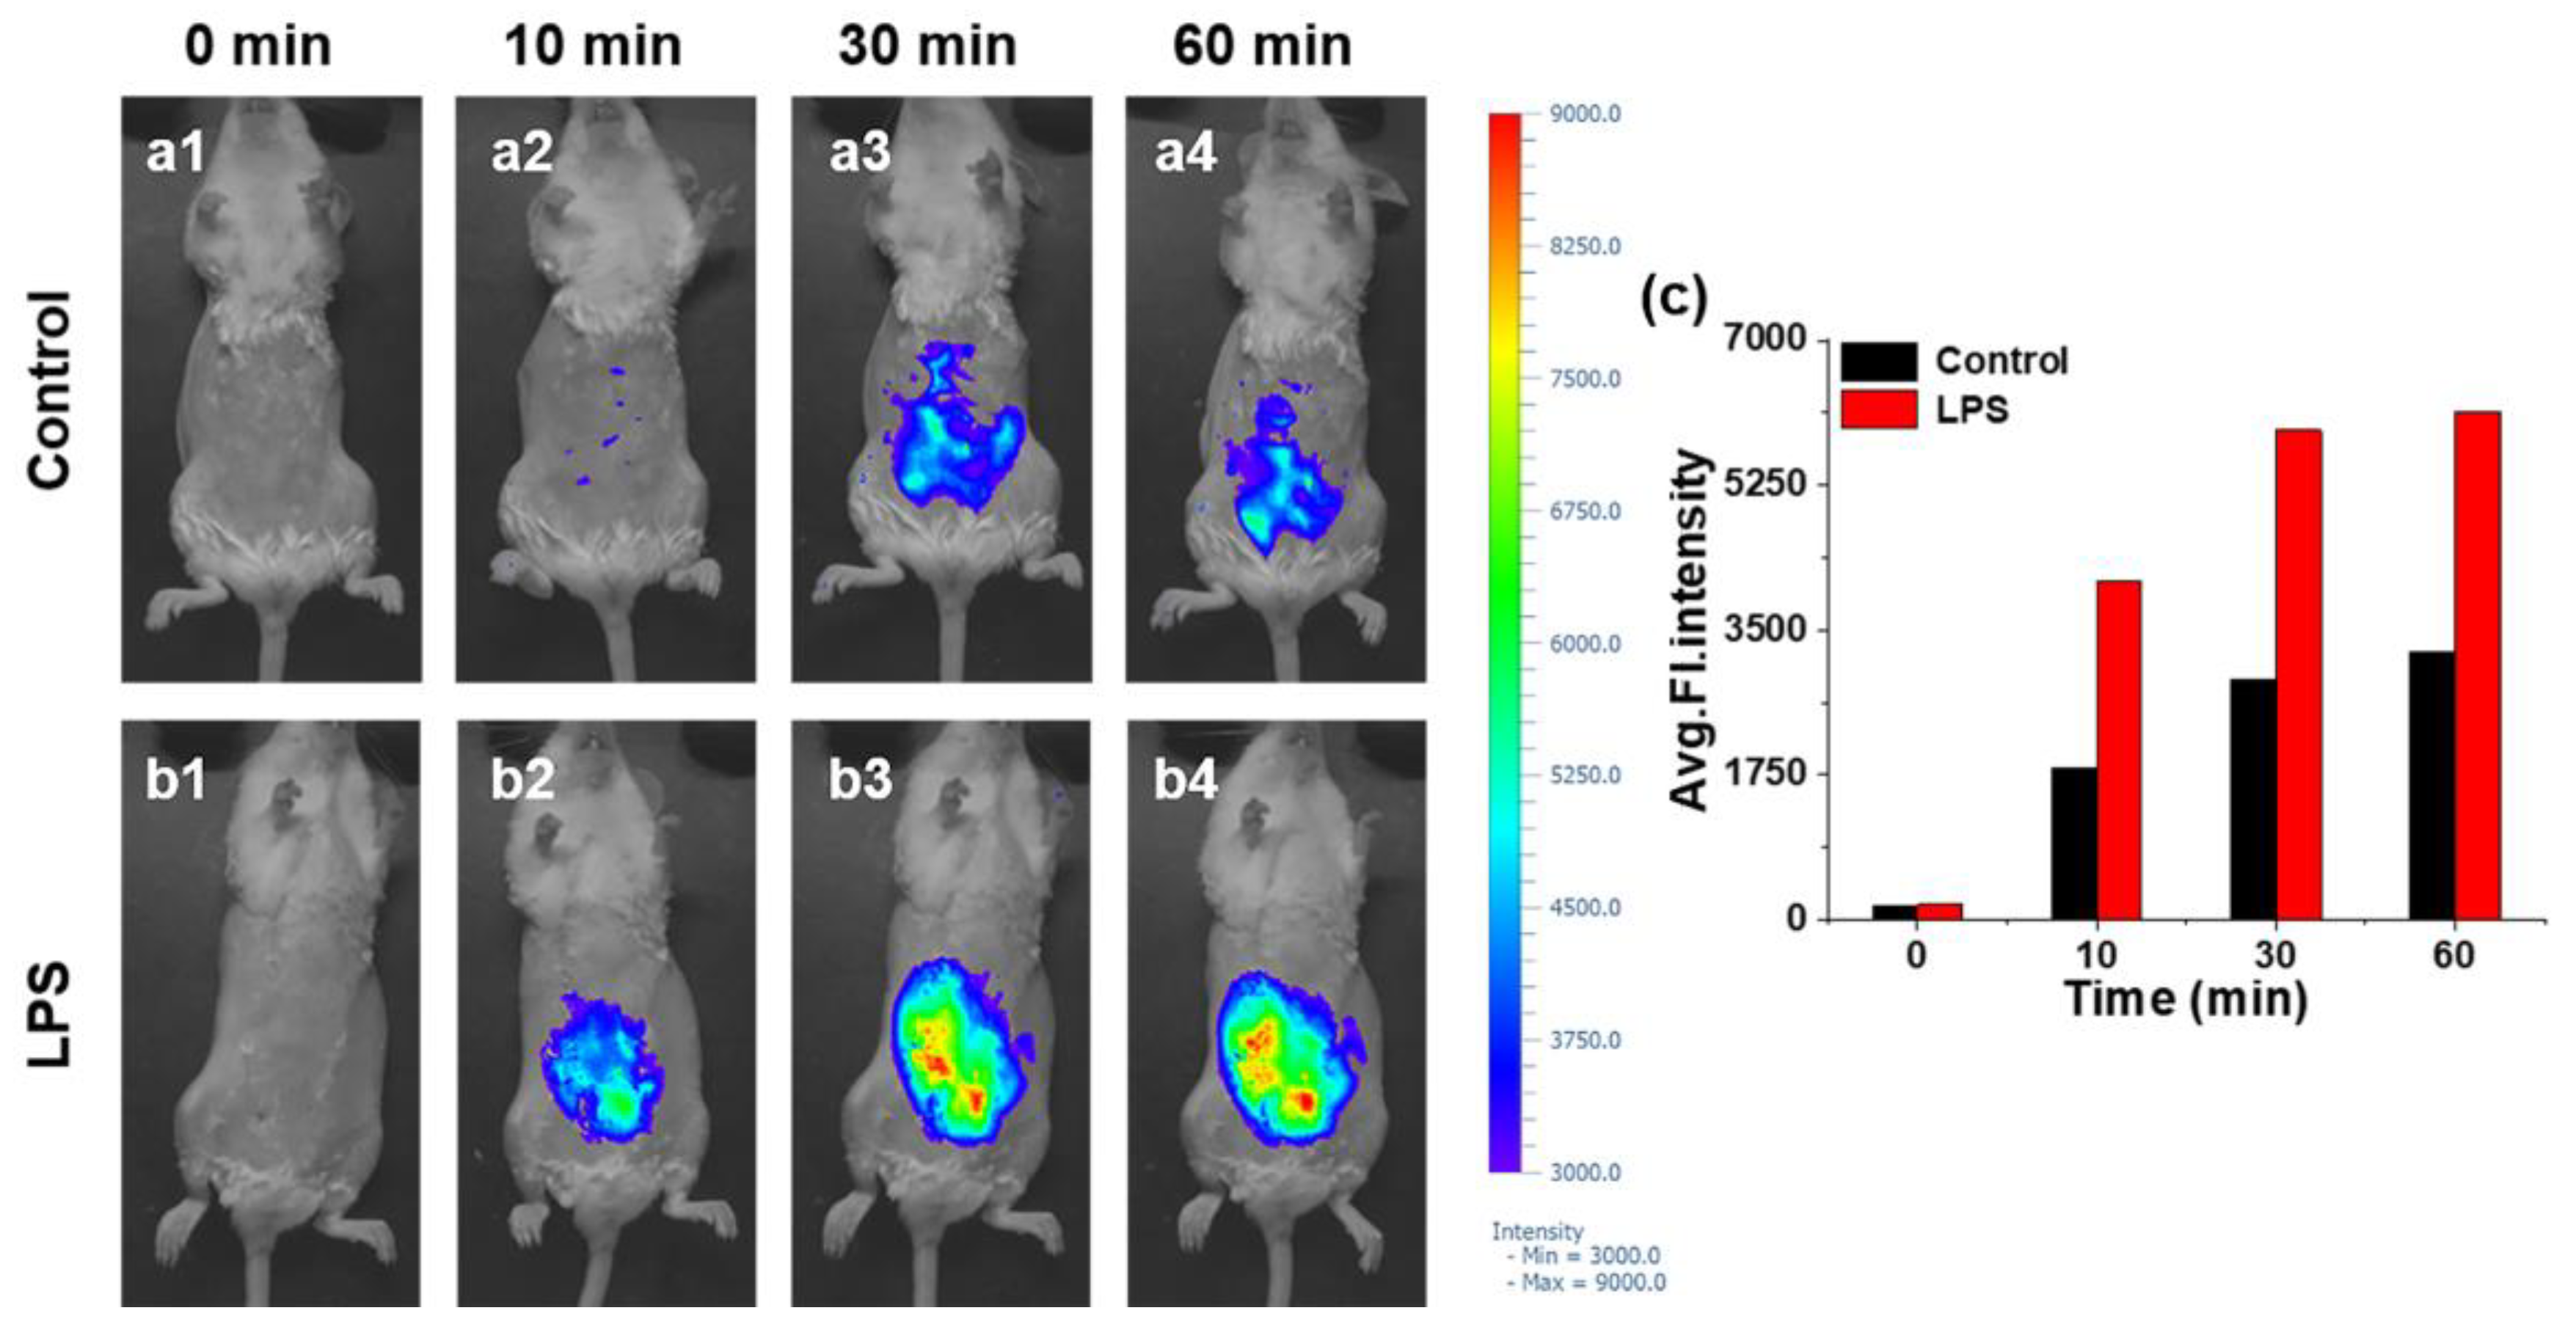
Based on the excellent in vitro testing performance of BDP-ENE-S-Py+, we extended testing to intracellular detection of ONOO, where we expected that BDP-ENE-S-Py+ could also show excellent detection performance for ONOO in cells. We selected hepatoma cells (HepG2 cells) for the intracellular ONOO selectivity experiment. Before cell imaging, the cytotoxicity of BDP-ENE-S-Py+ was verified by standard CCK-8 assays (Figure S6). After incubating the cells with different concentrations of BDP-ENE-S-Py+ for 24 h, cell livability still reached more than 90% when the probe concentration was 50 µM. The results showed that the probe had low cytotoxicity and good biocompatibility.
Subsequently, the intracellular selectivity of BDP-ENE-S-Py+ to ONOO was assessed in HepG2 cells. It can be seen from the figure that only faint red fluorescence was observed in the red channel of the blank control group (Figure 4). HClO and H2O2 were selected as the typical interference ROS in this study. The experimental results obtained in the two experimental groups were the same as those in the blank control group. There were weak fluorescence signals in the red channel. Only in the experimental group with ONOO-releasing agent 3-mollopyridinimine hydrochloride (SIN-1) was an obvious fluorescence signal observed in the red channel. The experimental results showed that the probe could achieve highly selective imaging of peroxynitrite in the complex cellular environment.
Since the BDP-ENE-S-Py+ probe could sensitively detect intracellular ONOO, we further investigated whether the probe could detect changes in the concentration level of ONOO in cells. We co-incubated the cells with different concentrations of SIN-1 (ONOO-releasing agent) and then treated them with the probe to observe the fluorescence changes. We selected two concentrations of SIN-1: 300 µM and 500 µM. It can be seen from the figure that along with the increased SIN-1 concentration, the fluorescence released after incubation with the probe became stronger (Figure 5). In conclusion, the BDP-ENE-S-Py+ probe could detect changes in the ONOO content of cells.

3.5. BDP-ENE-S-Py+ Imaging of ONOO in Inflammatory Mice

Encouraged by these results, we expected that the BDP-ENE-S-Py+ probe would detect ONOO in mice to achieve real-time imaging of inflammation induced by lipopolysaccharide (LPS). To verify this probe’s application in inflammation diagnosis, we established a mouse inflammatory model using LPS to induce upregulation of ONOO content in mice. Mice were intraperitoneally injected with LPS (100 µg/kg) and incubated for 24 h. After injecting the BDP-ENE-S-Py+ probe into the belly of mice in the blank controller and inflammatory groups, fluorescence imaging was performed at different times (Figure 6). At 10 min, the obvious fluorescence signal of the treatment group injected with LPS was observed, and fluorescence intensity enhanced gradually along with increased time. Although the fluorescence intensity of the blank control group was also enhanced, it was significantly smaller than that of the treatment group. The results show that the BDP-ENE-S-Py+ probe could detect and image ONOO in peritonitis mice, which would be helpful for the early diagnosis of inflammation.

4. Conclusions

In summary, we reasonably constructed the new near-infrared fluorescence probe BDP-ENE-S-Py+ by introducing thiophene methyl at positions 3 and 5 of the BODIPY dye to expand its conjugated structure. The probe has the advantage of a rapid, sensitive, and specific response to ONOO with a high signal-to-noise ratio. In addition, the probe was successfully applied to detect exogenous ONOO in hepatocellular carcinoma cells without disturbance from other ROS and was capable of visualizing the changes in ONOO content in cells. More importantly, BDP-ENE-S-Py+ was able to detect upregulation of ONOO in a mouse model of peritonitis induced by LPS. These results demonstrate that the BDP-ENE-S-Py+ probe has broad applicability and could be utilized as a powerful tool for the diagnosis of inflammation by detecting ONOO fluctuations.

Supplementary Materials

The following supporting information can be downloaded at: https://www.mdpi.com/article/10.3390/chemosensors11060316/s1, Scheme S1: The synthesis routine of BDP-ENE-S-Py+; Figure S1: The fluorescence emission spectra of the BDP-ENE-S-Py+ probe (10 µM) before and after reaction with ONOO (100 µM); Figure S2: Fluorescence intensity spectra of the BDP-ENE-S-Py+ probe (10 µM) after reaction with ONOO (100 µM) at different pH values; Figure S3: Probe time stability test; Figure S4: The ESI-MS of BDP-ENE-S-Py+; Figure S5: The ESI-MS of BDP-ENE-S-Py+ upon addition of ONOO; Figure S6: Cytotoxicity assays of BDP-ENE-S-Py+ in living HepG2 cells; Figure S7: 1H NMR of BDP-ENE-S-Me; Figure S8: 13C NMR of BDP-ENE-S-Me; Figure S9: 1H NMR of BDP-ENE-S-Py+; Figure S10: 13C NMR of BDP-ENE-S-Py+.

Author Contributions

Conceptualization, J.Z.; methodology, J.Z.; software, J.W. and S.Q.; validation, S.Q. and Y.R.; formal analysis, S.Q., Y.H. and X.L.; investigation, S.Q., Y.R., Y.H. and X.L.; resources, W.Z. and J.Z.; data curation, X.L. and S.Q.; writing—original draft preparation, S.Q. and Y.R.; writing—review and editing, J.W. and J.Z.; visualization, S.Q. and Y.R.; supervision, J.Z.; project administration, J.Z.; funding acquisition, J.W. and J.Z. All authors have read and agreed to the published version of the manuscript.

Funding

This research was financially supported by the National Natural Science Foundation of China (No. 82030107, No. 21702046), the Key Scientific and Technological Project of Henan Province (No. 212102311064, No. 222102310692), and the Key Scientific Research Project of Colleges and Universities in Henan Province (No. 22A150005).

Institutional Review Board Statement

The animal study protocol was approved by the Institutional Review Board of the Animal Experiment Ethics Committee of Henan University (protocol code HUSOM2022-140 and date of approval 6 March 2022) for studies involving animals.

Informed Consent Statement

Not applicable.

Data Availability Statement

Data will be shared upon reasonable request.

Acknowledgments

The authors thank Changwei Gong, School of Materials Science and Technology, Taiyuan University of Science and Technology, for his helpful discussions regarding density functional theory calculations.

Conflicts of Interest

The authors declare no conflict of interest.

References

  1. Wang, Z.; Wang, W.; Wang, P.; Song, X.; Mao, Z.; Liu, Z. Highly sensitive near-infrared imaging of peroxynitrite fluxes in inflammation progress. Anal. Chem. 2021, 93, 3035–3041. [Google Scholar] [CrossRef] [PubMed]
  2. She, Z.; Chen, J.; Sun, L.; Zeng, F.; Wu, S. An NO-responsive probe for detecting acute inflammation using NIR-II fluorescence/optoacoustic imaging. Chem. Commun. 2022, 58, 13123–13126. [Google Scholar] [CrossRef] [PubMed]
  3. Furman, D.; Campisi, J.; Verdin, E.; Carrera-Bastos, P.; Targ, S.; Franceschi, C.; Ferrucci, L.; Gilroy, D.W.; Fasano, A.; Miller, G.W.; et al. Chronic inflammation in the etiology of disease across the life span. Nat. Med. 2019, 25, 1822–1832. [Google Scholar] [CrossRef]
  4. Crusz, S.M.; Balkwill, F.R. Inflammation and cancer: Advances and new agents. Nat. Rev. Clin. Oncol. 2015, 12, 584–596. [Google Scholar] [CrossRef] [PubMed]
  5. Fullerton, J.N.; Gilroy, D.W. Resolution of inflammation: A new therapeutic frontier. Nat. Rev. Drug Discov. 2016, 15, 551–567. [Google Scholar] [CrossRef]
  6. Zarrin, A.A.; Bao, K.; Lupardus, P.; Vucic, D. Kinase inhibition in autoimmunity and inflammation. Nat. Rev. Drug Discov. 2021, 20, 39–63. [Google Scholar] [CrossRef]
  7. Li, W.; Li, R.; Chen, R.; Ai, S.; Zhu, H.; Huang, L.; Lin, W. Activatable fluorescent-photoacoustic integrated probes with deep tissue penetration for pathological diagnosis and therapeutic evaluation of acute inflammation in mice. Anal. Chem. 2022, 94, 7996–8004. [Google Scholar] [CrossRef]
  8. Tay, M.Z.; Poh, C.M.; Renia, L.; MacAry, P.A.; Ng, L.F.P. The trinity of COVID-19: Immunity, inflammation and intervention. Nat. Rev. Immunol. 2020, 20, 363–374. [Google Scholar] [CrossRef]
  9. Anderton, H.; Wicks, I.P.; Silke, J. Cell death in chronic inflammation: Breaking the cycle to treat rheumatic disease. Nat. Rev. Rheumatol. 2020, 16, 496–513. [Google Scholar] [CrossRef]
  10. Wu, D.; Ryu, J.-C.; Chung, Y.W.; Lee, D.; Ryu, J.-H.; Yoon, J.-H.; Yoon, J. A far-red-emitting fluorescence probe for sensitive and selective detection of peroxynitrite in live cells and tissues. Anal. Chem. 2017, 89, 10924–10931. [Google Scholar] [CrossRef]
  11. Blough, N.V.; Zafiriou, O.C. Reaction of superoxide with nitric oxide to form peroxonitrite in alkaline aqueous solution. Inorg. Chem. 1985, 24, 3502–3504. [Google Scholar] [CrossRef]
  12. Zhu, M.; Zhou, H.; Ji, D.; Li, G.; Wang, F.; Song, D.; Deng, B.; Li, C.; Qiao, R. A near-infrared fluorescence probe for ultrafast and selective detection of peroxynitrite with large Stokes shift in inflamed mouse models. Dye. Pigment. 2019, 168, 77–83. [Google Scholar] [CrossRef]
  13. Sonawane, P.M.; Yudhistira, T.; Halle, M.B.; Roychaudhury, A.; Kim, Y.; Surwase, S.S.; Bhosale, V.K.; Kim, J.; Park, H.-S.; Kim, Y.-c.; et al. A water-soluble boronate masked benzoindocyanin fluorescent probe for the detection of endogenous mitochondrial peroxynitrite in live cells and zebrafish as inflammation models. Dye. Pigment. 2021, 191, 109371. [Google Scholar] [CrossRef]
  14. Shu, W.; Wu, Y.; Duan, Q.; Zang, S.; Su, S.; Jing, J.; Zhang, X. A highly selective fluorescent probe for monitoring exogenous and endogenous ONOO fluctuations in HeLa cells. Dye. Pigment. 2020, 175, 108069. [Google Scholar] [CrossRef]
  15. Shu, W.; Wu, Y.; Shen, T.; Cui, J.; Kang, H.; Jing, J.; Zhang, X. A mitochondria-targeted far red fluorescent probe for ratiometric imaging of endogenous peroxynitrite. Dye. Pigment. 2019, 170, 107609. [Google Scholar] [CrossRef]
  16. Wood, Z.A.; Schroder, E.; Harris, J.R.; Poole, L.B. Structure, mechanism and regulation of peroxiredoxins. Trends Biochem. Sci. 2003, 28, 32–40. [Google Scholar] [CrossRef] [PubMed]
  17. Koppenol, W.H.; Moreno, J.J.; Pryor, W.A.; Ischiropoulos, H.; Beckman, J.S. Peroxynitrite, a cloaked oxidant formed by nitric oxide and superoxide. Chem. Res. Toxicol. 1992, 5, 834–842. [Google Scholar] [CrossRef]
  18. Lu, X.; Su, H.; Zhang, J.; Wang, N.; Wang, H.; Liu, J.; Zhao, W. Resorufin-based fluorescent probe with elevated water solubility for visualizing fluctuant peroxynitrite in progression of inflammation. Spectrochim. Acta A 2022, 267, 120620. [Google Scholar] [CrossRef]
  19. Chen, X.; Tian, X.; Shin, I.; Yoon, J. Fluorescent and luminescent probes for detection of reactive oxygen and nitrogen species. Chem. Soc. Rev. 2011, 40, 4783–4804. [Google Scholar] [CrossRef]
  20. Wu, D.; Chen, L.; Xu, Q.; Chen, X.; Yoon, J. Design principles, sensing mechanisms, and applications of highly specific fluorescent probes for HOCl/OCl. Acc. Chem. Res. 2019, 52, 2158–2168. [Google Scholar] [CrossRef]
  21. Paloczi, J.; Varga, Z.V.; Hasko, G.; Pacher, P. Neuroprotection in oxidative stress-related neurodegenerative diseases: Role of endocannabinoid system modulation. Antioxid. Redox Sign. 2018, 29, 75–108. [Google Scholar] [CrossRef] [PubMed]
  22. Yu, J.; Shu, W.; Kang, H.; Han, R.; Zhang, X.; Zhang, R.; Jing, J.; Zhang, X. An ESIPT-based fluorescent probe with large Stokes shift for peroxynitrite detection in HeLa cells and zebrafish. Dye. Pigment. 2022, 204, 110334. [Google Scholar] [CrossRef]
  23. Chan, J.; Dodani, S.C.; Chang, C.J. Reaction-based small-molecule fluorescent probes for chemoselective bioimaging. Nat. Chem. 2012, 4, 973–984. [Google Scholar] [CrossRef] [PubMed]
  24. Wang, N.; Wang, H.; Zhang, J.; Ji, X.; Su, H.; Liu, J.; Wang, J.; Zhao, W. Endogenous peroxynitrite activated fluorescent probe for revealing anti-tuberculosis drug induced hepatotoxicity. Chin. Chem. Lett. 2022, 33, 1584–1588. [Google Scholar] [CrossRef]
  25. Wang, N.; Wang, H.; Zhang, J.; Ji, X.; Su, H.; Liu, J.; Wang, J.; Zhao, W. Diketopyrrolopyrrole-based sensor for over-expressed peroxynitrite in drug-induced hepatotoxicity via ratiometric fluorescence imaging. Sensor. Actuat. B-Chem. 2022, 352, 130992. [Google Scholar] [CrossRef]
  26. Ji, X.; Wang, N.; Zhang, J.; Xu, S.; Si, Y.; Zhao, W. Meso-pyridinium substituted BODIPY dyes as mitochondria-targeted probes for the detection of cysteine in living cells and In Vivo. Dye. Pigment. 2021, 187, 109089. [Google Scholar] [CrossRef]
  27. Zhang, J.; Wang, N.; Ji, X.; Tao, Y.; Wang, J.; Zhao, W. BODIPY-based fluorescent probes for biothiols. Chem. Eur. J. 2020, 26, 4172–4192. [Google Scholar] [CrossRef]
  28. Yang, X.; Lu, X.; Wang, J.; Zhang, Z.; Du, X.; Zhang, J.; Wang, J. Near-infrared fluorescent probe with a large stokes shift for detection of hydrogen sulfide in food spoilage, living cells, and zebrafish. J. Agric. Food Chem. 2022, 70, 3047–3055. [Google Scholar] [CrossRef]
  29. Qin, S.; Lu, H.; Zhang, J.; Ji, X.; Wang, N.; Liu, J.; Zhao, W.; Wang, J. An activatable reporter for fluorescence imaging drug-induced liver injury in diverse cell lines and In Vivo. Dye. Pigment. 2022, 203, 110345. [Google Scholar] [CrossRef]
  30. Fan, G.; Wang, N.; Zhang, J.; Ji, X.; Qin, S.; Tao, Y.; Zhao, W. BODIPY-based near-infrared fluorescent probe for diagnosis drug-induced liver injury via imaging of HClO in cells and In Vivo. Dye. Pigment. 2022, 199, 110073. [Google Scholar] [CrossRef]
  31. Lu, X.; Wang, N.; Tao, Y.; Wang, J.; Ji, X.; Liu, J.; Zhao, W.; Zhang, J. Optimizing phenyl selenide-based BODIPYs as fluorescent probes for diagnosing cancer and drug-induced liver injury via cysteine. Chem. Commun. 2022, 58, 12576–12579. [Google Scholar] [CrossRef] [PubMed]
  32. Wu, D.; Sedgwick, A.C.; Gunnlaugsson, T.; Akkaya, E.U.; Yoon, J.; James, T.D. Fluorescent chemosensors: The past, present and future. Chem. Soc. Rev. 2017, 46, 7105–7123. [Google Scholar] [CrossRef] [PubMed]
  33. Liu, Y.; Li, X.; Shi, W.; Ma, H. New cell-membrane-anchored near-infrared fluorescent probes for viscosity monitoring. Chem. Commun. 2022, 58, 12815–12818. [Google Scholar] [CrossRef]
  34. He, Z.; Ishizuka, T.; Hishikawa, Y.; Xu, Y. Click chemistry for fluorescence imaging via combination of a BODIPY-based ‘turn-on’ probe and a norbornene glucosamine. Chem. Commun. 2022, 58, 12479–12482. [Google Scholar] [CrossRef]
  35. Zhang, Y.; Chen, X.; Yuan, Q.; Bian, Y.; Li, M.; Wang, Y.; Gao, X.; Su, D. Enzyme-activated near-infrared fluorogenic probe with high-efficiency intrahepatic targeting ability for visualization of drug-induced liver injury. Chem. Sci. 2021, 12, 14855–14862. [Google Scholar] [CrossRef]
  36. Chen, X.; Niu, W.; Yuan, Q.; Zhang, Y.; Gao, X.; Su, D. Mapping the endogenous Zn2+ in situ during zebrafish embryogenesis by a fluorogenic sensor. Sensor. Actuat. B-Chem. 2023, 376, 132937. [Google Scholar] [CrossRef]
  37. Li, M.; Han, H.; Song, S.; Shuang, S.; Dong, C. AIE-based fluorescent boronate probe and its application in peroxynitrite imaging. Spectrochim. Acta A 2021, 261, 120044. [Google Scholar] [CrossRef]
  38. Wu, L.; Tian, X.; Lee, D.J.; Yoon, J.; Lim, C.S.; Kim, H.M.; James, T.D. Two-photon ESIPT-based fluorescent probe using 4-hydroxyisoindoline-1,3-dione for the detection of peroxynitrite. Chem. Commun. 2021, 57, 11084–11087. [Google Scholar] [CrossRef] [PubMed]
  39. Kang, H.; Shu, W.; Yu, J.; Gao, M.; Han, R.; Jing, J.; Zhang, R.; Zhang, X. A near-infrared fluorescent probe for ratiometric imaging peroxynitrite in Parkinson’s disease model. Sensor. Actuat. B-Chem. 2022, 359, 131393. [Google Scholar] [CrossRef]
  40. Zhang, K.; Wang, Z.; Hu, X.; Meng, J.; Bao, W.; Wang, X.; Ding, W.; Tian, Z. A long-wavelength turn-on fluorescent probe for intracellular nanomolar level peroxynitrite sensing with second-level response. Talanta 2020, 219, 121354. [Google Scholar] [CrossRef]
  41. Xiong, J.; Wang, W.; Wang, C.; Zhong, C.; Ruan, R.; Mao, Z.; Liu, Z. Visualizing peroxynitrite in microvessels of the brain with stroke using an engineered highly specific fluorescent probe. ACS Sensor. 2020, 5, 3237–3245. [Google Scholar] [CrossRef]
  42. Wang, W.; Xiong, J.; Song, X.; Wang, Z.; Zhang, F.; Mao, Z. Activatable two-photon near-infrared fluorescent probe tailored toward peroxynitrite In Vivo imaging in tumors. Anal. Chem. 2020, 92, 13305–13312. [Google Scholar] [CrossRef] [PubMed]
  43. Luo, X.; Cheng, Z.; Wang, R.; Yu, F. Indication of dynamic peroxynitrite fluctuations in the rat epilepsy model with a near-infrared two-photon fluorescent probe. Anal. Chem. 2021, 93, 2490–2499. [Google Scholar] [CrossRef]
  44. Jiang, G.; Li, C.; Lai, Q.; Liu, X.; Chen, Q.; Zhang, P.; Wang, J.; Tang, B.Z. An easily available ratiometric AIE probe for peroxynitrite In Vitro and In Vivo imaging. Sensor. Actuat. B-Chem. 2021, 329, 129223. [Google Scholar] [CrossRef]
  45. Gu, B.; Liu, M.; Dai, C.; Zhou, Z.; Tang, D.; Tang, S.; Shen, Y.; Li, H. Rational construction of a novel ratiometric far-red fluorescent probe with excellent water solubility for sensing mitochondrial peroxynitrite. Sensor. Actuat. B-Chem. 2021, 344, 130246. [Google Scholar] [CrossRef]
  46. Chen, S.; Vurusaner, B.; Pena, S.; Thu, C.T.; Mahal, L.K.; Fisher, E.A.; Canary, J.W. Two-photon, ratiometric, quantitative fluorescent probe reveals fluctuation of peroxynitrite regulated by arginase 1. Anal. Chem. 2021, 93, 10090–10098. [Google Scholar] [CrossRef]
  47. Feng, S.; Liu, D.; Feng, G. A dual-channel probe with green and near-infrared fluorescence changes for In Vitro and In Vivo detection of peroxynitrite. Anal. Chim. Acta. 2019, 1054, 137–144. [Google Scholar] [CrossRef] [PubMed]
  48. Sun, S.-G.; Ding, H.; Yuan, G.; Zhou, L. An efficient TP-FRET-based lysosome-targetable fluorescent probe for imaging peroxynitrite with two well-resolved emission channels in living cells, tissues and zebrafish. Anal. Chim. Acta. 2020, 1100, 200–207. [Google Scholar] [CrossRef]
  49. Li, Z.; Lu, J.; Pang, Q.; You, J. Construction of a near-infrared fluorescent probe for ratiometric imaging of peroxynitrite during tumor progression. Analyst 2021, 146, 5204–5211. [Google Scholar] [CrossRef]
  50. Yudhistira, T.; Mulay, S.V.; Lee, K.J.; Kim, Y.; Park, H.-S.; Churchill, D.G. Thiomaleimide functionalization for selective biological fluorescence detection of peroxynitrite as tested in HeLa and RAW 264.7 cells. Chem. Asian J. 2017, 12, 1927–1934. [Google Scholar] [CrossRef]
  51. Xin, F.; Zhao, J.; Shu, W.; Zhang, X.; Luo, X.; Tian, Y.; Xing, M.; Wang, H.; Peng, Y.; Tian, Y. A thiocarbonate-caged fluorescent probe for specific visualization of peroxynitrite in living cells and zebrafish. Analyst 2021, 146, 7627–7634. [Google Scholar] [CrossRef] [PubMed]
  52. Wang, X.; Tao, Y.; Zhang, J.; Chen, M.; Wang, N.; Ji, X.; Zhao, W. Selective detection and visualization of exogenous/endogenous hypochlorous acid in living cells using a BODIPY-based red-emitting fluorescent probe. Chem. Asian J. 2020, 15, 770–774. [Google Scholar] [CrossRef] [PubMed]
  53. Yang, X.; Wang, J.; Zhang, Z.; Zhang, B.; Du, X.; Zhang, J.; Wang, J. BODIPY-based fluorescent probe for cysteine detection and its applications in food analysis, test strips and biological imaging. Food Chem. 2023, 416, 135730. [Google Scholar] [CrossRef] [PubMed]
  54. Wang, N.; Lu, X.; Wang, J.; Wang, H.; Zhang, B.; Zhao, W.; Zhang, J. Quasi-LD-targeted and ONOO-responsive fluorescent probe for investigating the interaction of nonalcoholic fatty liver with drug-induced liver injury. Anal. Chem. 2023, 95, 5967–5975. [Google Scholar] [CrossRef]
Scheme 1. The response mechanism of BDP-ENE-S-Py+ for the detection of ONOO.
Chemosensors 11 00316 sch001
Figure 1. (a) The absorption spectra of the BDP-ENE-S-Py+ probe (10 μM) with ONOO (100 μM) in PBS/acetonitrile (1:1, v/v, 10 mM, pH 7.4) buffer solution at room temperature before and after reaction. (b) The BDP-ENE-S-Py+ probe’s time dynamic curve. (c) The fluorescence intensity of the BDP-ENE-S-Py+ probe changed with the concentration of ONOO. (d) A linear relationship between fluorescence intensity changes at 694 nm of BDP-ENE-S-Py+ and ONOO concentration, which can be linearly fitted by the equation Y = −3.492 + 0.597X, with R2 = 0.991 (n = 3).
Chemosensors 11 00316 g001
Figure 2. The (a) selectivity and (b) interference of the BDP-ENE-S-Py+ probe (10 µM). The concentration of each analyte was 100 µM. The buffer system was PBS/acetonitrile (1:1, v/v, 10 mM, pH 7.4) at room temperature and the reaction time was 2 min. λex = 630 nm and λem = 694 nm.
Chemosensors 11 00316 g002
Figure 3. Density functional theory (DFT)-optimized structures and frontier molecular orbitals (MOs) of BDP-ENE-S-Py+ and BDP-ENE-S-Me.
Chemosensors 11 00316 g003
Figure 4. Intracellular selective imaging of ONOO in HepG2 cells. (a1,a2) Incubation of the cells with BDP-ENE-S-Py+ (10 μM) for half an hour; (b1,b2) incubation of the cells with H2O2 (0.1 mM) for one hour followed by incubation with BDP-ENE-S-Py+ (10 µM) for half an hour; (c1,c2) incubation of the cells with HClO (0.1 mM) for one hour followed by incubation with BDP-ENE-S-Py+ (10 µM) for half an hour; (d1,d2) incubation of the cells with SIN-1 (0.1 mM) for one hour followed by incubation with BDP-ENE-S-Py+ (10 μM) for half an hour; (a3d3) merged images of the blue channel and red channel. Hoechst 33342 (1 μg/mL); blue channel: λex = 405 nm, λem = 420–500 nm; red channel: λex = 660 nm, λem = 662–738 nm. Scale bar signifies 50 µm.
Chemosensors 11 00316 g004
Figure 5. ONOO imaging in HepG2 cells with different concentrations of SIN-1. (a1a3) Cells only incubated with BDP-ENE-S-Py+ (10 μM) for half an hour; (b1b3) incubation of cells with SIN-1 (0.3 mM) for one hour followed by BDP-ENE-S-Py+ (10 μM) for half an hour; (c1c3) incubation of cells with SIN-1 (0.5 mM) for one hour followed by BDP-ENE-S-Py+ (10 μM) for half an hour; (d) histogram of the fluorescence intensity ratio between the different concentrations of SIN-1 groups and the control group in the HepG2 cells experimental group. Hoechst 33342 (1 μg/mL) for ten minutes; blue channel: λex = 405 nm, λem = 420–500 nm; red channel: λex = 660 nm, λem = 662–738 nm. Scale bar signifies 50 µm.
Chemosensors 11 00316 g005
Figure 6. Fluorescence imaging of ONOO in mouse peritonitis. (a1a4) Mice were imaged at 0, 10, 30, and 60 min after abdominal injection of the BDP-ENE-S-Py+ probe (10 µM, 100 µL). (b1b4) The mice were intraperitoneally injected with LPS (100 µg/mL, 200 µL) for incubation for 24 h and then injected with BDP-ENE-S-Py+ (10 μM, 100 µL) in the same location, with imaging performed after incubation at 0, 10, 30, and 60 min. (c) Fluorescence intensity collected from (a1a4,b1b4). Images were taken using an excitation laser at 630 nm and an emission filter of 700 nm.
Chemosensors 11 00316 g006
Disclaimer/Publisher’s Note: The statements, opinions and data contained in all publications are solely those of the individual author(s) and contributor(s) and not of MDPI and/or the editor(s). MDPI and/or the editor(s) disclaim responsibility for any injury to people or property resulting from any ideas, methods, instructions or products referred to in the content.

