Article

Electrochemical Mercury Biosensor Based on Electrocatalytic Properties of Prussian Blue and Inhibition of Catalase

by
Povilas Virbickas
,
Narvydas Dėnas
and
Aušra Valiūnienė
*
Faculty of Chemistry and Geosciences, Vilnius University, Naugarduko 24, LT-03225 Vilnius, Lithuania
*
Author to whom correspondence should be addressed.
Chemosensors 2023, 11(5), 311; https://doi.org/10.3390/chemosensors11050311
Submission received: 6 April 2023 / Revised: 5 May 2023 / Accepted: 17 May 2023 / Published: 22 May 2023
(This article belongs to the Section Applied Chemical Sensors)

Abstract

:
This paper presents a detailed study of a novel type of electrochemical mercury ion (Hg2+) biosensor developed by combining Prussian blue (PB) and catalase (Cat). The simultaneous PB-catalyzed reduction of hydrogen peroxide and the inhibition of catalase by Hg2+ ions were used as the working principle of the biosensor. The biosensor described in this research was capable of detecting Hg2+ ions at relatively low potentials (+0.2 V vs. Ag|AgCl, KClsat) using chronoamperometry and a fast Fourier transform electrochemical impedance spectroscopy (FFT-EIS). Linear ranges of 0.07 mM–3 mM and 0.13 mM–0.80 mM of Hg2+ ions were obtained using amperometric and impedimetric techniques, respectively. In the course of this work, an amperometric study of the Hg2+ ion biosensor was also carried out on a real sample (tap water containing Hg2+ ions).

1. Introduction

Mercury is a heavy metal that can exist in different forms: an inorganic form, which consists of metallic mercury (Hg0) and mercury ions (Hg22+ and Hg2+), and an organic form, which is formed when mercury is attached to structures containing carbon atoms (methyl, ethyl, phenyl or similar groups) [1]. Mercury and its derivatives are highly toxic to humans and other living species. In the human body, Hg2+ is retained in brain tissue, where mercury can be present for many years. Many intracellular processes in the brain can be affected, including DNA, RNA and protein synthesis, microtubule polymerization, cell division and cell migration [2,3,4,5,6]. In many cases, the toxic effect of Hg2+ is related to enzyme inhibition, since Hg2+ ions tend to interact with the thiol group (-SH) of proteins and other biologically active compounds [7]. In the case of catalase, the inhibition caused by Hg2+ ions is based on van der Waals and the electrostatic interactions between Hg2+ and catalase [8]. These interactions between catalase and Hg2+ lead to changes in the conformation of catalase, which is believed to reduce the activity of catalase [8].
Mercury can be released into the environment naturally through volcanic activity and rock weathering [9,10]. However, human industrial activities, e.g., metal mining and the chlor-alkali industry [9,11,12], are also important sources of mercury contamination of the environment—due to anthropogenic activities, the global atmospheric Hg deposition rate has increased about three times compared to that of pre-industrial times [13]. Particularly high levels of mercury contamination are found in the soil of industrialized areas, where the concentration of mercury can reach 9000 ppm [14]; in the water near plants or mined areas, the concentration of mercury can reach more than 7 ppb [15]. Taking into account that concentrations of mercury can vary drastically depending on the sampling location as well as on the type of sample analyzed [10,11,12,13,14,15], the development of analytical methods suitable for analyzing different ranges of mercury concentrations is of great importance.
Mercury can be detected by various analytical methods such as cold vapor atomic absorption spectroscopy (CVAAS) [16,17,18], cold vapor atomic fluorescence spectroscopy (CVAFS) [19,20], inductively coupled plasma mass spectrometry (ICP-MS) [19,21] and graphite furnace atomic absorption spectrometry (GFAAS) [22,23]. These methods are sensitive and have high reproducibility. However, the use of these methods requires large amounts of chemical reagents, expensive equipment and analysis and are not time efficient [24,25]. Nevertheless, concentrations of mercury can also be measured using biosensors, which are characterized by their inherent simplicity, rapid analysis and small size, as well as ease of operation [26]. There have been many scientific investigations [27,28,29,30,31,32,33,34,35] which have aimed to determine Hg2+ ion concentrations in solutions using various biosensors based on DNA, enzymes, such as catalase, glucose oxidase and urease, and different electrochemical measurement approaches [27,28,29,30,31,32,33,34,35]. However, earlier-developed Hg2+ ion biosensors often faced problems that hindered the development of an efficient and applicable biosensor for the analysis of real samples, e.g., narrow linear range [27,28,30,32,35], disposability [30] and a requirement to use complex and expensive systems [29,33].
In this work, an electrochemicalHg2+ ion biosensor was developed by modifying the surface of a fluorine-doped tin oxide-coated glass electrode (glass|FTO) with a layer of Prussian blue (PB), and then immobilizing the enzyme catalase (Cat). To the best of our knowledge, a Hg2+ ion biosensor developed by combining PB and catalase has never been reported. This biosensor, based on the developed electrode (glass|FTO|PB|Cat), was able to measure the concentration of Hg2+ ions in aqueous solutions using amperometric and impedimetric techniques. The working principle of this biosensor is based on the simultaneous PB-catalyzed reduction of hydrogen peroxide and catalase inhibition by the Hg2+ ions.

2. Materials and Methods

2.1. Materials

K2HPO4 (purity ≥ 99%, CAS No. 7758-11-4), H3PO4 (purity 85%, CAS No. 7664-38-2), K3[Fe(CN)6)] (purity ≥ 99%, CAS No. 13746-66-2), FeCl3·6H2O (purity ≥ 98%, CAS No. 10025-77-1), KCl (purity ≥ 99.5%, CAS No. 7447-40-7), acetone (purity ≥ 99.9%, CAS No. [67-64-1]), HCl (37%, CAS No. 7647-01-0) and catalase (purity ≥ 11 700 U/mg material, CAS No. 9001-05-2) were acquired from ROTH (Karlsruhe, Germany). A 2% Mikro-90 solution and glutaraldehyde 25% (grade II, CAS No. 111-30-8) were acquired from Sigma Aldrich (Munich, Germany). Ultrapure water (R ≥ 18 MΩ × cm) supplied by a Milli Q-plus-Millipore system (Burlington, NJ, USA) was used to prepare all the solutions. A phosphate buffer solution (PBS) (pH 7) was prepared by dissolving K2HPO4 (10 mmol/L) and adjusting the pH value using H3PO4 solution to pH 7.

2.2. Equipment

Chronoamperometric and cyclic voltammetry-based measurements were performed using a μAUTOLAB potentiostat/galvanostat from ECO-Chemie (Utrecht, The Netherlands).
pH measurements were performed using a pH meter HI83141 with an HI1230B electrode from Hanna Instruments (Bedfordview, Republic of South Africa).
Fast Fourier transform electrochemical impedance spectroscopy (FFT-EIS) measurements were performed with a FFT impedance spectrometer EIS-128/16 constructed by Prof. G. Popkirov (University of Kiel, Germany) [36]. In FFT-EIS, a 16-bit digital-to-analog converter can create a perturbation signal as a sum of up to 80 frequencies and apply it to the sample. This technique allows for a drastic reduction in the required measurement time. For example, a full impedance spectrum from 1 Hz to 10 kHz can be obtained in 2 s.

2.3. Fabrication of the Glass|FTO|PB|Cat Electrode

Prior to biosensor fabrication, the glass|FTO plate was cleaned [37] using sonification in (1) 2% Micro-90 solution, (2) acetone and (3) deionized water for 16 min during each step (1, 2 and 3). During the PB-layer deposition, the potential of the previously cleaned glass|FTO plate was scanned from 0.4 V to 0.8 V vs. Ag|AgCl, KClsat (scan rate 40 mV s−1) in the solution, containing 1 mmol/L K3[Fe(CN)6)], 1 mM FeCl3·6H2O and 0.1 M HCl [38]. A total of 40 potential cycles were applied. To stabilize the PB layer [39] deposited on the glass|FTO|PB electrode, potential scanning in a range from 0.45 V to 0 V vs. Ag|AgCl, KClsat, at a scan rate of 40 mV s−1, was applied in a solution containing 0.1 M KCl and 0.1 M HCl. A total of 20 potential cycles were applied. To immobilize catalase on the glass|FTO|PB electrode, 25 µL of 5 mg/mL catalase solution was distributed on 1 cm2 geometric area of the PB surface and left to dry at ambient conditions. Then, the fabricated glass|FTO|PB|Cat electrode was held over a 25% glutaraldehyde aqueous solution for 15 min for cross-linking the catalase enzyme to immobilize it [38,39]. After catalase immobilization, the glass|FTO|PB|Cat electrode was rinsed with deionized water to remove any residual glutaraldehyde. Optical microscope images of the glass|FTO|PB plate recorded before and after the immobilization of the catalase are shown in Figure 1. It was found that before catalase immobilization the PB coating on the glass|FTO plate was rather smooth and blue in color (Figure 1A), while after catalase immobilization (Figure 1B), white spots of catalase enzymes were observed on the glass|FTO|PB plate.

2.4. Electrochemical Measurements

All the electrochemical measurements were carried out at room temperature (25 ± 1 °C) and at standard pressure (760 ± 25 mmHg). The experiments were performed using a three-electrode system consisting of the glass|FTO|PB or the glass|FTO|PB|Cat working electrode, a platinum wire as a counter electrode and a Ag|AgCl, KClsat electrode as a reference electrode. To characterize the amperometric and impedimetric response of the glass|FTO|PB|Cat electrode to the Hg2+ ions, at least 6 electrodes were used in this research.
During the amperometric measurements, the solution in the electrochemical cell was stirred with a magnetic stirrer (~2 revolutions per second (RPS)) throughout the experiment. An amount of either 0.088 M H2O2 or 0.1 M HgCl2 (from 0.011 mM to 3 mM) solution was added to the PBS only after a constant current was reached, which was attributed to the background current of the electrochemical system.
The FFT-electrochemical impedance spectra were recorded at the potentiostatic mode (by applying 0.2 V vs. Ag|AgCl, KClsat), and the range of alternating current frequencies varied from 2 Hz to 10.5 kHz, allowing for a single spectra to be recorded within 1 s. The data analysis software “Zview” was used to analyze the experimental data according to the model containing the elements of selected equivalent circuit. In these FFT-EIS studies, after the addition of H2O2 (0.88 M) or HgCl2 (0.1 M) stock solution to the PBS, the solution was further stirred (2 RPS) for 1 min and then allowed to settle for 0.5 min to avoid any unnecessary relaxation effects that can be a source of distortion in the FFT-EIS measurement data.

3. Results and Discussion

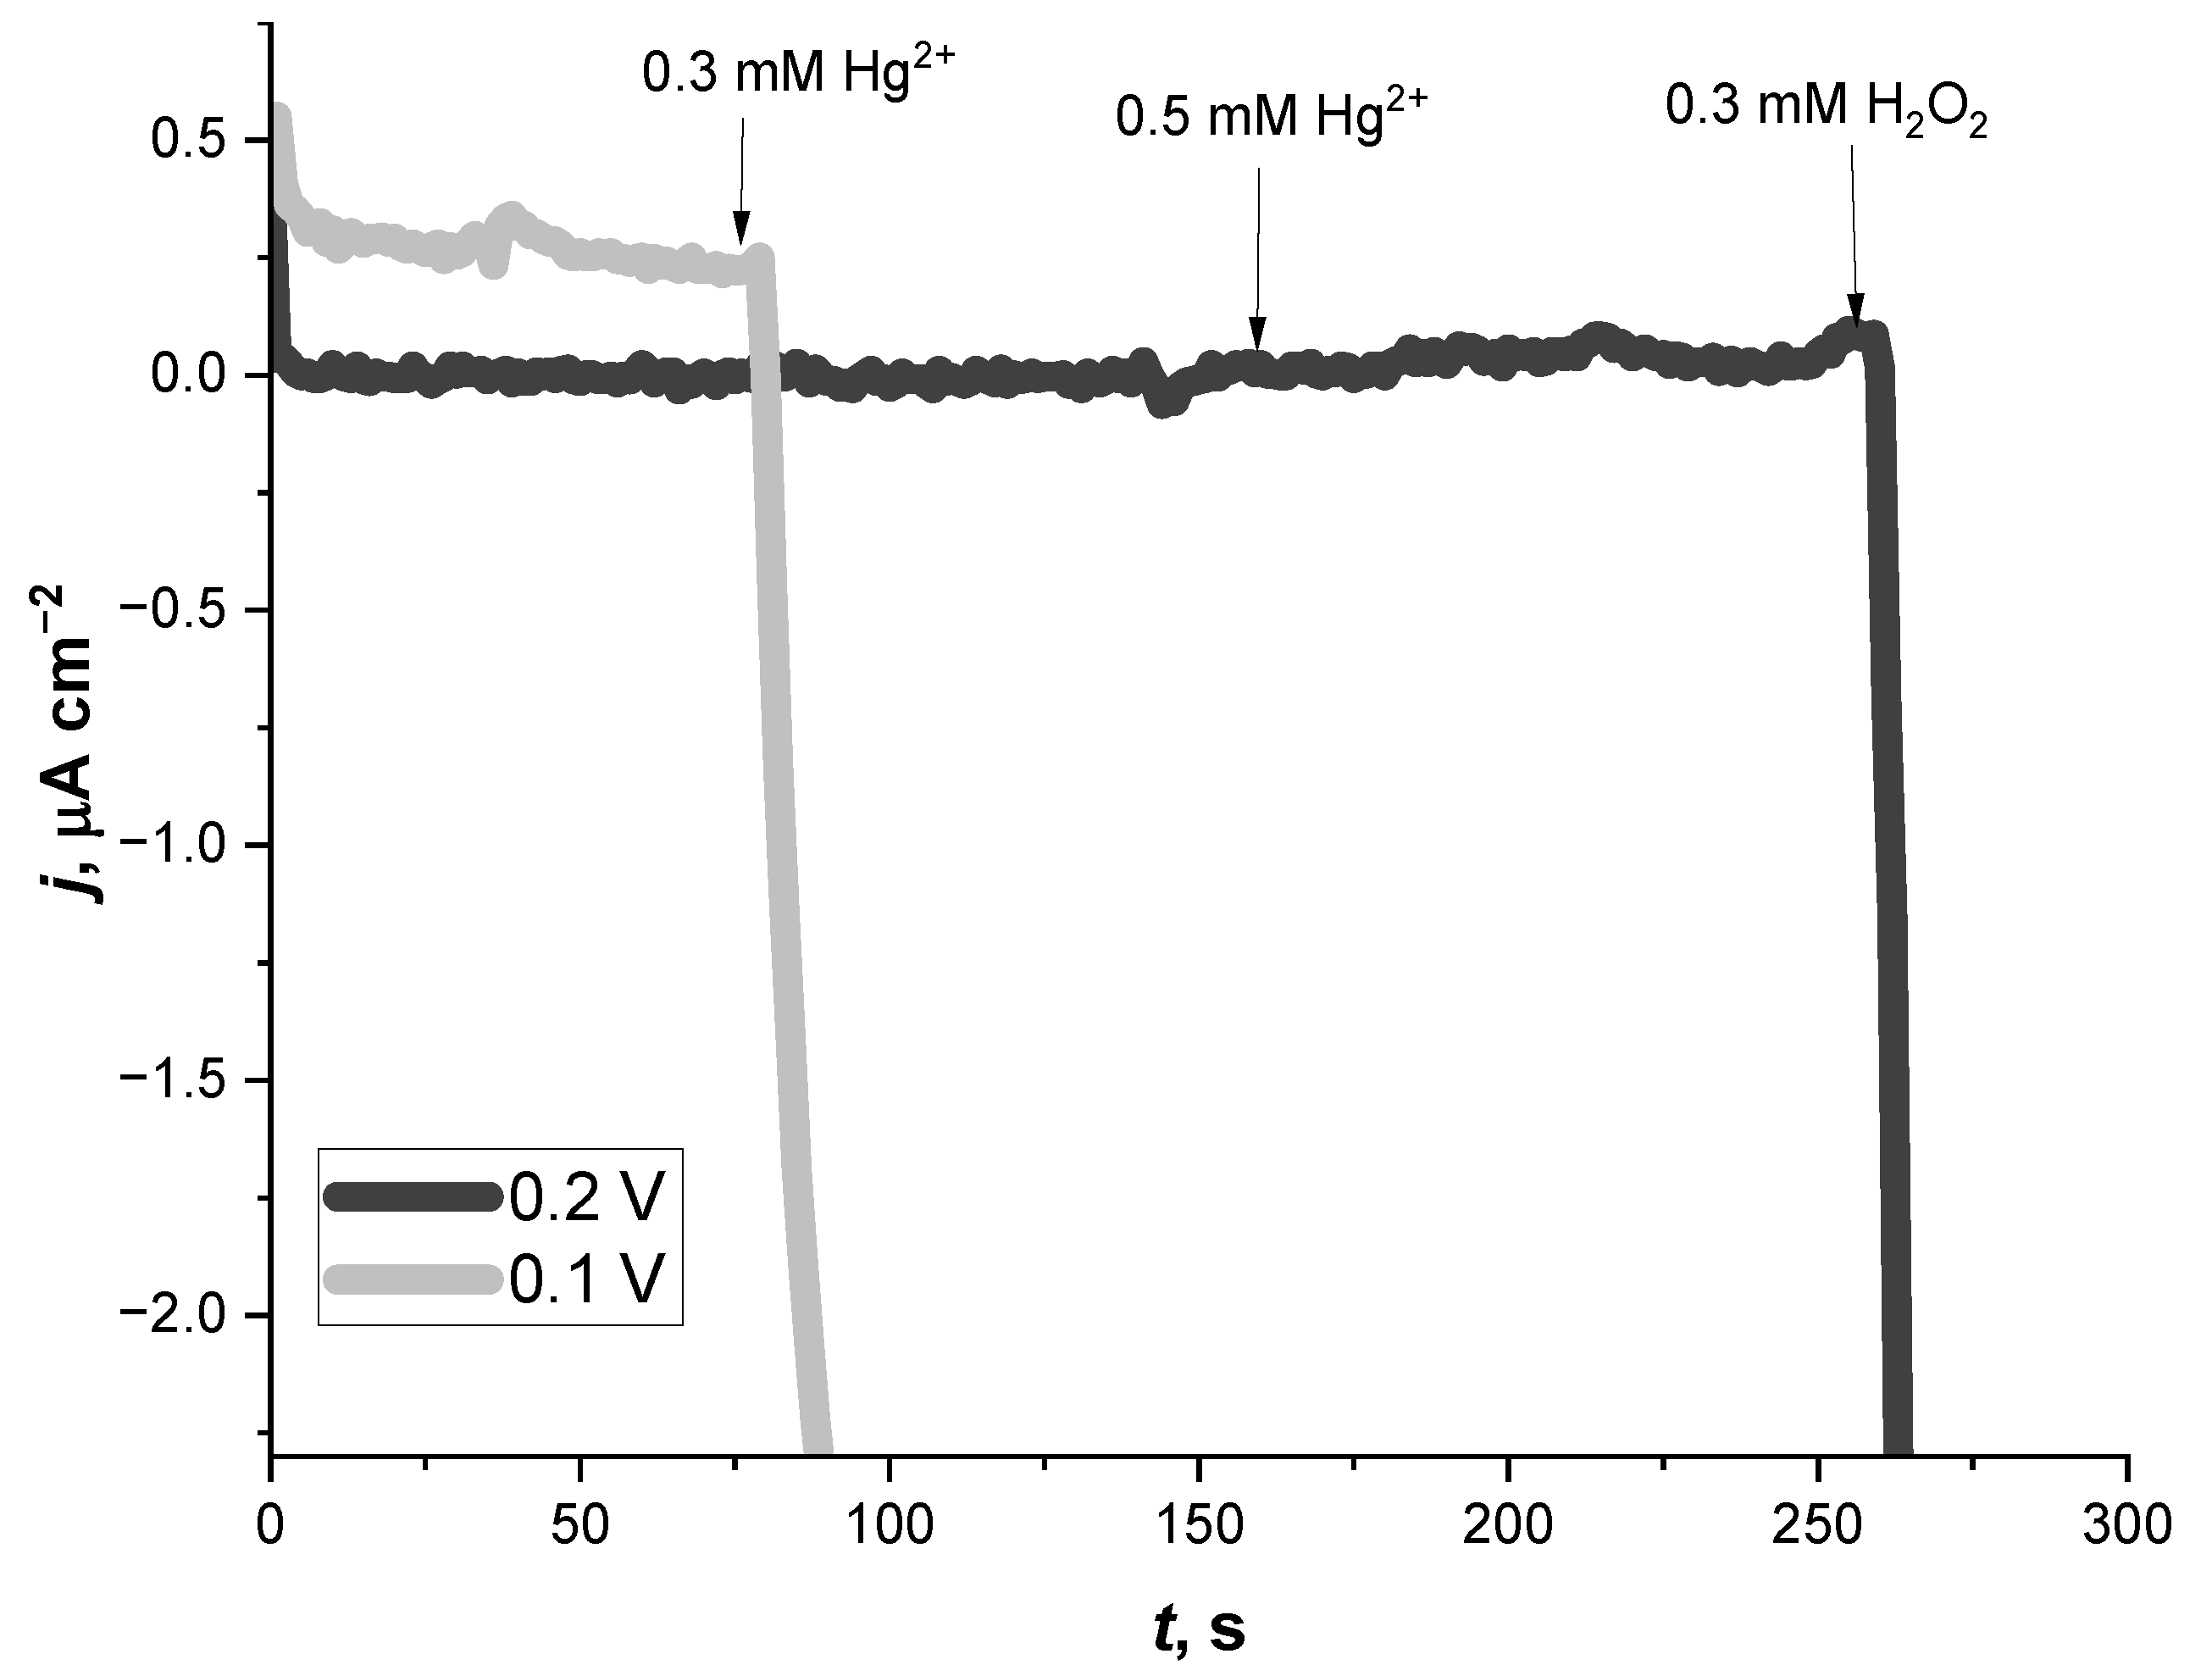
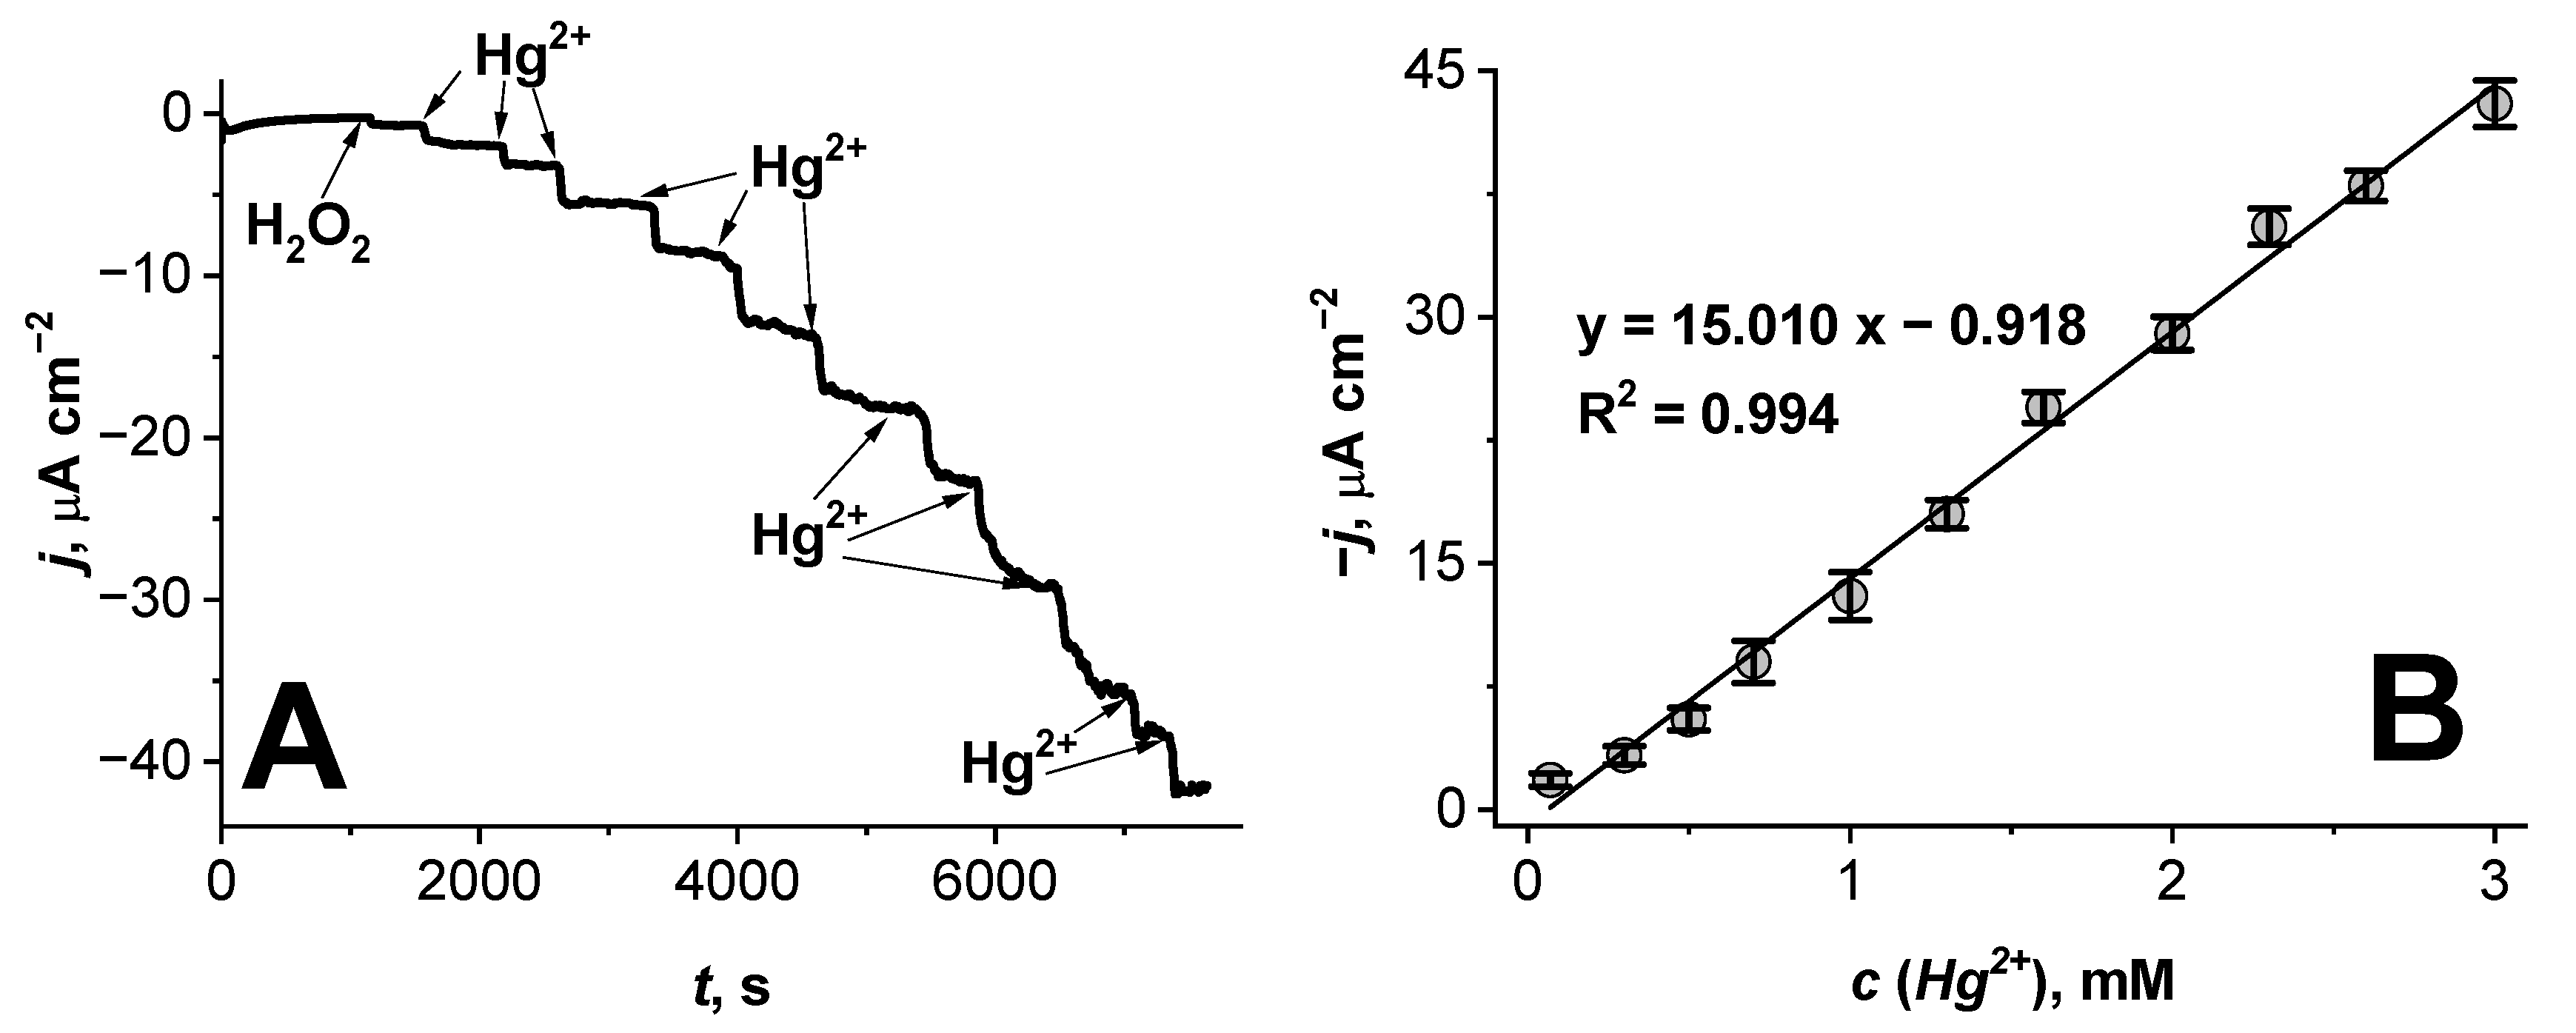
3.1. Amperometric Study of the Hg2+ Ion Biosensor Based on the Glass|FTO|PB|Cat Electrode

In order to develop an electrochemical-catalase inhibition-based biosensor for a Hg2+ ion, it is necessary to relate the inhibition of catalase to an electrochemical signal, e.g., to measure the reduction current of hydrogen peroxide, which is a substrate of the enzyme catalase. For this purpose, Prussian blue (PB) could be used in the composition of the Hg2+ ion biosensor because PB is a well-known electrocatalyst of H2O2 reduction (Equation (1)) [40].
H 2 O 2   + 2 H + + 2 e P B 2 H 2 O
2 H 2 O 2 C a t H 2 O + O 2
Considering that the enzyme catalase disproportionates H2O2 to oxygen and water (Equation (2)) [41], and PB catalyzes the electrochemical reduction of H2O2 (Equation (1)), in this research it was decided to develop a Hg2+ ion biosensor by immobilizing catalase (Cat) on the glass|FTO|PB electrode. As can be expected, the electrochemical response of such a Hg2+ ion biosensor (glass|FTO|PB|Cat) should be dependent on the H2O2 disproportionation reaction (Equation (2)), because the amount of H2O2 reaching the PB layer will be decreased due to the disproportionation of H2O2 by catalase, causing a relevant decrease in the cathodic current of the H2O2 reduction at the glass|FTO|PB electrode. On the other hand, the addition of Hg2+ ions to the H2O2-containing PBS may cause the inhibition of catalase, resulting in a decreased rate of catalytic H2O2 disproportionation and an increased rate of the electrochemical-PB-catalyzed H2O2 reduction. Therefore, the increase in the rate of the H2O2 reduction on the PB layer can be used for the electrochemical detection of Hg2+ ions. Specifically, both amperometric and impedimetric techniques can be used to detect Hg2+ ions using the glass|FTO|PB|Cat electrode developed in this research.
Previously reported [30] catalase inhibition-based Hg2+ ion biosensors required a three-step approach for Hg2+ ion sensing, which included: (i) measuring the H2O2 reduction current with a Hg2+-unaffected biosensor, (ii) incubating the biosensor in a Hg2+ ion-containing solution and (iii) measuring the H2O2 reduction current after incubating the biosensor in a Hg2+ ion-containing solution. In this work, it was decided to develop a Hg2+ ion biosensor capable of detecting Hg2+ ions without incubating the biosensor in a solution containing Hg2+ ions. To achieve this, a Hg2+ ion biosensor based on catalase inhibition should be able to operate in a solution containing both H2O2 and Hg2+ ions. Therefore, it is important to select the appropriate potential at which the electrochemical reduction of H2O2 occurs without redox reactions of Hg2+ ions. It is known from previous studies [38,42,43] that PB-catalyzed H2O2 reduction occurs only at potentials lower than 0.15 V–0.27 V vs. Ag|AgCl, KClsat, depending on the electrode material and/or the composition of the electrolyte. In this study, the glass|FTO|PB electrode was electrochemically tested by adding Hg2+ and H2O2 to the PBS at potentials of +0.1 V and +0.2 V (vs. Ag|AgCl, KClsat) (Figure 2). As can be seen in Figure 2, when a potential of +0.2 V was applied to the glass|FTO|PB electrode, the addition of Hg2+ ions to the PBS did not cause any changes to the current registered on the electrode; however, after the addition of H2O2 to the solution, the reduction current started to increase sharply (Figure 2, black curve).
This finding indicates that a potential of +0.2 V vs. Ag|AgCl, KClsat is suitable for measuring a H2O2 reduction reaction (Equation (1)), even with the presence of Hg2+ ions in the solution. Moreover, such a low potential for the working electrode (+0.2 V (vs. Ag|AgCl, KClsat)) helps to avoid the interfering oxidation reactions of the other electrochemically active substances which might be present in the sample, e.g., alkylphenols and sulfite ions [44,45]. Nevertheless, in this study it was decided to test the glass|FTO|PB electrode using chonoamperometry at an even lower potential of + 0.1 V vs. Ag|AgCl, KClsat (Figure 2, gray curve). However, it was found that when a potential of +0.1 V vs. Ag|AgCl, KClsat was applied to the glass|FTO|PB electrode, the cathodic current began to increase rapidly after the addition of Hg2+ ions to the PBS, due to the reduction of Hg2+ ions (Figure 2, gray curve). Therefore, when +0.1 V is applied to the glass|FTO|PB electrode, an increase in the cathodic current caused by the addition of H2O2 would be inseparable from the Hg2+ ion reduction current. Therefore, a potential value of +0.2 V was used in further investigations of the Hg2+ ion biosensor based on the glass|FTO|PB|Cat electrode.
An amperometric study of the glass|FTO|PB|Cat electrode in the PBS (Figure 3A) showed that the initial addition of 0.3 mM of H2O2 resulted in only a negligible (−0.7 µA cm−2) cathodic current. The small value (−0.7 µA cm−2) of the H2O2 reduction current indicates that the catalase efficiently disproportionated H2O2 into water and oxygen (Equation (2)); thus, most of the H2O2 from the solution was unable to penetrate the catalase coating of the glass|FTO|PB|Cat electrode and reach the PB layer. Meanwhile, the addition of Hg2+ ions to the PBS resulted in a significant increase in the cathodic current of the glass|FTO|PB|Cat electrode. Particularly, the cathodic current increased by approx. 45 µA cm−2 after adding 3 mM of Hg2+ to the PBS (Figure 3B). Therefore, after the addition of Hg2+ ions to the H2O2-containing PBS, more H2O2 molecules were able to penetrate through the catalase coating and be electrochemically reduced on the PB layer (Equation (1)). This Hg2+-caused increase in the cathodic current appears to be linearly dependent (R2 = 0.994) on the Hg2+ concentration in the range of 0.07 mM to 3 mM of Hg2+ (Figure 3B), with a sensitivity of 15 µA cm−2 mM−1. For the sake of comparison, the linear concentration ranges of other electrochemical-enzyme inhibition-based Hg2+ biosensors ranged from 5 × 10⁻⁴ µM–27 µM to 5 × 10⁻⁷–0.25 mM (Table 1). Therefore, the glass|FTO|PB|Cat electrode-basedHg2+ ion biosensor seems to be suitable for analyzing samples containing higher concentration of Hg2+, such as contaminated water and extracts made from soil or sediments [9,11,12,13,14].

3.2. Stability of the Hg2+ Ion Biosensor Based on the Glass|FTO|PB|Cat Electrode

In order to evaluate the stability of the glass|FTO|PB|Cat biosensor response to Hg2+ ions over time, the sensitivity of the Hg2+ ion biosensor was tested continuously for 70 days by examining the chronoamperometric responses of the FTO|PB|Cat electrode in PBS containing different concentrations of Hg2+ ions. A single glass|FTO|PB|Cat electrode was tested seven times: during the day of its preparation and after 14, 21, 28, 35, 56 and 70 days after its preparation, respectively. Between measurements, the glass|FTO|PB|Cat electrode was stored in a refrigerator (t = 4 ± 1 °C) under dry conditions. From the obtained linear dependencies between the cathodic current and the concentration of Hg2+ ions, it was found that the sensitivity of the biosensor decreased with time (Table 2), indicating some changes in the stability of the biosensor over time.
As can be seen from the data in Table 2, the sensitivity of the Hg2+ biosensor based on the glass|FTO|PB|Cat electrode decreased only about 10% during the first 2 weeks and did not decrease much within the 28-day period, remaining at 66.7% of the initial sensitivity. After 10 weeks, the biosensor lost about 65% of its initial sensitivity, but still showed a sensitivity of 4.59 µA cm−2 mM−1. Other similar electrochemical-enzyme inhibition-based Hg2+ ion biosensors showed a fluctuating loss of sensitivity (Table 1). For example, depending on the composition of the enzyme inhibition-based Hg2+ ion biosensor, a sensitivity loss of 25% after the first calibration curve, a loss of 60% after 3 weeks or a loss of 40% after 24 h was observed (Table 1).
In summary, it can be concluded that the Hg2+ ion biosensor constructed in this research has some advantages compared to other biosensors for mercury detection [28,30,32,33]. Its amperometric responses showed good linear dependencies for the construction of calibration curves (R2 ≈ 0.99), which are well suited for the calculation of the sensitivity, which was found to be comparatively high (15.01 µA cm−2 mM−1) for the wide concentration range of the Hg2+ ions (0.07 mM to 3 mM). Furthermore, the decrease in the sensitivity of our developed Hg2+ ion biosensor was rather small during the 2-week period, indicating that the biosensor does not need to be prepared before each measurement, but can be prepared in advance for later use.

3.3. Investigation of the Hg2+ Biosensor in Tap Water

In comparison to the chronoamperometric investigation of the Hg2+ ion biosensor in PBS (Figure 3A), the detection of Hg2+ ions in tap water allowed us to register some increase in the cathodic current after the addition of very low concentrations of Hg2+ ions (from 11 µM to 300 µM); however, the amperometric responses in tap water at such low Hg2+ concentrations were not linearly proportional to the Hg2+ concentration. Meanwhile, increasing the Hg2+ concentration in tap water from 0.3 mM to 1.5 mM resulted in a linear dependence between the cathodic current and the concentration of Hg2+ ions (Figure 4A,B). The sensitivity of the Hg2+ ion biosensor in tap water (Figure 4B) was slightly lower (13.29 µA cm−2 mM−1) than in PBS (Figure 3B) (15.01 µA cm−2 mM−1). These results are due to the matrix effect, indicating that the standard addition method has to be used for real samples analysis. Considering that Hg2+ concentration measurement in PBS has a higher sensitivity, we can conclude that PBS is more suitable for measuring Hg2+ ion concentration than tap water, but our developed Hg2+ biosensor can also be used for the preliminary analysis of mercury ions in tap water.

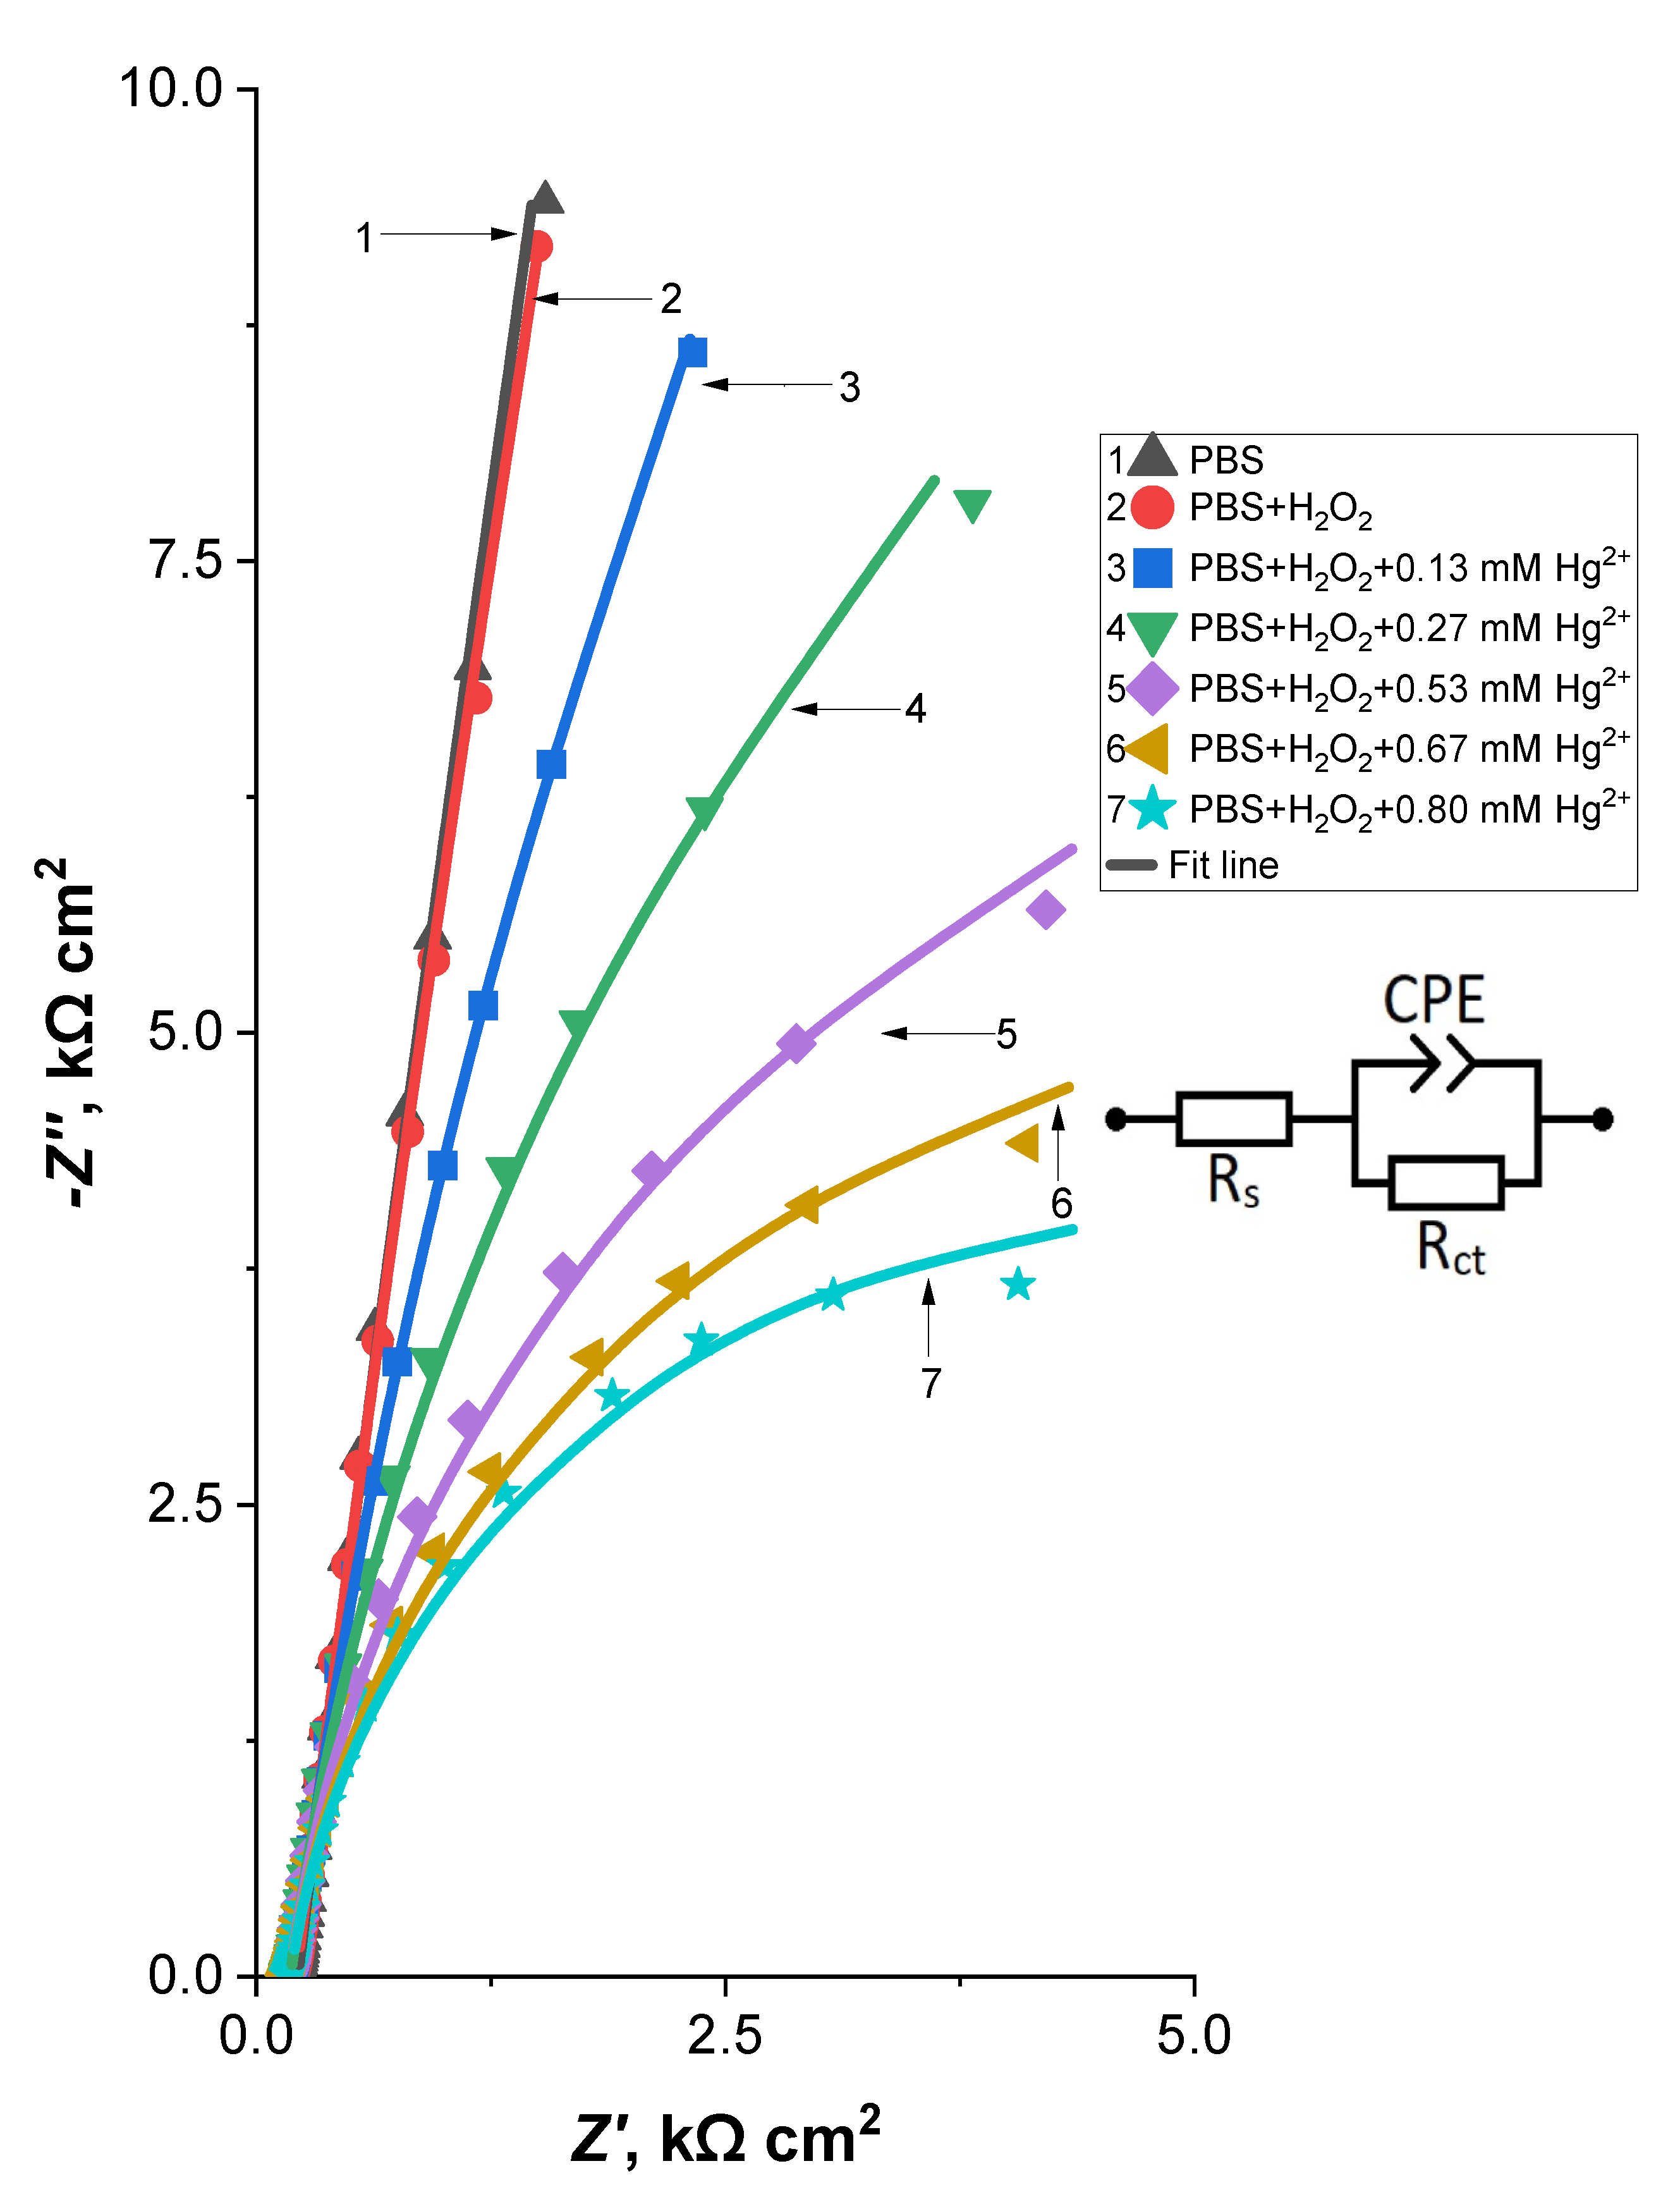
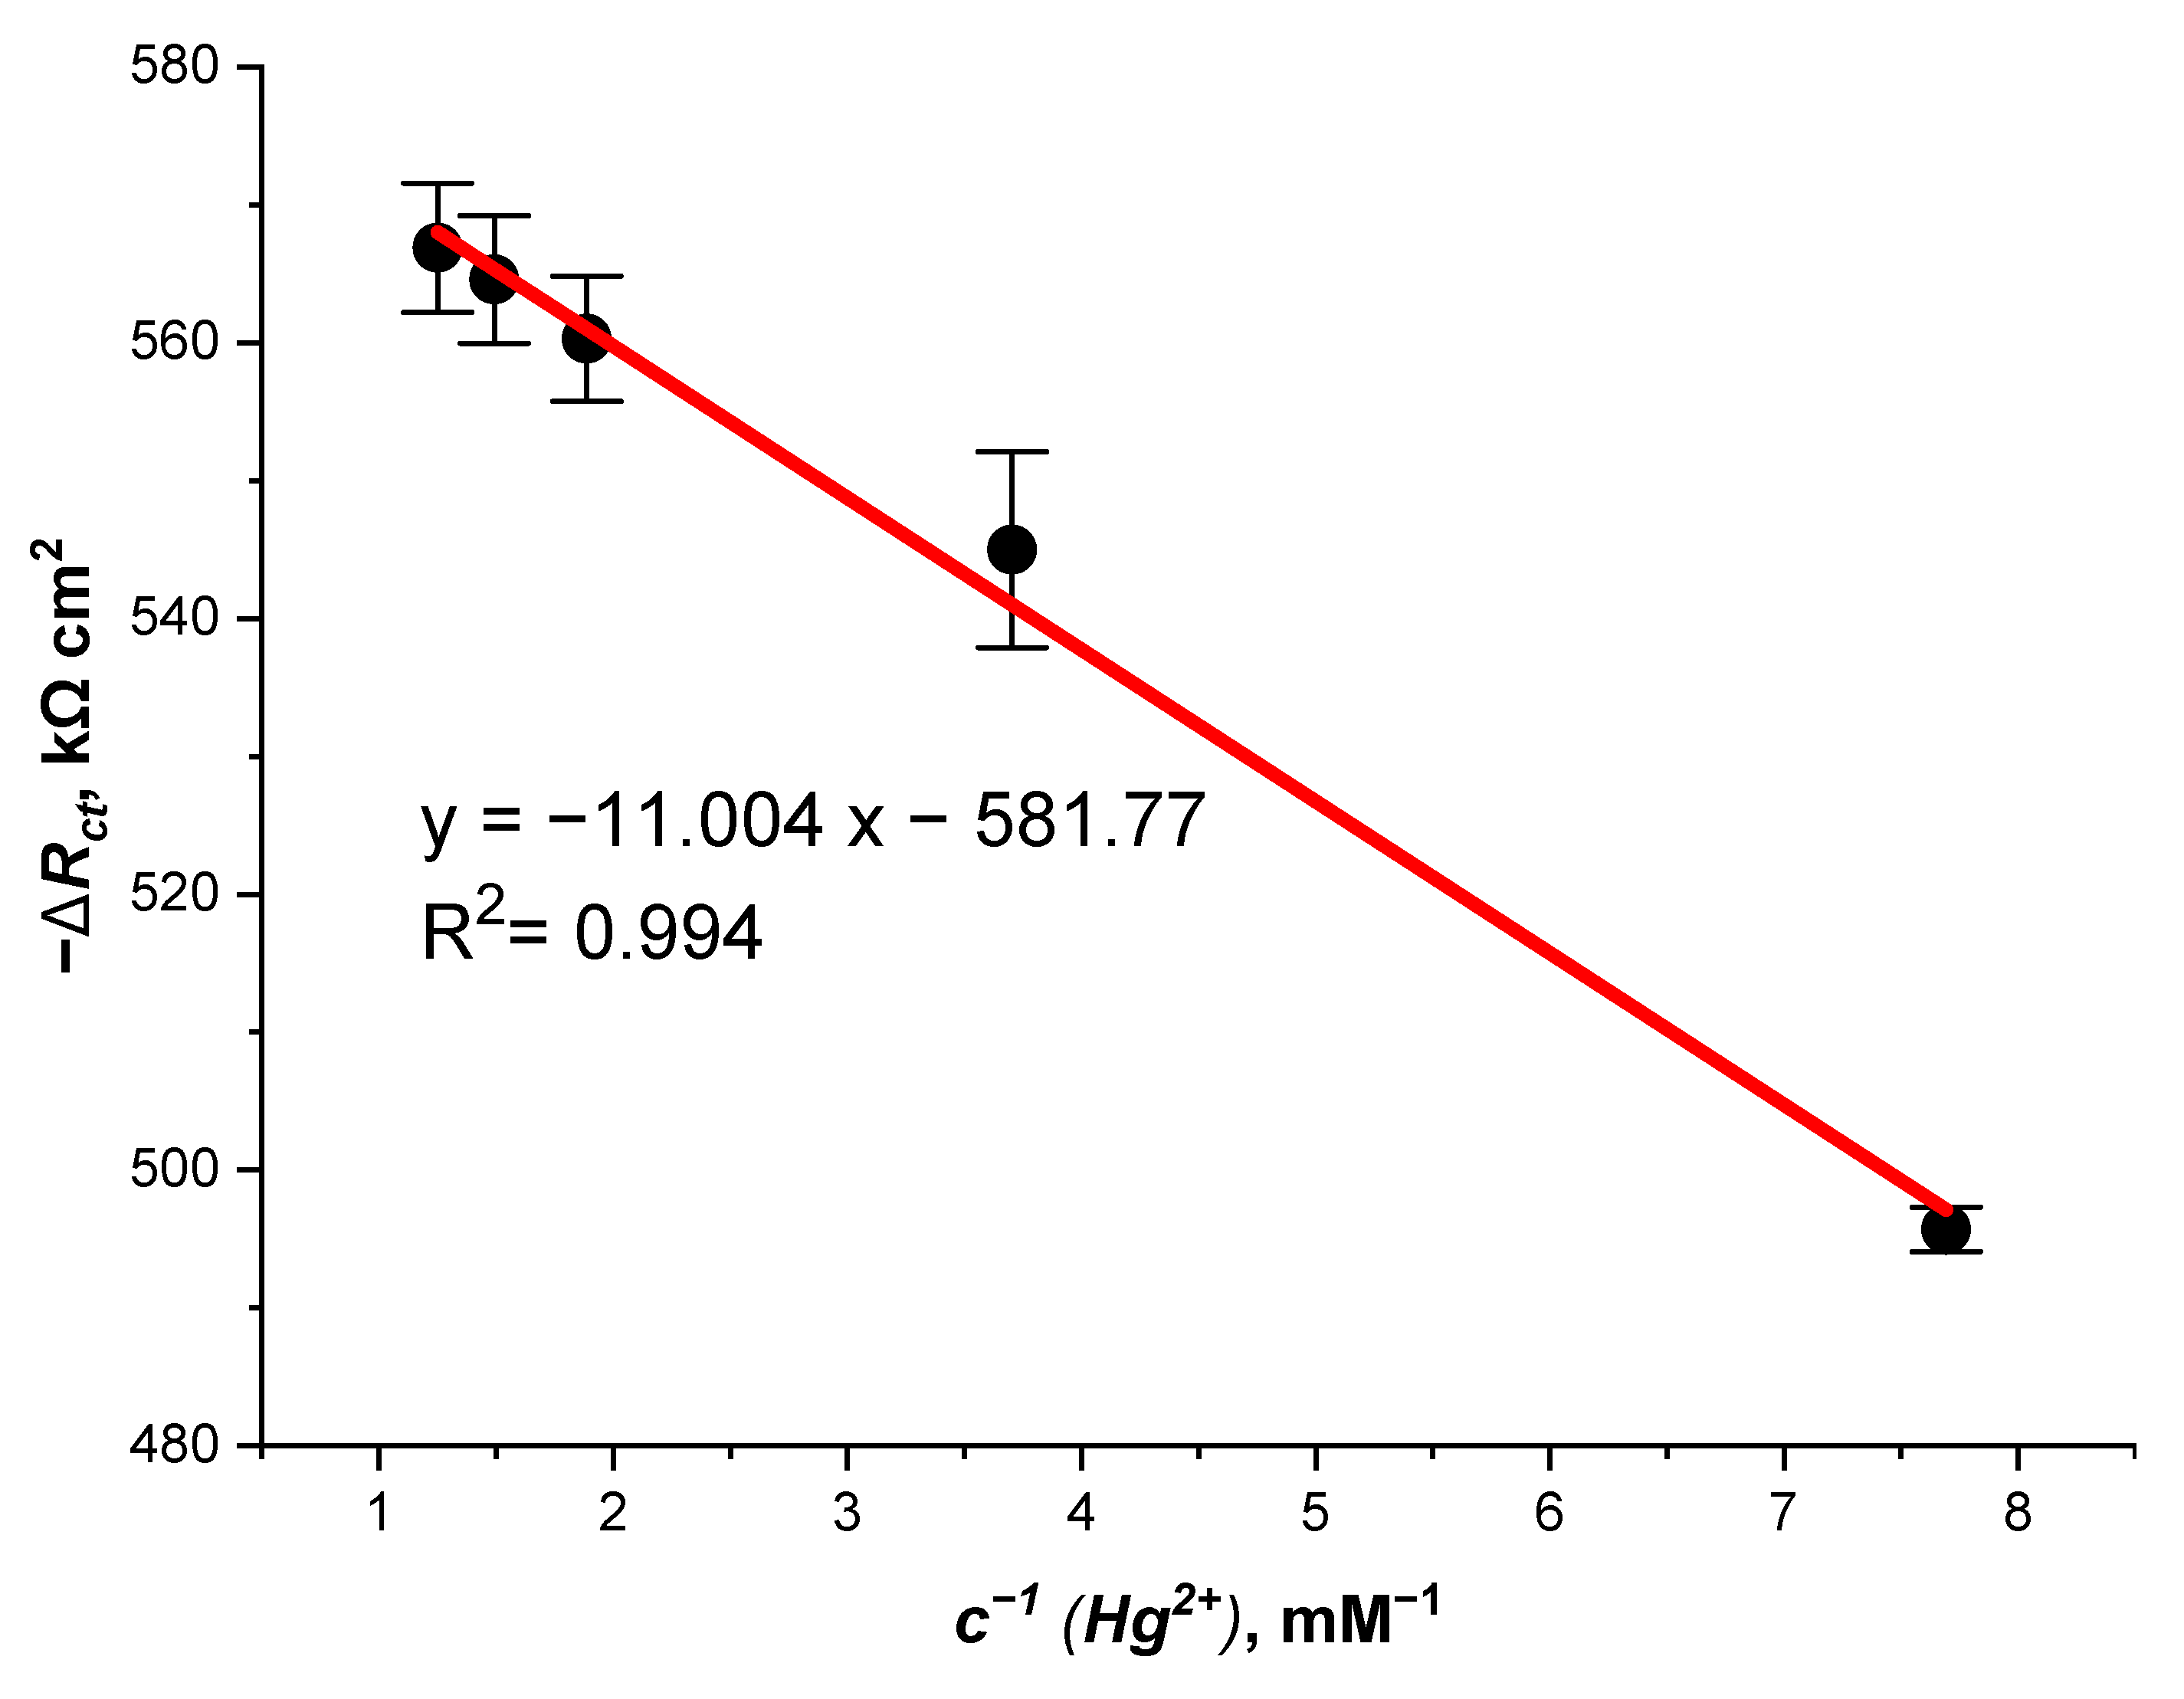
3.4. Investigation of the Hg2+ Biosensor Using Fast Fourier Transform Electrochemical Impedance Spectroscopy

To determine the kinetic parameters of the system and to design an impedimetric Hg2+ ion biosensor based on the glass|FTO|PB|Cat electrode, fast Fourier transform electrochemical impedance spectroscopy (FFT-EIS) measurements were performed at a potential of 0.2 V vs. Ag|AgCl, KClsat: (i) in PBS (pH 7), (ii) with the addition of 0.3 mM H2O2 to the PBS and (iii) with the addition of varying amounts of Hg2+ ions (from 0.13 mM to 0.8 mM) to the PBS (Figure 5).
The FFT-EIS spectra in the Nyquist plot (Figure 5) showed that the addition of H2O2 to the PBS did not significantly affect the shape of the electrochemical impedance spectrum (Figure 5, curves 1 and 2), which could be explained by the rather effective disproportionation of H2O2 by catalase (Equation (2)). Meanwhile, when Hg2+ ions were added to the PBS, the diameter of the uncomplete semicircle decreased as a function of the concentration of Hg2+ ions added (Figure 5, curves 3–7). This is an indication that Hg2+ ions facilitate a charge transfer at the electrode/PBS interface. Similar to the amperometric investigation of the Hg2+ biosensor in Hg2+ ions containing PBS (Figure 3), the enhancing effect of Hg2+ ions on the charge transfer can be explained by the inhibition of catalase with Hg2+ ions: since catalase is inhibited with Hg2+ ions, more H2O2 molecules can penetrate through the catalase layer and be electrochemically reduced on the PB layer (Equation (1)).
FFT-EIS data (Figure 5) for the Hg2+ biosensor constructed in this study were analyzed using the Randles circuit model (Figure 5, inset), which consists of the solution resistance (Rs), constant phase element (CPE) and charge transfer resistance (Rct). The electrochemical parameters obtained by analyzing the FFT-EIS data (Figure 5) are listed in Table 3.
The accuracy of the obtained electrochemical parameters (Table 3) was verified using chi-square goodness-of-fit test (Equation (3)), which evaluates the closeness of the observed values (Equation (3), symbol “Oi”) to those obtained by the fitted model (Equation (3), symbol “Ei”) [50,51]:
χ 2 = O i E i 2 E i
The subscript “i” in Equation (3) represents each element of the equivalent circuit; the function “ χ 2 ” is known as “Chi Square Goodness of Fit Coefficient”. The best fit is observed when the value of “ χ 2 ” approaches zero.
It was found that the values of the equivalent circuit elements (Table 3) fitted appropriately to the experimental data ( χ 2 varied from 1 × 10⁻⁵ to 5 × 10⁻⁴). Even though the addition of H2O2 into the PBS did not cause a significant visual change in the EIS spectra (Figure 5), the value of the charge transfer resistance (Rct) decreased from 960 to 576 kΩ cm2 after adding H2O2 into the PBS (Table 3), indicating that some molecules of H2O2 were able to penetrate through the catalase layer and be reduced on the PB. This finding corresponds to the chronoamperometric investigation of the glass|FTO|PB|Cat electrode (Figure 3A), revealing that the addition of H2O2 to PBS causes a negligible reduction current (−0.7 µA cm−2).
As predicted from the shape of the FFT-EIS spectra (Figure 5), the value of the charge transfer resistance (Rct) decreases with an increasing concentration of Hg2+ ions. Furthermore, a linear dependence (R2 = 0.994) of the Hg2+ ions-caused decrement in ΔRct on the concentration of Hg2+ ions (c−1 (Hg2+)) was observed in the range of 0.13 mM to 0.80 mM, with a sensitivity of 11.0 kΩ mM−1 (Figure 6). ΔRct was calculated by subtracting the Rct values measured in the Hg2+- and H2O2-containing PBS from the Rct value (576 kΩ cm2) measured in the H2O2-containing PBS (Table 3). Although this linear range (from 0.13 mM to 0.80 mM) is smaller than the linear range obtained during the amperometric study of the glass|FTO|PB electrode (Figure 3B, from 0.07 mM to 3 mM), the FFT-EIS method seems to be very promising for the detection of Hg2+ ions because of its ability to obtain a single spectrum very quickly—within 1 s. In addition, compared to other electrochemical techniques (e.g., fixed potential chronoamperometry), electrochemical impedance spectroscopy has several useful features, including the ability to perform a non-destructive measurement and the ability to distinguish the electrochemical parameter of interest (in this paper the charge transfer resistance) from other processes (e.g., diffusion) that affect the electrochemical signal [52,53]. In summary, the impedimetric detection of Hg2+ ions is significantly faster than the amperometric technique, which requires approximately 20 min to detect the Hg2+-induced increase in the cathodic current (Figure 3).
The glass|FTO|PB|Cat electrode, as well as other enzyme inhibition-based biosensors, may be affected by the presence of other catalase-inhibiting compounds in the sample being analyzed. Previous studies [54,55,56] have shown that some pesticides and the ions of other heavy metals (e.g., Zn, Pb, Cd, Cu and Cr) can also reduce the activity of catalase. However, a previous study [54] indicated that Hg2+ ions inhibited catalase 1.5 to 3 times more efficiently than some other heavy metal ions (e.g., Zn, Cr, Cd and Pb) when the concentration of these ions varied from 10 mg mL−1 to 40 mg mL−1. Therefore, the glass|FTO|PB|Cat biosensor should be more sensitive to Hg2+ than to Zn, Cr, Cd or Pb ions. However, to ensure the high reliability of Hg2+ ion analysis with the glass|FTO|PB|Cat biosensor, a qualitative analysis of other heavy metal ions should also be performed.

4. Conclusions

In this study it was demonstrated that the glass|FTO|PB|Cat-based biosensor can be used to measure Hg2+ ions concentration in a buffer solution and in tap water. An application of PB in the composition of the Hg2+ ion biosensor enabled the use of a comparatively low potential of +0.2 V for the operation of the biosensor, reducing the probability of interfering oxidation reactions from other electrochemically-active substances which might be present in the analyzed sample (e.g., alkylphenols and sulfite ions) [44,45]. Furthermore, the Hg2+ ion biosensor constructed in this study showed that the chronoamperometric response decreased only about 10% during the first 2 weeks. This indicates a sufficient stability of the biosensor over time.
Chronoamperometry and FFT-EIS studies of the glass|FTO|PB|Cat-based biosensor in a Hg2+ ion-containing PBS enabled linear ranges of 0.07 mM–3 mM and 0.13 mM–0.80 mM of Hg2+ ions with a sensitivity of 15 µA cm−2 mM−1 and 11.3 kΩ mM−1, respectively. In addition, the FFT-EIS technique allowed a very fast (within 1 s) measurement of the Hg2+ ion concentration. Considering that the Hg2+ ion biosensor developed in this study does not require expensive materials (e.g., metal nanoparticles) for its preparation, has a simple structure and is suitable for performing a very rapid analysis of Hg2+ ions, the glass|FTO|PB|Cat electrode-basedHg2+ ion biosensor seems to be a promising technique for determining the Hg2+ ion concentration in environmental samples, e.g., water or extracts from soil and sediments.

Author Contributions

Conceptualization, P.V. and A.V.; methodology, P.V. and N.D.; validation, P.V., N.D. and A.V.; formal analysis, P.V.; investigation, N.D.; resources, A.V.; data curation, A.V.; writing—original draft preparation, N.D., P.V. and A.V.; writing—review and editing, P.V. and A.V.; visualization, N.D.; supervision, A.V. All authors have read and agreed to the published version of the manuscript.

Funding

This research received no external funding.

Institutional Review Board Statement

Not applicable.

Informed Consent Statement

Not applicable.

Data Availability Statement

The data presented in this study are available on request from the corresponding author.

Conflicts of Interest

The authors declare there are no conflict of interest.

References

  1. Bernhoft, R.A. Mercury Toxicity and Treatment: A Review of the Literature. J. Environ. Public Health 2012, 2012, 460508. [Google Scholar] [CrossRef]
  2. Berlin, M.; Jerksell, L.G.; von Ubisch, H. Uptake and Retention of Mercury in the Mouse Brain. Arch. Environ. Health Int. J. 1966, 12, 33–42. [Google Scholar] [CrossRef] [PubMed]
  3. Berlin, M.; Fazackerley, J.; Nordberg, G.; Kand, M. The Uptake of Mercury in the Brains of Mammals Exposed to Mercury Vapor and to Mercuric Salts. Arch. Environ. Health Int. J. 1969, 18, 719–729. [Google Scholar] [CrossRef] [PubMed]
  4. Kosta, L.; Byrne, A.R.; Zelenko, V. Correlation between selenium and mercury in man following exposure to inorganic mercury. Nature 1975, 254, 238–239. [Google Scholar] [CrossRef] [PubMed]
  5. Pendergrass, J.C.; Haley, B.E.; Vimy, M.J.; Winfield, S.A.; Lorscheider, F.L. Mercury vapor inhalation inhibits binding of GTP to tubulin in rat brain: Similarity to a molecular lesion in Alzheimer diseased brain. Neurotoxicology 1997, 18, 315–324. [Google Scholar]
  6. Clifton, J.C. Mercury Exposure and Public Health. Pediatr. Clin. N. Am. 2007, 54, 237.e1–237.e45. [Google Scholar] [CrossRef]
  7. Tinkov, A.A.; Ajsuvakova, O.; Skalnaya, M.; Popova, E.; Sinitskii, A.; Nemereshina, O.; Gatiatulina, E.; Nikonorov, A.; Skalny, A.V. Mercury and metabolic syndrome: A review of experimental and clinical observations. Biometals 2015, 28, 231–254. [Google Scholar] [CrossRef]
  8. Chen, L.; Zhang, J.; Zhu, Y.; Zhang, Y. Molecular interaction of inorganic mercury(ii) with catalase: A spectroscopic study in combination with molecular docking. RSC Adv. 2015, 5, 79874–79881. [Google Scholar] [CrossRef]
  9. Maghsoudi, A.S.; Hassani, S.; Mirnia, K.; Abdollahi, M. Recent Advances in Nanotechnology-Based Biosensors Development for Detection of Arsenic, Lead, Mercury, and Cadmium. Int. J. Nanomed. 2021, 16, 803–832. [Google Scholar] [CrossRef]
  10. Gworek, B.; Dmuchowski, W.; Baczewska-Dąbrowska, A.H. Mercury in the terrestrial environment: A review. Environ. Sci. Eur. 2020, 32, 128. [Google Scholar] [CrossRef]
  11. Gray, J.E.; Theodorakos, P.M.; Fey, D.L.; Krabbenhoft, D.P. Mercury concentrations and distribution in soil, water, mine waste leachates, and air in and around mercury mines in the Big Bend region, Texas, USA. Environ. Geochem. Health 2015, 37, 35–48. [Google Scholar] [CrossRef] [PubMed]
  12. Bernaus, A.; Gaona, X.; van Ree, D.; Valiente, M. Determination of mercury in polluted soils surrounding a chlor-alkali plant: Direct speciation by X-ray absorption spectroscopy techniques and preliminary geochemical characterisation of the area. Anal. Chim. Acta 2006, 565, 73–80. [Google Scholar] [CrossRef]
  13. Hylander, L.D.; Meili, M. 500 years of mercury production: Global annual inventory by region until 2000 and associated emissions. Sci. Total Environ. 2003, 304, 13–27. [Google Scholar] [CrossRef] [PubMed]
  14. Higueras, P.; Oyarzun, R.; Biester, H.; Lillo, J.; Lorenzo, S. A first insight into mercury distribution and speciation in soils from the Almadén mining district, Spain. J. Geochem. Explor. 2003, 80, 95–104. [Google Scholar] [CrossRef]
  15. Ullrich, S.M.; Ilyushchenko, M.A.; Kamberov, I.M.; Tanton, T.W. Mercury contamination in the vicinity of a derelict chlor-alkali plant. Part I: Sediment and water contamination of Lake Balkyldak and the River Irtysh. Sci. Total Environ. 2007, 381, 1–16. [Google Scholar] [CrossRef]
  16. Geng, W.; Nakajima, T.; Takanashi, H.; Ohki, A. Determination of mercury in ash and soil samples by oxygen flask combustion method–Cold vapor atomic fluorescence spectrometry (CVAFS). J. Hazard. Mater. 2008, 154, 325–330. [Google Scholar] [CrossRef]
  17. Pourreza, N.; Ghanemi, K. Determination of mercury in water and fish samples by cold vapor atomic absorption spectrometry after solid phase extraction on agar modified with 2-mercaptobenzimidazole. J. Hazard. Mater. 2009, 161, 982–987. [Google Scholar] [CrossRef]
  18. Voegborlo, R.; Akagi, H. Determination of mercury in fish by cold vapour atomic absorption spectrometry using an automatic mercury analyzer. Food Chem. 2007, 100, 853–858. [Google Scholar] [CrossRef]
  19. Fernández, Z.H.; Rojas, L.A.V.; Álvarez, A.M.; Álvarez, J.R.E.; dos Santos, J.A.; González, I.P.; González, M.R.; Macias, N.A.; Sánchez, D.L.; Torres, D.H. Application of Cold Vapor-Atomic Absorption (CVAAS) Spectrophotometry and Inductively Coupled Plasma-Atomic Emission Spectrometry methods for cadmium, mercury and lead analyses of fish samples. Validation of the method of CVAAS. Food Control 2015, 48, 37–42. [Google Scholar] [CrossRef]
  20. Zheng, C.; Li, Y.; He, Y.; Ma, Q.; Hou, X. Photo-induced chemical vapor generation with formic acid for ultrasensitive atomic fluorescence spectrometric determination of mercury: Potential application to mercury speciation in water. J. Anal. At. Spectrom. 2005, 20, 746–750. [Google Scholar] [CrossRef]
  21. Allibone, J.; Fatemian, E.; Walker, P.J. Determination of mercury in potable water by ICP-MS using gold as a stabilising agent. J. Anal. At. Spectrom. 1999, 14, 235–239. [Google Scholar] [CrossRef]
  22. Baxter, D.C.; Frech, W. Determination of mercury by atomic absorption spectrometry using a platinum-lined graphite furnace for in situ preconcentration. Anal. Chim. Acta 1989, 225, 175–183. [Google Scholar] [CrossRef]
  23. Okamoto, Y.; Kumamaru, T.; Hara, S.; Matsuo, H.; Kiboku, M. Determination of Mercury by Graphite Furnace Atomic Absorption Spectrometry after Ion-Pair Extraction with Zephiramine in Small Scale. Bull. Chem. Soc. Jpn. 1987, 60, 3053–3055. [Google Scholar] [CrossRef]
  24. Zeiner, M.; Rezić, I.; Steffan, I. Analytical Methods for the Determination of Heavy Metals in the Textile Industry, Kemija u Industriji. Časopis Kemičara Kem. Inženjera Hrvat. 2007, 56, 587–595. [Google Scholar]
  25. Nuttall, K.L.; Gordon, W.H.; Ash, K.O. Inductively coupled plasma mass spectrometry for trace element analysis in the clinical laboratory. Ann. Clin. Lab. Sci. 1995, 25, 264–271. [Google Scholar]
  26. Malhotra, B.D.; Ali, A. Nanomaterials in Biosensors: Fundamentals and Applications; Elsevier: Amsterdam, The Netherlands, 2018; pp. 1–74. [Google Scholar] [CrossRef]
  27. Domínguez-Renedo, O.; Alonso-Lomillo, M.; Ferreira-Gonçalves, L.; Arcos-Martínez, M. Development of urease based amperometric biosensors for the inhibitive determination of Hg (II). Talanta 2009, 79, 1306–1310. [Google Scholar] [CrossRef]
  28. Ayenimo, J.G.; Adeloju, S.B. Rapid amperometric detection of trace metals by inhibition of an ultrathin polypyrrole-based glucose biosensor. Talanta 2016, 148, 502–510. [Google Scholar] [CrossRef]
  29. Zhang, Y.; Zhang, C.; Ma, R.; Du, X.; Dong, W.; Chen, Y.; Chen, Q. An ultra-sensitive Au nanoparticles functionalized DNA biosensor for electrochemical sensing of mercury ions. Mater. Sci. Eng. C 2017, 75, 175–181. [Google Scholar] [CrossRef]
  30. Elsebai, B.; Ghica, M.E.; Abbas, M.N.; Brett, C.M. Catalase based hydrogen peroxide biosensor for mercury determination by inhibition measurements. J. Hazard. Mater. 2017, 340, 344–350. [Google Scholar] [CrossRef]
  31. Guascito, M.R.; Malitesta, C.; Mazzotta, E.; Turco, A. Inhibitive determination of metal ions by an amperometric glucose oxidase biosensor: Study of the effect of hydrogen peroxide decomposition. Sens. Actuators B Chem. 2008, 131, 394–402. [Google Scholar] [CrossRef]
  32. Kuralay, F.; Özyörük, H.; Yıldız, A. Inhibitive determination of Hg2+ ion by an amperometric urea biosensor using poly(vinylferrocenium) film. Enzym. Microb. Technol. 2007, 40, 1156–1159. [Google Scholar] [CrossRef]
  33. Mohammadi, H.; Amine, A.; Cosnier, S.; Mousty, C. Mercury–enzyme inhibition assays with an amperometric sucrose biosensor based on a trienzymatic-clay matrix. Anal. Chim. Acta 2005, 543, 143–149. [Google Scholar] [CrossRef]
  34. Tan, I.; Erhan, E.; Karagöz, P.; Özkan, M. Determination of mercury and nickel by amperometric biosensor prepared with thermostable lactate dehydrogenase. Trans. Nonferrous Met. Soc. China 2011, 21, 2332–2338. [Google Scholar] [CrossRef]
  35. Liu, J.-X.; Xu, X.-M.; Tang, L.; Zeng, G.-M. Determination of trace mercury in compost extract by inhibition based glucose oxidase biosensor. Trans. Nonferrous Met. Soc. China 2009, 19, 235–240. [Google Scholar] [CrossRef]
  36. Popkirov, G.S.; Schindler, R.N. A new impedance spectrometer for the investigation of electrochemical systems. Rev. Sci. Instrum. 1992, 63, 5366–5372. [Google Scholar] [CrossRef]
  37. Gabriunaite, I.; Valiūnienė, A.; Valincius, G. Formation and properties of phospholipid bilayers on fluorine doped tin oxide electrodes. Electrochim. Acta 2018, 283, 1351–1358. [Google Scholar] [CrossRef]
  38. Valiūnienė, A.; Kavaliauskaitė, G.; Virbickas, P.; Ramanavičius, A. Prussian blue based impedimetric urea biosensor. J. Electroanal. Chem. 2021, 895, 115473. [Google Scholar] [CrossRef]
  39. Valiūnienė, A.; Virbickas, P.; Medvikytė, G.; Ramanavičius, A. Urea Biosensor Based on Electrochromic Properties of Prussian Blue. Electroanalysis 2020, 32, 503–509. [Google Scholar] [CrossRef]
  40. Noël, J.-M.; Médard, J.; Combellas, C.; Kanoufi, F. Prussian Blue Degradation during Hydrogen Peroxide Reduction: A Scanning Electrochemical Microscopy Study on the Role of the Hydroxide Ion and Hydroxyl Radical. Chemelectrochem 2016, 3, 1178–1184. [Google Scholar] [CrossRef]
  41. Alfonso-Prieto, M.; Biarnés, X.; Vidossich, P.; Rovira, C. The Molecular Mechanism of the Catalase Reaction. J. Am. Chem. Soc. 2009, 131, 11751–11761. [Google Scholar] [CrossRef]
  42. Hermes, M.; Scholz, F. The electrochemical determination of ammonium based on the selective inhibition of the low-spin iron(II)/(III) system of Prussian blue. J. Solid State Electrochem. 1997, 1, 215–220. [Google Scholar] [CrossRef]
  43. Virbickas, P.; Valiūnienė, A.; Kavaliauskaitė, G.; Ramanavicius, A. Prussian White-Based Optical Glucose Biosensor. J. Electro-Chem. Soc. 2019, 166, B927–B932. [Google Scholar] [CrossRef]
  44. Chmayssem, A.; Hauchard, D. New Detection Method for Alkylphenol Traces in Water Based on an Integrated Electrochemical Cell Sensor. J. Water Sci. 2015, 28, 35–40. [Google Scholar] [CrossRef]
  45. Novgorodtseva, O.N.; Zelinsky, A. Effects of solution pH on sulfite oxidation at a gold electrode. J. Solid State Electrochem. 2019, 23, 2301–2306. [Google Scholar] [CrossRef]
  46. Ayenimo, J.G.; Adeloju, S.B. Inhibitive potentiometric detection of trace metals with ultrathin polypyrrole glucose oxidase biosensor. Talanta 2015, 137, 62–70. [Google Scholar] [CrossRef] [PubMed]
  47. Yu, J.; Guan, H.; Chi, D. An amperometric glucose oxidase biosensor based on liposome microreactor-chitosan nanocompo-site-modified electrode for determination of trace mercury. J. Solid State Electrochem. 2017, 21, 1175–1183. [Google Scholar] [CrossRef]
  48. Virbickas, P.; Ziziunaite, G.; Ramanavicius, A.; Valiūnienė, A. Prussian Blue Modified Amperometric Hg2+ Ion Biosensor Based on Glucose Oxidase Inhibition. Electroanalysis 2022, 35, e202200230. [Google Scholar] [CrossRef]
  49. Ashrafi, A.M.; Sýs, M.; Sedláčková, E.; Farag, A.S.; Adam, V.; Přibyl, J.; Richtera, L. Application of the Enzymatic Electrochemical Biosensors for Monitoring Non-Competitive Inhibition of Enzyme Activity by Heavy Metals. Sensors 2019, 19, 2939. [Google Scholar] [CrossRef]
  50. Website of the Department of Statistics and Data Science of Yale University. Chi-Square Goodness of Fit Test. Available online: http://www.stat.yale.edu/Courses/1997-98/101/chigf.htm (accessed on 27 April 2023).
  51. Virbickas, P.; Valiūnienė, A.; Baryševa, D.; Popkirov, G.; Ramanavičius, A. Determination of cyanide concentration by chronoamperometry, cyclic voltammetry and fast Fourier transform electrochemical impedance spectroscopy. J. Electroanal. Chem. 2021, 895, 115449. [Google Scholar] [CrossRef]
  52. Magar, H.S.; Hassan, R.Y.A.; Mulchandani, A. Electrochemical Impedance Spectroscopy (EIS): Principles, Construction, and Biosensing Applications. Sensors 2021, 21, 6578. [Google Scholar] [CrossRef]
  53. Li, S.; Zhou, Q.; Cong, H. Electrochemical Techniques, Impedance, and Spectroscopy. In Handbook of Advanced Non-Destructive Evaluation; Springer: Berlin/Heidelberg, Germany, 2018; pp. 1–27. [Google Scholar] [CrossRef]
  54. Singh, S.M.; Sivalingam, P.M. In vitro study on the interactive effects of heavy metals on catalase activity of Sarotherodon mossambicus (Peters). J. Fish Biol. 1982, 20, 683–688. [Google Scholar] [CrossRef]
  55. Yeboah, J.O.; Shi, G.; Shi, W. Effect of Heavy Metal Contamination on Soil Enzymes Activities. J. Geosci. Environ. Prot. 2021, 9, 135–154. [Google Scholar] [CrossRef]
  56. Karadag, H.; Ozhan, F. Effect of cyprodinil and fludioxonil pesticides on bovine liver catalase activity. Biotechnol. Biotechnol. Equip. 2015, 29, 40–44. [Google Scholar] [CrossRef] [PubMed]
Figure 1. Optical microscope images (zoomed in 40 times) of the PB-coated glass|FTO plate (A) before immobilization of catalase with glutaraldehyde and (B) after immobilization of catalase with glutaraldehyde.
Chemosensors 11 00311 g001
Figure 2. Chronoamperograms of the glass|FTO|PB electrode in the PBS measured at +0.2 V (black curve) and at +0.1 V (gray curve) vs. the Ag|AgCl, KClsat reference electrode.
Chemosensors 11 00311 g002
Figure 3. (A) An amperometric investigation of the biosensor based on the glass|FTO|PB|Cat electrode at 0.2 V potential vs. Ag|AgCl, KClsat in PBS (pH 7), with the addition of 0.3 mM H2O2 and varying amounts of Hg2+ ions. Symbols “H2O2” and “Hg2+” indicate the time of adding these compounds to PBS. t—time (s), i—current density (μA cm−2). (B) The linear dependence of the Hg2+-induced increase in the cathodic current on the concentration of Hg2+ ions (c (Hg2+)) in PBS.
Chemosensors 11 00311 g003
Figure 4. (A) The amperometric investigation of the Hg2+ biosensor based on the glass|FTO|PB|Cat electrode at 0.2 V potential vs. Ag|AgCl, KClsat in tap water, with the addition of 0.3 mM H2O2 and varying amounts of Hg2+ ions. The symbol “Hg2+” indicates the time of addition of Hg2+ to tap water. t—time (s), i—current density (μA cm−2). (B) The linear dependence of the Hg2+-induced increase in the cathodic current on the concentration of Hg2+ ions (c (Hg2+)) in tap water.
Chemosensors 11 00311 g004
Figure 5. FFT-EIS spectra of the Hg2+ ion biosensor based on the glass|FTO|PB|Cat electrode at 0.2 V potential vs. Ag|AgCl, KClsat in PBS (pH 7), with the addition of 0.3 mM H2O2 and varying amounts of Hg2+ ions (from 0.13 mM to 0.8 mM).
Chemosensors 11 00311 g005
Figure 6. Dependence of the Hg2+ ions-caused decrement in the charge transfer resistance (ΔRct) on the concentration of Hg2+ ions (c−1 (Hg2+)).
Chemosensors 11 00311 g006
Table 1. Linear range, stability, sensitivity and storage conditions of the electrochemical-enzyme inhibition-based Hg2+ ion biosensors.
BiosensorLinear Range, MSensitivityStabilityStoring ConditionsReference
Pt/PPy-GOx2.5 × 10−8–5 × 10−67.46 mV mM−1>90% initial sensitivity after 8 consecutive measurements In PBS [46]
(CS/GLM)8-GCE5 × 10−7–5 × 10⁻⁶-85% initial sensitivity after 72 hAt room temperature under dry conditions[47]
Ultrathin Ppy|GOx4.8 × 10−7–3.3 × 10−64.0 µA cm−2 µM−140% initial sensitivity after 3 weeks-[28]
GCE|Cat5 × 10−11–5 × 10−100.44 inhibition% nM−140% initial sensitivity after 3 weeks (3 measurements)-[30]
Glass|FTO|PB|GOx2.7 × 10−5–2.5 × 10−40.164 inhibition% µM−172% initial sensitivity after one measurement-[48]
GCE/MWCNTs-RuO2/GOx/Nafion®®5 × 10−6–8 × 10−55 µA−1 mM−1--[49]
Pt|PPD|Gox5 × 10−6–1.8 × 10−40.067 µA−1 µM−160% initial sensitivity after 24 hIn PBS[31]
Glass|FTO|PB|Cat7 × 10−5–3 × 10−315 µA cm−2 mM−190% initial sensitivity after 2 weeksIn a refrigerator (t = 4 ± 1 °C) under dry conditionsThis study
Table 2. Variation of the biosensor based on the glass|FTO|PB|Cat electrode sensitivity to Hg2+ ions over time.
Days after Production of the BiosensorSensitivity, µA cm−2 mM−1R2
Freshly prepared15.010.992
1 13.780.998
14 13.330.993
21 10.160.991
28 10.090.989
35 9.060.991
56 8.020.998
70 4.590.990
Table 3. Electrochemical parameters obtained by fitting the FFT-EIS data (Figure 5) to the equivalent circuit model (Figure 5, inset).
Solution CompositionRs, Ω cm2CPE, μF cm−2n (CPE)Rct, kΩ cm2
PBS (pH 7)219.29.450.92960
PBS + 0.3 µM H2O2209.69.640.92576
PBS + 0.3 µM H2O2 + 0.13 mM HgCl2195.89.920.9280.3
PBS + 0.3 µM H2O2 + 0.27 mM HgCl2181.59.700.9231
PBS + 0.3 µM H2O2 + 0.53 mM HgCl2178.210.030.9215.7
PBS + 0.3 µM H2O2 + 0.67 mM HgCl2177.911.20.9111.4
PBS + 0.3 µM H2O2 + 0.80 mM HgCl2176.311.10.919.1
Disclaimer/Publisher’s Note: The statements, opinions and data contained in all publications are solely those of the individual author(s) and contributor(s) and not of MDPI and/or the editor(s). MDPI and/or the editor(s) disclaim responsibility for any injury to people or property resulting from any ideas, methods, instructions or products referred to in the content.

