
Quantitative Structure-Activity Relationship of Fluorescent Probes and Their Intracellular Localizations

1
Department of Chemistry, Pohang University of Science and Technology (POSTECH), Pohang 37673, Republic of Korea
2
Department of Chemistry, Hannam University, Daejeon 34054, Republic of Korea
*
Authors to whom correspondence should be addressed.
†
These authors have contributed equally to this work.
Chemosensors 2023, 11(5), 310; https://doi.org/10.3390/chemosensors11050310
Submission received: 24 March 2023
/
Revised: 12 May 2023
/
Accepted: 17 May 2023
/
Published: 22 May 2023
(This article belongs to the Special Issue A Theme Issue in Honor of Dr. Richard Horobin—Cell or Organelle Selective Fluorescent Probes: Their Design, Mechanism, Modeling and Application)
Abstract
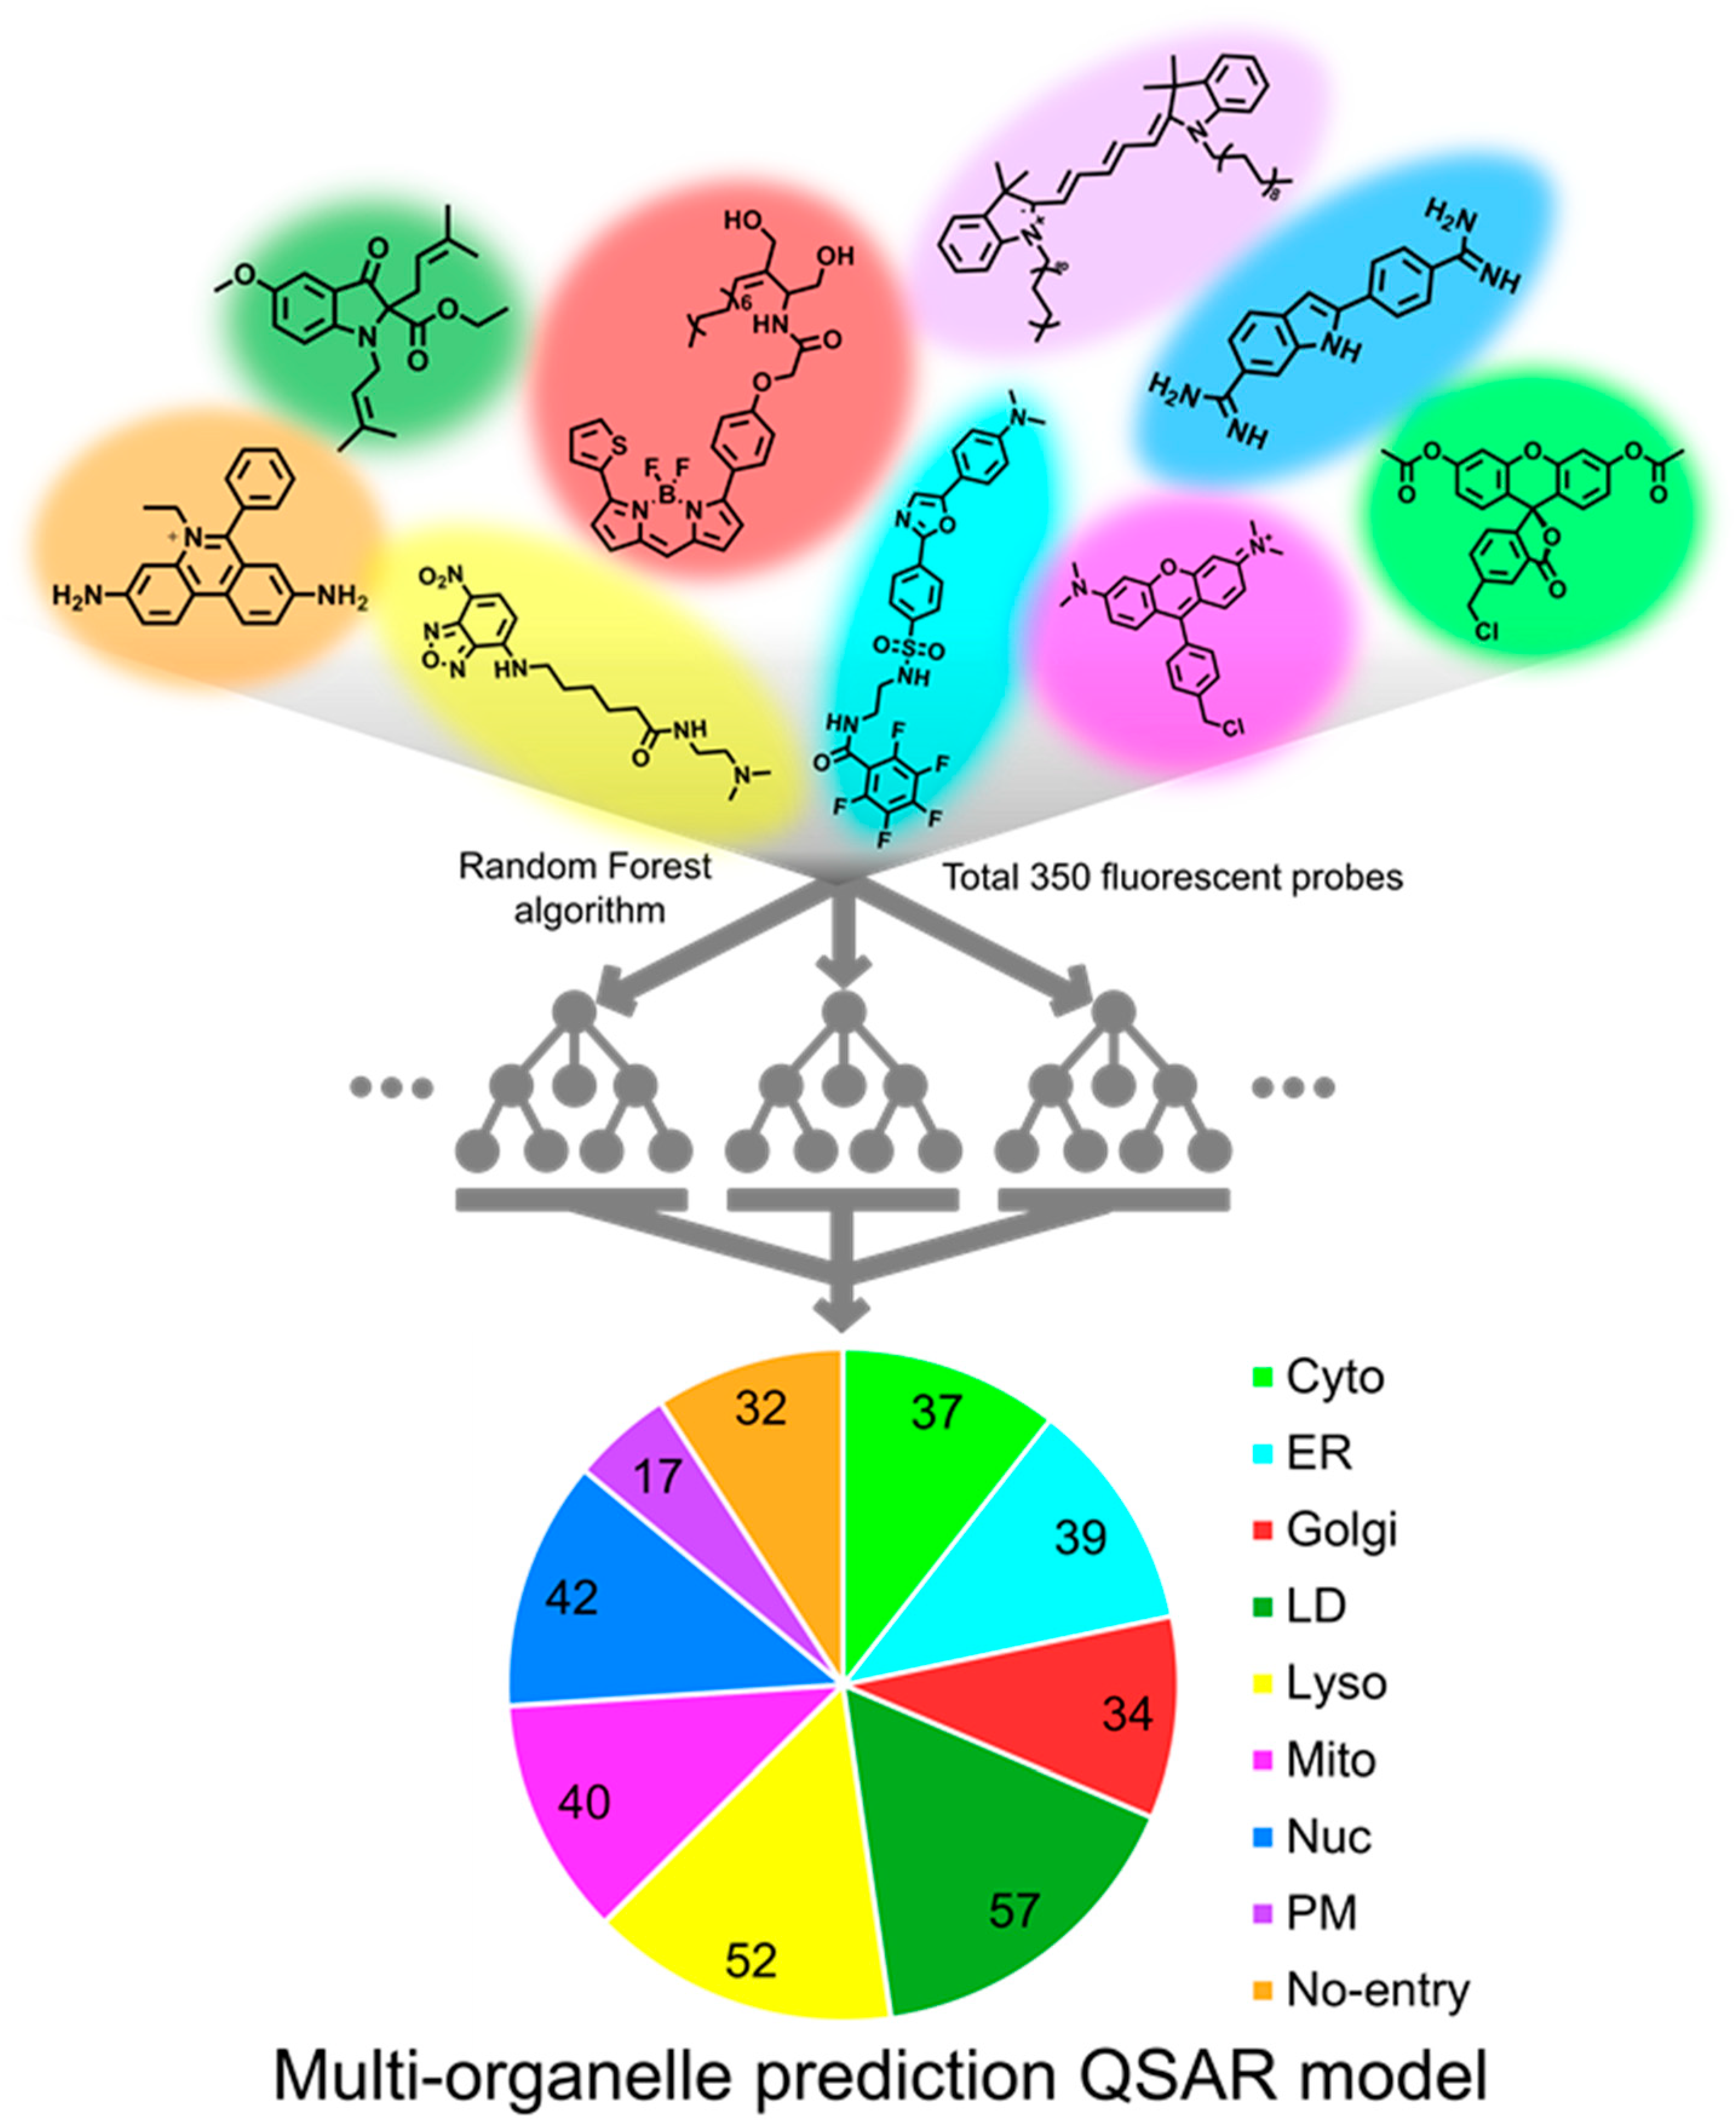
:The development of organelle-specific fluorescent probes has been impeded by the absence of a comprehensive understanding of the relationship between the physicochemical properties of fluorescent probes and their selectivity towards specific organelles. Although a few machine learning models have suggested several physicochemical parameters that control the target organelle of the probes and have attempted to predict the target organelles, they have been challenged by low accuracy and a limited range of applicable organelles. Herein, we report a multi-organelle prediction QSAR model that is capable of predicting the destination of probes among nine categories, including cytosol, endoplasmic reticulum, Golgi body, lipid droplet, lysosome, mitochondria, nucleus, plasma membrane, and no entry. The model is trained using the Random Forest algorithm with a dataset of 350 organelle-specific fluorescent probes and 786 descriptors, and it is able to predict the target organelles of fluorescent probes with an accuracy of 75%. The MDI analysis of the model identifies 38 key parameters that have a significant impact on the organelle selectivity of the probes, including LogD, pKa, hydrophilic-lipophilic balance (HLB), and topological polar surface area (TPSA). This prediction model may be useful in developing new organelle-specific fluorescent probes by providing crucial variables that determine the destination of the probes.
1. Introduction
Organelle-specific fluorescent probes that target lysosomes, endoplasmic reticulum (ER), Golgi bodies, mitochondria, nucleus, and plasma membranes have been an area of interest in chemical biology owing to their versatility in numerous applications, including the visualization of specific organelles, estimation of organelle activities and identification of intracellular dysfunctions [1,2,3,4,5,6,7,8]. However, the development of organelle-specific probes has been challenged by the lack of a systematic understanding of the organelle-specific staining mechanism. Despite the fact that some physicochemical properties that affect organelle-specific staining have been revealed, the individual properties are not sufficient to explain the organelle selectivity of the probes [9,10,11,12,13]. This is because numerous physicochemical parameters have complex relations with the staining process. Therefore, a systematic method that correlates a number of physicochemical parameters of probes to their target organelles is required to provide a comprehensive understanding of the organelle-specific staining mechanism and facilitate the development of novel organelle-specific probes.
Quantitative Structure-Activity Relationships (QSAR) have been employed in many area to develop mathematical models that predict the behavior of chemicals in biological systems based on their structure and properties [14,15,16,17]. In drug discovery, QSAR models have been generated to predict the activity of new drugs, using only the structure and biological effects of the drugs, even in the absence of information about their biological targets [18,19,20]. Similarly, QSAR can be utilized to develop models that predict the target organelles of new fluorescent molecules. The pioneering works on the organelle selectivity QSAR, reported by R. Horobin and colleagues, utilized the Simplest Chinese Box (SCB) algorithm to make prediction models and found a number of physicochemical parameters that control the entry and retention of probes into certain organelles [9,10,11,12,13,21,22,23,24,25,26]. However, when these parameters were applied to construct a multi-organelle prediction model using a decision tree algorithm, the model provided a low prediction accuracy for certain organelles (41% for lysosome and 45% for cytosol) [27].
We conjectured that the accuracy of the multi-organelle prediction QSAR model could be improved by using a larger dataset of probes and descriptors, coupled with advanced machine learning algorithms. We, therefore, collected the largest dataset ever reported, consisting of 350 organelle-specific fluorescent probes. Additionally, 786 descriptors were generated to classify the probes into nine categories, including eight targeting organelles: cytosol (Cyto), endoplasmic reticulum (ER), Golgi body (Golgi), lipid droplet (LD), lysosome (Lyso), mitochondria (Mito), nucleus (Nuc), and plasma membrane (PM), as well as a category for no entry. Furthermore, we opted to employ the Random Forest algorithm, as it has the advantage of mitigating overfitting issues that frequently arise in multi-class problems.
Herein, we report a multi-organelle prediction QSAR model capable of predicting the target organelles of fluorescent probes with an accuracy of 75%. Mean Decrease Impurity (MDI) analysis of the model identifies 38 key parameters, including logD, pKa, number of rotatable bonds, oxygen and fluorine atoms, hydrophilic-lipophilic balance (HLB), and topological polar surface area (TPSA), that are responsible for the organelle selectivity of the probes. The information obtained by the predictive model can help in understanding the organelle-targeting mechanism of chemical probes and may be useful in developing new organelle-specific fluorescent probes.
2. Materials and Methods
2.1. Dataset
The data set used for this study is based on a list of reported organelle-specific fluorescent probes for which experimental data were available and sufficiently documented; cytosol [27], ER [23,28], Golgi complex [29], LD [27], lysosome [24,27], mitochondria [21,23,30], nucleus [24,31], plasma membrane [32], and no entry [21,27,28]. A total of 350 organelle-specific fluorescent probes were collected by the following criteria; probes for fixed cell staining were excluded, but only probes for live cell staining were collected. Probes containing metal atoms or probes that stain more than one organelle were excluded to simplify the calculation. Similar number of probes for each organelle were collected to make a balanced dataset. The complete list of 350 probes and the references is attached in the supplementary information.
2.2. Descriptors
Descriptors are features derived from a chemical structure, e.g., hydrophobicity and pKa. The (de)protonation form of 2D molecular structure for each probe was determined at pH 7.4 by using the major microspecies calculator plugin of the Marvin program (Chemaxon). It used JChem (Chemaxon) to calculate 26 descriptors, including LogD at pH 7.4, Chemaxon HLB, and the Strongest basic pKa1. It also used topomol module from PreADMET program (BMDRC) to calculate 760 descriptors, which included constitutional, topological, geometrical, and CATS descriptors. Random Forest methods were generated using the corresponding scikit-learn modules, a machine-learning library for Python. Microsoft Excel was used to handle and visualize data. A full list and short explanations are provided in the supporting information.
2.3. Machine Learning Techniques
In 2001, Breimann introduced the principle of random forests (RFs), extending the Decision Tree Induction (DTI) principle by using not only one but multiple unpruned trees with randomly selected feature sets [33]. Our dataset, consisting of 350 compounds with 786 descriptors, is high-dimensional and thought to contain multiple mechanisms of localizations. DTI is well suited to classifying such data, but can have a low accuracy [34]. Therefore, we opted to employ the Random Forest, an ensemble-based learning algorithm. Random Forest method was generated using scikit-learn program [35].
3. Results and Discussion
Among 350 fluorescent probes, 280 probes were used to train the model (train set), and the remaining 70 probes were used to validate the accuracy of the model (test set). A total of 100 models were prepared by creating 10 Random Forest models from each of 10 random groups consisting of arbitrarily selected 280 probes. The accuracy of models converged to 100% when the value of maximum depth and the number of estimators reached 8 and 300, respectively. Under the conditions, the prediction accuracy of the test set reached 75% (Figure 1 and Figure S1a).
From the MDI analysis of the 10 random groups, the top 30 descriptors were identified from each group. Among these, 38 descriptors were commonly identified in at least three of the random groups (Table 1).
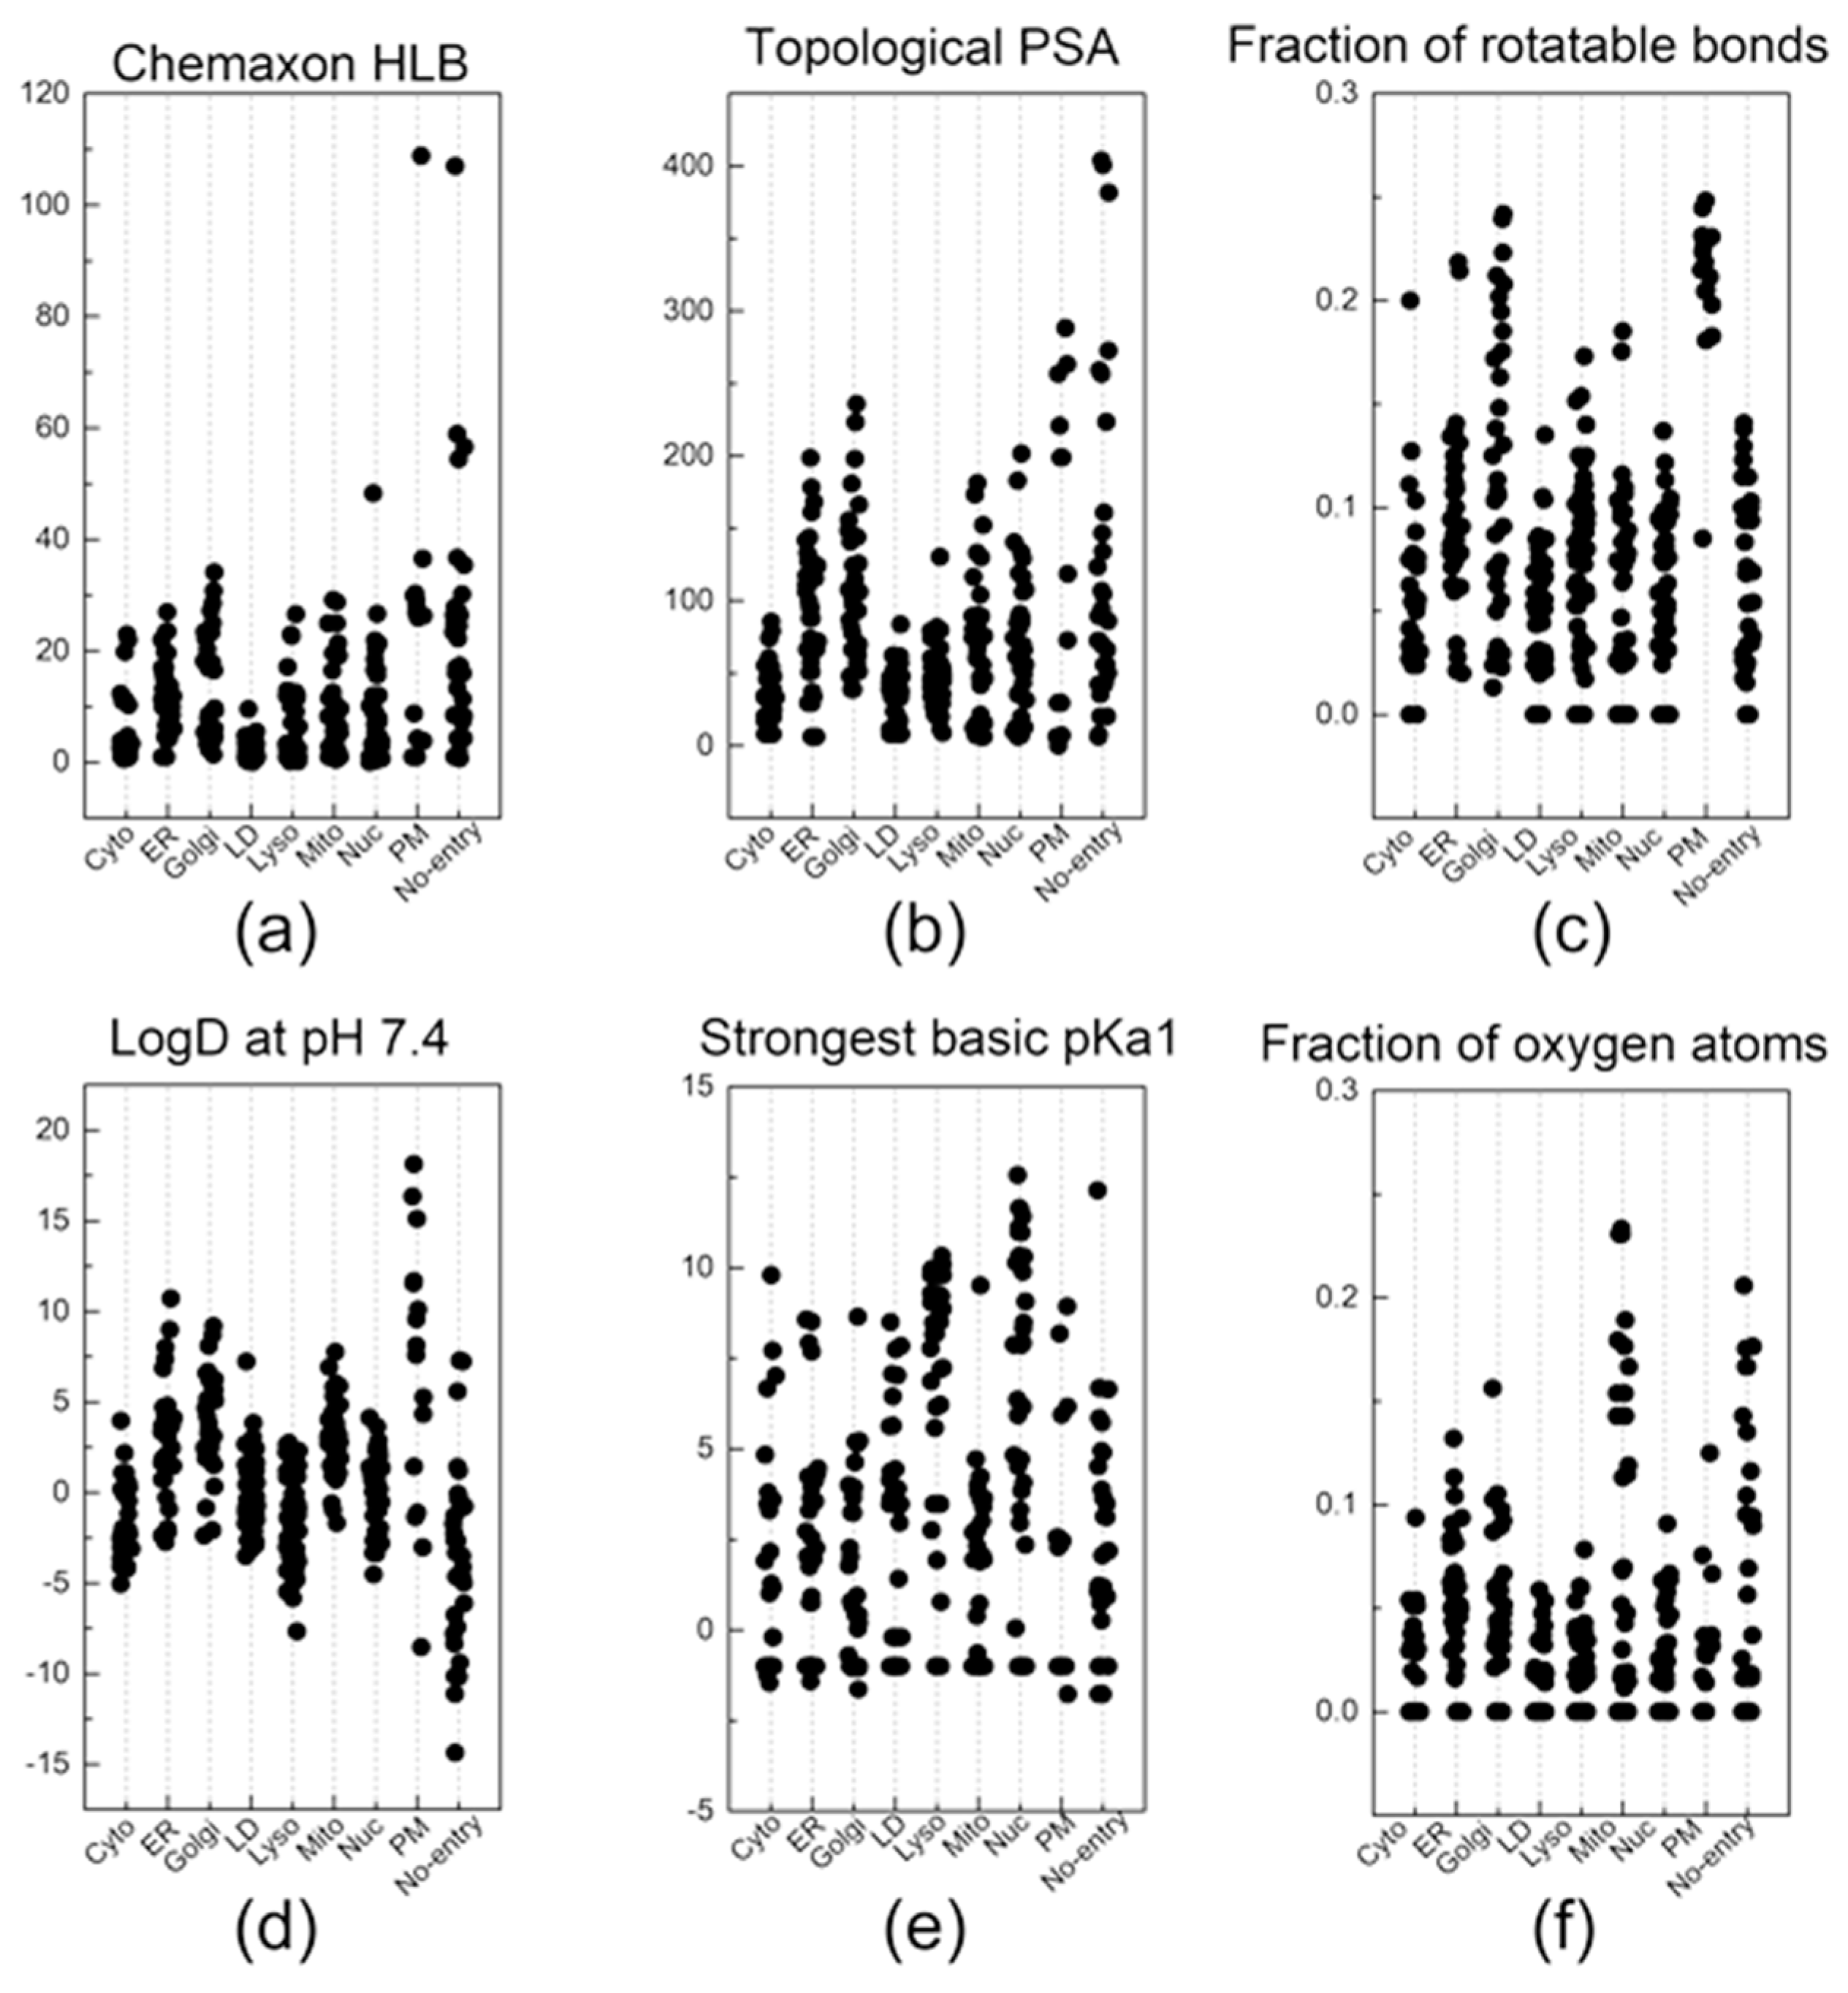
These 38 descriptors were considered to be the most dominant parameters contributing to the overall accuracy of the model since the accuracy of model reached 70% when only these 38 descriptors were parameterized in the calculation. Each descriptor exhibited distinctive patterns for the probes designed for different organelles, suggesting that there are specific features that are closely involved in the staining of different organelles (Figure 2). Interestingly, some of those 38 descriptors were found to represent the similar information. For example, both (topological PSA) and (2D VSA polar) represent the polar surface area within a molecule (Figure 3b and Figure S2r). Additionally, (CATS Pos Pos 00), (number of positive chargeable groups), and (number of positive charged groups) show similar trends as they commonly indicate the positive charge within a molecule (Figure 4e and Figure S3a,b). Moreover, the patterns of (fraction of rotatable bonds) and (fraction of rigid bonds) are opposite to each other as they describe the same information in a reverse manner (Figure 3c and Figure S2q). We have found that these overlapping descriptors are necessary to ensure the accuracy of the model, despite offering almost identical information.
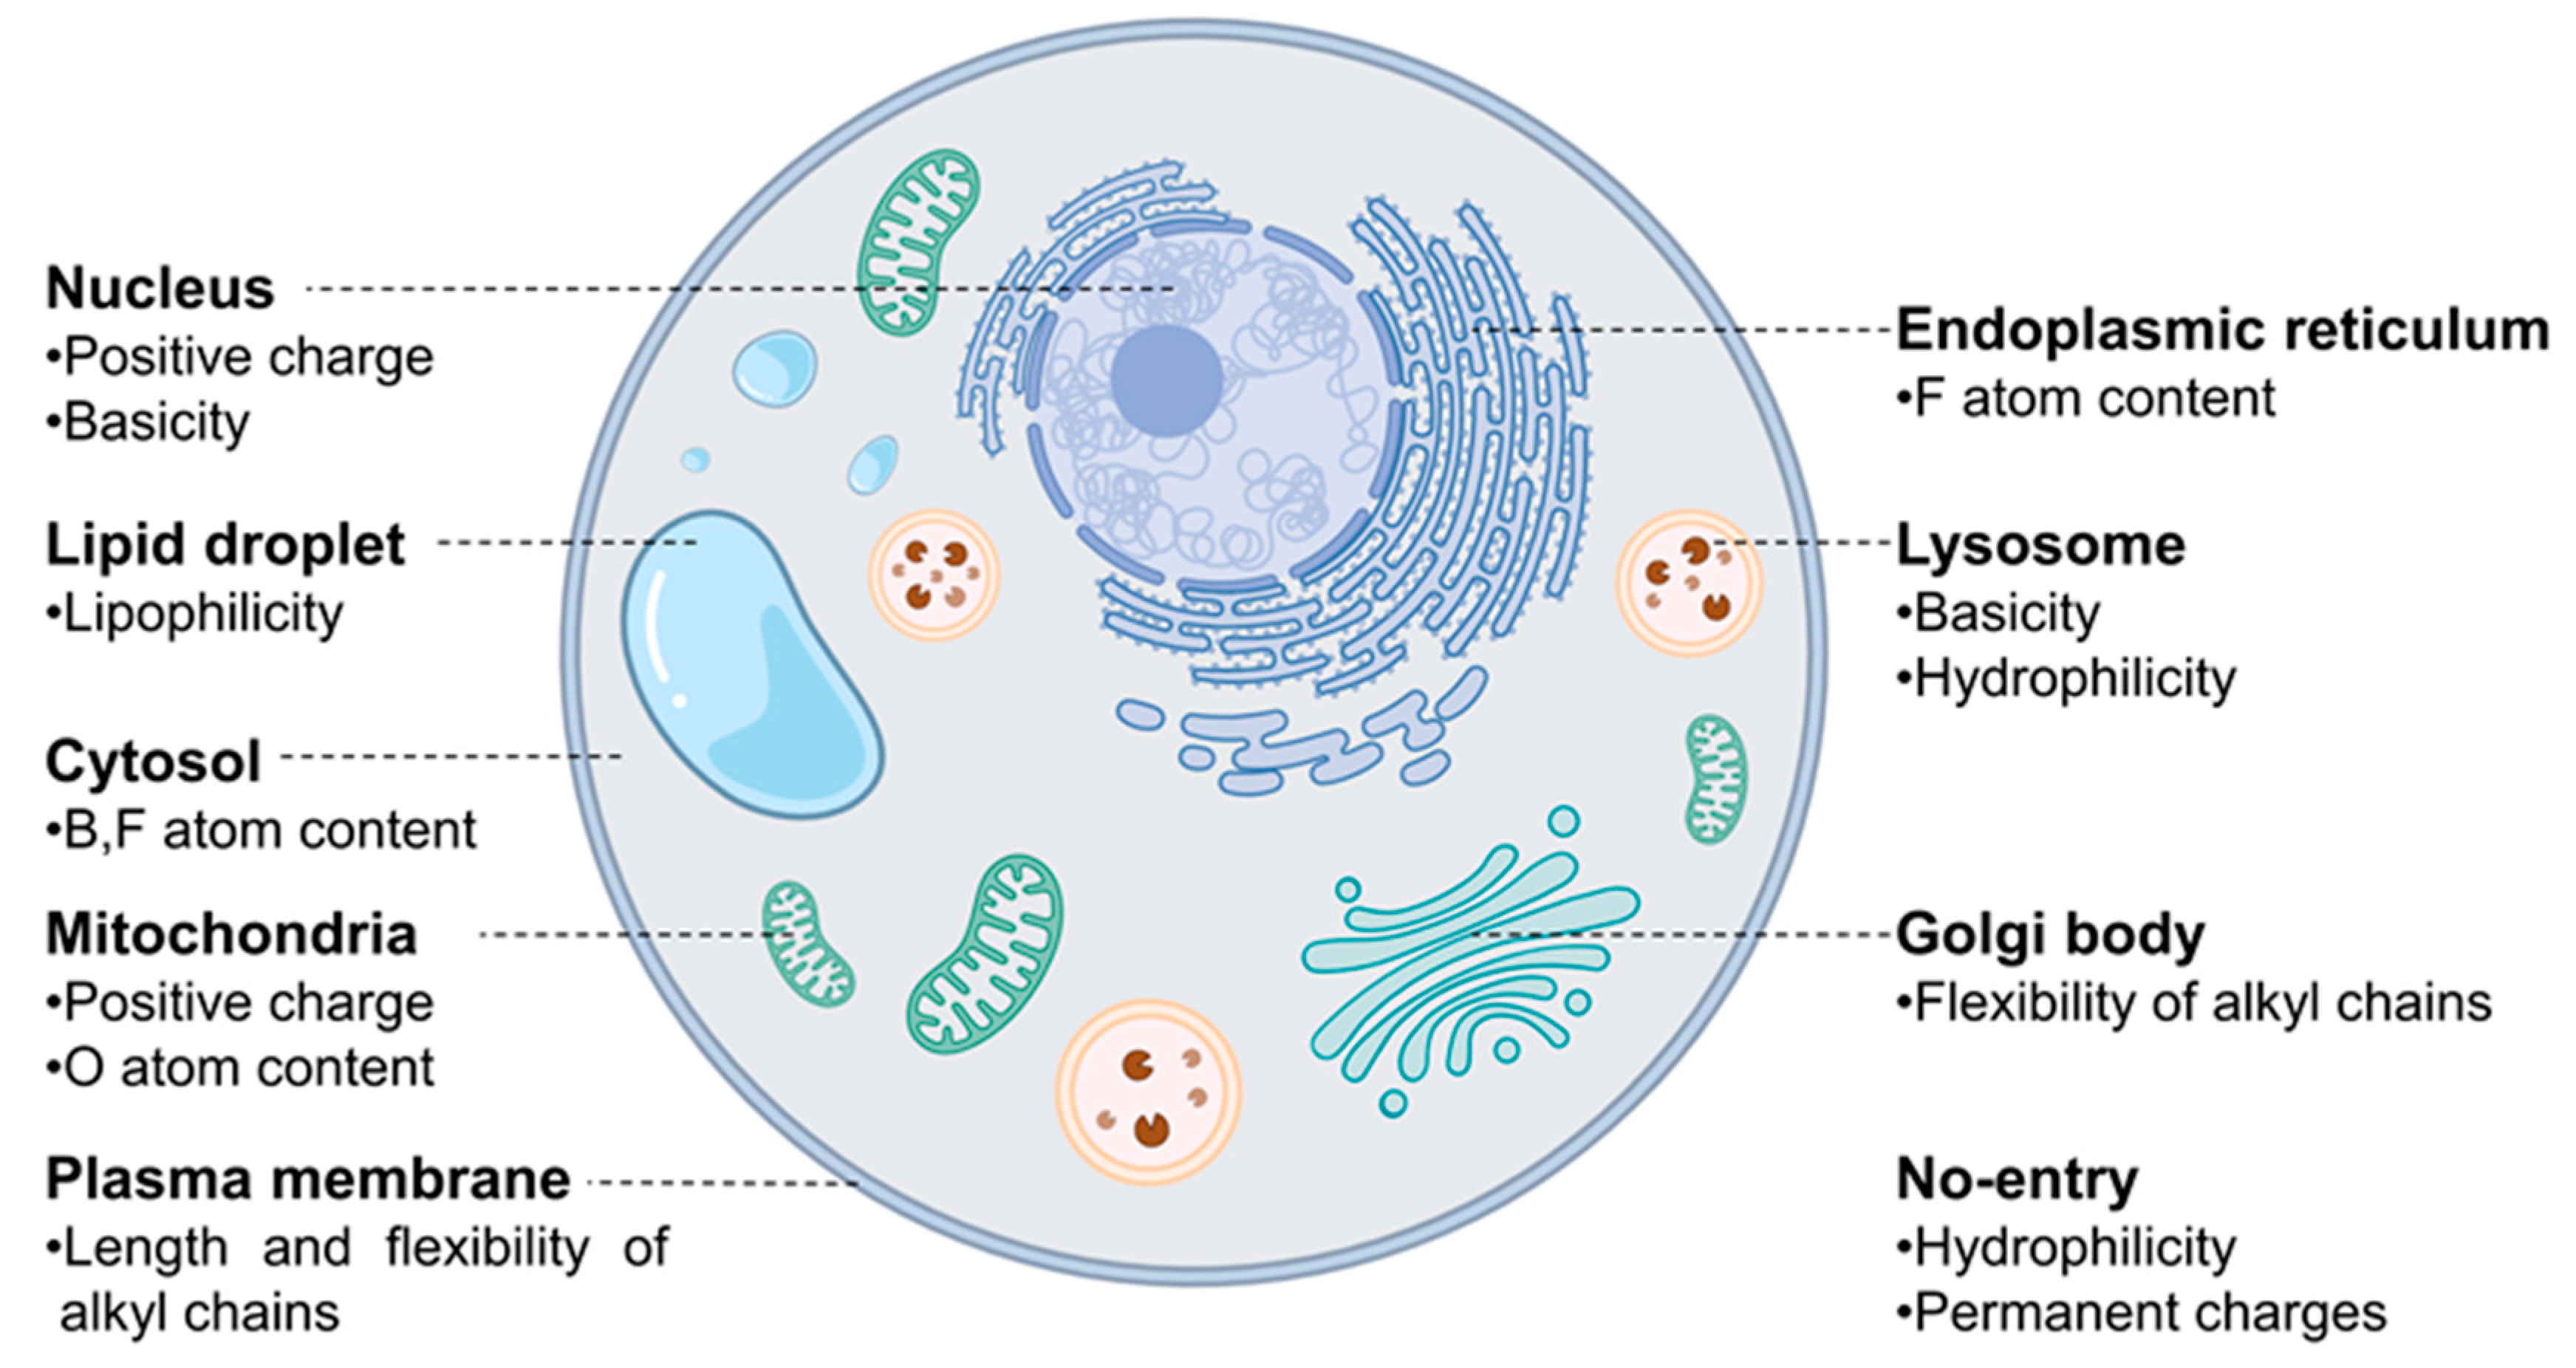
Now, let us discuss a few distinctive and explainable physicochemical properties that apparently affect the organelle specificity of the dyes. Among the 38 descriptors, those regarding the hydrophobicity of probes were found to be involved in the staining of LD and PM. For example, the results of (Chemaxon HLB) and (SlogP Me1) demonstrated that LD-specific probes are the most hydrophobic among all probes (Figure 3a and Figure 4a). The low values of (topological PSA) also indicate that the hydrophobic environment of LD would be preferred by the LD-specific probes (Figure 3b). PM-specific probes also exhibited high hydrophobicity, but the results of (fraction of rotatable bonds) suggest that the flexibility of probes is also an important factor for PM-selective probes (Figure 3c). On the other hand, probes that cannot pass through the PM (no entry) were commonly found to have permanent charges, high hydrophilicity and large polar surfaces, as shown in the results of (topological PSA), (LogD at pH 7.4), and (formal charge) (Figure 3b,d and Figure 4b). The comparative analysis of LD-, PM-, and no entry groups indicate that a variety of hydrophobicity-related properties affect the internalization of the probes into the cells and staining of LD, a typical hydrophobic organelle.
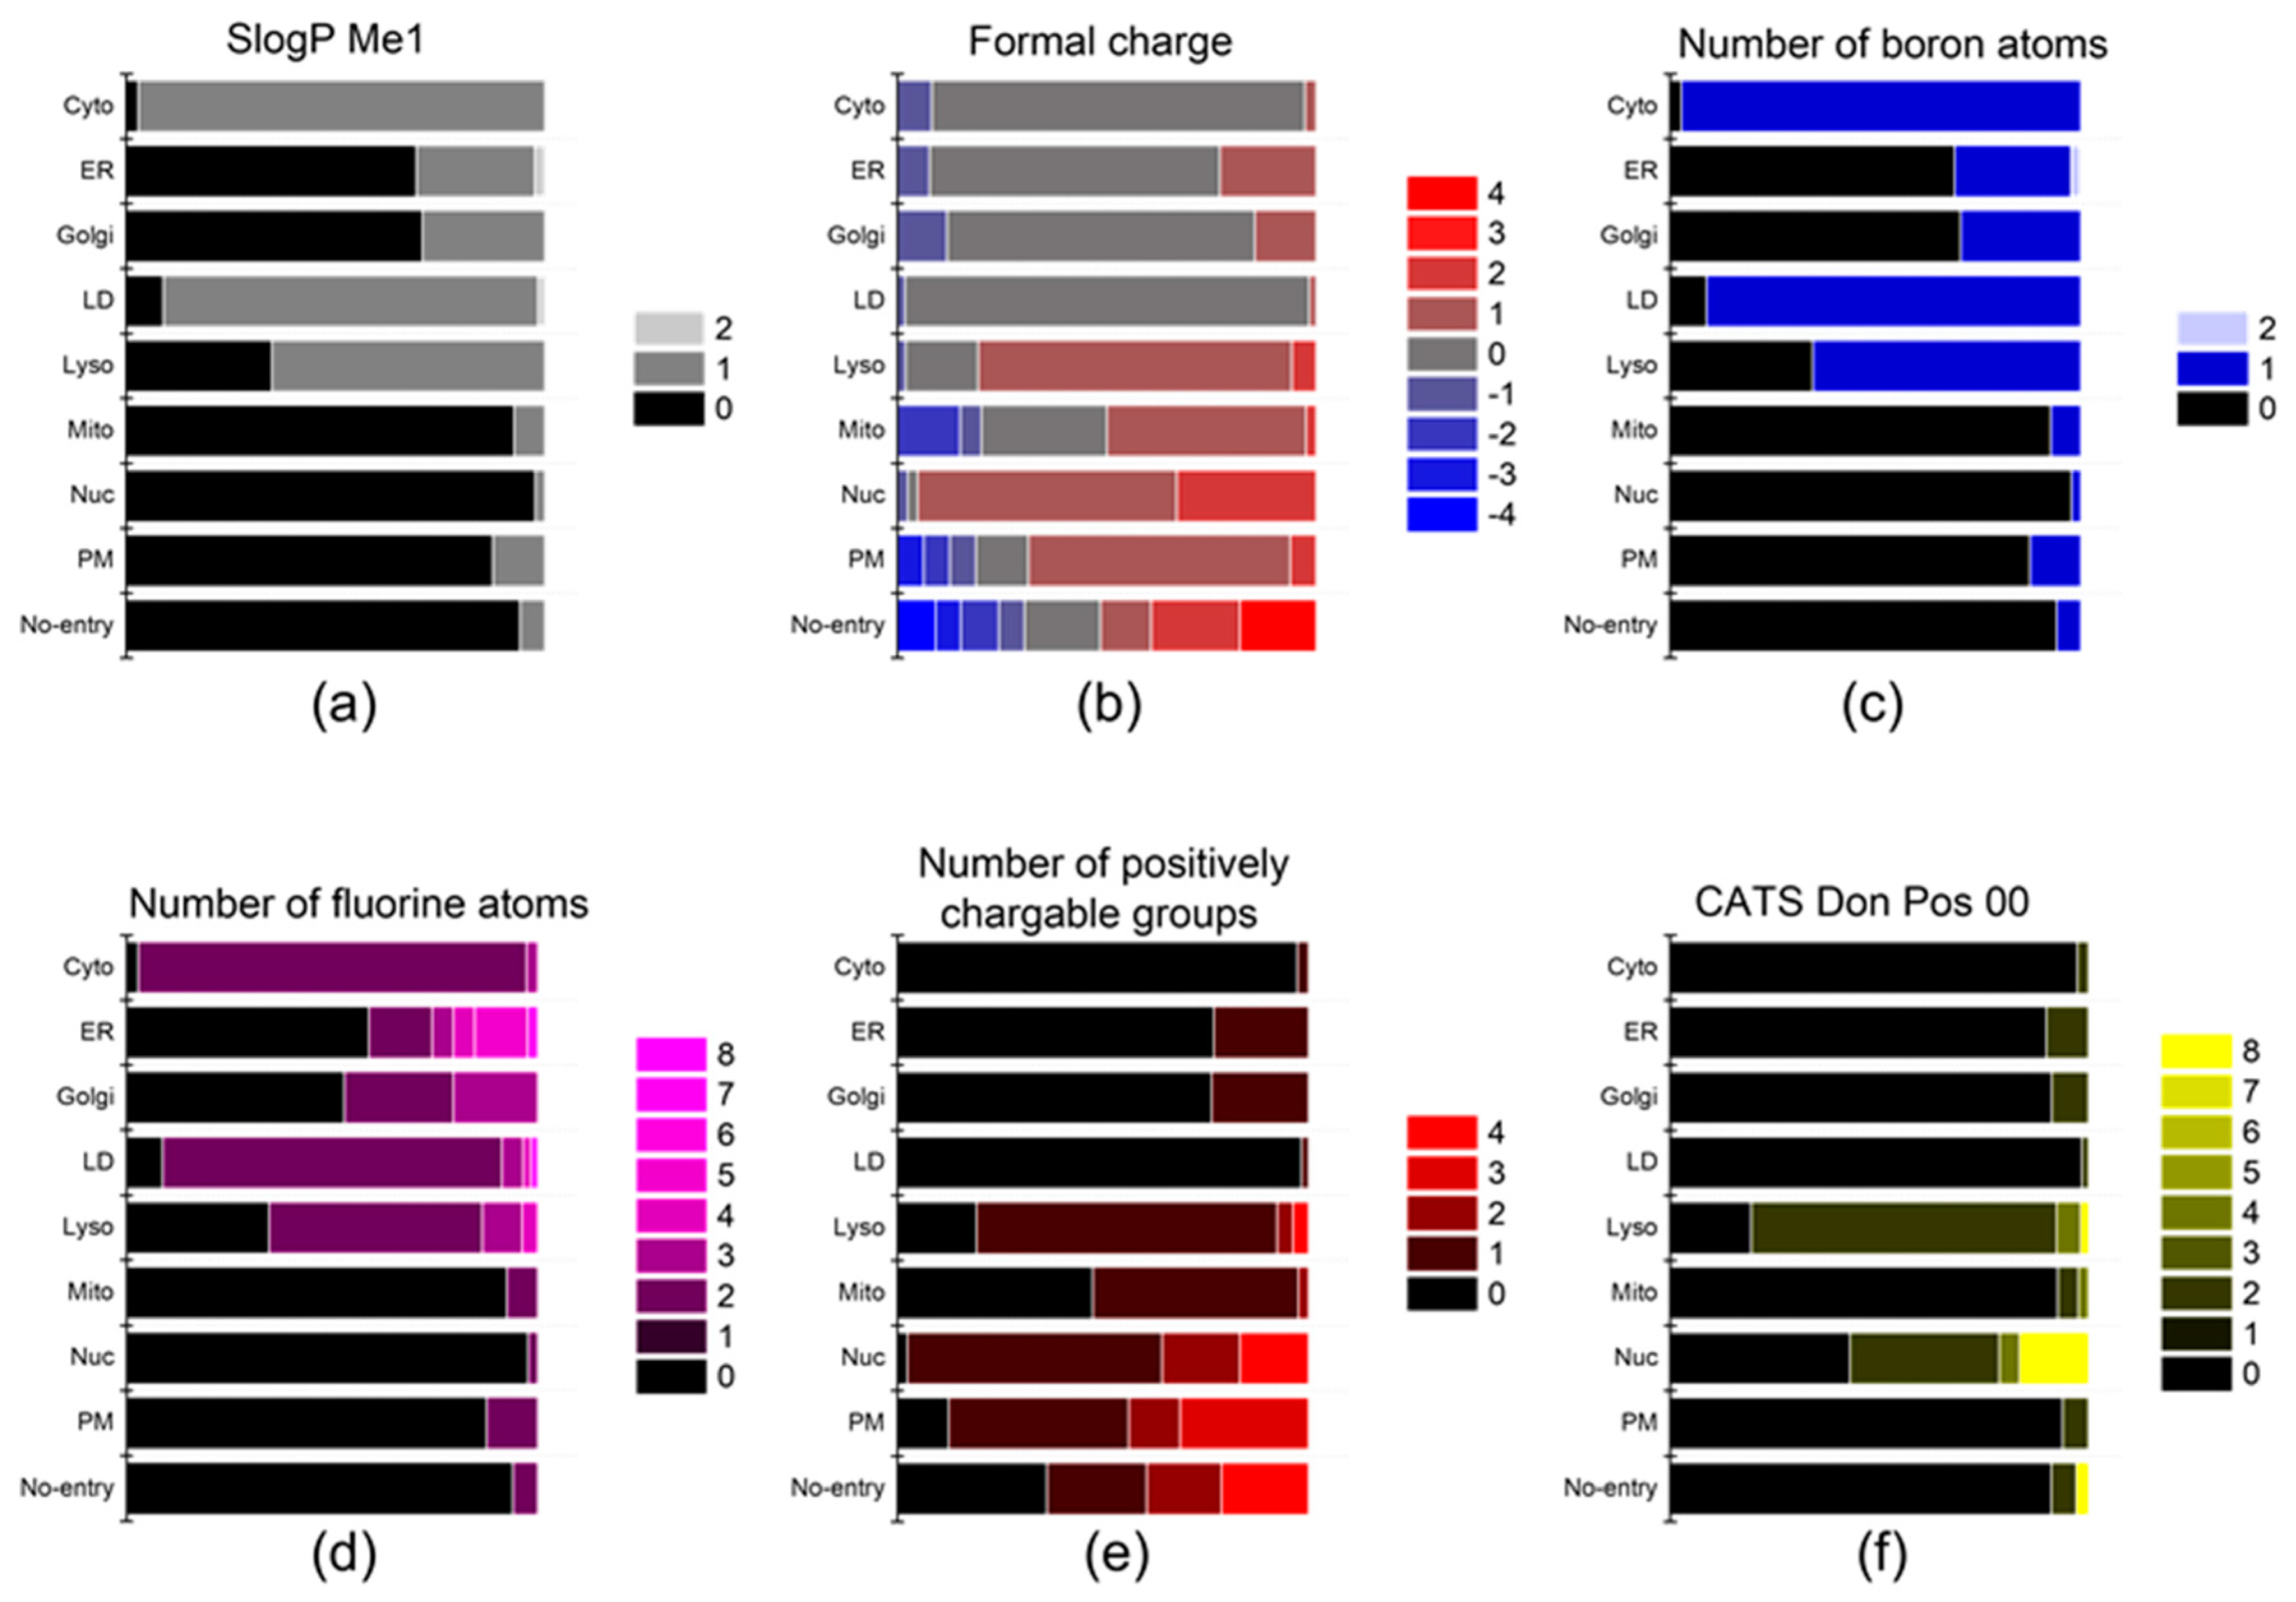
Upon internalization into cells, the probes possessing specific properties were prone to be localized in certain organelles. For instance, probes with high values of (strongest basic pKa1) tended to yield lyso-specific staining (Figure 3e). The result suggests that the basicity of probes plays a crucial role in the lyso-specific staining process, as basic probes can be easily accumulated in the acidic environment of lysosomes. Furthermore, these probes exhibited a high value of (fraction of nitrogen atoms) and a positive value of (formal charge) because the basicity of lyso-specific probes mostly originates from amine moieties (Figure 4b and Figure S2a). On the other hand, many cyto-specific probes tended to contain two fluorine atoms and one boron atom in their structures, since a number of cyto-specific probes consist of BODIPY moieties (Figure 4c,d). Considering the similar overall surface polarity of the lyso- and cyto-specific probes shown in (topological PSA) (Figure 3b), the permanent positive charges on the chemical structures might have an important role in the discrimination of lyso- and cyto-specific probes. Additionally, the results indicate that the contents of certain types of atoms, such as boron and fluorine, can help to predict the probes’ destination as they share similar net charges or functional groups such as BODIPY.
ER- and Golgi-specific probes shared similar tendencies in many properties including (Chemaxon HLB), (topological PSA), and (LogD at pH 7.4), except for a couple of distinguishing features (Figure 3a,b,d). ER-specific probes had the highest (number of fluorine atoms) among all types of organelle-specific probes (Figure 4d). This can be attributed to the pentafluorophenyl group which is commonly used as an ER-targeting moiety. Owing to the ER’s role in lipid metabolism and protein folding, ER has a higher lipophilic compound than other organelles. Such a lipophilic environment of ER can facilitate the accumulation of lipophilic molecules, such as the pentafluorophenyl and phenoxazine groups [28,39]. Moreover, the ER membrane proteins that contain thiol moieties may react with the pentafluorophenyl group through a halogen-substituted reaction [40,41]. On the other hand, the (fraction of rotatable bonds) was notably higher in Golgi-specific probes (Figure 3c). This result suggests that probes with longer and more flexible tails can be readily embedded in the membrane structure of the Golgi complex, which has many bulky phosphatidylinositol derivatives and condensed sphingomyelin components [23,42]. Therefore, while ER- and Golgi-specific probes share several properties, a few distinct features can lead to their selective localization within the ER and Golgi complex through physical interactions and chemical reactions.
The positive charge of probes appears to be the most critical property in determining the specificity of nuc-specific probes. Several positive charge-related descriptors commonly exhibited high values for the nuc-specific probes, including (formal charge), (number of positively chargeable groups), (CATS Don Pos 00), (number of positively charged groups), (CATS Pos Pos 00), and (CATS binary Don Pos 00). (Figure 4b,e,f and Figure S3a–c) In fact, the QSAR study of R. Horobin and colleagues has also suggested that nucleus-specific probes should have positive charges, as the positive charge of the probe may strongly interact with the negatively charged phosphate backbone of DNA [24]. Additionally, the relatively high value of (fraction of aromatic bonds) of the nuc-specific probes indicates that the probes having planar structures can be easily intercalated into the DNA structures (Figure S2l).
In the case of mito-specific probes, they share many characteristics with ER-, Golgi-, and nucleus-specific probes. Regarding lipophilicity and surface polarity, mito-specific probes were lipophilic, similar to ER- and Golgi-specific probes (Figure 3a,b). However, mito-specific probes exhibited positive charges (Figure 4b). Since the inner mitochondrial membrane has high negative charges due to many negatively charged lipids, including phosphatidylserine, phosphatidylglycerol, and cardiolipin, the positive charge of mito-specific probes can bind to the inner mitochondrial membrane via electrostatic interaction. Cardiolipin, a lipid with two negative charges, is exclusively distributed in the inner mitochondrial membrane and may contribute to the accumulation of positively charged probes. Some of the mito-specific probes change their colors by stacking with each other, sensing the mitochondrial membrane potential. Such membrane potential-dependent probes commonly have hydrophobic planar structures, as shown in the (fraction of aromatic bonds) (Figure S2l). Additionally, 15 out of 40 mitochondria-specific probes had values of the (fraction of oxygen atoms) over 0.1, as typical mitochondrial membrane potential-dependent fluorophores, such as alizarin, eosin Y, and gallein derivatives, contain oxygen atoms (Figure 3f) [30,43,44]. Therefore, the fluorophores can be selectively accumulated in mitochondria via either electrostatic interaction or in response to the mitochondrial membrane potential.
4. Conclusions
Our multi-organelle prediction QSAR model, trained on the largest dataset ever reported, consisting of 350 probes and 786 descriptors, has demonstrated the capability to predict the target organelles of fluorescent probes with an accuracy of 75%. Furthermore, the MDI analysis revealed 38 key parameters responsible for the organelle selectivity of the probes, including pKa, logD, the number of rotatable bonds, oxygen and fluorine atoms, hydrophilic-lipophilic balance, and topological polar surface area. Although there is room for improvement, including the prediction accuracy and the excessive number of descriptors that are not simply explainable, these challenges can be overcome by gathering more information of probes and elaborating on the set of descriptors. Thus, this predictive model provides key variables that determine the destination of the probes and can serve as a valuable tool for developing new organelle-specific fluorescent probes.
Supplementary Materials
The following supporting information can be downloaded at https://www.mdpi.com/article/10.3390/chemosensors11050310/s1. Figure S1: The increase in prediction accuracy along with the increasing number of max depths and estimators; Figure S2: The key descriptors which are not included in Figure 3; Figure S3: The key descriptors which are not included in Figure 4.
Author Contributions
Conceptualization, S.-H.P., X.L. and Y.-T.C.; methodology, S.-H.P. and S.K.L.; software, S.-H.P. and S.K.L.; validation, S.-H.P., H.-G.L., X.L., S.K.L. and Y.-T.C.; formal analysis, S.K.L.; data curation, S.-H.P., H.-G.L. and X.L.; writing—S.-H.P., X.L., H.-G.L., S.K.L. and Y.-T.C.; supervision, S.K.L. and Y.-T.C. All authors have read and agreed to the published version of the manuscript.
Funding
This paper is supported by the Basic Science Research Institute Fund (NRF 2021R1A6A1A10042944) and Institute for Basic Science (IBS-R007-A1).
Institutional Review Board Statement
Not applicable.
Informed Consent Statement
Not applicable.
Data Availability Statement
The dataset of 350 compounds presented in this study are available as an Excel file online.
Conflicts of Interest
The authors declare no conflict of interest.
References
- Casasampere, M.; Izquierdo, E.; Casas, J.; Abad, J.L.; Liu, X.; Xu, R.; Mao, C.; Chang, Y.-T.; Delgado, A.; Fabrias, G. Click and count: Specific detection of acid ceramidase activity in live cells. Chem. Sci. 2020, 11, 13044–13051. [Google Scholar] [CrossRef]
- Choi, Y.-K.; Kim, J.-J.; Chang, Y.-T. Holding-Oriented versus Gating-Oriented Live-Cell Distinction: Highlighting the Role of Transporters in Cell Imaging Probe Development. Acc. Chem. Res. 2019, 52, 3097–3107. [Google Scholar] [CrossRef]
- Gao, P.; Pan, W.; Li, N.; Tang, B. Fluorescent probes for organelle-targeted bioactive species imaging. Chem. Sci. 2019, 10, 6035–6071. [Google Scholar] [CrossRef]
- Kwon, H.-Y.; Kumar Das, R.; Jung, G.T.; Lee, H.-G.; Lee, S.H.; Berry, S.N.; Tan, J.K.S.; Park, S.; Yang, J.-S.; Park, S.; et al. Lipid-Oriented Live-Cell Distinction of B and T Lymphocytes. J. Am. Chem. Soc. 2021, 143, 5836–5844. [Google Scholar] [CrossRef]
- Liu, X.; Chang, Y.-T. Fluorescent probe strategy for live cell distinction. Chem. Soc. Rev. 2022, 51, 1573–1591. [Google Scholar] [CrossRef]
- Yasuda, M.; Ma, Y.; Okabe, S.; Wakabayashi, Y.; Su, D.; Chang, Y.-T.; Seimiya, H.; Tera, M.; Nagasawa, K. Target identification of a macrocyclic hexaoxazole G-quadruplex ligand using post-target-binding visualization. Chem. Commun. 2020, 56, 12905–12908. [Google Scholar] [CrossRef]
- Zhu, H.; Fan, J.; Du, J.; Peng, X. Fluorescent Probes for Sensing and Imaging within Specific Cellular Organelles. Acc. Chem. Res. 2016, 49, 2115–2126. [Google Scholar] [CrossRef]
- Lim, S.; Haque, M.M.; Su, D.; Kim, D.; Lee, J.-S.; Chang, Y.-T.; Kim, Y.K. Development of a BODIPY-based fluorescent probe for imaging pathological tau aggregates in live cells. Chem. Commun. 2017, 53, 1607–1610. [Google Scholar] [CrossRef]
- Horobin, R.; Stockert, J.; Rashid-Doubell, F. Uptake and localization mechanisms of fluorescent and colored lipid probes. Part 2. QSAR models that predict localization of fluorescent probes used to identify (“specifically stain”) various biomembranes and membranous organelles. Biotech. Histochem. 2015, 90, 241–254. [Google Scholar] [CrossRef]
- Horobin, R.; Stockert, J.; Rashid-Doubell, F. Uptake and localization mechanisms of fluorescent and colored lipid probes. Part 3. Protocols for predicting intracellular localization of lipid probes using QSAR models. Biotech. Histochem. 2015, 90, 255–263. [Google Scholar] [CrossRef]
- Horobin, R.W.; Rashid, F. Interactions of molecular probes with living cells and tissues. Part 1. Some general mechanistic proposals, making use of a simplistic Chinese box model. Histochemistry 1990, 94, 205–209. [Google Scholar] [CrossRef]
- Horobin, R.W.; Rashid-Doubell, F. Predicting small molecule fluorescent probe localization in living cells using QSAR modeling. 2. Specifying probe, protocol and cell factors; selecting QSAR models; predicting entry and localization. Biotech. Histochem. 2013, 88, 461–476. [Google Scholar] [CrossRef]
- Horobin, R.W.; Rashid-Doubell, F.; Pediani, J.D.; Milligan, G. Predicting small molecule fluorescent probe localization in living cells using QSAR modeling. 1. Overview and models for probes of structure, properties and function in single cells. Biotech. Histochem. 2013, 88, 440–460. [Google Scholar] [CrossRef]
- Cruz, V.L.; Martinez, S.; Ramos, J.; Martinez-Salazar, J. 3D-QSAR as a Tool for Understanding and Improving Single-Site Polymerization Catalysts. A Review. Organometallics 2014, 33, 2944–2959. [Google Scholar] [CrossRef]
- Ding, B.; Yu, Y.; Geng, S.; Liu, B.; Hao, Y.; Liang, G. Computational Methods for the Interaction between Cyclodextrins and Natural Compounds: Technology, Benefits, Limitations, and Trends. J. Agric. Food Chem. 2022, 70, 2466–2482. [Google Scholar] [CrossRef]
- Muratov, E.N.; Bajorath, J.; Sheridan, R.P.; Tetko, I.V.; Filimonov, D.; Poroikov, V.; Oprea, T.I.; Baskin, I.I.; Varnek, A.; Roitberg, A.; et al. QSAR without borders. Chem. Soc. Rev. 2020, 49, 3525–3564. [Google Scholar] [CrossRef]
- Nongonierma, A.B.; FitzGerald, R.J. Learnings from quantitative structure–activity relationship (QSAR) studies with respect to food protein-derived bioactive peptides: A review. RSC Adv. 2016, 6, 75400–75413. [Google Scholar] [CrossRef]
- Radaeva, M.; Dong, X.; Cherkasov, A. The Use of Methods of Computer-Aided Drug Discovery in the Development of Topoisomerase II Inhibitors: Applications and Future Directions. J. Chem. Inf. Model. 2020, 60, 3703–3721. [Google Scholar] [CrossRef]
- Liu, R.; Jiang, W.; Walkey, C.D.; Chan, W.C.W.; Cohen, Y. Prediction of nanoparticles-cell association based on corona proteins and physicochemical properties. Nanoscale 2015, 7, 9664–9675. [Google Scholar] [CrossRef]
- Ambure, P.; Roy, K. Understanding the structural requirements of cyclic sulfone hydroxyethylamines as hBACE1 inhibitors against Aβ plaques in Alzheimer’s disease: A predictive QSAR approach. RSC Adv. 2016, 6, 28171–28186. [Google Scholar] [CrossRef]
- Rashid, F.; Horobin, R.W. Interaction of molecular probes with living cells and tissues. Part 2. Histochemistry 1990, 94, 303–308. [Google Scholar] [CrossRef]
- Rashid, F.; Horobin, R.W.; Williams, M.A. Predicting the behaviour and selectivity of fluorescent probes for lysosomes and related structures by means of structure-activity models. Histochemistry 1991, 23, 450–459. [Google Scholar] [CrossRef]
- Colston, J.; Horobin, R.; Rashid-Doubell, F.; Pediani, J.; Johal, K. Why fluorescent probes for endoplasmic reticulum are selective: An experimental and QSAR-modelling study. Biotech. Histochem. 2003, 78, 323–332. [Google Scholar] [CrossRef]
- Horobin, R.W.; Stockert, J.C.; Rashid-Doubell, F. Fluorescent cationic probes for nuclei of living cells: Why are they selective? A quantitative structure–activity relations analysis. Histochem. Cell Biol. 2006, 126, 165–175. [Google Scholar] [CrossRef]
- Horobin, R.W.; Stockert, J.C.; Rashid-Doubell, F. Uptake and localisation of small-molecule fluorescent probes in living cells: A critical appraisal of QSAR models and a case study concerning probes for DNA and RNA. Histochem. Cell Biol. 2013, 139, 623–637. [Google Scholar] [CrossRef]
- Horobin, R.W.; Stockert, J.C. Uptake and localization mechanisms of fluorescent and colored lipid probes. 1. Physicochemistry of probe uptake and localization, and the use of QSAR models for selectivity prediction. Biotech. Histochem. 2011, 86, 379–393. [Google Scholar] [CrossRef]
- Uchinomiya, S.; Horobin, R.W.; Alvarado-Martinez, E.; Pena-Cabrera, E.; Chang, Y.T. Prediction of Intracellular Localization of Fluorescent Dyes Using QSAR Models. Comb. Chem. High Throughput Screen. 2016, 19, 378–383. [Google Scholar] [CrossRef]
- Singh, D.; Rajput, D.; Kanvah, S. Fluorescent probes for targeting endoplasmic reticulum: Design strategies and their applications. Chem. Commun. 2022, 58, 2413–2429. [Google Scholar] [CrossRef]
- Liu, C.Y.; Zhu, H.C.; Zhang, Y.; Su, M.J.; Liu, M.Y.; Zhang, X.H.; Wang, X.; Rong, X.D.; Wang, K.; Li, X.W.; et al. Recent advances in Golgi-targeted small-molecule fluorescent probes. Coord. Chem. Rev. 2022, 462, 214504. [Google Scholar] [CrossRef]
- Rashid, F.; Horobin, R.W. Accumulation of Fluorescent Non-Cationic Probes in Mitochondria of Cultured-Cells—Observations, a Proposed Mechanism, and Some Implications. J. Microsc. 1991, 163, 233–241. [Google Scholar] [CrossRef]
- Lansiaux, A.; Tanious, F.; Mishal, Z.; Dassonneville, L.; Kumar, A.; Stephens, C.E.; Hu, Q.; Wilson, W.D.; Boykin, D.W.; Bailly, C. Distribution of furamidine analogues in tumor cells: Targeting of the nucleus or mitochondria depending on the amidine substitution. Cancer Res. 2002, 62, 7219–7229. [Google Scholar]
- Collot, M.; Ashokkumar, P.; Anton, H.; Boutant, E.; Faklaris, O.; Galli, T.; Mely, Y.; Danglot, L.; Klymchenko, A.S. MemBright: A Family of Fluorescent Membrane Probes for Advanced Cellular Imaging and Neuroscience. Cell Chem. Biol. 2019, 26, 600. [Google Scholar] [CrossRef]
- Breiman, L. Random forests. Mach. Learn. 2001, 45, 5–32. [Google Scholar] [CrossRef]
- Svetnik, V.; Liaw, A.; Tong, C.; Culberson, J.C.; Sheridan, R.P.; Feuston, B.P. Random forest: A classification and regression tool for compound classification and QSAR modeling. J. Chem. Inf. Comput. Sci. 2003, 43, 1947–1958. [Google Scholar] [CrossRef]
- Pedregosa, F.; Varoquaux, G.; Gramfort, A.; Michel, V.; Thirion, B.; Grisel, O.; Blondel, M.; Prettenhofer, P.; Weiss, R.; Dubourg, V.; et al. Scikit-learn: Machine Learning in Python. J. Mach. Learn. Res. 2011, 12, 2825–2830. [Google Scholar]
- Kier, L.B.; Hall, L.H. A Differential Molecular Connectivity Index. Quant. Struct. Act. Relatsh. 1991, 10, 134–140. [Google Scholar] [CrossRef]
- Wildman, S.A.; Crippen, G.M. Prediction of Physicochemical Parameters by Atomic Contributions. J. Chem. Inf. Comput. Sci. 1999, 39, 868–873. [Google Scholar] [CrossRef]
- Schneider, G.; Neidhart, W.; Giller, T.; Schmid, G. “Scaffold-Hopping” by Topological Pharmacophore Search: A Contribution to Virtual Screening. Angew. Chem. Int. Ed. 1999, 38, 2894–2896. [Google Scholar] [CrossRef]
- Phaniraj, S.; Gao, Z.; Rane, D.; Peterson, B.R. Hydrophobic resorufamine derivatives: Potent and selective red fluorescent probes of the endoplasmic reticulum of mammalian cells. Dyes Pigm. 2016, 135, 127–133. [Google Scholar] [CrossRef]
- Yuriev, E.; Kong, D.C.M.; Iskander, M.N. Investigation of structure-activity relationships in a series of glibenclamide analogues. Eur. J. Med. Chem. 2004, 39, 835–847. [Google Scholar] [CrossRef]
- Lu, S.; Dai, Z.; Cui, Y.; Kong, D.-M. Recent Development of Advanced Fluorescent Molecular Probes for Organelle-Targeted Cell Imaging. Biosensors 2023, 13, 360. [Google Scholar] [CrossRef]
- Li, S.; Yang, K.; Zeng, J.; Ding, Y.; Cheng, D.; He, L. Golgi-Targeting Fluorescent Probe for Monitoring CO-Releasing Molecule-3 In Vitro and In Vivo. ACS Omega 2022, 7, 9929–9935. [Google Scholar] [CrossRef]
- Scorrano, L.; Petronilli, V.; Colonna, R.; Di Lisa, F.; Bernardi, P. Chloromethyltetramethylrosamine (Mitotracker OrangeTM) Induces the Mitochondrial Permeability Transition and Inhibits Respiratory Complex I: IMPLICATIONS FOR THE MECHANISM OF CYTOCHROME c RELEASE*. J. Biol. Chem. 1999, 274, 24657–24663. [Google Scholar] [CrossRef]
- Poot, M.; Zhang, Y.Z.; Krämer, J.A.; Wells, K.S.; Jones, L.J.; Hanzel, D.K.; Lugade, A.G.; Singer, V.L.; Haugland, R.P. Analysis of mitochondrial morphology and function with novel fixable fluorescent stains. J. Histochem. Cytochem. 1996, 44, 1363–1372. [Google Scholar] [CrossRef]
Figure 1.
An illustration of multi-organelle prediction QSAR model. Random Forest algorithm was utilized for classifying the fluorescent probes into individual organelles. A dataset of 350 organelle-specific fluorescent probes was used to train the machine learning model. Among 350 fluorescent probes, 280 randomly selected probes were used to train the model (train set), and the remaining 70 probes were used to validate the accuracy of the model (test set).

Figure 2.
A visual representation of significant characteristics of probes that influence their localization, acquired through MDI analysis of the model.
Figure 2.
A visual representation of significant characteristics of probes that influence their localization, acquired through MDI analysis of the model.

Figure 3.
The descriptors that were most commonly listed in the top 30 descriptors of the 10 random groups. Out of the 6 descriptors: (a) Chemaxon HLB, (b) topological PSA, (c) fraction of rotatable bonds, (d) LogD at pH 7.4, (e) strongest basic pKa1, and (f) fraction of oxygen atoms, a total of 38 key descriptors were sorted out by selecting the descriptors that were listed at least three times in the top 30 descriptors of the 10 random groups.

Figure 4.
The descriptors that affect the localization of probes into the ER, Golgi, and mito-chondria. (a) SlogP Me1, (b) formal charge, (c) number of boron atoms, (d) number of fluorine atoms, (e) number of positively chargable groups, and (f) CATS Don Pos 00.
Figure 4.
The descriptors that affect the localization of probes into the ER, Golgi, and mito-chondria. (a) SlogP Me1, (b) formal charge, (c) number of boron atoms, (d) number of fluorine atoms, (e) number of positively chargable groups, and (f) CATS Don Pos 00.


Table 1.
The 38 key descriptors obtained by MDI analysis.
| # 1 | Descriptor | Information |
|---|---|---|
| 10 | LogD at pH 7.4 | Distribution coefficient at pH 7.4 |
| 10 | Chemaxon HLB | Hydrophilic-lipophilic balance of a molecule, consensus value from Griffin and Davies methods calculated by the Chemaxon program |
| 10 | Topological PSA | Topological polar surface area of a molecule |
| 10 | Strongest basic pKa1 | The first dissociation constant of a molecule |
| 9 | 2D VSA H-bond | Distribution of hydrogen bonding sites within a molecule |
| 9 | Fraction of 2D VSA H-bond | Fraction of the surface area covered by hydrogen bonds to the total surface area of the molecule |
| 9 | SlogP 3 | Octanol-water partition coefficient |
| 9 | SlogP Me1 3 | Contribution of p-block elements to the partition coefficient, excluding ones described by other SlogP atom types |
| 9 | Fraction of N atoms | Fraction or proportion of nitrogen atoms within a molecule |
| 8 | 2D VSA H-bond acceptor | Distribution of hydrogen bond acceptor sites within a molecule |
| 8 | CATS Hyd Pos 02 4 | Number of atom pairs within a molecule: hydrophobic-positive charge, separated by distance of two bonds |
| 8 | CATS Don Acc 02 4 | Number of atom pairs within a molecule: hydrogen bond donor-acceptor, separated by distance of two bonds |
| 8 | CATS Don Pos 00 4 | Number of atoms within a molecule that exhibit both a hydrogen donor and a positive charge |
| 7 | 2D VSA polar | Contribution of polar surface area within a molecule |
| 7 | SC 04 path cluster 2 | Kier and Hall’s topological descriptor: subgraph count of order 4, path cluster |
| 7 | Formal charge | Formal charge of a molecule |
| 7 | CATS Aro Pos 02 4 | Number of atom pairs within a molecule: aromatic-positive charge, separated by distance of two bonds |
| 7 | CATS Pos Pos 00 4 | Number of positively charged atoms within a molecule |
| 7 | CATS binary Don Pos 00 4 | Presence of atoms within a molecule that exhibit both a hydrogen donor and a positive charge |
| 6 | Number of positively chargeable groups | Number of positively chargeable groups within a molecule |
| 6 | Number of positively charged groups | Number of positive charged groups within a molecule |
| 6 | Fraction of 2D VSA H-bond acceptor | The fraction of the 2D surface area that corresponds to hydrogen bond acceptor sites within a molecule |
| 6 | SlogP H1 3 | Number of hydrocarbon hydrogens |
| 6 | Fraction of H atoms | Fraction of hydrogen atoms within a molecule |
| 6 | Fraction of rotatable bonds | Fraction of rotatable bonds within a molecule |
| 5 | Fraction of 2D VSA polar | Fraction of 2D Van der Waals polar surface area |
| 5 | Number of fluorine atoms | The number of fluorine atoms within a molecule |
| 5 | Number of C2 | The number of secondary carbon atoms within a molecule |
| 4 | 2D VSA hydrophobic | The contribution of hydrophobic surface area within a molecule |
| 4 | Fraction of double bonds | Fraction of double bonds within a molecule |
| 4 | Fraction of aromatic bonds | Fraction of aromatic bonds within a molecule |
| 4 | CATS binary Don Acc 02 4 | Presence of atom pairs within a molecule: hydrogen bond donor-acceptor, separated by distance of two bonds |
| 4 | Number of CsH | Number of single bonds between carbon and hydrogen atoms within a molecule |
| 3 | Number of inorganic atoms | Number of inorganic atoms within a molecule |
| 3 | SC 04 path 2 | Kier and Hall’s topological descriptor: subgraph count of order 4, path |
| 3 | Number of boron atoms | Number of boron atoms within a molecule |
| 3 | Fraction of oxygen atoms | Fraction of oxygen atoms within a molecule |
| 3 | Fraction of rigid bonds | Fraction of chemical bonds that exhibit limited or negligible flexibility or rotational freedom |
Disclaimer/Publisher’s Note: The statements, opinions and data contained in all publications are solely those of the individual author(s) and contributor(s) and not of MDPI and/or the editor(s). MDPI and/or the editor(s) disclaim responsibility for any injury to people or property resulting from any ideas, methods, instructions or products referred to in the content. |
© 2023 by the authors. Licensee MDPI, Basel, Switzerland. This article is an open access article distributed under the terms and conditions of the Creative Commons Attribution (CC BY) license (https://creativecommons.org/licenses/by/4.0/).
Share and Cite
MDPI and ACS Style
Park, S.-H.; Lee, H.-G.; Liu, X.; Lee, S.K.; Chang, Y.-T. Quantitative Structure-Activity Relationship of Fluorescent Probes and Their Intracellular Localizations. Chemosensors 2023, 11, 310. https://doi.org/10.3390/chemosensors11050310
AMA Style
Park S-H, Lee H-G, Liu X, Lee SK, Chang Y-T. Quantitative Structure-Activity Relationship of Fluorescent Probes and Their Intracellular Localizations. Chemosensors. 2023; 11(5):310. https://doi.org/10.3390/chemosensors11050310
Chicago/Turabian StylePark, Seong-Hyeon, Hong-Guen Lee, Xiao Liu, Sung Kwang Lee, and Young-Tae Chang. 2023. "Quantitative Structure-Activity Relationship of Fluorescent Probes and Their Intracellular Localizations" Chemosensors 11, no. 5: 310. https://doi.org/10.3390/chemosensors11050310
Note that from the first issue of 2016, this journal uses article numbers instead of page numbers. See further details here.