Article

Rhodamine Derivative-Linked Silica-Coated Upconverting Nanophosphor (NaYF4: Yb3+/Er3+@SiO2-RBDA) for Ratiometric, Ultrasensitive Chemosensing of Pb2+ Ions

Department of Chemistry, University of Delhi, Delhi 110007, India
*
Author to whom correspondence should be addressed.
Chemosensors 2023, 11(5), 305; https://doi.org/10.3390/chemosensors11050305
Submission received: 20 February 2023 / Revised: 3 April 2023 / Accepted: 16 May 2023 / Published: 19 May 2023
(This article belongs to the Special Issue Chemosensors for Ion Detection)

Abstract

:
Lead (Pb2+) ions are considered as one of the primary environmental pollutants and have a profound effect on human health. In this work, we have developed a hybrid organic–inorganic optical nanochemosensor for selective and ultrasensitive detection of Pb2+ ions based on energy transfer (ET), involving a Pb2+ sensitive rhodamine-derived named (E)-4-(((3′,6′-bis(diethylamino)-3-oxospiro[isoindoline-1,9′-xanthen]-2-yl)imino)methyl)benzaldehyde represented as RBDA, covalently linked with silica coated upconverting nanophosphors (UCNPs). The UCNPs emit visible light after being excited by NIR light, activating the Pb2+ coordinated RBDA (fluorescent probe). When Pb2+ ions were added, a yellow emission band at about 588 nm formed in upconverting photoluminescence spectra, whereas the strength of green emission at about 542 nm reduced upon excitation of 980 nm laser, indicating the energy transfer from UCNP to RBDA-Pb2+ complex. The concentration of Pb2+ ions directly affects how well the probe reabsorbs the green emission of the nanophosphor, thus enabling the ratiometric chemosensing. With a detection limit of 20 nM in aqueous, the resulting ET-based nochemosensor can also preferentially detect Pb2+ despite the presence of other ions. Owing to the minimal autofluorescence and the great penetration depth of NIR light and special optical features of UCNPs, this is a promising approach for sensitive and in-depth detection of Pb2+ ions in a complex ecological and biological specimen.

1. Introduction

Overexposure to certain hazardous metals can have a profound impact on human health [1,2,3]. Among these heavy metal ions, the lead ion (Pb2+) is a significant environmental pollutant that is produced by gasoline, batteries, industrial pigments, and other waste products. Lead poses serious health concerns to humans, including cancer, cardiovascular ailments, paralysis, memory loss, and other neurological disorders [4,5,6,7]. As a result, there is an increasing interest in creating quick, selective, and highly sensitive methods for Pb2+ ion detection, especially in aqueous conditions. Several technologies, including atomic absorption spectroscopy (AAS) [8], plasma atomic emission spectroscopy [9], anodic stripping voltammetry [10], biochemical assays [11], surface enhanced Raman spectroscopy [12], and electrochemical techniques [13] have been developed for the detection of Pb2+ ions. However, those analytical techniques often require expensive machinery operated by highly skilled personnel and are time-consuming [14,15]. Therefore, it is extremely desirable to create a novel real-time detection approach for Pb2+. Recently, colorimetric and florescence spectrometry has gained significant interest for evaluating various environmental pollutants due to their ease of operation, affordability, and selectivity [16,17,18]. In this view, several fluorescent probes had been developed already; for example, N. Aksuner et al., prepared the triazolo-thiadiazin derivative immobilized in polyvinyl chloride [19], S. S. Wee et al., synthesized the carbon dots [20], and J. Liu et al., developed GSH-Mn-ZnS QDs [21] for the lead ion sensing. Despite their good selectivity, these sensors have poor sensitivity and reproducibility, resulting in low detection efficiencies. Additionally, these probes are excited by low tissue-penetrating UV–visible light, which limits their applications in biological samples [22,23,24]. There are other issues like autofluorescence and a low signal-to-noise ratio that considerably limit sensing performance and concurrently photo-oxidize the sensing probes. NIR light is a preferable choice as an primary excitation source due to its greater tissue penetration and lower impact on biological material than UV–visible light [25,26,27]. Therefore, the development of an NIR-light excited advanced ratiometric sensing probe, preferably with multiple emission signals for heavy metal ion detection, is extremely necessary.
Upconverting nanophosphors (UCNPs) have recently attracted more attention because of their ability to release higher-energy light when stimulated by low-energy NIR light, which makes them suitable for in-depth detection of metal ions for analytical and biological applications [28]. The successive absorption of two or more low energy (large wavelength) photons by UCNPs results in the generation of high energy (low wavelength) photons [29,30,31]. UCNPs usually consist of an inorganic host and lattice-embedded lanthanide dopant ions. They also exhibit a number of other advantageous optical characteristics, such as multiple emission peaks, high Stokes shift, and resistance to photobleaching [32,33]. The absence of auto-fluorescence background in UCNP emission gives significantly greater detection sensitivity, suitable for highly sensitive heavy metal ion detection. In addition, these advantages make UCNPs an appealing material to function as energy donor in ET (energy transfer)-based nanoprobes [34,35,36]. The multiple emission peaks of UCNPs allow ratiometric ET-based optical detection of analyte. Several ET-based sensors have been developed so far to detect DNA, metal ions, toxic anions, and small molecules. In these sensors, UCNPs transfer energy to other chromophores, which cause observable variations in emission intensity/pattern. For the metal ion sensing, many NIR-excited UCNPs based sensor had been reported; for example, Q. Liu et al., reported N719-UCNPs for mercury (II) ion detection [37]. CoOOH-modified UCNPs were developed by Q. Han et al., for ascorbic acid detection [38]. J. Han et al., developed an NR dye-UCNP sensor for nitrite detection [39]. L. Liu et al., reported an RB-based UCNP platform for detecting the activity of caspase-3 [40], and Y. Zhang et al., presented RBH modified UCNPs for copper (II) detection [41]. All these probes have advantages like high sensitivity, good reproducibility, and less damage to biological samples than their attached respective fluorescent probes. Recently, a rhodamine-based framework has established itself as a standard mode for the creation of fluorescent probes, due to its unique spirolactam structure and superior photophysical characteristics.
Here, we have developed a NIR-excited ratiometric chemosensor consisting of Pb2+ ion responsive RBDA (turn-on fluorescent probe, as-synthesized derivative of rhodamine-B) covalently conjugated to amine-functionalized silica-coated upconverting nanophosphors (UCNP@SiO2-NH2) and investigated its potential use in the ultrasensitive detection of Pb2+ ions. The robust silica structure can shield the fluorescent probes from the hostile environment, reducing photobleaching and photodegradation. The absorption and fluorescence emission of RBDA, whether free or UCNP-linked, is prominent only in the presence of Pb2+ ions. As RBDA is colorless in the absence of Pb2+ ions, the NIR (980 nm)-excited UNCPs within the UCNP@SiO2-RBDA formulation show prominent green (peak at 542 nm) and red (peak at 655 nm) emission peaks. However, as the absorption of RBDA (having spectral overlap with the green emission of UCNP) increases in a dose-dependent manner with added Pb2+ ions, the green-emission of NIR-excited UCNPs (energy donor) is reabsorbed by the covalently conjugated RBDA (energy acceptor) via radiative reabsorption energy transfer (ET). Consequently, the intensity of yellow emission (peak at 588 nm) of RBDA also increases. On the other hand, the NIR-excited red emission peak of the UCNPs, which does not participate in the ET process, remains unaffected with respect to Pb2+ ion concentration. We have carefully investigated how the concentration of Pb2+ ions quantitatively affects the energy transfer process. This technique allows the ratiometric chemosensing of the analyte, which improves the sensitivity and reproducibility compared to the results acquired from standard single mode analysis. Using the obtained data, we conducted ratiometric analysis among the spectral intensities (green, yellow, and red) variations with the concentration of Pb2+ ions. High selectivity and sensitivity were shown by this NIR-excited ratiometric ET-based chemosensor, as our developed sensor and detection approach exhibits a much lower limit of detection than other previously reported sensing probes.

2. Materials and Methods

2.1. Materials and Reagents

All the details regarding the materials and reagents utilized in this study are described in the Supplementary Material.

2.2. Equipment and Characterizations

The Supplementary Material contains a complete description of all the information regarding to the Equipment and characterizations used.

2.3. Synthesis of Rhodamine-B Derivative (RBDA)

First, rhodamine-B hydrazide was synthesized by the simple one step reaction [42]. In a 100 mL round bottom flask, 4 mmol of rhodamine-B was dissolved in 30 mL of ethanol, followed by dropwise addition of 6 mL of hydrazine hydrate. Then, this reaction mixture was refluxed at 80 °C for 12 h, during which the solution transformed from purple-red to pale orange and then became colorless. After cooling it to room temperature, the solvent was separated under reduced pressure by utilizing rotatory evaporator. Then, 50 mL of HCl solution (1 M) was added dropwise under continuous stirring in the isolated material to get a wine-red solution. After that, 70 mL of NaOH (1 M) solution was added to the aforementioned solution to produce a white precipitate, which was then washed five times with distilled water to eliminate impurities. The final product was dried in vacuum for 12 h to obtain a light-pink solid.
Next, in 25 mL of ethanol, 1 mmol each of terephthalaldehyde and freshly synthesized rhodamine-B hydrazide was dissolved, followed by the addition of three drops of acetic acid and refluxing for 8 h at 80 °C. The yellow color residue was isolated by filtration and thoroughly washed with distilled water and vacuum dried for 6 h. Column chromatography on a silica gel column (petroleum ether: EtOAc 2:1, v/v) was used to get RBDA as purified product. The entire scheme of RBDA synthesis is shown in Figure S1A.

2.4. Synthesis of Upconverting Nanophosphors (NaYF4: Yb3+/Er3+)

Hexagonal phase UCNPs capped with oleic acid (OA) were synthesized through solvothermal synthesis [43]. For synthesis, 0.795 mmol of Y(NO3)3.6H2O, 0.20 mmol of Yb(NO3)3.6H2O, and 0.005 mmol of Er(NO3)3.6H2O were taken in a 100 mL round-bottom flask containing 5 mL of OA and 15 mL of 1-octadecene. The reaction mixture was heated to 160 °C for 30 min to form homogenous solution and then was allowed to cool to room temperature. A solution of NaOH (0.1 g) and NH4OH (0.148 g) in 10 mL methanol was prepared and slowly added in dropwise manner for 30 min. After this, the temperature was raised to 80 °C to completely remove methanol, followed by degassing at 100 °C for 10 min; then, under nitrogen atmosphere the reaction was heated at 315 °C for 1.5 h. To precipitate the UCNPs (NaYF4: Yb3+/Er3+), ethanol was added and collected by centrifugation, followed by washing thrice with a mixture (4:1) of ethanol and cyclohexane.

2.5. Synthesis of Silica Coated UCNP (NaYF4: Yb3+/Er3+@SiO2)

The amine-functionalized silica coated UCNPs were prepared by using protocols from the literature with some modifications [44]. First, 0.1 g of CTAB was dissolved in 10 mL of double distilled water, followed by the addition of 100 mg of UCNPs dispersed in 1 mL cyclohexane and stirring for 3 h to form oil-in-water emulsion. The mixture was then heated to 80 °C for 30 min to remove cyclohexane. Then, 30 mL of water, 150 µL of NaOH (0.1 M), and 2 mL of ethanol were added to the reaction mixture and sonicated for 20 min. After that, 100 µL of TEOS was added dropwise and vigorously stirred for 24 h. The silica-coated UCNPs were collected via centrifugation and washed thoroughly with ethanol. The product was then dried overnight in oven at 60 °C.
The functionalization of surface with amino groups was conducted by grafting APTES. To disintegrate the CTAB templates, the silica-coated UCNPs were first dispersed in a 1 M HCl solution in 30 mL of ethanol and stirred for three hours. Using a centrifuge to separate the product, ethanol was used to clean it three times. This procedure was conducted two more times to remove CTAB as much as possible. Next, the product was dispersed in 15 mL of toluene (moisture-free), and 40 µL of APTES was added, followed by refluxing the solution at 70 °C for 24 h under nitrogen flow. The resulting amine-functionalized silica coated UCNPs were collected by centrifugation and washed three times with methanol and dried overnight in the oven.

2.6. Synthesis of UCNP@SiO2-RBDA

The RBDA was covalently grafted onto UCNP@SiO2 through condensation reaction between amino (on amino-functionalized SiO2) and aldehyde (on RBDA) groups. A total of 100 mg of amino-functionalized silica coated UCNPs was taken in 30 mL of ethanol and sonicated for 10 min, followed by the addition of 100 mg of RBDA and stirring for 12 h at 60 °C. The resulting RBDA-modified UCNPs (UCNP@SiO2-RBDA) were centrifuged and washed three times ethanol and dried in vacuum. The fabrication of UCNP@SiO2-RBDA is shown schematically in Figure S1B.

2.7. Detection of Lead Ions

Different amounts of stock solution in deionized water of Pb2+ and other ions were prepared. In an equal volume ratio of water and ethanol, a 5 mg mL−1 solution of RBDA and UCNP@SiO2-RBDA was also prepared. The test samples for selectivity experiment were prepared by adding 0.1 mL of RBDA from prepared stock solution in 3 mL of water/ethanol (v/v 2:1); then, suitable quantities (50 µM) of various ions including Pb2+ ions were added, and the resultant solutions were analyzed for their UV–visible absorption and fluorescence spectra. To determine the sensitivity, the same amount of the RBDA solution was taken, and Pb2+ ions were added in increasing concentration, and then UV–vis absorption and fluorescence spectra were taken. For the NIR light-stimulated ET-based detection, 0.1 mL of UCNP@SiO2-RBDA from prepared stock solution was added into 3 mL of water/ethanol (v/v 2:1); then, increasing concentrations of Pb2+ ions (in µM range) were added, and finally the upconverting photoluminescence spectra were recorded. For examining the interference of other ions, Pb2+ was added to the solutions containing UCNP@SiO2-RBDA in the presence of other metal ions. Excitation wavelength was set at 540 nm for fluorescence measurements, and emission was measured from 550 to 700 nm, and for the upconverting photoluminescence measurements the 980 CW laser was utilized as excitation source, and emission was measured from 480 to 700 nm.

2.8. Real-Samples Analysis

To additionally show the potential use of a nanochemosensor for the detection of Pb2+ in the real samples, we took the tap water and used it as detection sample without any pretreatment. The standardized addition method was utilized to detect Pb2+ ions. Three different concentrations of Pb2+ ions (10 µM, 20 µM, and 30 µM) were added into the tap water samples. These samples were added with UCNP@SiO2-RBDA, and upconverting photoluminescence spectra were recorded, and the found concentration and percentage recovery were calculated.

3. Results and Discussions

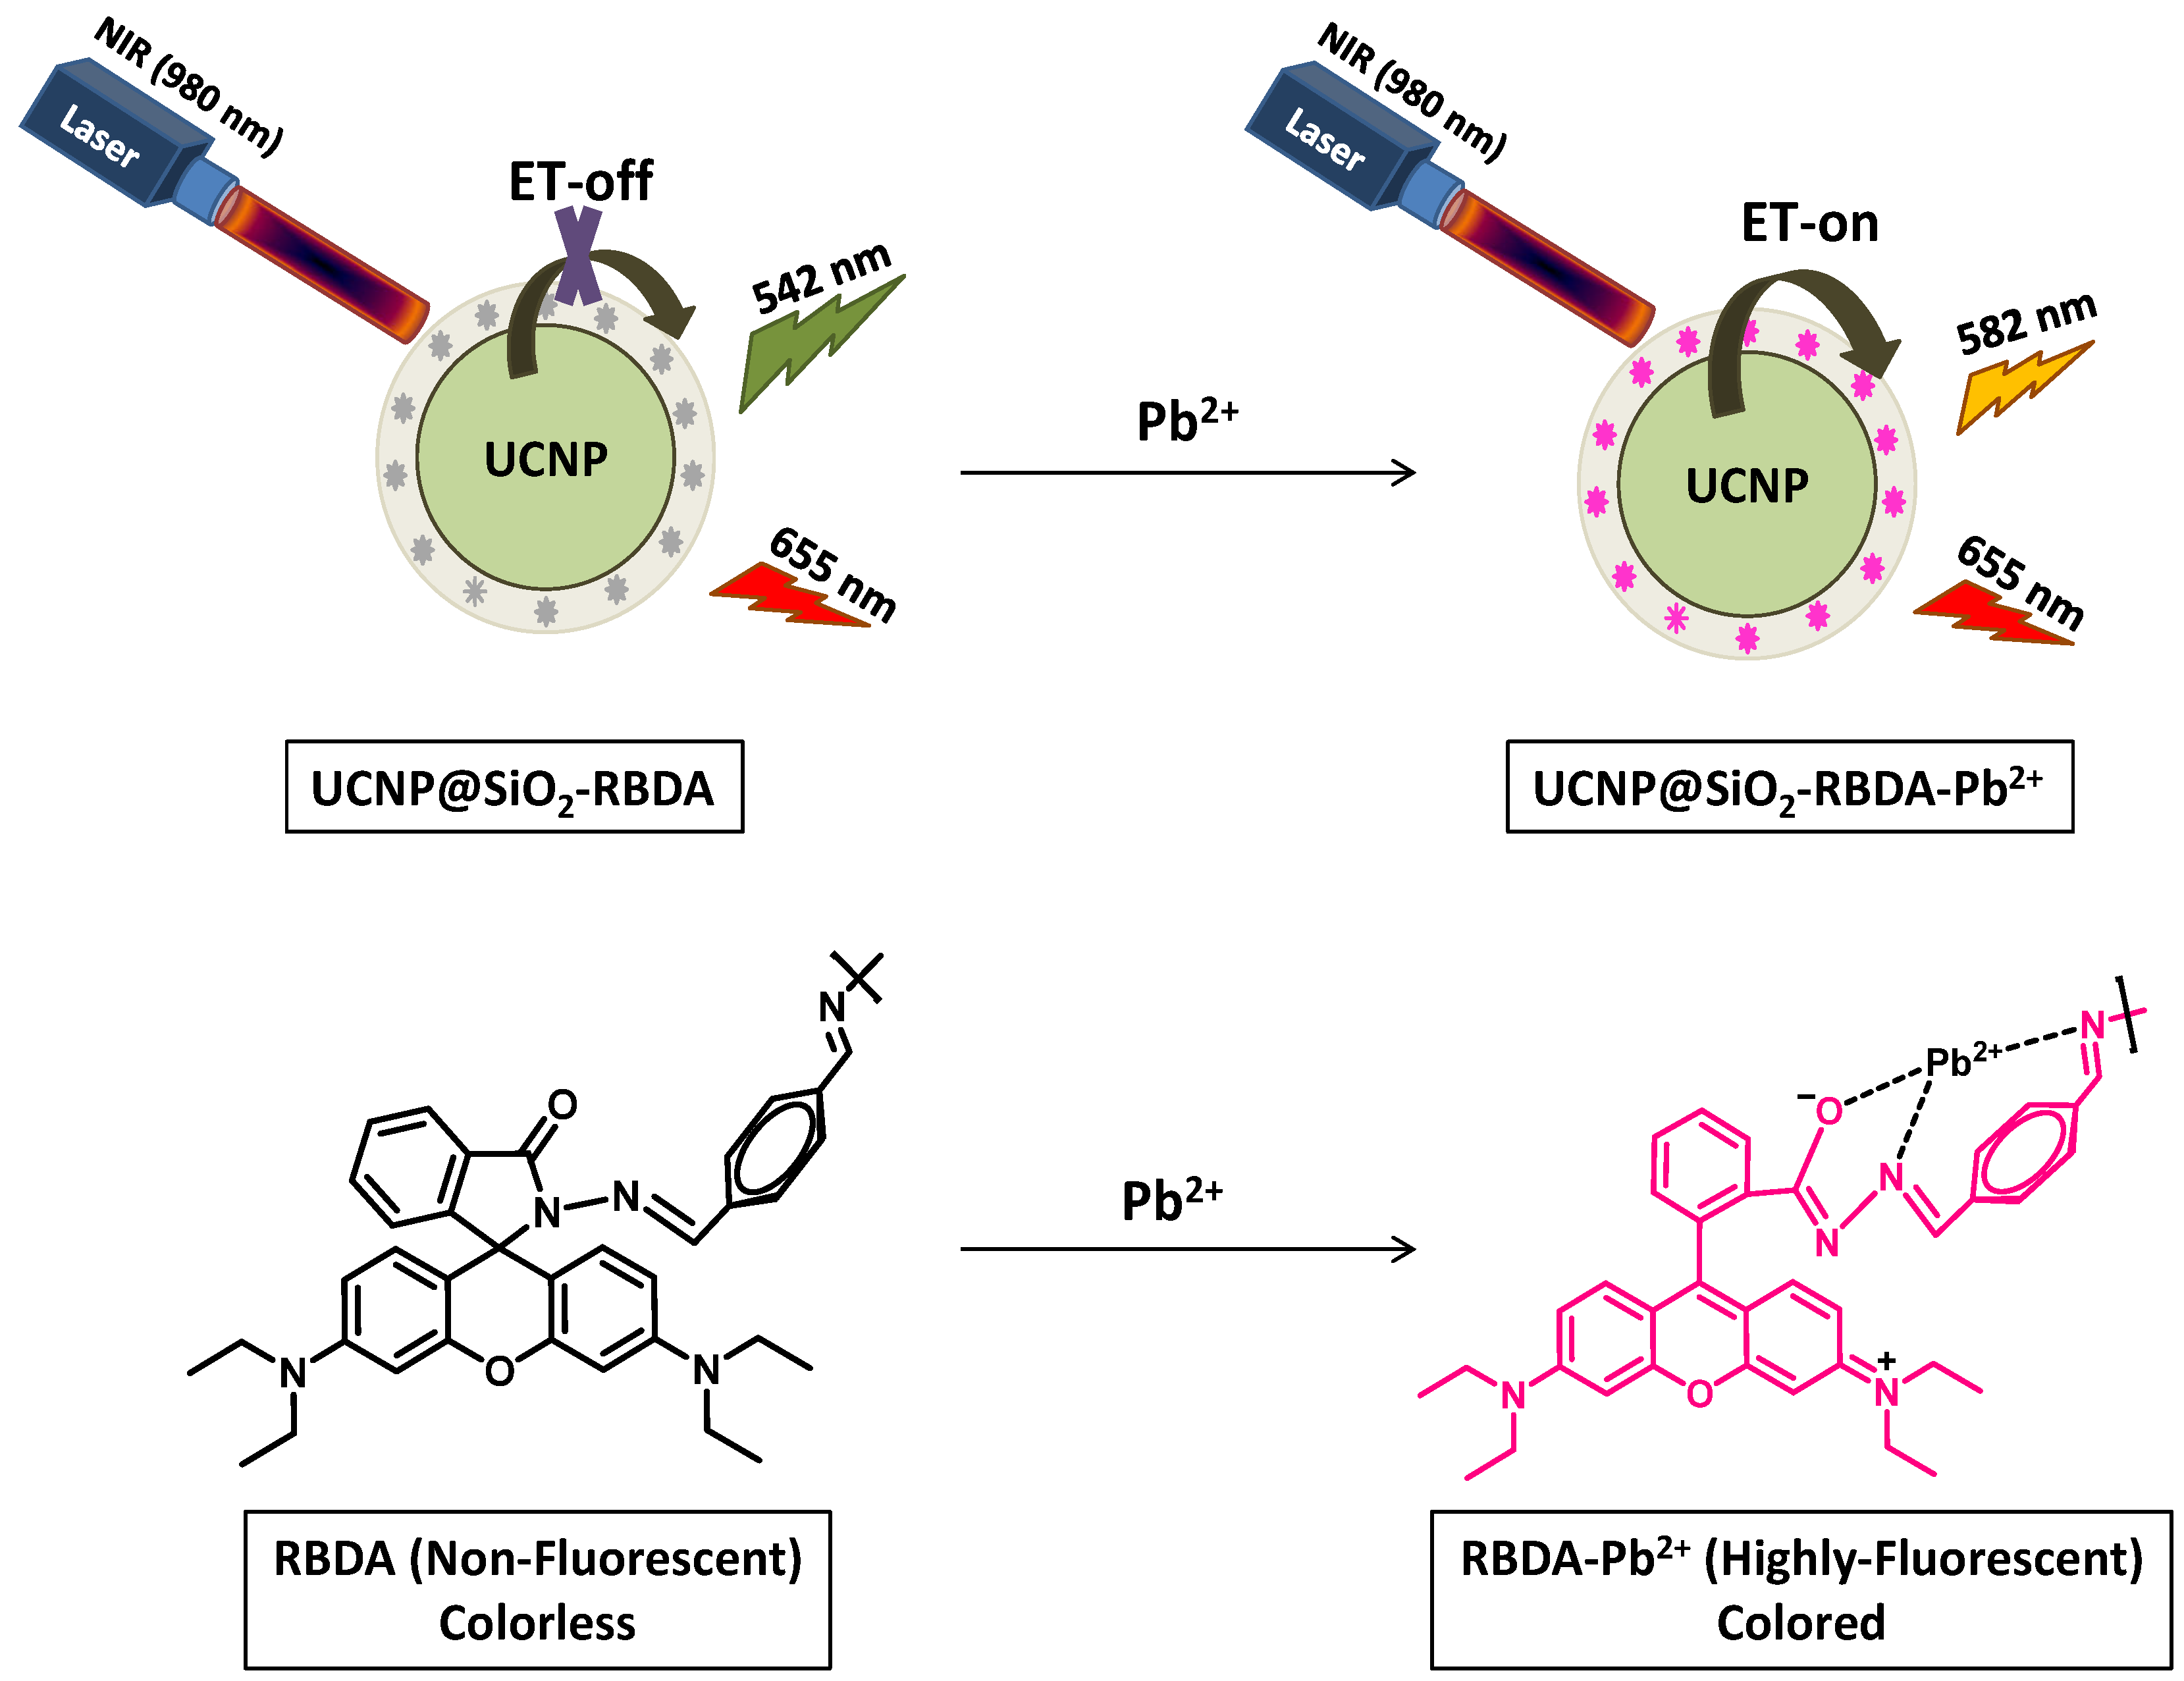
3.1. Synthesis and ET-Based Sensing Mechanism

In order to develop the NIR-excited, ET-based nanochemosensor, first we synthesized a Pb2+ responsive derivative of rhodamine-B ((E)-4-(((3′,6′-bis(diethylamino)-3-oxospiro[isoindoline-1,9′-xanthen]-2-yl)imino)methyl)benzaldehyde or RBDA) in a two-step reaction process (Figure S1A), which serves as an energy acceptor in this study. The successful synthesis of RBDA in a two-step reaction from rhodamine B was confirmed by the 1H NMR and 13C NMR spectra (Figures S6 and S7). Concurrently, the rare-earth nitrate with oelic acid (OA) and 1-octadecence (ODC) at 315 °C was used to synthesize the hexagonal upconverting nanophosphors (UCNPs) by following the solvothermal method. These β-phase UCNPs which act as an energy donor in a nanochemosensor were composed of host material NaYF4, sensitizer Yb3+, and the activator Er3+. The synthesized OA-capped UCNPs were well dispersed in cyclohexane. The coating of silica with free amino groups on the surface of UCNPs was carried out by using the CTAB as surfactant to make them hydrophilic, which gives them perfect dispersion in water and also offers free functional groups for further subsequent reactions. In order to achieve an effective energy transfer from UCNPs to the probe RBDA, this silica layer should not be too thick. After that, the as-synthesized RBDA was covalently conjugated on the surface of silica-coated UCNPs, resulting in the formation of the NIR-excited nanochemosensor (Figure S1B). The structure of RBDA changes from a closed-ring (colorless and non-fluorescent) to an open-ring (colored and fluorescent) configuration when it coordinates with Pb2+ ions, whether it is free or UCNP-linked. The absorption spectra of Pb2+ coordinated RBDA (open ring) overlaps with the green emissions of UCNPs, demonstrating an effective energy transfer (ET) to the acceptor (RBDA). It is evident that when the concentration of Pb2+ ions increases, the ET between UCNP (donor) and open-ring RBDA (acceptor) considerably increases, leading in an instantaneous reduction in the green emission peaks of UCNP and elevation in the yellow emission peak of RBDA in upconveting photoluminescence spectra. The mechanism of ET-based detection of Pb2+ ions in the nanochemosensor is represented in Figure 1.

3.2. Structural and Morphological Characterization

The structural and morphological characteristics of the nanophosphors were studied using TEM and FESEM techniques. The FESEM images at the scale bars of 500 nm and 50 nm (Figure 2A,B) show that the synthesized UCNPs are uniform in size, with a hexagonal morphology. In accordance with the FESEM results, the TEM data (Figure 2C) clearly demonstrates that UCNPs have a hexagonal shape and size in range of 180 to 200 nm. Additionally, the silica coating on the surface of UCNP can be observed by the high-resolution TEM data (in Figure 2D). The EDS (energy dispersive X-ray spectroscopy) spectrum shown in Figure S2A,B confirmed that the synthesized material contained all the elements (Na, Y, F, Yb, and Er). It also confirmed the silica coating on the surface of UCNP. According to the DLS data as shown in Figure S3, the UCNPs’ polydispersity index and average size were 0.186 and 179.8 nm, respectively. Figure S4 displays the X-ray diffraction patterns, which illustrate that the synthesized nanophosphors having the hexagonal phase and sharp peaks validate high product crystallinity; this obtained XRD pattern is consistent with the reference data cards (JCPDS 16-0334) [45]. The absence of any additional peaks in the spectrum validates the purity of synthesized material.
Figure S5 displays the FT-IR spectra of OA-capped UCNP, UCNP@SiO2(NH2), RBDA, and UCNP@SiO2-RBDA in the wide (500–4000 cm−1) range. Four prominent peaks were observed in the spectrum of the synthesized UCNPs at 1456, 1628, 2852, and 2926 cm−1. The -COO group of oleic acid-capped UCNP generated the two bands centered at 1462 and 1612 cm−1 as a result of symmetric and asymmetric stretching vibrations, respectively. In addition, the methylene group (-CH2) stretching vibrations in the long alkyl chain of oleic acid were found to be responsible for the bands at 2926 and 2852 cm−1. After amine-functionalized silica coating on the surface of UCNPs, four new bands at 786, 1058, 1640, and 3412 cm−1 emerged, among which the stretching vibration of Si-O is responsible for the 786 and 1058 cm−1 peaks. The stretching vibration and shear bending vibration of N-H in the -NH2 group cause bands at 3412 and 1640 cm−1, respectively. Covalent grafting of RBDA was achieved using these amino groups on the silica-coated nanophosphors surface. Next in the spectrum of UCNP@SiO2-RBDA, three new peaks have been seen at 1215, 1612, and 1682 cm−1, which are correlated to the stretching frequencies of the -CO, -NHCO, and -C꞊N- groups, respectively. The peak of -NH2 group disappeared, indicating the role of this group in creating covalent bond with RBDA. This was further supported by the absence of -CHO peak (of free RBDA) and the presence of imine stretching at 1682 cm−1 in the UCNP@SiO2-RBD.

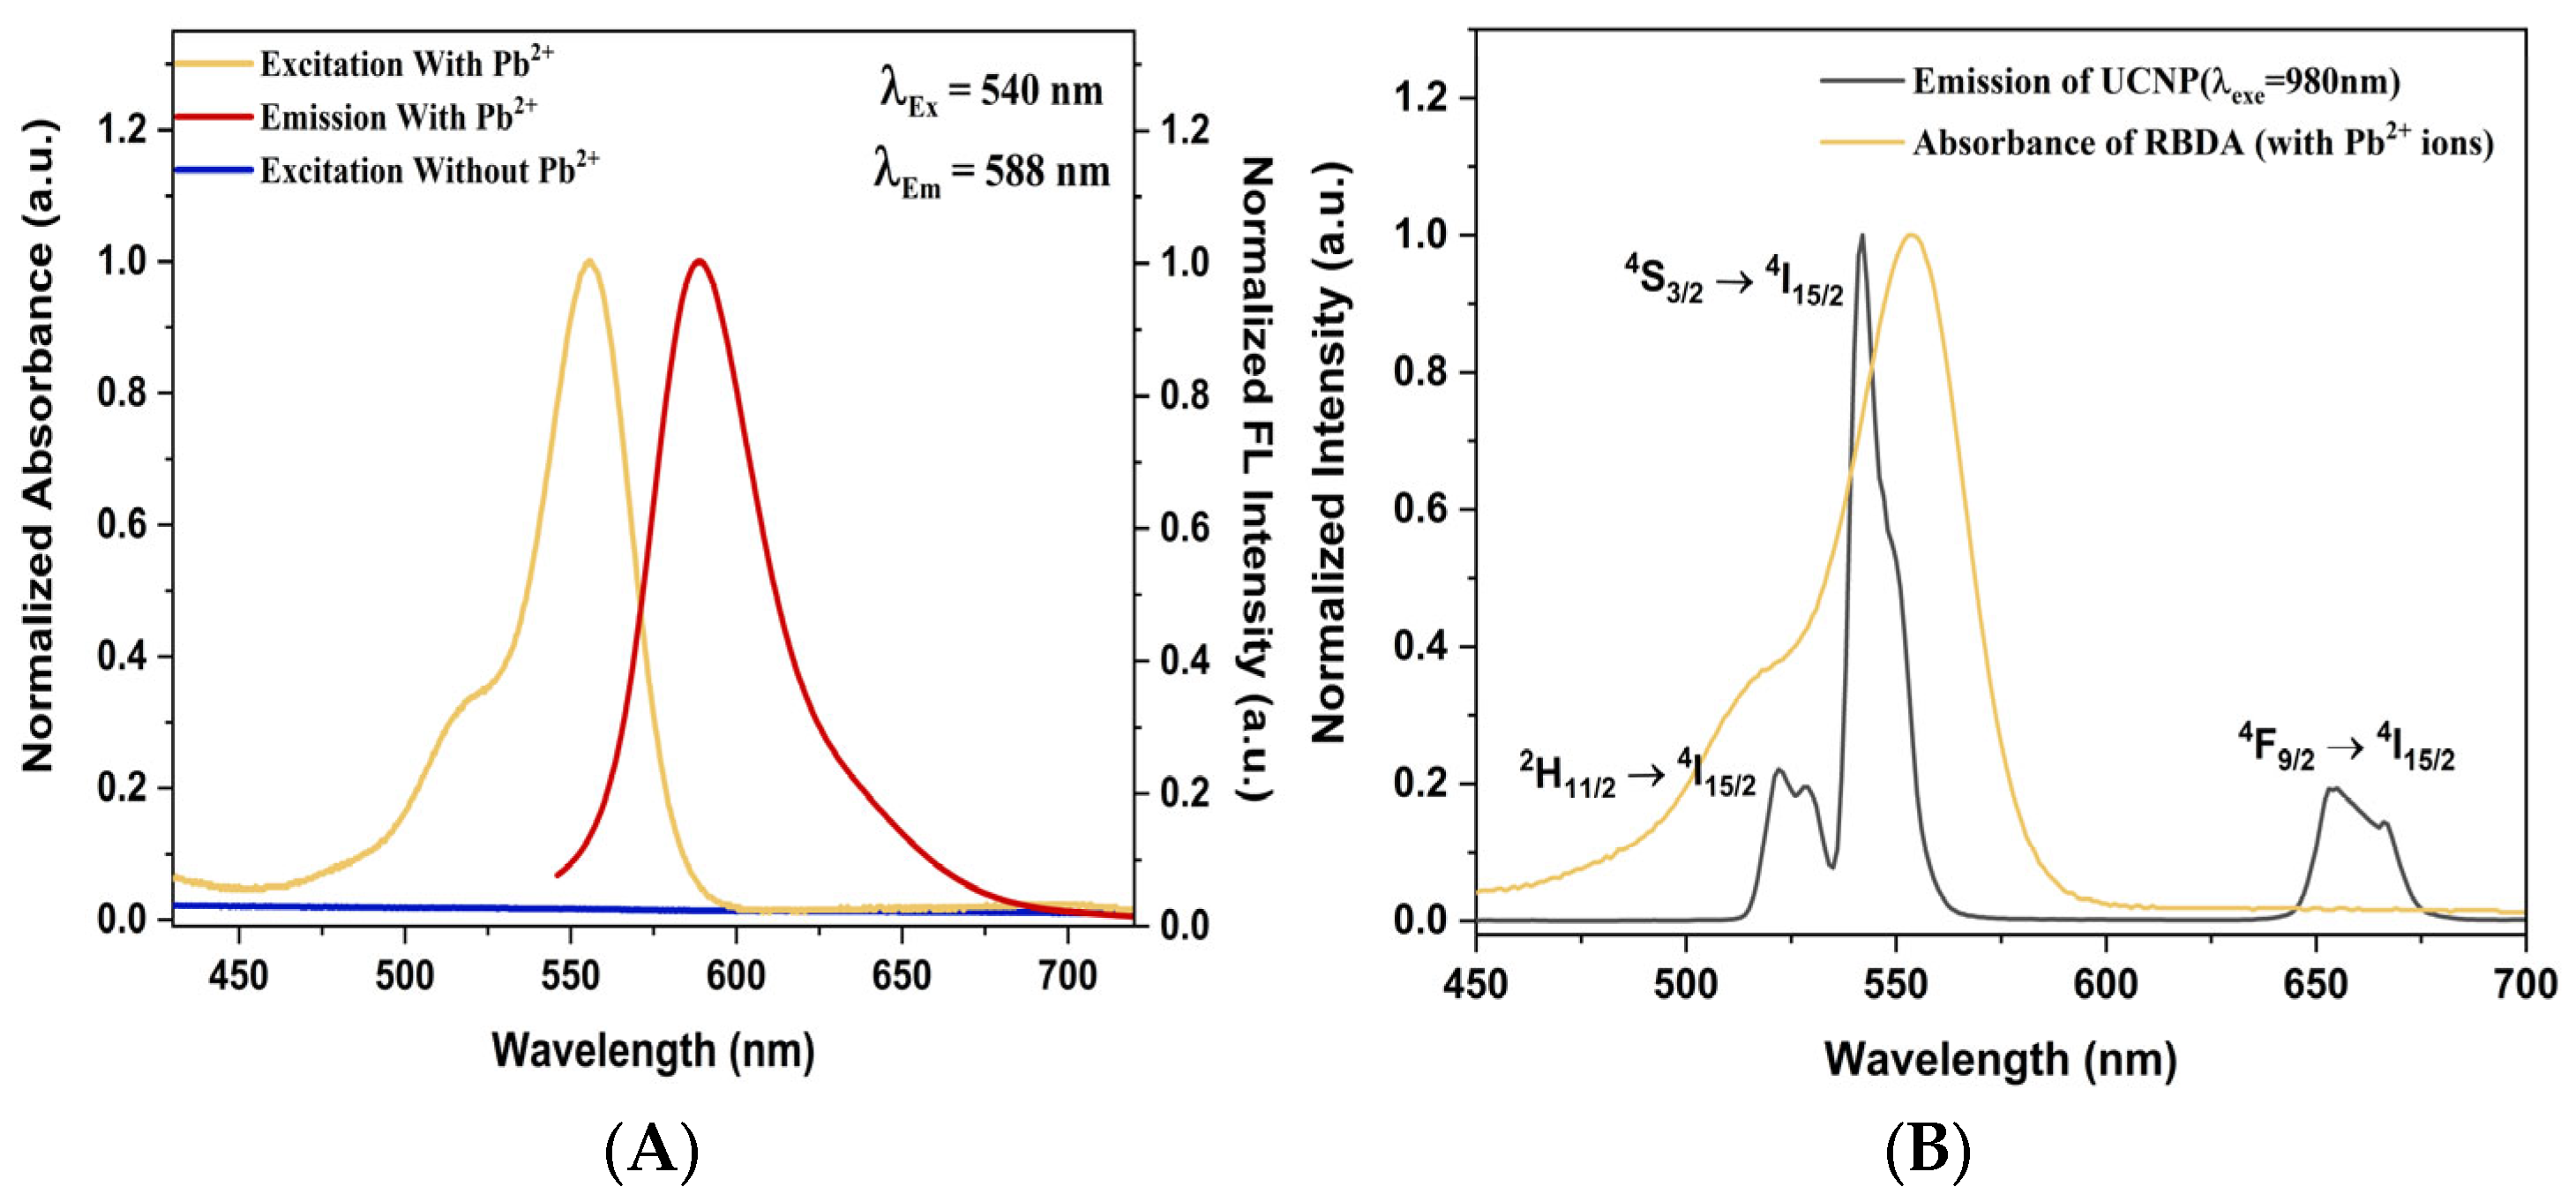
3.3. Luminescence Studies of UCNP and RBDA

The optical properties of RBDA were next investigated. Figure 3A shows the excitation and emission spectra of RBDA, with and without added Pb2+ ions. The graph shows clearly that pure RBDA (without Pb2+ ions) exhibits no apparent absorption or excitation. However, with the addition of Pb2+ ions, a distinct excitation band appeared, ranging from 495 to 595 nm (peaking at 554 nm). Additionally, the open-ring RBDA-Pb2+ complex emission band is observed with the maximum appearing at 588 nm (λEx = 540 nm) upon Pb2+ addition. Under the 980 nm NIR laser excitation, the synthesized silica-coated UCNPs’ upconverting photoluminescence emission spectra exhibit distinct emission bands at 522 nm and 542 nm, as well as 655 nm as shown in Figure 3B. It has been already reported in various studies that these bands correspond to Er3+ ion transitions 2H11/24I15/2, 4S3/24I15/2, and 4F9/24I15/2, respectively [46,47,48]. It can also be observed from Figure 4B that the absorption band Pb2+-coordinated RBDA (open ring form) and the two green upconverting emission bands of UCNPs overlap perfectly. This makes energy transfer easier from UCNP to open-ring RBDA (coordinated with Pb2+).

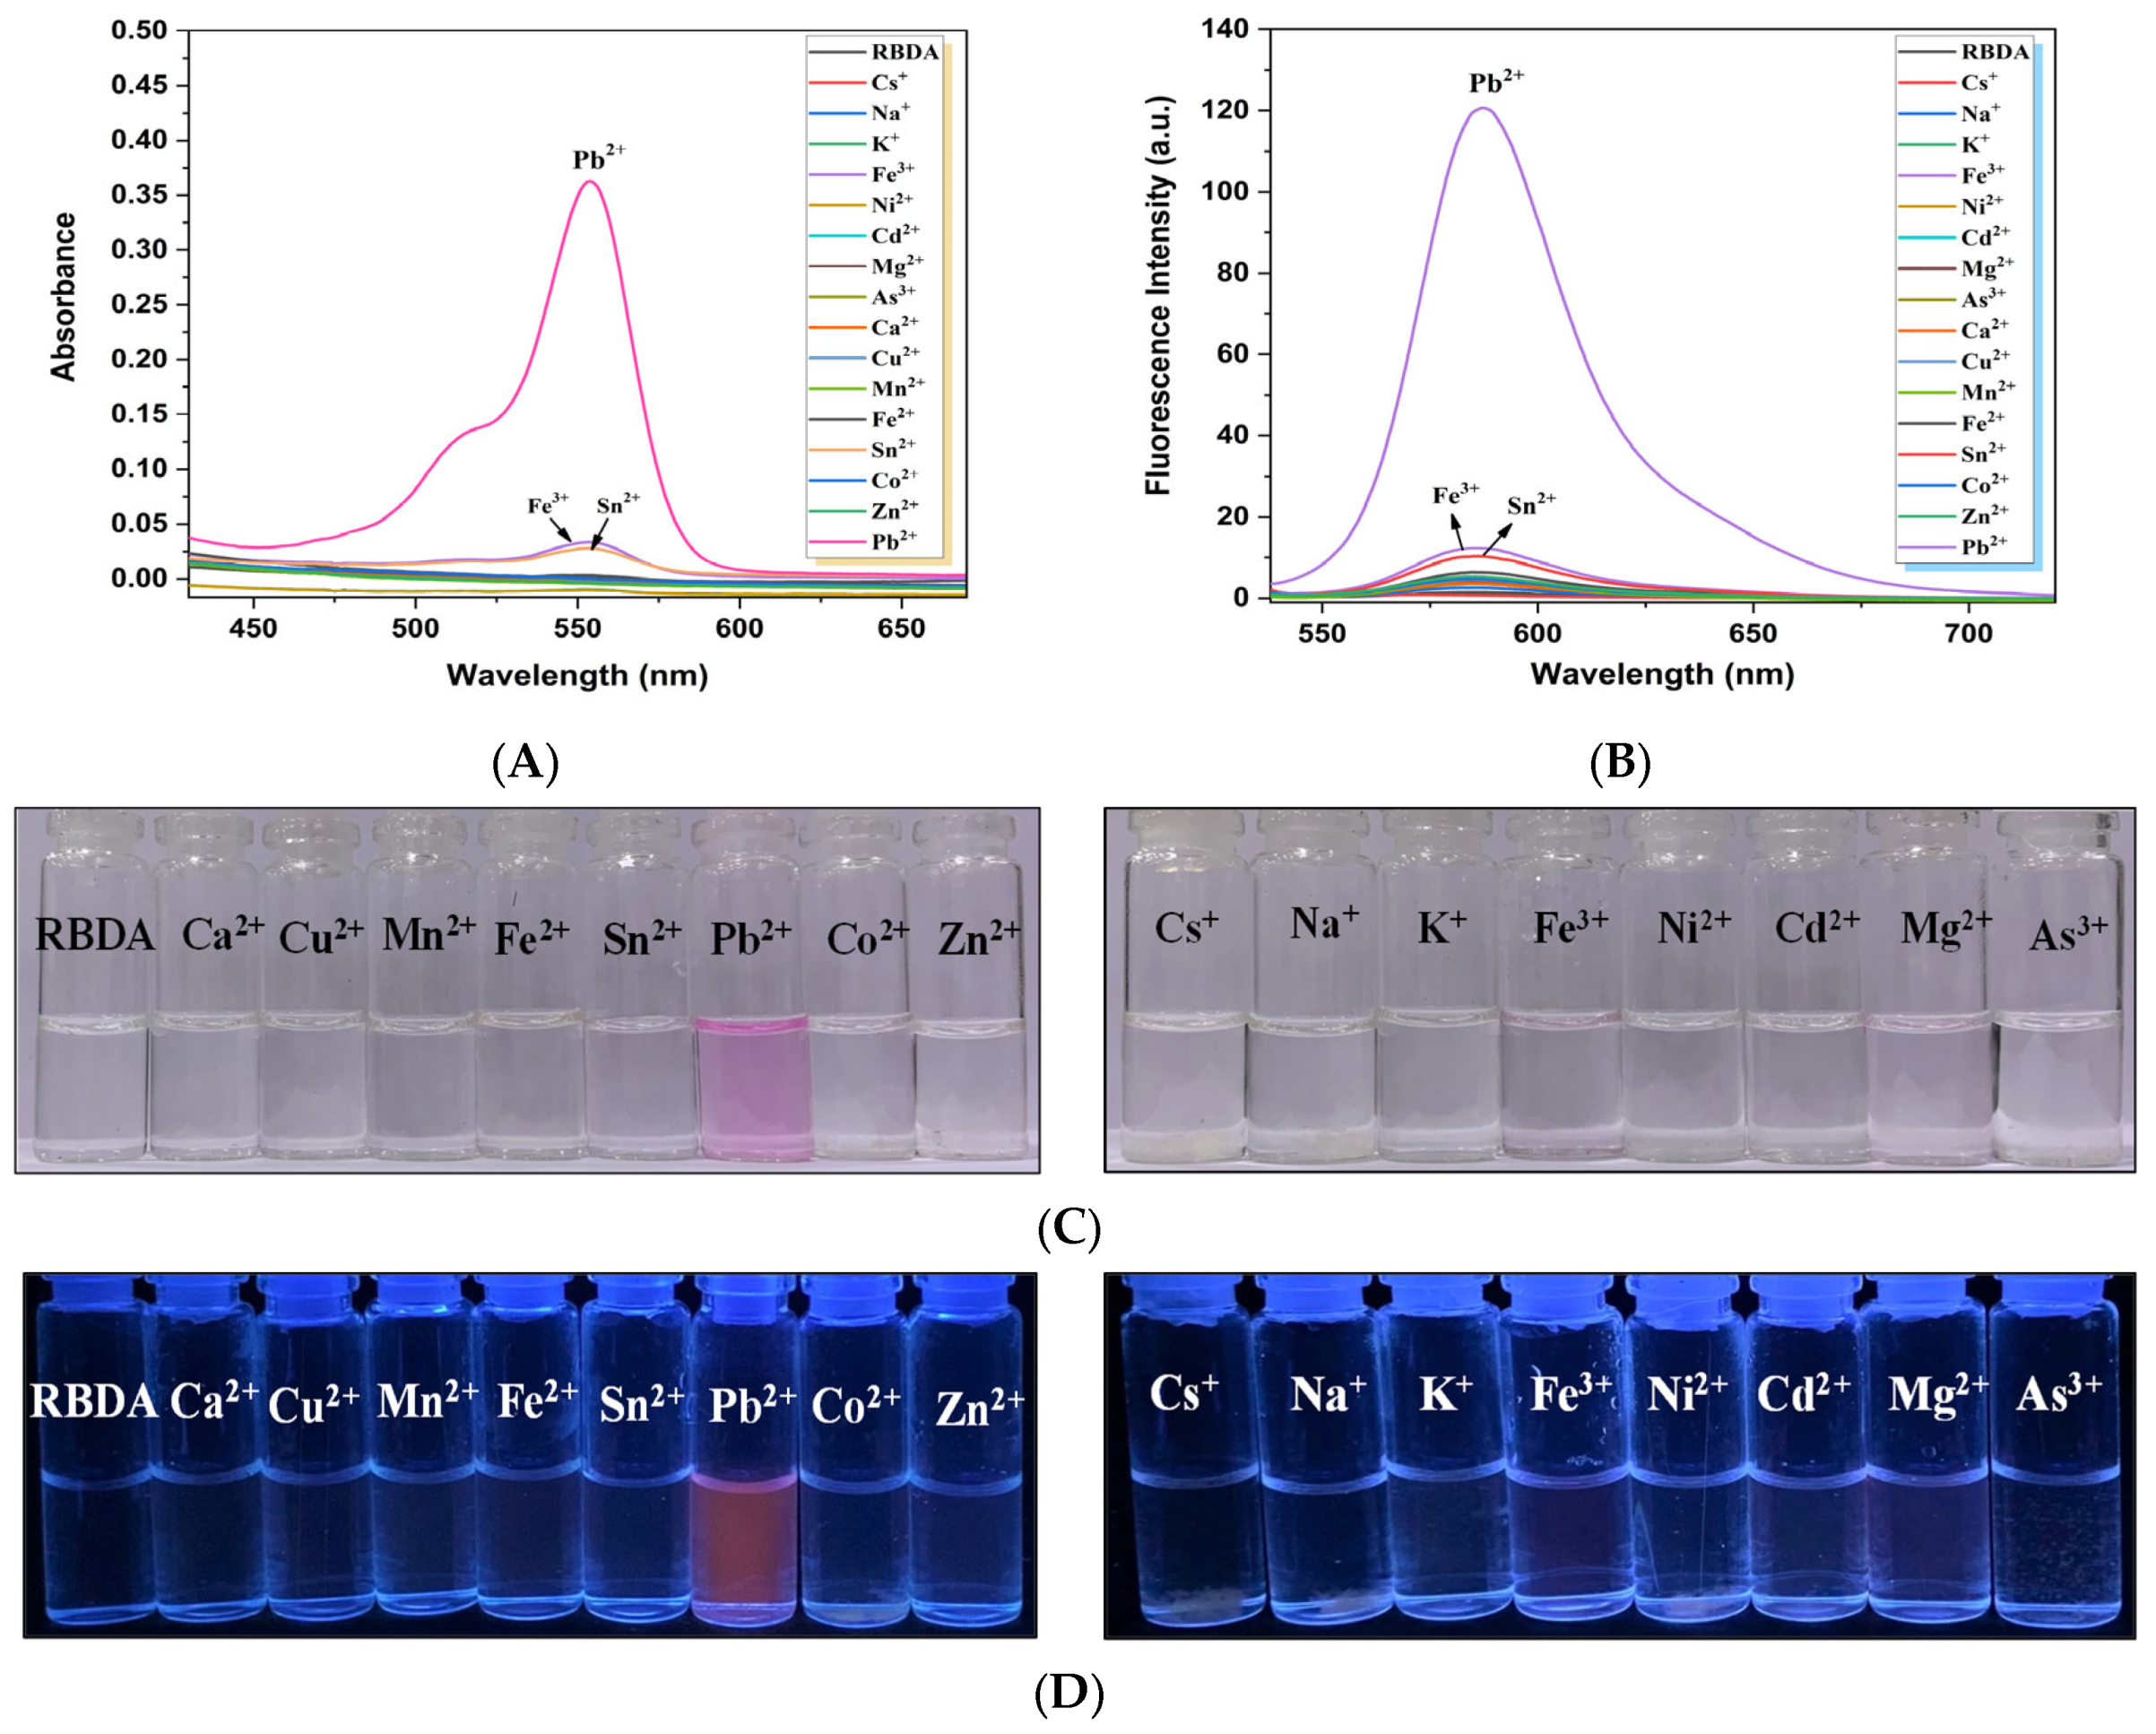
3.4. Selectivity of RBDA Chemosensor towards Pb2+ Ions

To evaluate the selectivity of free RBDA towards various metal cations (including Pb2+), the UV–visible spectroscopy was used. Figure 4A shows that the absorption of RBDA only significantly increased with the addition of Pb2+ ions, λmax at 554 nm. The visual appearance of RBDA changing from colorless to magenta only in the presence of Pb2+ ions, and other metal ions do not show any significant effect, as shown in Figure 4C. Figure 4B illustrates the fluorescence spectra of free RBDA against several metal ions. Similar to the UV–visible spectrum data, only upon treatment with the Pb2+ ions, the substantial increase in the fluorescence intensity was observed. Other metal ions do not change fluorescence intensity significantly. Additionally, the fluorescent red color appears in the presence of Pb2+ ions as can be seen in the fluorescent image (Figure 4D), proving that RBDA has greater affinity towards Pb2+ ions. This analysis proves that Pb2+ ions are more preferred by RBDA than other metal ions. The α-amino acid ester ring of RBDA (spirolactam) can be hydrolyzed with the assistance of Pb2+ ions, as schematically seen in Figure 1, which leads to the creation of Pb2+-α-amino acid chelate (fluorescent) as a result of the ring opening of RBDA. This open-ring structure shows color due to the electronic transition in the xanthene moiety. Therefore, RBDA can be used as an efficient Pb2+ ion selective optical chemosensor.

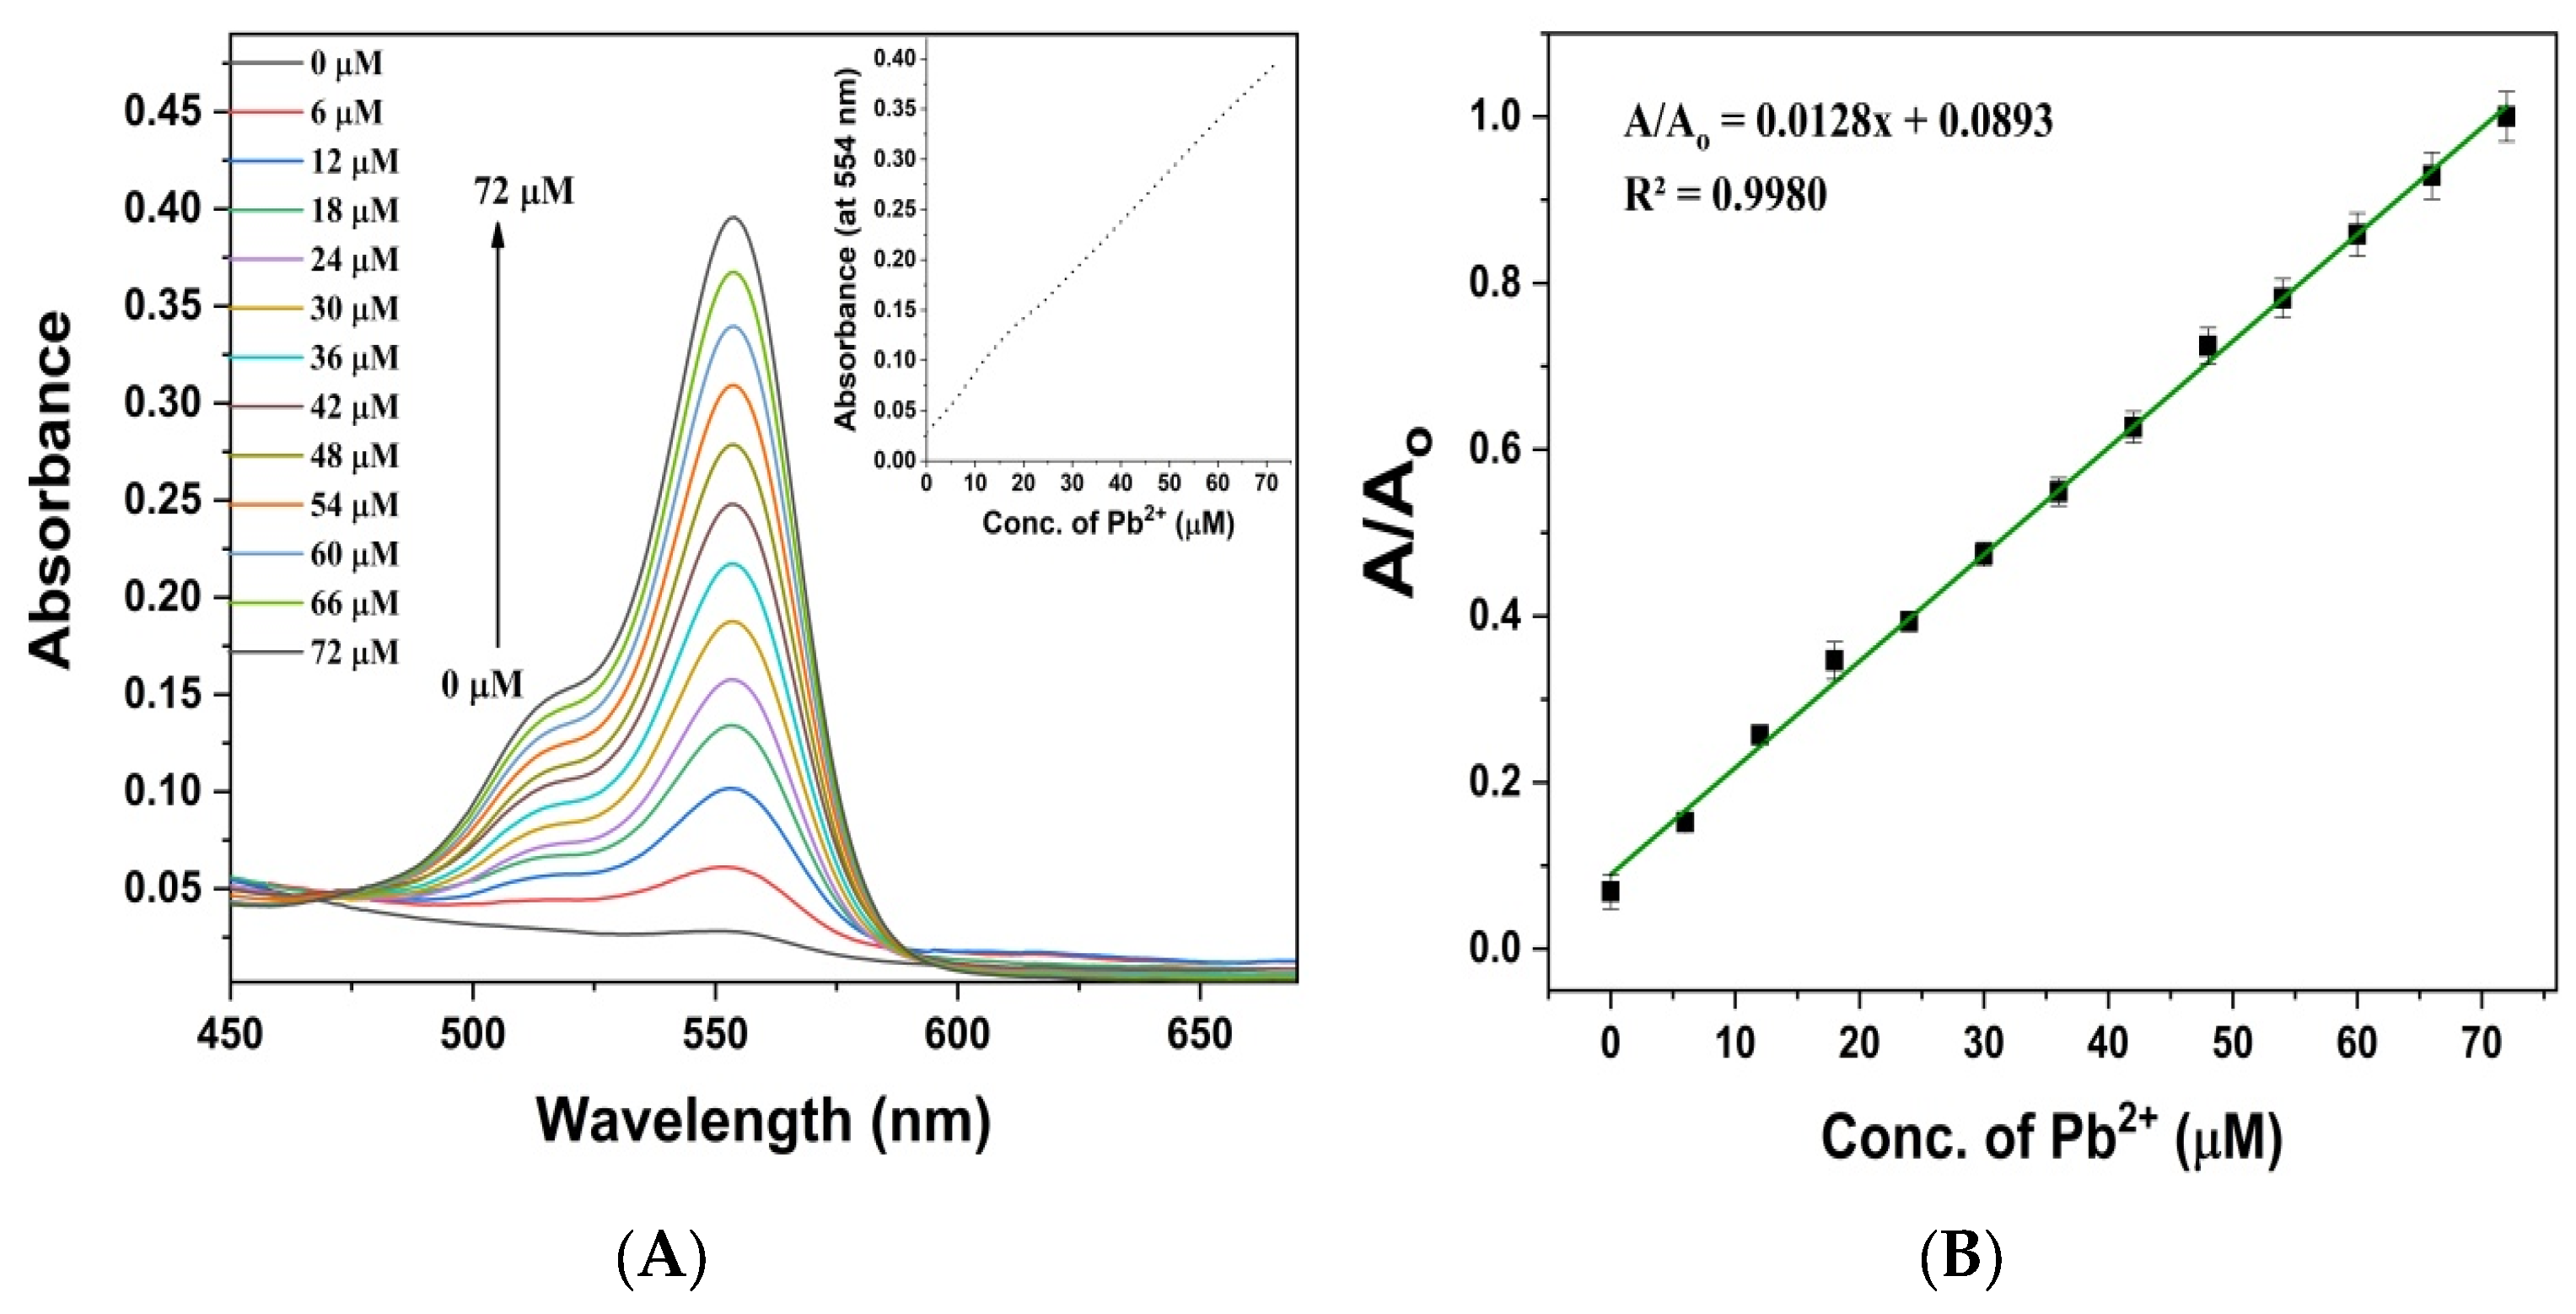
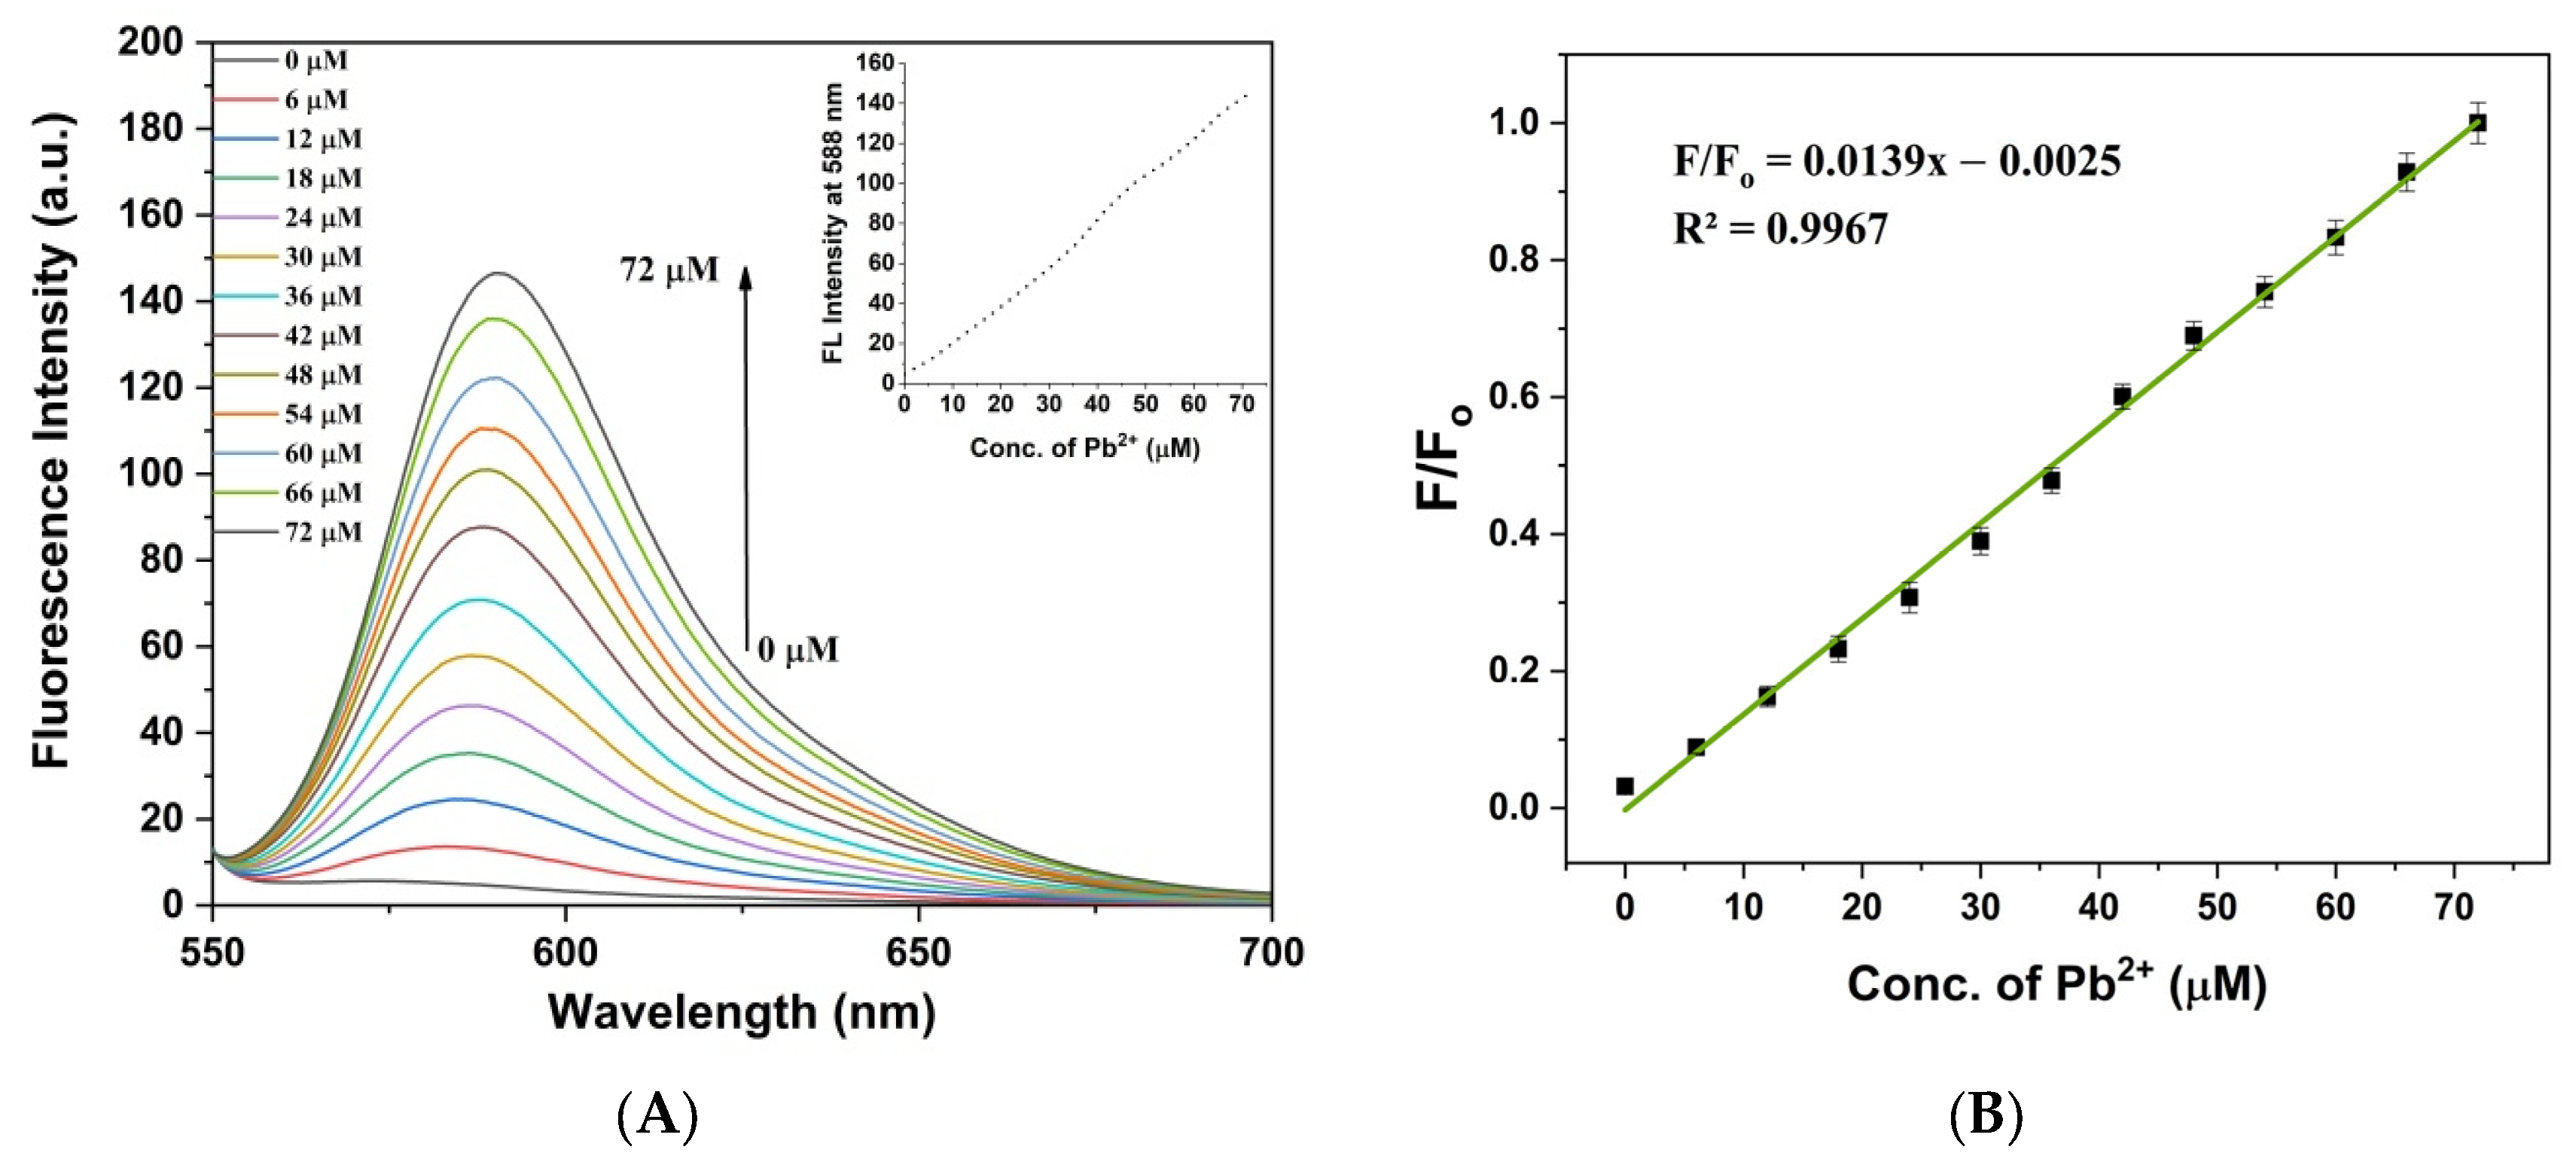
3.5. Sensitivity and Response Time of RBDA Chemosensor

To determine the sensitivity of RBDA, we have taken the UV–visible and fluorescence titration spectra upon increasing concentration of Pb2+ ions. Figure 5A displays the RBDA (0.1 mL of stock in 3 mL of water/ethanol 2:1) absorption spectra as a function of increasing concentration of Pb2+ ions from 0 to 72 µM. The linear rise in Pb2+ concentration resulted in a substantial increase in the intensity of the absorption band with a center wavelength of 554 nm, as shown in Figure 5A (inset). Figure 5B illustrates a calibration curve for concentration-dependent relative absorbance intensity of RBDA. It is evident that the relative intensity grew steadily with the concentration of Pb2+ ions, with an R2 value of 0.9980. The LOD (limit of detection), which is equivalent to three times the deviation of the blank response (3σ), [39] of RBDA for Pb2+ was found to be 0.149 µM.
With increasing Pb2+ concentrations (0–72 µM), the fluorescence spectra of RBDA solution (0.1 mL of stock in 3 mL of water/ethanol, 2:1) showed a noticeable rise in fluorescence intensity at 588 nm (Figure 6A), as seen in Figure 6A (inset), which depends linearly on the concentration of Pb2+ ions. As illustrated in Figure 6B, the calibration curve displays a co-linear relationship (F/Fo = 0.0139x − 0.0025, R2 = 0.9967, where x is the concentration of Pb2+ ions). Fluorescence spectroscopy’s detection limit (3σ) was found to be 0.216 µM, demonstrating that we might use this technique to detect ecologically important levels of Pb2+. Additionally, by using fluorescence spectroscopy, the time-dependent response of RBDA towards Pb2+ ions was studied. As shown in Figure S8, the response of RBDA to Pb2+ ion was fast, with the peak signal found around 70 s. This analysis indicates that the nanoprobe shows fast response to Pb2+ ions and thus can be utilized to effectively monitor and evaluate Pb2+ levels in aqueous media.

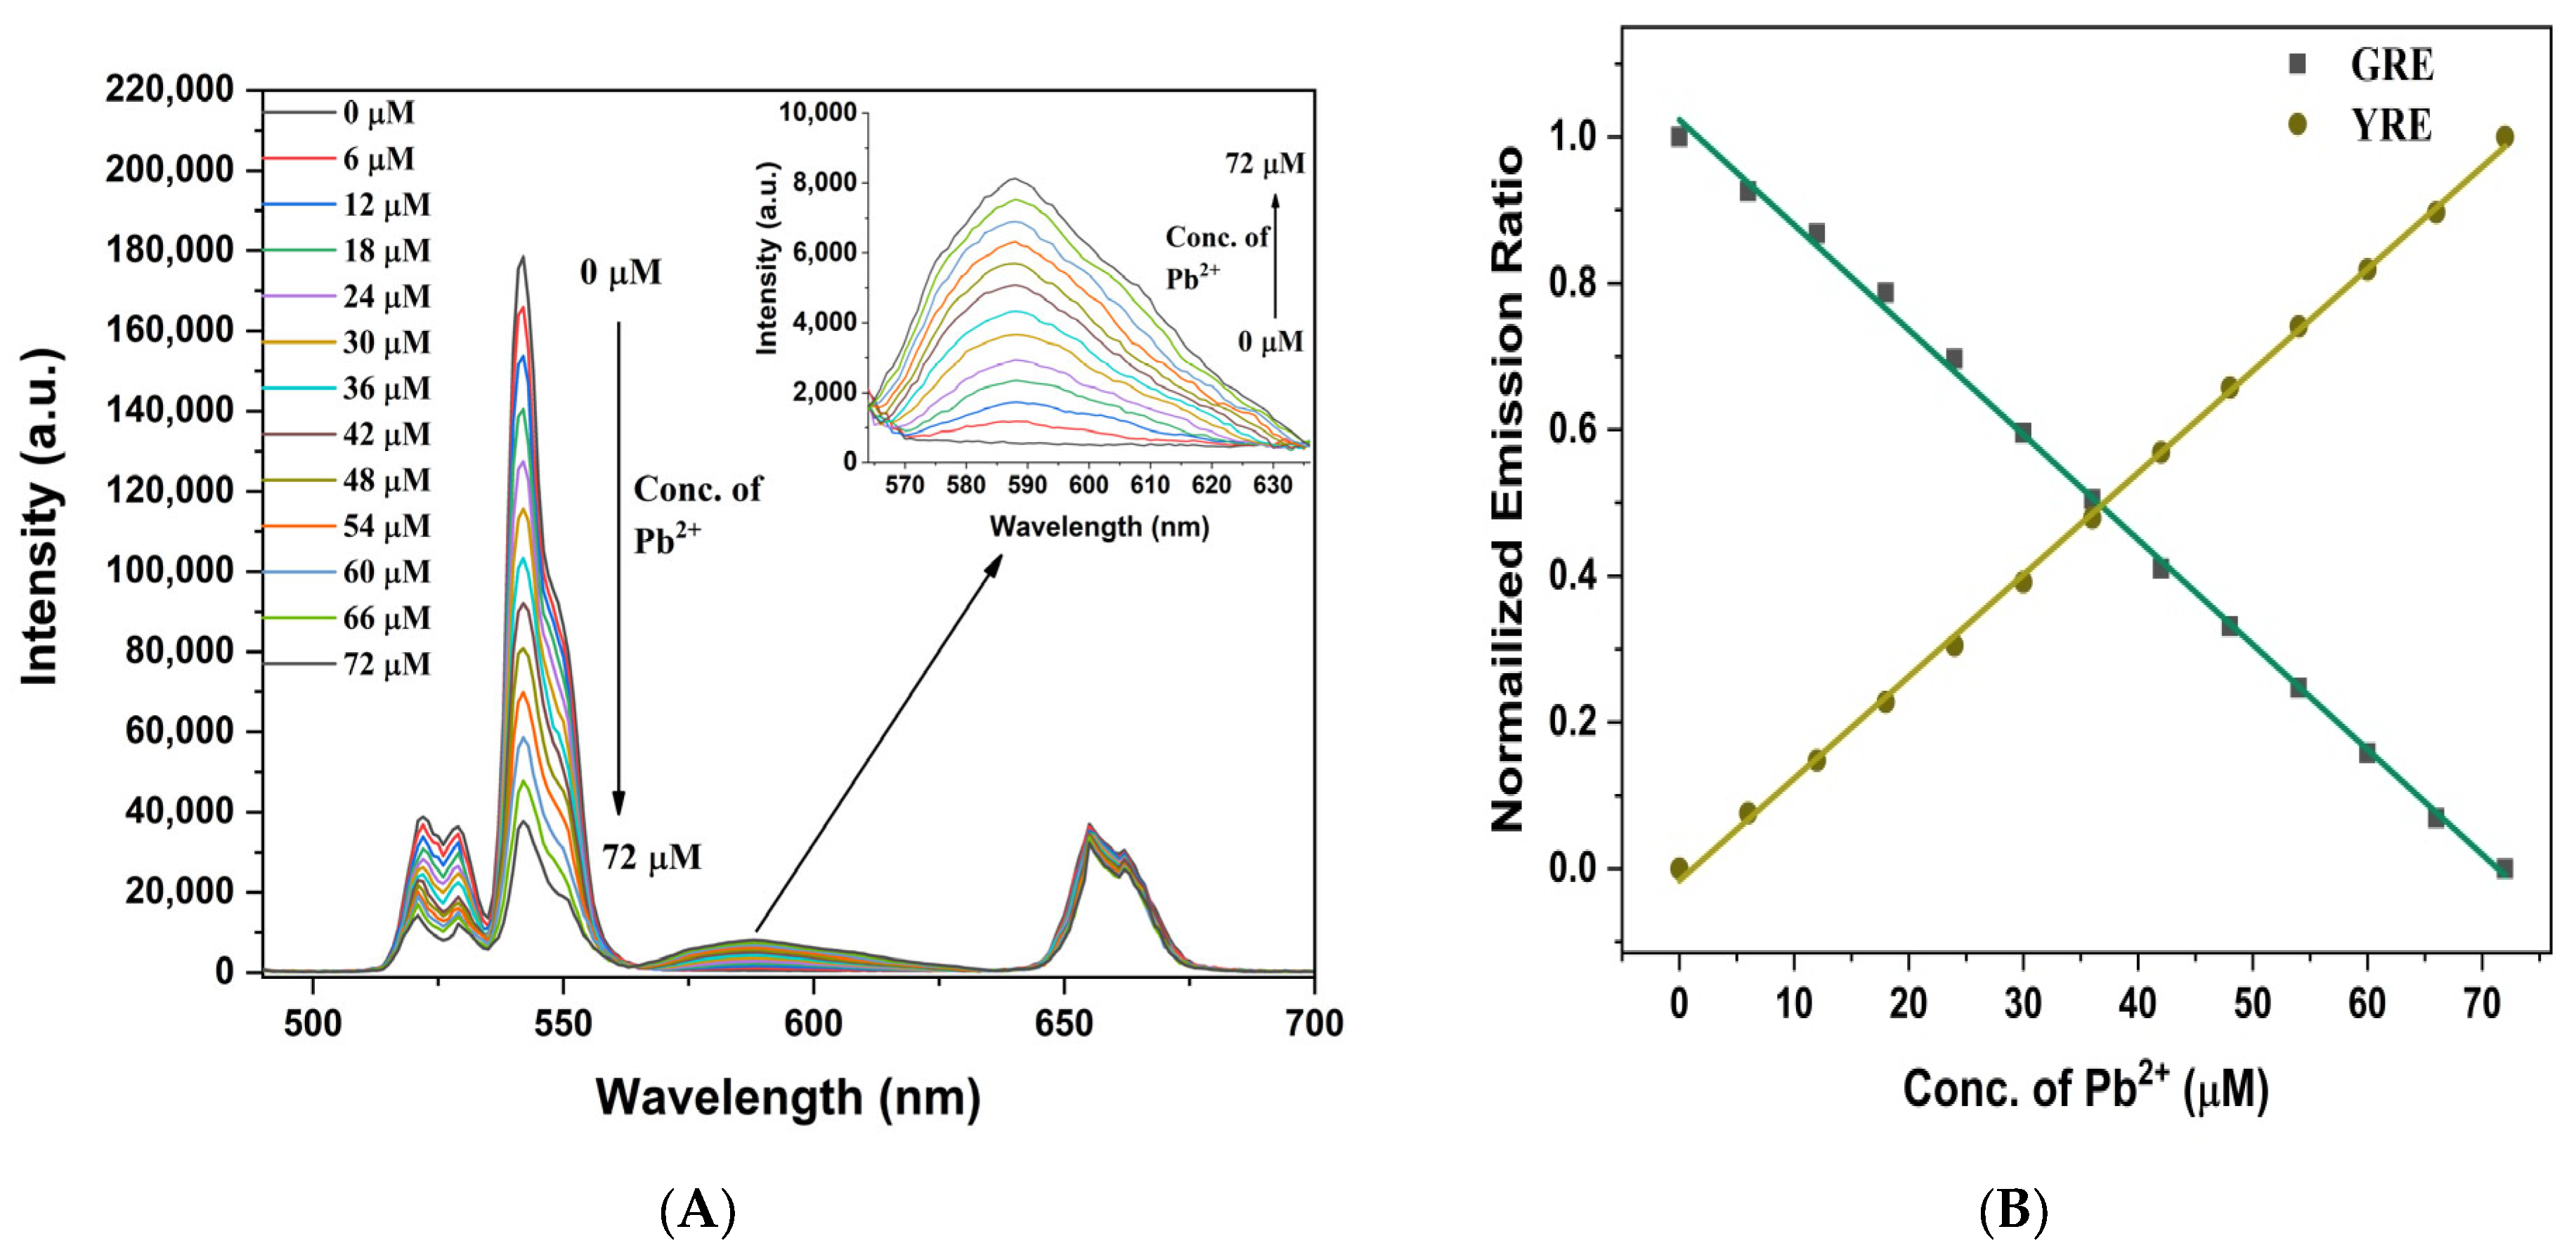
3.6. ET-Based Sensing of Pb2+ by NIR Excited Chemosensor (UCNP@SiO2-RBDA)

Next, we explored whether the UCNPs, which enable ET-based ratiometric analysis in combination with RBDA when excited by deep-tissue penetrating NIR light, can further enhance the detection limit of Pb2+ ions. First, under NIR laser irradiation, a range of Pb2+ ion concentrations (0–72 µM) was used to analyze the upconverting emission spectra of UCNP@SiO2-RBDA. As noted previously, energy transfer (ET) from the UCNPs to the RBDA-Pb2+ complex under NIR excitation is caused by the spectrum overlap between the absorption peak of RBDA-Pb2+ and the green emission peak of UCNP. Figure 7A shows that UCNP@SiO2-RBDA displayed both green and red emission peaks in the absence of Pb2+ ions. Then, as Pb2+ ions were added to the UCNP@SiO2-RBDA in increasing concentrations, the intensity of the green emission peaks (at 522 nm and 542 nm) gradually reduced. Concurrently, a new, wider yellow emission with a peak at 588 nm was observed, which is due to the linked open-ring RBDA-Pb2+ complex. The continuous decrease in green emission and enhancement of the yellow emission at 588 nm with the increasing concentration of Pb2+ confirmed the successful transfer of optical energy from UCNP to RBDA-Pb2+. At the same time, the addition of Pb2+ does not alter the red emission of UCNP at 655 nm. Since RBDA does not absorb in the red region (655 nm), even with added Pb2+, this fixed red emission band can be used as an internal reference in this process.
The green-to-red emission (GRE) ratios (I542/I655) and yellow-to-red emission (YRE) ratios (I588/I655) at various concentrations of Pb2+ ions are shown in Figure S9A,B. High R2 linear fits were attained for both the GRE (0.9984) and YRE (0.9992) forms, indicating highly precise and reliable Pb2+ sensing. The changing trends of both GRE and YRE as a function of Pb2+ concentration support the UCNP emission/RBDA absorption overlap and consequent ET, with UCNPs acting as energy donor and Pb2+-coordinated RBDA as energy acceptor. The ratio of I542/I655 and I588/I655 ranged from 4.8 to 1.1 and 0.01 to 0.25, respectively, when the concentration of Pb2+ ions ranged from 0 to 72 µM, showing strong linear correlation (I542/I655 = −0.0525x + 4.9146, R2 = 0.9984 and I588/I655 = 0.0032x + 0.0111, R2 = 0.9992, where x is the concentration of Pb2+ ions in μM). The sensitivity of the Pb2+ measurement is determined by the slope of the calibration curves. The sensitivities of the GRE and YRE were determined to be 0.0525 and 0.0032 per unit change in Pb2+ ion concentration (in µM), respectively. The RBDA emission intensity response to Pb2+ ions concentration has a significant linear coefficient (R2) up to 0.9992, indicating outstanding quantification characteristics. Figure 7B shows the variance in normalized GRE and YRE ratios at various Pb2+ ion concentrations.
Figure S10A,C show the emission intensity ratio at 542 nm (I542) to intensity at 588 nm (I588) and vice versa, respectively, against the Pb2+ concentration (0–72 µM). The ratios show the exponential trends; however, the logarithmic emission intensity plots were found to have liner relationship (Figure S10B,D). Since the free open-ring RBDA-Pb2+ complex exhibits no fluorescence when excited at 980 nm, this ratiometric technique can be utilized to determine the Pb2+ ion concentration. This ET-based ratiometric analysis obtained by upconverting photoluminescence spectroscopy revealed that the detection limit (3σ) was as low as 21 nM (0.021 µM); this is ten-fold more effective than the observations shown for free RBDA treated with Pb2+ ions using UV–Vis and fluorescence techniques. The obtained detection limit is significantly lower than the World Health Organization’s (WHO) permissible levels for Pb2+ contamination, which is 10 mg/L (48 µM) for potable water [49]. The UCNP@SiO2-RBDA nanoprobe has an improved detection limit for Pb2+ ions in comparison to several other reported probes, as shown in Table 1.
Additionally, we checked the ET process using more subtle Pb2+ ions concentration variations. Figure S11A shows the upconverting emission spectra of the nanochemosensor with the addition of Pb2+ ions in the range of 0–6 µM. The variations in spectra are clearly evident at low analyte concentrations due to the ET; even 1 μM of Pb2+ ions reduces the intensity of green emission peak due to the effective ET process in the nanoprobe.
Figure S12A,B shows the GRE and YRE ratios at various low Pb2+ concentrations (0–6 µM). Figure S11B displays the normalized GRE and YRE ratio for concentrations of Pb2+ ions ranging from 0 to 6 µM. Similar to the previous data, we also obtained high R2 linear fits for the GRE and YRE here, further validating the great sensitivity towards Pb2+ ions. The strong linear correlations were seen between the ratios of I542/I655 (GRE) and I588/I655 (YRE) for the concentration ranges of 0–6 μM (I542/I655 = −0.0805x + 4.1758, R2 = 0.9943 and I588/I655 = 0.0055x + 0.0228, R2 = 0.9968, where x is the concentration of Pb2+ ions in μM). The detection limit (3σ) was determined to be 20 nM from these low concentration results, which fits with the data collected for the concentration range of 0–72 μM.

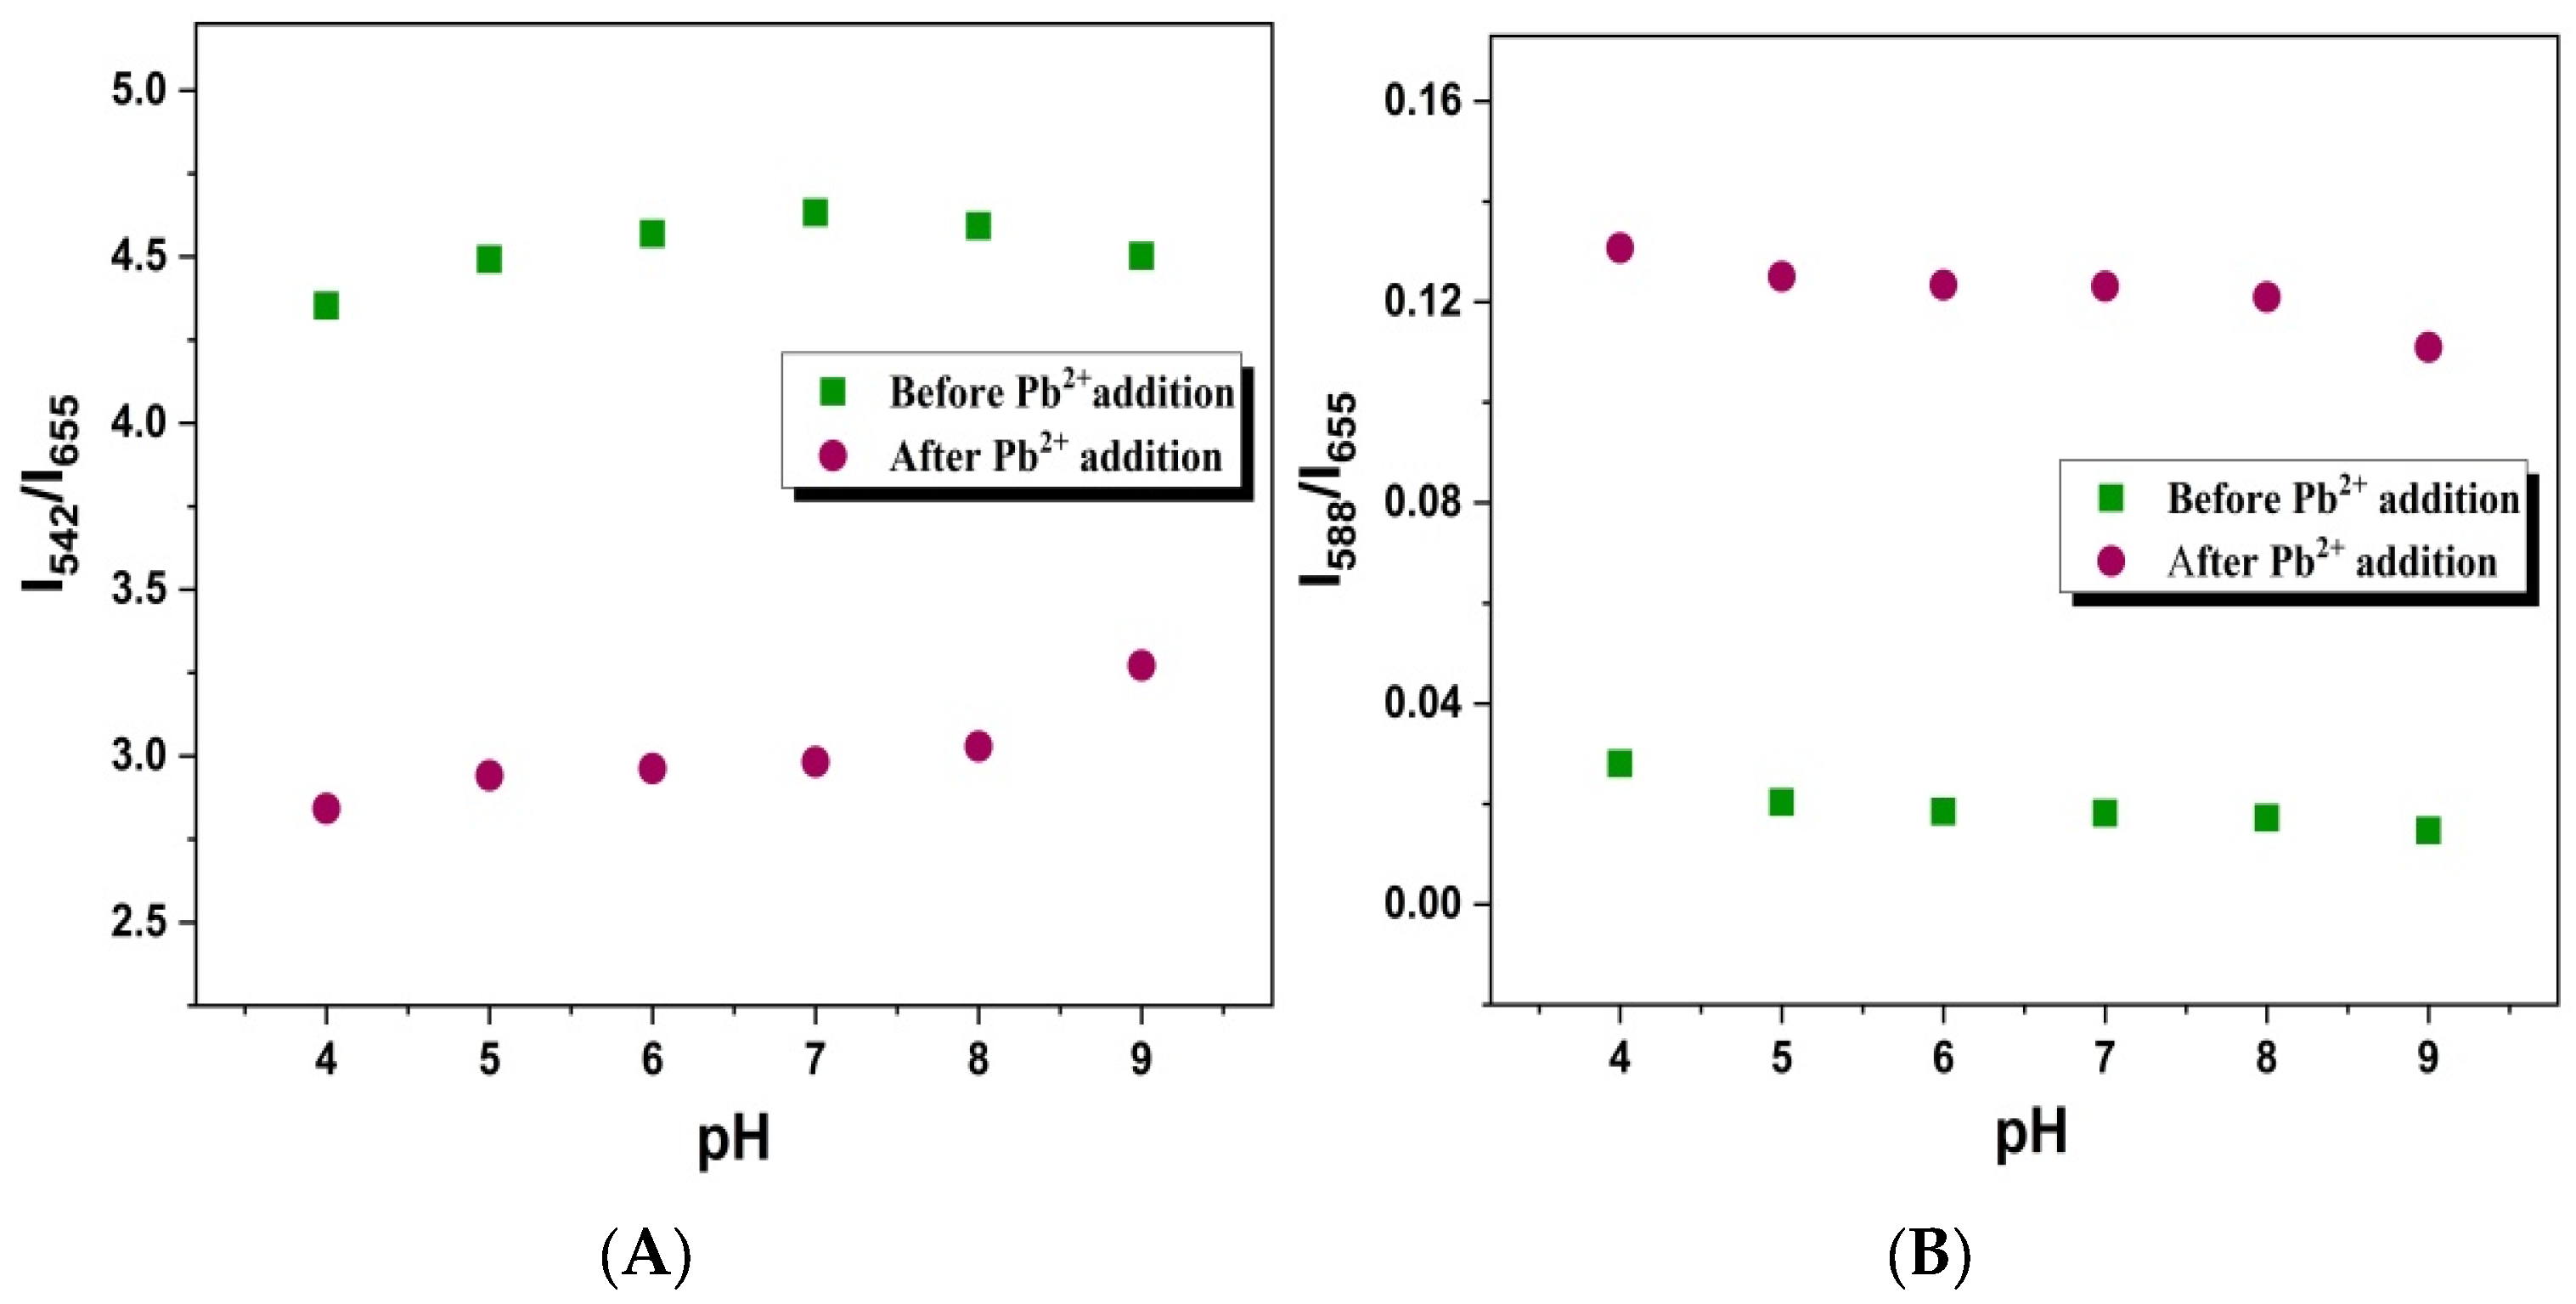
3.7. pH-Dependent Sensitivity

Additionally, a study has been carried out on the pH-dependent response of UCNP@SiO2-RBDA to Pb2+ detection. Analysis of the GRE and YRE responses was done in the pH range of 4 to 9 after recording the upconverting photoluminescence emission spectra of UCNP@SiO2-RBDA, with and without Pb2+ ions. When the pH is changed within the range of 5–8, the variation in GRE and YRE before the addition of Pb2+ ions is not particularly noticeable, as illustrated in Figure 8A,B, respectively. The variation in GRE and YRE before the addition of Pb2+ ions, as shown in Figure 8A,B, respectively, is not very prominent with change in pH within the range of 5–8. The efficient energy transfer can be seen from the graph after the addition of Pb2+ ions (30 µM), as the GRE values decreased and the YRE values increased for all pH values, proving that the impact of pH changes on the energy transfer process (ET) and detection analysis is negligible. Even in the extreme pH values (4 and 9), the signal variation before and after Pb2+ addition is not very large. Overall, it can be concluded that this chemosensing process is valid over a reasonable pH range.

3.8. Selectivity and Interference Test of NIR-Excited Chemosensor

To evaluate the degree of selectivity of the NIR-excited ratiometric sensor for Pb2+ ions over other metal ions (including Cs+, Na+, K+, Fe3+, Ni2+, Cd2+, Mg2+, As3+, Ca2+, Cu2+, Mn2+, Fe2+, Sn2+, Co2+, Zn2+, and Pb2+), the upconverting green emission intensity was accessed under the influence of other metal ions. As shown in Figure S13A, the green emission intensity at 542 nm of UCNP@SiO2-RBDA remains unchanged in the presence of other metal cations, but upon the addition of Pb2+ ions (30 µM), it decreased significantly. Moreover, the yellow emission (peaking at 588 nm) of RBDA increased only in the presence of Pb2+ ions. Figure S13B shows that in the presence of other ions, the GRE (I542/I655) ratio remains unchanged (gray bars), but with the co-addition of Pb2+, the green emission and consequently GRE ratio decreased significantly, showing that there is no interaction between other ions and UCNP@SiO2-RBDA. Apart from this, the competition (anti-interference) test was also examined, involving the co-addition of Pb2+ ions in the presence of other metal ions. The interfering ions had no effect on GRE ratio, but after co-addition of the Pb2+ ions, the ratio decreased (red bars), indicating that there is no interference in the detection of Pb2+ ions in the presence of other metal ions. The degree of selectivity and anti-interference was also studied by following the yellow fluorescence emission of the UCNP-linked RBDA. As shown in Figure S14 (black bars), the emission intensity of RBDA at 588 nm only increased with Pb2+ ions (15 μM), whereas no significant change was observed with the other ions. Additionally, by using this technique the competition test was performed. As given in Figure S14 (pink bars), the presence of other ions did not result in enhancement of the emission intensity (at 588 nm), while upon co-addition of Pb2+ ions, the intensity enhanced significantly. Consequently, the UCNP@SiO2-RBDA shows high selectivity, sensitivity, and anti-interference towards Pb2+ ions and thus can be used as an ET-based ratiometric sensor for the interference-free detection of Pb2+ ions following NIR light excitation. These results further show that energy transfer between the UCNP and RBDA is successful across a wider pH range and can be varied even at low analyte concentrations.

3.9. Real Sample Analysis of NIR-Excited Chemosensor

The method for detecting Pb2+ ions was further investigated in order to confirm the use of the described detection approach in real samples. To measure the Pb2+ in tap water samples, we employed the conventional addition approach. The amount of Pb2+ in tap water was determined using ratiometric analysis under the same circumstances, and the tests were carried out three times, as indicated in Table 2. The observed Pb2+ concentration was nearly close to the added concentration. The relative standard deviation (RSD) of the three measurements (n = 3) was in the range of than 0.91% to 1.55%, and the recovery rate from 95.3% to 96.8%. This demonstrates that it is practical and reliable to determine the Pb2+ in the real-world samples using this NIR-excited nanochemosensor.

4. Conclusions

In summary, we have developed upconverting nanophosphors that are amino-functionalized, silica-modified, and RBDA-functionalized for the ultrasensitive ET-based detection of Pb2+ ions. By transforming the NIR (980 nm) into visible light, which the RBDA molecules could only absorb in the presence of Pb2+ ions, UCNPs act as the energy provider in this situation. This nanochemosensor exhibits quick response to Pb2+ ions, high selectivity, and minimal background autofluorescence. The chemsosenor produced a visible color shift from colorless to magenta that can be seen with naked eyes, along with an increase in fluorescence emission when Pb2+ ions were added. In addition, the intensity of green upconversion emissions gradually decreased, and a new emission of RBDA with a peak at 588 nm appeared and increased with the concentration of Pb2+ ions when excited by NIR (980 nm) light corresponding to the efficient ET from UCNP to RBDA-Pb2+ complex. This ratiometric approach produced an effective and precise response for the detection of Pb2+ ions with a detection limit of 0.02 µM, which is lower than the WHO-allowed contamination levels of Pb2+ ions and one-tenth of that of pure RBDA. This demonstrates that the synthesized ET-based ratiometic nanoprobes have high sensitivity and selectivity towards Pb2+ ions, and they can be utilized to detect upon NIR light excitation.

Supplementary Materials

The following supporting information can be downloaded at: https://www.mdpi.com/article/10.3390/chemosensors11050305/s1, Figure S1: Schematic representation; Figure S2: EDAX spectrum of as-synthesized (A) UCNPs (B) UCNP@SiO2; Figure S3: DLS measurement of UCNPs; Figure S4: XRD patterns of the UCNP, UCNP@SiO2, and UCNP@SiO2-RBDA; Figure S5: FT-IR of the UCNP, UCNP@SiO2, free RBDA, and UCNP@SiO2-RBDA; Figure S6: (A) 1H-NMR (CDCl3, 400 MHz) (B) 13C NMR (101 MHz, Chloroform-d) spectrum of synthesized Rhodamine B hydrazide; Figure S7: (A) 1H-NMR (CDCl3, 400 MHz) (B) 13C NMR (101 MHz, Chloroform-d) spectrum of synthesized Pb2+ sensitive RBDA; Figure S8: Fluorescence emission intensity of RBDA (at 588 nm) upon addition of Pb2+ ions (30 μM) as a function of time; Figure S9: (A) The linear calibration plot with the green-to-red emission (GRE) ratios (I542/I655) (B) Yellow-to-red (YRE) emission ratios (I582/I655) of UCNP@SiO2-RBDA in the presence of increasing concentration of Pb2+ ions; Figure S10: (A) The exponential and (B) logarithmic calibration curve (I542/I588) with the green to RBDA emission (yellow) ratios of UCNP@SiO2-RBDA. (C) The exponential, and (D) logarithmic calibration curve with RBDA emission (yellow) ratios to green emission ratio (I588/I542), in the different concentration of Pb2+ ions; Figure S11: (A) Upconversion photoluminescence emission spectra of UCNP@SiO2-RBDA upon addition of Pb2+ ions up to 6 µM. (B) Variation in normalized GRE and YRE at the concentration 0–6 µM of Pb2+ ions; Figure S12: The linear calibration plot of UCNP@SiO2-RBDA in the presence of Pb2+ ions in the range of 0–6 µM (A) green-to-red emission (GRE) ratios (I542/I655) (B) Yellow-to-red (RRE) emission ratios (I588/I655). Figure S13: (A) Emission spectra of UCNP@SiO2-RBDA in the presence of different metal ions, including Pb2+ ions. (B) Selectivity (gray bar) and interference test (red bar). The selectivity data were obtained using different metal ions, including Pb2+. The interference tests were performed by the addition of 30 μM Pb2+ with the coexistence of an excess of interfering ions; Figure S14: Selectivity (black bar) and interference test (pink bar) for RBDA towards different metal ions. The selectivity results were obtained using different ions, and the anti-interference tests were carried out by adding 15 μM of Pb2+ ions while an excess of interfering ions was present.

Author Contributions

J.K. and I.R. designed the experiments. J.K. performed the experiments, under the supervision of I.R.; J.K. and I.R. interpreted the results and composed the manuscript. All authors have read and agreed to the published version of the manuscript.

Funding

This work was supported by funding from the Institution of Eminence (IoE), University of Delhi, India.

Institutional Review Board Statement

Not applicable.

Informed Consent Statement

Not applicable.

Data Availability Statement

Not applicable.

Acknowledgments

This work was supported by funding from the Institution of Eminence (IoE), University of Delhi, India. J.K. acknowledges fellowship support from Council of Scientific and Industrial Research (CSIR), India. The Instrumentation support provided by University Science Instrumentation Center (USIC), University of Delhi, India, is also acknowledged.

Conflicts of Interest

The authors declare no conflict of interest.

References

  1. Alengebawy, A.; Abdelkhalek, S.T.; Qureshi, S.R.; Wang, M.Q. Heavy Metals and Pesticides Toxicity in Agricultural Soil and Plants: Ecological Risks and Human Health Implications. Toxics 2021, 9, 42. [Google Scholar] [CrossRef]
  2. Pratush, A.; Kumar, A.; Hu, Z. Adverse Effect of Heavy Metals (As, Pb, Hg, and Cr) on Health and Their Bioremediation Strategies: A Review. Int. Microbiol. 2018, 21, 97–106. [Google Scholar] [CrossRef]
  3. Vardhan, K.H.; Kumar, P.S.; Panda, R.C. A Review on Heavy Metal Pollution, Toxicity and Remedial Measures: Current Trends and Future Perspectives. J. Mol. Liq. 2019, 290, 111197. [Google Scholar] [CrossRef]
  4. Mondal, B.; Bairagi, D.; Nandi, N.; Hansda, B.; Das, K.S.; Edwards-Gayle, C.J.C.; Castelletto, V.; Hamley, I.W.; Banerjee, A. Peptide-Based Gel in Environmental Remediation: Removal of Toxic Organic Dyes and Hazardous Pb2+ and Cd2+ ions from Wastewater and Oil Spill Recovery. Langmuir 2020, 36, 12942–12953. [Google Scholar] [CrossRef]
  5. Wani, A.L.; Ara, A.; Usmani, J.A. Lead Toxicity: A Review. Interdiscip. Toxicol. 2015, 8, 55. [Google Scholar] [CrossRef]
  6. Schileo, G.; Grancini, G. Lead or No Lead? Availability, Toxicity, Sustainability and Environmental Impact of Lead-Free Perovskite Solar Cells. J. Mater. Chem. C 2021, 9, 67–76. [Google Scholar] [CrossRef]
  7. Niu, X.; Zhong, Y.; Chen, R.; Wang, F.; Liu, Y.; Luo, D. A “Turn-on” Fluorescence Sensor for Pb2+ Detection Based on Graphene Quantum Dots and Gold Nanoparticles. Sens. Actuators B Chem. 2018, 255, 1577–1581. [Google Scholar] [CrossRef]
  8. Ochsenkühn-Petropoulou, M.; Ochsenkühn, K.M. Comparison of Inductively Coupled Plasma–Atomic Emission Spectrometry, Anodic Stripping Voltammetry and Instrumental Neutron-Activation Analysis for the Determination of Heavy Metals in Airborne Particulate Matter. Fresenius’ J. Anal. Chem. 2001, 369, 629–632. [Google Scholar] [CrossRef]
  9. Tarley, C.R.T.; Andrade, F.N.; de Oliveira, F.M.; Corazza, M.Z.; de Azevedo, L.F.M.; Segatelli, M.G. Synthesis and Application of Imprinted Polyvinylimidazole-Silica Hybrid Copolymer for Pb2+ Determination by Flow-Injection Thermospray Flame Furnace Atomic Absorption Spectrometry. Anal. Chim. Acta 2011, 703, 145–151. [Google Scholar] [CrossRef]
  10. Rosolina, S.M.; Chambers, J.Q.; Lee, C.W.; Xue, Z.L. Direct Determination of Cadmium and Lead in Pharmaceutical Ingredients Using Anodic Stripping Voltammetry in Aqueous and DMSO/Water Solutions. Anal. Chim. Acta 2015, 893, 25–33. [Google Scholar] [CrossRef]
  11. Li, J.; Lu, Y. A Highly Sensitive and Selective Catalytic DNA Biosensor for Lead Ions. J. Am. Chem. Soc. 2000, 122, 10466–10467. [Google Scholar] [CrossRef]
  12. Shi, X.; Gu, W.; Zhang, C.; Zhao, L.; Li, L.; Peng, W.; Xian, Y. Construction of a Graphene/Au-Nanoparticles/Cucurbit[7]Uril-Based Sensor for Pb2+ Sensing. Chem A Eur. J. 2016, 22, 5643–5648. [Google Scholar] [CrossRef]
  13. Yang, X.; Xu, J.; Tang, X.; Liu, H.; Tian, D. A Novel Electrochemical DNAzyme Sensor for the Amplified Detection of Pb2+ Ions. Chem. Commun. 2010, 46, 3107–3109. [Google Scholar] [CrossRef]
  14. Zhan, S.; Wu, Y.; Luo, Y.; Liu, L.; He, L.; Xing, H.; Zhou, P. Label-Free Fluorescent Sensor for Lead Ion Detection Based on Lead(II)-Stabilized G-Quadruplex Formation. Anal. Biochem. 2014, 462, 19–25. [Google Scholar] [CrossRef]
  15. Beqa, L.; Singh, A.K.; Khan, S.A.; Senapati, D.; Arumugam, S.R.; Ray, P.C. Gold Nanoparticle-Based Simple Colorimetric and Ultrasensitive Dynamic Light Scattering Assay for the Selective Detection of Pb(II) from Paints, Plastics, and Water Samples. ACS Appl. Mater. Interfaces 2011, 3, 668–673. [Google Scholar] [CrossRef]
  16. Yang, D.; Liu, X.; Zhou, Y.; Luo, L.; Zhang, J.; Huang, A.; Mao, Q.; Chen, X.; Tang, L. Aptamer-Based Biosensors for Detection of Lead(Ii) Ion: A Review. Anal. Methods 2017, 9, 1976–1990. [Google Scholar] [CrossRef]
  17. Na Kim, H.; Xiu Ren, W.; Seung Kim, J.; Yoon, J. Fluorescent and Colorimetric Sensors for Detection of Lead, Cadmium, and Mercury Ions. Chem. Soc. Rev. 2012, 41, 3210–3244. [Google Scholar] [CrossRef]
  18. Singh, H.; Bamrah, A.; Bhardwaj, S.K.; Deep, A.; Khatri, M.; Brown, R.J.C.; Bhardwaj, N.; Kim, K.H. Recent Advances in the Application of Noble Metal Nanoparticles in Colorimetric Sensors for Lead Ions. Environ. Sci. Nano 2021, 8, 863–889. [Google Scholar] [CrossRef]
  19. Aksuner, N. Development of a New Fluorescent Sensor Based on a Triazolo-Thiadiazin Derivative Immobilized in Polyvinyl Chloride Membrane for Sensitive Detection of Lead(II) Ions. Sens. Actuators B Chem. 2011, 157, 162–168. [Google Scholar] [CrossRef]
  20. Wee, S.S.; Ng, Y.H.; Ng, S.M. Synthesis of Fluorescent Carbon Dots via Simple Acid Hydrolysis of Bovine Serum Albumin and Its Potential as Sensitive Sensing Probe for Lead (II) Ions. Talanta 2013, 116, 71–76. [Google Scholar] [CrossRef]
  21. Liu, J.; Lv, G.; Gu, W.; Li, Z.; Tang, A.; Mei, L. A Novel Luminescence Probe Based on Layered Double Hydroxides Loaded with Quantum Dots for Simultaneous Detection of Heavy Metal Ions in Water. J. Mater. Chem. C 2017, 5, 5024–5030. [Google Scholar] [CrossRef]
  22. Lo, M.; Diaw, A.K.D.; Gningue-Sall, D.; Oturan, M.A.; Chehimi, M.M.; Aaron, J.J. A Novel Fluorescent Sensor Based on Electrosynthesized Benzene Sulfonic Acid-Doped Polypyrrole for Determination of Pb(II) and Cu(II). Luminescence 2019, 34, 489–499. [Google Scholar] [CrossRef]
  23. Kuo, S.Y.; Li, H.H.; Wu, P.J.; Chen, C.P.; Huang, Y.C.; Chan, Y.H. Dual Colorimetric and Fluorescent Sensor Based on Semiconducting Polymer Dots for Ratiometric Detection of Lead Ions in Living Cells. Anal. Chem. 2015, 87, 4765–4771. [Google Scholar] [CrossRef]
  24. Anand, T.; Sivaraman, G.; Mahesh, A.; Chellappa, D. Aminoquinoline Based Highly Sensitive Fluorescent Sensor for Lead(II) and Aluminum(III) and Its Application in Live Cell Imaging. Anal. Chim. Acta 2015, 853, 596–601. [Google Scholar] [CrossRef]
  25. Cai, Y.; Wei, Z.; Song, C.; Tang, C.; Han, W.; Dong, X. Optical Nano-Agents in the Second near-Infrared Window for Biomedical Applications. Chem. Soc. Rev. 2019, 48, 22–37. [Google Scholar] [CrossRef]
  26. Yang, F.; Zhang, Q.; Huang, S.; Ma, D. Recent Advances of near Infrared Inorganic Fluorescent Probes for Biomedical Applications. J. Mater. Chem. B 2020, 8, 7856–7879. [Google Scholar] [CrossRef]
  27. Lin, Q.; Li, Z.; Yuan, Q. Recent Advances in Autofluorescence-Free Biosensing and Bioimaging Based on Persistent Luminescence Nanoparticles. Chin. Chem. Lett. 2019, 30, 1547–1556. [Google Scholar] [CrossRef]
  28. Chen, G.; Roy, I.; Yang, C.; Prasad, P.N. Nanochemistry and Nanomedicine for Nanoparticle-Based Diagnostics and Therapy. Chem. Rev. 2016, 116, 2826–2885. [Google Scholar] [CrossRef]
  29. Wen, S.; Zhou, J.; Zheng, K.; Bednarkiewicz, A.; Liu, X.; Jin, D. Advances in Highly Doped Upconversion Nanoparticles. Nat. Commun. 2018, 9, 2415. [Google Scholar] [CrossRef]
  30. Chen, G.; Ågren, H.; Ohulchanskyy, T.Y.; Prasad, P.N. Light Upconverting Core–Shell Nanostructures: Nanophotonic Control for Emerging Applications. Chem. Soc. Rev. 2015, 44, 1680–1713. [Google Scholar] [CrossRef]
  31. Wang, J.; Sheng, T.; Zhu, X.; Li, Q.; Wu, Y.; Zhang, J.; Liu, J.; Zhang, Y. Spectral Engineering of Lanthanide-Doped Upconversion Nanoparticles and Their Biosensing Applications. Mater. Chem. Front. 2021, 5, 1743–1770. [Google Scholar] [CrossRef]
  32. Zhang, Z.; Shikha, S.; Liu, J.; Zhang, J.; Mei, Q.; Zhang, Y. Upconversion Nanoprobes: Recent Advances in Sensing Applications. Anal. Chem. 2019, 91, 548–568. [Google Scholar] [CrossRef]
  33. Idris, N.M.; Jayakumar, M.K.G.; Bansal, A.; Zhang, Y. Upconversion Nanoparticles as Versatile Light Nanotransducers for Photoactivation Applications. Chem. Soc. Rev. 2015, 44, 1449–1478. [Google Scholar] [CrossRef]
  34. Ansari, A.A.; Thakur, V.K.; Chen, G. Functionalized Upconversion Nanoparticles: New Strategy towards FRET-Based Luminescence Bio-Sensing. Coord. Chem. Rev. 2021, 436, 213821. [Google Scholar] [CrossRef]
  35. Chen, G.; Qiu, H.; Prasad, P.N.; Chen, X. Upconversion Nanoparticles: Design, Nanochemistry, and Applications in Theranostics. Chem. Rev. 2014, 114, 5161–5214. [Google Scholar] [CrossRef]
  36. Kumar, J.; Roy, I. Highly Selective and Sensitive Ratiometric Detection of Sn2+Ions Using NIR-Excited Rhodamine-B-Linked Upconversion Nanophosphors. ACS Omega 2022, 7, 29840–29849. [Google Scholar] [CrossRef]
  37. Liu, Q.; Peng, J.; Sun, L.; Li, F. High-Efficiency Upconversion Luminescent Sensing and Bioimaging of Hg(II) by Chromophoric Ruthenium Complex-Assembled Nanophosphors. ACS Nano 2011, 5, 8040–8048. [Google Scholar] [CrossRef]
  38. Han, Q.; Dong, Z.; Tang, X.; Wang, L.; Ju, Z.; Liu, W. A Ratiometric Nanoprobe Consisting of Up-Conversion Nanoparticles Functionalized with Cobalt Oxyhydroxide for Detecting and Imaging Ascorbic Acid. J. Mater. Chem. B 2016, 5, 167–172. [Google Scholar] [CrossRef]
  39. Han, J.; Zhang, C.; Liu, F.; Liu, B.; Han, M.; Zou, W.; Yang, L.; Zhang, Z. Upconversion Nanoparticles for Ratiometric Fluorescence Detection of Nitrite. Analyst 2014, 139, 3032–3038. [Google Scholar] [CrossRef]
  40. Liu, L.; Zhang, H.; Song, D.; Wang, Z. An Upconversion Nanoparticle-Based Fluorescence Resonance Energy Transfer System for Effectively Sensing Caspase-3 Activity. Analyst 2018, 143, 761–767. [Google Scholar] [CrossRef]
  41. Zhang, Y.; Xu, S.; Li, X.; Zhang, J.; Sun, J.; Tong, L.; Zhong, H.; Xia, H.; Hua, R.; Chen, B. Improved LRET-Based Detection Characters of Cu2+ Using Sandwich Structured NaYF4@NaYF4:Er3+/Yb3+@NaYF4 Nanoparticles as Energy Donor. Sens. Actuators B Chem. 2018, 257, 829–838. [Google Scholar] [CrossRef]
  42. Xu, Z.; Zhang, L.; Guo, R.; Xiang, T.; Wu, C.; Zheng, Z.; Yang, F. A Highly Sensitive and Selective Colorimetric and off–on Fluorescent Chemosensor for Cu2+ Based on Rhodamine B Derivative. Sens. Actuators B Chem. 2011, 156, 546–552. [Google Scholar] [CrossRef]
  43. Cui, S.; Chen, H.; Gu, Y. Comparison of Two Strategies for the Synthesis of Upconverting Nanoparticles as Biological Labels. J. Phys. Conf. Ser. 2011, 277, 012006. [Google Scholar] [CrossRef]
  44. Han, R.; Shi, J.; Liu, Z.; Wang, H.; Wang, Y. Fabrication of Mesoporous-Silica-Coated Upconverting Nanoparticles with Ultrafast Photosensitizer Loading and 808 Nm NIR-Light-Triggering Capability for Photodynamic Therapy. Chem. Asian J. 2017, 12, 2197–2201. [Google Scholar] [CrossRef]
  45. Park, Y.I.; Nam, S.H.; Kim, J.H.; Bae, Y.M.; Yoo, B.; Kim, H.M.; Jeon, K.S.; Park, H.S.; Choi, J.S.; Lee, K.T.; et al. Comparative Study of Upconverting Nanoparticles with Various Crystal Structures, Core/Shell Structures, and Surface Characteristics. J. Phys. Chem. C 2013, 117, 2239–2244. [Google Scholar] [CrossRef]
  46. Radunz, S.; Schavkan, A.; Wahl, S.; Würth, C.; Tschiche, H.R.; Krumrey, M.; Resch-Genger, U. Evolution of Size and Optical Properties of Upconverting Nanoparticles during High-Temperature Synthesis. J. Phys. Chem. C 2018, 122, 28958–28967. [Google Scholar] [CrossRef]
  47. Lu, D.; Mao, C.; Cho, S.K.; Ahn, S.; Park, W. Experimental Demonstration of Plasmon Enhanced Energy Transfer Rate in NaYF4:Yb3+,Er3+ Upconversion Nanoparticles. Sci. Rep. 2016, 6, 18894. [Google Scholar] [CrossRef]
  48. Tian, L.; Xu, Z.; Zhao, S.; Cui, Y.; Liang, Z.; Zhang, J.; Xu, X. The Upconversion Luminescence of Er3+/Yb3+/Nd3+ Triply-Doped β-NaYF4 Nanocrystals under 808-Nm Excitation. Materials 2014, 7, 7289–7303. [Google Scholar] [CrossRef]
  49. Guidelines for Drinking-Water Quality. Vol. 2, Health Criteria and Other Supporting Information. Available online: https://apps.who.int/iris/handle/10665/38551 (accessed on 14 October 2022).
  50. Li, L.; Chen, Q.; Niu, Z.; Zhou, X.; Yang, T.; Huang, W. Lanthanide Metal–Organic Frameworks Assembled from a Fluorene-Based Ligand: Selective Sensing of Pb2+ and Fe3+ Ions. J. Mater. Chem. C 2016, 4, 1900–1905. [Google Scholar] [CrossRef]
  51. Tian, Y.; Kelarakis, A.; Li, L.; Zhao, F.; Wang, Y.; Wang, W.; Yang, Q.; Ye, Z.; Guo, X. Facile Fluorescence “Turn on” Sensing of Lead Ions in Water via Carbon Nanodots Immobilized in Spherical Polyelectrolyte Brushes. Front. Chem. 2018, 6, 470. [Google Scholar] [CrossRef]
  52. Ji, G.; Liu, J.; Gao, X.; Sun, W.; Wang, J.; Zhao, S.; Liu, Z. A Luminescent Lanthanide MOF for Selectively and Ultra-High Sensitively Detecting Pb2+ Ions in Aqueous Solution. J. Mater. Chem. A 2017, 5, 10200–10205. [Google Scholar] [CrossRef]
  53. Algarra, M.; Campos, B.B.; Alonso, B.; Miranda, M.S.; Martínez, Á.M.; Casado, C.M.; Esteves Da Silva, J.C.G. Thiolated DAB Dendrimers and CdSe Quantum Dots Nanocomposites for Cd(II) or Pb(II) Sensing. Talanta 2012, 88, 403–407. [Google Scholar] [CrossRef]
  54. Yang, L.R.; Song, S.; Zhang, H.M.; Zhang, W.; Bu, Z.W.; Ren, T.G. Synthesis, Structure of 3D Lanthanide (La(III), Pr(III)) Nanoporous Coordination Polymers Containing 1D Channels as Selective Luminescent Probes of Pb2+, Ca2+ and Cd2+ Ions. Synth. Met. 2011, 161, 2230–2240. [Google Scholar] [CrossRef]
  55. Shamsipur, M.; Sadeghi, M.; Alizadeh, K.; Bencini, A.; Valtancoli, B.; Garau, A.; Lippolis, V. Novel Fluorimetric Bulk Optode Membrane Based on 5,8-Bis((5′-Chloro-8′-Hydroxy-7′-Quinolinyl)Methyl)-2,11-Dithia-5,8-Diaza-2,6-Pyridinophane for Selective Detection of Lead(II) Ions. Talanta 2010, 80, 2023–2033. [Google Scholar] [CrossRef]
  56. Ranyuk, E.; Douaihy, C.M.; Bessmertnykh, A.; Denat, F.; Averin, A.; Beletskaya, I.; Guilard, R. Diaminoanthraquinone-Linked Polyazamacrocycles: Efficient and Simple Colorimetric Sensor for Lead Ion in Aqueous Solution. Org. Lett. 2009, 11, 987–990. [Google Scholar] [CrossRef]
  57. Wei, H.; Li, B.; Li, J.; Dong, S.; Wang, E. DNAzyme-Based Colorimetric Sensing of Lead(Pb2+) Using Unmodified Gold Nanoparticle Probes. Nanotechnology 2008, 19, 095501. [Google Scholar] [CrossRef]
  58. Ma, L.; Li, H.; Wu, Y. A Pyrene-Containing Fluorescent Sensor with High Selectivity for Lead(II) Ion in Water with Dual Illustration of Ground-State Dimer. Sens. Actuators B Chem. 2009, 143, 25–29. [Google Scholar] [CrossRef]
Figure 1. Schematic illustration of the proposed chemosensing mechanism of UCNP@SiO2-RBDA with Pb2+ ions based on ET.
Chemosensors 11 00305 g001
Figure 2. FESEM images of synthesized UCNPs at scale bar of (A) 500 nm and (B) 50 nm. TEM micrographs of (C) UCNPs and (D) silica-coated UCNPs.
Chemosensors 11 00305 g002
Figure 3. (A) Excitation and emission spectra of RBDA, with and without added Pb2+ ions. (B) Spectral overlap of upconverting photoluminescence spectrum of silica-coated UCNPs under NIR (980 nm) laser excitation and absorbance of RBDA in the presence of Pb2+ ions.
Chemosensors 11 00305 g003
Figure 4. (A) UV–vis absorption (B) Fluorescence emission spectra of RBDA upon the addition of various metal ions (Cs+, Na+, K+, Fe3+, Ni2+, Cd2+, Mg2+, As3+, Ca2+, Cu2+, Mn2+, Fe2+, Sn2+, Co2+, Zn2+, and Pb2+). (C) The visible and (D) fluorescent appearance of the solutions upon the addition of various metal ions, including Pb2+ ions.
Chemosensors 11 00305 g004
Figure 5. (A) UV–visible absorption of RBDA with increasing amounts of Pb2+ ions. Inset: magnictude of absorbance of RBDA at 554 nm as function of Pb2+ concentration. (B) RBDA relative absorption intensity calibration curve as a function of Pb2+ concentration at 554 nm.
Chemosensors 11 00305 g005
Figure 6. (A) Fluorescence spectra of RBDA upon addition of Pb2+ ions in increasing concentrations (λExe = 525 nm). Inset: Intensity magnitude at 588 nm as a function of Pb2+ ion concentration. (B) The relationship between concentration and the relative fluorescence intensity of RBDA at 588 nm.
Chemosensors 11 00305 g006
Figure 7. (A) Upconverting photoluminescence emission spectra of UCNP@SiO2-RBDA following NIR-laser excitation with of increasing concentration of Pb2+ ions, Inset: ET caused an emission at 588 nm after the addition of Pb2+ ions. (B) Normalized GRE and YRE variations at various Pb2+ ion concentrations.
Chemosensors 11 00305 g007
Figure 8. (A) Green-to-red emission (GRE) ratios (I542/I655) (B) Yellow-to-red (YRE) emission ratios (I588/I655) at different pH values ranging from 4–9, before (green squares) and after (red circles) the addition of Pb2+ ions (30 μM).
Chemosensors 11 00305 g008
Table 1. Comparison of other reported different types of nanoprobe and their detection limits for Pb2+ ion with the UCNP@SiO2-RBDA.
S.No.ProbesMediaSensing MethodSensitivityLODReferences
1. [Ln2(FDC)3DMA(H2O)3]DMA 4.5H2O MOFsTris-HCl solutionFluorescence0.02–0.1 mM8.2 µM [50]
2.N-CQDsPBS BufferSAXS0–1.67 mM22.8 µM [51]
3. [Tb(L)(H2O)5]n MOFswaterFluorescence35 µM–0.8 mM0.29 µM [52]
4.CQDsWaterFluorescence0–6 mM5.05 µM [20]
5.ZnS QDsBufferFluorescence1 µM–1 mM0.9 µM [21]
6.CdSe QDsWaterFluorescence0.01–0.15 mM0.06 mM [53]
7. [La2(PDA)3 (H2O)4]
H2O and [Pr2(PDA)3
(H2O)3]⋅H2O
DMFEmission0.02–0.1 mM8.2 µM [54]
8.L2 immobilized on PVCAcetate
Buffer
Fluorescence0.3 µM–25 mM0.2 µM [55]
9.Diaminoanthraquinone-Linked
Polyazamacrocycles
Methanol/WaterColorimetry 10 µM [56]
10.DNAzymesTris-HCl solutioncolorimetric0.5–1000 µM0.5 µM [57]
11.PLE
N-[4(1-pyrene)-butyroyl]-L-glutamic acid
Water/DMSOFluorescence0–106.7 µM1.5 µM [58]
12.UCNP@SiO2-RBDAWaterET0–72 µM0.02 µMThis work
Table 2. Detection of Pb2+ ions in tap water.
SampleAdded Concentration of Pb2+ (µM)Pb2+ Ions Found Concentration (µM)Average Recovery (%)RSD (n = 3) %
Tap water109.5395.31.30
2019.3296.60.91
3029.0496.81.55
Disclaimer/Publisher’s Note: The statements, opinions and data contained in all publications are solely those of the individual author(s) and contributor(s) and not of MDPI and/or the editor(s). MDPI and/or the editor(s) disclaim responsibility for any injury to people or property resulting from any ideas, methods, instructions or products referred to in the content.

