Article

Highly Selective Arsenite Sensor Based on Gold Nanoparticles and Ionic Liquids

1
Department of Chemistry, National University of Singapore, 3 Science Drive 3, Singapore 117543, Singapore
2
NUS Environmental Research Institute (NERI), #02-01, T-Lab Building (TL), 5A Engineering Drive 1, Singapore 117411, Singapore
*
Author to whom correspondence should be addressed.
Chemosensors 2023, 11(5), 302; https://doi.org/10.3390/chemosensors11050302
Submission received: 21 March 2023 / Revised: 29 April 2023 / Accepted: 4 May 2023 / Published: 19 May 2023

Abstract

:
Here, we report a highly selective arsenite (As(III)) sensor based on gold nanoparticles (AuNPs) and ionic liquids (ILs). AuNPs were citrate-capped with negative charges on their surfaces, and could aggregate and precipitate once electrolytes were introduced to neutralize the negative charges. In this study, we discovered that organic ILs, behaving similarly to inorganic electrolytes such as NaCl, could induce the aggregation and precipitation of AuNPs much more efficiently than inorganic electrolytes. Since As(III) inhibited while ILs promoted the aggregation of AuNPs, we examined the interactions between AuNPs, As(III), and ILs and the possibility of using ILs and AuNPs as a sensing probe to detect arsenite and determine its concentration. Six different ILs were evaluated for this purpose in this study. Repeatability, interference, stability, selectivity, and sensitivity were investigated to evaluate the As(III) sensing probe. The limit of detection (LOD) of the sensor sBMP was as low as 0.18 ppb, ranked as the second lowest among the reported arsenite sensors. The sensing of arsenite was also demonstrated with real water samples and was cross-validated with ICP-OES.

1. Introduction

Traditional arsenic detection methods mainly rely on spectroscopic and chromatographic techniques [1,2]. Although these methods yield accurate results, the instruments are costly and sophisticated. In recent decades, many sensors have been developed based on colorimetry, electrochemistry, and nanomaterials for the detection of arsenic [3,4,5,6,7,8]. However, high selectivity and low detection limits, crucial for practical use, were seldom simultaneously achieved with one sensor. Aptamer-based methods were commonly based on the aptamer Ars-3 [9], focusing on the optimization of concentrations, temperature, pH, colorimetric reagents, and destabilizing agents.
It has been reported that [1], similar to citrate, arsenite (H3AsO3 neutral species or AsO2 anionic species) could also be adsorbed onto AuNPs’ surface as a capping reagent and, thus, also inhibited AuNPs aggregating and precipitating. Matsunaga et al. reported the detection of As(III) using AuNPs as a colorimetric reagent. In their approach, sodium chloride was used to induce AuNPs’ aggregation and changing color from red to blue/black [10]. Wu et al. synthesized crystal violet particles, which became bigger or smaller with different concentrations of an aptamer [11]. The changes in particle size of crystal violet were correlated with the aptamer concentration and monitored using a resonance Rayleigh scattering (RRS) spectrum. The same authors also reported surfactants being used as effective organic electrolytes for AuNPs’ color change [9]. They studied several different cationic surfactants, such as cetyltrimethylammonium bromide (CTAB), and found that a relatively long time was needed for the reactions between surfactants and AuNPs. Cui et al. disclosed strong interactions between an aptamer and poly(diallyldimethylammonium chloride) (PDDA) and suggested utilizing [Ru(NH3)6]3+ as an electroactive redox species for signal transduction [12]. They achieved a very low limit of detection (LOD) although the advantage was offset by the relatively long analysis time.
Zong et al. investigated the adsorption and competition between As(III) and several random DNAs on the surface of AuNPs after removing excess free citrate ions from the AuNP solution [1]. They reported that 10 mM As(III) added after the DNA adsorption could displace 18% of the adsorbed DNA from AuNPs, while 20 µM As(III) added before the DNA adsorption inhibited the adsorption of DNA by 50%. They highlighted the good affinity between As(III) and AuNPs’ surfaces. Tan et al. synthesized phosphonium IL–tetradecyltrihexylphosphonium chloride (TTPC) and Triton X-114-coated AuNPs for the speciation of As(III) and As(V). Their extended X-ray absorption fine structure (EXAFS) analysis revealed shorter N-As bonds (2.96 Å) between TTPC and arsenite than those (4.13 Å) between TTPC and arsenate [13]. However, their tests required a relatively high pH (10.2). Trivedi et al. reported colorimetric dual chemosensors for arsenite and Hg2+ and further verified their results using theoretical DFT calculations [14]. Schott et al. studied the sensing mechanism of chemosensors for Cu2+ and Ni2+ with DFT methods [15]. Tabassum et al. validated the sensing mechanism in various modes of fluorescent “turn on” sensors towards Cd2+ through DFT studies [16]. Traditionally, high concentrations of inorganic electrolytes, e.g., typically higher than 40 mM NaCl, would need to be utilized to induce the aggregation of AuNPs [1]. In this study, we discovered that ionic liquids are much more efficient than NaCl in inducing AuNPs’ aggregation, requiring a concentration of ILs as low as 0.75 µM, i.e., 5300 times lower than the NaCl threshold. To the authors’ best knowledge, in the previous reports, there is no study on the interactions between arsenite and ILs, and AuNPs. Herein, we report a highly selective arsenite (As(III)) sensor based on AuNPs and ionic liquids (ILs) and demonstrate how it can be used as a sensor for As(III) detection and quantification. To the best of our knowledge, this is the first time that ILs were studied as sensors for arsenite with the assistance of AuNPs. ILs in this study were used as electrolytes to induce the aggregation of AuNPs and color changing from red to bluish gray by neutralizing or shielding the negative charges on their surface. Ionic liquid is a kind of free-flowing liquid composed of cations and anions below 100 °C. Various types of cations and anions provide extensive choices of ionic liquids. The main cations for ILs include imidazolium, pyridinium, pyrrolidinium, cholinium, ammonium, phosphonium, and sulfonium, while their countering anions could be hexafluorophosphate, tetrafluoroborate, amino acid, carboxylate, bis(trifluomethanesulfonyl)imide, alkyl sulfate, and halides. Imidazolium-based ILs are some of the most popularly explored in past reports. Six different ILs were evaluated in this study, namely 1-(3-cyanopropyl)-3-methylimidazolium chloride (CPMI), 1-(3-cyanopropyl)pyridinium chloride (CPP), tetradecyldimethylbenzylammonium chloride (TDDBA), cetylpyridinium chloride monohydrate (CP), 1-butyl-1-methylpyrrolidinium methyl carbonate (BMP), and tributylmethylphosphonium methyl carbonate (TBMP). Out of the six ILs, there are three pyridinium- (BMP, CP, CPP), one immidazolium- (CPMI), one ammonium- (TDDBA), and one phosphomium (TBMP)-ionic liquids. The choice of ILs in this study included five types of cations: imidazolium, pyridinium, pyrrolidinium, ammonium, and phosphonium. Two of the ILs have long chains: CP and TDDBA. ILs with different cationic center types and chain lengths were chosen to evaluate the effects of molecular structure.

2. Materials and Methods

The chemicals, apparatus, and synthesis of AuNPs are described in the Supplementary Materials (SM). The as-prepared AuNPs, ~0.1439 nM, were citrate-capped and well dispersed, and their individual particle sizes were ~15 nm (Figure 1C). A total of 89.1 µM excess citrate was kept in the solution for better stability.

2.1. Colorimetric Assays

The colorimetric assay method was adopted from a previous report with slight modifications [1]. In a typical assay, 200 µL of the synthesized AuNPs and a certain amount of MOPS buffer (10 mM, pH 7.3) were added to a 1.5 mL plastic vial and mixed well. Next, arsenite solution was added with 10 min of incubation for sufficient interaction of AuNPs and arsenite. Finally, a certain amount of an IL solution (10 mM for BMP, optimized) was added and incubated for another 10 min. All solutions were made up to a total volume of 600 µL. An optical extinction (commonly named “absorption” if without particles) measurement was then carried out in the range of 400–800 nm. The chemical structures of ILs are shown in Figure 1B. The concentrations of ILs were optimized (SI). Figure 1A shows the proposed principle of aggregation of citrate-capped AuNPs induced by IL but inhibited by As(III).

2.2. Optimization of ILs’ Concentrations

ILs in this study were used as electrolytes to induce the aggregation of AuNPs and color change from red to bluish gray by neutralizing or shielding the negative charges on their surface. To determine the optimal IL concentrations, 200 µL of the synthesized AuNPs and a certain amount of MOPS buffer (10 mM, pH 7.3) were added to a 1.5 mL plastic vial and mixed well before adding a variable volume of IL solution to make it up to a total volume of 600 µL (except otherwise stated, the total volume of the mixed reaction solution in this report was 600 µL) [10]. The solution was mixed well and incubated for 10 min before optical extinction measurement at 400–800 nm. The pH value was kept neutral by using pH 7.3 MOPS buffer. At this pH, arsenite existed mainly as neutral H3AsO3 species with little anionic species H2AsO3 [17].

2.3. Determination of the Detection Limit for As(III)

To determine the detection limit for As(III), 200 µL of the synthesized AuNPs and a certain amount of MOPS buffer (10 mM, pH 7.3) were added to a 1.5 mL plastic vial and mixed well before adding a certain concentration (0, 5, 10, 50, 100, 500, 1000, and 5000 ppb) of arsenite and incubating for 10 min. Then, a variable volume of IL solution was added to make it up to a total volume of 600 µL. The solution was mixed well and incubated for 10 min before optical extinction measurement at 400–800 nm. A total of eight AuNP suspension solutions with As(III) concentrations 0, 5, 10, 50, 100, 500, 1000, and 5000 ppb were prepared and measured.

2.4. Selectivity towards As(III) and Other Ions

The selectivity study was performed using a similar procedure as that described in Section 2.3, with 1 ppm or 50 ppb As(III) or other ions (As(V), Hg2+, Cd2+, Pb2+, Na+, Zn2+, Cr(VI), Br, I).

2.5. Interference Study in the Presence of BMP (One of the ILs)

The interference study of Pb2+, Na+ and I¯ ions followed a similar procedure to that described in Section 2.3 in the presence of 10 mM BMP. To the Section 2.3 procedure, a certain concentration (20, 100, or 500 ppb) of ions (Pb2+, Na+, or I) was added after the addition of 200 ppb As(III) before the 1st 10 min of incubation.
Note: For convenience’s sake, the sensors and conditions were described as shown in Table 1. “s” means “sensor” to differentiate ILs and sensors.

3. Results and Discussion

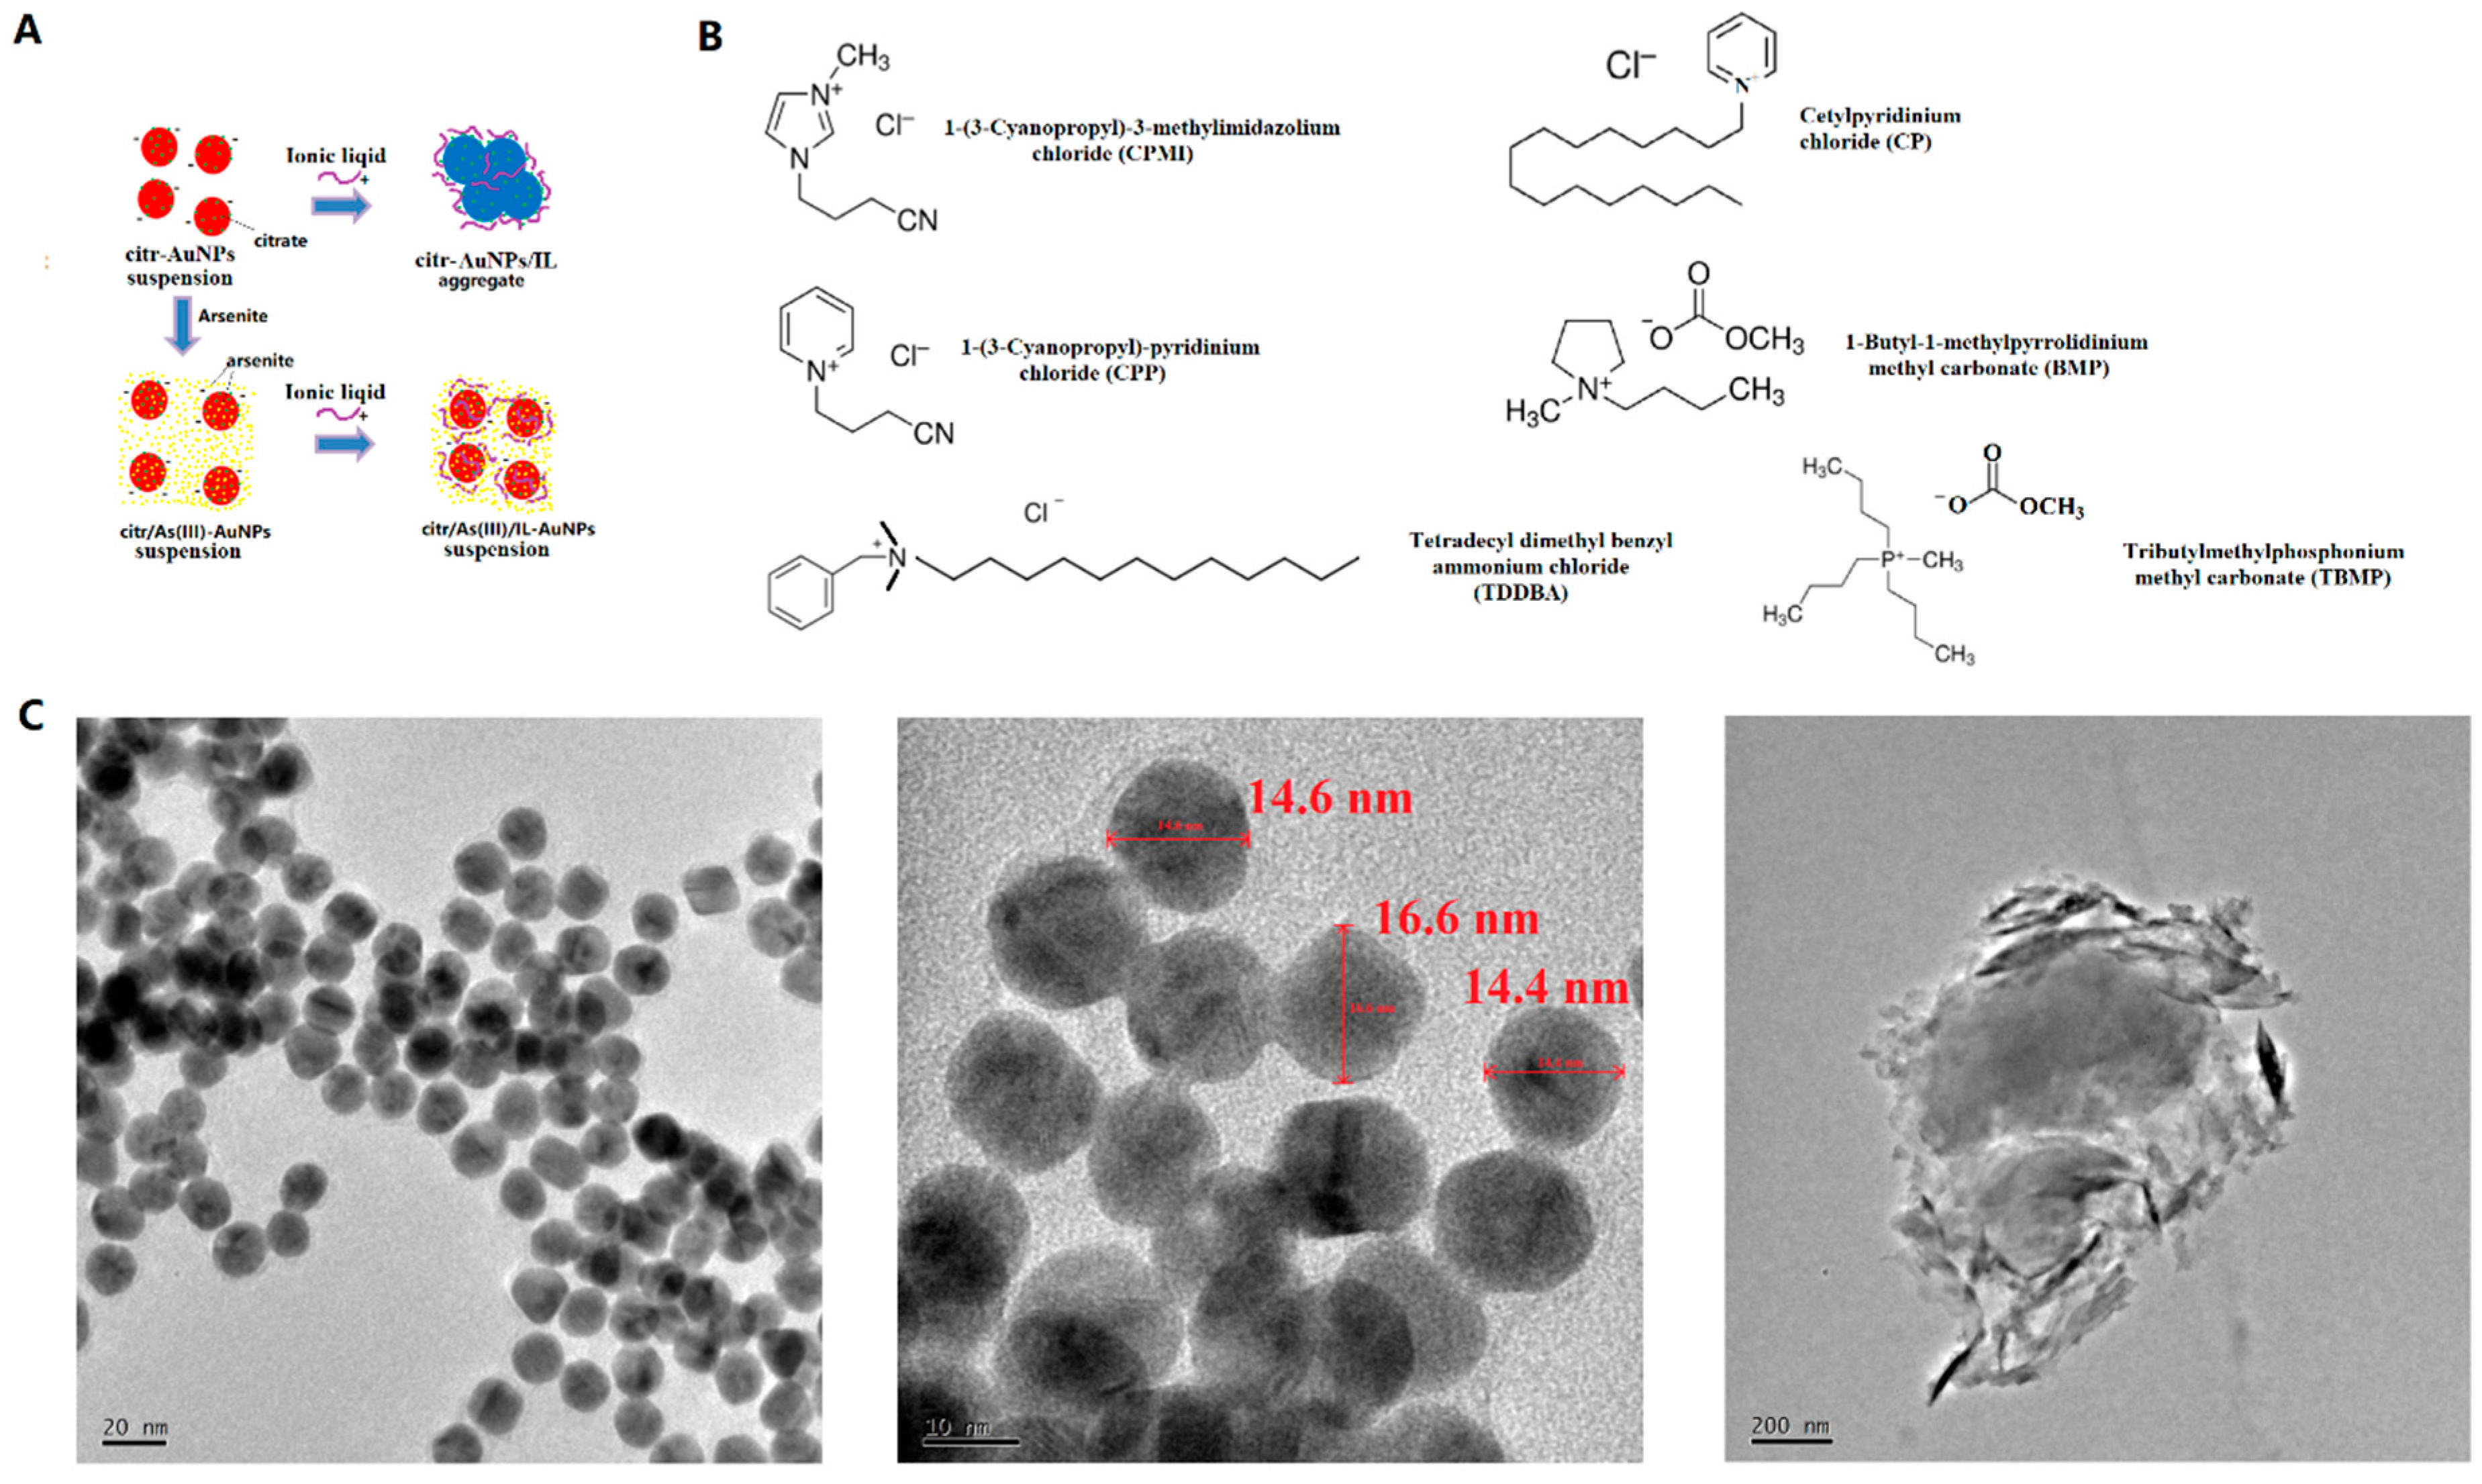
3.1. Synthesis and Characterization of AuNPs

At a reaction temperature of 100 °C and with a starting molar ratio of citrate/Au 3.35 (slightly higher than stoichiometric ratio 3), the reaction mixture started out as light gray, then turned bluish gray (<1 min), purple (1–2 min), and finally red (3 min and onwards), as shown in Figure 2A. It has been well established that the extinction peak of surface plasmonic resonance (SPR) redshifts when the size of nanoparticles increases [18]. The surfaces of AuNPs were capped with citrate anions (Figure 2B) [19], whose negative electrostatic repulsion formed a steric barrier to prevent further growth and aggregation of particles [1], imparting stability to the AuNPs. The particle size distribution and zeta potential of a BMP-induced AuNP aggregate sample are shown in Figure S1C, where its average dynamic particle size is 197.2 nm, much larger than that (22.5 nm) of the pristine AuNPs. Its zeta potential is −25.9 mV, near to a stable state since the particles have aggregated. A sample similar to Figure S1C but with the addition of 1 ppm arsenite (Figure S1D) shows a similar dynamic particle size and zeta potential values (26.44 nm, −11.5 mV) to the pristine AuNPs (22.5 nm, −14.5 mV), indicating that the formation of the probes could also be confirmed by zeta potential changes [20].

3.2. Sensing Principle

It was reported that the surface charges of the AuNP suspension would be shielded by an electrolyte solution (e.g., NaCl) with a concentration above the threshold, causing a concomitant decrease in the inter-particle distance, and as a result, AuNPs aggregated [21]. ILs are organic electrolytes with bulky cations and relatively smaller counter anions. We discovered that ILs behave similarly to inorganic electrolytes. When the negative charges of citrate on the surface of the AuNPs were shielded by ILs, the AuNPs were induced to aggregate, so the solution color changed from red to blue, as illustrated in Figure 1A. ILs interact with citrate-capped AuNPs, causing their precipitation. We discovered that citrate-capped AuNPs had weaker interactions with BMP, CPMI, CPP, and TBMP, but relatively stronger interactions with CP and TDDBA. As mentioned at the end of Section 1, CP and TDDBA have long chains on their bulky cations. It is possible that their bulky long chains have an enhanced effect in the shielding of surface charges and, hence, could accelerate the aggregation of AuNPs. In the presence of arsenite, there is a strong interaction between arsenite and ILs, which further weakens the charge shielding effect of ILs and prevents AuNPs from aggregating and precipitating (Figure 1A). As mentioned in Section 2.2, the pH value was kept neutral by using pH 7.3 MOPS buffer. At this pH, arsenite existed mainly as neutral H3AsO3 species with little anionic species H2AsO3 [17]. Due to the neutral pH and few anionic species, the interaction between arsenite and AuNPs introduces little additional negative charge onto the AuNPs’ surfaces. Hence, the majority of the interaction between arsenite and AuNPs, if there is any, should not be attributed to the small amount of additional surface negative charges from the anionic species H2AsO3 but should be attributed to the neutral H3AsO3 species.

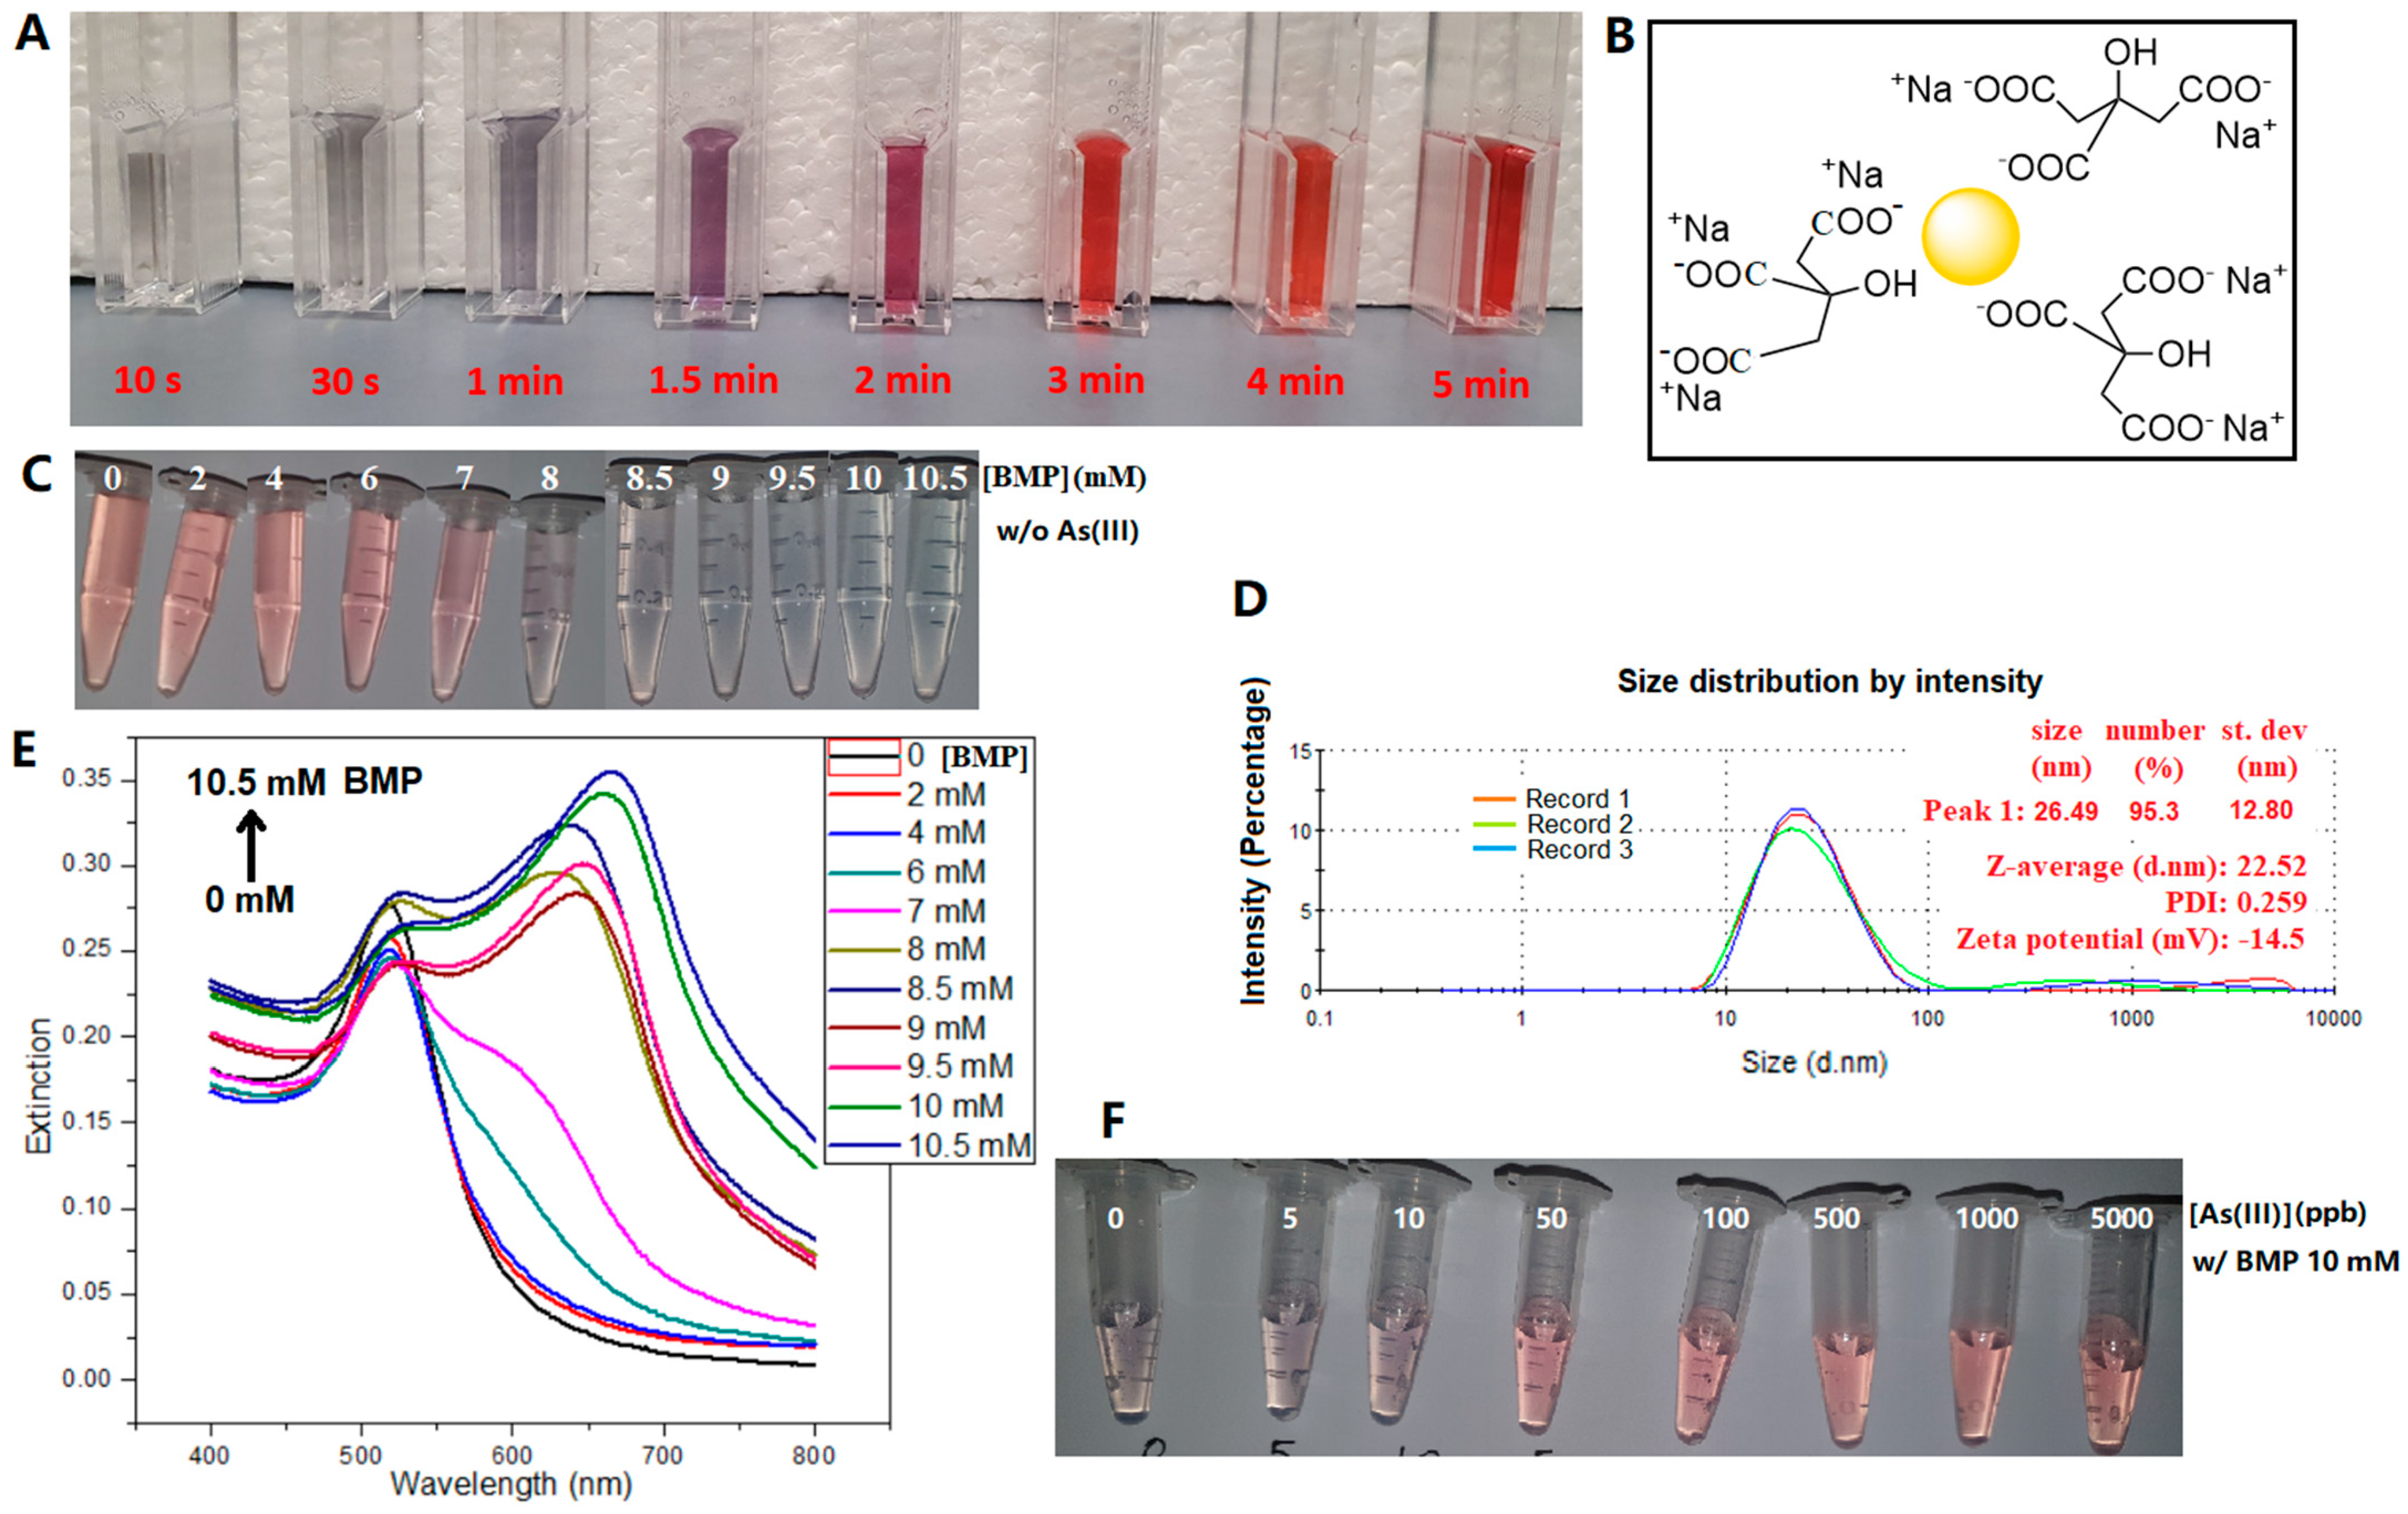
3.3. Optimizing Concentrations of ILs

The concentrations of the ILs were optimized for the colorimetric assay. Their concentration ranges and working concentrations used in this study are listed in Table 2. The solution color of the AuNPs changed from pink to blue when the BMP concentration exceeded a threshold, i.e., 8 mM, and an absorption peak near 650 nm on the UV-Vis spectra appeared, which was attributed to the aggregation of AuNPs (Figure 2C,E). The other five ILs could also induce AuNP aggregation above certain threshold concentrations (Figure S3), which were determined from the d(E650/Espr)/d[ILs]-[ILs] plots (Figure S4). The ratio E650/Espr at 650 nm and 517 nm is commonly used to indicate AuNP aggregation [9]. Further to this, here, we also plotted the differential function d(E650/Espr)/d[ILs] against [ILs] to better visualize the minimum [ILs] required (Figure S4). The threshold concentrations to induce AuNP aggregation were, in order from high to low, [BMP] > [CPP] > [TBMP] > [CPMI] > [TDDBA] > [CP]. At the same concentration, CP was the most efficient one out of the six ILs in inducing AuNP aggregation due to the very strong interactions between the long chain of CP and citrate on the surface of AuNPs. The threshold concentrations of ILs for the aggregation of AuNPs are listed in Table 2. The adopted working concentrations were slightly higher than the relevant thresholds to ensure the aggregation effect.

3.4. Interactions between AuNPs, As(III), and ILs
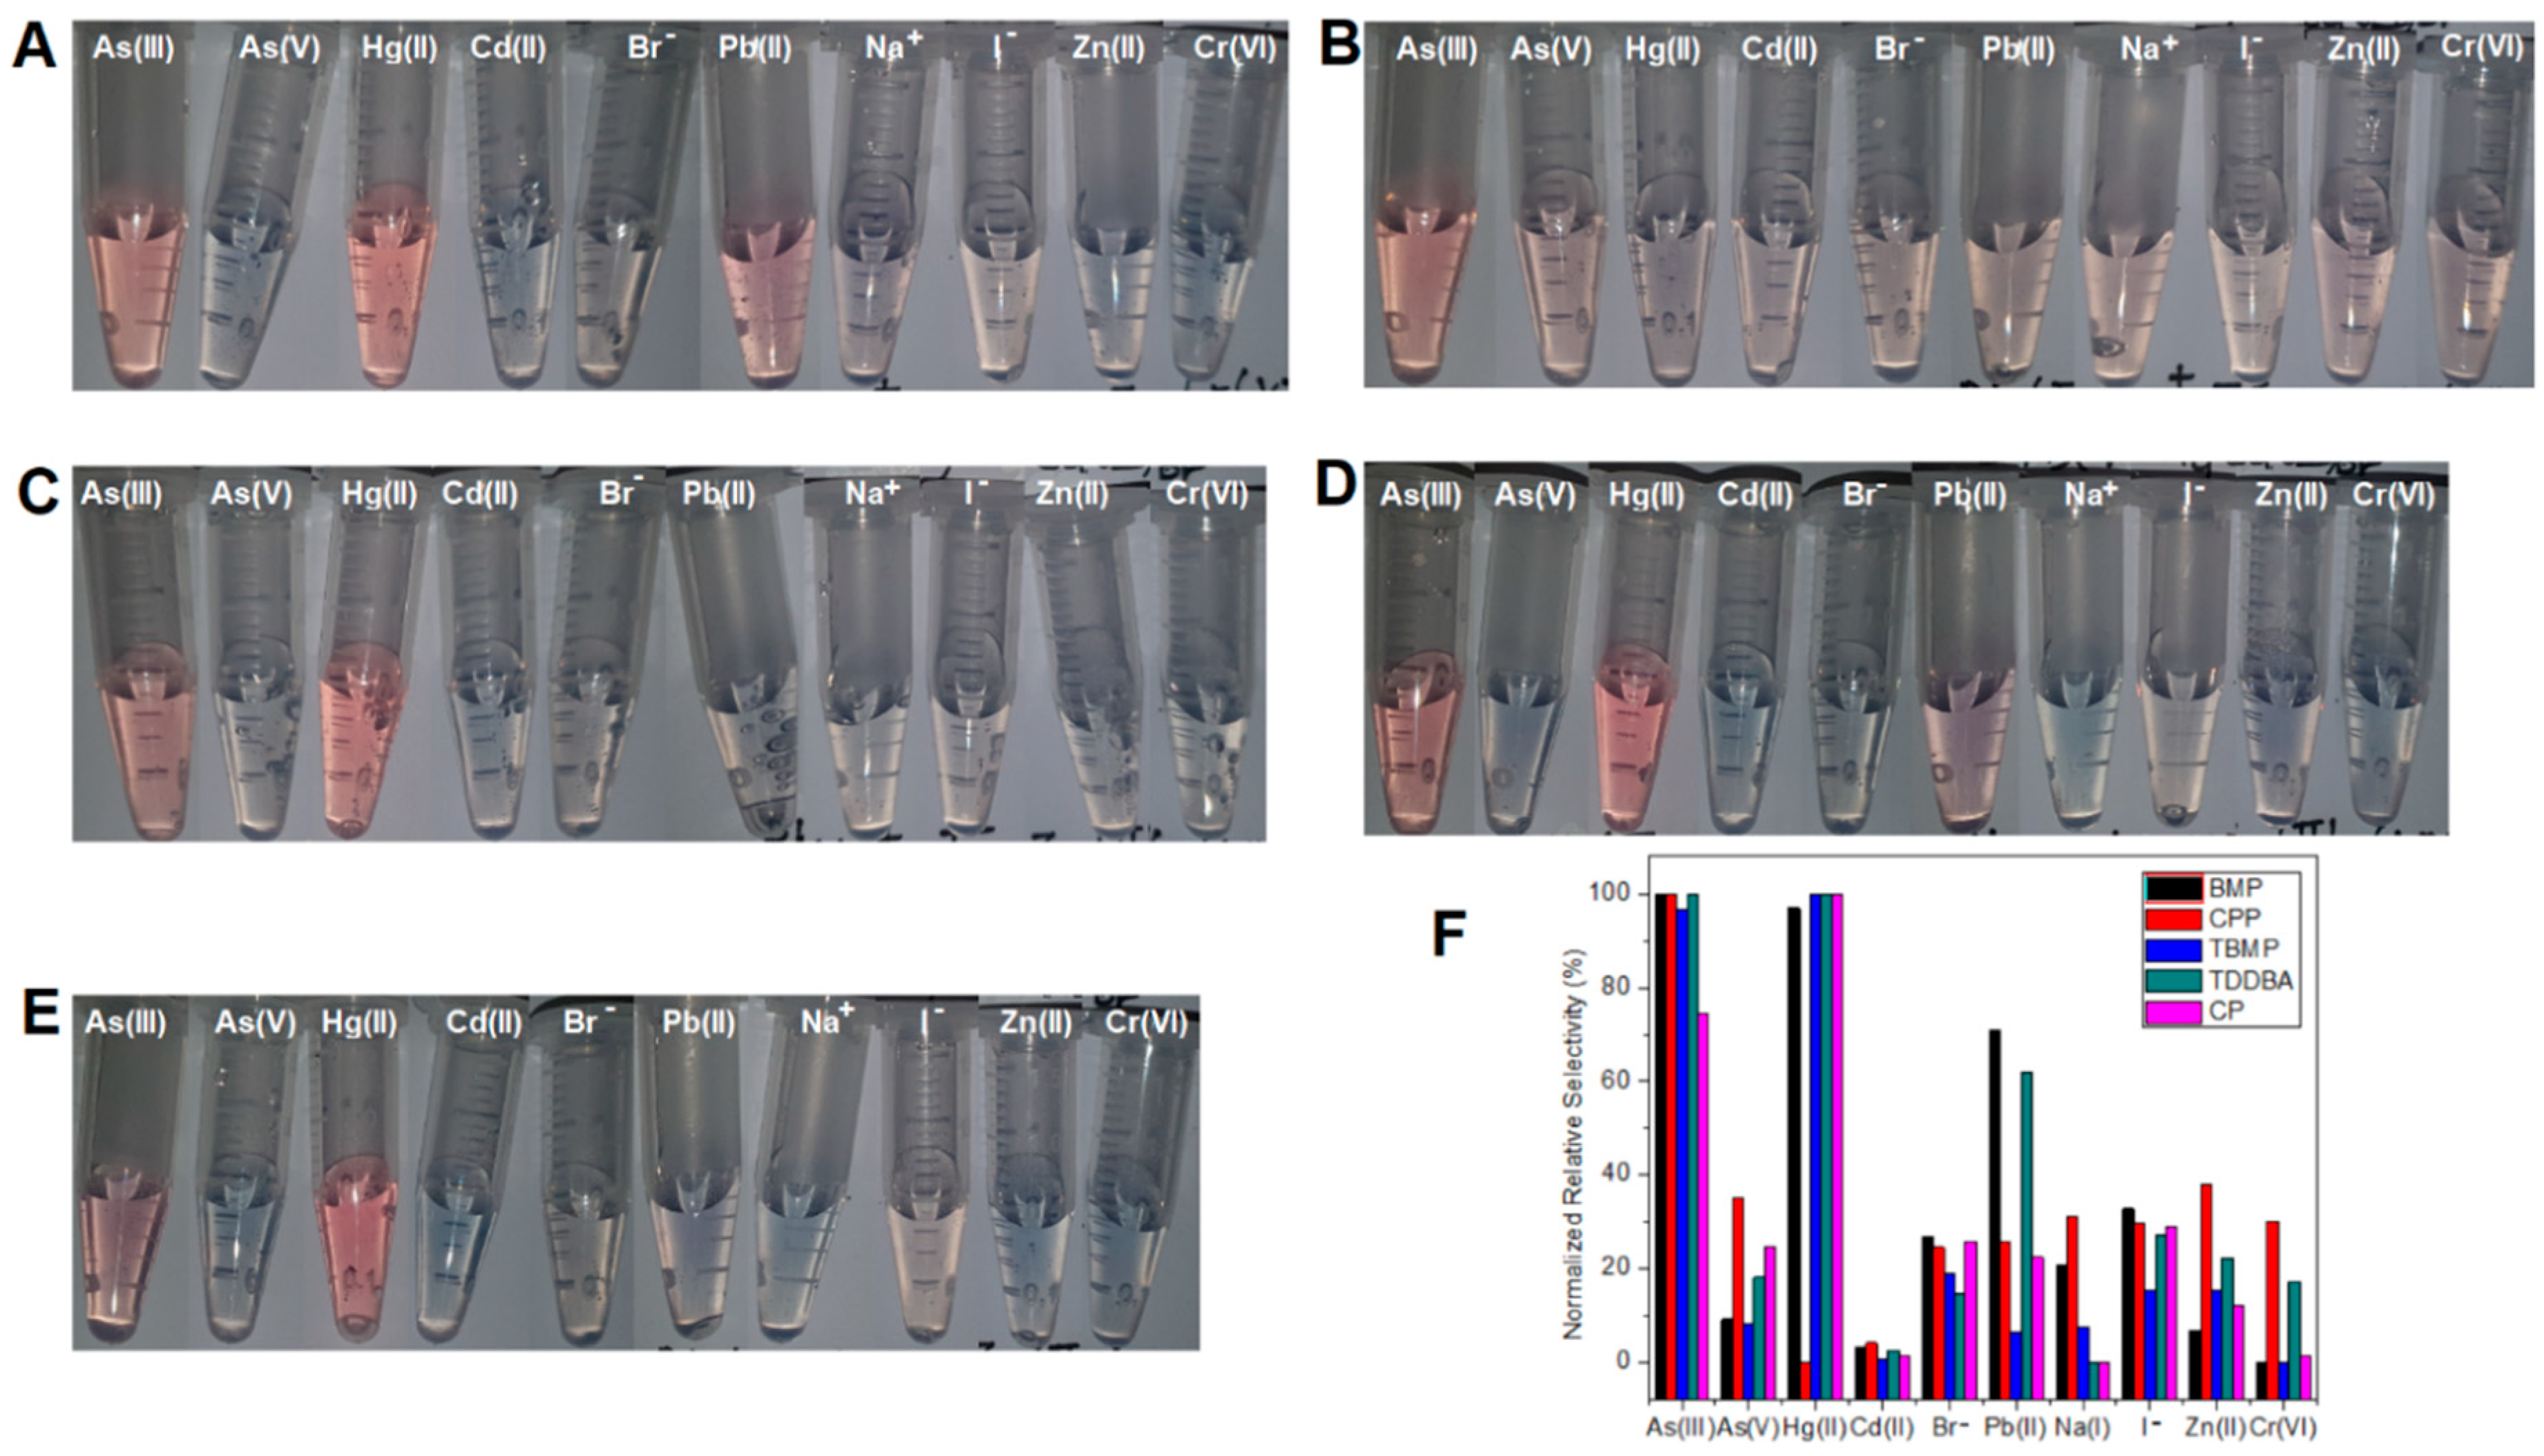
We also studied the interactions between As(III), AuNPs, and ILs. The addition of ILs to AuNPs caused their immediate aggregation. However, the addition of ILs to a mixture of As(III) and AuNPs did not cause aggregation, which could be attributed to two possible reasons: either As(III) adsorbed on AuNPs prevented aggregation, or As(III) in the solution prevented aggregation. It is well known that adsorption usually takes time [1,13]. Although no report was found to study exactly how fast arsenite ions could be adsorbed onto AuNPs capped with citrate, the literature reports typically adopted 20 to 30 min of incubation time to ensure the adsorption or reaction is more complete. The shortest adsorption time found was 8 min, where AuNPs were titrated with arsenite and measured using isothermal titration calorimetry [1]. The addition of ILs immediately after (within several seconds) a quick mixing (1–2 s) of As(III) and AuNPs also did not cause aggregation, while the addition of ILs to AuNPs alone caused aggregation. In such a short time (within 5 s), it is likely that adsorption of As(III) onto AuNPs did not happen, even if it happened later (after several minutes). Hence, this eliminates the possibility that it was the adsorbed arsenite ions that prevented AuNPs from aggregating. This proved that prevention of aggregation could not be attributed to the adsorption of As(III) onto AuNPs, which takes time (minutes to hours), but should be mainly attributed to the quick interaction (within several seconds) between As(III) and ILs. This experiment also indicates that the interaction between As(III) and ILs is immediate and fast, and also faster than that between AuNPs and ILs, if there is any.

3.5. Selectivity

The relative selectivity of the five sensors sBMP, sCPP, sTBMP, sTDDBA, and sCP (Figure 3) were studied. Sensor sTBMP and sCP (Figure 3C,E) showed selectivity towards As(III) and Hg (II), which could prevent AuNPs from aggregating in the presence of a sufficient amount of TBMP, while all the other eight ions (Cd(II), Pb(II), Zn(II), Na+, Br, I, As(V), and Cr(VI)) could not prevent AuNPs from aggregating. Sensor sBMP and sTDDBA (Figure 3A,D) showed selectivity towards As(III), Hg(II), and Pb(II), while sensor sCPP showed selectivity towards As(III), As(V), Zn(II), Na+, and I (Figure 3B,F). Besides arsenite, sensors sBMP, sTBMP, and sTDDBA showed selectivity towards Hg2+. The reason could be the formation of amalgam, which changed the surface composition of AuNPs. When the analyte concentration was reduced from 1 ppm to 50 ppb, sensor selectivity was improved. This means that sensor selectivity was better at a low concentration of analytes than that at a high concentration of analytes. For instance, sBMP had a high response to As(III), Hg(II), and Pb(II) and a medium response to Br and I with 1 ppm analyte, while it had a high and medium response to As(III) and I only with 50 ppb analyte. Better selectivity at low concentrations facilitates higher accuracy and prevents false positives at low concentrations. This would be beneficial to the analysis of real samples with a strong matrix effect (signal changed by the matrix of all other components instead of the analyte in the sample). Dilution can be applied to lower the matrix effect and prevent false positives from interfering with components in the sample matrix (matrix refers to the components of a sample other than the analyte of interest).

3.6. Repeatability

The repeatability of the sensors was studied with 200 µL of AuNPs, 10 mM BMP, and 0–100 ppb of arsenite. Three replicates were conducted. The relative standard deviations (RSD) of the extinction values at 517 nm and 650 nm and their ratios were calculated for the 3 × 12 samples, and are listed in Table 3. Out of the total 36 samples, 29 had RSDs within ±3%. The remaining seven samples had RSDs within ±4%. Hence, the measurements of arsenite using IL-assisted AuNPs were repeatable, with an RSD within ±4%.

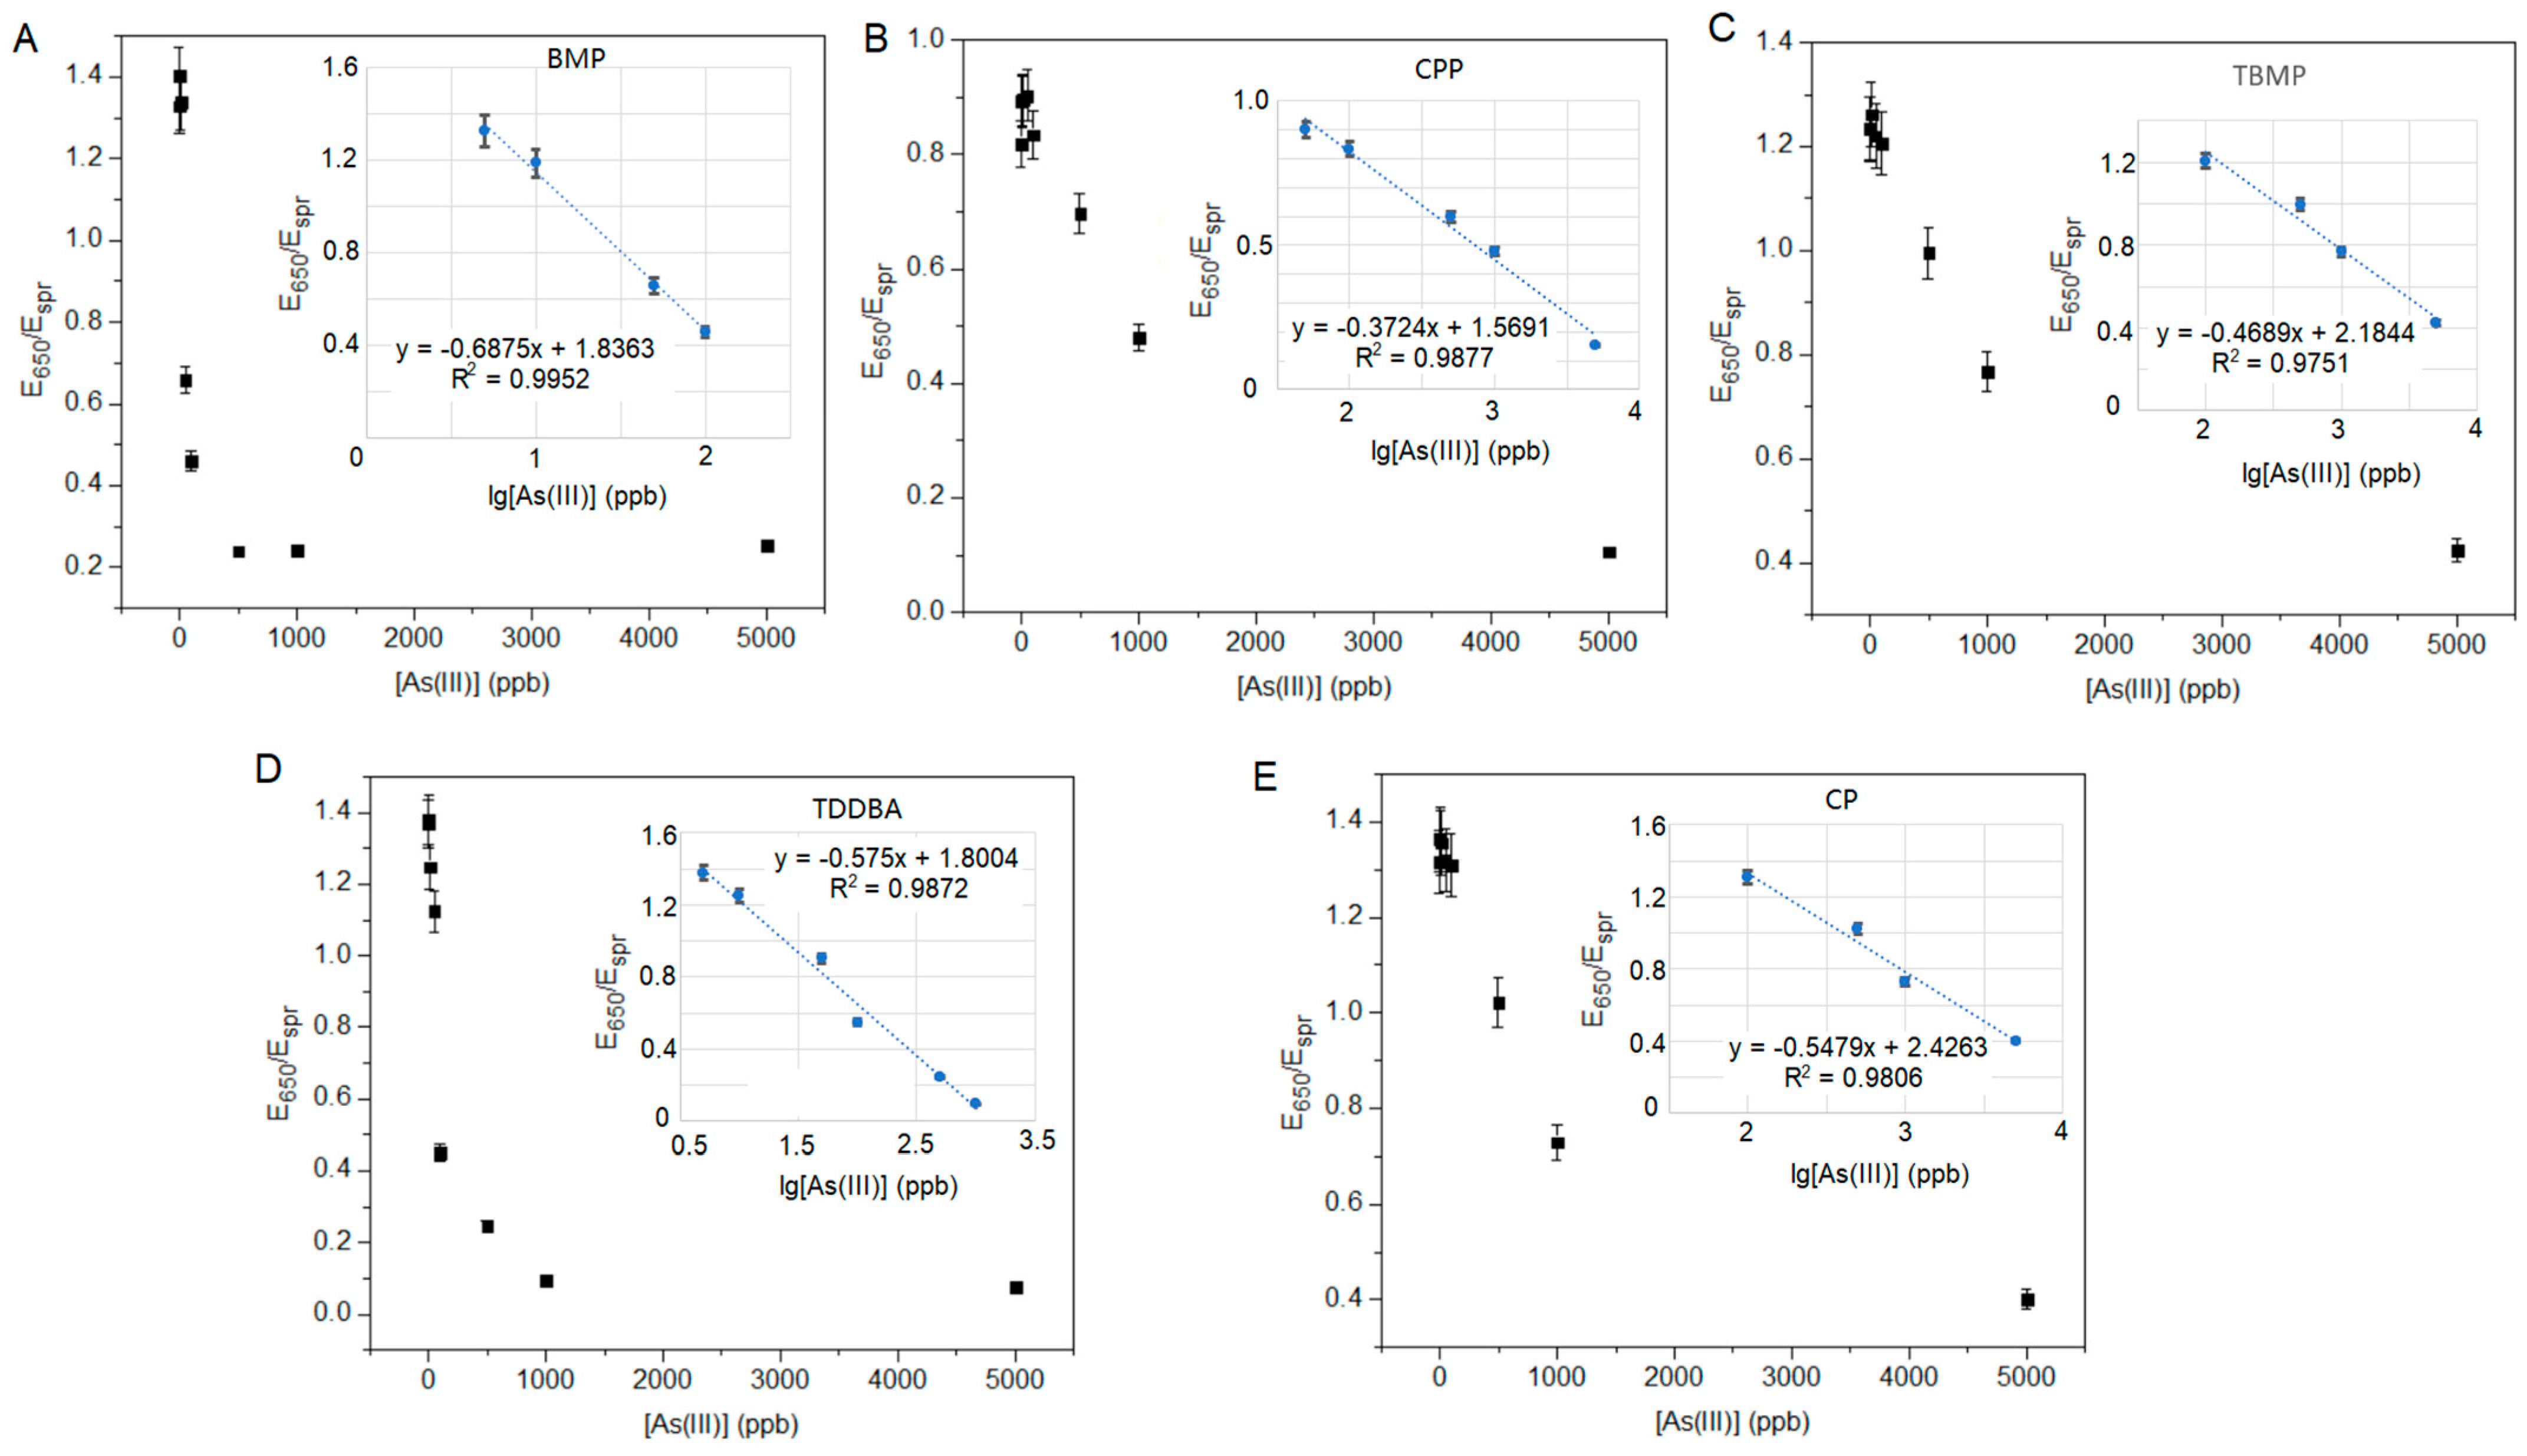
3.7. Calibration and Sensitivity
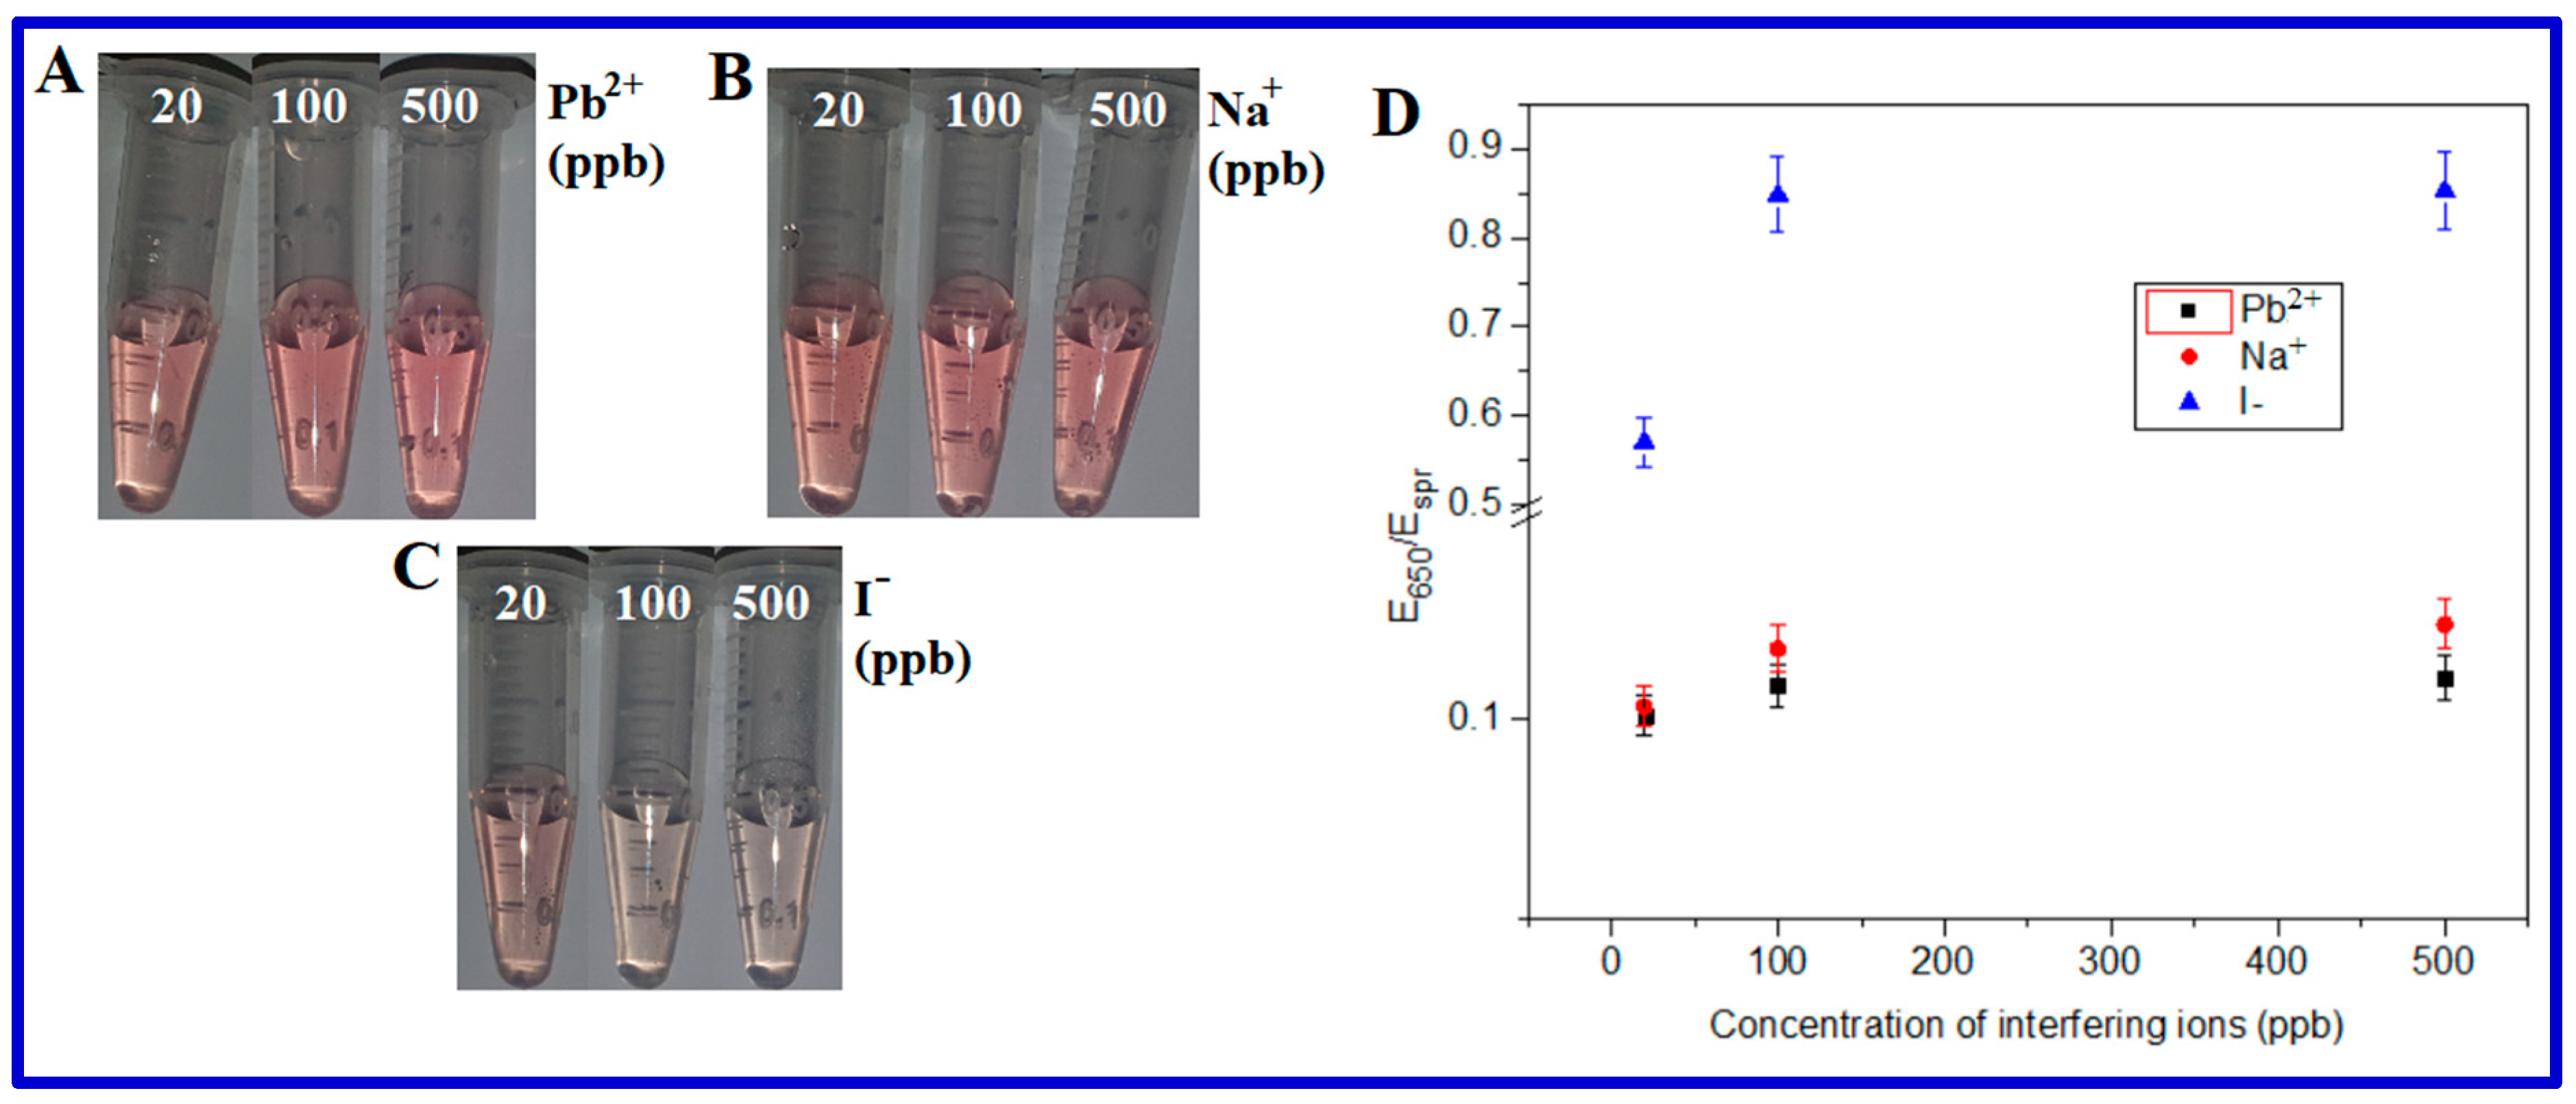
To achieve the lowest detection limit, we first determined the minimum concentration of ILs required for AuNP aggregation (Table 2). If the added amount of ILs is insufficient (i.e., below the minimum concentration), the AuNPs do not aggregate at any concentration of arsenite. On the other hand, when ILs are overdosed, a high amount of arsenite would be required to prevent the AuNPs’ aggregation, which increases the LOD and, hence, lowers sensitivity. Therefore, a dose of ILs slightly higher than the minimum dose would achieve better sensitivity. In fact, the LOD is more greatly affected by the difference between the working dose and threshold dose than the absolute values of the threshold. The smaller the difference is, the lower the achievable LOD will be. Hence, although lower concentrations of CP and TDDBA are required to induce AuNPs’ aggregation, they do not have significant advantages in terms of improving the LOD of arsenite over other ILs. Therefore, here, we chose sBMP as an example for full characterization instead of sCP or sTDDBA.
The calibrations of the sensors were conducted with the optimized concentrations of ILs (i.e., the working concentrations listed in Table 2) and different concentrations of arsenite (Figure 4), and E650/Espr was plotted against the logarithm concentration of arsenite (Figure 4 inserts). All five plots (Figure 4 inserts) are linear, with R2 values near to 1.0. the LOD of sBMP was calculated from 3σ, where σ is the standard deviation of the measured three replicates of the lowest concentration of arsenite (Table 3 and Figure 4A). sBMP had a linear detection range of 0.59–100 ppb with an LOD of 0.18 ppb. The LODs and linear ranges of the remaining sensors (sCPP, sCP, sTBMP, sTDDBA, and sCPMI) were not determined in this study. The LOD of the sensor sBMP in this study was 0.18 ppb, which was the second lowest among the reported arsenic sensors (Table 4).

3.8. Interference

From Figure 3A, it is clear that sBMP responded to arsenite, Hg(II), and Pb(II), which means Hg(II) and Pb(II) are potential interfering ions. The reason could be the formation of amalgam, which changed the surface composition of AuNPs [28]. sBMP had no response towards As(V), Cd(II), Br, Na(I), I, Zn(II), and Cr(VI), indicating that they are not potential interfering ions. For the interference study, we chose Pb(II), one of two potential interfering ions aforementioned, and also Na(I) and I¯, i.e., one cation and one anion, as two of seven potential non-interfering ions.
An ionic interference study was conducted by spiking a certain concentration (20, 100, or 500 ppb) of ions (Pb2+, Na+, or I) into AuNP suspensions in the presence of 200 ppb As(III) and 10 mM BMP. With the addition of up to 500 ppb Pb2+ or Na+ ions, AuNPs’ color did not have any significant changes (Figure 5) and the changes in the spectroscopic E650/Espr ratio were also negligible, which indicates that up to 500 ppb Pb2+ or Na+ did not significantly interfere with the sensor sBMP. However, the sBMP sensor was affected by ≥100 ppb I¯ anions (Figure 5C,D). Hence, Pb(II) and Na(I) ions did not interfere with the sensor sBMP at concentrations of up to 500 ppb, while iodide ions interfered significantly at a concentration of 100 ppb.

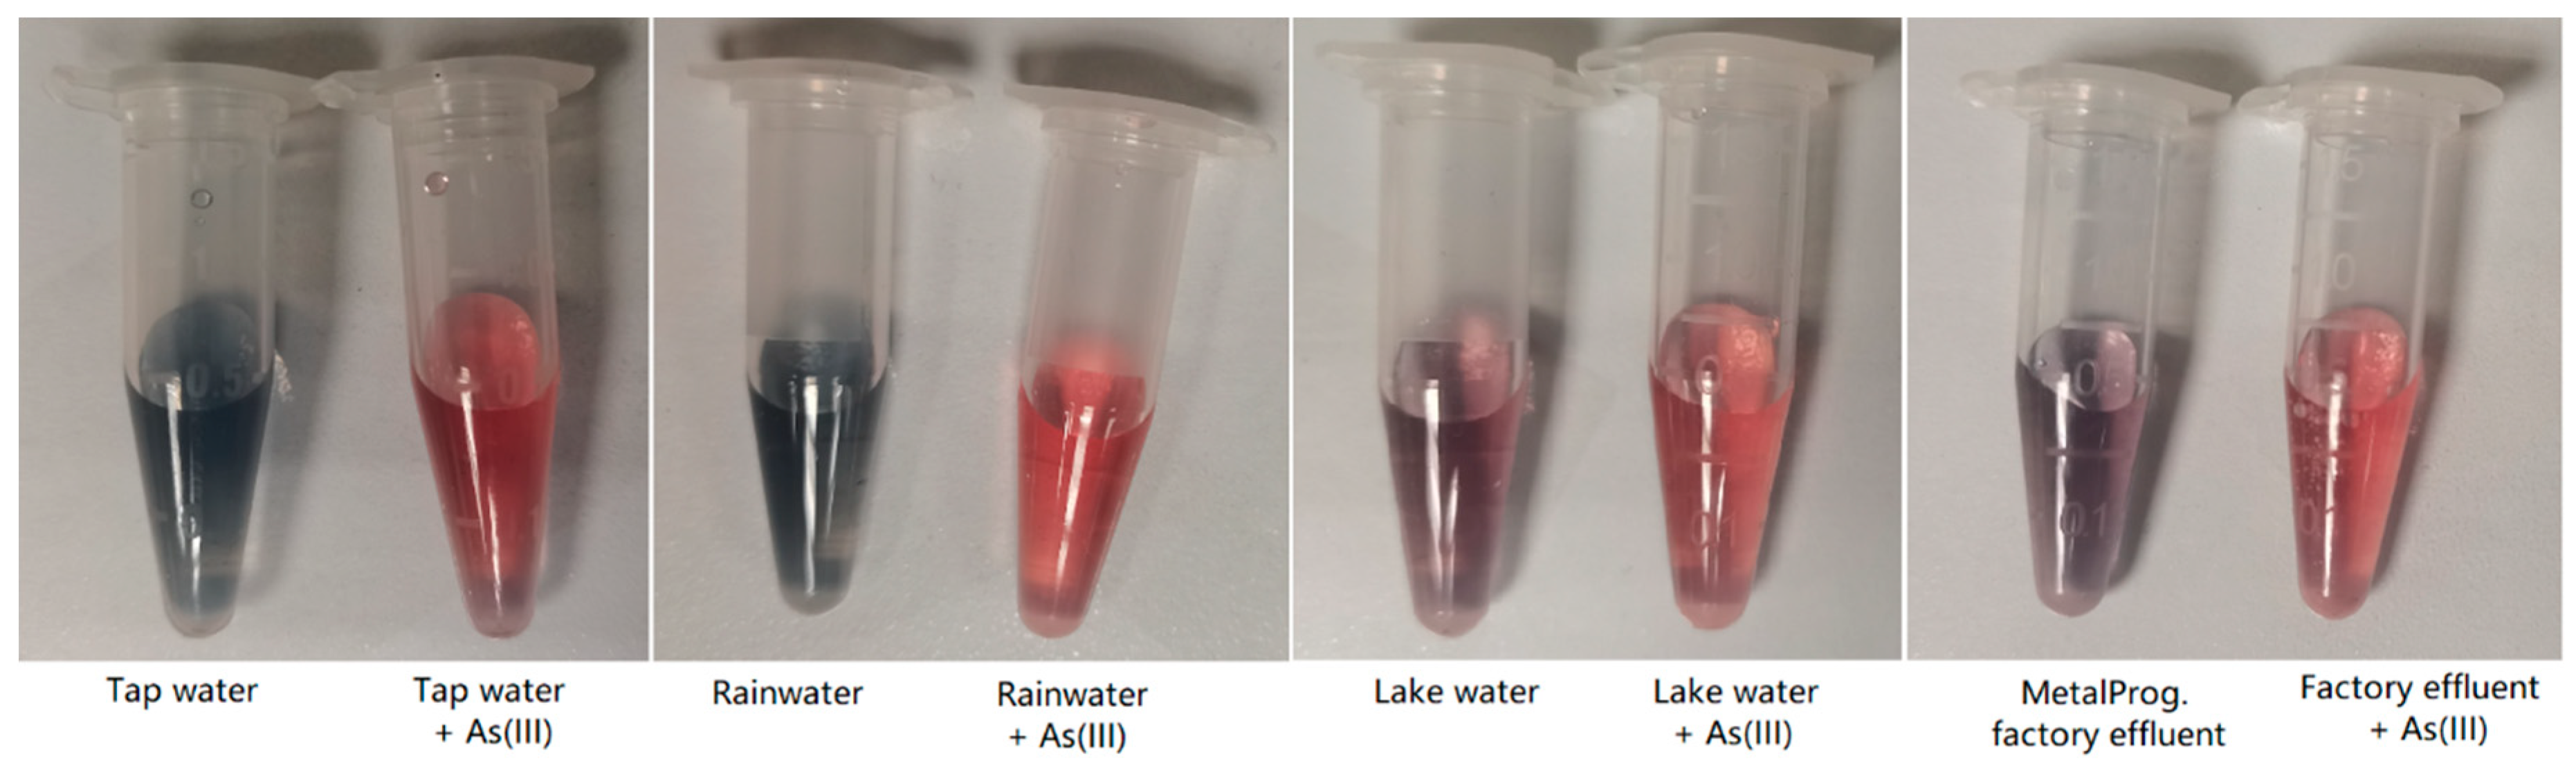
3.9. Measuring Real Water Samples

Four real samples (tap water, rainwater, lake water, and MetalProg factory effluent) with or without spiking of 100 ppb As(III) were measured using the sBMP method. All samples were filtered through a 0.22 µm membrane filter. The lake water and MetalProg factory effluent samples were diluted 10 times before use due to a strong matrix effect, while the tap water and rainwater samples were directly tested without further dilution. The tap water and rainwater samples after tests were blue, while the lake water and MetalProg factory effluent samples after tests were not as blue as the former two samples (Figure 6), which could also be due to the remaining matrix effect from the latter two samples even with dilution 10 times. The BMP and AuNP-assisted colorimetric results from all samples with and without spiking of 100 ppb As(III) are listed in Table 5. They agreed well with those determined using inductively coupled plasma-optical emission spectroscopy (ICP-OES). ICP-OES determines the total arsenic concentration, including arsenite and arsenate. It is worth noting that ICP-OES detects total arsenic, while the sBMP sensor detects arsenite species only; hence, it is reasonable that the sBMP sensing results were lower than those from ICP-OES because arsenate could exist in the pristine sample or some amount of arsenite was oxidized by the sample matrix into arsenate. When the total arsenic concentration is to be determined, the sample could be reduced by an appropriate reducing agent, i.e., SnCl2, to convert arsenate to arsenite, which is then determined using sBMP. The difference between the determined values before and after reduction is the concentration of arsenate. Arsenite is more toxic than arsenate. In Table 5, the accuracy of results was not calculated since ICP-OES and sBMP measured different species. In natural sources, the colorimetric results were lower than those from ICP-OES. Apart from the signal from arsenate, other possible reasons could include the facts that (1) the ICP-OES was calibrated using standards prepared in DI water without considering the matrix effect, which caused errors in the ICP-OES results, and (2) some interfering species in the real-world samples interfered with the detection of arsenite ions.

4. Conclusions

We discovered that aggregation of citrate-stabilized AuNPs could be induced more efficiently by organic ILs than by inorganic electrolytes (e.g., NaCl), up to 40,000-fold. The threshold concentrations to induce AuNP aggregation were, in order from high to low, [BMP] > [CPP] > [TBMP] > [CPMI] > [TDDBA] > [CP]. Very strong interactions between the long chain of CP and citrate on the surface of the AuNPs explain why CP was most efficient.
However, the aggregation of AuNPs induced by ILs was inhibited by arsenite As(III). Our experimental results proved that prevention of AuNP aggregation could not be attributed to the adsorption of As(III) onto AuNPs, which takes time (minutes to hours), but should be mainly attributed to the quick interaction (within several seconds) between As(III) and ILs.
In this manuscript, we reported a new approach for arsenite detection and determination, with good sensitivity and selectivity. Among the sensors based on ILs and AuNPs, sTBMP and sCP showed selectivity towards As(III) and Hg (II), which could prevent AuNPs from aggregating in the presence of a sufficient amount of TBMP, while all the other eight ions (Cd(II), Pb(II), Zn(II), Na+, Br, I, As(V), and Cr(VI)) could not prevent AuNPs from aggregating. The repeatability of the sensors is good, with all RSDs within ±4%. sBMP had a linear detection range of 0.59–100 ppb with a LOD of 0.18 ppb, which was the second lowest among the reported arsenic sensors. Pb(II) and Na(I) ions did not interfere with the sensor sBMP at concentrations of up to 500 ppb, while iodide ions interfered significantly at a concentration of 100 ppb. Four real samples (tap water, rainwater, lake water, and MetalProg factory effluent) with or without spiking of 100 ppb As(III) were measured using the sBMP method. The BMP and AuNP-assisted colorimetric results from all samples with and without spiking of 100 ppb As(III) agreed well with those determined using inductively coupled plasma–optical emission spectroscopy (ICP-OES). This demonstrates the advantages of IL- and AuNP-assisted arsenite sensors for the analysis of real samples in overcoming their matrix effect, which is usually very challenging for many other approaches and sensors.

Supplementary Materials

The following supporting information can be downloaded at: https://www.mdpi.com/article/10.3390/chemosensors11050302/s1. References [1,10,18,19,20,29,30,31,32,33] are cited in the supplementary materials.

Author Contributions

Conceptualization, X.H.L.; methodology, X.H.L.; validation, S.F.Y.L.; formal analysis, M.J.W.; investigation, M.J.W.; resources, S.F.Y.L.; data curation, X.H.L.; writing—original draft preparation, X.H.L.; writing—review and editing, S.F.Y.L.; visualization, X.H.L.; supervision, S.F.Y.L.; project administration, S.F.Y.L.; funding acquisition, S.F.Y.L. All authors have read and agreed to the published version of the manuscript.

Funding

This research was funded by the PUBLIC UTILITES BOARD OF SINGAPORE, grant number “PUB-1804-0076”.

Institutional Review Board Statement

Not Applicable.

Informed Consent Statement

Not Applicable.

Data Availability Statement

All data have been shared in the main text and supplementary information.

Conflicts of Interest

The authors declare no conflict of interest.

References

  1. Zong, C.H.; Zhang, Z.J.; Liu, B.W.; Liu, J.W. Adsorption of Arsenite on Gold Nanoparticles Studied with DNA Oligonu-cleotide Probes. Langmuir 2019, 35, 7304–7311. [Google Scholar] [CrossRef] [PubMed]
  2. Al-Rekabi, S.H.; Kamil, Y.M.; Abu Bakar, M.H.; Fen, Y.W.; Lim, H.N.; Kanagesan, S.; Mahdi, M.A. Hydrous ferric oxide-magnetite-reduced graphene oxide nanocomposite for optical detection of arsenic using surface plasmon resonance. Opt. Laser Technol. 2019, 111, 417–423. [Google Scholar] [CrossRef]
  3. Muppidathi, M.; Perumal, P.; Ayyanu, R.; Subramanian, S. Immobilization of ssDNA on a metal-organic framework derived magnetic porous carbon (MPC) composite as a fluorescent sensing platform for the detection of arsenate ions. Analyst 2019, 144, 3111–3118. [Google Scholar] [CrossRef] [PubMed]
  4. Xiao, L.; Wildgoose, G.G.; Compton, R.G. Sensitive electrochemical detection of arsenic (III) using gold nanoparticle modified carbon nanotubes via anodic stripping voltammetry. Anal. Chim. Acta 2008, 620, 44–49. [Google Scholar] [CrossRef]
  5. Rahman, M.M.; Hussain, M.M.; Arshad, M.N.; Awual, M.R.; Asiri, A.M. Arsenic sensor development based on modification with (E)-N-(2-nitrobenzylidine)-benzenesulfonohydrazide: A real sample analysis. New J. Chem. 2019, 43, 9066–9075. [Google Scholar] [CrossRef]
  6. Forzani, E.S.; Foley, K.; Westerhoff, P.; Tao, N.J. Detection of arsenic in groundwater using a surface plasmon resonance sensor. Sens. Actuators B-Chem. 2007, 123, 82–88. [Google Scholar] [CrossRef]
  7. Dominguez-Gonzalez, R.; Varela, L.G.; Bermejo-Barrera, P. Functionalized gold nanoparticles for the detection of arsenic in water. Talanta 2014, 118, 262–269. [Google Scholar] [CrossRef]
  8. Wu, Y.G.; Zhan, S.S.; Wang, F.Z.; He, L.; Zhi, W.T.; Zhou, P. Cationic polymers and aptamers mediated aggregation of gold nanoparticles for the colorimetric detection of arsenic (III) in aqueous solution. Chem. Commun. 2012, 48, 4459–4461. [Google Scholar] [CrossRef]
  9. Wu, Y.G.; Liu, L.; Zhan, S.S.; Wang, F.Z.; Zhou, P. Ultrasensitive aptamer biosensor for arsenic (III) detection in aqueous solution based on surfactant-induced aggregation of gold nanoparticles. Analyst 2012, 137, 4171–4178. [Google Scholar] [CrossRef]
  10. Matsunaga, K.; Okuyama, Y.; Hirano, R.; Okabe, S.; Takahashi, M.; Satoh, H. Development of a simple analytical method to determine arsenite using a DNA aptamer and gold nanoparticles. Chemosphere 2019, 224, 538–543. [Google Scholar] [CrossRef]
  11. Wu, Y.G.; Zhan, S.S.; Xing, H.B.; He, L.; Xu, L.R.; Zhou, P. Nanoparticles assembled by aptamers and crystal violet for arsenic (III) detection in aqueous solution based on a resonance Rayleigh scattering spectral assay. Nanoscale 2012, 4, 6841–6849. [Google Scholar] [CrossRef] [PubMed]
  12. Cui, L.; Wu, J.; Ju, H.X. Label-free signal-on aptasensor for sensitive electrochemical detection of arsenite. Biosens. Bioelectron. 2016, 79, 861–865. [Google Scholar] [CrossRef] [PubMed]
  13. Tan, Z.Q.; Liu, J.F.; Yin, Y.G.; Shi, Q.T.; Jing, C.Y.; Jiang, G.B. Colorimetric Au Nanoparticle Probe for Speciation Test of Arsenite and Arsenate Inspired by Selective Interaction between Phosphonium Ionic Liquid and Arsenite. ACS Appl. Mater. Interfaces 2014, 6, 19833–19839. [Google Scholar] [CrossRef] [PubMed]
  14. Krishna, T.G.A.; Tekuri, V.; Mohan, M.; Trivedi, D.R. Selective colorimetric chemosensor for the detection of Hg2+ and arsenite ions using Isatin based Schiff’s bases; DFT Studies and Applications in test strips. Sens. Actuators B-Chem. 2019, 284, 271–280. [Google Scholar] [CrossRef]
  15. Treto-Suarez, M.A.; Tapia, J.; Hidalgo-Rosa, Y.; Paez-Hernandez, D.; Molins, E.; Zarate, X.; Schott, E. New Sensitive and Selective Chemical Sensors for Ni2+ and Cu2+ Ions: Insights into the Sensing Mechanism through DFT Methods. J. Phys. Chem. A 2020, 124, 6493–6503. [Google Scholar] [CrossRef]
  16. Zehra, S.; Khan, R.A.; Alsalme, A.; Tabassum, S. Coumarin Derived “Turn on” Fluorescent Sensor for Selective Detection of Cadmium (II) Ion: Spectroscopic Studies and Validation of Sensing Mechanism by DFT Calculations. J. Fluoresc. 2019, 29, 1029–1037. [Google Scholar] [CrossRef]
  17. Sánchez, J. Cationic polyelectrolytes. Synthesis, characterization and application in analysis and removal of arsenic. Ph.D. Thesis, Université de Grenoble, Grenoble, France, 2010. [Google Scholar]
  18. Bac, L.H.; Kim, J.S.; Kim, J.C. Size, Optical and Stability Properties of Gold Nanoparticles Synthesized by Electrical Explosion of Wire in Different Aqueous Media. Rev. Adv. Mater. Sci. 2011, 28, 117–121. [Google Scholar]
  19. Szunerits, S.; Spadavecchia, J.; Boukherroub, R. Surface plasmon resonance: Signal amplification using colloidal gold nanoparticles for enhanced sensitivity. Rev. Anal. Chem. 2014, 33, 153–164. [Google Scholar] [CrossRef]
  20. Wang, W.J.; Ding, X.F.; Xu, Q.; Wang, J.; Wang, L.; Lou, X.H. Zeta-potential data reliability of gold nanoparticle bio-molecular conjugates and its application in sensitive quantification of surface absorbed protein. Colloids Surf. B-Biointerfaces 2016, 148, 541–548. [Google Scholar] [CrossRef]
  21. Tseng, K.H.; Hsieh, C.L.; Huang, J.C.; Tien, D.C. The Effect of NaCl/pH on Colloidal Nanogold Produced by Pulsed Spark Discharge. J. Nanomater. 2015, 2015, 5. [Google Scholar] [CrossRef]
  22. Kalluri, J.R.; Arbneshi, T.; Khan, S.A.; Neely, A.; Candice, P.; Varisli, B.; Washington, M.; McAfee, S.; Robinson, B.; Banerjee, S.; et al. Use of Gold Nanoparticles in a Simple Colorimetric and Ultrasensitive Dynamic Light Scattering Assay: Selective Detection of Arsenic in Groundwater. Angew. Chem.-Int. Edit. 2009, 48, 9668–9671. [Google Scholar] [CrossRef] [PubMed]
  23. Liu, B.W.; Liu, J.W. DNA adsorption by magnetic iron oxide nanoparticles and its application for arsenate detection. Chem. Commun. 2014, 50, 8568–8570. [Google Scholar] [CrossRef] [PubMed]
  24. Lopez, A.; Zhang, Y.F.; Liu, J.W. Tuning DNA adsorption affinity and density on metal oxide and phosphate for improved arsenate detection. J. Colloid Interface Sci. 2017, 493, 249–256. [Google Scholar] [CrossRef] [PubMed]
  25. Mulvihill, M.; Tao, A.; Benjauthrit, K.; Arnold, J.; Yang, P. Surface-enhanced Raman spectroscopy for trace arsenic detection in contaminated water. Angew. Chem.-Int. Edit. 2008, 47, 6456–6460. [Google Scholar] [CrossRef]
  26. Liu, Z.P.; Li, G.D.; Xia, T.T.; Su, X.G. Ultrasensitive fluorescent nanosensor for arsenate assay and removal using oligonucleotide-functionalized CuInS2 quantum dot@magnetic Fe3O4 nanoparticles composite. Sens. Actuators B-Chem. 2015, 220, 1205–1211. [Google Scholar] [CrossRef]
  27. Liu, F.; De Cristofaro, A.; Violante, A. Effect of pH, phosphate and oxalate on the adsorption/desorption of arsenate on/from goethite. Soil Sci. 2001, 166, 197–208. [Google Scholar] [CrossRef]
  28. Zhang, C.; Kong, C.; Liu, Q.; Chen, Z. Ultrasensitive colorimetric detection of Hg2+ ions based on enhanced catalytic performance of gold amalgam dispersed in channels of rose petals. Analyst 2019, 144, 1205–1209. [Google Scholar] [CrossRef]
  29. Turkevich, J.; Stevenson, P.C.; Hillier, J. A Study of the Nucleation and Growth Processes in the Synthesis of Colloidal Gold. Discuss. Faraday Soc. 1951, 11, 55–75. [Google Scholar] [CrossRef]
  30. Andalibi, M.R.; Wokaun, A.; Bowen, P.; Testino, A. Kinetics and Mechanism of Metal Nanoparticle Growth via Optical Extinction Spectroscopy and Computational Modeling: The Curious Case of Colloidal Gold. ACS Nano 2019, 13, 11510–11521. [Google Scholar] [CrossRef]
  31. Ji, X.H.; Song, X.N.; Li, J.; Bai, Y.B.; Yang, W.S.; Peng, X.G. Size control of gold nanocrystals in citrate reduction: The third role of citrate. J. Am. Chem. Soc. 2007, 129, 13939–13948. [Google Scholar] [CrossRef]
  32. Zhao, L.L.; Jiang, D.; Cai, Y.; Ji, X.H.; Xie, R.U.; Yang, W.S. Tuning the size of gold nanoparticles in the citrate reduction by chloride ions. Nanoscale 2012, 4, 5071–5076. [Google Scholar] [CrossRef]
  33. Haiss, W.; Thanh, N.T.K.; Aveyard, J.; Fernig, D.G. Determination of size and concentration of gold nanoparticles from UV-Vis spectra. Anal. Chem. 2007, 79, 4215–4221. [Google Scholar] [CrossRef]
Figure 1. (A) Schematic principle of aggregation of citrate-capped AuNPs induced by ILs but inhibited by As(III). (B) Chemical structures and names of the six ILs used in this study. (C) TEM images of the as-synthesized (left and middle) or aggregated (right) AuNPs.
Chemosensors 11 00302 g001
Figure 2. (A) Optical images during the formation of AuNPs at 100 °C with the starting molar ratio of citrate/Au 3.35/1. (B) Illustrative chemical structure of citrate-capped AuNPs synthesized. (C) Change in AuNPs from dispersion to aggregate with increasing BMP concentration in the absence of arsenite. (D) Particle size distribution and zeta potential of the as-prepared AuNP suspension. (E) Relevant extinction spectra of (C). (F) Change in AuNPs from aggregation to dispersion with increasing As(III) concentration in the presence of 10 mM BMP.
Chemosensors 11 00302 g002
Figure 3. Color change of AuNP suspension depending on 1 ppm different ions in the absence of DNAzyme substrate and in the presence of optimized concentration of ILs: (A) BMP, (B) CPP, (C) TBMP, (D) TDDBA, and (E) CP. (F) Normalized relative selectivity.
Chemosensors 11 00302 g003
Figure 4. Sensor sensitivity of As(III) with optimized concentration of ILs: (A) BMP, (B) CPP, (C) TBMP, (D) TDDBA, and (E) CP.
Chemosensors 11 00302 g004
Figure 5. Color changes in AuNPs depending on the interfering (A) Pb2+, (B) Na+, and (C) I concentration in the presence of 200 ppb As(III) and 10 mM BMP. (D) Spectra E650/Espr ratio of (AC).
Chemosensors 11 00302 g005
Figure 6. Tests of real samples (tap water, rainwater, lake water, and MetalProg factory effluent) with and without spiking of 100 ppb As(III) using the sBMP method: photographs of samples with and without spiking after tests (lake water and MetalProg factory effluent samples were diluted with DI water 10 times before use due to strong matrix effect).
Chemosensors 11 00302 g006
Table 1. Sensor names and their compositions, reagent addition sequences, and reaction time.
Sensor No.DescriptionComposition, Sequence, and Reaction Time
1sCPMIAuNPs+MOPS+As(III) *, 10 min, + CPMI, 10 min
2sCPPAuNPs+MOPS+As(III) *, 10 min, + CPP, 10 min
3sTDDBAAuNPs+MOPS+As(III) *, 10 min, + TDDBA, 10 min
4sCPAuNPs+MOPS+As(III) *, 10 min, + CP, 10 min
5sBMPAuNPs+MOPS+As(III) *, 10 min, + BMP, 10 min
6sTBMPAuNPs+MOPS+As(III) *, 10 min, + TBMP, 10 min
Note: * For the selectivity study, the analyte could be As(III) or other ions; for the interference study, the analyte was As(III) together with other ions.
Table 2. Minimal threshold concentration required for the aggregation of AuNPs and the working concentrations adopted in this study.
[IL] (mM)
BMPCPCPMICPPTBMPTDDBA
Min. threshold conc. required for AuNP aggregation80.75 × 10−30.461.51.5 × 10−3
Working conc.101.25 × 10−30.5102.52.25 × 10−3
Table 3. Repeatability tests for arsenite sensing with 200 µL of AuNPs and 10 mM BMP.
VAuNP (μL)VMOPS (μL)V200 ppb As (μL)V50 ppm As (μL)[As] (ppb)V0.02 M BMP (μL)[BMP] (mM)Extinction
Replicate 1Replicate 2Replicate 3RSD (%)
E517 nmE650 nmE650/E517E517 nmE650 nmE650/E517E517 nmE650 nmE650/E517E517 nmE650 nmE650/E517
2004000000100.2220.2961.330.230.311.350.2170.2871.322.753.610.95
2004001505150100.2140.2941.370.2210.3041.380.2170.291.341.322.221.62
20040030010300100.220.2931.330.2190.3081.410.2170.291.340.692.873.08
20040060020600100.2260.2981.320.2260.2961.310.2190.2891.321.811.590.41
20040090030900100.2250.2871.280.230.2841.230.220.2821.282.130.832.02
20040000.48401200100.2380.1870.790.2370.1860.780.2250.1820.813.11.421.72
20040000.6501500100.2510.140.560.2480.1370.550.2420.1410.581.821.362.86
20040000.72601800100.2520.1270.50.2570.1250.490.2620.1260.481.860.652.46
20040000.84702100100.2630.1230.470.2580.1240.480.2660.1190.451.442.153.6
20040000.96802400100.270.0920.340.2630.090.340.2730.0880.321.762.133.3
20040001.08902700100.2740.0640.230.2660.0650.240.2860.0670.233.562.32.54
20040001.21003000100.2860.0570.20.2820.0530.190.2780.0540.191.363.192.94
Table 4. Comparison of the approaches and detection limits of arsenic sensors reported in the literature and this study.
Sensor MaterialApproachLOD (ppb)Ref.
AgNPsSurface-enhanced Raman scattering (SERS)1[22]
DNA-functionalized Fe3O4 NPsFluorescence22.5[23]
CeO2Fluorescence2.2[24]
Functional polymer Fluorescence74.9[25]
Magnetic porous carbon compositeFluorescence0.05[3]
Ruthenium bipyridine-graphene oxideElectrochemical3.2[26]
Functionalized AuNPsColorimetric2.5[27]
AuNPsColorimetric1[7]
IL-assisted AuNPsColorimetric0.18This work
Table 5. Arsenic concentrations in four real samples tested using the BMP and AuNP-assisted colorimetric method and verified using ICP-OES.
Samples[Arsenic] (ppb)
ICP-OES #Colorimetric
(This Work) *
Tap water 00
Tap + 100 ppb As(III)99.7107.9
Rainwater1.30
Rain + 100 ppb As(III)84.6105.2
Lake water27.310.8
Lake + 100 ppb As(III)98.5112.5
MetalProg Factory Effluent28.514.5
Effluent + 100 ppb As(III)90.2108.6
Note: # total arsenic concentration, * [arsenite] only.
Disclaimer/Publisher’s Note: The statements, opinions and data contained in all publications are solely those of the individual author(s) and contributor(s) and not of MDPI and/or the editor(s). MDPI and/or the editor(s) disclaim responsibility for any injury to people or property resulting from any ideas, methods, instructions or products referred to in the content.

