Article

Combining Impedance Spectroscopy and Information Visualization Methods to Optimize the Detection of Carbendazim Using Layer-by-Layer Films

by
Leonardo Negri Furini
1,*,
José Diego Fernandes
2,
Douglas Henrique Vieira
2,
Luis Fernando do Carmo Morato
2,
Neri Alves
2 and
Carlos José Leopoldo Constantino
2
1
Department of Physics, Federal University of Santa Catarina (UFSC), Florianópolis 88040-001, SC, Brazil
2
Physics Department, Faculty of Science and Technology (FCT), São Paulo State University (UNESP), Presidente Prudente 19060-900, SP, Brazil
*
Author to whom correspondence should be addressed.
Chemosensors 2023, 11(4), 213; https://doi.org/10.3390/chemosensors11040213
Submission received: 16 February 2023 / Revised: 15 March 2023 / Accepted: 17 March 2023 / Published: 29 March 2023
(This article belongs to the Special Issue Developments on Supramolecular Thin Films to Sensing Applications)

Abstract

:
Usually, electronic tongues (e-tongue) do not require specific interactions to discriminate aqueous solutions. Among the several factors which determine the electrical properties of sensing units, the interactions between liquids and interfaces have a crucial role. Here, we explore the interaction between dioctadecyldimethylammonium bromide (DODAB) lipid and carbendazim (MBC) pesticide in an e-tongue to discriminate different MBC concentrations in aqueous solutions. The sensing units were fabricated of gold interdigitated electrodes (IDEs) coated with layer-by-layer (LbL) films of DODAB and nickel tetrasulfonated phthalocyanine (NiTsPc), perylene and 1,2-dipalmitoyl-sn-glycero-3-phospho-(1′-rac-glycerol) (DPPG), namely (DODAB/NiTsPc)5 and (Perylene/DPPG)5, respectively. Besides, a bare electrode also constituted the e-tongue to distinguish MBC concentrations from 1.0 × 10⁻⁷ up to 1.0 × 10⁻¹⁰ mol L−1, by impedance spectroscopy. In addition, the experiment was optimized using two IDE geometries. The LbL films were manually fabricated obtaining linear growth monitored via UV-Vis absorption spectroscopy. Optical images associated with chemical mapping reveals the presence of small aggregates in the DODAB/NiTsPc LbL film surface. Although the e-tongue was able to discriminate all MBC concentrations by means of the interactive document map (IDMAP), only the sensing unit covered with DODAB/NiTsPc LbL film presented a satisfactory response. According to the equivalent circuit, the main contribution arises from the bulk and film surface due to the interaction between DODAB and MBC, indicating THE sensitivity of the sensing unit. Finally, the adsorption of MBC molecules onto the film surface induced an irreversible process, although there are some frequencies at which the sensing unit response seems to be reversible, as shown by parallel coordinates.

1. Introduction

Recent progress in the field of detectors has shown that sensors produced with thin films are capable of highly distinguishing various analytes, including pesticides, whose monitoring is important for public health [1]. Pesticides are commonly applied on a large scale in agriculture for pest control, leading to bioaccumulation. Among these pesticides, we highlight carbendazim (MBC), a broad-spectrum fungicide applied in several crops. Its persistence in water sources due to difficulties in degradation poses a potential risk to the environment and human health [2,3]. According to the 2016 European Union report on pesticide residues in food [4], carbendazim residues can be found in a large variety of samples, which require specific methodologies to detect them in a matrix. For instance, detection strategies for carbendazim have been developed for kale, orange juice [5], apples, and tomatoes [6], as well as for wine samples [7].
The detection of MBC can be performed using several techniques, such as voltammetry [8], colorimetric [9], impedimetric [10], SERS [11], and other sensors. Since its first publication in 1985, the electronic tongue (e-tongue) system for liquid analysis has been improved and applied in complex systems [12,13]. Typically, electrochemical methods were applied in e-tongues, such as in the evaluation of cross-sensitivity of chemical sensors [14]. However, the use of impedance spectroscopy has opened new window of applications [15]. It is common to fabricate e-tongues using interdigitated electrodes (IDEs) covered by nanostructured thin films to perform impedance spectroscopy measurements because IDEs have a high aspect ratio. Gold is widely used for IDEs due to its inert nature and strong affinity for specific sets of molecules [16]. Thin films can be deposited by several techniques, such as Langmuir–Blodgett (LB), layer-by-layer (LbL), and physical vapor deposition (PVD). The versatility of these techniques allows the growth of films from a wide variety of materials, such as conductive polymers, pigments, dyes, biomolecules, and hybrid compounds. It is also possible to immobilize enzymes [17] and antigens [18] to act as biosensors, which have specificity and high sensitivity. In terms of pesticide detection, an e-tongue composed of reduced graphene oxide (rGO) and rGO-based nanocomposites was applied to detect malathion and cadusafos, both organophosphate pesticides [19]. In general, e-tongues do not require a specific interaction between the analyte and sensing units. However, Chen et al. [20] have demonstrated the need for a specific interaction to detect dithiocarbamate pesticides, using cetyltrimethylammonium bromide (CTAB)-encapsulated fluorescent copper nanoclusters.
In addition to its use in e-tongues, impedance spectroscopy is a powerful tool for investigating electrical properties and providing information about a material electrical conductivity and dielectric constant [21]. The impedance spectrum also allows for the separation of the contributions of different phenomena, such as bulk effects from interfacial and surface effects [22]. It can even identify transport properties, such as the diffusion and migration of ions [23], and represent them as elements in a phenomenological equivalent circuit. Impedance can also determine whether the sensing mechanism is reversible or results in permanent changes. Sensors based on electrochemical response have drawn attention due to advantages, such as high stability, sensitivity, and selectivity [24], and electrical analysis is a cheap and miniaturizable way to perform detection.
Information visualization methods allow for the visual inspection of large amounts of data, making them a useful tool for distinguishing between analyte variations even when the data is very similar. Information visualization methods have been used frequently in the analysis of e-tongues [25]. The statistical method most commonly used for this purpose is principal component analysis, which applies linear statistical dimension reduction [26]. However, methods that involve dimension reductions through nonlinear relationships have been shown to be more efficient for biosensors [27]. Among these methods, the interactive document map (IDMAP) generates a graph containing several marks representing the measurements. The distance between the marks is a function of the difference between the measurements, with closer marks indicating greater similarity between the measurements.
Here, layer-by-layer (LbL) films of dioctadecyldimethylammonium bromide (DODAB) and nickel tetrasulfonated phthalocyanine (NiTsPc), perylene and 1,2-dipalmitoyl-sn-glycero-3-phospho-(1′-rac-glycerol) (DPPG), namely (DODAB/NiTsPc)5 and (Perylene/DPPG)5 were fabricated and used as sensing units to detect MBC concentrations an e-tongue using impedance spectroscopy. The growth of the films was monitored by UV-Vis absorption spectroscopy, and the morphology was studied using optical images and atomic force microscopy (AFM). IDMAP was applied as a data projection technique to discriminate the MBC concentrations in the e-tongue. Additionally, the electrical properties of the DODAB/NiTsPc sensing unit were studied using equivalent circuit analysis and ac conductivity spectroscopy to relate the detection phenomena to the respective processes that occur in the bulk and at the interface of the sensing units.

2. Materials and Methods
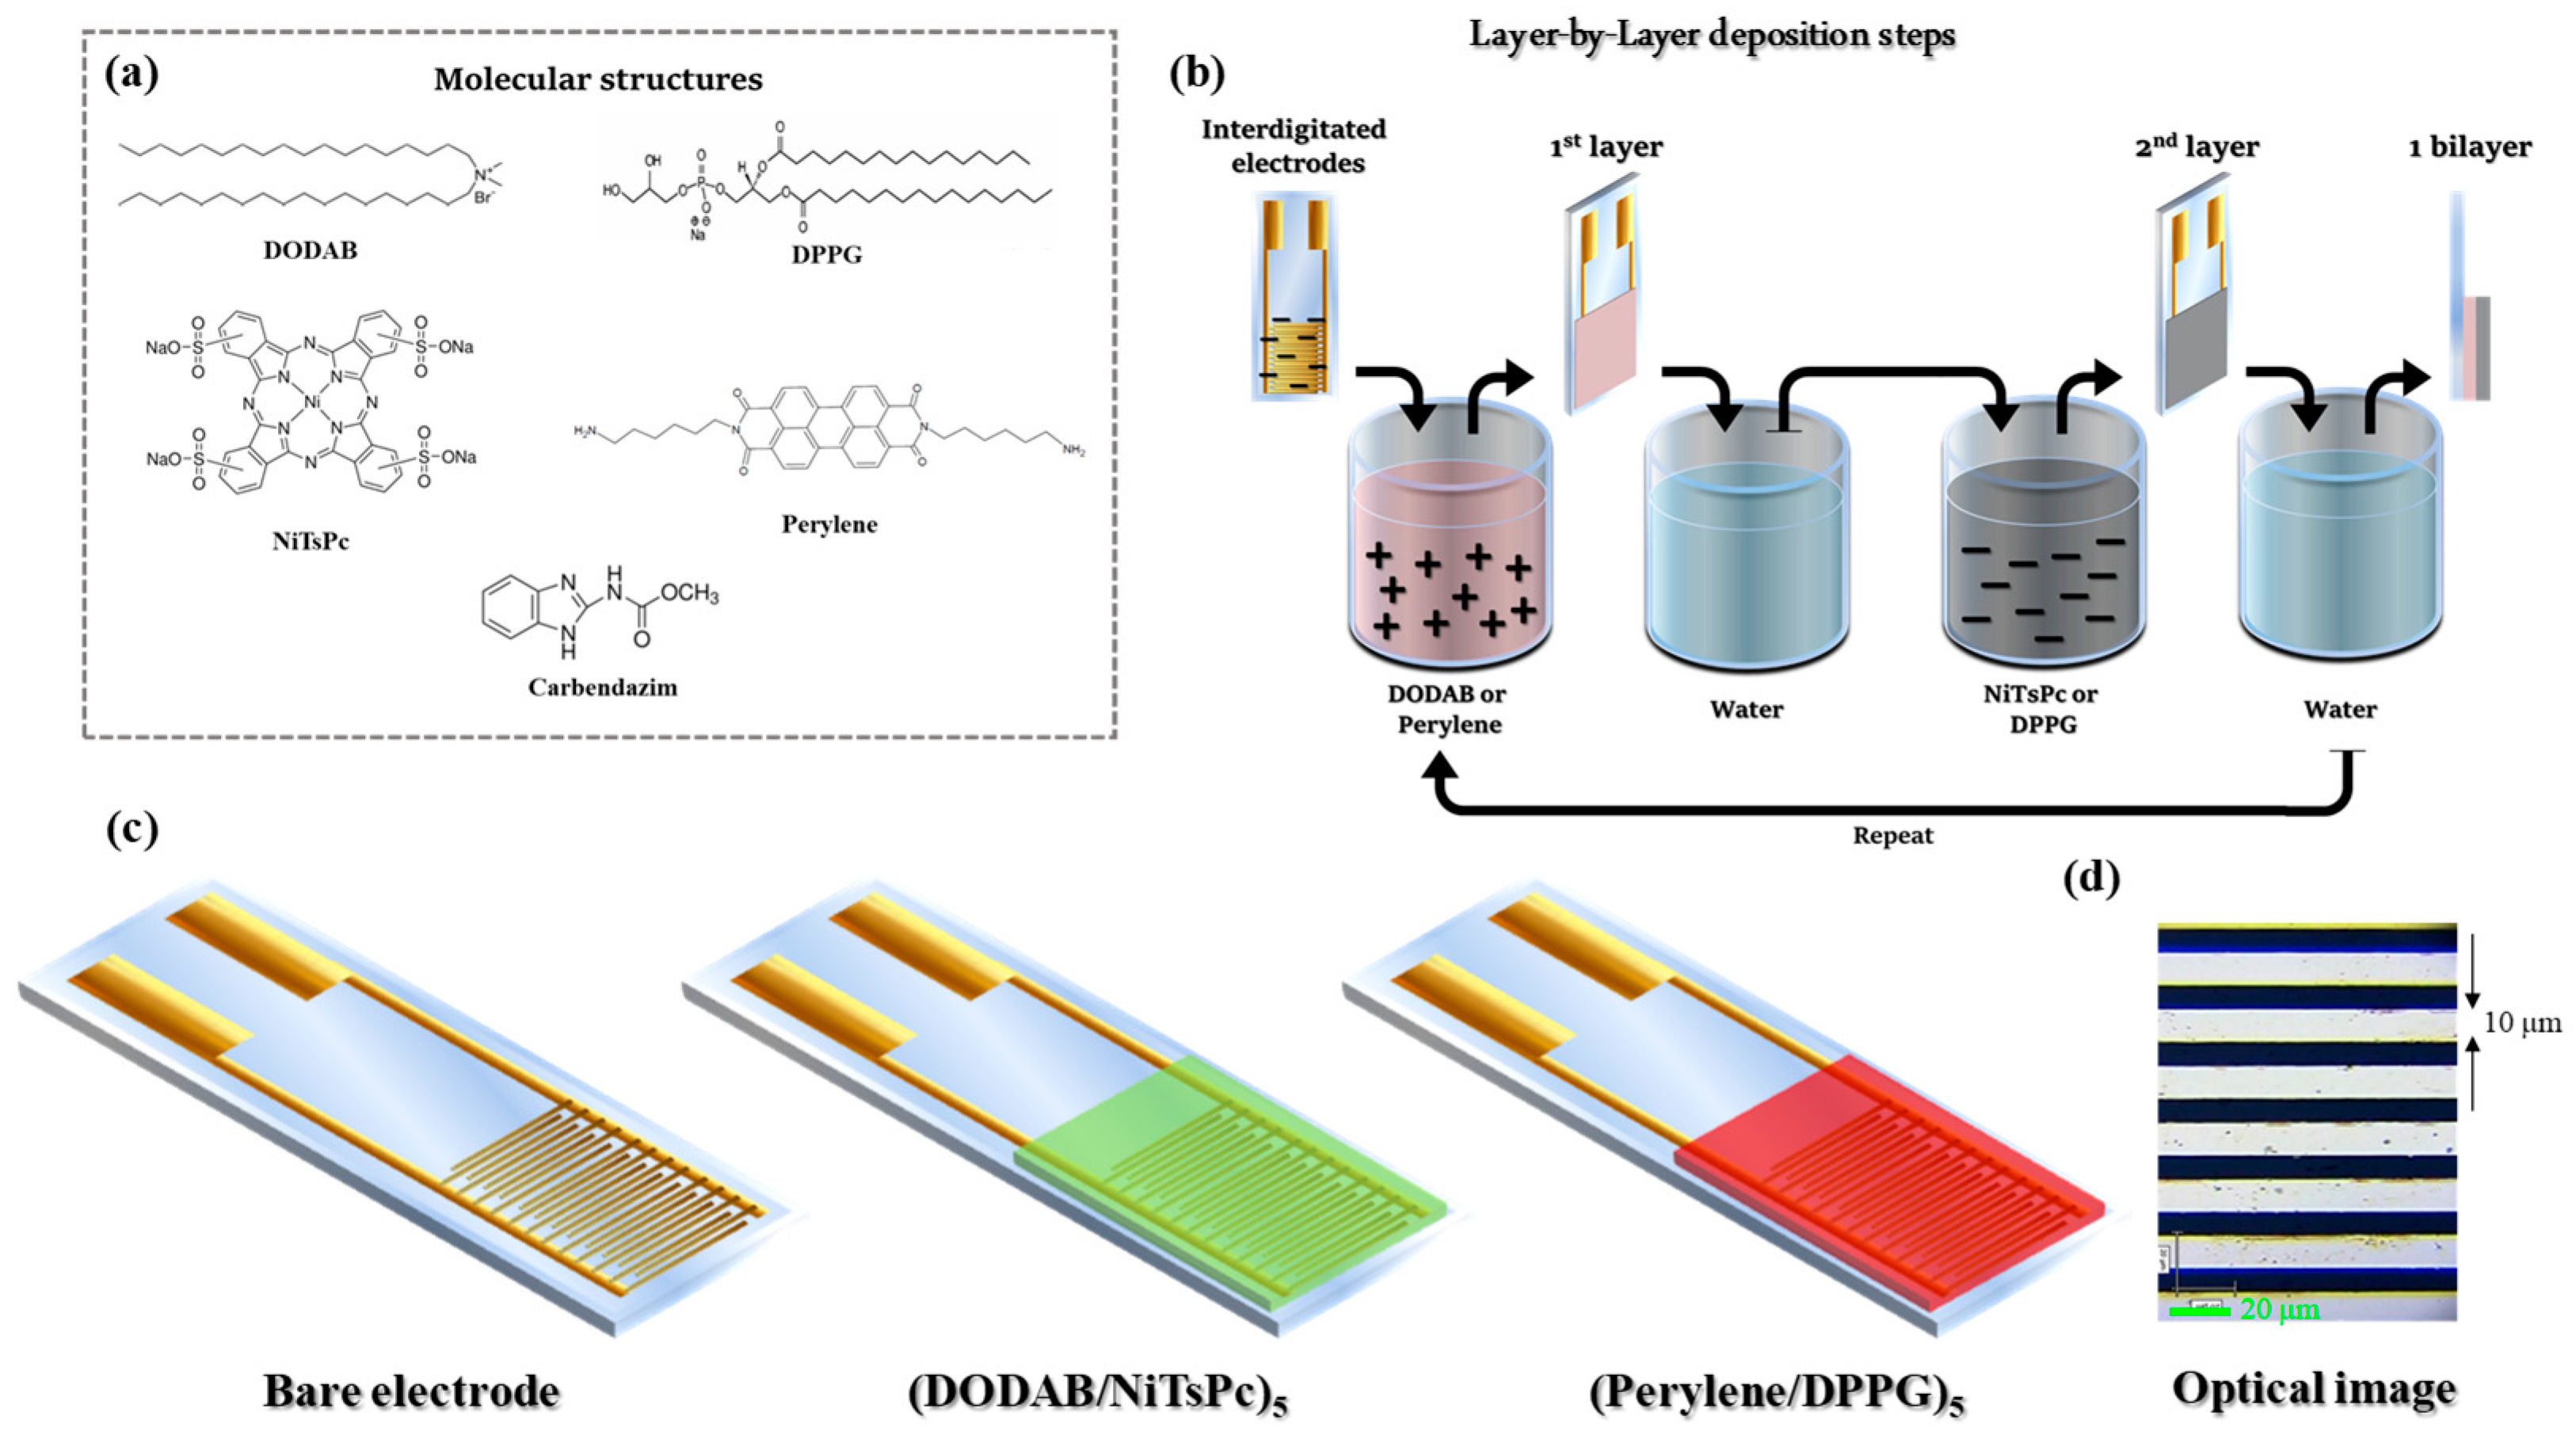
DODAB (MW 630.95 g mol−1) was purchased from Fluka and the phospholipid 1,2-Dipalmitoyl-sn-glycero-3-phospho-rac-(1-glycerol) (DPPG, MW734.04 g mol−1) was acquired from Avanti Polar Lipids. NiTsPc (MW 979.40 g mol−1), MBC (MW 191.19 g mol−1), polyallylamine hydrochloride (PAH, average MW 50,000 g mol−1), and poly(sodium 4-styrenesulfonate) (PSS, average MW 70,000 g mol−1) were purchased from Sigma-Aldrich and the perylene was synthesized. All the molecular structures are given in Figure 1a. Ultrapure water was provided from Milli-Q system (pH 5.6 and resistivity of 18.2 MΩ cm). Interdigitated electrodes (IDEs) of gold were fabricated by photolithography onto glass substrates using 20 nm of chrome as adhesive layer. The experiments were carried out using two IDEs geometries: 60 digits, width 40 μm, height 100 nm, spaced 40 μm each other (IDE 40), and another IDEs with 100 digits, width 10 μm, height 100 nm, and spaced 10 μm each other (IDE 10).

2.1. LbL Films

DODAB and DPPG dispersions (1.0 × 10⁻³ mol L−1) were prepared dissolving the lipids in ultrapure water under heating at 60 °C for complete solubilization. The NiTsPc was dissolved in water at 5.0 × 10⁻² mol L−1 and pH 5.6, and the perylene solution (2.0 × 10⁻⁴ g mL−1) was obtained at pH 2 filtering to retail the solid material. Aqueous solutions of PAH and PSS were prepared at 1.0 mg mL−1.
DODAB/NiTSPc LbL films were manually grownby immersing the substratein alternating DODAB (cationic) and NiTsPc (anionic) solutions. The first bilayer, denoted by (DODAB/NiTsPC)1, was fabricated as follow: the substrate was immersed in DODAB dispersion for 3 min, then immersed in ultrapure water to remove the excess of material. Subsequently, the substrate was immersed in NiTsPc solution for 3 min and immersed in ultrapure water to remove the excess of material. This process was repeated five times, i.e., five bilayers were stacked to form the active layer film, giving (DODAB/NiTsPC)5. Perylene/DPPG LbL films were growth similarly, with perylene being the cationic solution and DPPG the anionic solution, with the active layer denoted by (Perylene/DPPG)5. The LbL films fabrication steps are illustrated in Figure 1b. It is important to mention, in the case of (DODAB/NiTsPC)5, LbL film was added a last layer of DODAB.
Priorto the LbL film fabrication, an adhesive layer was deposited over the IDEs to minimize the substrate effect and material loss [28]. For this purpose, three surface treatment approaches were conducted using LbL films: one bilayer of PAH/PSS denoted by (PAH/PSS)1, two bilayers of PAH/PSS—(PAH/PSS)2 and one bilayer of PAH/NiTsPc—(PAH/NiTsPc)1 followed by five bilayers of DODAB/NiTsPc-(DODAB/NiTsPc)5. The LbL films composed of (PAH/PSS)1 + (DODAB/NiTsPc)5, (PAH/PSS)2 + (DODAB/NiTsPc)5 and (PAH/NiTsPc)1 + (DODAB/NiTsPc)5 were immersed in ultrapure water and their absorbances were monitored versus the immersion time, as shown in Figure S1. Moreover, a LbL film of (DODAB/NiTsPc)5 without the adhesive layer is presented for comparison. All films present an initial material loss in a few minutes after immersion in ultrapure water, stabilizing at ca. 30 min. The LbL film without the adhesive layer presented the higher material loss, around 48.2%, followed by the LbL film of (PAH/NiTsPc)1 + (DODAB/NiTsPc)5 with 5.4%, (PAH/PSS)2 + (DODAB/NiTsPc)5 with 4.1% and (PAH/PSS)1 + (DODAB/NiTsPc)5 with 3.7% (Figure S1). Thus, the sensing units (DODAB/NiTsPc) and (Perylene/DPPG) were fabricated covering the IDEs with (PAH/PSS)1 to minimize the material loss, although it will be omitted in the nomenclature.

2.2. E-Tongue

The sensing unit consists of gold IDEs covered by a LbL film, as represented in Figure 1c. Optical image of the IDE 10 is available in Figure 1d. The e-tongue was composed of three sensing units, (DODAB/NiTsPc)5, (Perylene/DPPG)5 and a bare electrode. This system was applied to detect MBC dissolved in water at concentrations 1.0 × 10⁻⁷, 1.0 × 10⁻⁸, 1.0 × 10⁻⁹ and 1.0 × 10⁻¹⁰ mol L−1, by impedance spectroscopy. The measurements were performed from the lower to higher concentration adding aliquots of MBC to the same solution. Moreover, measurements were recorded in ultrapure water (without MBC) at the beginning and at the end of experiments, called initial and final water, respectively. The capacitance curves were obtained applying Vac = 50 mV in the frequency range from 1 to 106 Hz and Vdc = 0 V. Prior to measurements with MBC, 3 of 10 bare IDEs were selected to compose the electronic tongue. The criterion of choice was the similarity of their electrical properties when measured in ultrapure water. This procedure guarantees the similarities among the electrodes in terms of geometry and electrical response. Figure S2 shows the capacitance curves of the sensing units (bare IDEs, and IDEs + LbL films) in ultrapure water for IDE 40 and IDE 10. After the deposition of LbL films (DODAB/NiTsPc or Perylene/DPPG), there is a slight change in the capacitance. As the selected electrodes had a similar electrical response, the change can be exclusively assigned to the presence of the LbL films, discarding differences from the fabrication process.

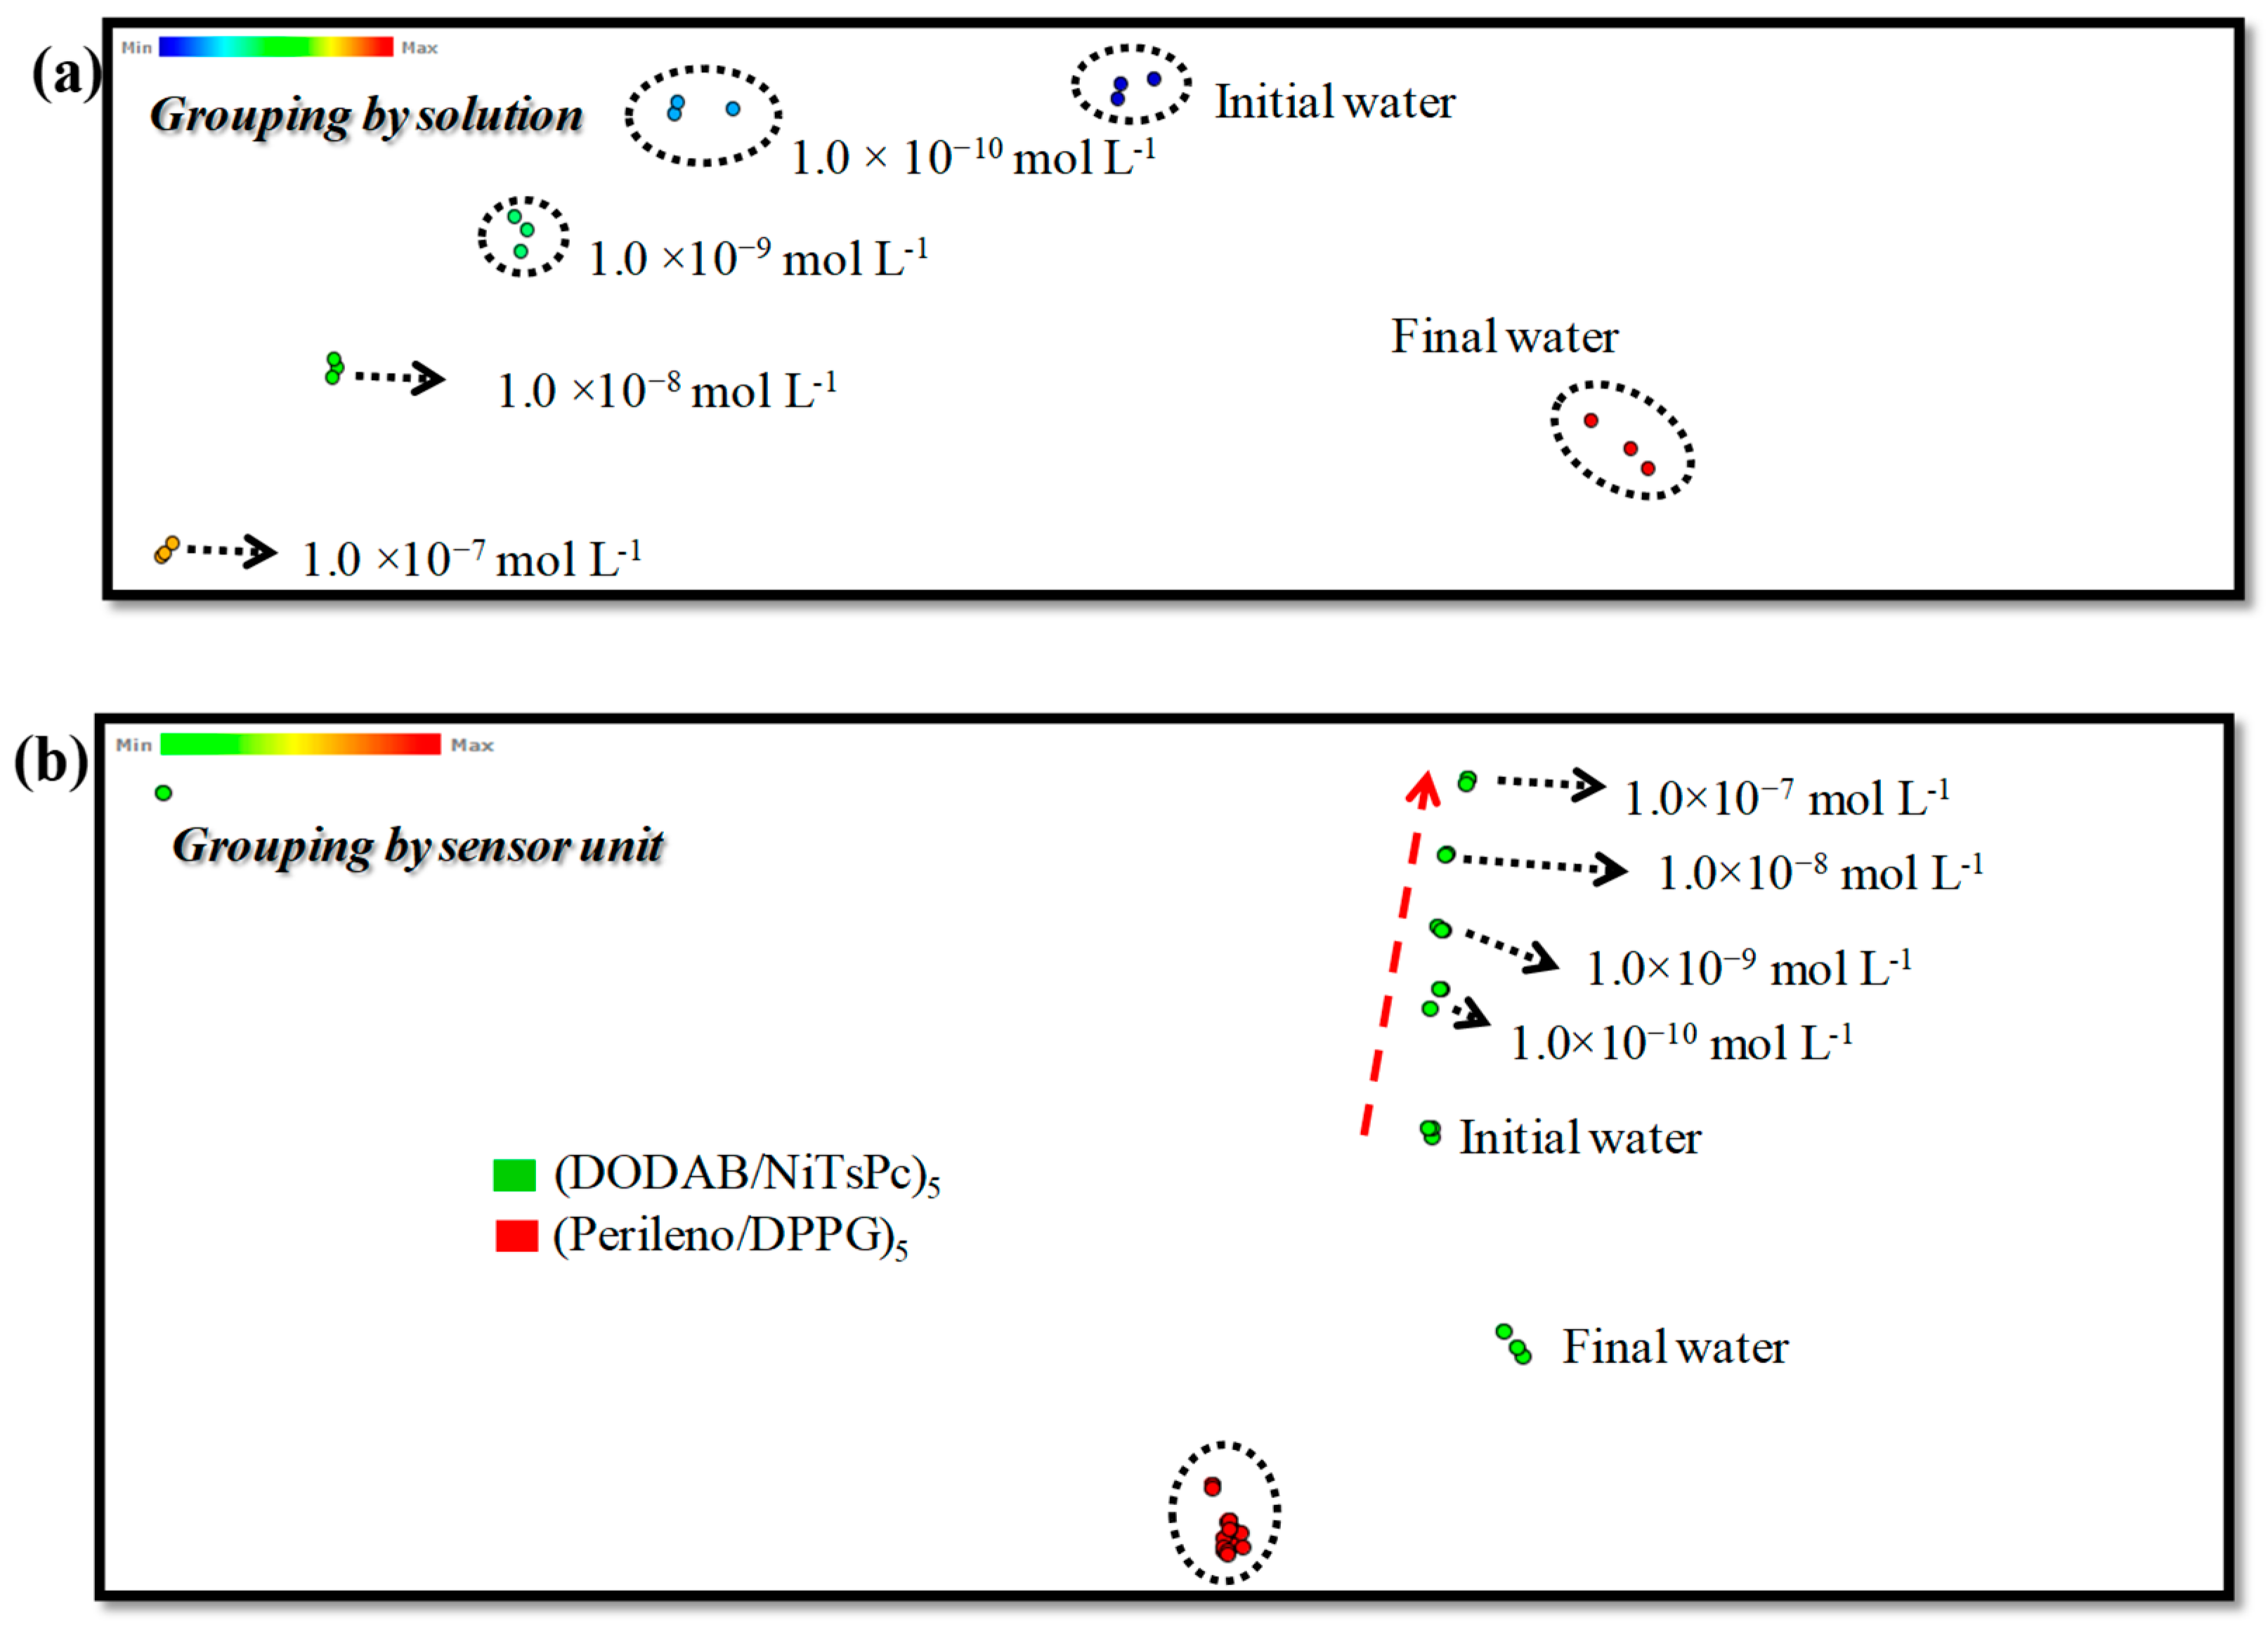
2.3. Information Visualization Methods

A nonlinear technique of projection IDMAP was employed to analyze the capacitance data obtained for the sensing units. More details can be accessed in [27]. Basically, the technique converts the data in a marker and displays it on a two-dimensional map, assigning a Euclidian distance between the markers. The smaller the Euclidean distance, the more similar the response of one marker in relation to the other. The error function minimized in IDMAP (SIDMAP) is represented by equation [29]:
S I D M A P = δ x i , x j δ m i n δ m a x δ m i n d ( y i , y j )
where δ(xi, xj) is the dissimilarity function, δmin is the minimum distance and δmax is the maximum distance, between points for the projected map. IDMAP were obtained using Projection Explorer (PEx) software, version 1.6.3 [30] and raw data.

2.4. Instrumentation

UV-Vis absorption spectra were obtained in a UV-Vis spectrophotometer Varian, model Cary 50. Raman spectra was performed in a micro-Raman spectrograph Renishaw, model in-Via, equipped with 633 laser line, diffraction grating with 1800 groves mm−1. Chemical mapping was built collecting one spectrum every 1 μm in a line of 100 μm. Optical images were obtained using a Leica microscope, coupled to a Raman spectrograph, under 50× objective lens. Atomic force microscopy (AFM) topography was carried out in a Nanosurf, EasyScan 2 Flex AFM model, using TAP150 Al-G tips in tapping mode. The data were processed in the WSxM v4.0 software package. The electrical measurements were carried out using a Solartron impedance analyzer, model 1260A, with a 1296 dielectric interface system, and the impedance data werefitted using the ZView 2.0 software.

3. Results and Discussion

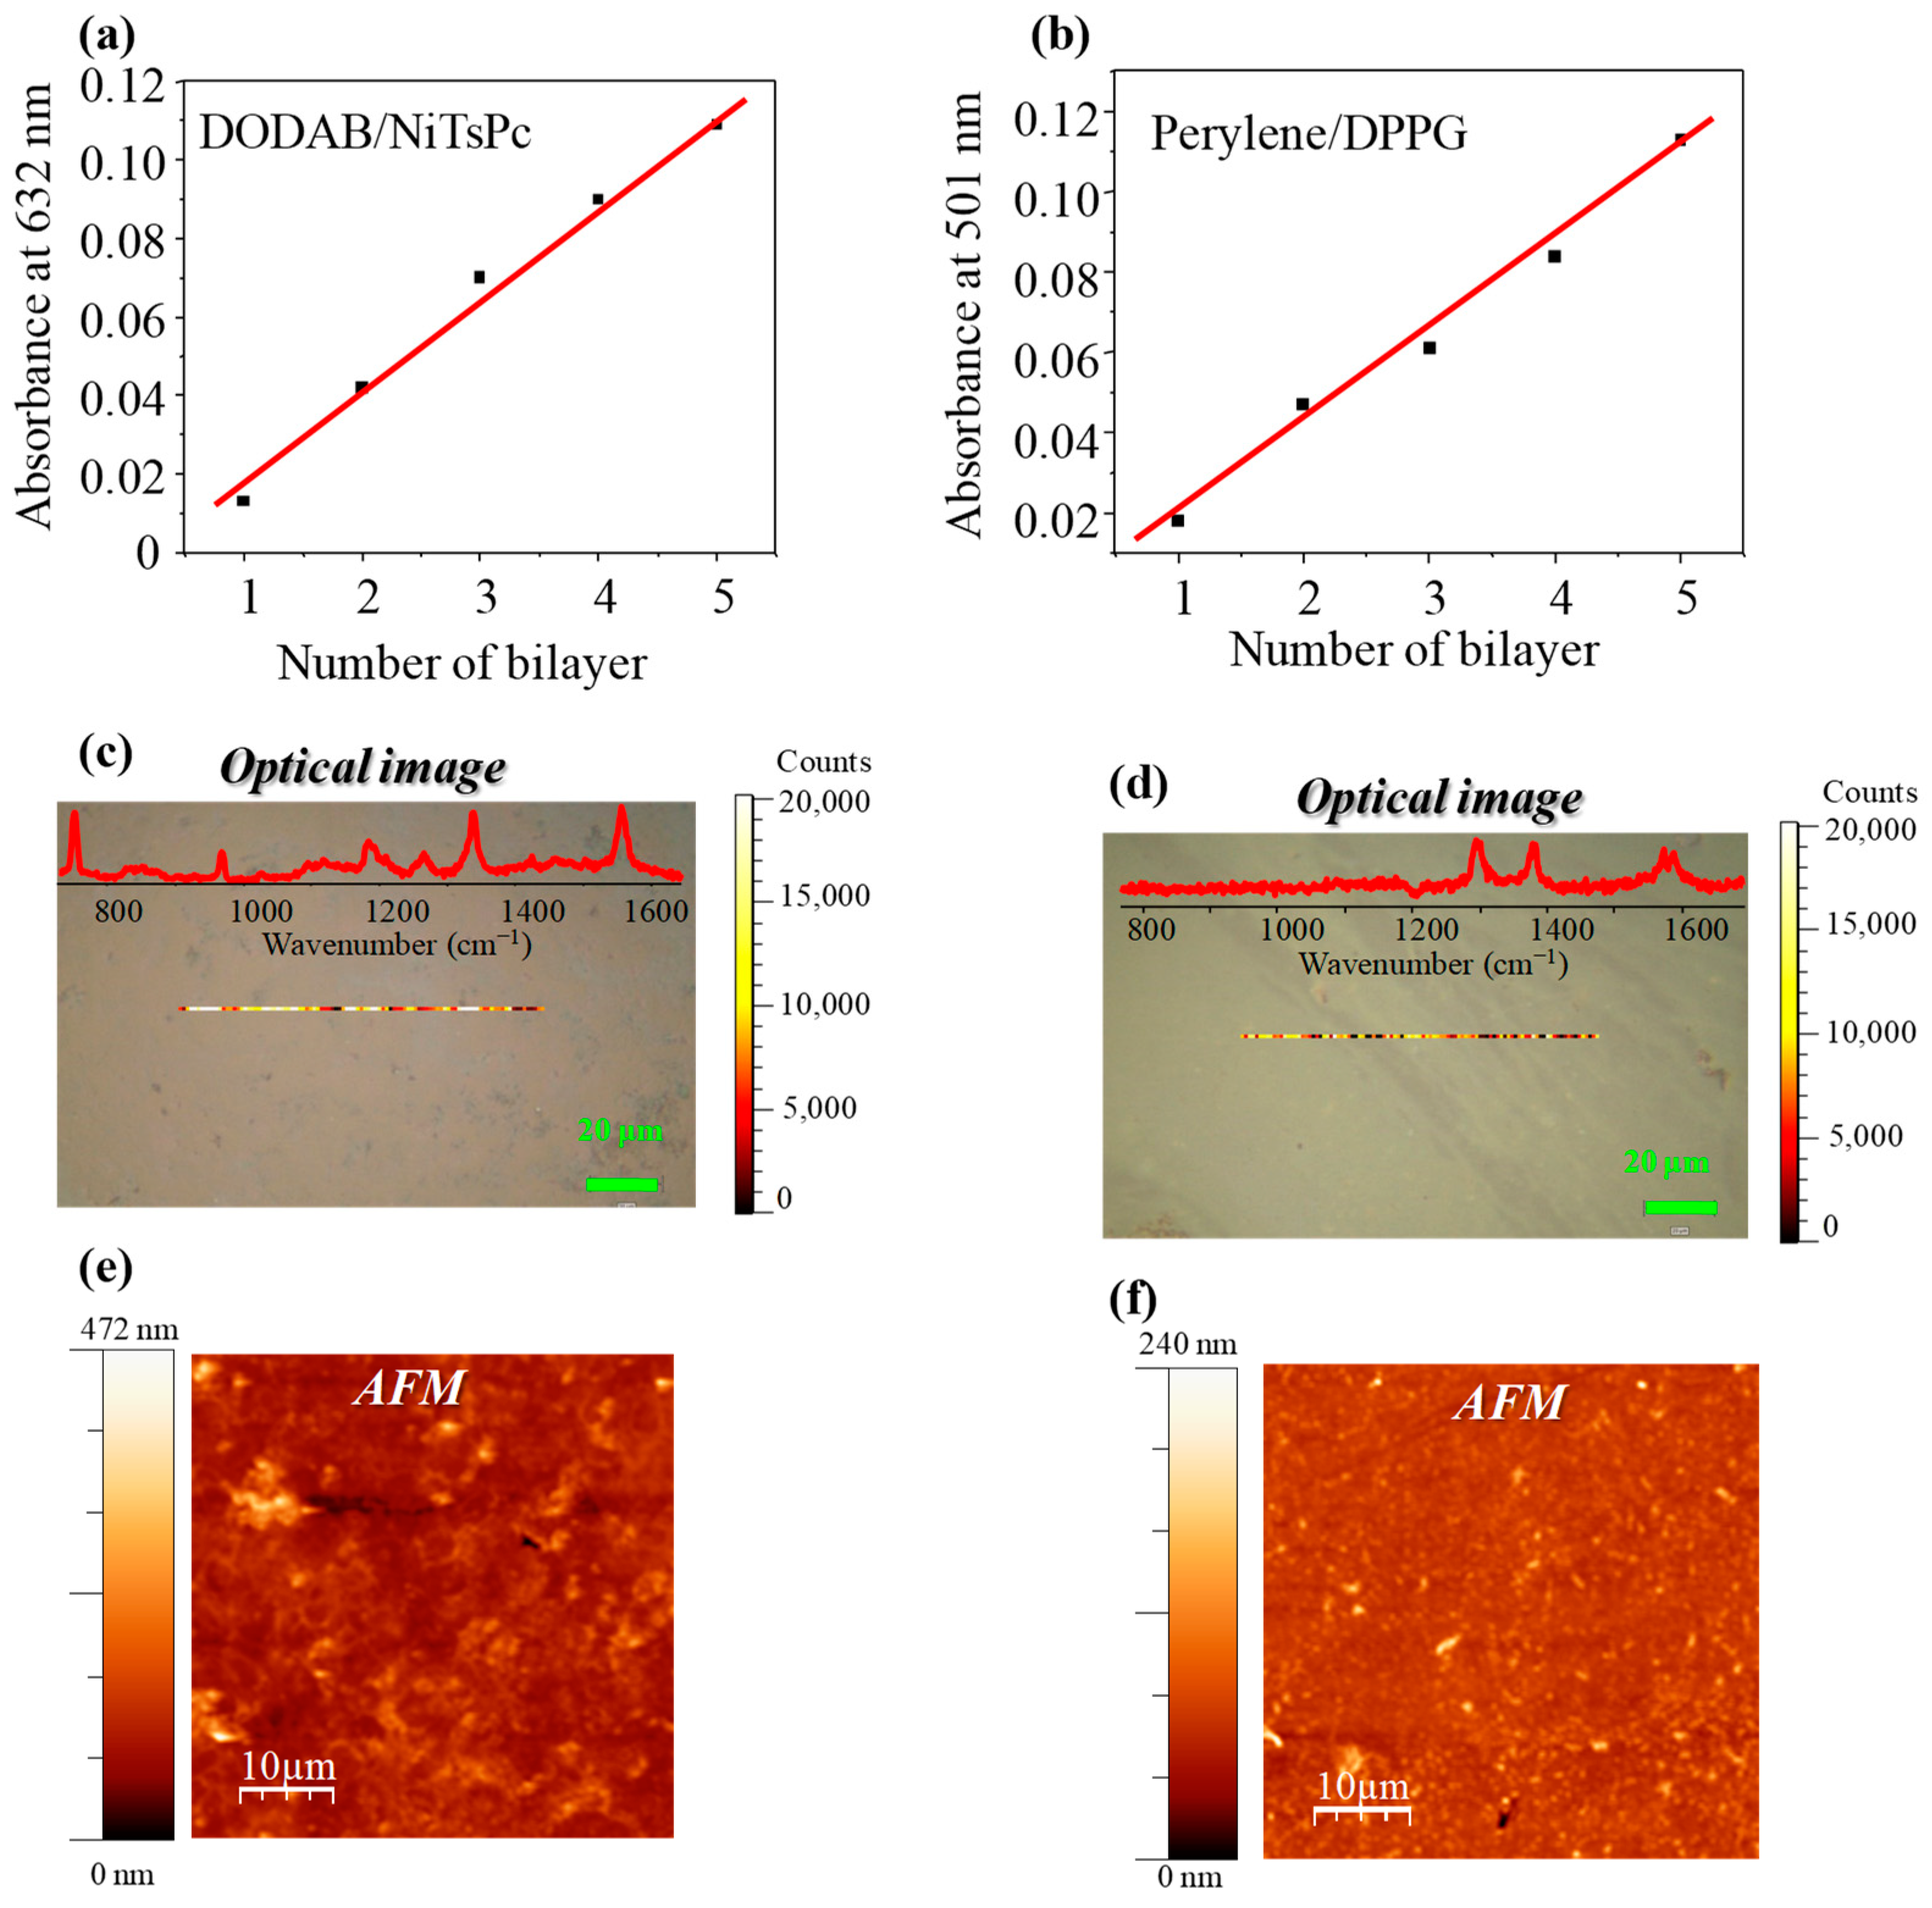
3.1. Fabrication and Characterization of the LbL Films

The LbL film growth was monitored by UV-Vis absorption spectroscopy, collecting one spectrum every each bilayer on glass substrate. The absorbance versus number of bilayer for the DODAB/NiTsPcLbL film is shown in Figure 2a and for the Perylene/DPPG LbL film in Figure 2b, the wavelength was fixed at 632 and 501 nm, respectively. In both films, the growth was linear, revealing the homogeneity in the film fabrication process, with the same amount of material being deposited in each step. In general, this behavior is reported for other LbL films [31], and therefore this technique allows controlling the film thickness. Moreover, it is noteworthy the importance of the number of bilayers and, as consequence, the film thickness in sensing applications. For instance, Ferreira et al. [32] compared sensing units covered with two methodologies to fabricate thin films, such as cast film (thickness~1 μm) and 11 layers of LB films (total thickness of ~11 nm). Their findings show that ultrathin films provide a lower dispersion and better distinction of the data. In the same way, Volpati et al. [25] demonstrated that thicker films (within nanometer scale) tend to have worse response to lower concentrations (<10 μM). In their study, sensing units covered with perylene derivative were fabricated via the LB technique (1 layer) and by PVD with film thickness of 5, 10, 15, 20, 30, 40, and 120 nm. The pioneering work of our group in assembling LbL films of phospholipids, which is the approach applied here, was highlighted by Aoki et al. [33], working with LbL and LB films of phospholipids. Moreover, the versatility of LbL technique allowing several film architectures was pointed out by Aoki et al. [34] when they demonstrated the importance of a suitable medium for immobilizing enzymes in biosensors.
The morphological characterization of the LbL films was performed at micro and nanoscale by means optical microscopy and AFM, respectively. The optical image of DODAB/NiTsPc films (Figure 2c) on glass substrate shows the presence of small aggregates at the film surface. This latter is also present in the NiTsPc solution (molecular aggregates) and they are transferred to the substrate in the fabrication process, forming morphological aggregates, as previously reported by our group for LbL films of DODAB/NiTsPc [35]. In fact, the UV-Vis spectra of NiTsPc solution presents the Q band at the 550–750 nm range, which splits in two maxima at 630 and 668 nm in DODAB/NiTsPc LbL film (Figure S3). The first one is assigned to the presence of aggregates and the latter to the monomers [36]. The aggregates present in DODAB/NiTsPc LbL film are smaller than those reported in [35] and can be related to the number of deposited bilayers. In this work, it was only five bilayers, while in [32] it was 21 bilayers. In the chemical mapping (line with color scale at center of optical image), the intensity of the peak at 1556 cm−1, assigned to C = N stretching of NiTsPc molecules, was monitored. DODAB does not present a peak at this range (results not shown). The brightest spots represent higher Raman intensities. The Raman spectrum of DODAB/NiTsPc LbL film is given on the inset in Figure 2c. A large variation on the Raman intensity was observed, which is related to the presence of the amount of NiTsPc aggregates, in agreement with the optical images. On the other hand, the optical image of the Perylene/DPPG LbL film (Figure 2d) on glass substrate does not present morphological aggregates. However, a variation in the Raman intensity was observed in the chemical mapping. This latter was performed monitoring the peak at 1295 cm−1 in the Raman spectrum of Perylene/DPPG LbL film (inset of Figure 2d). Perylene also presents molecular aggregation in solution [37], which can be transferred to substrate in the LbL film fabrication. However, in this case, these aggregates are small and observed at nanoscale, as discussed below.
Figure 2e,f show the AFM topographical scan obtained in tapping mode for DODAB/NiTsPc and Perylene/DPPG films on glass substrate, respectively. Both systems present non-flat surface with irregularities. While for the DODAB/NiTsPc LbL film the image seems diffuse, for Perylene/DPPG, small morphological aggregates are observed. The latter is in agreement with the chemical mapping indicating the presence of small aggregates. The root mean square (RMS) roughness, which takes into account the standard deviation of the height distribution, of the DODAB/NiTsPc LbL film was around 23.4 nm and that of the Perylene/DPPG LbL film was around 8 nm, while the RMS roughness of glass substrate was 0,6 nm. The greater RMS roughness can be related to the presence of micelles/structures of DODAB, besides the NiTsPc aggregates transferred to film. We estimated, from the reference [31] (LbL films of NiTsPc and PAH), the film thickness of our system giving about 13 nm for five bilayers. Although the film is not thick, the surface presents some regions with great variation in height, as shown in Figure S4. Thus, all these structures favor the large RMS roughness found for DODAB/NiTsPcLbL films. The large RMS roughness is also reported in [35] and it was attributed to the presence of small structures of dioctadecyldimethylammonium bromide (DODAB) at film surface. Moreover, in the reference [31], the variation in the RMS roughness of thin films fabricated by different methodologies is reported. Dipping-LbL films (similar to those in this study) present higher RMS/thickness ratio, namely35%, which shows how the RMS can increase with thin film growth. In summary, the presence of DODAB (micelles) and NiTsPc (molecular aggregates) contributes to the roughness of the film.

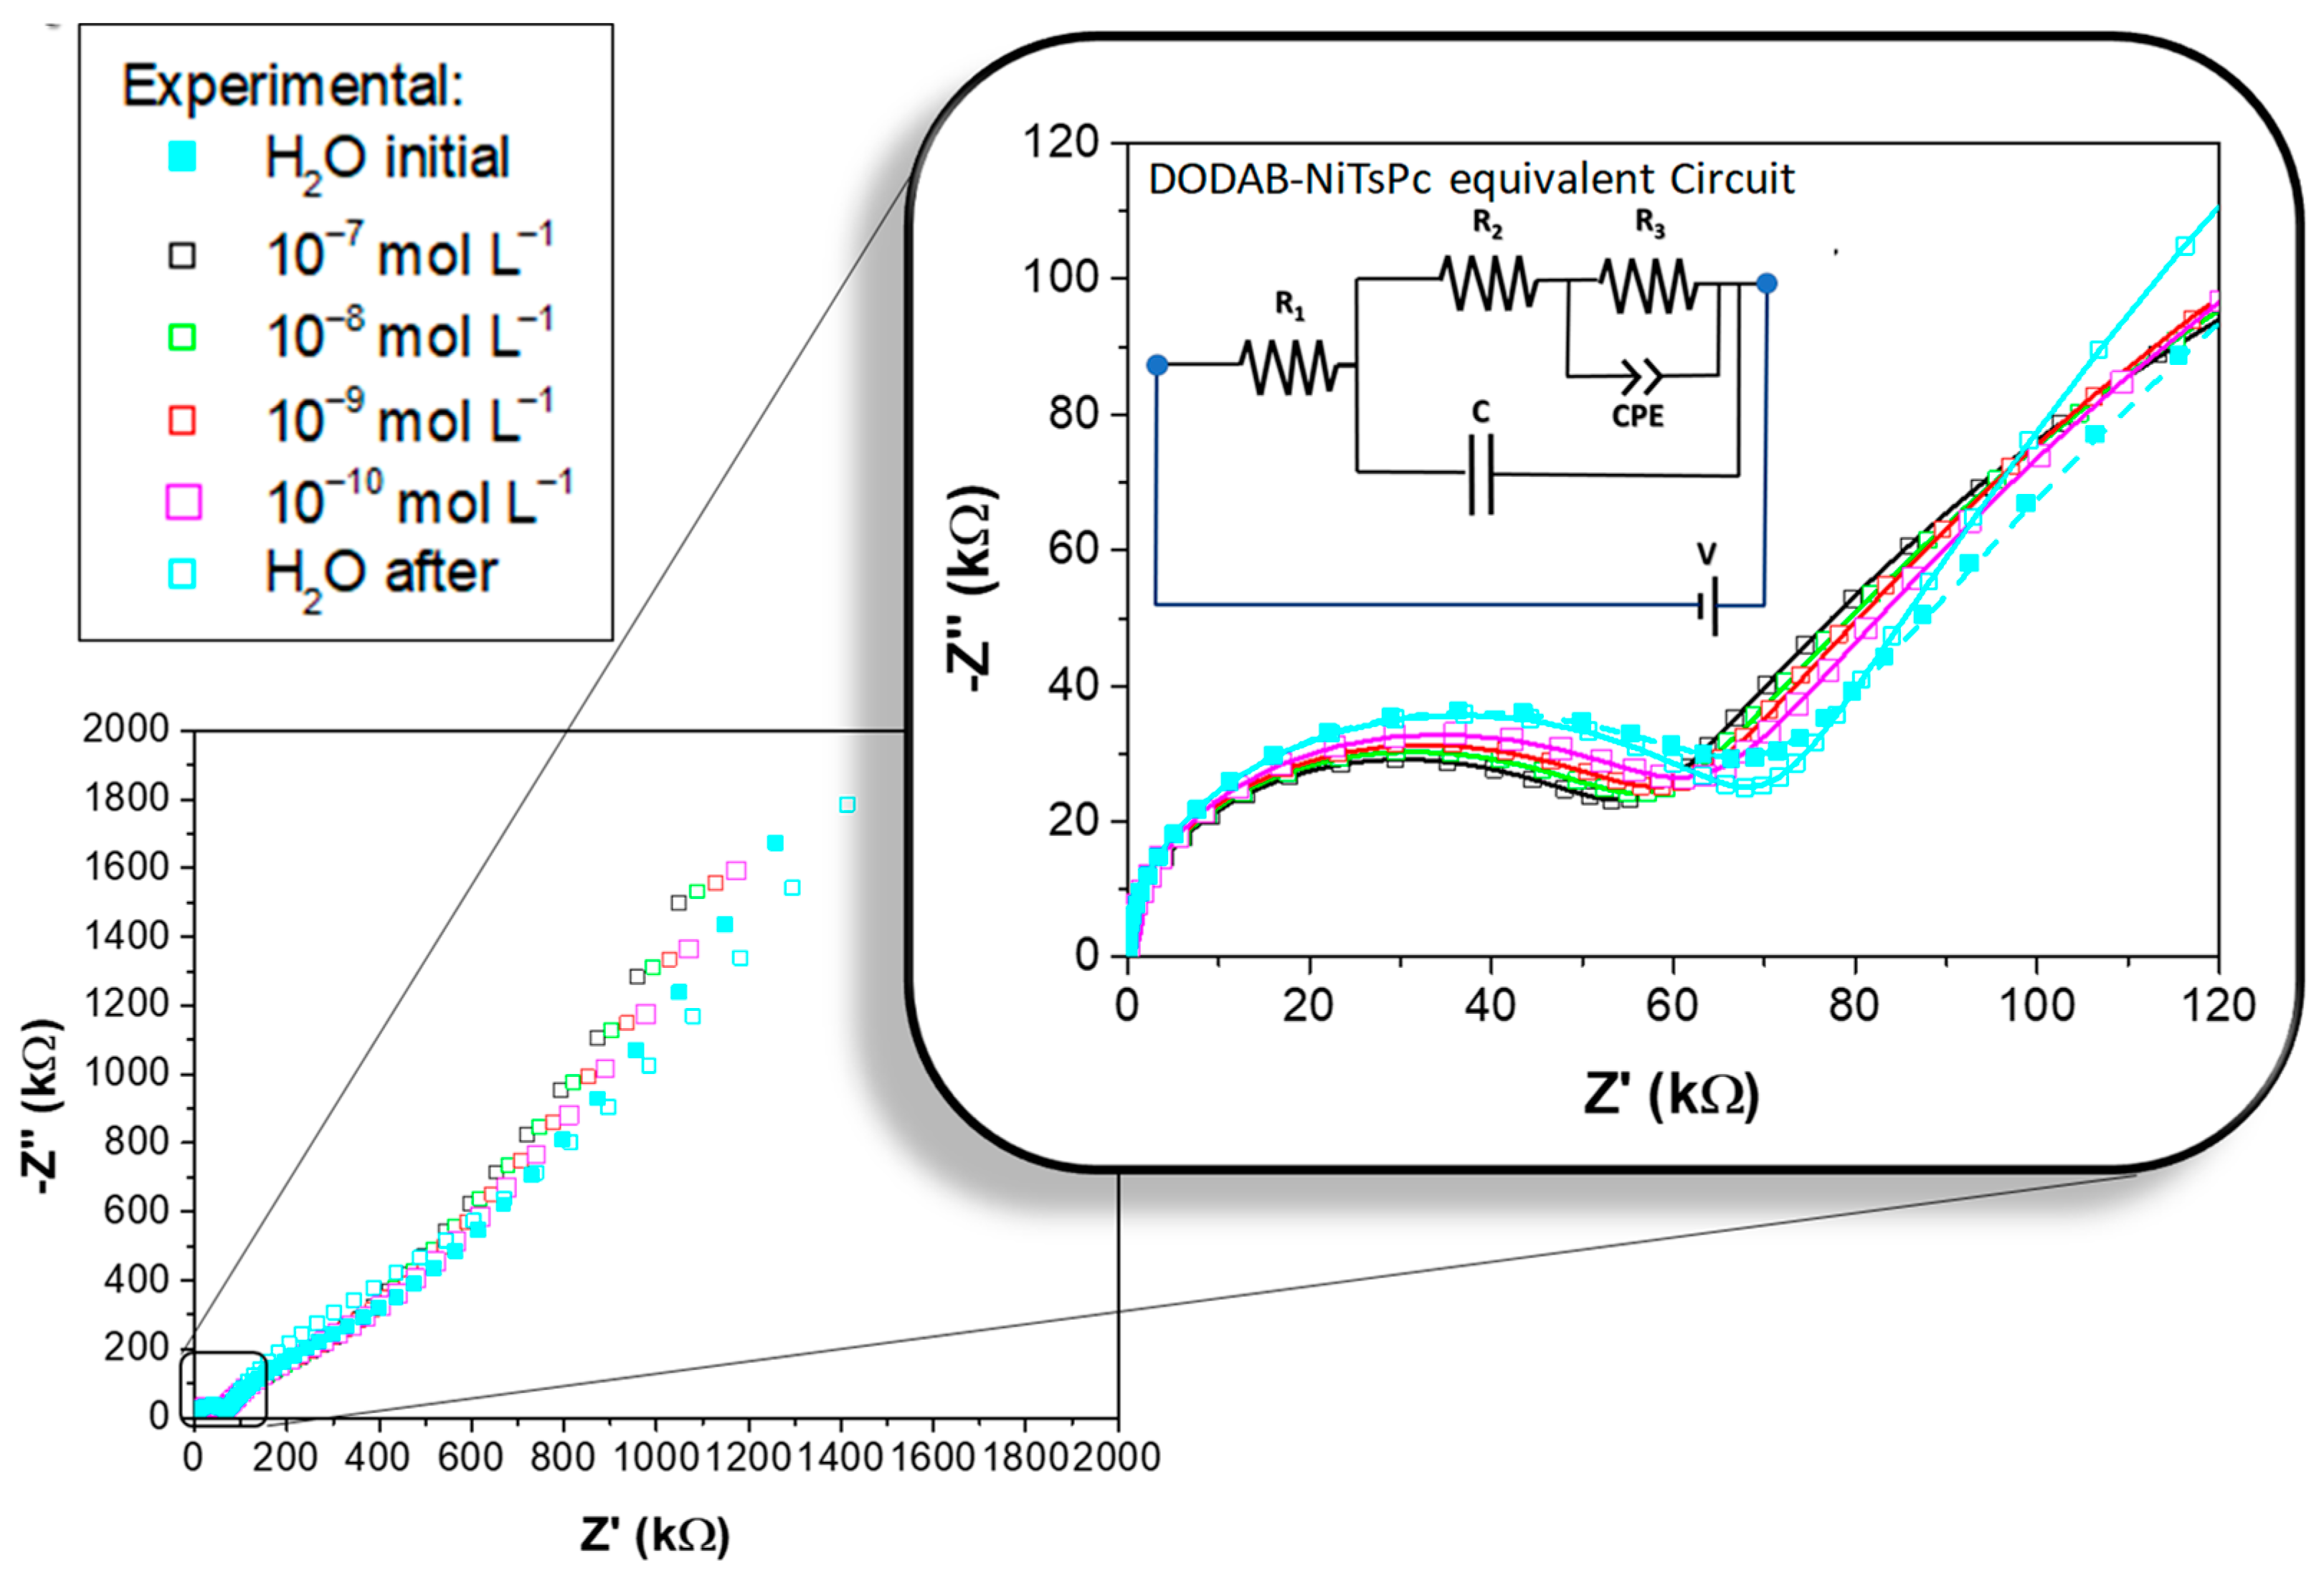
3.2. Application of the LbL Films in Sensing Units

The e-tongue, composed of the sensing units: (DODAB/NiTsPc)5, (Perylene/DPPG)5 and bare IDEs, was placed in the setup illustrated in the inset in Figure S5, i.e., it was immersed in aqueous solutions containing different MBC concentrations to carry out the capacitance measurement. Figure S5 presents the real capacitance curves of all sensing units immersed in initial and final water, and MBC concentrations (1.0 × 10⁻¹⁰, 1.0 × 10⁻⁹, 1.0 × 10⁻⁸, 1.0 × 10⁻⁷ mol L−1) for IDE 40. On visual inspection, the capacitance curves are almost superposed, presenting only small differences. Therefore, a quantitative analysis was performed using information visualization methods. Figure S6a shows IDMAP projections, grouping by solution, with all sensing units combined in a single projection. In this projection, the contribution of the capacitance of all sensing units to discriminate the MBC concentrations is taken into account, represented by a dot. Each cluster (dashed circles) represents three repetitions for each measurement, where more compact clusters mean more similar measures and the greater the Euclidean distance from one cluster to another, the better the distinction between concentrations. The e-tongue was able to distinguish almost all the MBC concentrations (1.0 × 10⁻⁷ up to 1.0 × 10⁻¹⁰ mol L−1), and initial and final water, with a superposition of concentrations at 1.0 × 10⁻⁸ and 1.0 × 10⁻⁹ mol L−1. The red arrow presents the pattern observed from lowest to highest concentration. Furthermore, more compact clusters can be observed as the concentration increases, indicating less dispersion of measures. The distance between initial and final water revels that the sensing units are affected by the presence of MBC. Thus, the addition of aliquots of MBC leads to changes in the electrical response and at least part of this change is irreversible.
The contribution of each sensing unit to discriminate the MBC concentrations is shown in Figure S6b. In this projection, it is possible to view the role of the sensing units separately. While the color represents each sensing unit, the concentrations are represented by the clusters (dashed circles). One can observe three groups corresponding to the sensing units (DODAB/NiTsPc, Perylene/DPPG and bare IDEs). In this projection, all the dots representing the MBC concentrations are mixed, allowing only to distinguish the initial and final water for each sensing unit. The individual performance of each sensing unit was not satisfactory. For instance, a simpler system was able to distinguish different concentrations of atrazine [38].
As it is well known in the literature, optimizing the relative size between the sensing layer and the electrodes in a sensor is very important in order to increase the capacitance [39]. This latter is proportional to the IDEs aspect ratio, i.e., the signal strength in a sensor can be controlled easily by changing the dimensions of the IDEs [40]. Accordingly, poor sensor performance can occur due to the choice of electrode aspect ratio. In order to improve the response, we replaced the IDEs for another configuration with width 10 μm and spacing 10 μm between each other—IDE 10, instead of 60 digits, width 40 μm, height 100 nm, spaced 40 μm each other—IDE 40, applied in the first approach. Sensing units produced with this new arrangement were submitted to the same procedures, and a new IDMAP projection was made. Figure 3a shows the IDMAP grouping by solution, while the individual performance of each sensing unit is shown in Figure 3b (grouping by sensing unit). In general, data clusters are more compact, revealing low dispersion. A greater Euclidean distance between clusters was also verified, indicating a greater ability to discriminate all concentrations of MBC, without superposition in the grouping by solution plot.
The best performance was achieved when the sensing units are analyzed separately. The sensing unit covered with DODAB/NiTsPc LbL film was able to discriminate the MBC concentrations while the sensing unit recovered with Perylene/DPPG remains unable to discriminate in the grouping by sensing unit plot (Figure 3b). Moreover, it is possible to observe a pattern from the lower to higher MBC concentrations. The separation of initial and final water shows the irreversibility of measures. This phenomenon is reported in the literature [38] and may be related to adsorption of analyte, which can lead to irreversible changes. In our case, the last layer of the DODAB/NiTsPc LbL films was DODAB, and for Perylene/DPPG LbL films the last layer was DPPG. Thus, we can relate the better response of the sensing units covered with DODAB/NiTsPc to the interaction between DODAB and MBC. Indeed, our group reported the affinity between DODAB and MBC by Langmuir isotherms. The interaction is driven by ion-dipole forces between the benzimidazole moiety and quaternary N+, from MBC and DODAB respectively [41]. The absence of interaction between DPPG and MBC was attained to steric hindrance.
As above mentioned, DODAB/NiTsPc LbL film presented the best sensing performance. To obtain more information about the nature of this sample as a sensor, as well as the properties of the materials that compose this sensing unit, a study of its impedance in terms of equivalent circuit was made. Figure 4 presents the complex impedance plot (Cole-Cole, −Z″–Z′) carried out in the sensing unit covered with (DODAB/NiTsPc)5 LbL film (IDE 10). All complex impedance spectra presented a flattened semicircular-shape in the high frequency region (highlighted in Figure 4), followed by an impedance increasing towards lower frequency, indicating similar behavior in terms of equivalent circuit. The complex impedance spectra show the dependence of the semicircle radius on the MBC concentration. Complex impedance spectra were interpreted in terms of the phenomenological equivalent circuit displayed in the inset in Figure 4, containing resistors (Z = R), a capacitor (Z = 1/j2πfC), and a constant phase element (CPE). The CPE impedance (ZCPE) is defined as 1/Q(j2πf)n, where Q is equivalent to capacitance or conductance depending on n value, and 0 ≤ n ≤ 1. If n = 1, the ZCPE presents a capacitor-like behavior with ZCPE = 1/jQ2πf, and if n = 0, it will have a resistor-like behavior with impedance ZCPE = 1/Q [42]. The representation of the Cole-Cole plot for the (DODAB/NiTsPc)5 LbL film by this equivalent circuit (inset in Figure 4) is corroborated by several other works in the literature [43,44,45,46,47], which is obtained by solving the corresponding Nernst–Planck equation [23]. A decreasing of the resistance upon MBC concentration increasing is clearly visible in the decrease of the flattened semicircle radius. This fact may be a result of the dipole interaction that occurs between DODAB and MBC at the interface surface. In addition, the change in the slope at lower frequencies can be attributed to the chemisorption/physisorption of molecules [48] or even ion diffusion [49].
The fittings presented in Figure 4 were obtained with the calculated parameters presenting errors no greater than ~6%, indicating a good correlation between the experimental data and the equivalent circuit adopted. Figure 5a presents a sketch associating the circuit elements with their possible phenomenological interpretations. For this purpose, a drawing of a simplified version of the sensing unit is also presented, containing only the representation of the last bilayer. The R1 represents the series resistance, that has contribution of the contact resistance (gold IDE covered with PAH/PSS) and wire connections. The R2-C parallel circuit branch represents the bulk resistance and the capacitance of the DODAB/NiTsPc LbL film. The R3-CPE parallel circuit branch represents the DODAB/solution interface, where there are effects attributed to the water and MBC solutions influence on the film surface, such as dipolar interactions. Changes in the R3-CPE value is usually attributed to changes in the electrical double layer, chemisorption-physisorption [48], and/or to changes in the dielectric constant [50]. Here, it Is necessary to emphasize that ion-dipole interaction modifies the solution dielectric constant [51]. So, the above-mentioned ion-dipole forces between benzimidazole moiety and quaternary N+, from MBC and DODAB, respectively, must be one of the main interactions responsible for the change in the electrical response when compared to the sensing unit in contact with ultrapure water.
The MBC concentration variation does not change the R1 value, fixed in R1 ≈ 34 ± 2 Ω, indicating that no effect reaches the gold and film interface, and it presented non-blocking low contact resistance. The CPE-n value was n ≈ 0.76 ± 0.02. Figure 5b shows that the capacitance C and CPE impedance have negligible variations with MBC concentration. This occurs because the concentration of MBC is low (10−10 to 10−7 mol L−1), i.e., the capacitance of the interface is dominated by the water capacitance, which is formed by the electrical double layer of H+ and OH [52]. However, Figure 5c,d show that both resistances, R2 related to the LbL film bulk and R3 related to the interface dynamics, decrease as the MBC concentration increases. The R3 change can be attributed to the aforementioned DODAB/solution interaction at the interface, which may be linked to the time for the dipoles to be reoriented, being different for MBC and water. This has consequences on the material dielectric relaxation time (τ = RC) and, since the capacitance is constant, the expected change is in resistance. The R2 change may be related to chemisorption/physisorption of MBC species that can be able to diffuse into the film achieving the bulk, leading to modify the conductivity of the material permanently.
These resistance alterations will affect the impedance measurements only in a specific frequency range. Then, conductivity analysis is a good complementary approach to help understanding this phenomenon. The ac conductivity (σac) of (DODAB/NiTsPc)5 LbL film was estimated from impedance data using the following equation [53]:
σ a c = k Z Z 2 + Z 2
where Z′ and Z″ are the real and imaginary impedance components (Z = Z′ + iZ″), and κ is the cell constant, in general a planar IDEs geometry correction that can be expressed in terms of capacitance or resistance by κ = R/ρ = ϵϵ0/C. In our case, κ was experimentally and theoretically determined using the method reported by Olthuis et al. [54], following the equation:
k = 1 ( N 1 ) L 2 K ( k ) K 1 k 2 1 / 2
where N is the number of fingers in the IDEs, L is the length of the fingers, and K(k) is an elliptic integral of the first kind, given by the follow equation [54]:
K k = t = 0 1 d t 1 t 2 1 k 2 t 2 1 / 2
according to Equation (3) and the experimental results, it was found κ ≈ 6.7 m−1.
Figure 6a presents the σac versus f plot of the (DODAB/NiTsPc)5 LbL film when immersed in ultrapure water and in different concentrations of MBC. The σac at low frequencies is generally a plateau attributed to the dc conductivity (σdc). However, this behavior can be deviated due to the frequency-dependence promoted by the ionic conductivity of the liquids [55]. This phenomenon can slow down charge carriers at the electrodes, causing polarization effects [56]. At intermediate frequencies, those ions can no longer follow the variation of the electric field, establishing an almost frequency-independent plateau. The σac enters in the dispersion regime at high frequencies, that is, it presents a Jonscher’s universal power law behavior given by σac = σdc + Aωn, where A and n are constants and ω is the angular frequency [57]. One may note two regions in frequencies, marked in the graph of Figure 6a as (1) and (2), where the conductivity has greater variation with the concentration. Each frequency region in the σac-spectra is attributed to different phenomena. The effect is an increase in the conductivity with increasing concentration of MBC. The variation in the range of low-frequency (1) can be related to the chemisorption/physisorption of MBC species. When the sensing unit was removed from the last MBC concentration and immersed in the final water, its value is lower than the value of the initial water. This result indicates a permanent change in the electrical properties that respond this range of frequency. This effect was also visible in the Cole-Cole plot (Figure 4) and this interpretation is corroborated by Rubira et al. [38] and Aoki et al. [58], who using different approaches, verified irreversible process being attributed to the adsorption of the analyte onto sensor surface. On the other hand, at high-frequency (2), in which an ion-dipole interaction response is observed, the value of the initial and final water is indistinguishable in terms of ac conductivity, leading to no residue on the electrical properties in this frequency range, probably due to their interaction being based on a weak force (Coulombian). Moreover, an increase of conductivity with the MBC concentration was observed, which is appropriate for a sensor.
S % = σ M B C σ H 2 O × 100 %
where σMBC is the ac conductivity when the sample is immersed in water at different MBC concentrations and σH2O is the ac conductivity when the sample was immersed in initial water. Figure 6b presents the σac at f = 104 Hz and S(%) versus MBC concentration. Both curves present a linear regime, i.e., σac increases as MBC concentration becomes higher. The ac conductivity increased from σH2O ≈ 92 μS m−1, which represents the minimum limit when the MBC concentration is zero, up to σMBC ≈ 112 μS m−1 when the MBC concentration is 10−7 mol L−1. The S(%) was ~19% at 10−7 mol L−1 and extrapolating the fitting line to the abscissa axes, we can estimate the S(%) > 5 % for the concentration as low as 10−12 mol L−1. We might suppose that the interaction between MBC and DODAB can favor the higher sensitivity, making it possible to detect very small MBC concentrations.
A computational analysis by parallel coordinates (PC) [27,59,60] was performed using σac data to investigate the role of frequency in the sensing unit covered by the(DODAB/NiTsPc)5 LbL film (Figure 7). This method divides the σac spectrum into a set of frequency bands represented by equally spaced vertical lines, in which each sample datum is represented as a line that intersects each column in its value at the corresponding frequency [59]. Moreover, for each frequency, a silhouette coefficient (Sc) box shows the contribution of the dimension related to its distinction capability, i.e., it is a metric of quality of data. Sc values vary between –1 and 1 and is represented in a color scale, blue being the highest contribution for the discrimination of the sample in the related frequency and the red being the smallest contribution. The magnitude of contribution is represented by the fill of the box, i.e., the greater filled, the higher (blue color) or the smaller (red color) contribution [59,60]. In general, all the frequencies contributed to the discrimination of MBC concentrations and initial and final water, being that the frequency interval from1.00 × 101 Hz to 3.16 × 101 Hz the best data discrimination. However, at this frequency region, the initial and final water are also discriminated, indicating residues in the electrical properties. Regarding the presence of MBC, there is a similarity in the profile for all the pesticide concentrations, being it equidistant in almost all frequencies. Moreover, the lines are close to each other in the three repetitions, indicating a good degree of similarity in the measurement. It is interesting to note that, at high frequencies (<3.16 × 10⁵ Hz), the lines start to overlap, suggesting that at higher frequencies the electrical response was similar, independent of the MBC concentration.
Regarding the measurements in water, while the final water presents dispersion in the data at frequencies higher than 3.16 × 10² Hz, the initial water dispersion was observed at frequencies higher than 1.00 × 10⁵ Hz. Moreover, the response for both initial and final water at 1.00 × 10² Hz and between 1.00 × 10⁴ and 1.00 × 10⁵ Hz (highlighted in purple in Figure 7) was similar (the lines are closer each other). The proximity of the initial and final water for those frequencies suggests a reversible process i.e., processes that may be irreversible have no effect on electrical measurements at that frequency. Although, overall, the sensing unit seems to be affected by the presence of MBC, there are specific frequencies at which a reversible process can be achieved. Therefore, the PC analysis of the ac conductivity allows to identify the frequency ranges in which the sensor is reversible or irreversible, showing the potential of the system for the detection of MBC. Moreover, this sensing unit would be suitable for applications in different circuits which may require operation at medium or high frequencies. The ability to operate over a wide frequency range facilitates the portability of the sensor for its use in field.

4. Conclusions

LbL films of DODAB/NiTsPc and Perylene/DPPG were successfully fabricated with thickness linear growth at nanometer scale. Optical images revel the presence of small aggregates in DODAB/NiTsPc LbL films in agreement with Raman chemical mapping. The e-tongue composed of LbL films of DODAB/NiTsPc, Perylene/DPPG, and bare electrode was able to distinguish different MBC concentrations. The best performance was achieved with a sensing unit covered with (DODAB/NiTsPc)5 LbL film and gold IDEs composed by 100 digits, width 10 μm, height 100 nm, spaced 10 μm each other—IDE 10 (against gold IDEs composed by 60 digits, width 40 μm, height 100 nm, spaced 40 μm each other—IDE 40). The equivalent circuit obtained through the complex impedance graph (Cole-Cole, −Z″–Z′), for DODAB/NiTsPc LbL film, presented errors smaller than 6%, allowing the establishment of a good association of circuit elements with phenomenological interpretations. There was a significant decrease in R3 (attributed to the DODAB/solution interface) with increasing MBC concentration, which is possibly related to the ion-dipole interaction between DODAB and MBC. Furthermore, a small decrease was also observed for R2(attributed to the DODAB/NiTsPc bulk), indicating the MBC diffusion in the DODAB/NiTsPc LbL film. Ac conductivity measurements increased with MBC concentration at low (1 to 102 Hz) and high (104 to 105 Hz) frequencies. However, only at high-frequency are the ac conductivity values of the initial and final water indistinguishable, showing no MBC residues in the electrical properties. The sensitivity for the ac conductivity at 104 Hz grows linearly with the MBC concentration, reaching approximately 19% for 1.0 × 10⁻⁷ mol L−1 concentration. Sensitivity extrapolation for lower values of MBC concentration indicated a sensitivity of 5% for 1.0 × 10⁻¹² mol L−1, suggesting that the (DODAB/NiTsPc)5 sensing unit is sensitive to very low concentrations. The PC method demonstrated that the (DODAB/NiTsPc)5 sensing unit is suitable for the MBC detection once it can distinguish the different samples regarding the concentration of the pesticide and indicates the better frequency of a reversible process.

Supplementary Materials

The following supporting information can be downloaded at: https://www.mdpi.com/article/10.3390/chemosensors11040213/s1, Figure S1: absorbance at fixed wavelength for LbL films on glass. Figure S2: capacitance curves of sensing units (DODAB/NiTsPc)5, (Perylene/DPPG)5 and bare electrode in ultrapure water. IDE 40 (left) and IDE 10 (right). Figure S3: UV-Vis absorption spectra of NiTsPc and perylene in solution (top) and the smoothed (percentile filter) UV-Vis absorption spectra of DODAB/NiTsPc and Perylene/DPPG LbL films recorded every bilayer (bottom). Figure S4: profile of AFM topography of 50 μm x 50 μm area for (DODAB/NiTsPc)5 LbL film (left). AFM topography of glass slide annealed at 600 °C for 2 h (right). Figure S5: real capacitance vs. frequency for all sensing units in ultrapure water and MBC solutions. IDE 40. Figure S6: IDMAP projection from capacitance data (a) of all sensing units combined, grouping by solution. (b) IDMAP projection grouping by sensing unit. IDE 40.

Author Contributions

Conceptualization L.N.F. and Constantino, C.J.L.C.; methodology L.N.F., J.D.F., D.H.V. and L.F.d.C.M.; software, L.N.F. and D.H.V.; formal analysis, L.N.F., J.D.F., D.H.V. and L.F.d.C.M.; data curation, L.N.F., D.H.V., J.D.F. and L.F.d.C.M.; writing—original draft preparation, L.N.F., J.D.F., D.H.V. and L.F.d.C.M.; writing—review and editing, Constantino, C.J.L.C., N.A. and L.N.F. All authors have read and agreed to the published version of the manuscript.

Funding

This research received no external funding.

Institutional Review Board Statement

Not applicable.

Informed Consent Statement

Not applicable.

Data Availability Statement

The data are available in https://data.mendeley.com/datasets/ghf3jpsb3m/1 (accessed on 15 March 2023).

Acknowledgments

The authors acknowledge Fundação de Amparo à Pesquisa do Estado de São Paulo (FAPESP, grants 2020/12282-4, 2018/22214-6 and 2020/12060-1), Coordenação de Aperfeiçoamento de Pessoal de Nível Superior (CAPES)—Finance Code 001, and Conselho Nacional de Desenvolvimento Científico e Tecnológico (CNPq) for the financial support (Process 306501/2022-8, 405087/2021-7, 311601/2020-0 and 304100/2018-8). The authors also acknowledge Programa de Pós-Graduação em Ciência e Tecnologia de Materiais (POSMAT), Instituto Nacional de Eletrônica Orgânica (INEO), fortechnical support.

Conflicts of Interest

The authors declare no conflict of interest.

References

  1. Lu, L.; Hu, Z.; Hu, X.; Li, D.; Tian, S. Electronic tongue and electronic nose for food quality and safety. Food Res. Int. 2022, 162, 112214. [Google Scholar] [CrossRef] [PubMed]
  2. Zhou, Y.; Wu, J.; Wang, B.; Duan, L.; Zhang, Y.; Zhao, W.; Wang, F.; Sui, Q.; Chen, Z.; Xu, D.; et al. Occurrence, source and ecotoxicological risk assessment of pesticides in surface water of Wujin District (northwest of Taihu Lake), China. Environ. Pollut. 2020, 265, 114953. [Google Scholar] [CrossRef]
  3. Suresh, I.; Selvaraj, S.; Nesakumar, N.; Rayappan, J.B.B.; Kulandaiswamy, A.J. Nanomaterials based non-enzymatic electrochemical and optical sensors for the detection of carbendazim: A review. Trends Environ. Anal. Chem. 2021, 31, e00137. [Google Scholar] [CrossRef]
  4. European Food Safety Authority. The 2016 European Union report on pesticide residues in food. EFSA J. 2018, 16, e05348. [Google Scholar]
  5. Shen, Z.; Fan, Q.; Yu, Q.; Wang, R.; Wang, H.; Kong, X. Facile detection of carbendazim in food using TLC-SERS on diatomite thin layer chromatography. Spectrochim. Acta—Part A Mol. Biomol. Spectrosc. 2021, 247, 119037. [Google Scholar] [CrossRef]
  6. Liu, R.; Chang, Y.; Li, F.; Dubovyk, V.; Li, D.; Ran, Q.; Zhao, H. Highly sensitive detection of carbendazim in juices based on mung bean-derived porous carbon@chitosan composite modified electrochemical sensor. Food Chem. 2022, 392, 133301. [Google Scholar] [CrossRef]
  7. Raymundo-Pereira, P.A.; Gomes, N.O.; Carvalho, J.H.S.; Machado, S.A.S.; Oliveira, O.N.; Janegitz, B.C. Simultaneous Detection of Quercetin and Carbendazim in Wine Samples Using Disposable Electrochemical Sensors. ChemElectroChem 2020, 7, 3074–3081. [Google Scholar] [CrossRef]
  8. Luo, S.; Wu, Y.; Gou, H. A voltammetric sensor based on GO-MWNTs hybrid nanomaterial-modified electrode for determination of carbendazim in soil and water samples. Ionics 2013, 19, 673–680. [Google Scholar] [CrossRef]
  9. Patel, G.M.; Rohit, J.V.; Singhal, R.K.; Kailasa, S.K. Recognition of carbendazim fungicide in environmental samples by using 4-aminobenzenethiol functionalized silver nanoparticles as a colorimetric sensor. Sens. Actuators B Chem. 2015, 206, 684–691. [Google Scholar] [CrossRef]
  10. Zhu, C.; Liu, D.; Chen, Z.; Li, L.; You, T. An ultra-sensitive aptasensor based on carbon nanohorns/gold nanoparticles composites for impedimetric detection of carbendazim at picogram levels. J. Colloid Interface Sci. 2019, 546, 92–100. [Google Scholar] [CrossRef]
  11. Li, H.; Hassan, M.M.; He, Z.; Haruna, S.A.; Chen, Q.; Ding, Z. A sensitive silver nanoflower-based SERS sensor coupled novel chemometric models for simultaneous detection of chlorpyrifos and carbendazim in food. LWT 2022, 167, 113804. [Google Scholar] [CrossRef]
  12. Riul, A., Jr.; Dantas, C.A.; Miyazaki, C.M.; Oliveira, O.N., Jr. UK. Recent advances in electronic tongues CORE View metadata, citation and similar papers at core. Analyst 2010, 135, 2481–2495. [Google Scholar] [PubMed]
  13. Vahdatiyekta, P.; Zniber, M.; Bobacka, J.; Huynh, T.P. A review on conjugated polymer-based electronic tongues. Anal. Chim. Acta 2022, 1221, 340114. [Google Scholar] [CrossRef] [PubMed]
  14. Vlasov, Y.G.; Legin, A.V.; Rudnitskaya, A.M. Cross-sensitivity evaluation of chemical sensors for electronic tongue: Determination of heavy metal ions. Sens. Actuators B Chem. 1997, 44, 532–537. [Google Scholar] [CrossRef]
  15. Riul, A.; Dos Santos, D.S.; Wohnrath, K.; Di Tommazo, R.; Carvalho, A.C.P.L.F.; Fonseca, F.J.; Oliveira, O.N.; Taylor, D.M.; Mattoso, L.H.C. Artificial Taste Sensor: Efficient Combination of Sensors Made from Langmuir-Blodgett Films of Conducting Polymers and a Ruthenium Complex and Self-Assembled Films of an Azobenzene-Containing Polymer. Langmuir 2002, 18, 239–245. [Google Scholar] [CrossRef]
  16. Steinern, C.; Janshoff, A.; Galla, H.J.; Sieber, M. Impedance analysis of ion transport through gramicidin channels incorporated in solid supported lipid bilayers. Bioelectrochem. Bioenerg. 1997, 42, 213–220. [Google Scholar]
  17. Siqueira, J.R.; Caseli, L.; Crespilho, F.N.; Zucolotto, V.; Oliveira, O.N. Immobilization of biomolecules on nanostructured films for biosensing. Biosens. Bioelectron. 2010, 25, 1254–1263. [Google Scholar] [CrossRef] [PubMed]
  18. Perinoto, A.C.; Maki, R.M.; Colhone, M.C.; Santos, F.R.; Migliaccio, V.; Daghastanli, K.R.; Stabeli, R.G.; Ciancaglini, P.; Paulovich, F.V.; De Oliveira, M.C.; et al. Biosensors for Efficient Diagnosis of Leishmaniasis: Innovations in Bioanalytics for a Neglected Disease. Anal. Chem. 2010, 82, 9763–9768. [Google Scholar] [CrossRef]
  19. Facure, M.H.M.; Mercante, L.A.; Mattoso, L.H.C.; Correa, D.S. Detection of trace levels of organophosphate pesticides using an electronic tongue based on graphene hybrid nanocomposites. Talanta 2017, 167, 59–66. [Google Scholar] [CrossRef]
  20. Chen, S.; Wang, Y.; Feng, L. Specific detection and discrimination of dithiocarbamates using CTAB-encapsulated fluorescent copper nanoclusters. Talanta 2020, 210, 120627. [Google Scholar] [CrossRef]
  21. Steinem, C.; Janshoff, A.; Wegener, J.; Ulrich, W.P.; Willenbrink, W.; Sieber, M.; Galla, H.J. Impedance and shear wave resonance analysis of ligand-receptor interactions at functionalized surfaces and of cell monolayers. Biosens. Bioelectron. 1997, 12, 787–808. [Google Scholar] [CrossRef]
  22. Brumlev, T.R.; Buck, R.P. Transmission line equivalent circuit models for electrochemical impedances. J. Electroanal. Chem. 1981, 126, 73–104. [Google Scholar] [CrossRef]
  23. Janshoff, A.; Steinem, C. Transport across artificial membranes-an analytical perspective. Anal. Bioanal. Chem. 2006, 385, 433–451. [Google Scholar] [CrossRef] [PubMed]
  24. Deffo, G.; Temgoua, R.C.T.; Tajeu, K.Y.; Njanja, E.; Doungmo, G.; Tonle, I.K.; Ngameni, E. Signal amplification by electropolymerization of alizarin red S for improved diuron detection at organosmectite modified glassy carbon electrode. J. Chin. Chem. Soc. 2022, 69, 349–358. [Google Scholar] [CrossRef]
  25. Volpati, D.; Aoki, P.H.; Dantas, C.A.; Paulovich, F.V.; De Oliveira, M.C.F.; Oliveira, O.N., Jr.; Riul, A., Jr.; Aroca, R.F.; Constantino, C.J. Toward the Optimization of an e-Tongue System Using Information Visualization: A Case Study with Perylene Tetracarboxylic Derivative Films in the Sensing Units. Langmuir. 2012, 28, 1029–1040. [Google Scholar] [CrossRef]
  26. Jolliffe, I.T. Principal Component Analysis, 2nd ed.; Springer: Aberdeen, UK, 2002. [Google Scholar]
  27. Oliveira, O.N.; Pavinatto, F.J.; Constantino, C.J.L.; Paulovich, F.V.; de Oliveira, M.C.F. Information visualization to enhance sensitivity and selectivity in biosensing. Biointerphases 2012, 7, 53. [Google Scholar] [CrossRef] [PubMed] [Green Version]
  28. Moraes, M.L.; Maki, R.M.; Paulovich, F.V.; Rodrigues Filho, U.P.; De Oliveira, M.C.F.; Riul, A., Jr.; De Souza, N.C.; Ferreira, M.; Gomes, H.L.; Oliveira, O.N., Jr. Strategies to Optimize Biosensors Based on Impedance Spectroscopy to Detect Phytic Acid Using Layer-by-Layer Films. Anal. Chem. 2010, 82, 3239–3246. [Google Scholar] [CrossRef]
  29. Rocha Neto, J.B.M.; Soares, A.C.; Bataglioli, R.A.; Carr, O.; Costa, C.A.R.; Oliveira, O.N., Jr.; Beppu, M.M.; Carvalho, H.F. Polysaccharide Multilayer Films in Sensors for Detecting Prostate Tumor Cells Based on Hyaluronan-CD44 Interactions. Cells 2020, 9, 1563. [Google Scholar] [CrossRef]
  30. Paulovich, F.V.; Oliveira, M.C.F.; Minghim, R. The Projection Explorer: A Flexible Tool for Projection-based Multidimensional Visualization. In Proceedings of the XX Brazilian Symposium on Computer Graphics and Image Processing (SIBGRAPI 2007), Minas Gerais, Brazil, 7–10 October 2007; pp. 27–36. [Google Scholar]
  31. Furini, L.N.; Martin, C.S.; Camacho, S.A.; Rubira, R.J.; Fernandes, J.D.; Silva, E.A.; Gomes, T.C.; Stunges, G.M.; Constantino, C.J.; Alessio, P. Electrochemical properties of nickel phthalocyanine: The effect of thin film morphology tuned by deposition techniques. Thin Solid Film. 2020, 699, 137897. [Google Scholar] [CrossRef]
  32. Ferreira, M.; Riul, A.; Wohnrath, K.; Fonseca, F.J.; Oliveira, O.N.; Mattoso, L.H.C. High-performance taste sensor made from Langmuir-Blodgett films of conducting polymers and a ruthenium complex. Anal. Chem. 2003, 75, 953–955. [Google Scholar] [CrossRef]
  33. Aoki, P.H.B.; Volpati, D.; Riul, A.; Caetano, W.; Constantino, C.J.L. Layer-by-layer technique as a new approach to produce nanostructured films containing phospholipids as transducers in sensing applications. Langmuir 2009, 25, 2331–2338. [Google Scholar] [CrossRef] [PubMed]
  34. Aoki, P.H.; Alessio, P.; Furini, L.N.; Constantino, C.J.; Neves, T.T.; Paulovich, F.V.; De Oliveira, M.C.F.; Oliveira, O.N., Jr. Molecularly designed layer-by-layer (LbL) films to detect catechol using information visualization methods. Langmuir 2013, 29, 7542–7550. [Google Scholar] [CrossRef] [PubMed]
  35. Furini, L.N.; Feitosa, E.; Alessio, P.; Shimabukuro, M.H.; Riul, A.; Constantino, C.J.L. Tuning the nanostructure of DODAB/nickel tetrasulfonated phthalocyanine bilayers in LbL films. Mater. Sci. Eng. C 2013, 33, 2937–2946. [Google Scholar] [CrossRef] [PubMed]
  36. Camp, P.J.; Jones, A.C.; Neely, R.K.; Speirs, N.M. Aggregation of Copper (II) Tetrasulfonated Phthalocyanine in Aqueous Salt Solutions. J. Phys. Chem. A 2002, 106, 10725–10732. [Google Scholar] [CrossRef]
  37. Dreher, M.; Kang, D.; Breuer, T.; Witte, G. Growth of extended DNTT fibers on metal substrates by suppression of step-induced nucleation. Nanoscale Horiz. 2019, 4, 1353–1360. [Google Scholar] [CrossRef]
  38. Rubira, R.J.; Camacho, S.A.; Aoki, P.H.; Maximino, M.D.; Alessio, P.; Martin, C.S.; Oliveira, O.N.; Fatore, F.M.; Paulovich, F.V.; Constantino, C.J. Detection of trace levels of atrazine using surface-enhanced Raman scattering and information visualization. Colloid Polym. Sci. 2014, 292, 2811–2820. [Google Scholar] [CrossRef] [Green Version]
  39. Mamishev, V.; Sundara-Rajan, K.; Yang, F.; Du, Y.; Zahn, M. Interdigital Sensors and Transducers. Proc. IEEE 2004, 92, 808–845. [Google Scholar] [CrossRef] [Green Version]
  40. Rivadeneyra, A.; Fernández-Salmerón, J.; Banqueri, J.; López-Villanueva, J.A.; Capitan-Vallvey, L.F.; Palma, A.J. A novel electrode structure compared with interdigitated electrodes as capacitive sensor. Sens. Actuators B Chem. 2014, 204, 552–560. [Google Scholar] [CrossRef]
  41. Furini, L.N.; Morato, L.F.C.; Olivier, D.S.; Lemos, M.; Feitosa, E.; Constantino, C.J.L. Interactions of Lipid Polar Headgroups with Carbendazim Fungicide. J. Nanosci. Nanotechnol. 2019, 19, 3734–3743. [Google Scholar] [CrossRef]
  42. Klem, M.D.S.; Morais, R.M.; Rubira, R.J.G.; Alves, N. Paper-based supercapacitor with screen-printed poly (3, 4-ethylene dioxythiophene)-poly (styrene sulfonate)/multiwall carbon nanotube films actuating both as electrodes and current collectors. Thin Solid Film. 2019, 669, 96–102. [Google Scholar] [CrossRef]
  43. Steinem, C.; Janshoff, A.; Von Dem Bruch, K.; Reihs, K.; Goossens, J.; Galla, H.J. Valinomycin-mediated transport of alkali cations through solid supported membranes. Bioelectrochem. Bioenerg. 1998, 45, 17–26. [Google Scholar] [CrossRef]
  44. Navrátil, T.; Šestáková, I.; Štulík, K.; Mareček, V. Electrochemical measurements on supported phospholipid bilayers: Preparation, properties and ion transport using incorporated ionophores. Electroanalysis 2010, 22, 2043–2050. [Google Scholar] [CrossRef]
  45. Navrátil, T.; Šestáková, I.; Mareček, V. Supported phospholipid membranes formation at a gel electrode and transport of divalent cations across them. Int. J. Electrochem. Sci. 2011, 6, 6032–6046. [Google Scholar]
  46. Stelzle, M.; Weissmüller, G.; Sackmann, E. On the application of supported bilayers as receptive layers for biosensors with electrical detection. J. Phys. Chem. 1993, 97, 2974–2981. [Google Scholar] [CrossRef]
  47. Navrátil, T.; Šestáková, I.; Dytrtová, J.J.; Jakl, M.; Marěek, V. Study of charged particles transport across model and real phospholipid bilayers. WSEAS Trans. Environ. Dev. 2010, 6, 208–219. [Google Scholar]
  48. Behpour, M.; Mohammadi, N. Investigation of inhibition properties of aromatic thiol self-assembled monolayer for corrosion protection. Corros. Sci. 2012, 65, 331–339. [Google Scholar] [CrossRef]
  49. Klem, M.D.S.; Nogueira, G.L.; Alves, N. High-performance symmetric supercapacitor based on molybdenum disulfide/poly(3,4-ethylenedioxythiophene)-poly(styrenesulfonate) composite electrodes deposited by spray-coating. Int. J. Energy Res. 2021, 45, 9021–9038. [Google Scholar] [CrossRef]
  50. Behpour, M.; Ghoreishi, S.M.; Mohammadi, N.; Salavati-Niasari, M. Investigation of the inhibiting effect of N-[(Z)-1-phenylemethyleidene]-N-{2-[(2-{[(Z)-1phenylmethylidene]amino}phenyl)disulfanyl]phenyl} amine and its derivatives on the corrosion of stainless steel 304 in acid media. Corros. Sci. 2011, 53, 3380–3387. [Google Scholar] [CrossRef]
  51. Buehler, M.; Cobos, D.; Dunne, K. Dielectric Constant and Osmotic Potential from Ion-Dipole Polarization Measurements of KCl- And NaCl-doped Aqueous Solutions. ISEMA Conf. Proc. 2011, 70–78. [Google Scholar]
  52. Ozório, M.S.; Vieira, D.H.; Nogueira, G.L.; Martin, C.S.; Alves, N.; Constantino, C.J.L. Effect of the gate electrodes/water interface on the performance of ZnO-based water gate field-effect transistors. Mater. Sci. Semicond. Process. 2022, 151, 107045. [Google Scholar] [CrossRef]
  53. Vieira, D.H.; da Silva Ozório, M.; Nogueira, G.L.; Alves, N. Impedance spectroscopy analysis of poly(3-hexylthiophene):TIPS-pentacene blends in different ratios. Phys. B Phys. Condens. Matter 2021, 623, 413346. [Google Scholar] [CrossRef]
  54. Olthuis, W.; Streekstra, W.; Bergveld, P. Theoretical and experimental determination of cell constants of planar-interdigitated electrolyte conductivity sensors. Sens. Actuators B Chem. 1995, 24, 252–256. [Google Scholar] [CrossRef] [Green Version]
  55. Karaman, B.; Çevik, E.; Bozkurt, A. Novel flexible Li-doped PEO/copolymer electrolytes for supercapacitor application. Ionics 2019, 25, 1773–1781. [Google Scholar] [CrossRef]
  56. Sedlak, P.; Gajdos, A.; Macku, R.; Majzner, J.; Holcman, V.; Sedlakova, V.; Kubersky, P. The effect of thermal treatment on ac/dc conductivity and current fluctuations of PVDF/NMP/[EMIM][TFSI] solid polymer electrolyte. Sci. Rep. 2020, 10, 21140. [Google Scholar] [CrossRef]
  57. Padhee, R.; Das, P.R.; Parida, B.N.; Choudhary, R.N.P. Electrical and Pyroelectric Properties of K2Pb2Gd2W2Ti4Nb4O30 Ferroelectrics. J. Electron. Mater. 2013, 42, 426–437. [Google Scholar] [CrossRef]
  58. Aoki, P.H.; Alessio, P.; Volpati, D.; Paulovich, F.V.; Riul, A., Jr.; Oliveira, O.N., Jr.; Constantino, C.J. On the distinct molecular architectures of dipping- and spray-LbL films containing lipid vesicles. Mater. Sci. Eng. C 2014, 41, 363–371. [Google Scholar] [CrossRef]
  59. Paulovich, F.V.; Moraes, M.L.; Maki, R.M.; Ferreira, M.; Oliveira, O.N.; De Oliveira, M.C.F. Information visualization techniques for sensing and biosensing. Analyst 2011, 136, 1344–1350. [Google Scholar] [CrossRef]
  60. Andre, R.S.; Facure, M.H.M.; Mercante, L.A.; Correa, D.S. Electronic nose based on hybrid free-standing nanofibrous mats for meat spoilage monitoring. Sens. Actuators B Chem. 2022, 353, 131114. [Google Scholar] [CrossRef]
Figure 1. (a) Molecular structures of DODAB, DPPG, NiTsPc, Perylene and MBC. (b) Layer-by-layer deposition steps. (c) Sensing units composed by bare IDE and IDEs covered with LbL films of (DODAB/NiTsPc)5 and (Perylene/DPPG)5. (d) Optical image of the IDE 10 showing the space of 10 μm between electrodes.
Chemosensors 11 00213 g001
Figure 2. Monitoring LbL film growth by absorbance versus number of bilayers for (a) DODAB/NiTsPc and (b) Perylene/DPPG. Optical images and chemical mapping of (c) (DODAB/NiTsPc)5 and (d) (Perylene/DPPG)5 LbL films with the Raman spectra of LbL films as inset. Topography AFM images for (e) (DODAB/NiTsPc)5 and (f) (Perylene/DPPG)5 on glass substrates.
Chemosensors 11 00213 g002
Figure 3. IDMAP projection from capacitance data (a) of all sensing units combined, grouping by solution. (b) IDMAP projection grouping by sensing unit. IDE 10.
Chemosensors 11 00213 g003
Figure 4. Cole-Cole plot (−Z″–Z′) of the (DODAB/NiTsPc)5 sample immersed in: water initial, MBC dissolved in water at concentrations from 1.0 × 10⁻¹⁰, to 1.0 × 10⁻⁷ mol L−1, and water final. The zoom shows the flattened semicircular region with a fitting (continuous lines) using equivalent circuit presented in the inset. IDE 10.
Chemosensors 11 00213 g004
Figure 5. (a) Schematic representation of the (DODAB/NiTsPc)5 LbL film onto gold electrodes together with its corresponding equivalent circuit indicating the phenomenological relationship of the two schemes through arrows. (b) C1 and CPE impedance of CPE versus MBC concentration. (c) R2 versus MBC concentration. (d) R3 versus MBC concentration. The respective errors found in the fitting were added as an error bar in the figures. IDE 10.
Chemosensors 11 00213 g005
Figure 6. (a) ac conductivity versus frequency of the (DODAB/NiTsPc)5 when immersed in ultrapure water and at different concentrations of MBC. Inset: zoom at the low frequency region. (b) Analytical curve of ac conductivity at 104 Hz and sensitivity versus MBC concentration. IDE 10.
Chemosensors 11 00213 g006
Figure 7. Parallel coordinates plot for the σac data obtained with the sensing units made with (DODAB/NiTsPc)5 LbL film using three measurements for each concentration. IDE 10.
Chemosensors 11 00213 g007
Disclaimer/Publisher’s Note: The statements, opinions and data contained in all publications are solely those of the individual author(s) and contributor(s) and not of MDPI and/or the editor(s). MDPI and/or the editor(s) disclaim responsibility for any injury to people or property resulting from any ideas, methods, instructions or products referred to in the content.

