
Nanostring-Based Identification of the Gene Expression Profile in Trigger Finger Samples

 , , ,
, , ,  ,
,
Abstract
:1. Introduction
2. Materials and Methods
2.1. Ethical Approval and Informed Consent
2.2. Obtaining Patient Samples
2.3. RNA Isolation and NanoString’s nCounter XT Gene Expression Assay
2.4. Statistical Method
3. Results
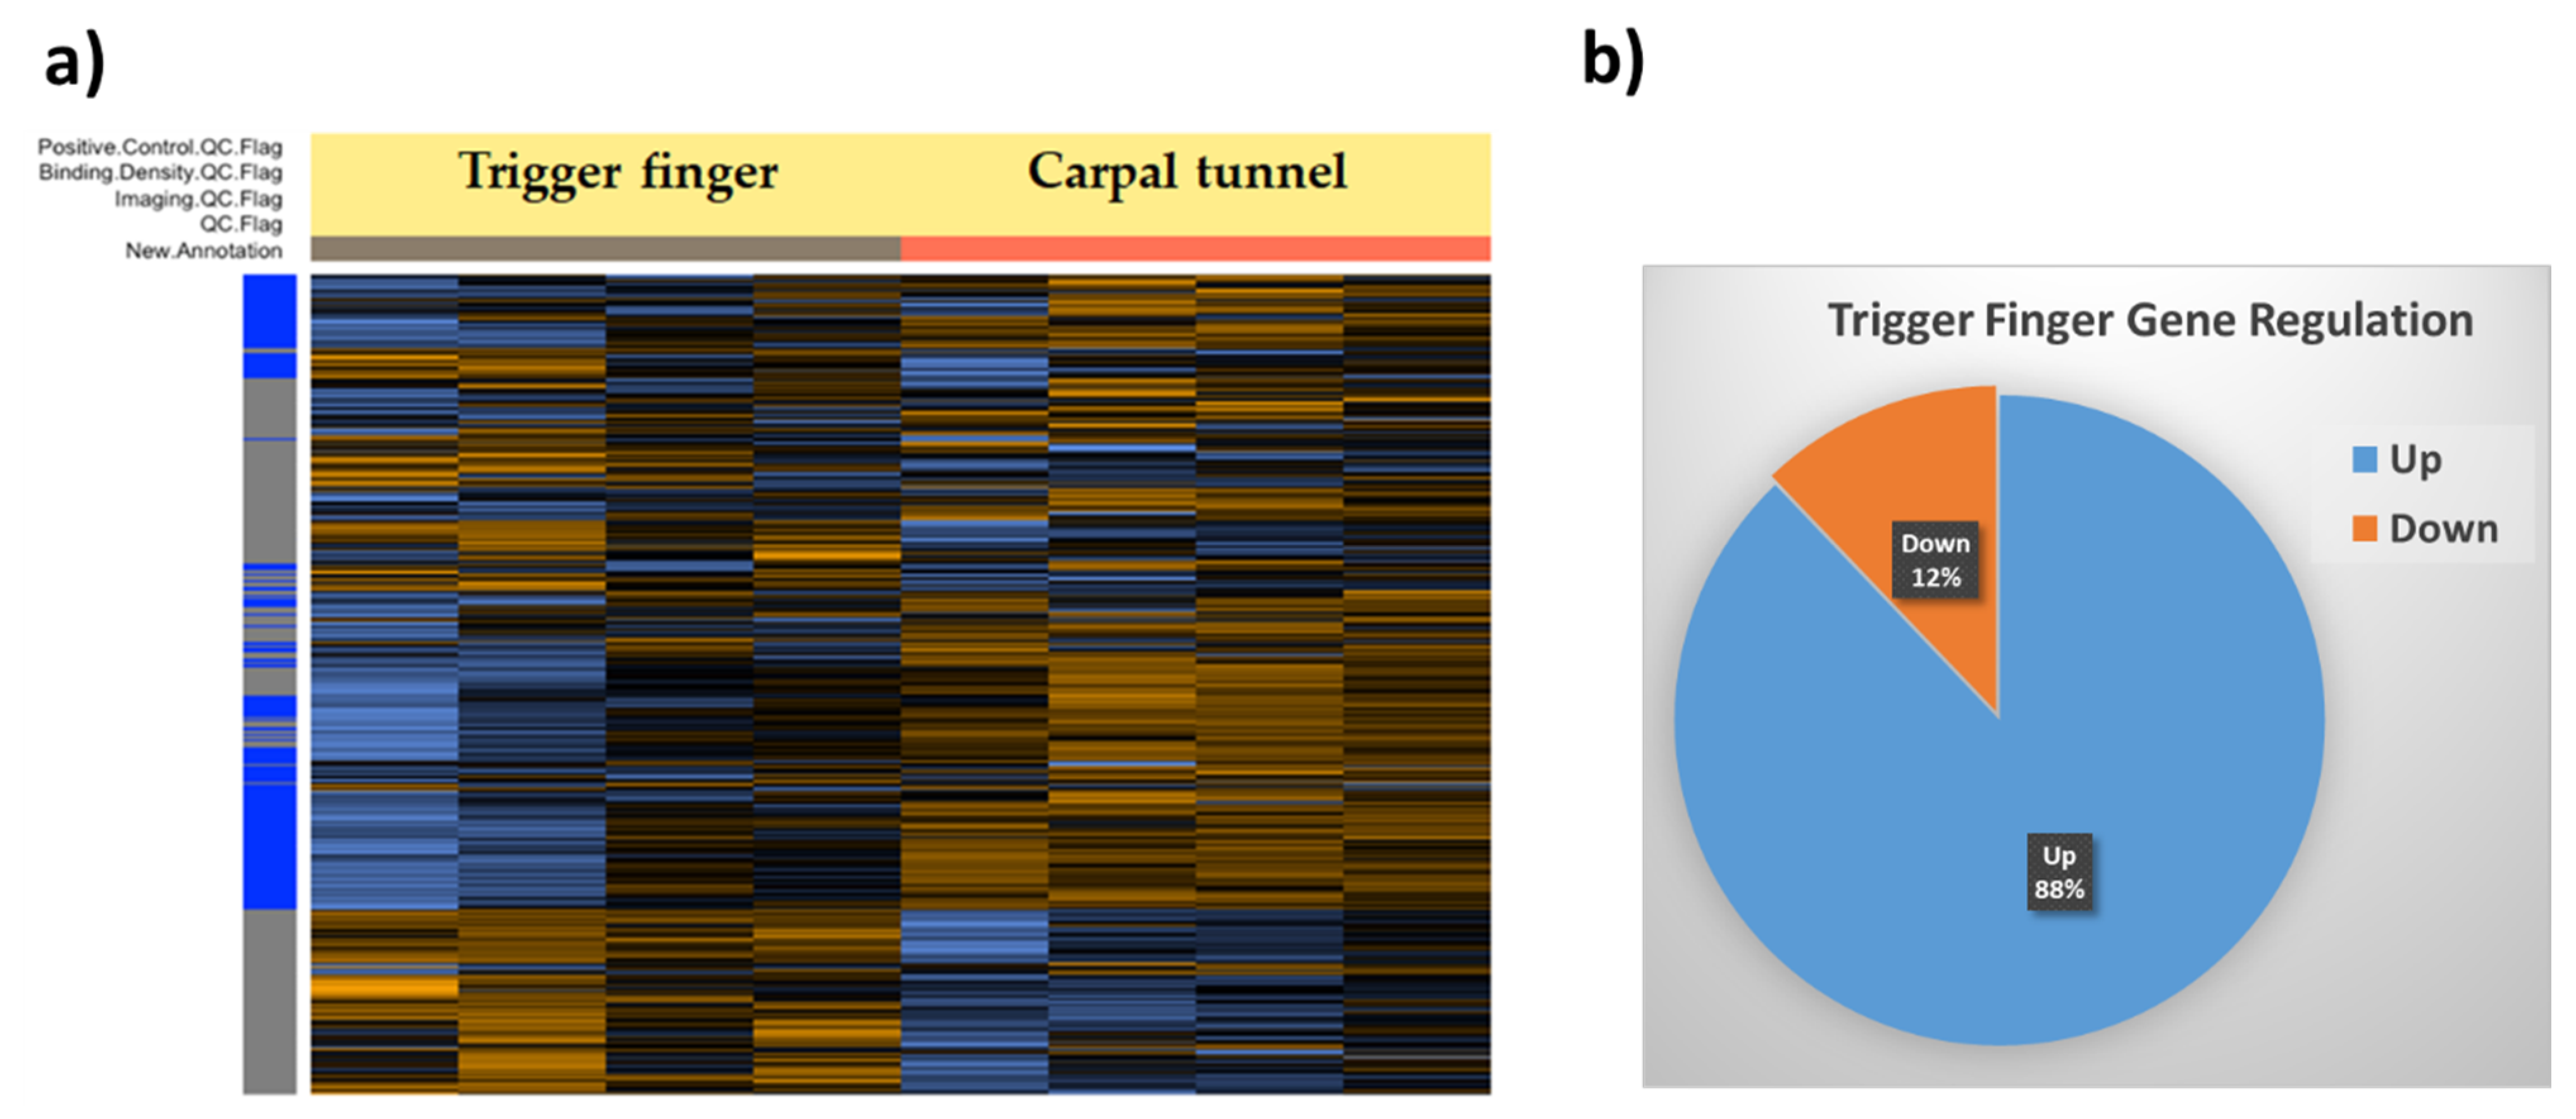
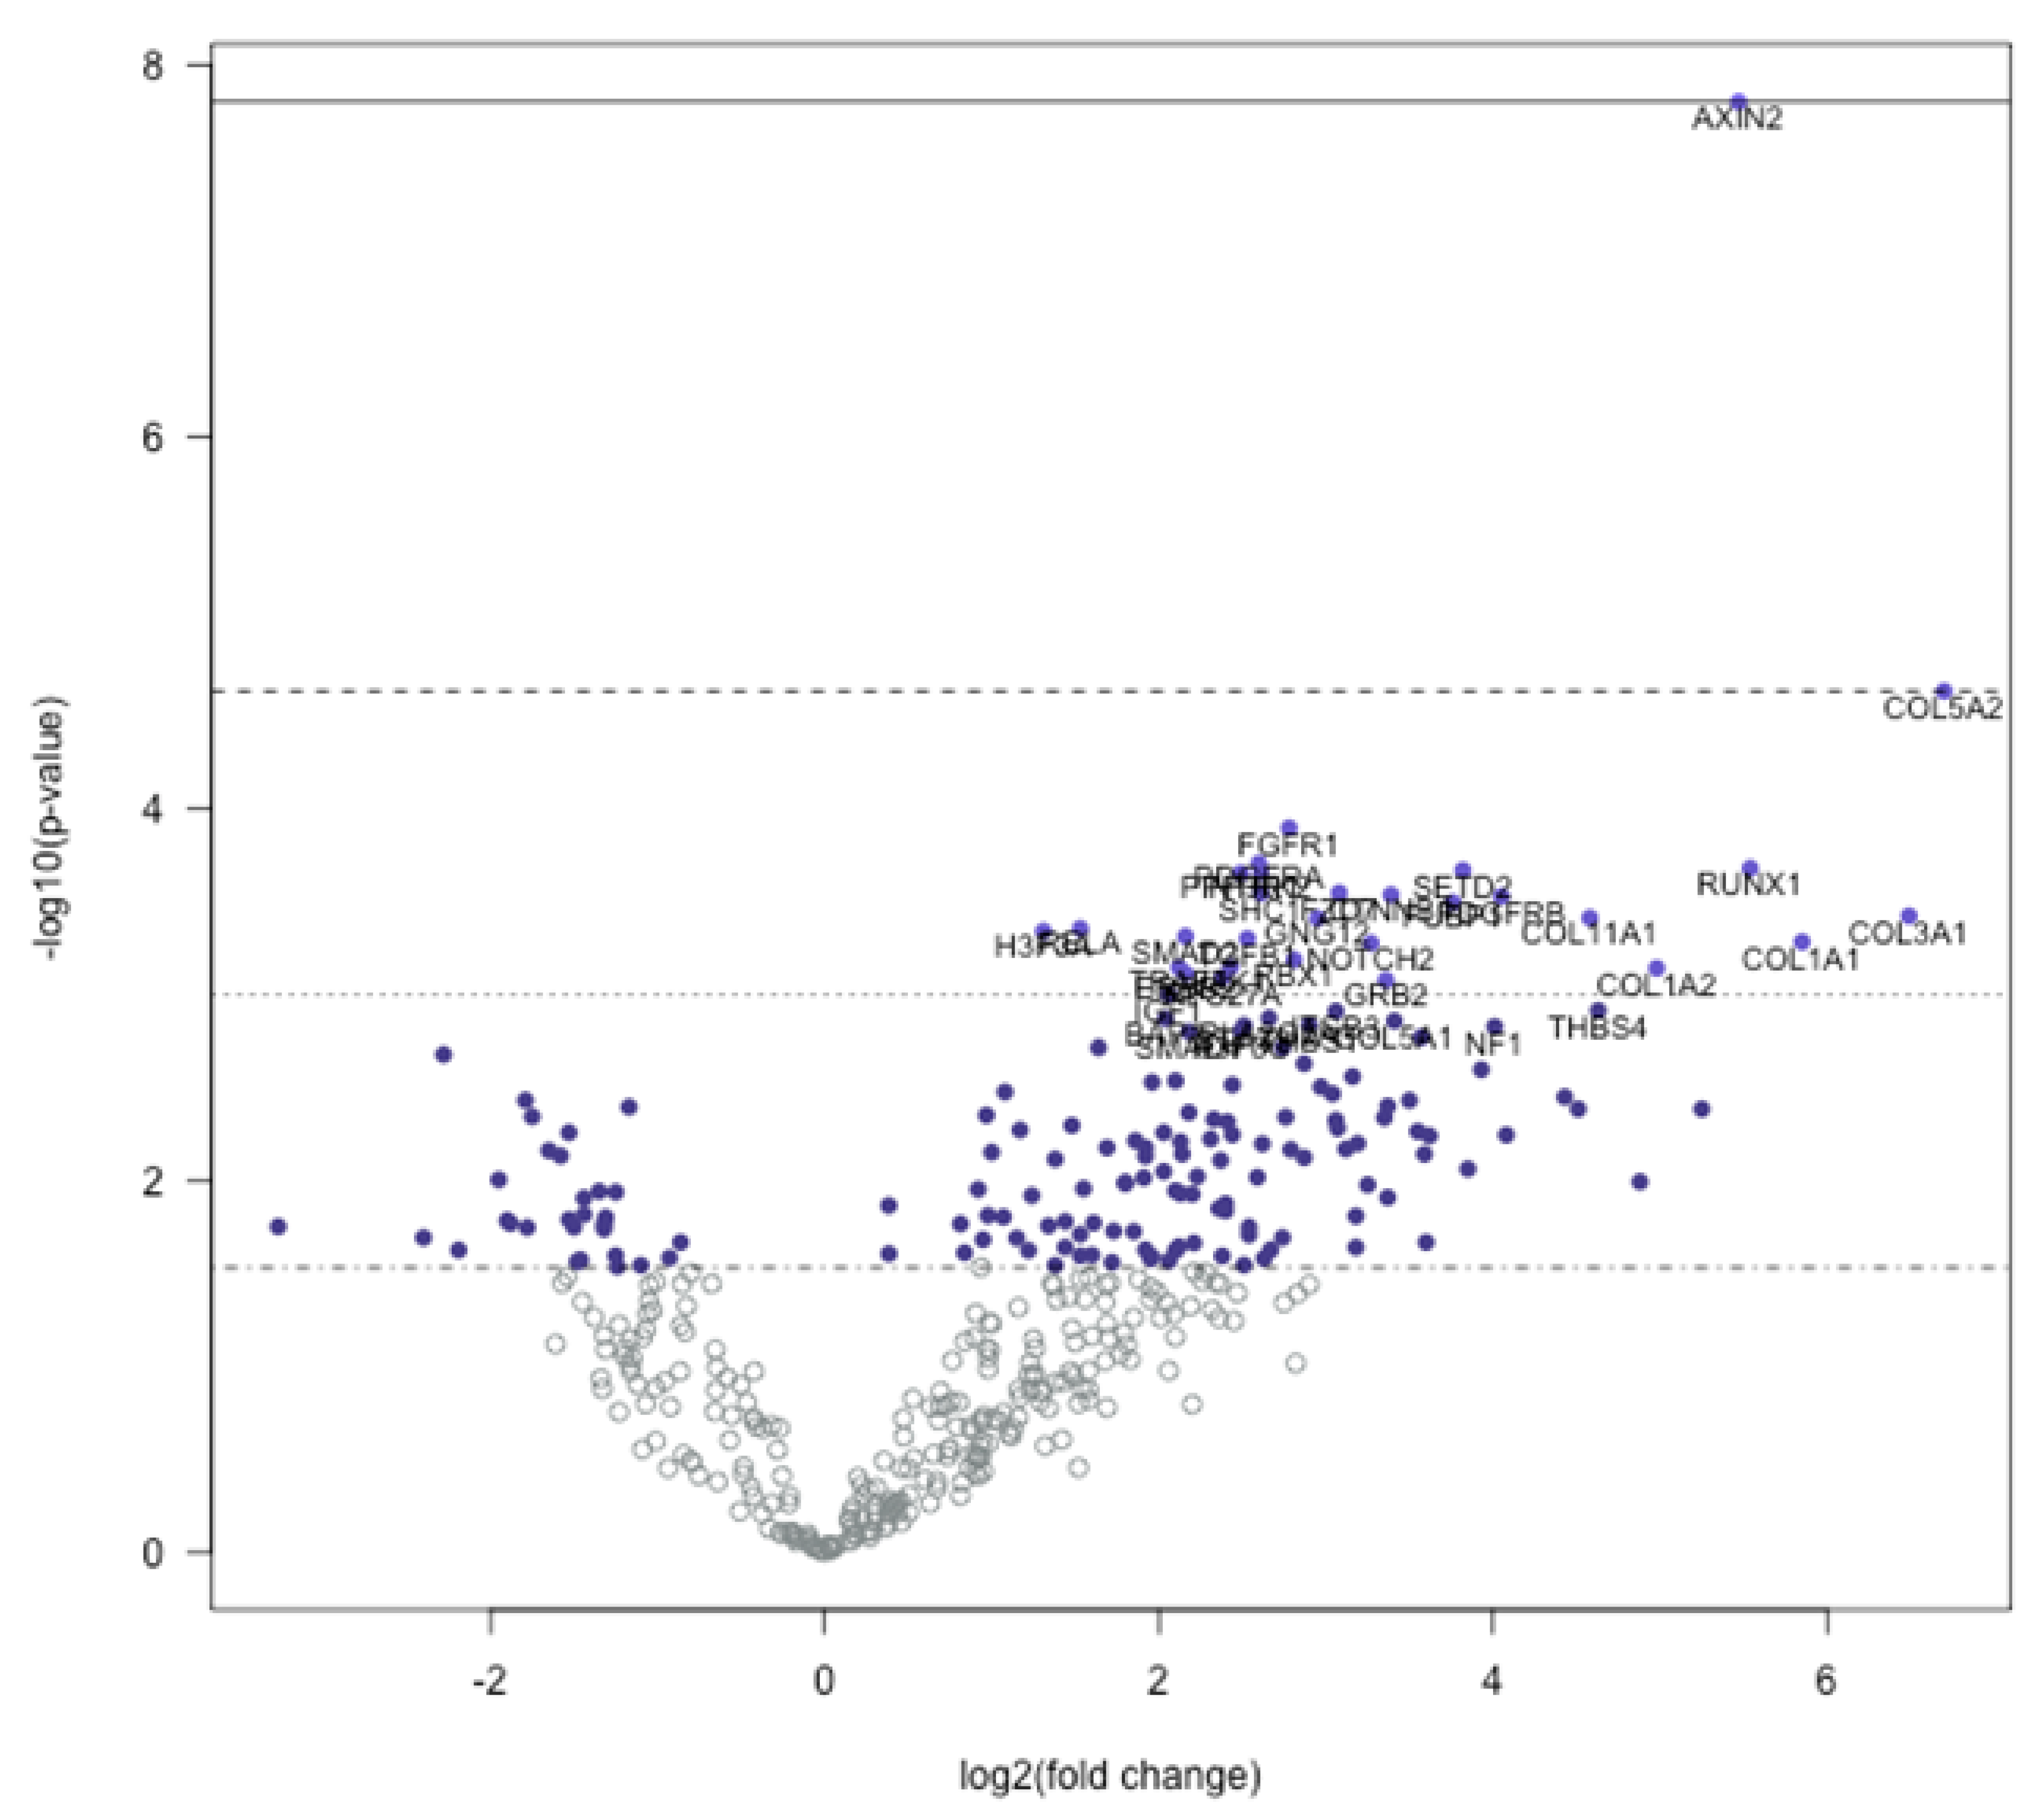
3.1. Global Gene Expression Profile of Trigger Finger Samples Compared to Control
3.2. Signaling Pathway Predictions
4. Discussion
Supplementary Materials
Author Contributions
Funding
Institutional Review Board Statement
Informed Consent Statement
Data Availability Statement
Acknowledgments
Conflicts of Interest
References
- Fiorini, H.J.; Tamaoki, M.J.; Lenza, M.; Gomes Dos Santos, J.B.; Faloppa, F.; Belloti, J.C. Surgery for trigger finger. Cochrane Database Syst. Rev. 2018, 2, CD009860. [Google Scholar] [CrossRef]
- Jeanmonod, R.; Waseem, M. Trigger Finger. In StatPearls; StatPearls Publishing: Treasure Island, FL, USA, 2019. [Google Scholar]
- Sbernardori, M.C.; Bandiera, P. Histopathology of the A1 pulley in adult trigger fingers. J. Hand Surg. Eur. Vol. 2007, 32, 556–559. [Google Scholar] [CrossRef]
- Sampson, S.P.; Badalamente, M.A.; Hurst, L.C.; Seidman, J. Pathobiology of the human A1 pulley in trigger finger. J. Hand Surg. Am. 1991, 16, 714–721. [Google Scholar] [CrossRef]
- Niumsawatt, V.; Mao, D.; Salerno, S.; Rozen, W.M. Trigger finger release with stepwise preservation of the A1 pulley: A functional pulley-preserving technique. Int. Surg. 2013, 98, 437–444. [Google Scholar] [CrossRef] [PubMed]
- Langer, D.; Luria, S.; Michailevich, M.; Maeir, A. Long-term functional outcome of trigger finger. Disabil. Rehabil. 2018, 40, 90–95. [Google Scholar] [CrossRef] [PubMed]
- Langer, D.; Maeir, A.; Michailevich, M.; Luria, S. Evaluating Hand Function in Clients with Trigger Finger. Occup. Ther. Int. 2017, 2017, 9539206. [Google Scholar] [CrossRef] [PubMed]
- Makkouk, A.H.; Oetgen, M.E.; Swigart, C.R.; Dodds, S.D. Trigger finger: Etiology, evaluation, and treatment. Curr. Rev. Musculoskelet. Med. 2008, 1, 92–96. [Google Scholar] [CrossRef] [Green Version]
- Matthews, A.; Smith, K.; Read, L.; Nicholas, J.; Schmidt, E. Trigger finger: An overview of the treatment options. JAAPA 2019, 32, 17–21. [Google Scholar] [CrossRef] [PubMed]
- Cain, M.; Awad, M.E.; Kolhe, R.; Mondal, A.K.; Ghilzai, U.; Isales, C.; Fulcher, M.; Fulzele, S. Dysregulation of epigenetic related genes in Diabetic Trigger finger Patients; preliminary analysis of Patient-Derived Samples. Biomol. Concepts 2020, 11, 221–229. [Google Scholar] [CrossRef]
- Abate, M.; Schiavone, C.; Salini, V.; Andia, I. Occurrence of tendon pathologies in metabolic disorders. Rheumatology 2013, 52, 599–608. [Google Scholar] [CrossRef] [Green Version]
- Lundin, A.C.; Aspenberg, P.; Eliasson, P. Trigger finger, tendinosis, and intratendinous gene expression. Scand. J. Med. Sci. Sports 2014, 24, 363–368. [Google Scholar] [CrossRef]
- Kulkarni, M.M. Digital multiplexed gene expression analysis using the NanoString nCounter system. Curr. Protoc. Mol. Biol. 2011, 94, 25B.10.1–25B.10.17. [Google Scholar] [CrossRef]
- Geiss, G.K.; Bumgarner, R.E.; Birditt, B.; Dahl, T.; Dowidar, N.; Dunaway, D.L.; Fell, H.P.; Ferree, S.; George, R.D.; Grogan, T.; et al. Direct multiplexed measurement of gene expression with color-coded probe pairs. Nat. Biotechnol. 2008, 26, 317–325. [Google Scholar] [CrossRef]
- Veldman-Jones, M.H.; Brant, R.; Rooney, C.; Geh, C.; Emery, H.; Harbron, C.G.; Wappett, M.; Sharpe, A.; Dymond, M.; Barrett, J.C.; et al. Evaluating Robustness and Sensitivity of the NanoString Technologies nCounter Platform to Enable Multiplexed Gene Expression Analysis of Clinical Samples. Cancer Res. 2015, 75, 2587–2593. [Google Scholar] [CrossRef] [Green Version]
- Saba, N.F.; Wilson, M.; Doho, G.; DaSilva, J.; Benjamin Isett, R.; Newman, S.; Chen, Z.G.; Magliocca, K.; Rossi, M.R. Mutation and Transcriptional Profiling of Formalin-Fixed Paraffin Embedded Specimens as Companion Methods to Immunohistochemistry for Determining Therapeutic Targets in Oropharyngeal Squamous Cell Carcinoma (OPSCC): A Pilot of Proof of Principle. Head Neck Pathol. 2015, 9, 223–235. [Google Scholar] [CrossRef] [PubMed] [Green Version]
- Scott, D.W.; Chan, F.C.; Hong, F.; Rogic, S.; Tan, K.L.; Meissner, B.; Ben-Neriah, S.; Boyle, M.; Kridel, R.; Telenius, A.; et al. Gene expression-based model using formalin-fixed paraffin-embedded biopsies predicts overall survival in advanced-stage classical Hodgkin lymphoma. J. Clin. Oncol. 2013, 31, 692–700. [Google Scholar] [CrossRef] [PubMed] [Green Version]
- Norton, N.; Sun, Z.; Asmann, Y.W.; Serie, D.J.; Necela, B.M.; Bhagwate, A.; Jen, J.; Eckloff, B.W.; Kalari, K.R.; Thompson, K.J.; et al. Gene expression, single nucleotide variant and fusion transcript discovery in archival material from breast tumors. PLoS ONE 2013, 8, e81925. [Google Scholar] [CrossRef] [PubMed]
- Nielsen, T.; Wallden, B.; Schaper, C.; Ferree, S.; Liu, S.; Gao, D.; Barry, G.; Dowidar, N.; Maysuria, M.; Storhoff, J. Analytical validation of the PAM50-based Prosigna Breast Cancer Prognostic Gene Signature Assay and nCounter Analysis System using formalin-fixed paraffin-embedded breast tumor specimens. BMC Cancer 2014, 14, 177. [Google Scholar] [CrossRef] [Green Version]
- Dowsett, M.; Sestak, I.; Lopez-Knowles, E.; Sidhu, K.; Dunbier, A.K.; Cowens, J.W.; Ferree, S.; Storhoff, J.; Schaper, C.; Cuzick, J. Comparison of PAM50 risk of recurrence score with oncotype DX and IHC4 for predicting risk of distant recurrence after endocrine therapy. J. Clin. Oncol. 2013, 31, 2783–2790. [Google Scholar] [CrossRef]
- Xu, W.; Solis, N.V.; Filler, S.G.; Mitchell, A.P. Pathogen Gene Expression Profiling During Infection Using a Nanostring nCounter Platform. Methods Mol. Biol. 2016, 1361, 57–65. [Google Scholar] [CrossRef] [Green Version]
- Tsang, H.F.; Xue, V.W.; Koh, S.P.; Chiu, Y.M.; Ng, L.P.; Wong, S.C. NanoString, a novel digital color-coded barcode technology: Current and future applications in molecular diagnostics. Expert Rev. Mol. Diagn. 2017, 17, 95–103. [Google Scholar] [CrossRef] [PubMed]
- Zychowicz, M.E. A closer look at hand and wrist complaints. Nurse Pract. 2013, 38, 46–53. [Google Scholar] [CrossRef] [PubMed]
- Frantz, C.; Stewart, K.M.; Weaver, V.M. The extracellular matrix at a glance. J. Cell Sci. 2010, 123, 4195–4200. [Google Scholar] [CrossRef] [Green Version]
- Gordon, M.K.; Hahn, R.A. Collagens. Cell Tissue Res. 2010, 339, 247–257. [Google Scholar] [CrossRef] [PubMed]
- Kadler, K.E.; Baldock, C.; Bella, J.; Boot-Handford, R.P. Collagens at a glance. J. Cell Sci. 2007, 120, 1955–1958. [Google Scholar] [CrossRef] [Green Version]
- Rozario, T.; DeSimone, D.W. The extracellular matrix in development and morphogenesis: A dynamic view. Dev. Biol. 2010, 341, 126–140. [Google Scholar] [CrossRef] [Green Version]
- Birch, H.L.; Bailey, A.J.; Goodship, A.E. Macroscopic ’degeneration’ of equine superficial digital flexor tendon is accompanied by a change in extracellular matrix composition. Equine Vet. J. 1998, 30, 534–539. [Google Scholar] [CrossRef]
- Mead, M.P.; Gumucio, J.P.; Awan, T.M.; Mendias, C.L.; Sugg, K.B. Pathogenesis and Management of Tendinopathies in Sports Medicine. Transl. Sports Med. 2018, 1, 5–13. [Google Scholar] [CrossRef]
- Riley, G.P.; Harrall, R.L.; Constant, C.R.; Chard, M.D.; Cawston, T.E.; Hazleman, B.L. Tendon degeneration and chronic shoulder pain: Changes in the collagen composition of the human rotator cuff tendons in rotator cuff tendinitis. Ann. Rheum. Dis. 1994, 53, 359–366. [Google Scholar] [CrossRef]
- Nagase, H.; Visse, R.; Murphy, G. Structure and function of matrix metalloproteinases and TIMPs. Cardiovasc. Res. 2006, 69, 562–573. [Google Scholar] [CrossRef] [Green Version]
- Newby, A.C. Dual role of matrix metalloproteinases (matrixins) in intimal thickening and atherosclerotic plaque rupture. Physiol. Rev. 2005, 85, 1–31. [Google Scholar] [CrossRef] [Green Version]
- Visse, R.; Nagase, H. Matrix metalloproteinases and tissue inhibitors of metalloproteinases: Structure, function, and biochemistry. Circ. Res. 2003, 92, 827–839. [Google Scholar] [CrossRef] [Green Version]
- Ye, S.; Eriksson, P.; Hamsten, A.; Kurkinen, M.; Humphries, S.E.; Henney, A.M. Progression of coronary atherosclerosis is associated with a common genetic variant of the human stromelysin-1 promoter which results in reduced gene expression. J. Biol. Chem. 1996, 271, 13055–13060. [Google Scholar] [CrossRef] [Green Version]
- Flores-Pliego, A.; Espejel-Nunez, A.; Castillo-Castrejon, M.; Meraz-Cruz, N.; Beltran-Montoya, J.; Zaga-Clavellina, V.; Nava-Salazar, S.; Sanchez-Martinez, M.; Vadillo-Ortega, F.; Estrada-Gutierrez, G. Matrix Metalloproteinase-3 (MMP-3) Is an Endogenous Activator of the MMP-9 Secreted by Placental Leukocytes: Implication in Human Labor. PLoS ONE 2015, 10, e0145366. [Google Scholar] [CrossRef] [Green Version]
- Sternlicht, M.D.; Bissell, M.J.; Werb, Z. The matrix metalloproteinase stromelysin-1 acts as a natural mammary tumor promoter. Oncogene 2000, 19, 1102–1113. [Google Scholar] [CrossRef] [Green Version]
- Milner, J.M.; Elliott, S.F.; Cawston, T.E. Activation of procollagenases is a key control point in cartilage collagen degradation: Interaction of serine and metalloproteinase pathways. Arthritis Rheum. 2001, 44, 2084–2096. [Google Scholar] [CrossRef]
- Riley, G.P.; Curry, V.; DeGroot, J.; van El, B.; Verzijl, N.; Hazleman, B.L.; Bank, R.A. Matrix metalloproteinase activities and their relationship with collagen remodelling in tendon pathology. Matrix Biol. 2002, 21, 185–195. [Google Scholar] [CrossRef] [Green Version]
- Riley, G. Tendinopathy--from basic science to treatment. Nat. Clin. Pract. Rheumatol. 2008, 4, 82–89. [Google Scholar] [CrossRef] [Green Version]
- Wynn, T.A. Cellular and molecular mechanisms of fibrosis. J. Pathol. 2008, 214, 199–210. [Google Scholar] [CrossRef] [Green Version]
- Graham, J.G.; Wang, M.L.; Rivlin, M.; Beredjiklian, P.K. Biologic and mechanical aspects of tendon fibrosis after injury and repair. Connect. Tissue Res. 2019, 60, 10–20. [Google Scholar] [CrossRef] [PubMed]
- Hinz, B. Formation and function of the myofibroblast during tissue repair. J. Investig. Dermatol. 2007, 127, 526–537. [Google Scholar] [CrossRef]
- Ceran, F.; Basat, S.O.; Basaran, K.; Saydam, F.A. Five-Years Trigger Finger Due to Partial Flexor Tendon Laceration in a Child. J. Hand Microsurg. 2015, 7, 228–229. [Google Scholar] [CrossRef] [PubMed] [Green Version]
- Nichols, A.E.C.; Best, K.T.; Loiselle, A.E. The cellular basis of fibrotic tendon healing: Challenges and opportunities. Transl. Res. 2019, 209, 156–168. [Google Scholar] [CrossRef] [PubMed]
- O’Gorman, D.B.; Vi, L.; Gan, B.S. Molecular mechanisms and treatment strategies for Dupuytren’s disease. Ther. Clin. Risk Manag. 2010, 6, 383–390. [Google Scholar] [CrossRef] [Green Version]
- Badalamente, M.A.; Sampson, S.P.; Hurst, L.C.; Dowd, A.; Miyasaka, K. The role of transforming growth factor beta in Dupuytren’s disease. J. Hand Surg. Am. 1996, 21, 210–215. [Google Scholar] [CrossRef]
- Kloen, P.; Jennings, C.L.; Gebhardt, M.C.; Springfield, D.S.; Mankin, H.J. Transforming growth factor-beta: Possible roles in Dupuytren’s contracture. J. Hand Surg. Am. 1995, 20, 101–108. [Google Scholar] [CrossRef]
- Zhou, C.; Liu, F.; Gallo, P.H.; Baratz, M.E.; Kathju, S.; Satish, L. Anti-fibrotic action of pirfenidone in Dupuytren’s disease-derived fibroblasts. BMC Musculoskelet. Disord. 2016, 17, 469. [Google Scholar] [CrossRef] [Green Version]
- Akhmetshina, A.; Palumbo, K.; Dees, C.; Bergmann, C.; Venalis, P.; Zerr, P.; Horn, A.; Kireva, T.; Beyer, C.; Zwerina, J.; et al. Activation of canonical Wnt signalling is required for TGF-beta-mediated fibrosis. Nat. Commun. 2012, 3, 735. [Google Scholar] [CrossRef] [PubMed] [Green Version]
- Cheon, S.S.; Nadesan, P.; Poon, R.; Alman, B.A. Growth factors regulate beta-catenin-mediated TCF-dependent transcriptional activation in fibroblasts during the proliferative phase of wound healing. Exp. Cell Res. 2004, 293, 267–274. [Google Scholar] [CrossRef]
- Piersma, B.; Bank, R.A.; Boersema, M. Signaling in Fibrosis: TGF-beta, WNT, and YAP/TAZ Converge. Front. Med. (Lausanne) 2015, 2, 59. [Google Scholar] [CrossRef]
- Guo, Y.; Xiao, L.; Sun, L.; Liu, F. Wnt/beta-catenin signaling: A promising new target for fibrosis diseases. Physiol. Res. 2012, 61, 337–346. [Google Scholar] [CrossRef] [PubMed]
- Classen, D.A.; Hurst, L.N. Plantar fibromatosis and bilateral flexion contractures: A review of the literature. Ann. Plast. Surg. 1992, 28, 475–478. [Google Scholar] [CrossRef]
- Donato, R.R.; Morrison, W.A. Dupuytren’s disease in the feet causing flexion contractures in the toes. J. Hand Surg. Br. 1996, 21, 364–366. [Google Scholar] [CrossRef]
- Bunker, T.D.; Reilly, J.; Baird, K.S.; Hamblen, D.L. Expression of growth factors, cytokines and matrix metalloproteinases in frozen shoulder. J. Bone Jt. Surg. Br. 2000, 82, 768–773. [Google Scholar] [CrossRef]
- Bunker, T.D.; Anthony, P.P. The pathology of frozen shoulder. A Dupuytren-like disease. J. Bone Joint Surg. Br. 1995, 77, 677–683. [Google Scholar] [CrossRef] [PubMed]
- Smith, S.P.; Devaraj, V.S.; Bunker, T.D. The association between frozen shoulder and Dupuytren’s disease. J. Shoulder Elbow Surg. 2001, 10, 149–151. [Google Scholar] [CrossRef] [Green Version]
- Qian, A.; Meals, R.A.; Rajfer, J.; Gonzalez-Cadavid, N.F. Comparison of gene expression profiles between Peyronie’s disease and Dupuytren’s contracture. Urology 2004, 64, 399–404. [Google Scholar] [CrossRef]
- Carrieri, M.P.; Serraino, D.; Palmiotto, F.; Nucci, G.; Sasso, F. A case-control study on risk factors for Peyronie’s disease. J. Clin. Epidemiol. 1998, 51, 511–515. [Google Scholar] [CrossRef]
- Chuang, L.S.; Ito, K.; Ito, Y. RUNX family: Regulation and diversification of roles through interacting proteins. Int. J. Cancer 2013, 132, 1260–1271. [Google Scholar] [CrossRef]
- Cai, X.; Gao, L.; Teng, L.; Ge, J.; Oo, Z.M.; Kumar, A.R.; Gilliland, D.G.; Mason, P.J.; Tan, K.; Speck, N.A. Runx1 Deficiency Decreases Ribosome Biogenesis and Confers Stress Resistance to Hematopoietic Stem and Progenitor Cells. Cell Stem Cell 2015, 17, 165–177. [Google Scholar] [CrossRef] [PubMed] [Green Version]
- Kim, W.; Barron, D.A.; San Martin, R.; Chan, K.S.; Tran, L.L.; Yang, F.; Ressler, S.J.; Rowley, D.R. RUNX1 is essential for mesenchymal stem cell proliferation and myofibroblast differentiation. Proc. Natl. Acad. Sci. USA 2014, 111, 16389–16394. [Google Scholar] [CrossRef] [Green Version]
- Yakar, S.; Rosen, C.J.; Beamer, W.G.; Ackert-Bicknell, C.L.; Wu, Y.; Liu, J.L.; Ooi, G.T.; Setser, J.; Frystyk, J.; Boisclair, Y.R.; et al. Circulating levels of IGF-1 directly regulate bone growth and density. J. Clin. Investig. 2002, 110, 771–781. [Google Scholar] [CrossRef] [PubMed]
- Kim, M.S.; Lee, D.Y. Insulin-like growth factor (IGF)-I and IGF binding proteins axis in diabetes mellitus. Ann. Pediatr. Endocrinol. Metab. 2015, 20, 69–73. [Google Scholar] [CrossRef] [Green Version]
- Dahlgren, L.A.; van der Meulen, M.C.; Bertram, J.E.; Starrak, G.S.; Nixon, A.J. Insulin-like growth factor-I improves cellular and molecular aspects of healing in a collagenase-induced model of flexor tendinitis. J. Orthop. Res. 2002, 20, 910–919. [Google Scholar] [CrossRef]
- Kurtz, C.A.; Loebig, T.G.; Anderson, D.D.; DeMeo, P.J.; Campbell, P.G. Insulin-like growth factor I accelerates functional recovery from Achilles tendon injury in a rat model. Am. J. Sports Med. 1999, 27, 363–369. [Google Scholar] [CrossRef] [PubMed] [Green Version]
- Achar, R.A.; Silva, T.C.; Achar, E.; Martines, R.B.; Machado, J.L. Use of insulin-like growth factor in the healing of open wounds in diabetic and non-diabetic rats. Acta Cirurgica Bras. 2014, 29, 125–131. [Google Scholar] [CrossRef] [PubMed] [Green Version]


| Patient Group | Patient Age | Patient Gender | |
|---|---|---|---|
| Control | Carpal tunnel | 35 | Female |
| Carpal tunnel | 37 | Female | |
| Carpal tunnel | 44 | Female | |
| Carpal tunnel | 51 | Female | |
| Experimental | Trigger finger | 25 | Female |
| Trigger finger | 46 | Female | |
| Trigger finger | 52 | Female | |
| Trigger finger | 40 | Female |
| Gene | Fold Change (Log2) | p-Value | Genetic Pathway Impacted |
|---|---|---|---|
| MMP3-mRNA | −3.27 | 0.0178 | Transcriptional misregulation |
| NODAL-mRNA | −2.4 | 0.0204 | TGF-beta |
| HMGA2-mRNA | −2.28 | 0.00211 | Transcriptional misregulation |
| CACNA1E-mRNA | −2.19 | 0.0238 | MAPK |
| LEFTY1-mRNA | −1.95 | 0.00994 | TGF-beta |
| FGF22-mRNA | −1.9 | 0.0165 | MAPK, PI3K, Ras |
| CASP10-mRNA | −1.88 | 0.0171 | Cell cycle/apoptosis |
| FGF21-mRNA | −1.79 | 0.00372 | MAPK, PI3K, Ras |
| KIT-mRNA | −1.78 | 0.018 | Driver gene, PI3K, Ras |
| FGFR2-mRNA | −1.75 | 0.00455 | Driver gene, MAPK, PI3K, Ras |
| IL7R-mRNA | −1.65 | 0.00693 | JAK/STAT, PI3K |
| DKK4-mRNA | −1.58 | 0.0074 | Wnt |
| WNT2-mRNA | −1.57 | 0.0359 | Hedgehog, Wnt |
| EFNA3-mRNA | −1.54 | 0.033 | PI3K, Ras |
| WIF1-mRNA | −1.53 | 0.00555 | Wnt |
| WNT6-mRNA | −1.53 | 0.0163 | Hedgehog, Wnt |
| C19orf40-mRNA | −1.5 | 0.0179 | DNA damage repair |
| HMGA1-mRNA | −1.48 | 0.0274 | Chromatin modification |
| CREBBP-mRNA | −1.46 | 0.0269 | Cell cycle/apoptosis, chromatin modification, driver gene, JAK/STAT, Notch, TGF-beta, Wnt |
| CDKN2D-mRNA | −1.45 | 0.0453 | Cell cycle/apoptosis |
| NF2-mRNA | 1.48 | 0.00508 | Driver gene |
| RELA-mRNA | 1.53 | 0.000445 | Cell cycle/apoptosis, MAPK, PI3K, Ras, transcriptional misregulation |
| PRKDC-mRNA | 1.53 | 0.0196 | Cell cycle/apoptosis, DNA damage repair |
| IL8-mRNA | 1.53 | 0.0255 | Transcriptional misregulation |
| MAD2L2-mRNA | 1.53 | 0.034 | Cell cycle/apoptosis, DNA damage repair |
| GADD45A-mRNA | 1.55 | 0.0111 | Cell cycle/apoptosis, MAPK |
| CIC-mRNA | 1.56 | 0.0437 | Driver gene |
| ITGA9-mRNA | 1.58 | 0.0335 | PI3K |
| SOX9-mRNA | 1.6 | 0.0253 | Driver gene |
| LIFR-mRNA | 1.61 | 0.017 | JAK/STAT |
| RAD21-mRNA | 1.64 | 0.00194 | Cell cycle/apoptosis |
| KRAS-mRNA | 1.68 | 0.0362 | Driver gene, MAPK, PI3K, Ras |
| ITGA2-mRNA | 1.68 | 0.0454 | PI3K |
| MLF1-mRNA | 1.69 | 0.00669 | Transcriptional misregulation |
| CASP3-mRNA | 1.71 | 0.0358 | Cell cycle/apoptosis, MAPK |
| ITGB4-mRNA | 1.72 | 0.0277 | PI3K |
| IL1R1-mRNA | 1.73 | 0.0188 | Cell cycle/apoptosis, MAPK |
| IRAK3-mRNA | 1.8 | 0.0103 | Cell cycle/apoptosis |
| CBL-mRNA | 1.8 | 0.0104 | Driver gene, JAK-STAT |
| PPP2R1A-mRNA | 1.85 | 0.0189 | Driver gene, PI3K, TGF-beta |
| IGFBP3-mRNA | 1.86 | 0.00613 | Transcriptional misregulation |
| JAK2-mRNA | 1.88 | 0.0343 | Driver gene, JAK/STAT, PI3K |
| FLT1-mRNA | 1.91 | 0.00971 | PI3K, Ras, transcriptional misregulation |
| HIST1H3H-mRNA | 1.92 | 0.00669 | transcriptional misregulation |
| NBN-mRNA | 1.92 | 0.00744 | DNA damage repair |
| TGFBR2-mRNA | 1.92 | 0.0237 | MAPK, TGF-beta, transcriptional misregulation |
| PLCB1-mRNA | 1.95 | 0.0264 | Wnt |
| MSH6-mRNA | 1.95 | 0.0378 | Driver gene |
| PPP3CA-mRNA | 1.95 | 0.0439 | Cell cycle/apoptosis, MAPK, Wnt |
| SF3B1-mRNA | 1.96 | 0.00297 | Driver gene |
| PIM1-mRNA | 1.96 | 0.0259 | JAK/STAT |
| SMAD3-mRNA | 1.99 | 0.0401 | Cell cycle/apoptosis, TGF-beta, Wnt |
| RAC1-mRNA | 2.03 | 0.00555 | MAPK, PI3K, Ras, Wnt |
| TNFRSF10B-mRNA | 2.03 | 0.00899 | Cell cycle/apoptosis |
| BAP1-mRNA | 2.04 | 0.00136 | Driver gene |
| PHF6-mRNA | 2.05 | 0.0458 | Driver gene |
| IGF1-mRNA | 2.06 | 0.00101 | PI3K, Ras, transcriptional misregulation |
| CDKN1C-mRNA | 2.06 | 0.0272 | Cell cycle/apoptosis |
| AKT3-mRNA | 2.1 | 0.00292 | Cell cycle/apoptosis, JAK/STAT, MAPK, PI3K, Ras |
| ITGA6-mRNA | 2.1 | 0.0114 | PI3K |
| CHUK-mRNA | 2.1 | 0.024 | Cell cycle/apoptosis, MAPK, PI3K, Ras |
| TRAF7-mRNA | 2.12 | 0.000721 | Driver gene |
| ID2-mRNA | 2.12 | 0.0228 | TGF-beta, transcriptional misregulation |
| PLCB4-mRNA | 2.13 | 0.00622 | Wnt |
| HSPB1-mRNA | 2.13 | 0.0118 | MAPK |
| PLAU-mRNA | 2.14 | 0.00723 | Transcriptional misregulation |
| SMAD2-mRNA | 2.16 | 0.000491 | Cell cycle/apoptosis, driver gene, TGF-beta |
| ERBB2-mRNA | 2.16 | 0.000777 | Driver gene |
| SMAD4-mRNA | 2.18 | 0.0016 | Cell cycle/apoptosis, driver gene, TGF-beta, Wnt |
| SOS2-mRNA | 2.18 | 0.00433 | JAK/STAT, MAPK, PI3K, Ras |
| SMC1A-mRNA | 2.19 | 0.0477 | Cell cycle/apoptosis |
| NFE2L2-mRNA | 2.2 | 0.0119 | Driver gene |
| MAPK3-mRNA | 2.21 | 0.0218 | MAPK, PI3K, Ras, TGF-beta |
| MDM2-mRNA | 2.21 | 0.0312 | Driver gene, cell cycle |
| VHL-mRNA | 2.23 | 0.00957 | Driver gene |
| NUPR1-mRNA | 2.26 | 0.035 | Transcriptional misregulation |
| ATR-mRNA | 2.28 | 0.0314 | Cell cycle/apoptosis |
| DDB2-mRNA | 2.31 | 0.006 | DNA damage repair |
| BMP4-mRNA | 2.32 | 0.0498 | Hedgehog, TGF-beta |
| CCND1-mRNA | 2.33 | 0.00471 | Cell cycle/apoptosis, JAK/STAT, PI3K, Wnt |
| SETBP1-mRNA | 2.34 | 0.0355 | Driver gene |
| SOCS3-mRNA | 2.36 | 0.0142 | JAK/STAT |
| PIK3R1-mRNA | 2.37 | 0.00782 | Cell cycle/apoptosis, driver gene, JAK/STAT, PI3K, Ras |
| KDM5C-mRNA | 2.37 | 0.0363 | Driver gene |
| RPS27A-mRNA | 2.38 | 0.000817 | DNA damage repair |
| MGMT-mRNA | 2.38 | 0.0256 | DNA damage repair |
| GADD45B-mRNA | 2.4 | 0.0134 | Cell cycle/apoptosis, MAPK |
| MAP3K12-mRNA | 2.4 | 0.0146 | Chromatin modification, MAPK |
| PIK3CA-mRNA | 2.41 | 0.00485 | Cell cycle/apoptosis, driver gene, JAK/STAT, PI3K, Ras |
| JAK1-mRNA | 2.43 | 0.000718 | Driver gene, JAK/STAT, PI3K |
| CASP7-mRNA | 2.44 | 0.00307 | Cell cycle/apoptosis |
| UBB-mRNA | 2.44 | 0.00569 | DNA damage repair |
| ITGB8-mRNA | 2.47 | 0.0405 | PI3K |
| PPP3R1-mRNA | 2.49 | 0.000224 | Cell cycle/apoptosis, MAPK, Wnt |
| H3F3C-mRNA | 2.49 | 0.00159 | Transcriptional misregulation |
| STAT3-mRNA | 2.51 | 0.00148 | JAK/STAT |
| BAX-mRNA | 2.51 | 0.0286 | Cell cycle/apoptosis |
| TGFB1-mRNA | 2.53 | 0.000504 | Cell cycle/apoptosis, MAPK, TGF-beta |
| B2M-mRNA | 2.54 | 0.0179 | Driver gene |
| TLR4-mRNA | 2.54 | 0.0197 | PI3K |
| RAF1-mRNA | 2.59 | 0.00964 | MAPK, PI3K, Ras |
| PDGFRA-mRNA | 2.6 | 0.000198 | Driver gene, MAPK, PI3K, Ras |
| NTRK2-mRNA | 2.61 | 0.000221 | MAPK |
| SHC1-mRNA | 2.61 | 0.000287 | Ras |
| IDH2-mRNA | 2.62 | 0.00638 | Driver gene |
| ID1-mRNA | 2.63 | 0.0264 | TGF-beta |
| PLA2G2A-mRNA | 2.66 | 0.00135 | Ras |
| COL2A1-mRNA | 2.67 | 0.0237 | PI3K |
| WHSC1-mRNA | 2.74 | 0.00194 | Transcriptional misregulation |
| AKT1-mRNA | 2.74 | 0.0204 | Cell cycle/apoptosis, driver gene, JAK/STAT, MAPK, PI3K, Ras |
| MMP9-mRNA | 2.75 | 0.0457 | Transcriptional misregulation |
| PPP3CB-mRNA | 2.76 | 0.00458 | Cell cycle/apoptosis, MAPK, Wnt |
| FGFR1-mRNA | 2.78 | 0.000128 | MAPK, PI3K, Ras |
| MAP2K2-mRNA | 2.79 | 0.00685 | MAPK, PI3K, Ras |
| RBX1-mRNA | 2.81 | 0.000656 | Cell cycle/apoptosis, TGF-beta, Wnt |
| JUN-mRNA | 2.83 | 0.0409 | MAPK, Wnt |
| SKP1-mRNA | 2.87 | 0.00236 | Cell cycle/apoptosis, TGF-beta, Wnt |
| ABL1-mRNA | 2.87 | 0.00756 | Cell cycle/apoptosis, driver gene, Ras |
| THBS1-mRNA | 2.9 | 0.00147 | PI3K, TGF-beta |
| KLF4-mRNA | 2.9 | 0.0365 | Driver gene |
| GNG12-mRNA | 2.95 | 0.000392 | MAPK, PI3K, Ras |
| PDGFD-mRNA | 2.97 | 0.00315 | PI3K, Ras |
| CHAD-mRNA | 3.04 | 0.00343 | PI3K |
| ITGB3-mRNA | 3.06 | 0.00124 | PI3K |
| BCL2L1-mRNA | 3.06 | 0.00476 | Cell cycle/apoptosis, JAK/STAT, PI3K, Ras, transcriptional misregulation |
| NCOR1-mRNA | 3.07 | 0.00525 | Driver gene, transcriptional misregulation |
| FZD7-mRNA | 3.08 | 0.000286 | Wnt |
| POLD4-mRNA | 3.12 | 0.0068 | DNA damage repair |
| PIK3R2-mRNA | 3.16 | 0.00277 | Cell cycle/apoptosis, JAK/STAT, PI3K, Ras |
| TGFB3-mRNA | 3.18 | 0.0156 | Cell cycle/apoptosis, MAPK, TGF-beta |
| PRKACA-mRNA | 3.18 | 0.023 | Cell cycle/apoptosis, Hedgehog, MAPK, Ras, Wnt |
| TBL1XR1-mRNA | 3.19 | 0.00635 | Wnt |
| GNAS-mRNA | 3.25 | 0.0106 | Driver gene |
| NOTCH2-mRNA | 3.27 | 0.000534 | Driver gene, Notch |
| COMP-mRNA | 3.35 | 0.00461 | PI3K |
| GRB2-mRNA | 3.36 | 0.000844 | JAK/STAT, MAPK, PI3K, Ras |
| CREB3L1-mRNA | 3.37 | 0.004 | PI3K |
| CAPN2-mRNA | 3.37 | 0.0124 | Cell cycle/apoptosis |
| CTNNB1-mRNA | 3.39 | 0.000293 | Driver gene, Wnt |
| COL5A1-mRNA | 3.41 | 0.0014 | PI3K |
| MAPK1-mRNA | 3.5 | 0.00372 | MAPK, PI3K, Ras, TGF-beta |
| GAS1-mRNA | 3.55 | 0.00546 | Hedgehog |
| ASXL1-mRNA | 3.57 | 0.00171 | Driver gene |
| HSP90B1-mRNA | 3.59 | 0.00724 | PI3K |
| FLNA-mRNA | 3.6 | 0.0216 | MAPK |
| FGF18-mRNA | 3.62 | 0.00578 | MAPK, PI3K, Ras |
| FUBP1-mRNA | 3.76 | 0.000322 | Driver gene |
| SETD2-mRNA | 3.82 | 0.000216 | Driver gene |
| FOS-mRNA | 3.85 | 0.0087 | MAPK |
| NFATC1-mRNA | 3.93 | 0.00254 | MAPK, Wnt |
| NF1-mRNA | 4.01 | 0.0015 | Driver gene, MAPK, Ras |
| PDGFRB-mRNA | 4.05 | 0.000298 | MAPK, PI3K, Ras |
| LTBP1-mRNA | 4.08 | 0.00571 | TGF-beta |
| NFKBIZ-mRNA | 4.43 | 0.00357 | Transcriptional misregulation |
| SFRP2-mRNA | 4.51 | 0.00414 | Wnt |
| COL11A1-mRNA | 4.58 | 0.00039 | PI3K |
| THBS4-mRNA | 4.63 | 0.00123 | PI3K |
| FN1-mRNA | 4.88 | 0.0102 | PI3K |
| COL1A2-mRNA | 4.98 | 0.000728 | PI3K |
| SFRP4-mRNA | 5.25 | 0.00414 | Wnt |
| AXIN2-mRNA | 5.47 | 1.58 × 10⁻⁸ | Wnt |
| RUNX1-mRNA | 5.54 | 0.000211 | Driver gene, transcriptional misregulation |
| COL1A1-mRNA | 5.85 | 0.000525 | PI3K |
| COL3A1-mRNA | 6.49 | 0.000381 | PI3K |
| COL5A2-mRNA | 6.7 | 2.35 × 10⁻⁵ | PI3K |
| Differential Expression in Trigger Finger vs. Baseline of Carpal Tunnel | |
|---|---|
| Wnt | 6.268 |
| Driver Gene | 3.382 |
| PI3K | 3.283 |
| MAPK | 3.086 |
| Ras | 3.053 |
| TGF-Beta | 2.951 |
| Cell Cycle—Apoptosis | 2.719 |
| Transcriptional Misregulation | 2.648 |
| JAK-STAT | 2.479 |
| Notch | 1.94 |
| DNA Damage—Repair | 1.625 |
| hromatin Modification | 0.579 |
| Hedgehog | 0.273 |
Publisher’s Note: MDPI stays neutral with regard to jurisdictional claims in published maps and institutional affiliations. |
© 2021 by the authors. Licensee MDPI, Basel, Switzerland. This article is an open access article distributed under the terms and conditions of the Creative Commons Attribution (CC BY) license (https://creativecommons.org/licenses/by/4.0/).
Share and Cite
Kolhe, R.; Ghilzai, U.; Mondal, A.K.; Pundkar, C.; Ahluwalia, P.; Sahajpal, N.S.; Chen, J.; Isales, C.M.; Fulcher, M.; Fulzele, S. Nanostring-Based Identification of the Gene Expression Profile in Trigger Finger Samples. Healthcare 2021, 9, 1592. https://doi.org/10.3390/healthcare9111592
Kolhe R, Ghilzai U, Mondal AK, Pundkar C, Ahluwalia P, Sahajpal NS, Chen J, Isales CM, Fulcher M, Fulzele S. Nanostring-Based Identification of the Gene Expression Profile in Trigger Finger Samples. Healthcare. 2021; 9(11):1592. https://doi.org/10.3390/healthcare9111592
Chicago/Turabian StyleKolhe, Ravindra, Umar Ghilzai, Ashis K. Mondal, Chetan Pundkar, Pankaj Ahluwalia, Nikhil S. Sahajpal, Jie Chen, Carlos M. Isales, Mark Fulcher, and Sadanand Fulzele. 2021. "Nanostring-Based Identification of the Gene Expression Profile in Trigger Finger Samples" Healthcare 9, no. 11: 1592. https://doi.org/10.3390/healthcare9111592