Multiple Ensemble Neural Network Models with Fuzzy Response Aggregation for Predicting COVID-19 Time Series: The Case of Mexico


Abstract
:1. Introduction
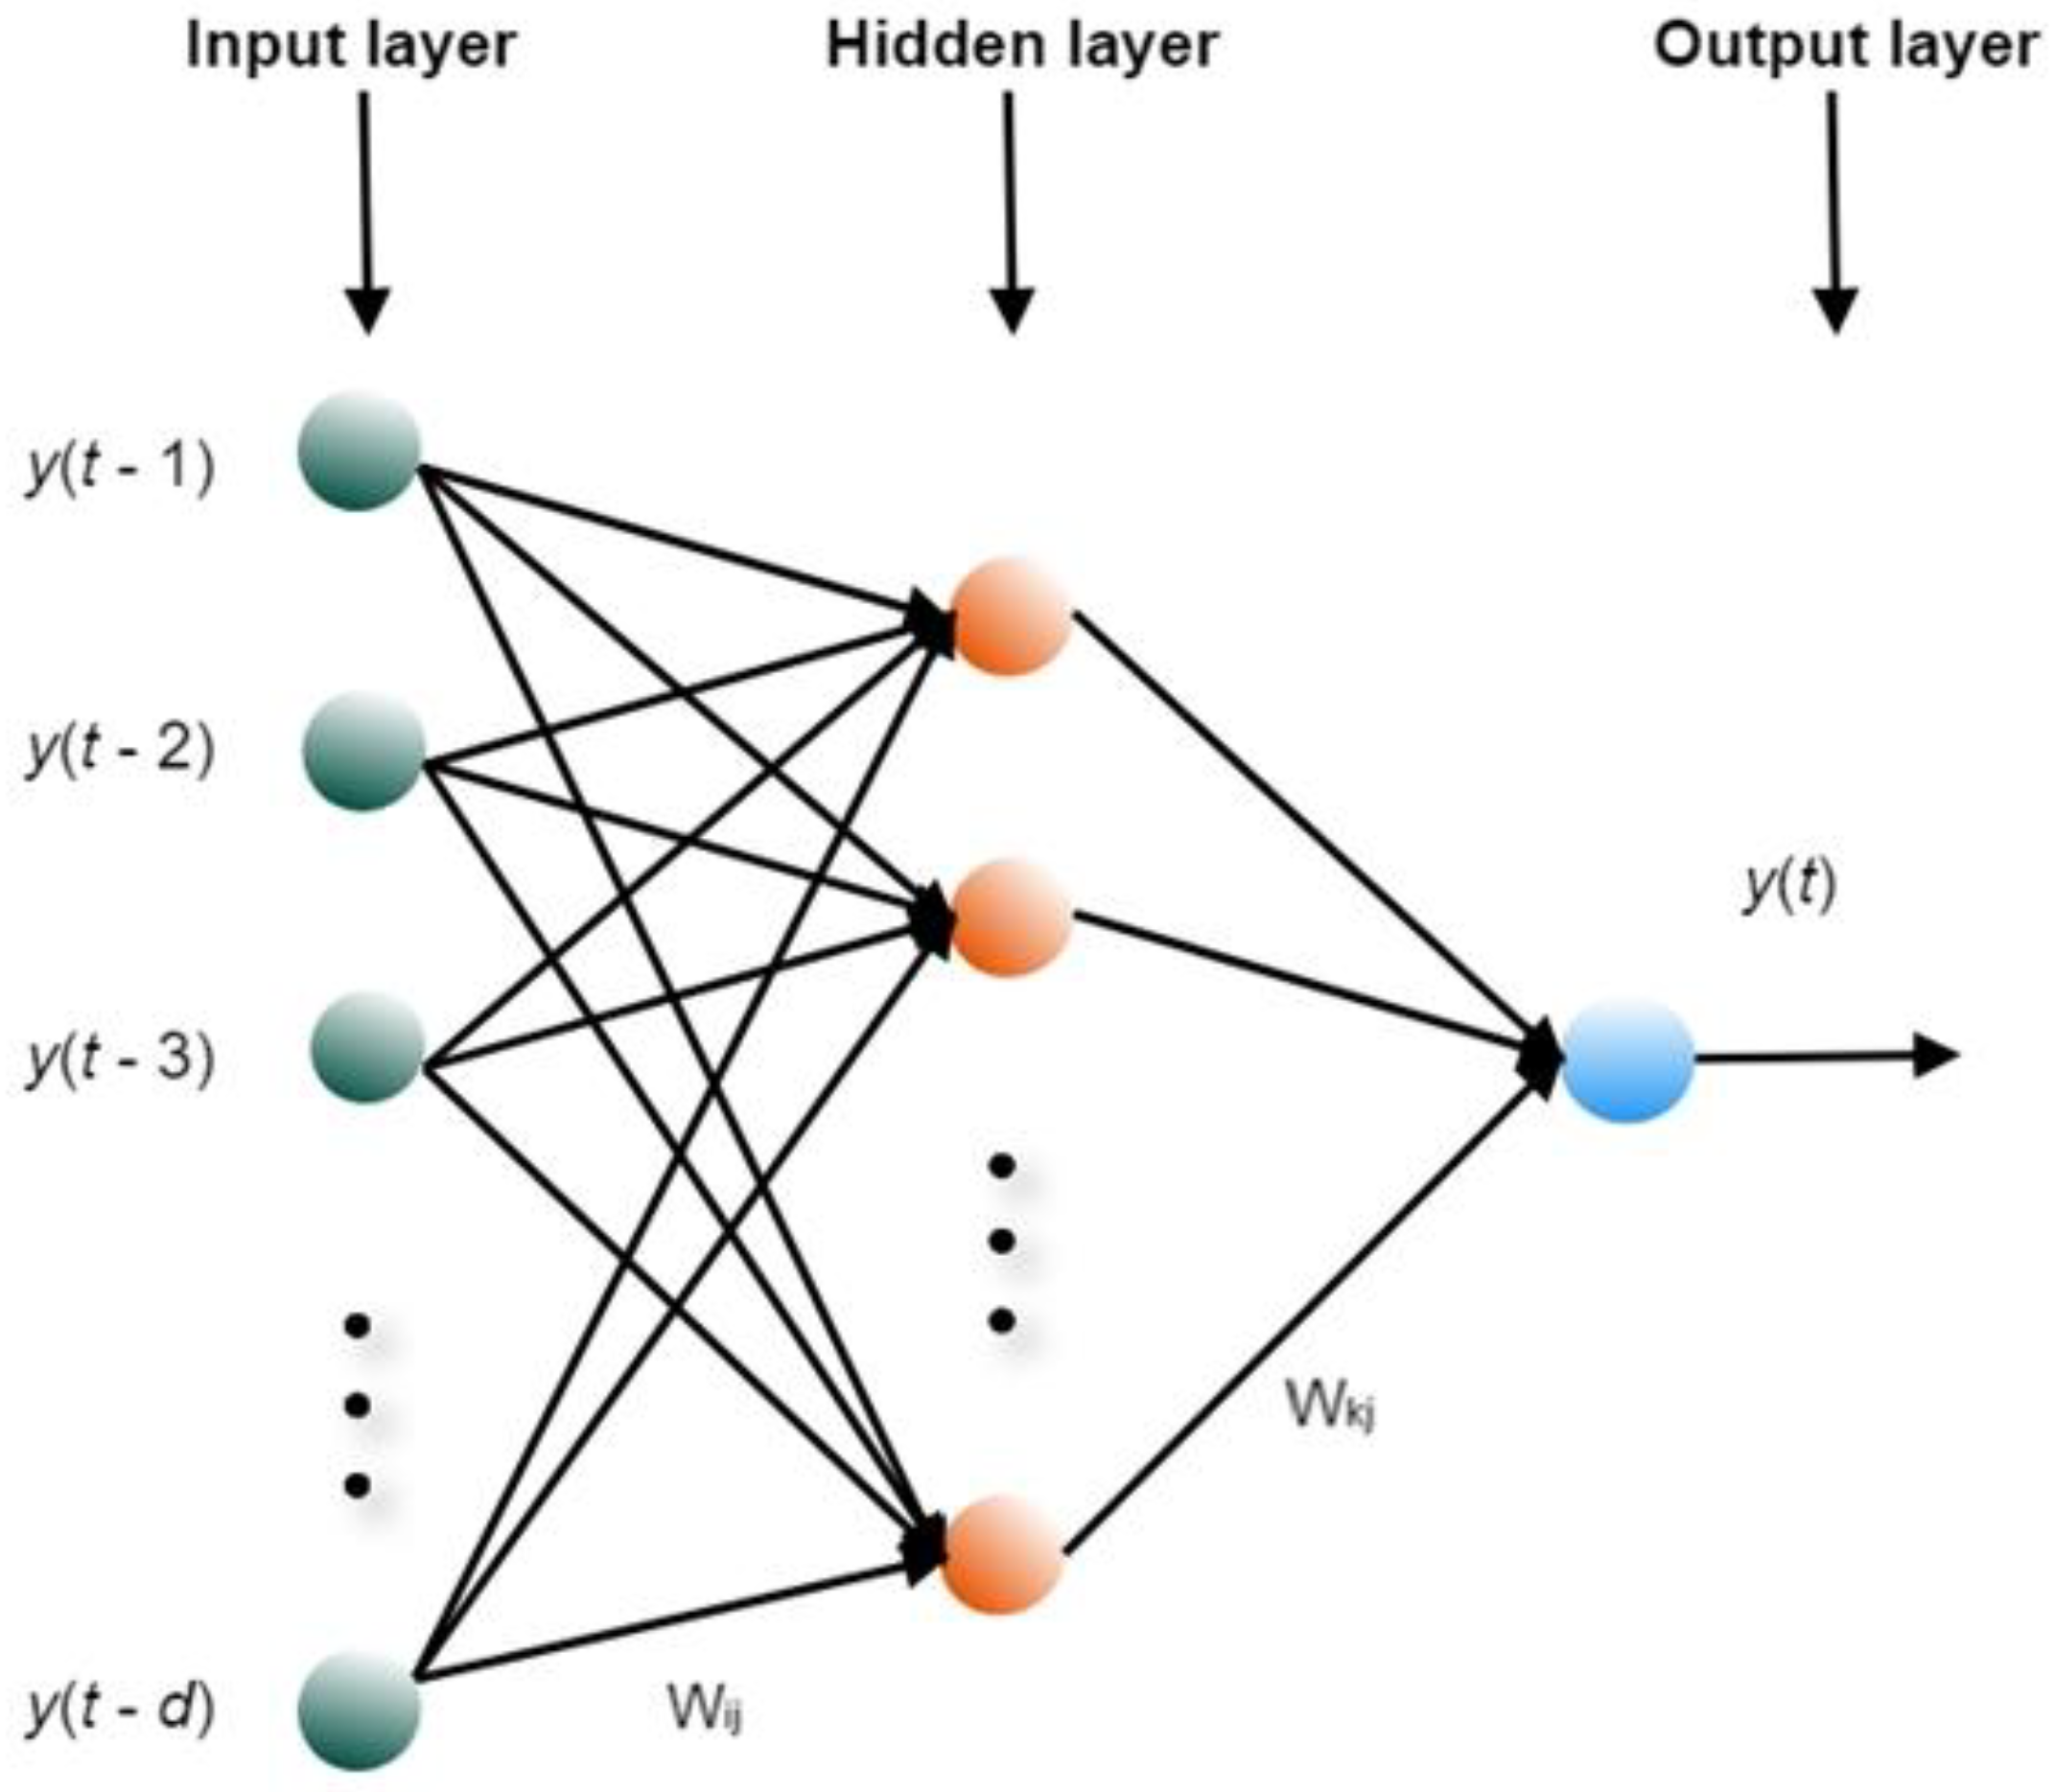
2. Nonlinear Autoregressive Neural Networks
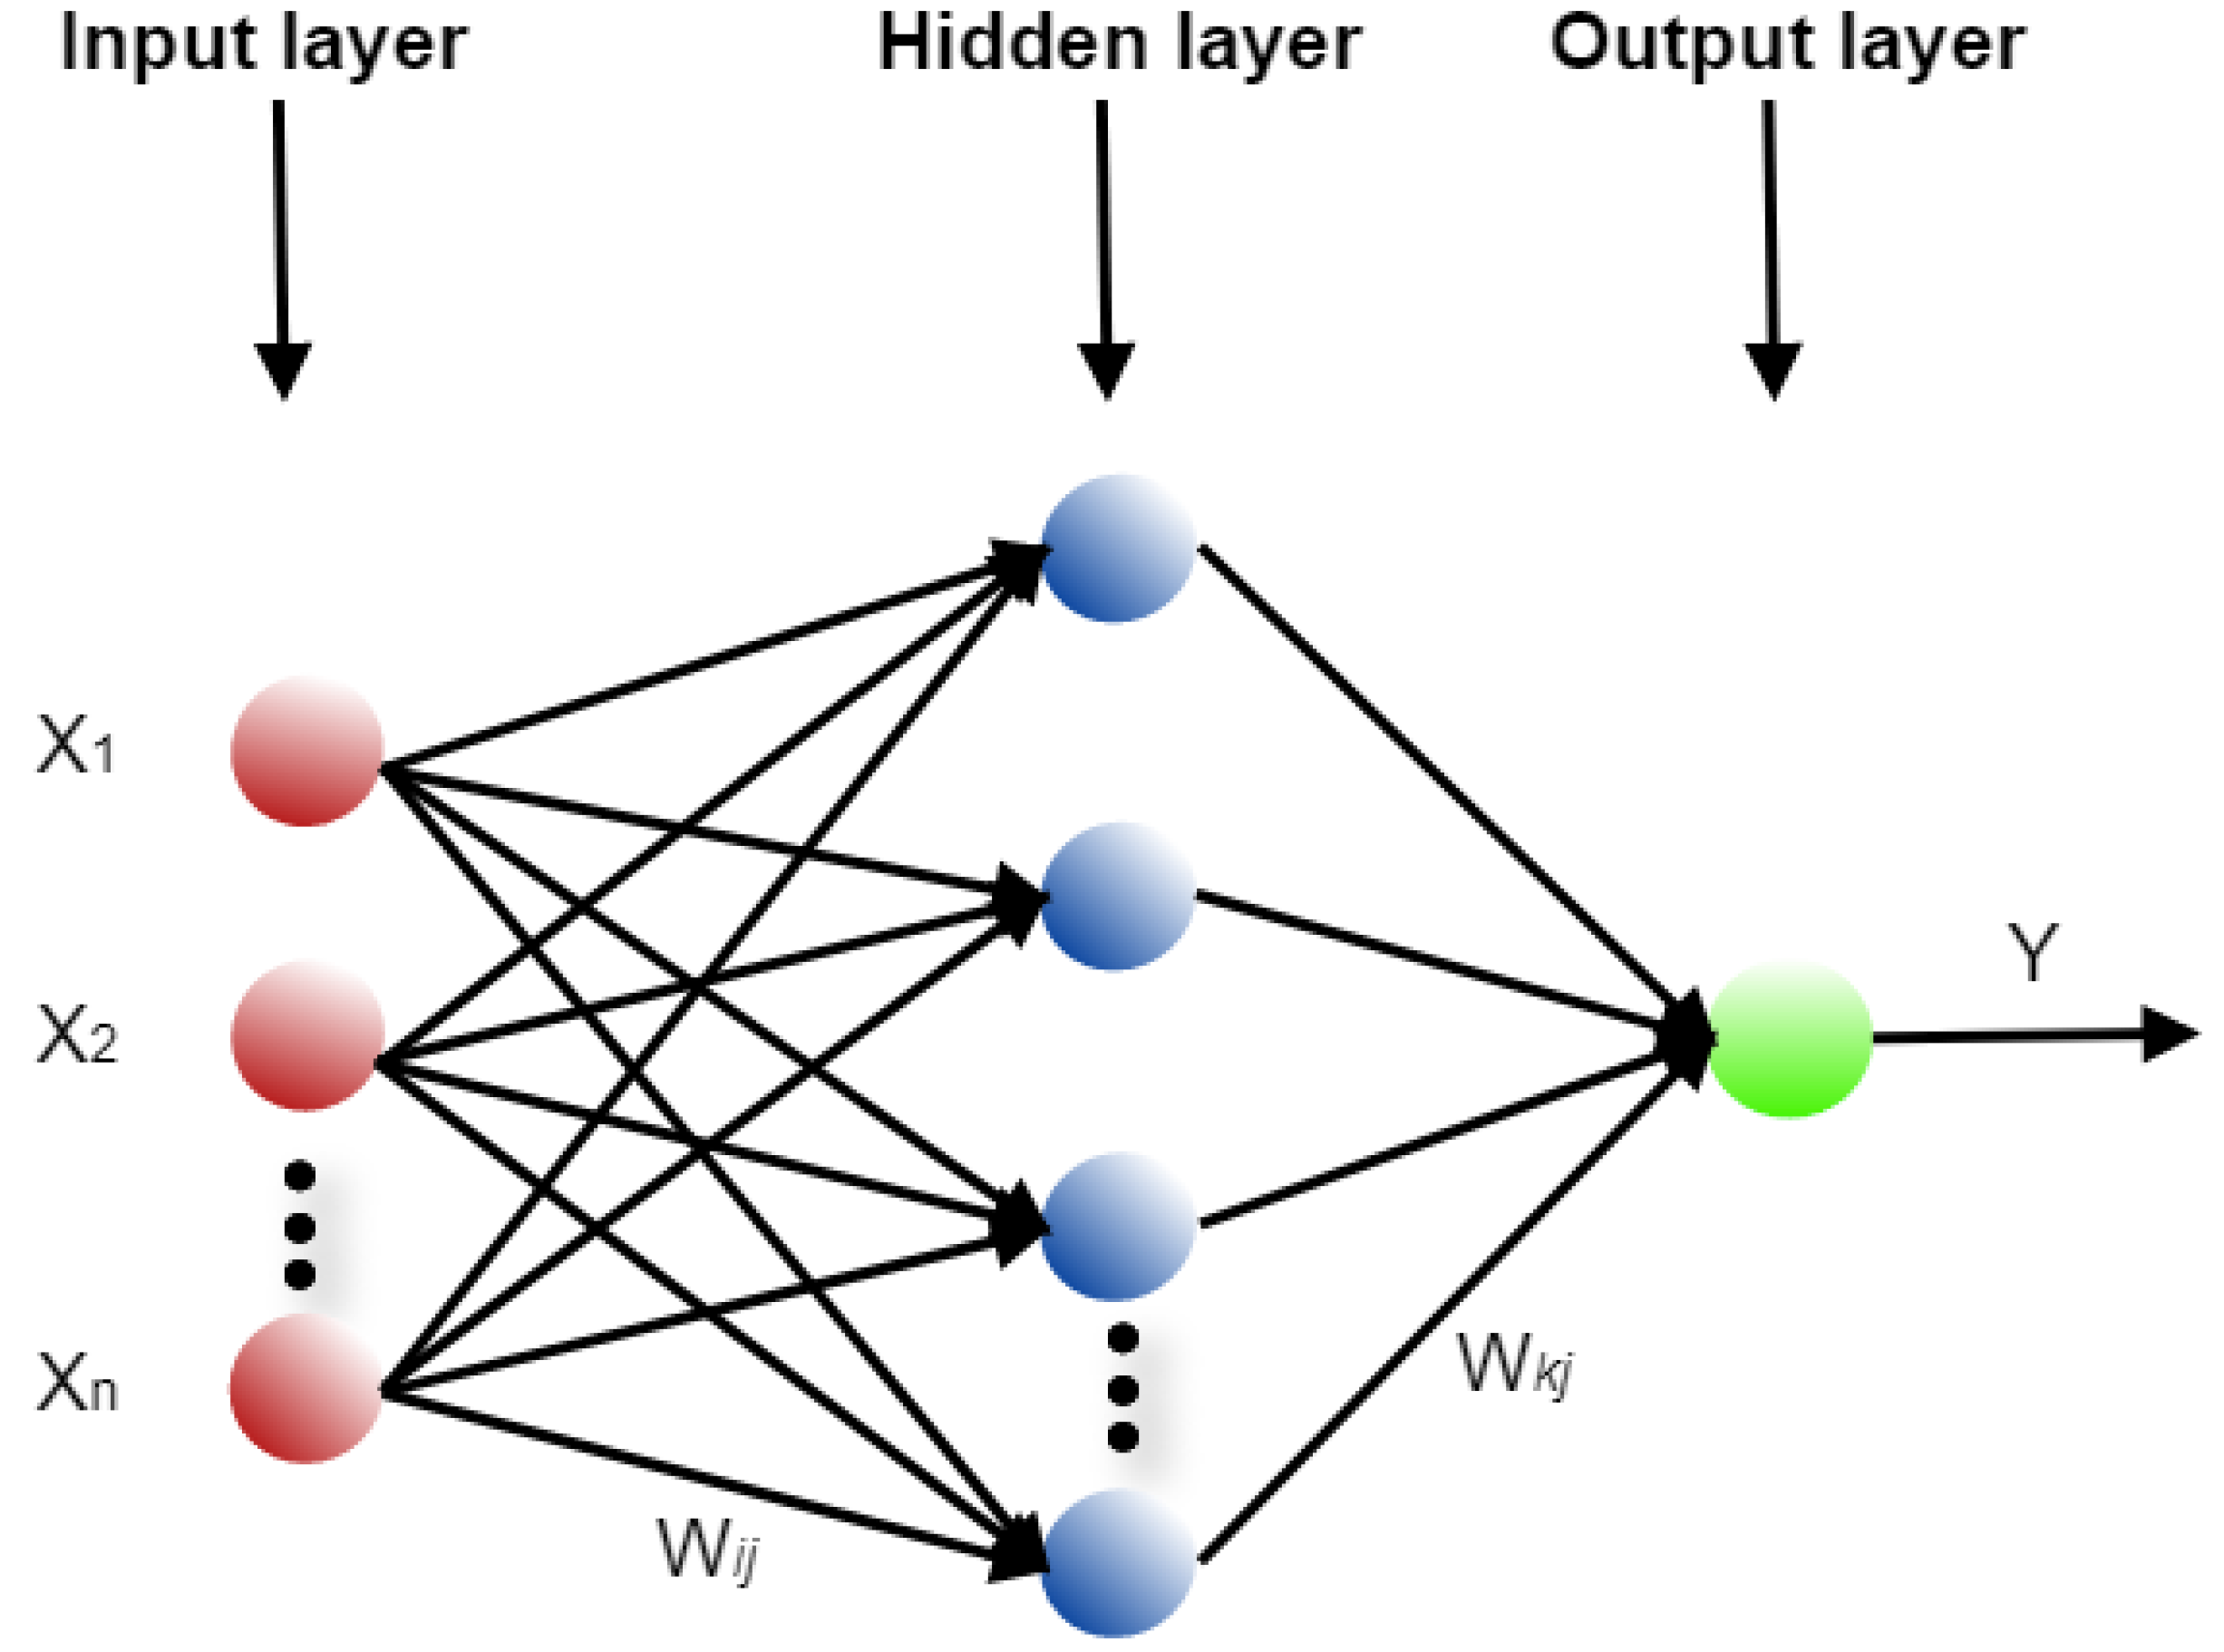
3. Function Fitting Neural Network
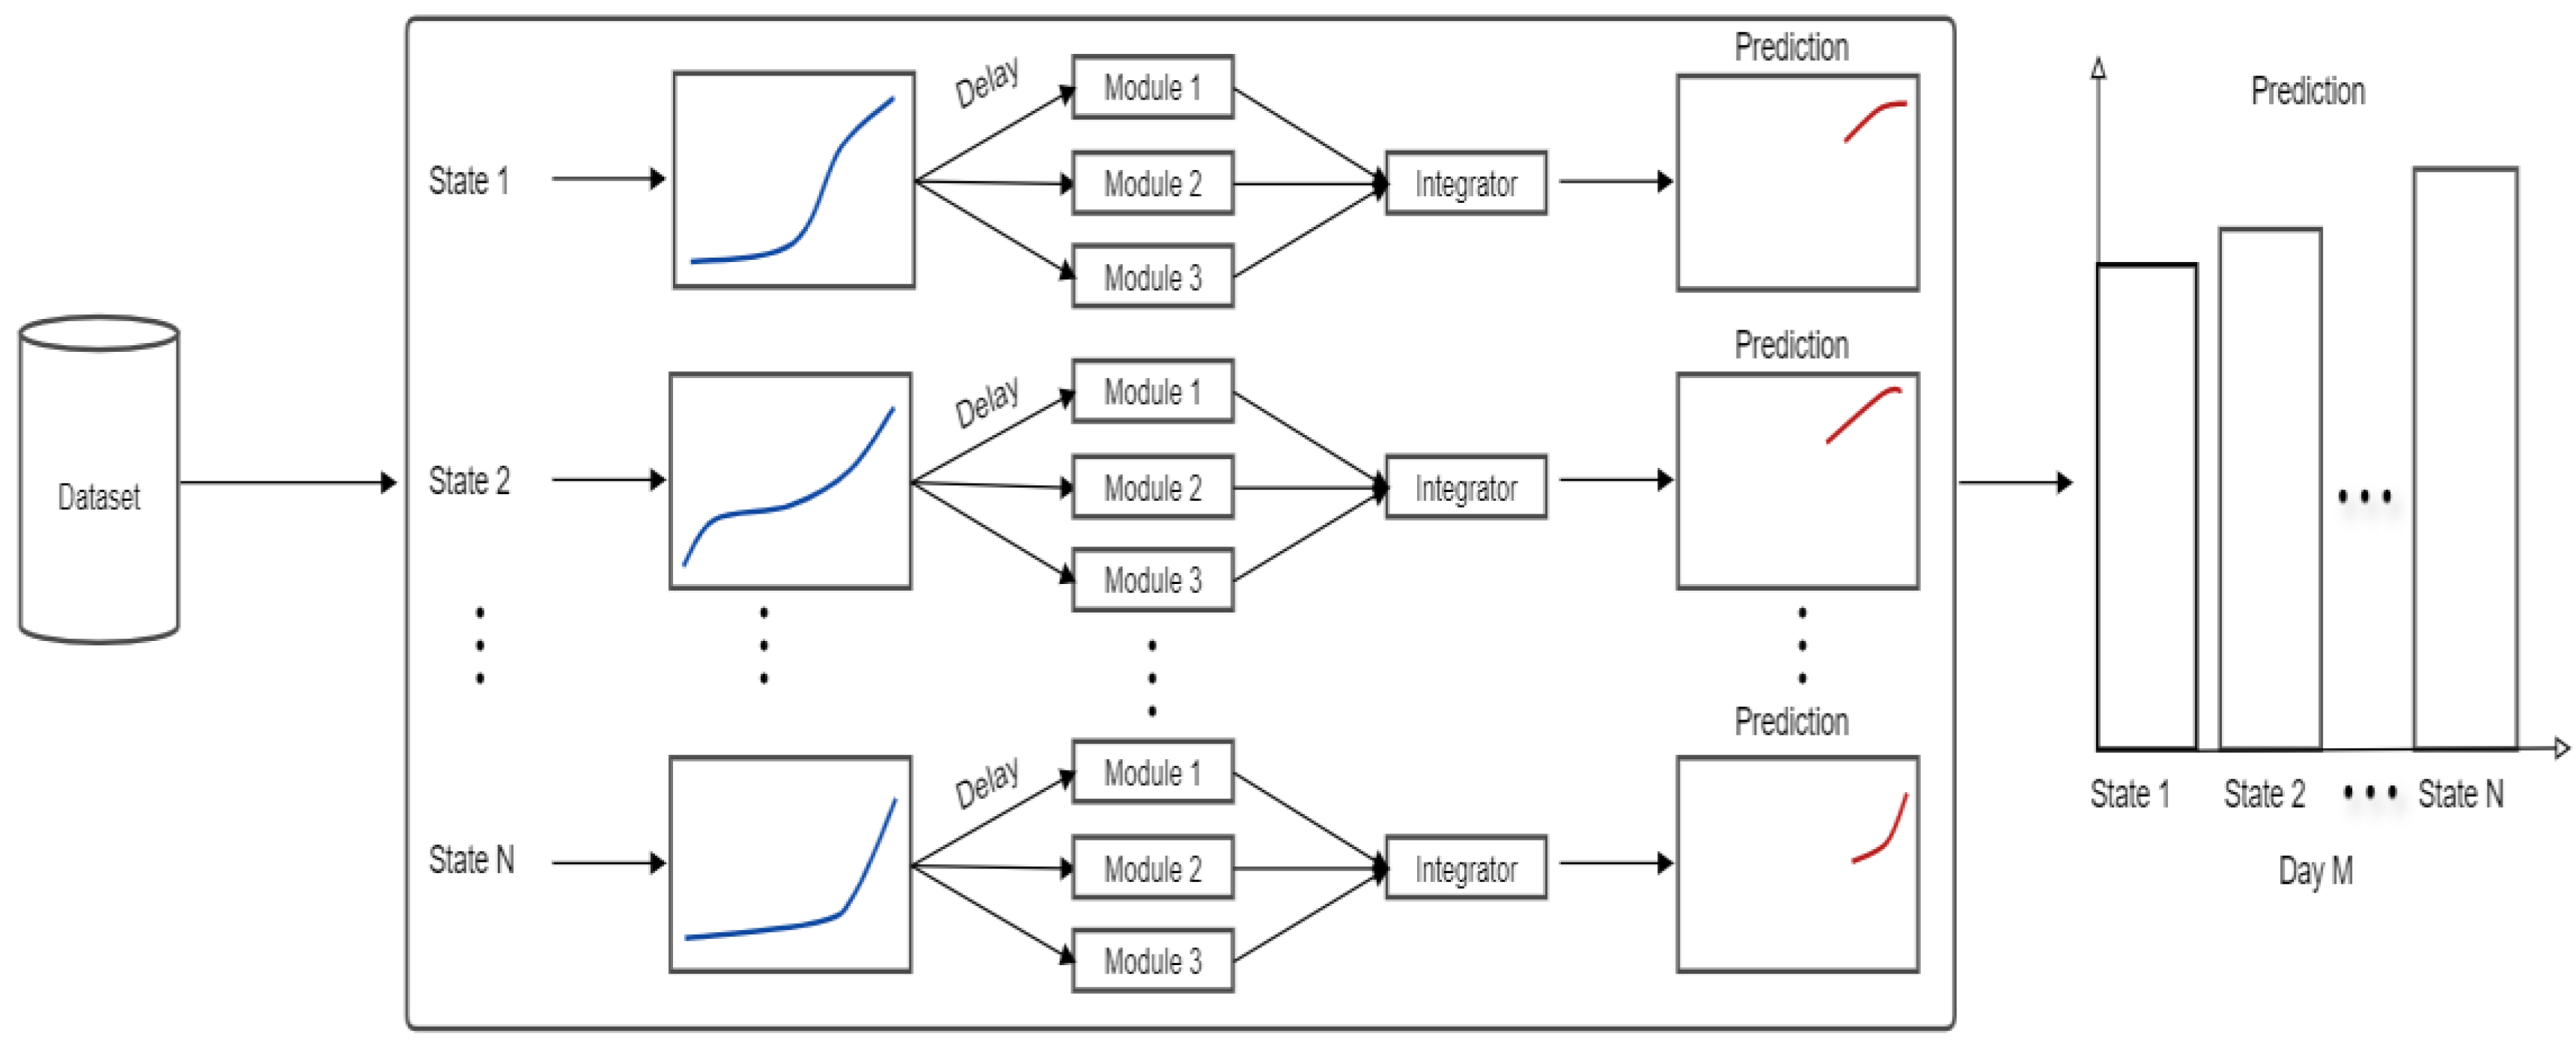
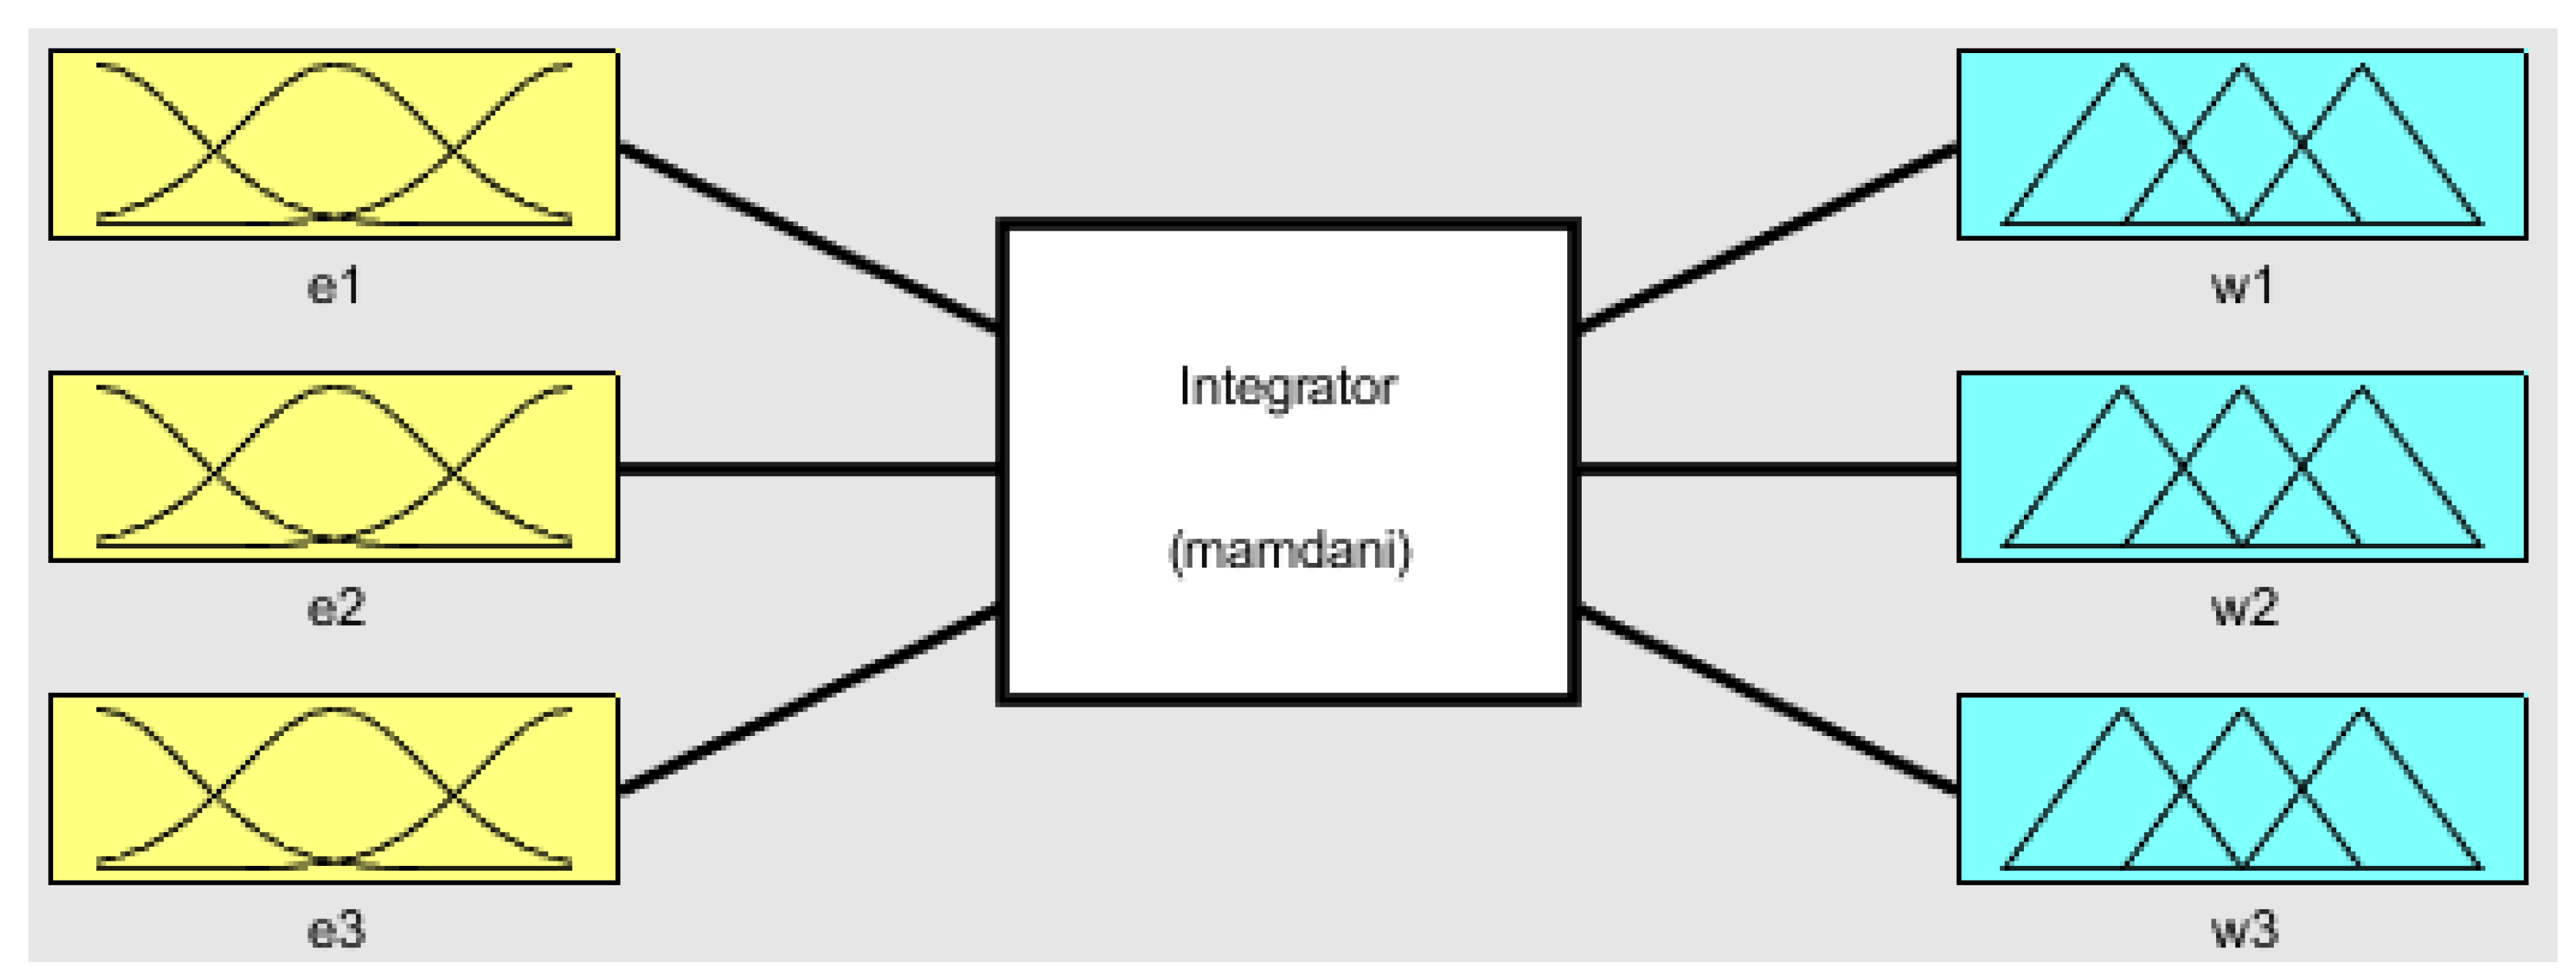
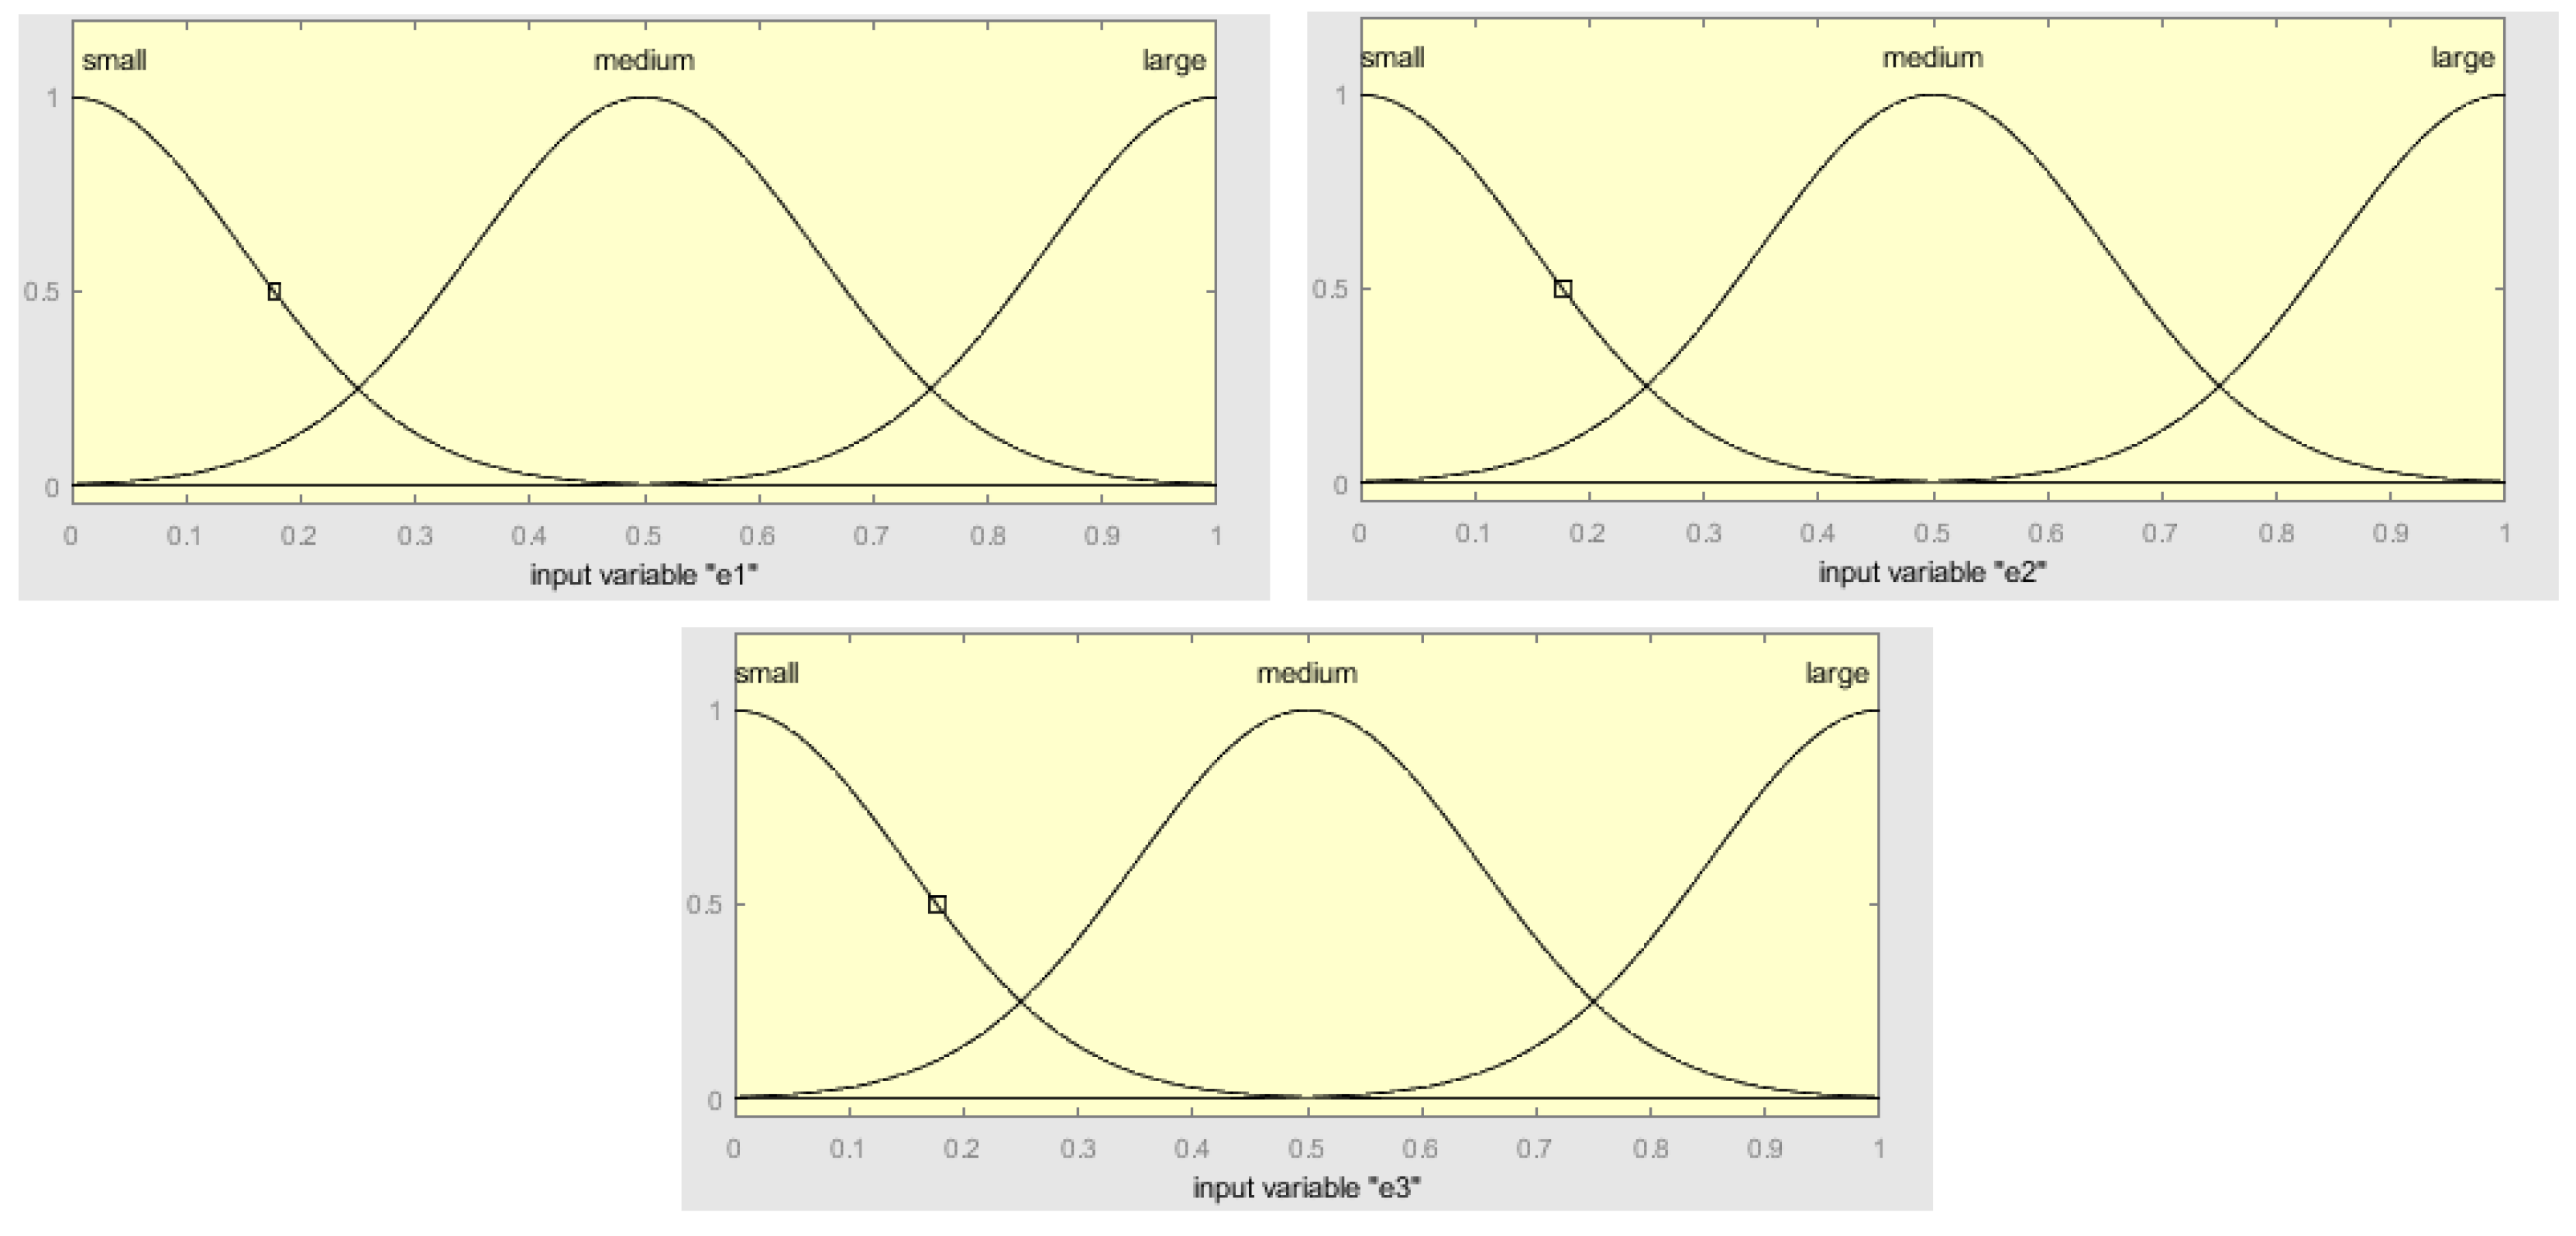
4. Proposed Method
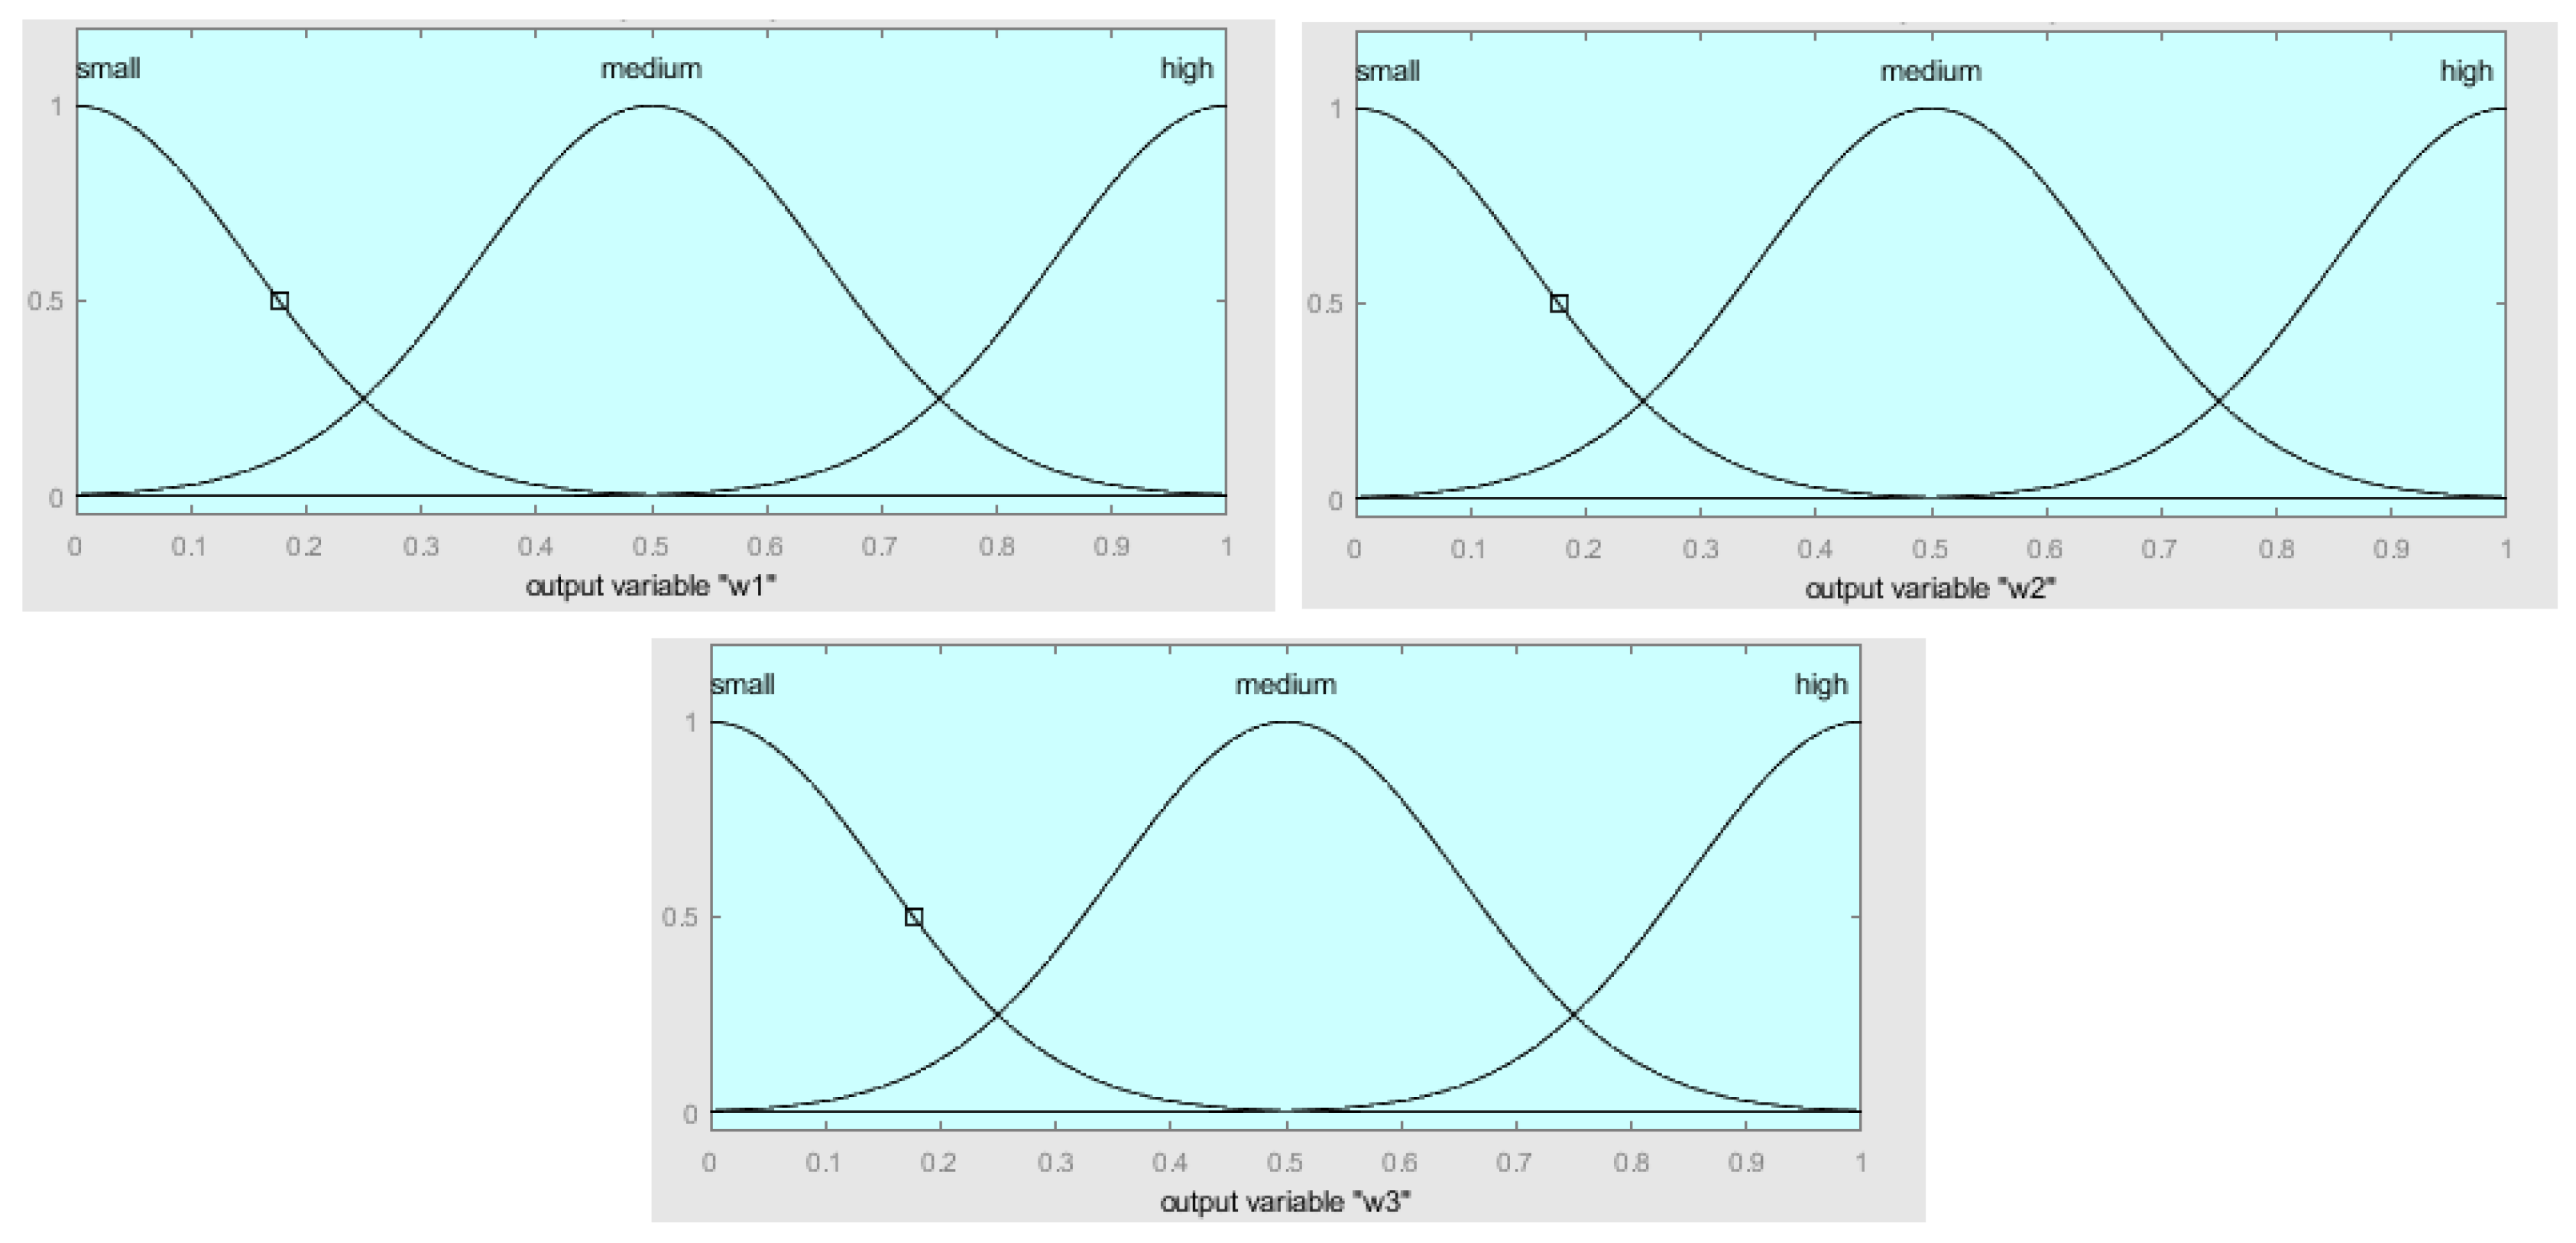
- If ( is small) and ( is medium) and ( is large), then ( is high) ( is medium) ( is small).
- If ( is large) and ( is small) and ( is medium), then ( is small) ( is high) ( is medium).
- If ( is medium) and ( is large) and ( is small), then ( is medium) ( is small) ( is high).
5. Knowledge Representation of the Fuzzy System
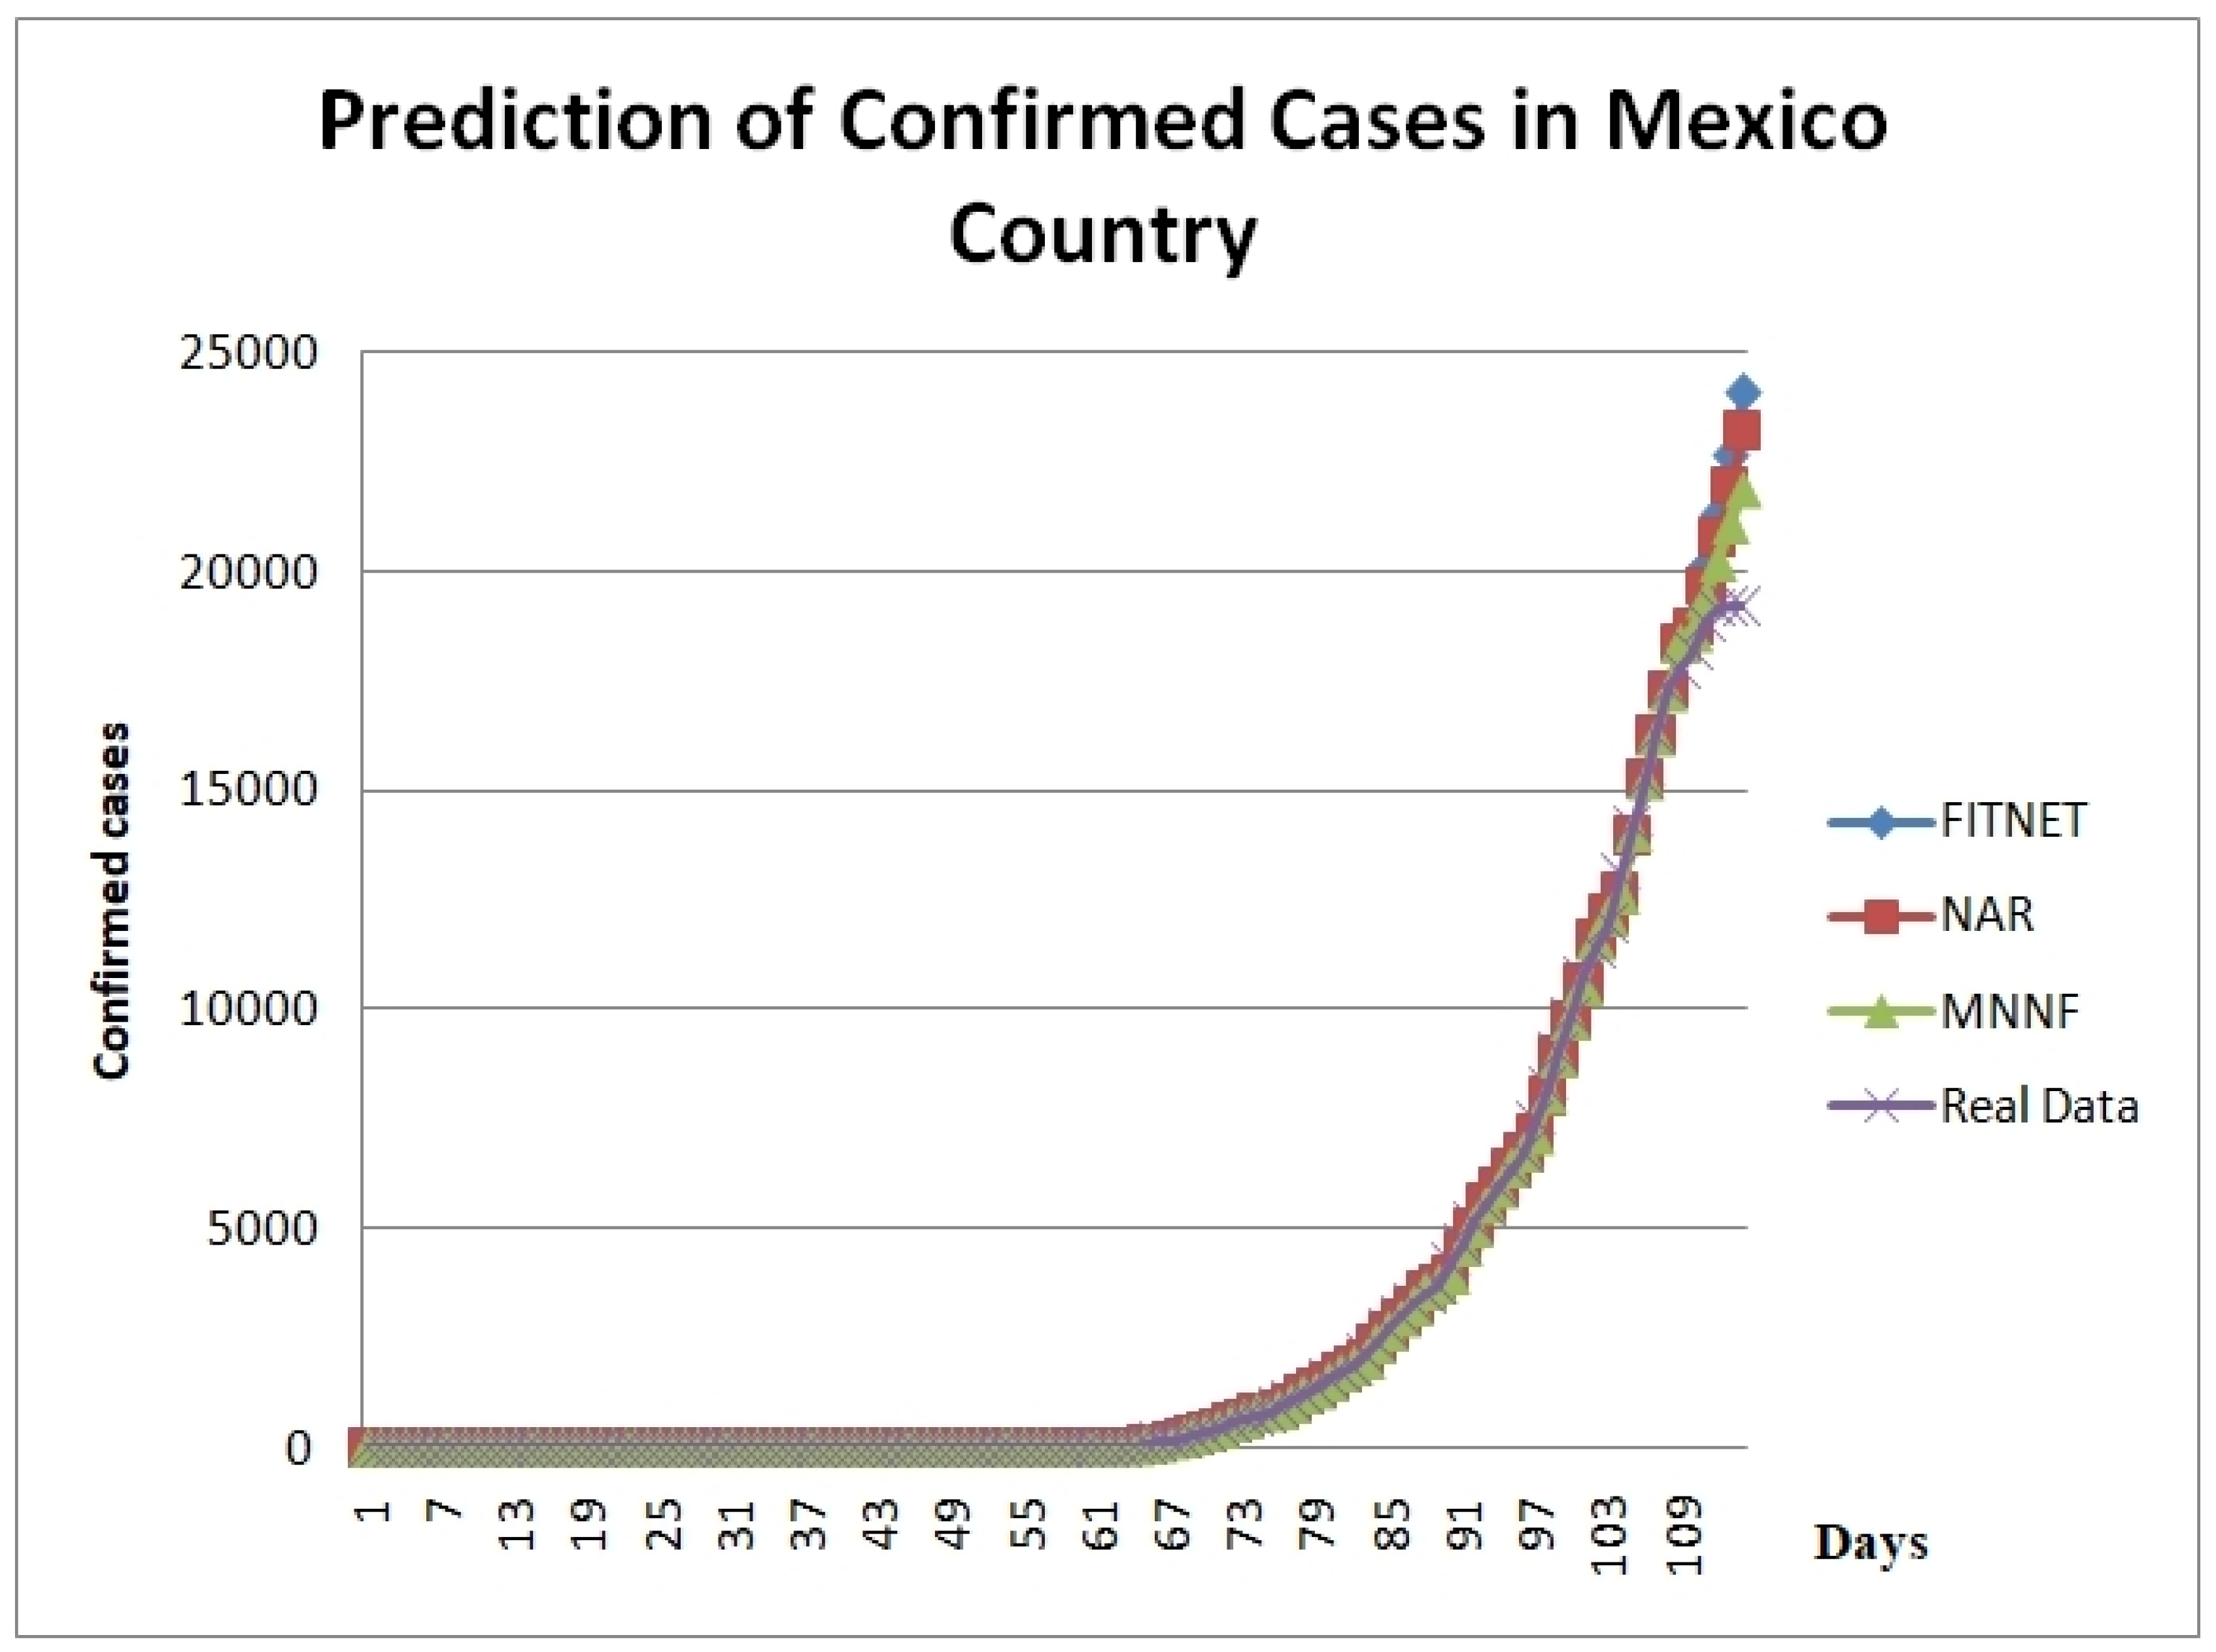
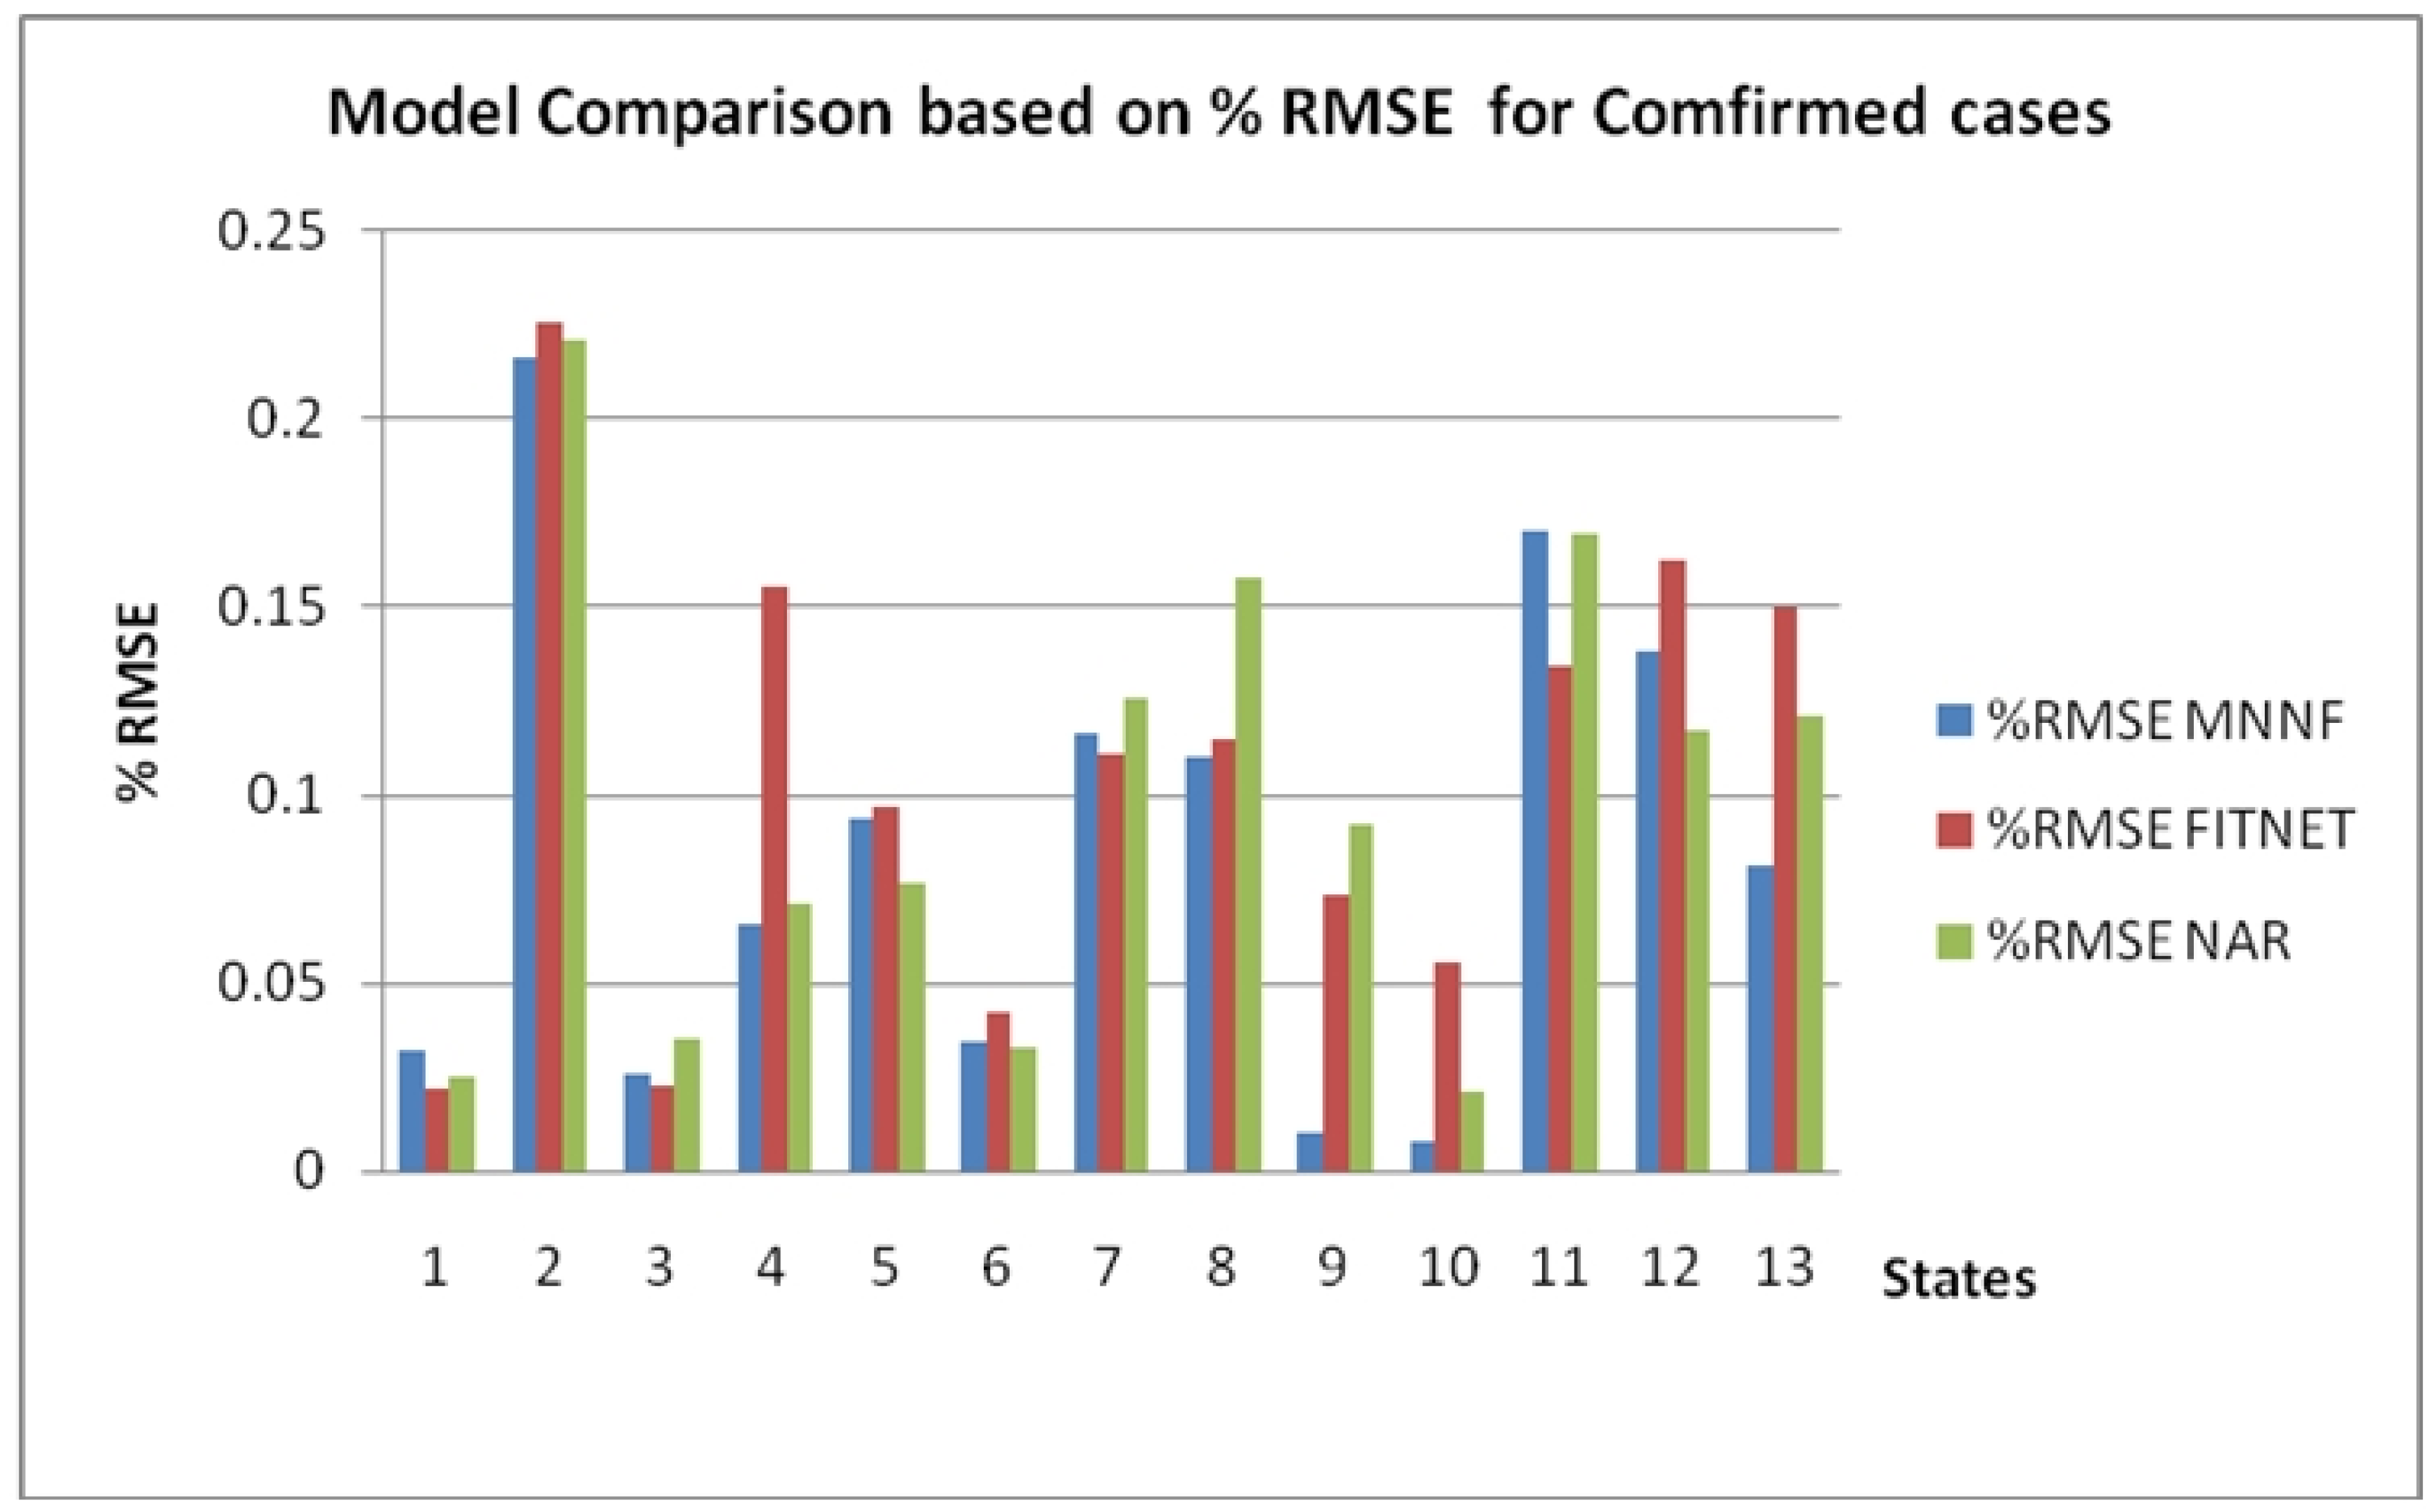
6. Simulation Results
7. Conclusions
Author Contributions
Funding
Conflicts of Interest
References
- Chen, Y.W.; Yiu, C.P.B.; Wong, K.Y. Prediction of the SARS-CoV-2 (2019-nCoV) 3C-like protease (3CLpro) structure: Virtual screening reveals velpatasvir, ledipasvir, and other drug repurposing candidates. F1000Research 2020, 9, 129. [Google Scholar] [CrossRef] [PubMed] [Green Version]
- Fan, C.; Liu, L.; Guo, W.; Yang, A.; Ye, C.; Jilili, M.; Ren, M.; Xu, P.; Long, H.; Wang, Y. Prediction of Epidemic Spread of the 2019 Novel Coronavirus Driven by Spring Festival Transportation in China: A Population-Based Study. Int. J. Environ. Res. Public Heal. 2020, 17, 1679. [Google Scholar] [CrossRef] [PubMed] [Green Version]
- Goh, G.K.-M.; Dunker, A.K.; Foster, J.A.; Uversky, V.N. Rigidity of the outer shell predicted by a protein intrinsic disorder model sheds light on the COVID-19 (Wuhan-2019-nCoV) infectivity. Biomolecules 2020, 10, 331. [Google Scholar] [CrossRef] [PubMed] [Green Version]
- Grifoni, A.; Sidney, J.; Zhang, Y.; Scheuermann, R.H.; Peters, B.; Sette, A. A Sequence Homology and Bioinformatic Approach Can Predict Candidate Targets for Immune Responses to SARS-CoV-2. Cell. Host. Microbe 2020, 27, 671–680.e2. [Google Scholar] [CrossRef]
- He, Z. What further should be done to control COVID-19 outbreaks in addition to cases isolation and contact tracing measures? BMC Med. 2020, 18, 80–83. [Google Scholar] [CrossRef]
- Huang, R.; Liu, M.; Ding, Y. Spatial-temporal distribution of COVID-19 in China and its prediction: A data-driven modeling analysis. J. Infect. Dev. Ctries. 2020, 14, 246–253. [Google Scholar] [CrossRef] [Green Version]
- Ibrahim, I.M.; Abdelmalek, D.H.; Elshahat, M.E.; Elfiky, A.A. COVID-19 spike-host cell receptor GRP78 binding site prediction. J. Infect. 2020, 80, 554–562. [Google Scholar] [CrossRef]
- Ivanov, D. Predicting the impacts of epidemic outbreaks on global supply chains: A simulation-based analysis on the coronavirus outbreak (COVID-19/SARS-CoV-2) case. Transp. Res. Part. E Logist. Transp. Rev. 2020, 136, 101922. [Google Scholar] [CrossRef]
- Li, L.; Yang, Z.; Dang, Z.; Meng, C.; Huang, J.; Meng, H.T.; Wang, D.; Chen, G.; Zhang, J.; Peng, H.; et al. Propagation analysis and prediction of the COVID-19. Infect. Dis. Model. 2020, 5, 282–292. [Google Scholar] [CrossRef]
- Li, Q.; Feng, W. Trend and forecasting of the COVID-19 outbreak in China. J. Infect. 2020, 80, 469–496. [Google Scholar]
- Liu, Z.; Magal, P.; Seydi, O.; Webb, G. Understanding Unreported Cases in the COVID-19 Epidemic Outbreak in Wuhan, China, and the Importance of Major Public Health Interventions. Biology 2020, 9, 50. [Google Scholar] [CrossRef] [Green Version]
- Roda, W.C.; Varughese, M.B.; Han, D.; Li, M.Y. Why is it difficult to accurately predict the COVID-19 epidemic? Infect. Dis. Model. 2020, 5, 271–281. [Google Scholar] [CrossRef] [PubMed]
- Roosa, K.; Lee, Y.; Luo, R.; Kirpich, A.; Rothenberg, R.; Hyman, J.M.; Yan, P.; Chowell, G. Real-time forecasts of the COVID-19 epidemic in China from February 5th to February 24th, 2020. Infect. Dis. Model. 2020, 5, 256–263. [Google Scholar] [CrossRef] [PubMed]
- Ton, A.T.; Gentile, F.; Hsing, M.; Ban, F.; Cherkasov, A. Rapid Identification of Potential Inhibitors of SARS-CoV-2 Main Protease by Deep Docking of 1.3 Billion Compounds. Mol. Inform. 2020, 39, 2000028. [Google Scholar] [CrossRef] [Green Version]
- Wang, H.; Wang, Z.; Dong, Y.; Chang, R.; Xu, C.; Yu, X.; Zhang, S.; Tsamlag, L.; Shang, M.; Huang, J.; et al. Phase-adjusted estimation of the number of Coronavirus Disease 2019 cases in Wuhan, China. Cell Discov. 2020. [Google Scholar] [CrossRef] [PubMed] [Green Version]
- Sarkar, R.; Julai, S.; Hossain, S.; Chong, W.T.; Rahman, M. A Comparative Study of Activation Functions of NAR and NARX Neural Network for Long-Term Wind Speed Forecasting in Malaysia. Math. Probl. Eng. 2019, 2019, 1–14. [Google Scholar] [CrossRef]
- Le, T.-T.; Pham, B.T.; Ly, H.-B.; Shirzadi, A.; Le, L.M. Development of 48-hour Precipitation Forecasting Model using Nonlinear Autoregressive Neural Network. In Lecture Notes in Civil Engineering; Springer: Singapore, 2019; pp. 1191–1196. [Google Scholar]
- Aci, M.; Avcı, M. Artificial neural network approach for atomic coordinate prediction of carbon nanotubes. Appl. Phys. A. 2016, 122, 631. [Google Scholar] [CrossRef]
- Hoffmann, L.F.; Parquet Bizarria, F.C.; Parquet Bizarria, J.W. Detection of liner surface defects in solid rocket motors using multilayer perceptron neural networks. Polym. Test. 2020. [Google Scholar] [CrossRef]
- Turabee, G.; Khowja, M.R.; Giangrande, P.; Madonna, V.; Cosma, G.; Vakil, G.; Gerada, C.; Galea, M. The Role of Neural Networks in Predicting the Thermal Life of Electrical Machines. IEEE Access 2020, 8, 40283–40297. [Google Scholar] [CrossRef]
- Zhang, G.; Zhou, H.; Wang, C.; Xue, H.; Wang, J.; Wan, H. Forecasting Time Series Albedo Using NARnet Based on EEMD Decomposition. IEEE Trans. Geosci. Remote. Sens. 2020, 58, 3544–3557. [Google Scholar] [CrossRef]
- Fan, N.; Wang, S.; Liu, C.; Liu, X. Wheel Wear Prediction of High-Speed Train Using NAR and BP Neural Networks. In Proceedings of the 2017 IEEE International Conference on Internet of Things (iThings) and IEEE Green Computing and Communications (GreenCom) and IEEE Cyber, Physical and Social Computing (CPSCom) and IEEE Smart Data (SmartData), Exeter, UK, 21–23 June 2017; pp. 126–130. [Google Scholar]
- Avci, M. Neural network-based design approach for submicron MOS integrated circuits. Math. Comput. Simul. 2008, 79, 1126–1136. [Google Scholar] [CrossRef]
- Butdee, S.; Tangchaidee, K. Neuro Fuzzy Based for Prediction Quality of a Rubber Curing Process on a Compression Machine Under Uncertainty Circumstances; Elsevier BV: Amsterdam, The Netherlands, 2020; pp. 2953–2960. [Google Scholar]
- Saxena, K.; Banodha, U. A Fuzzy Logic Based Cardiovascular Disease Risk Level Prediction System in Correlation to Diabetes and Smoking. In Data Management, Analytics and Innovation; Springer: Singapore, 2020; pp. 29–40. [Google Scholar]
- Gobierno de Mexico. Available online: https://coronavirus.gob.mx/datos/#DownZCSV (accessed on 9 June 2020).
- Kumar, S.S. Analysis of the Performance Evaluation of Machine Learning Techniques in Business Forecasting. 2016. Available online: https://shodhganga.inflibnet.ac.in/handle/10603/109591 (accessed on 9 June 2020).
- Guzmán, J.C.; Miramontes, I.; Melin, P.; Prado-Arechiga, G. Optimal Genetic Design of Type-1 and Interval Type-2 Fuzzy Systems for Blood Pressure Level Classification. Axioms 2019, 8, 8. [Google Scholar] [CrossRef] [Green Version]
- Melin, P.; Miramontes, I.; Prado-Arechiga, G. A hybrid model based on modular neural networks and fuzzy systems for classification of blood pressure and hypertension risk diagnosis. Expert Syst. Appl. 2018, 107, 146–164. [Google Scholar] [CrossRef]
- Cuevas, F.; Castillo, O. Design and implementation of a fuzzy path optimization system for omnidirectional autonomous mobile robot control in real-time. In Fuzzy Logic Augmentation of Neural and Optimization Algorithms: Theoretical Aspects and Real Applications; Springer: Cham, Switzerland, 2018; pp. 241–252. [Google Scholar]
- Himavathi, S.; Umamaheswari, B. New membership functions for effective design and implementation of fuzzy systems. IEEE Trans. Syst. Man Cybern. Part A Syst. Hum. 2001, 31, 717–723. [Google Scholar] [CrossRef]
- Franco, J.D.; Ramirez-Delreal, T.A.; Villanueva, D.; Gárate-García, A.; Armenta-Medina, D. Monitoring of Ocimum basilicum seeds growth with image processing and fuzzy logic techniques based on Cloudino-IoT and FIWARE platforms. Comput. Electron. Agric. 2020, 173, 105389. [Google Scholar] [CrossRef]
- Gonzalez, C.I.; Melin, P.; Castro, J.R.; Mendoza, O.; Castillo, O. An improved sobel edge detection method based on generalized type-2 fuzzy logic. Soft. Comput. 2016, 20, 773–784. [Google Scholar] [CrossRef]
- Ontiveros, E.; Melin, P.; Castillo, O. High order α-planes integration: A new approach to computational cost reduction of General Type-2 Fuzzy Systems. Eng. Appl. Artif. Intell. 2018, 74, 186–197. [Google Scholar] [CrossRef]
- Qiu, J.; Sun, K.; Rudas, I.J.; Gao, H.-J. Command Filter-Based Adaptive NN Control for MIMO Nonlinear Systems with Full-State Constraints and Actuator Hysteresis. IEEE Trans. Cybern. 2019, PP, 1–11. [Google Scholar] [CrossRef]
- Qiu, J.; Sun, K.; Wang, T.; Gao, H.-J. Observer-Based Fuzzy Adaptive Event-Triggered Control for Pure-Feedback Nonlinear Systems with Prescribed Performance. IEEE Trans. Fuzzy Syst. 2019, 27, 2152–2162. [Google Scholar] [CrossRef]
- Castillo, O. Type-2 Fuzzy Logic in Intelligent Control Applications; Springer: Berlin, Germany, 2012. [Google Scholar]
- Ontiveros-Robles, E.; Melin, P.; Castillo, O. Comparative analysis of noise robustness of type 2 fuzzy logic controllers. Kybernetika 2018, 54, 175–201. [Google Scholar] [CrossRef] [Green Version]


| Predicted Day | Real Data | FITNET | NAR | MNNF |
|---|---|---|---|---|
| 1 | 14,230 | 13,988 | 13,988 | 14,035 |
| 2 | 15,246 | 15,148 | 15,291 | 15,226 |
| 3 | 16,252 | 16,216 | 16,298 | 16,226 |
| 4 | 17,301 | 17,279 | 17,301 | 17,241 |
| 5 | 17,783 | 18,391 | 18,386 | 18,333 |
| 6 | 18,205 | 18,862 | 18,745 | 18,597 |
| 7 | 18,850 | 20,045 | 19,678 | 19,391 |
| 8 | 19,172 | 21,302 | 20,783 | 20,221 |
| 9 | 19,220 | 22,637 | 21,953 | 21,053 |
| 10 | 19,224 | 24,053 | 23,228 | 21,900 |
| Baja California | Cd. de Mexico | Estado de Mex | Jalisco | Nuevo Leon | Quintana Roo | Sinaloa | Mexico Country | |
|---|---|---|---|---|---|---|---|---|
| MNNF | ||||||||
| MSE | 2529.072 | 1,263,297.767 | 41,570.1111 | 1055.7705 | 131.8613 | 7513.0870 | 74.2234 | 2,415,010.109 |
| RMSE | 50.2898 | 1123.9651 | 203.8874 | 32.4926 | 11.4830 | 86.6780 | 8.6153 | 1554.0302 |
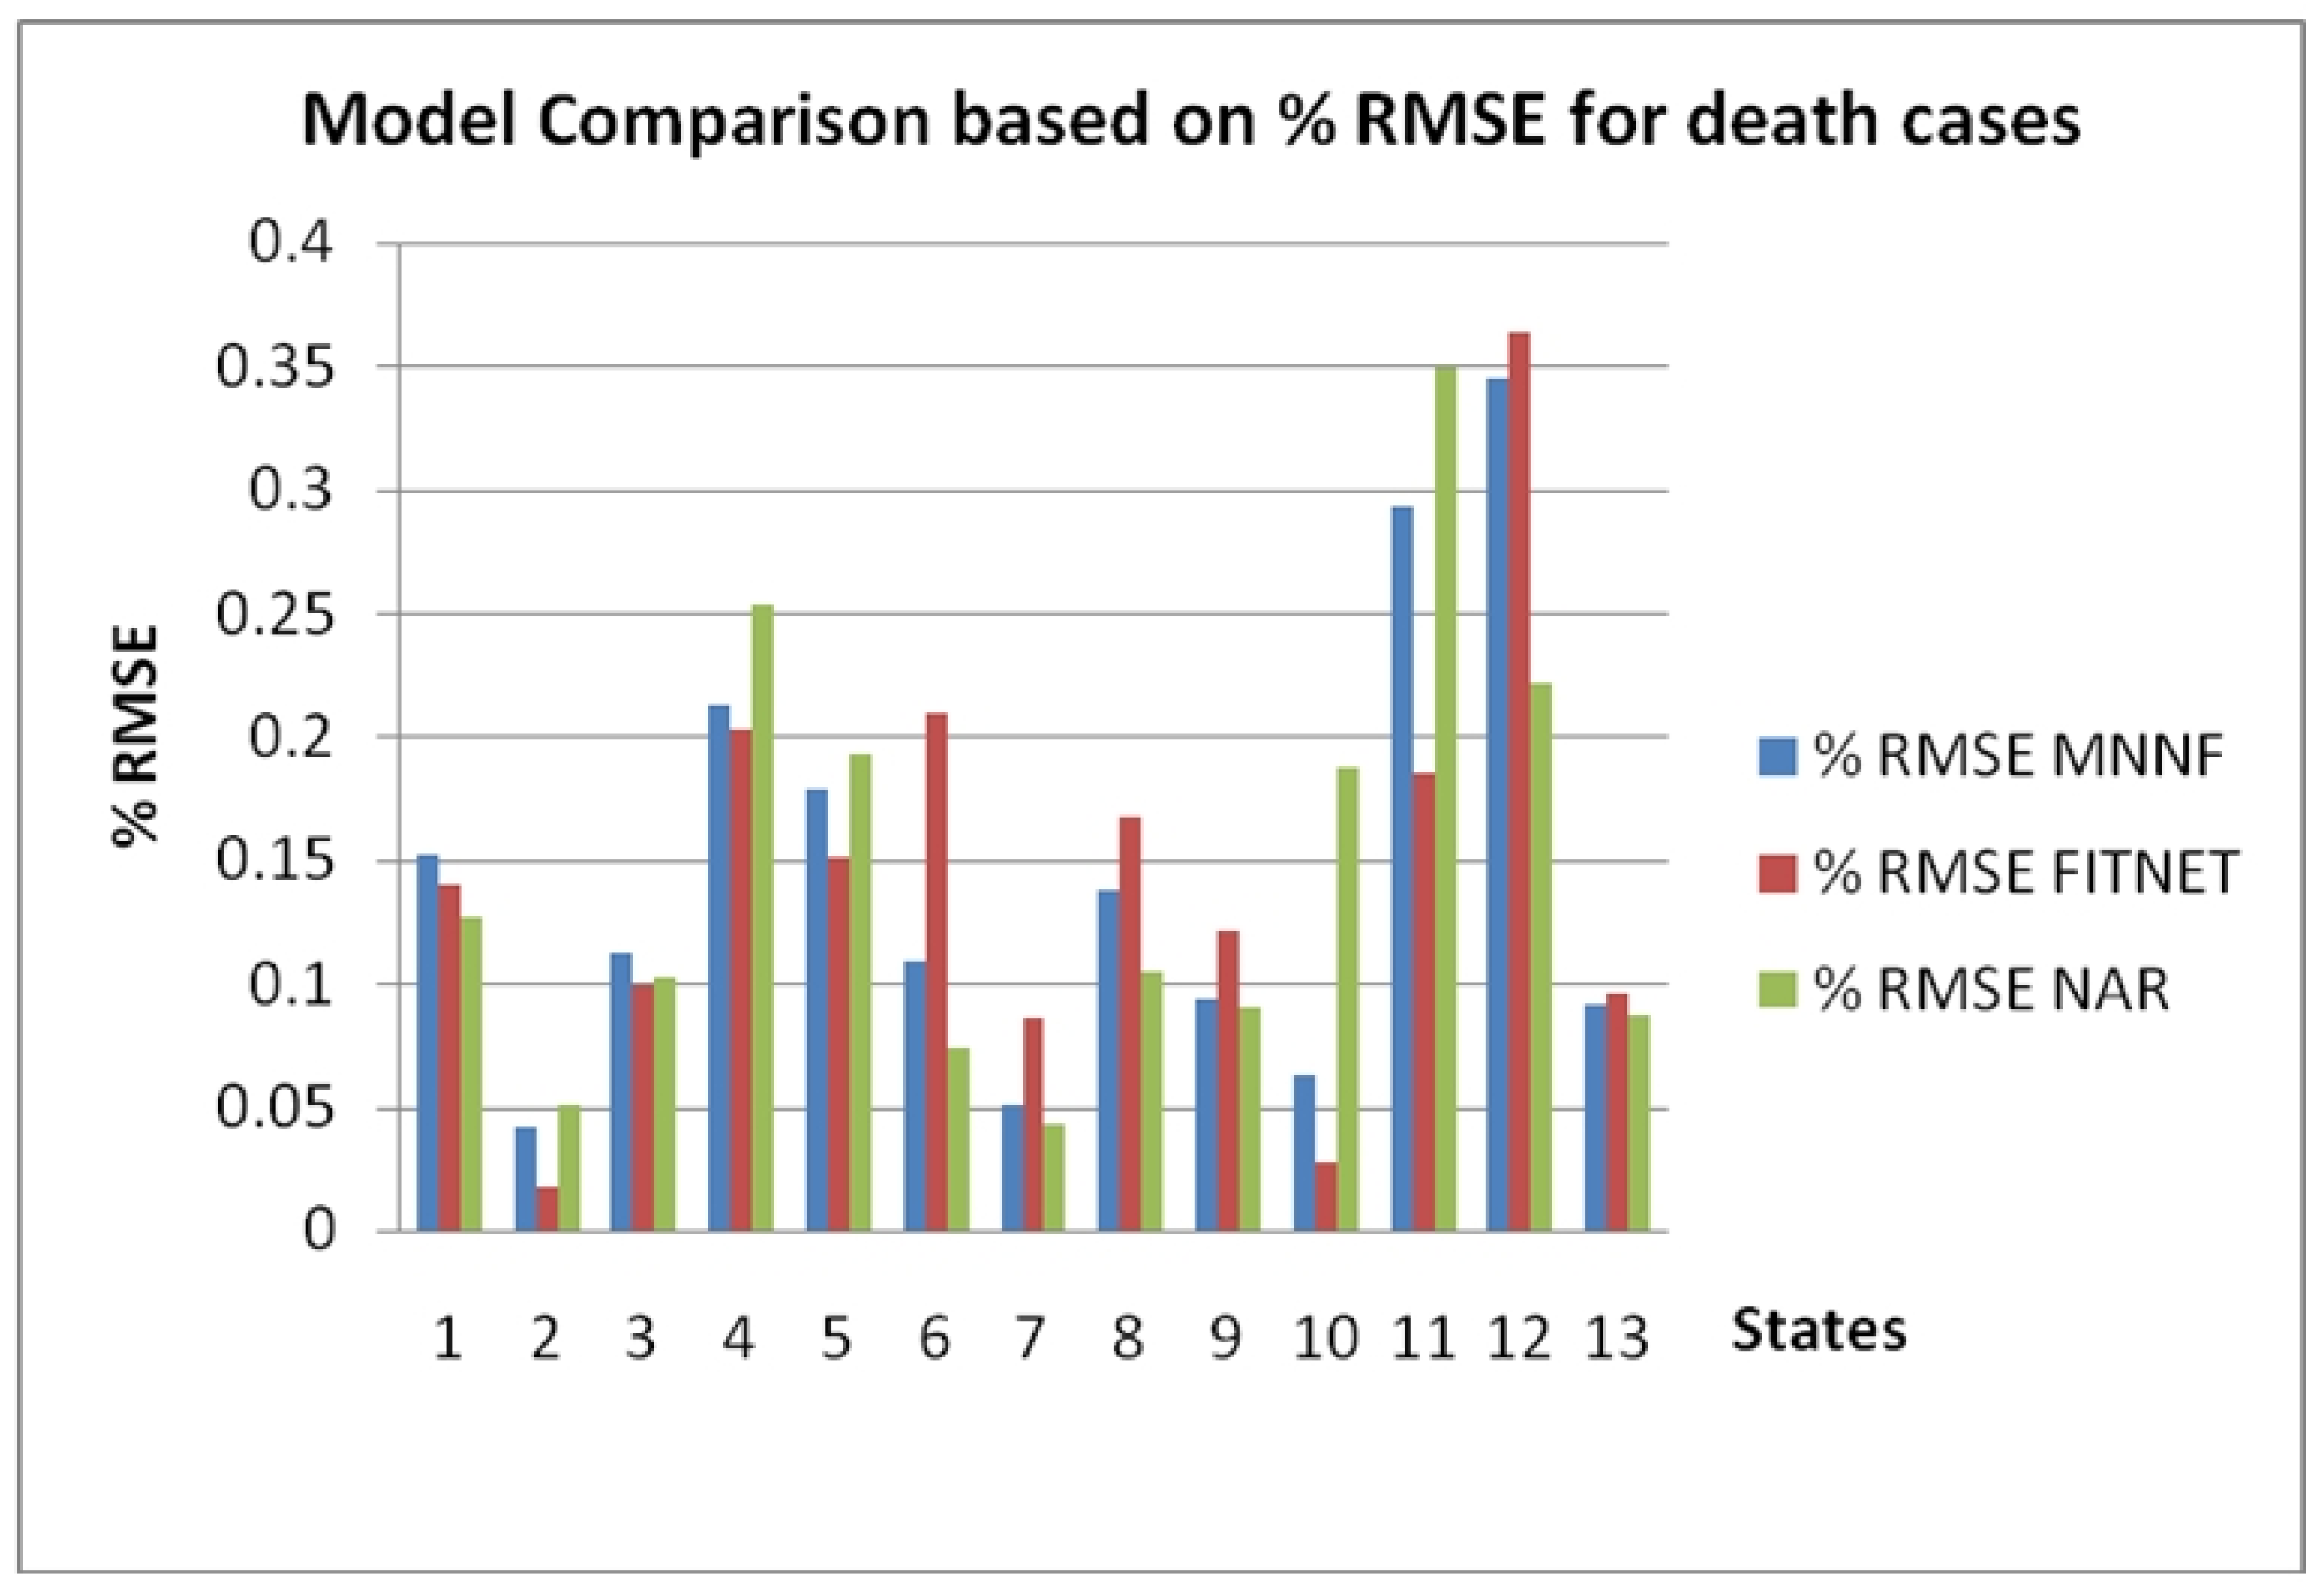
| %RMSE MNNF | 0.0322 | 0.2157 | 0.0651 | 0.0936 | 0.0343 | 0.1099 | 0.0099 | 0.0808 |
| FITNET | ||||||||
| MSE: | 1158.3682 | 1,373,761.46 | 235,501.924 | 1122.0012 | 198.0156 | 8178.0354 | 3994.9508 | 8,280,063.46 |
| RMSE: | 34.0348 | 1172.0757 | 485.2854 | 33.4962 | 14.0718 | 90.4324 | 63.2056 | 2877.5099 |
| %RMSE FITNET | 0.0218 | 0.22500 | 0.1550 | 0.0965 | 0.0421 | 0.1147 | 0.07307008 | 0.14968321 |
| NAR | ||||||||
| MSE | 1463.8333 | 1,318,844.292 | 49,312.6242 | 706.70452 | 117.464185 | 15,407.8063 | 6370.45123 | 5,416,634.47 |
| RMSE | 38.2600 | 1148.4094 | 222.0644 | 26.5839147 | 10.8380895 | 124.128185 | 79.8151065 | 2327.36642 |
| %RMSE NAR | 0.0245 | 0.22046 | 0.0709 | 0.0766 | 0.0324 | 0.1575 | 0.0922 | 0.1210 |
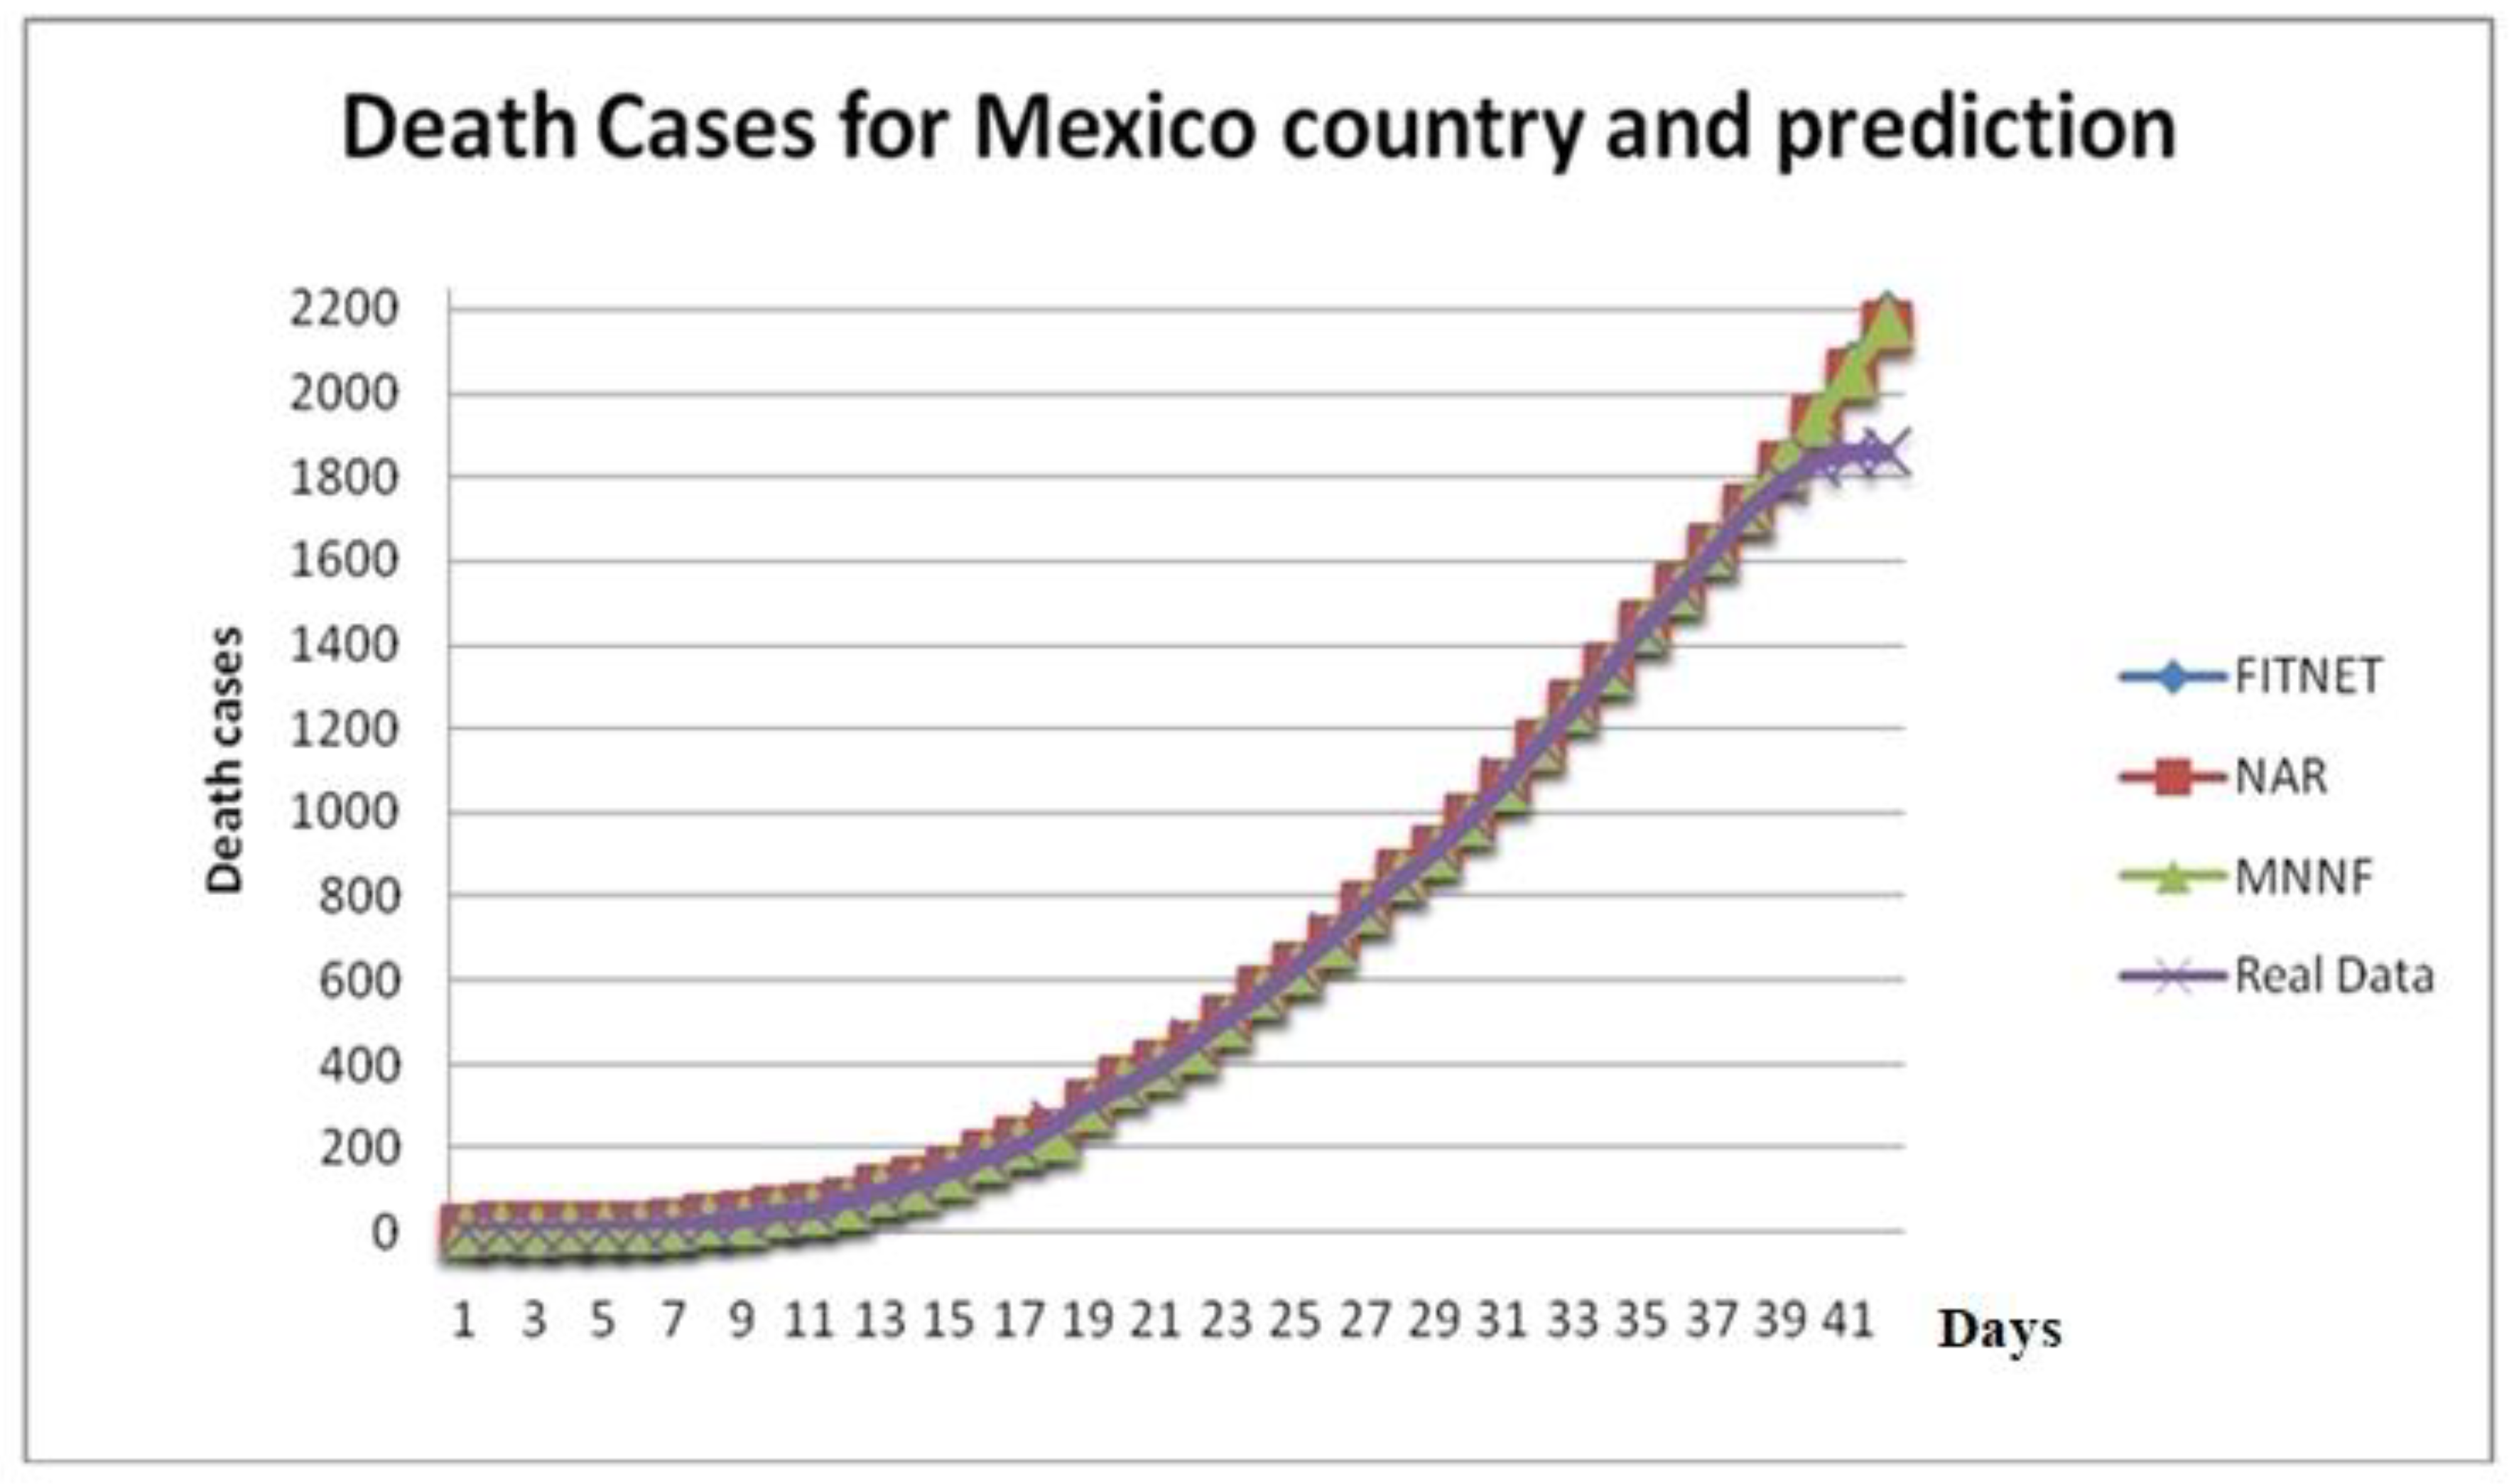
| Predicted Day | Real Data | FITNET | NAR | MNNF |
|---|---|---|---|---|
| 1 | 1251 | 1256.14422 | 1255.71983 | 1256.63828 |
| 2 | 1347 | 1339.80171 | 1339.88456 | 1340.6627 |
| 3 | 1438 | 1445.1368 | 1442.91771 | 1444.02958 |
| 4 | 1531 | 1533.02409 | 1532.79844 | 1533.68764 |
| 5 | 1625 | 1628.71662 | 1627.20689 | 1628.18016 |
| 6 | 1717 | 1724.59421 | 1722.99607 | 1723.98249 |
| 7 | 1788 | 1829.92399 | 1824.7057 | 1827.52789 |
| 8 | 1837 | 1941.17027 | 1930.41912 | 1935.97883 |
| 9 | 1856 | 2058.54869 | 2040.3259 | 2049.49095 |
| 10 | 1859 | 2182.306 | 2154.63482 | 2168.29111 |
| Baja California | Ciudad de Mex | Estado de Mexico | Jalisco | Nuevo Leon | Quintana Roo | Sinaloa | Mexico Country | |
|---|---|---|---|---|---|---|---|---|
| MNNF | ||||||||
| MSE: | 1119.3858 | 202.0965 | 2578.2210 | 24.9536 | 2.6856 | 254.1817 | 168.0517 | 28,901.5512 |
| RMSE: | 33.4572 | 14.21606 | 50.7761 | 4.9953 | 1.63879 | 15.9430 | 12.9634 | 170.0045 |
| % RMSE | 0.1520 | 0.0421 | 0.2124 | 0.1784 | 0.1092 | 0.1374 | 0.0932 | 0.0914 |
| FITNET | ||||||||
| MSE: | 948.1897 | 35.1181 | 2342.7949 | 17.8936 | 9.8660 | 377.9779 | 283.5697 | 31,643.8956 |
| RMSE: | 30.7926 | 5.9260 | 48.4024 | 4.2300 | 3.1410 | 19.4416 | 16.8395 | 177.8873 |
| %RMSE | 0.1399 | 0.0175 | 0.2025 | 0.1510 | 0.2094 | 0.1676 | 0.1211 | 0.0956 |
| NAR | ||||||||
| MSE: | 780.6350 | 294.4490 | 3664.4998 | 29.1810 | 1.2292 | 146.1051 | 159.1990 | 26,297.2756 |
| RMSE: | 27.9398 | 17.1595 | 60.5351 | 5.4019 | 1.1087 | 12.0873 | 12.61744 | 162.1643 |
| %RMSE | 0.1269 | 0.0509 | 0.2532 | 0.1929 | 0.0739 | 0.1042 | 0.0907 | 0.0872 |
© 2020 by the authors. Licensee MDPI, Basel, Switzerland. This article is an open access article distributed under the terms and conditions of the Creative Commons Attribution (CC BY) license (http://creativecommons.org/licenses/by/4.0/).
Share and Cite
Melin, P.; Monica, J.C.; Sanchez, D.; Castillo, O. Multiple Ensemble Neural Network Models with Fuzzy Response Aggregation for Predicting COVID-19 Time Series: The Case of Mexico. Healthcare 2020, 8, 181. https://doi.org/10.3390/healthcare8020181
Melin P, Monica JC, Sanchez D, Castillo O. Multiple Ensemble Neural Network Models with Fuzzy Response Aggregation for Predicting COVID-19 Time Series: The Case of Mexico. Healthcare. 2020; 8(2):181. https://doi.org/10.3390/healthcare8020181
Chicago/Turabian StyleMelin, Patricia, Julio Cesar Monica, Daniela Sanchez, and Oscar Castillo. 2020. "Multiple Ensemble Neural Network Models with Fuzzy Response Aggregation for Predicting COVID-19 Time Series: The Case of Mexico" Healthcare 8, no. 2: 181. https://doi.org/10.3390/healthcare8020181