
Interrupted Time Series Analysis: Patient Characteristics and Rates of Opioid-Use-Disorder-Related Emergency Department Visits in the Los Angeles County Public Hospital System during COVID-19

 , ,
, ,
Abstract
:1. Introduction
Timeline
2. Materials and Methods
3. Results
3.1. Population Characteristics of the Sample
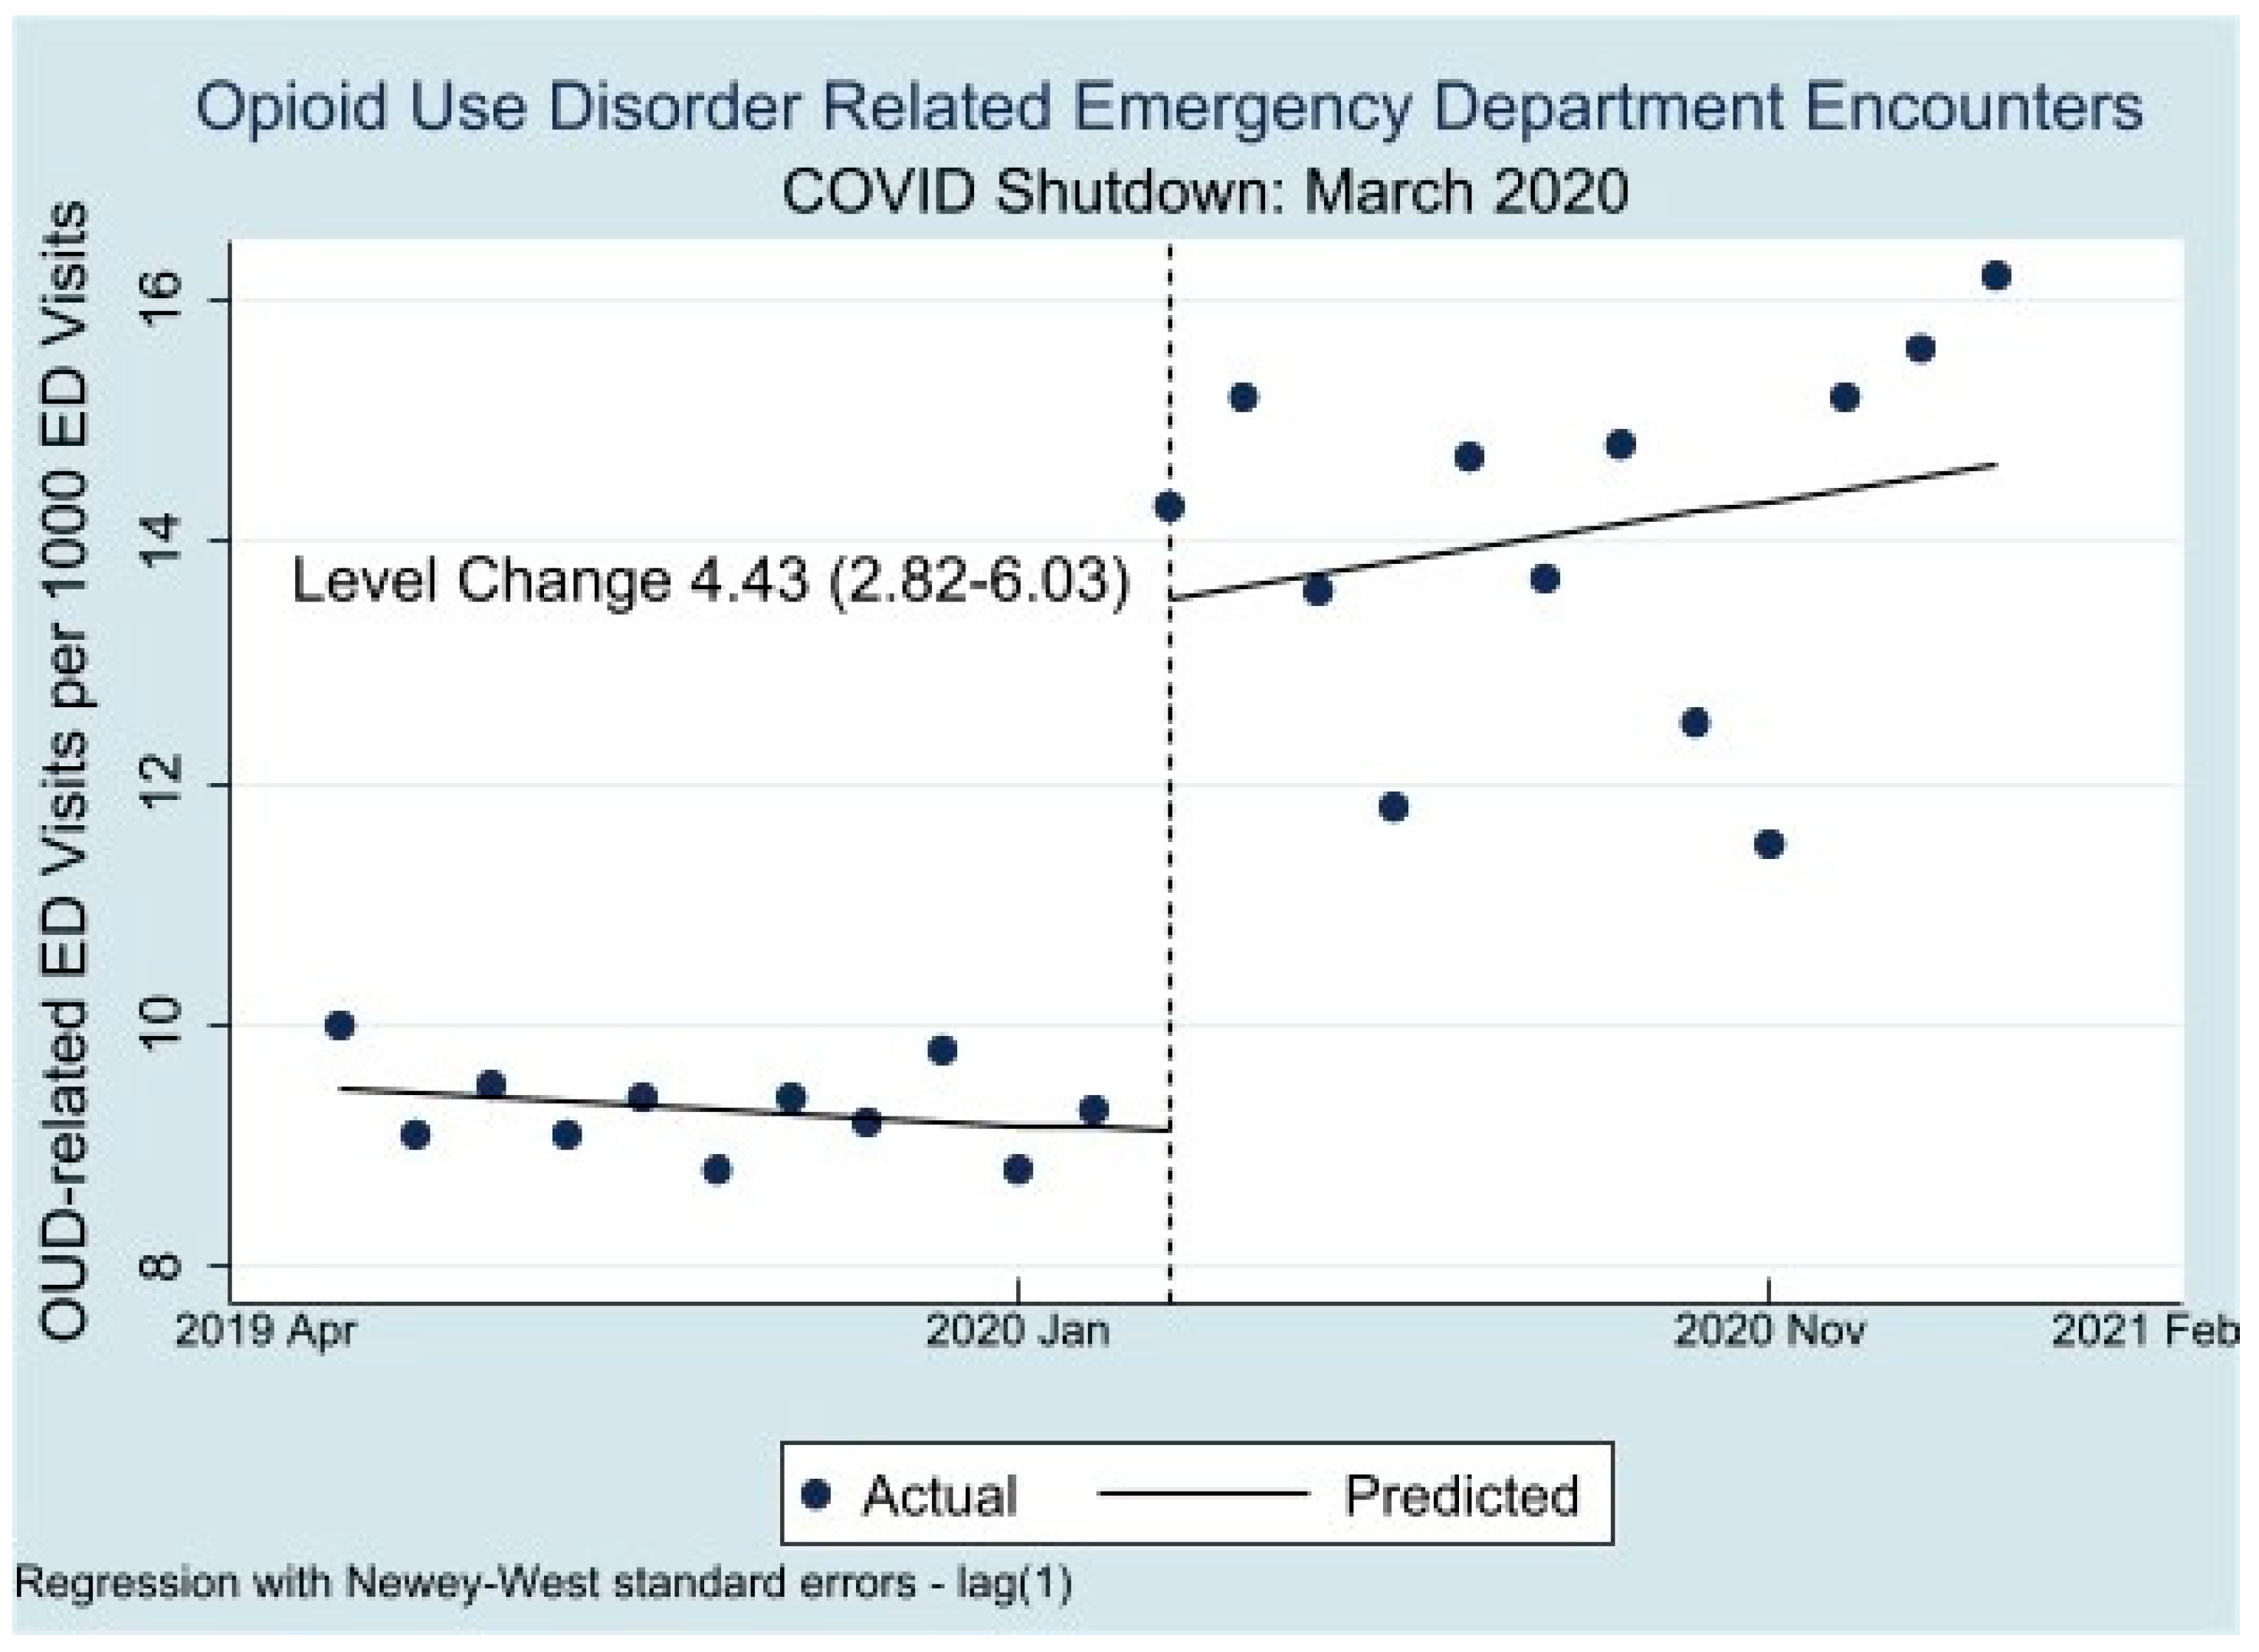
3.2. Interrupted Time Series Analysis
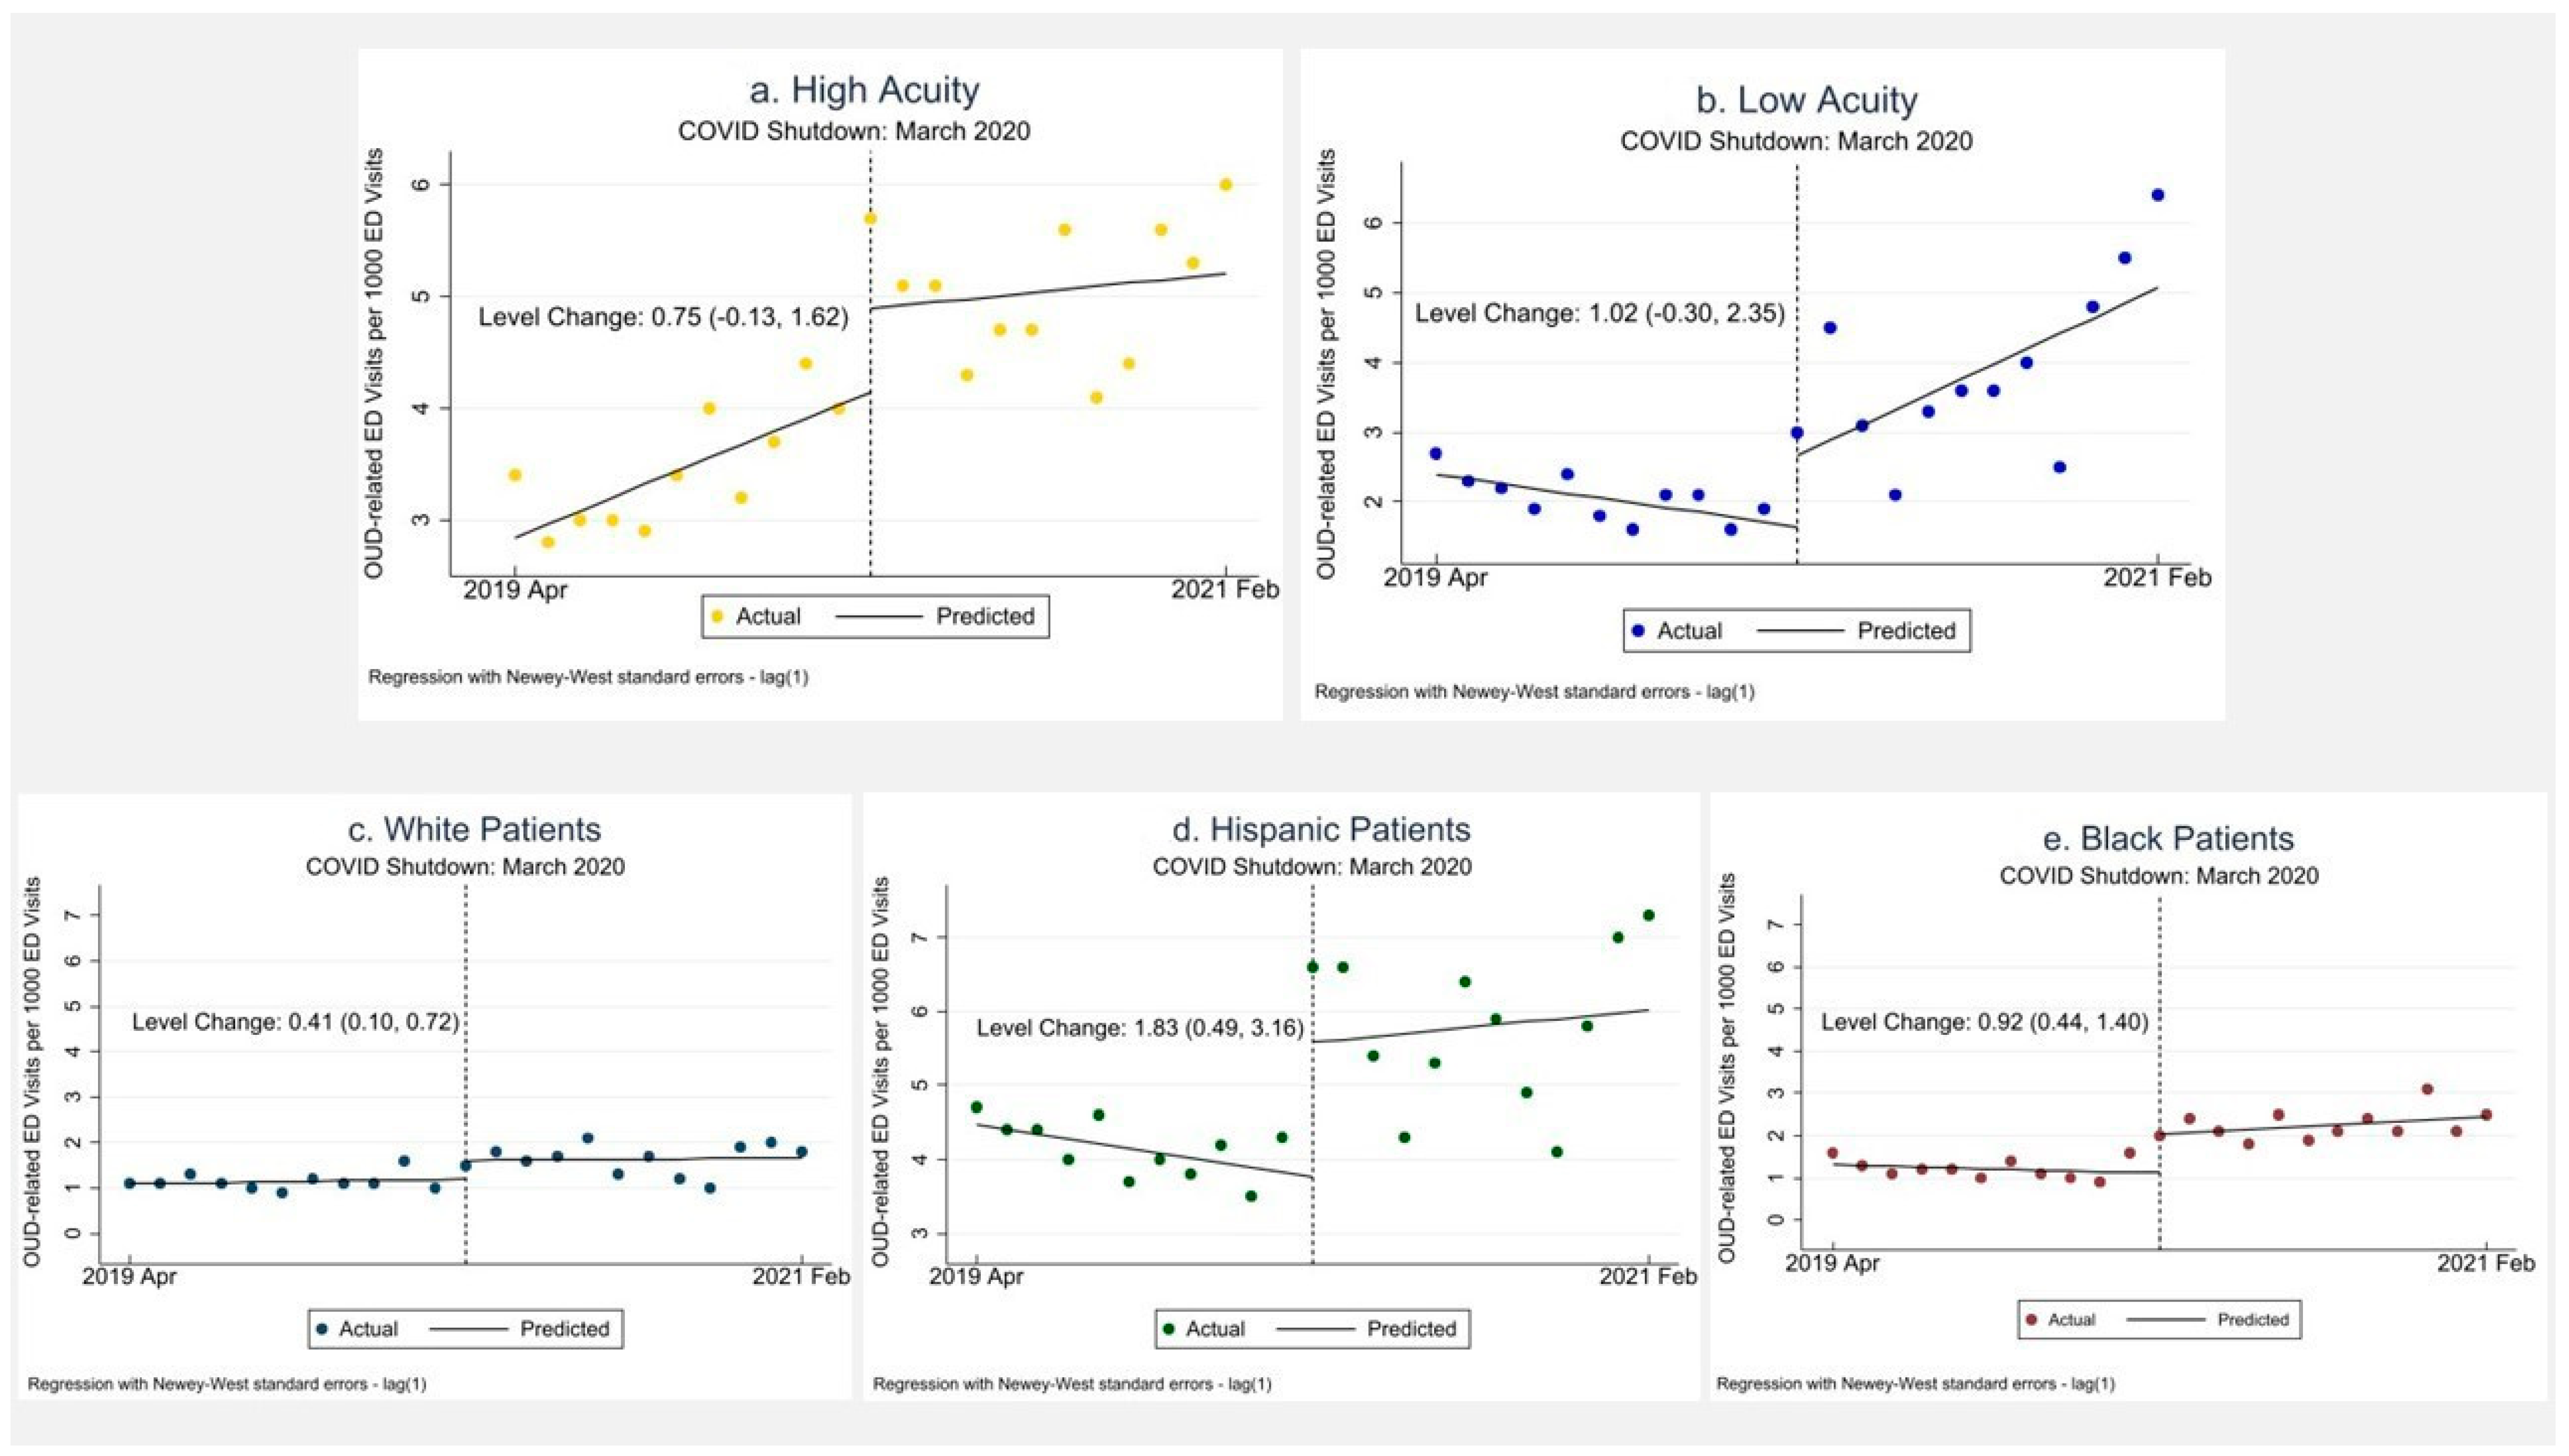
3.3. Race/Ethnicity
3.4. Visit Acuity
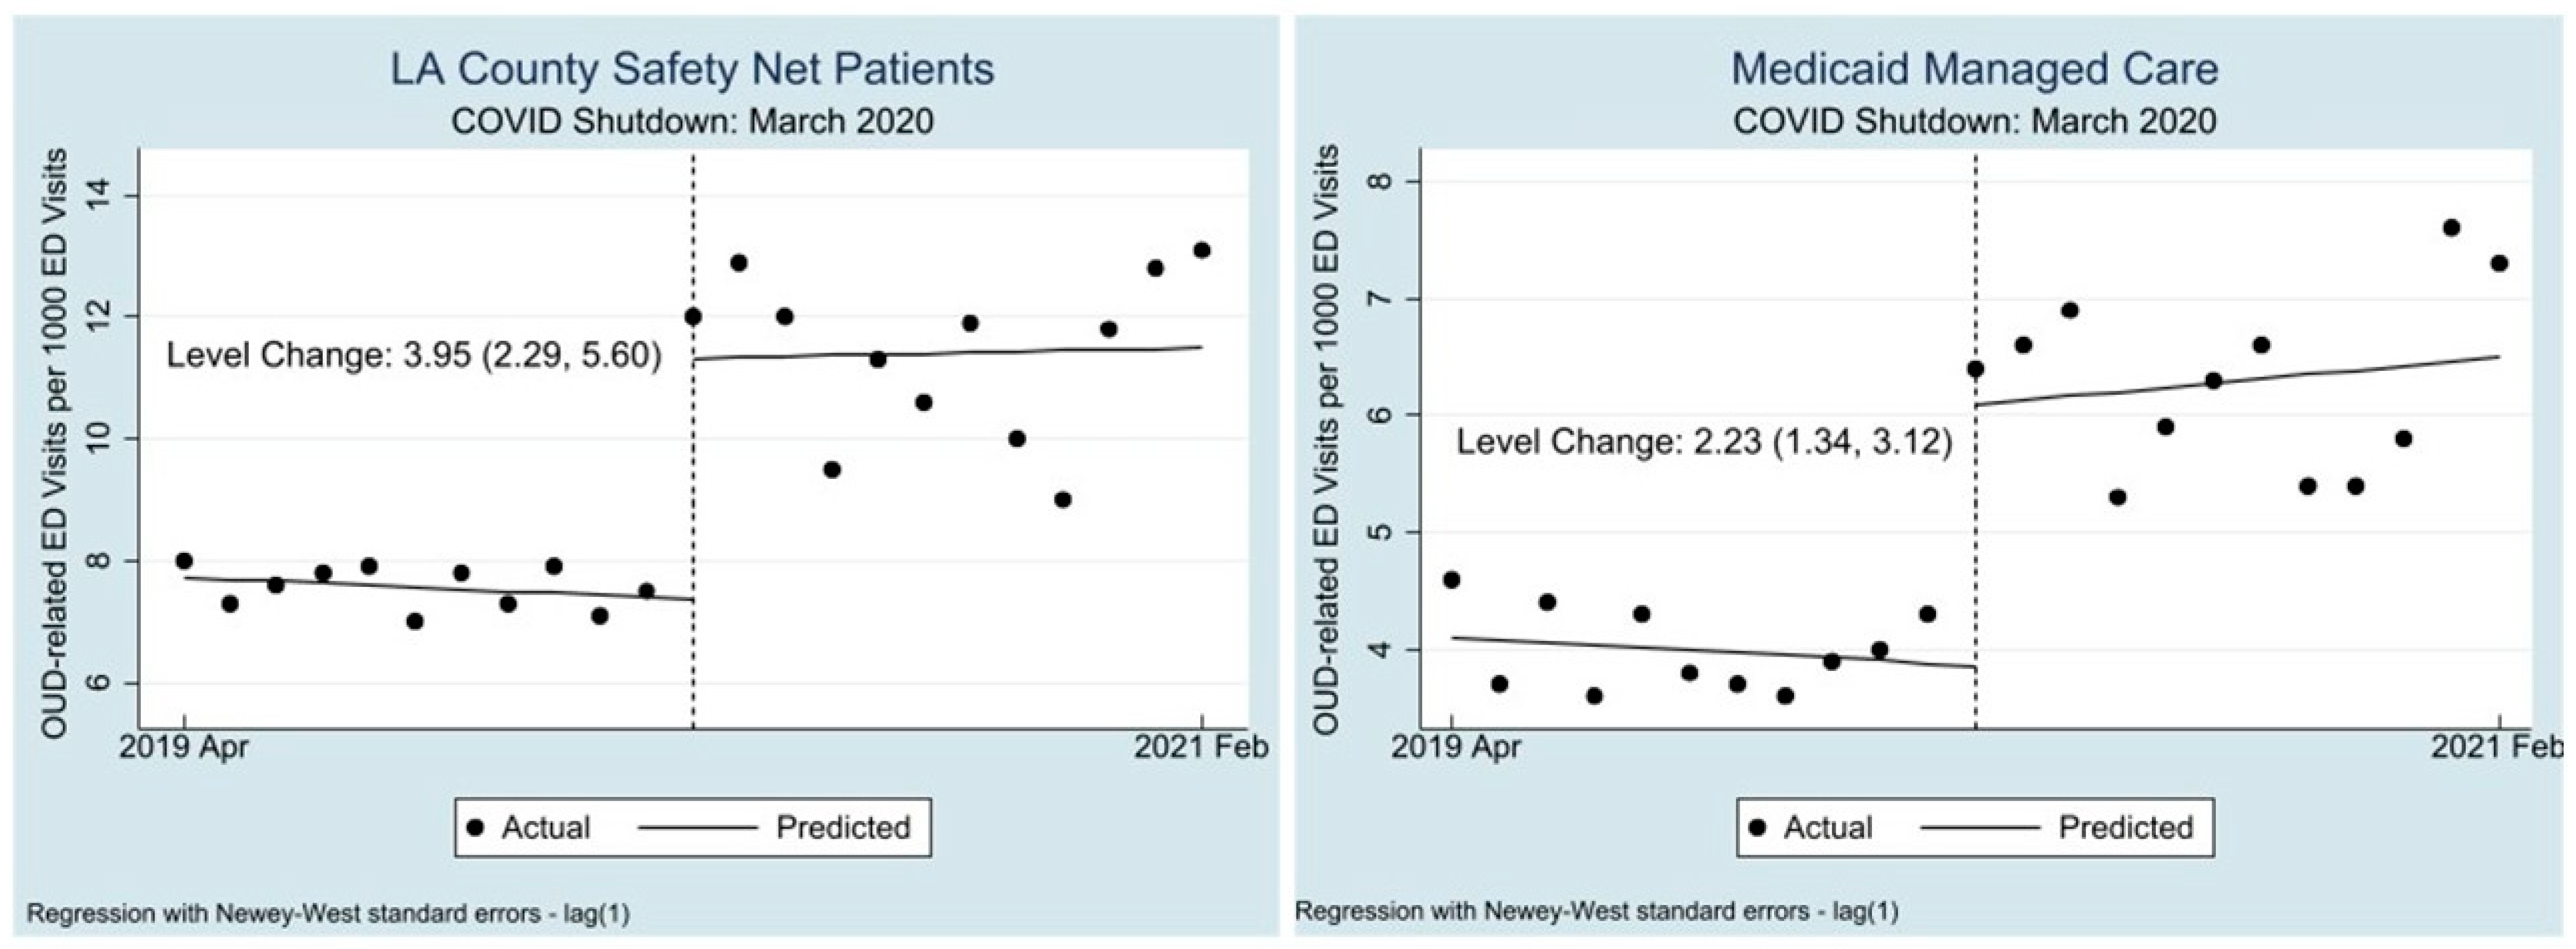
3.5. Payor Group
4. Discussion
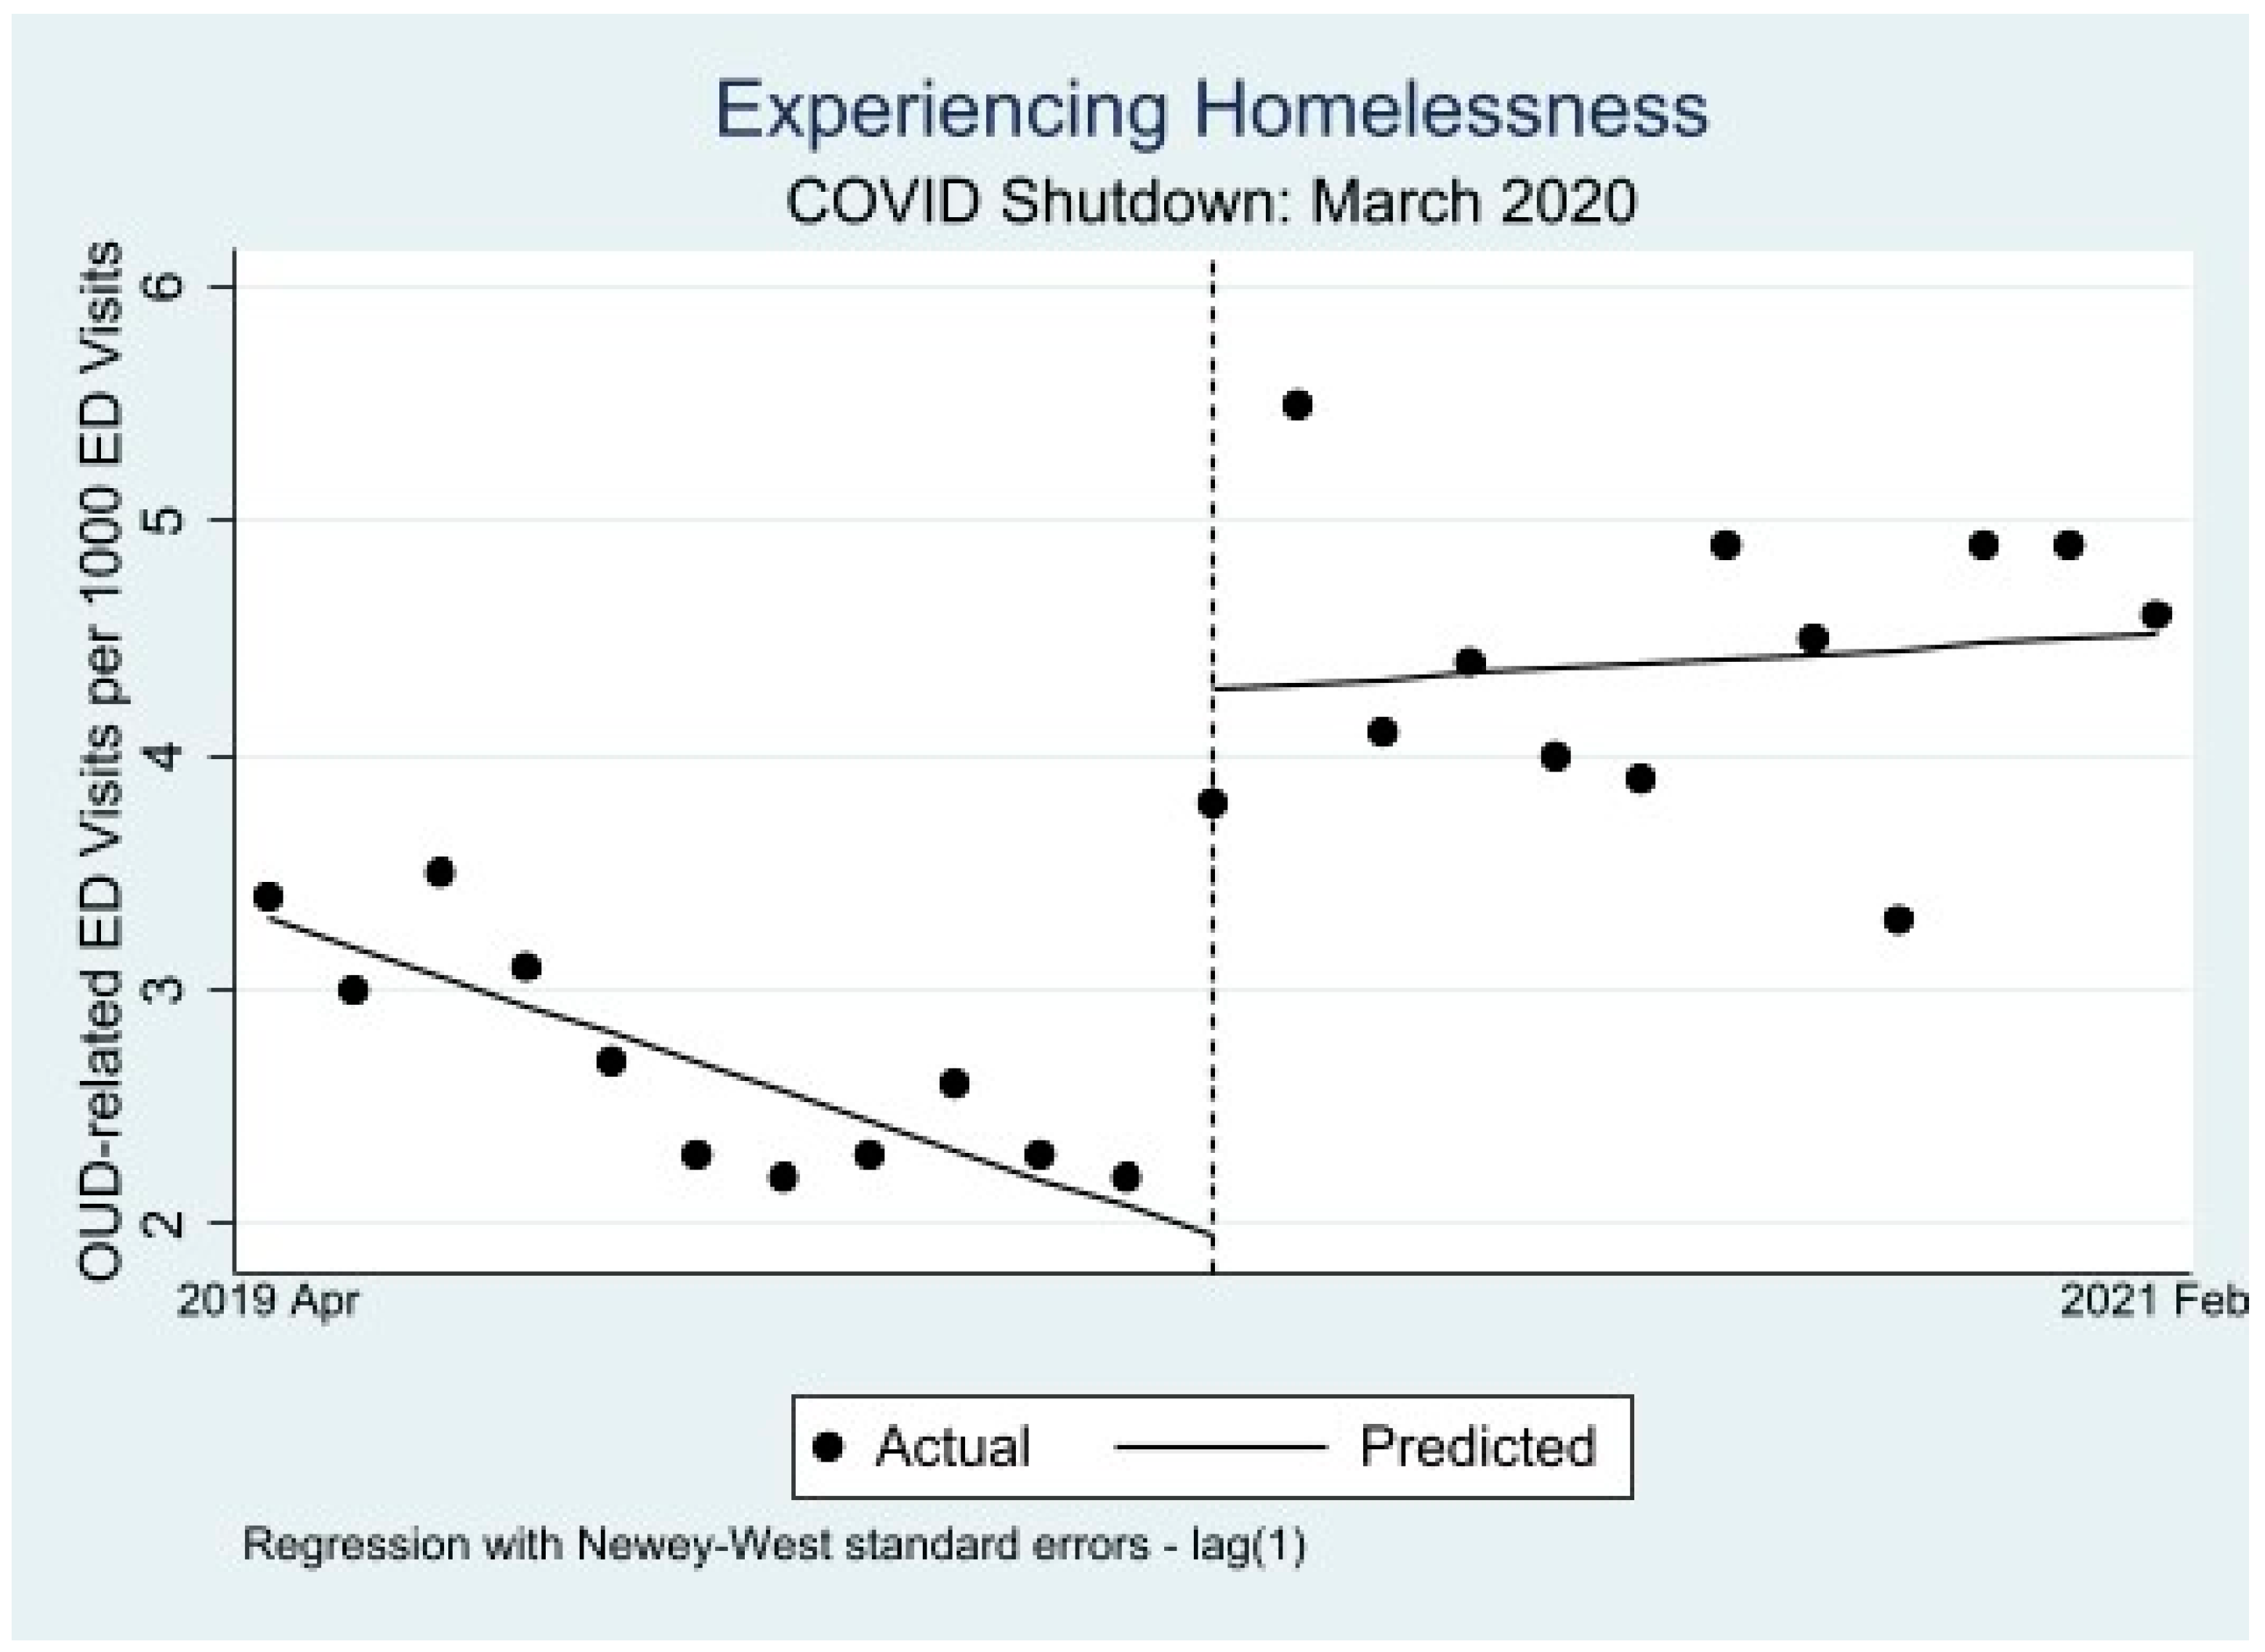
4.1. A Closer Look at Vulnerable Groups
4.2. Limitations
5. Conclusions
Author Contributions
Funding
Institutional Review Board Statement
Informed Consent Statement
Data Availability Statement
Conflicts of Interest
Appendix A


| Low Acuity | Homeless | |
|---|---|---|
| Total N | 269 | 359 |
| Pretrend | −0.013 (0.008) [−0.030, 0.004] | −0.01 (0.019) [−0.050, 0.030] |
| Level change in April 2020 | 0.212 (0.096) [0.010, 0.413] | 0.420 (0.171) [0.061, 0.778] |
| Change in trend (post–pre) | 0.056 (0.021) [0.012, 0.010] | 0.035 (0.023) [−0.014, 0.083] |
| Preperiod level | 0.400 (0.048) [0.300, 0.500] | 0.495 (0.108) [0.269, 0.722] |
| Postestimation Command | ||
| Weekly change in outcome during COVID | 0.043 (0.019) [0.003, 0.083] | 0.025 (0.016) [−0.008, 0.058] |
| Low Acuity | Homeless | |
|---|---|---|
| Total N | 671 | 573 |
| Pretrend | −0.034 (0.017) [−0.070, 0.003] | −0.082 (0.009) [−0.101, −0.063] |
| Level change in April 2020 | 0.439 (0.401) [−0.401, 1.278] | 0.906 (0.159) [0.573, 1.239] |
| Change in trend (post–pre) | 0.125 (0.066) [−0.138, 0.264] | 0.070 (0.030) [0.006, 0.133] |
| Preperiod level | 1.105 (0.110) [0.875, 1.334] | 1.336 (0.049) [1.233, 1.440] |
| Postestimation Command | ||
| Weekly change in outcome during COVID | 0.091 (0.062) [−0.039, 0.222] | −0.012 (0.029) [−0.073, 0.049] |
| Low Acuity | Homeless | |
|---|---|---|
| Total N | 169 | 288 |
| Pretrend | 0.000 (0.006) [−0.013, 0.013] | −0.025 (0.014) [−0.056, 0.005] |
| Level change in April 2020 | −0.061 (0.076) [−0.221, 0.099] | 0.431 (0.019) [0.209, 0.653] |
| Change in trend (post–pre) | 0.034 (0.014) [0.006, 0.063] | 0.031 (0.019) [−0.008, 0.070] |
| Preperiod level | 0.273 (0.037) [0.196, 0.350] | 0.545 (0.101) [0.335, 0.756] |
| Postestimation Command | ||
| Weekly change in outcome during COVID | 0.0343 (0.012) [0.009, 0.060] | 0.005 (0.012) [−0.020, 0.030] |
| Characteristic | All Patients (%) | OUD Patients (%) | Non-OUD Patients (%) |
|---|---|---|---|
| Total | 520,991 (100) | 5919 (1.14) | 515,072 (98.9) |
| Gender | |||
| Male | 270,970 (52.0) | 3824 (64.6) | 267,148 (51.9) |
| Female | 250,019 (48.0) | 2095 (35.4) | 247,924 (48.1) |
| Age | |||
| <18 | 66,840 (12.8) | 108 (1.8) | 66,732 (13.0) |
| 19–39 | 163,704 (31.4) | 2225 (37.6) | 161,479 (31.4) |
| 40–64 | 225,795 (43.3) | 2845 (48.1) | 222,950 (43.3) |
| 65–80 | 52,197 (10.0) | 650 (11.0) | 51,547 (10.0) |
| >80 | 11,277 (2.2) | 85 (1.4) | 11,192 (2.2) |
| Race/Ethnicity | |||
| Black | 67,308 (12.9) | 869 (14.7) | 66,439 (12.9) |
| White | 24,600 (4.7) | 706 (11.9) | 23,894 (4.6) |
| Asian | 22,325 (4.3) | 146 (2.5) | 22,179 (4.3) |
| Hispanic/Latino | 338,570 (65.0) | 2527 (42.7) | 336,043 (65.2) |
| Other Race | 64,032 (12.3) | 1640 (27.7) | 62,392 (12.1) |
| Payor Status | |||
| LA County Safety Net | 438,436 (84.2) | 4792 (81.0) | 433,644 (84.2) |
| Medicaid Managed Care | 174,616 (33.5) | 2595 (43.8) | 172,021 (33.4) |
| Medicare | 46,414 (13.8) | 822 (13.9) | 45,592 (8.9) |
| Private | 37,683 (7.2) | 339 (5.7) | 37,344 (7.3) |
| Other | 34,573 (6.6) | 191 (3.10) | 34,382 (6.5) |
| No insurance | 42,902 (8.2) | 470 (7.9) | 42,432 (8.2) |
| Experiencing Homelessness | 42,357 (8.1) | 1789 (30.2) | 40,568 (7.9) |
| Study Period | |||
| Period 1 (April 2019–February 2020) | 296,642 (56.9) | 2763 (46.7) | 293,879 (57.1) |
| Period 2 (April 2020–February 2021) | 224,349 (43.1) | 3156 (53.3) | 221,193 (42.9) |
| High Acuity | 5400 (1.08) | 2160 (36.5) | 5116 (1.04) |
| Low Acuity | 102,077 (20.4) | 1474 (24.9) | 99,648 (20.2) |
| Brought in by Ambulance | |||
| Yes | 87,679 (16.8) | 2473 (41.8) | 88,206 (16.5) |
| No | 433,312 (83.2) | 3446 (58.2) | 429,866 (83.5) |
| Disposition | |||
| Admit | 77,381 (14.9) | 2843 (48.0) | 74,538 (14.5) |
| Discharge | 366,307 (70.3) | 2288 (38.7) | 364,019 (70.7) |
| Transfer | 27,402 (5.3) | 414 (7.0) | 26,988 (5.2) |
| LWBS a and LBTC b | 42,874 (8.2) | 241 (4.1) | 42,633 (8.2) |
| Psychiatric Hold | 34,855 (6.7) | 739 (12.5) | 34,116 (6.6) |
| Emergency Department | |||
| Harbor | 158,930 (30.5) | 1529 (25.8) | 157,401 (30.6) |
| Oliveview | 120,744 (23.2) | 1464 (24.7) | 119,280 (23.2) |
| LAC + USC | 241,317 (46.3) | 2926 (49.4) | 238,391 (46.3) |
Appendix B
| ICD 10 Code | Freq | Percent |
|---|---|---|
| F11.10 | 1488 | 31.71 |
| F11.120 | 13 | 0.28 |
| F11.121 | 1 | 0.02 |
| F11.129 | 65 | 1.39 |
| F11.14 | 4 | 0.09 |
| F11.151 | 3 | 0.06 |
| F11.159 | 15 | 0.32 |
| F11.188 | 33 | 0.70 |
| F11.19 | 17 | 0.36 |
| F11.20 | 557 | 11.87 |
| F11.220 | 5 | 0.11 |
| F11.221 | 1 | 0.02 |
| F11.222 | 1 | 0.02 |
| F11.229 | 10 | 0.21 |
| F11.23 | 348 | 7.42 |
| F11.24 | 7 | 0.15 |
| F11.250 | 2 | 0.04 |
| F11.251 | 1 | 0.02 |
| F11.259 | 8 | 0.17 |
| F11.288 | 15 | 0.32 |
| F11.29 | 425 | 9.06 |
| F11.90 | 231 | 4.92 |
| F11.920 | 1 | 0.02 |
| F11.929 | 8 | 0.17 |
| F11.93 | 75 | 1.60 |
| F11.94 | 11 | 0.23 |
| F11.950 | 1 | 0.02 |
| F11.951 | 2 | 0.04 |
| F11.959 | 6 | 0.13 |
| F11.988 | 20 | 0.43 |
| F11.99 | 367 | 7.82 |
| T40.1X1A | 58 | 1.24 |
| T40.1X4A | 5 | 0.11 |
| T40.2X1A | 138 | 2.94 |
| T40.2X4A | 12 | 0.26 |
| T40.2X5A | 373 | 7.95 |
| T40.2X5D | 10 | 0.21 |
| T40.2X5S | 5 | 0.11 |
| T40.3X1A | 10 | 0.21 |
| T40.3X5A | 3 | 0.06 |
| T40.4X1A | 28 | 0.60 |
| T40.4X4A | 1 | 0.02 |
| T40.4X5A | 27 | 0.58 |
| T40.601A | 41 | 0.87 |
| T40.604A | 6 | 0.13 |
| T40.605A | 53 | 1.13 |
| T40.605D | 3 | 0.06 |
| T40.605S | 1 | 0.02 |
| T40.691A | 1 | 0.02 |
| T40.695A | 1 | 0.02 |
| Multiple Values | 175 | 3.73 |
References
- D’Onofrio, G.; Venkatesh, A.; Hawk, K. The Adverse Impact of COVID-19 on Individuals with OUD Highlights the Urgent Need for Reform to Leverage Emergency Department–Based Treatment. Nejm Catal. 2020. Available online: https://catalyst.nejm.org/doi/full/10.1056/CAT.20.0190 (accessed on 1 February 2023).
- Khatri, U.G.; Perrone, J. Opioid Use Disorder and COVID-19: Crashing of the Crises. J. Addict. Med. 2020, 14, e6–e7. [Google Scholar] [CrossRef]
- Ahmad, F.B.; Rossen, L.M.; Sutton, P. Provisional Drug Overdose Death Counts; National Center for Health Statistics: Hyattsville, MD, USA, 2021.
- Holland, K.M.; Jones, C.; Vivolo-Kantor, A.M.; Idaikkadar, N.; Zwald, M.; Hoots, B.; Yard, E.; D’Inverno, A.; Swedo, E.; Chen, M.S.; et al. Trends in US Emergency Department Visits for Mental Health, Overdose, and Violence Outcomes Before and during the COVID-19 Pandemic. JAMA Psychiatry 2021, 78, 372–379. [Google Scholar] [CrossRef]
- Rodda, L.N.; West, K.L.; LeSaint, K.T. Opioid Overdose-Related Emergency Department Visits and Accidental Deaths during the COVID-19 Pandemic. J. Urban Health 2020, 97, 808–813. [Google Scholar] [CrossRef]
- Slavova, S.; Rock, P.; Bush, H.M.; Quesinberry, D.; Walsh, S.L. Signal of increased opioid overdose during COVID-19 from emergency medical services data. Drug Alcohol Depend. 2020, 214, 108176. [Google Scholar] [CrossRef]
- Soares, W.E., 3rd; Melnick, E.R.; Nath, B.; D’Onofrio, G.; Paek, H.; Skains, R.M.; Walter, L.A.; Casey, M.F.; Napoli, A.; Hoppe, J.A.; et al. Emergency Department Visits for Nonfatal Opioid Overdose during the COVID-19 Pandemic across Six US Health Care Systems. Ann. Emerg. Med. 2022, 79, 158–167. [Google Scholar] [CrossRef]
- Volkow, N.D. Collision of the COVID-19 and Addiction Epidemics. Ann. Intern. Med. 2020, 173, 61–62. [Google Scholar] [CrossRef] [Green Version]
- Ochalek, T.A.; Cumpston, K.L.; Wills, B.K.; Gal, T.S.; Moeller, F.G. Nonfatal Opioid Overdoses at an Urban Emergency Department during the COVID-19 Pandemic. JAMA 2020, 324, 1673–1674. [Google Scholar] [CrossRef]
- Haley, D.F.; Saitz, R. The Opioid Epidemic during the COVID-19 Pandemic. JAMA 2020, 324, 1615–1617. [Google Scholar] [CrossRef]
- Substance Abuse Prevention and Control. Data Report: Accidental Drug Overdose Deaths in Los Angeles County during the COVID 19 Pandemic; County of Los Angeles Department of Public Health: Alexandria, VA, USA, 2021.
- Gutovitz, S.; Pangia, J.; Finer, A.; Rymer, K.; Johnson, D. Emergency Department Utilization and Patient Outcomes during the COVID-19 Pandemic in America. J. Emerg. Med. 2021, 60, 798–806. [Google Scholar] [CrossRef]
- Hartnett, K.P.; Kite-Powell, A.; DeVies, J.; Coletta, M.A.; Boehmer, T.K.; Adjemian, J.; Gundlapalli, A.V. Impact of the COVID-19 Pandemic on Emergency Department Visits—United States, January 1, 2019–May 30, 2020. MMWR Morb. Mortal. Wkly Rep. 2020, 69, 699–704. [Google Scholar] [CrossRef]
- Lange, S.J.; Ritchey, M.D.; Goodman, A.B.; Dias, T.; Twentyman, E.; Fuld, J.; Yang, Q. Potential Indirect Effects of the COVID-19 Pandemic on Use of Emergency Departments for Acute Life-Threatening Conditions—United States, January-May 2020. MMWR Morb. Mortal. Wkly Rep. 2020, 69, 795–800. [Google Scholar] [CrossRef]
- Lam, C.N.; Axeen, S.; Terp, S.; Burner, E.; Dworkis, D.A.; Arora, S.; Menchine, M. Who Stayed Home Under Safer-at-Home? Impacts of COVID-19 on Volume and Patient-Mix at an Emergency Department. West. J. Emerg. Med. 2021, 22, 234–243. [Google Scholar] [CrossRef]
- Rikin, S.; Perez, H.R.; Zhang, C.; Khalid, L.; Groeger, J.; Deng, Y.; Starrels, J.L. Changes in Outpatient Opioid Prescribing during the COVID-19 Pandemic: An Interrupted Time Series Analysis. J. Prim. Care Community Health 2022, 13, 21501319221076926. [Google Scholar] [CrossRef]
- Manchikanti, L.; Vanaparthy, R.; Atluri, S.; Sachdeva, H.; Kaye, A.D.; Hirsch, J.A. COVID-19 and the Opioid Epidemic: Two Public Health Emergencies That Intersect With Chronic Pain. Pain Ther. 2021, 10, 269–286. [Google Scholar] [CrossRef]
- Williams, J.C.; Ball, M.; Roscoe, N.; Harowitz, J.; Hobbs, R.J.; Raman, H.N.; Seltzer, M.K.; Vo, L.C.; Cagande, C.C.; Alexander-Bloch, A.F.; et al. Widening Racial Disparities during COVID-19 Telemedicine Transition: A Study of Child Mental Health Services at Two Large Children’s Hospitals. J. Am. Acad. Child Adolesc. Psychiatry 2023, 62, 447–456. [Google Scholar] [CrossRef]
- Tong, L.; George, B.; Crotty, B.H.; Somai, M.; Taylor, B.W.; Osinski, K.; Luo, J. Telemedicine and health disparities: Association between patient characteristics and telemedicine, in-person, telephone and message-based care during the COVID-19 pandemic. IPEM Transl. 2022, 3, 100010. [Google Scholar] [CrossRef]
- Katzow, M.W.; Steinway, C.; Jan, S. Telemedicine and Health Disparities during COVID-19. Pediatrics 2020, 146, e20201586. [Google Scholar] [CrossRef]
- Julien, H.M.; Eberly, L.A.; Adusumalli, S. Telemedicine and the Forgotten America. Circulation 2020, 142, 312–314. [Google Scholar] [CrossRef]
- Bourgois, P.; Holmes, S.M.; Sue, K.; Quesada, J. Structural Vulnerability: Operationalizing the Concept to Address Health Disparities in Clinical Care. Acad. Med. 2017, 92, 299–307. [Google Scholar] [CrossRef]
- Khatri, U.G.; Pizzicato, L.N.; Viner, K.; Bobyock, E.; Sun, M.; Meisel, Z.F.; South, E.C. Racial/Ethnic Disparities in Unintentional Fatal and Nonfatal Emergency Medical Services-Attended Opioid Overdoses during the COVID-19 Pandemic in Philadelphia. JAMA Netw. Open 2021, 4, e2034878. [Google Scholar] [CrossRef]
- Tai, D.B.G.; Sia, I.G.; Doubeni, C.A.; Wieland, M.L. Disproportionate Impact of COVID-19 on Racial and Ethnic Minority Groups in the United States: A 2021 Update. J. Racial Ethn. Health Disparities 2022, 9, 2334–2339. [Google Scholar] [CrossRef]
- Gordon, S.H.; Gadbois, E.A.; Shield, R.R.; Vivier, P.M.; Ndumele, C.D.; Trivedi, A.N. Qualitative perspectives of primary care providers who treat Medicaid managed care patients. BMC Health Serv. Res. 2018, 18, 728. [Google Scholar] [CrossRef] [Green Version]
- Ludomirsky, A.B.; Schpero, W.L.; Wallace, J.; Lollo, A.; Bernheim, S.; Ross, J.S.; Ndumele, C.D. In Medicaid Managed Care Networks, Care Is Highly Concentrated Among A Small Percentage Of Physicians. Health Aff. 2022, 41, 760–768. [Google Scholar] [CrossRef]
- Los Angeles County Department of Health Services, 2022 Annual Report, Department of Health Services Los Angeles County, 23 Febuary 2023. Available online: https://dhs.lacounty.gov/who-we-are/our-reports (accessed on 20 March 2023).
- County of Los Angeles Department of Public Health. LA County COVID-19 Surveillance Dashboard. Available online: http://dashboard.publichealth.lacounty.gov/covid19_surveillance_dashboard/ (accessed on 20 March 2023).
- Gilboy, N. Agency for Healthcare Research and Quality. Emergency Severity Index. Version 4: Implementation Handbook, 2012 ed.; Agency for Healthcare Research and Quality: Rockville, MD, USA, 2012. Available online: https://purl.fdlp.gov/GPO/gpo23161 (accessed on 6 March 2023).
- Agency for Healthcare Research and Quality. Preventable Emergency Department Visits; Agency for Healthcare Research and Quality: Rockville, MD, USA, 2018.
- Jemberie, W.B.; Stewart Williams, J.; Eriksson, M.; Gronlund, A.S.; Ng, N.; Blom Nilsson, M.; Padyab, M.; Priest, K.C.; Sandlund, M.; Snellman, F.; et al. Substance Use Disorders and COVID-19: Multi-Faceted Problems Which Require Multi-Pronged Solutions. Front. Psychiatry 2020, 11, 714. [Google Scholar] [CrossRef]
- Friedman, J.; Hansen, H.; Bluthenthal, R.N.; Harawa, N.; Jordan, A.; Beletsky, L. Growing racial/ethnic disparities in overdose mortality before and during the COVID-19 pandemic in California. Prev. Med. 2021, 153, 106845. [Google Scholar] [CrossRef]


| Measure | Period 1: | Period 2: | Difference |
|---|---|---|---|
| April 2019–February 2020 | April 2020–February 2021 | Period 2–Period 1 | |
| N (% of All Visits) | N (% of All Visits) | % Difference [95% CI] | |
| All Visits OUD Visits | 296,642 (100) | 224,349 (100) | - |
| 2763 (0.93) | 3156 (1.41) | 0.48 [0.42, 0.53] | |
| N (% of OUD Visits) | N (% of OUD Visits) | % Difference [95% CI] | |
| Race/Ethnicity | |||
| Black | 360 (13.0) | 509 (16.1) | 3.10 [1.29, 4.90] |
| White | 339 (12.3) | 367 (11.6) | −0.64 [−2.30, 1.01] |
| Hispanic/Latino | 1229 (44.5) | 1298 (41.1) | −3.35 [−5.88, 0.83] |
| OUD-Related Acuity | |||
| High | 1028 (37.2) | 1132 (35.9) | −1.33 [−3.80, 1.12] |
| Low | 607 (22.0) | 867 (27.5) | 5.50 [3.30, 7.70] |
| Payor | |||
| LA County Safety Net | 2244 (81.2) | 2548 (80.7) | −0.48 [−2.48, 1.52] |
| Medicaid Managed Care | 1183 (42.8) | 1412 (44.7) | 1.92 [−0.61, 4.45] |
| Other Characteristics | |||
| Male Gender | 1868 (67.6) | 1956 (62.0) | −5.63 [−8.07, −3.19] |
| Experiencing Homelessness | 800 (29.0) | 989 (31.3) | 2.38 [0.04, 4.72] |
| All Encounters | White | Black | Hispanic | Acuity: High | Acuity: Low | |
|---|---|---|---|---|---|---|
| Total N | 5919 | 732 | 913 | 2622 | 2264 | 1527 |
| Pretrend | −0.033 (0.027) [−0.088, 0.023] | 0.01 (0.015) [−0.021, 0.041] | −0.017 (0.028) [−0.075, 0.040] | −0.065 (0.023) [−0.113, −0.018] | 0.118 (0.033) [0.048, 0.188] | −0.068 (0.019) [−0.109, −0.028] |
| Level change in April 2020 | 4.427 (0.766) [2.824, 6.030] | 0.410 (0.148) [0.101, 0.719] | 0.920 (0.229) [0.441, 1.399] | 1.828 (0.638) [0.492, 3.164] | 0.747 (0.417) [−0.126, 1.62] | 1.021 (0.633) [−0.304, 2.345] |
| Change in trend (post–pre) | 0.133 (0.0143) [−0.166, 0.432] | −0.005 (0.029) [−0.067, 0.056] | 0.056 (0.033) [−0.012, 0.124] | 0.105 (0.121) [−0.149, 0.359] | −0.090 (0.067) [−0.230, 0.051] | 0.286 (0.108) [0.061, 0.512] |
| Preperiod level | 9.472 (0.167) [9.123, 9.822] | 1.086 (0.070) [0.940, 1.233] | 1.304 (0.134) [1.024, 1.585] | 4.472 (0.109) [4.244, 4.702] | 2.845 (0.209) [2.409, 3.282] | 2.40 (0.124) [2.135, 2.655] |
| Postestimation Commands | ||||||
| Weekly change in outcome during COVID | 0.100 (0.140) [−0.192, 0.393] | 0.005 (0.024) [−0.046, 0.056] | 0.039 (0.018) [0.001, 0.077] | 0.040 (0.115) [−0.200, 0.280] | 0.0287 (0.058) [−0.094, 0.151] | 0.218 (0.105) [−0.002, 0.439] |
| All Encounters | Medicaid Managed Care | LA County Safety Net | |
|---|---|---|---|
| Total N | 5919 | 2595 | 4792 |
| Pretrend | −0.033 (0.027) [−0.088, 0.023] | −0.022 (0.032) [−0.088, 0.045] | −0.032 (0.019) [−0.072, 0.008] |
| Level change in April 2020 | 4.427 (0.766) [2.824, 6.030] | 2.229 (0.427) [1.337, 3.122] | 3.945 (0.792) [2.287, 5.603] |
| Change in trend (post–pre) | 0.133 (0.0143) [−0.166, 0.432] | 0.059 (0.086) [−0.121, 0.238] | 0.048 (0.145) [−0.254, 0.351] |
| Preperiod level | 9.472 (0.167) [9.123, 9.822] | 4.1 (0.155) [3.775, 4.425] | 7.723 (0.137) [7.436, 8.009] |
| Postestimation Commands | |||
| Weekly change in outcome during COVID | 0.100 (0.140) [−0.192, 0.393] | 0.037 (0.078) [−0.127, 0.200] | 0.0164 (0.143) [−0.282, 0.315] |
Disclaimer/Publisher’s Note: The statements, opinions and data contained in all publications are solely those of the individual author(s) and contributor(s) and not of MDPI and/or the editor(s). MDPI and/or the editor(s) disclaim responsibility for any injury to people or property resulting from any ideas, methods, instructions or products referred to in the content. |
© 2023 by the authors. Licensee MDPI, Basel, Switzerland. This article is an open access article distributed under the terms and conditions of the Creative Commons Attribution (CC BY) license (https://creativecommons.org/licenses/by/4.0/).
Share and Cite
Johnson, E.; Axeen, S.; Vosooghi, A.; Lam, C.N.; Bluthenthal, R.; Schneberk, T. Interrupted Time Series Analysis: Patient Characteristics and Rates of Opioid-Use-Disorder-Related Emergency Department Visits in the Los Angeles County Public Hospital System during COVID-19. Healthcare 2023, 11, 979. https://doi.org/10.3390/healthcare11070979
Johnson E, Axeen S, Vosooghi A, Lam CN, Bluthenthal R, Schneberk T. Interrupted Time Series Analysis: Patient Characteristics and Rates of Opioid-Use-Disorder-Related Emergency Department Visits in the Los Angeles County Public Hospital System during COVID-19. Healthcare. 2023; 11(7):979. https://doi.org/10.3390/healthcare11070979
Chicago/Turabian StyleJohnson, Emily, Sarah Axeen, Aidan Vosooghi, Chun Nok Lam, Ricky Bluthenthal, and Todd Schneberk. 2023. "Interrupted Time Series Analysis: Patient Characteristics and Rates of Opioid-Use-Disorder-Related Emergency Department Visits in the Los Angeles County Public Hospital System during COVID-19" Healthcare 11, no. 7: 979. https://doi.org/10.3390/healthcare11070979