
Mortality Evaluation and Life Expectancy Prediction of Patients with Hepatocellular Carcinoma with Data Mining
 ,
,
Abstract
:1. Introductory Statement
2. Methods and Materials
Data Preprocessing and Variables Conversion
3. Data Mining Model
3.1. CART
3.2. Post-Pruning CART (PPC)
3.3. Random Forest
3.4. XGBoost
3.5. Model Evaluation
Descriptive Statistics
4. Results
5. Discussion
Author Contributions
Funding
Institutional Review Board Statement
Data Availability Statement
Conflicts of Interest
References
- Sung, H.; Ferlay, J.; Siegel, R.L.; Laversanne, M.; Soerjomataram, I.; Jemal, A.; Bray, F. Global cancer statistics 2020: GLOBOCAN estimates of incidence and mortality worldwide for 36 cancers in 185 countries. CA Cancer J. Clin. 2021, 71, 209–249. [Google Scholar] [CrossRef] [PubMed]
- Siegel, R.L.; Miller, K.D.; Fuchs, H.E.; Jemal, A. Cancer statistics, 2022. CA Cancer J. Clin. 2022, 72, 7–33. [Google Scholar] [CrossRef]
- Kim, B.K.; Kim, S.U.; Park, J.Y.; Kim, D.Y.; Ahn, S.H.; Park, M.S.; Kim, E.H.; Seong, J.; Lee, D.Y.; Han, K.-H. Applicability of BCLC stage for prognostic stratification in comparison with other staging systems: Single centre experience from long-term clinical outcomes of 1717 treatment-naïve patients with hepatocellular carcinoma. Liver Int. 2012, 32, 1120–1127. [Google Scholar] [CrossRef]
- Reig, M.; Forner, A.; Rimola, J.; Ferrer-Fàbrega, J.; Burrel, M.; Garcia-Criado, Á.; Kelley, R.K.; Galle, P.R.; Mazzaferro, V.; Salem, R.; et al. BCLC strategy for prognosis prediction and treatment recommendation: The 2022 update. J. Hepatol. 2022, 76, 681–693. [Google Scholar] [CrossRef]
- Priyam, A.; Abhijeeta, G.; Rathee, A.; Srivastava, S. Comparative analysis of decision tree classification algorithms. Int. J. Curr. Eng. Technol. 2013, 3, 334–337. [Google Scholar]
- Decherchi, S.; Pedrini, E.; Mordenti, M.; Cavalli, A.; Sangiorgi, L. Opportunities and Challenges for Machine Learning in Rare Diseases. Front. Med. 2021, 8, 1696. [Google Scholar] [CrossRef]
- Song, Y.-Y.; Ying, L. Decision tree methods: Applications for classification and prediction. Shanghai Arch. Psychiatry 2015, 27, 130. [Google Scholar]
- Bellazzi, R.; Zupan, B. Predictive data mining in clinical medicine: Current issues and guidelines. Int. J. Med. Inform. 2008, 77, 81–97. [Google Scholar] [CrossRef] [Green Version]
- AbdelMoez, W.; Kholief, M.; Elsalmy, F.M. Improving bug fix-time prediction model by filtering out outliers. In Proceedings of the 2013 the International Conference on Technological Advances in Electrical, Electronics and Computer Engineering (TAEECE), Konya, Turkey, 9–11 May 2013. [Google Scholar]
- Sasikala, S.; Bharathidason, S.; Venkateswaran, C.J. Improving classification accuracy based on random forest model through weighted sampling for noisy data with linear decision boundary. Indian J. Sci. Technol. 2015, 8, 614–619. [Google Scholar] [CrossRef]
- Smith, M.R.; Martinez, T. Improving classification accuracy by identifying and removing instances that should be misclassified. In Proceedings of the 2011 International Joint Conference on Neural Networks, San Jose, CA, USA, 31 July–5 August 2011. [Google Scholar]
- Podgorelec, V.; Hericko, M.; Rozman, I. Improving mining of medical data by outliers prediction. In Proceedings of the 18th IEEE Symposium on Computer-Based Medical Systems (CBMS’05), Dublin, Ireland, 23–24 June 2005. [Google Scholar]
- Thongkam, J.; Xu, G.; Zhang, Y.; Huang, F. Toward breast cancer survivability prediction models through improving training space. Expert Syst. Appl. 2009, 36, 12200–12209. [Google Scholar] [CrossRef]
- Straus, S.E.; Glasziou, P.; Richardson, W.S.; Haynes, R.B. Evidence-Based Medicine E-Book: How to Practice and Teach EBM; Elsevier Health Sciences: Amsterdam, The Netherlands, 2018. [Google Scholar]
- Wang, C.-Y.; Li, S. Clinical characteristics and prognosis of 2887 patients with hepatocellular carcinoma. Medicine 2019, 98, e14070–e14085. [Google Scholar] [CrossRef] [PubMed]
- Wang, J.-H.; Changchien, C.-S.; Hu, T.-H.; Lee, C.-M.; Kee, K.-M.; Lin, C.-Y.; Chen, C.-L.; Chen, T.-Y.; Huang, Y.-J.; Lu, S.-N. The efficacy of treatment schedules according to Barcelona Clinic Liver Cancer staging for hepatocellular carcinoma—Survival analysis of 3892 patients. Eur. J. Cancer 2008, 44, 1000–1006. [Google Scholar] [CrossRef]
- Cabibbo, G.; Enea, M.; Attanasio, M.; Bruix, J.; Craxì, A.; Cammà, C. A meta-analysis of survival rates of untreated patients in randomized clinical trials of hepatocellular carcinoma. Hepatology 2010, 51, 1274–1283. [Google Scholar] [CrossRef] [Green Version]
- Gómez-Rodríguez, R.; Romero-Gutiérrez, M.; Artaza-Varasa, T.; González-Frutos, C.; Ciampi-Dopazo, J.J.; de-la-Cruz-Pérez, G.; Sánchez-Ruano, J.J. The value of the Barcelona Clinic Liver Cancer and alpha-fetoprotein in the prognosis of hepatocellular carcinoma. Rev. Esp. Enferm. Dig. 2012, 104, 298. [Google Scholar] [CrossRef] [PubMed] [Green Version]
- Tangkijvanich, P.; Anukulkarnkusol, N.; Suwangool, P.; Lertmaharit, S.; Hanvivatvong, O.; Kullavanijaya, P.; Poovorawan, Y. Clinical characteristics and prognosis of hepatocellular carcinoma: Analysis based on serum alpha-fetoprotein levels. J. Clin. Gastroenterol. 2000, 31, 302–308. [Google Scholar] [CrossRef] [PubMed]
- Llovet, J.M. Hepatocellular carcinoma. Lancet 2003, 362, 1907–1917. [Google Scholar] [CrossRef] [PubMed] [Green Version]
- Andreou, A.; Vauthey, J.-N.; Cherqui, D.; Zimmitti, G.; Ribero, D.; Truty, M.J.; Wei, S.H.; Curley, S.A.; Laurent, A.; Poon, R.T.; et al. Improved long-term survival after major resection for hepatocellular carcinoma: A multicenter analysis based on a new definition of major hepatectomy. J. Gastrointest. Surg. 2013, 17, 66–77. [Google Scholar] [CrossRef] [PubMed]
- Dahiya, D.; Wu, T.-J.; Lee, C.-F.; Chan, K.-M.; Lee, W.-C.; Chen, M.-F. Minor versus major hepatic resection for small hepatocellular carcinoma (HCC) in cirrhotic patients: A 20-year experience. Surgery 2010, 147, 676–685. [Google Scholar] [CrossRef] [PubMed]
- Hsu, K.-Y.; Chau, G.-Y.; Lui, W.-Y.; Tsay, S.-H.; King, K.-L.; Wu, C.-W. Predicting morbidity and mortality after hepatic resection in patients with hepatocellular carcinoma: The role of Model for End-Stage Liver Disease score. World J. Surg. 2009, 33, 2412–2419. [Google Scholar] [CrossRef]
- Marelli, L.; Stigliano, R.; Triantos, C.; Senzolo, M.; Cholongitas, E.; Davies, N.; Tibballs, J.; Meyer, T.; Patch, D.W.; Burroughs, A.K. Transarterial therapy for hepatocellular carcinoma: Which technique is more effective? A systematic review of cohort and randomized studies. Cardiovasc. Interv. Radiol. 2007, 30, 6–25. [Google Scholar] [CrossRef]
- Chan, A.O.; Yuen, M.F.; Hui, C.K.; Tso, W.K.; Lai, C.L. A prospective study regarding the complications of transcatheter intraarterial lipiodol chemoembolization in patients with hepatocellular carcinoma. Cancer 2002, 94, 1747–1752. [Google Scholar] [CrossRef]
- Tateishi, R. Proposal of a new prognostic model for hepatocellular carcinoma: An analysis of 403 patients. Gut 2005, 54, 419–425. [Google Scholar] [CrossRef] [Green Version]
- Siriwardana, R.C.; Niriella, M.A.; Dassanayake, A.S.; Liyanage, C.A.H.; Upasena, A.; Sirigampala, C.; de Silva, H.J. Factors affecting post-embolization fever and liver failure after trans-arterial chemo-embolization in a cohort without background infective hepatitis—A prospective analysis. BMC Gastroenterol. 2015, 15, 1–5. [Google Scholar] [CrossRef] [PubMed] [Green Version]
- Kohla, M.A.S.; Abu Zeid, M.I.; Al-Warraky, M.; Taha, H.; Gish, R.G. Predictors of hepatic decompensation after TACE for hepatocellular carcinoma. BMJ Open Gastroenterol. 2015, 2, e000032. [Google Scholar] [CrossRef]
- Huang, Y.-S.; Chiang, J.-H.; Wu, J.-C.; Chang, F.-Y.; Lee, S.-D. Risk of hepatic failure after transcatheter arterial chemoembolization for hepatocellular carcinoma: Predictive value of the monoethylglycinexylidide test. Am. J. Gastroenterol. 2002, 97, 1223–1227. [Google Scholar] [CrossRef] [PubMed]
- Grieco, A. Prognostic factors for survival in patients with early-intermediate hepatocellular carcinoma undergoing non-surgical therapy: Comparison of Okuda, CLIP, and BCLC staging systems in a single Italian centre. Gut 2005, 54, 411–418. [Google Scholar] [CrossRef]
- Nojiri, S.; Joh, T. Albumin Suppresses Human Hepatocellular Carcinoma Proliferation and the Cell Cycle. Int. J. Mol. Sci. 2014, 15, 5163–5174. [Google Scholar] [CrossRef] [PubMed]
- Bağırsakçı, E.; Şahin, E.; Atabey, N.; Erdal, E.; Guerra, V.; Carr, B.I. Role of Albumin in Growth Inhibition in Hepatocellular Carcinoma. Oncology 2017, 93, 136–142. [Google Scholar] [CrossRef]
- Choi, G.-H.; Kim, D.-H.; Kang, C.-M.; Kim, K.-S.; Choi, J.-S.; Lee, W.-J.; Kim, B.R. Prognostic Factors and Optimal Treatment Strategy for Intrahepatic Nodular Recurrence After Curative Resection of Hepatocellular Carcinoma. Ann. Surg. Oncol. 2007, 15, 618–629. [Google Scholar] [CrossRef]
- Brar, G.; Greten, T.F.; Graubard, B.I.; McNeel, T.S.; Petrick, J.L.; McGlynn, K.A.; Altekruse, S.F. Hepatocellular Carcinoma Survival by Etiology: A SEER-Medicare Database Analysis. Hepatol. Commun. 2020, 4, 1541–1551. [Google Scholar] [CrossRef]
- Golabi, P.; Fazel, S.; Otgonsuren, M.; Sayiner, M.; Locklear, C.T.; Younossi, Z.M. Mortality assessment of patients with hepatocellular carcinoma according to underlying disease and treatment modalities. Medicine 2017, 96, e5904–e5989. [Google Scholar] [CrossRef]
- Marcus, J.L.; Hurley, L.B.; Chamberland, S.; Champsi, J.H.; Korn, D.G.; Lai, J.B.; Lam, J.O.; Quesenberry, C.P., Jr.; Ready, J.; Saxena, V.; et al. Life Expectancy of Insured People with and without Hepatitis C Virus Infection, 2007–2017. Open Forum Infect. Dis. 2020, 7, ofaa044. [Google Scholar] [CrossRef]
- Wang, T. Model of life expectancy of chronic hepatitis B carriers in an endemic region. J. Epidemiol. 2009, 19, 311–318. [Google Scholar] [CrossRef] [PubMed] [Green Version]
- Guglielmi, A.; Ruzzenente, A.; Valdegamberi, A.; Pachera, S.; Campagnaro, T.; D’Onofrio, M.; Martone, E.; Nicoli, P.; Iacono, C. Radiofrequency ablation versus surgical resection for the treatment of hepatocellular carcinoma in cirrhosis. J. Gastrointest. Surg. 2008, 12, 192–198. [Google Scholar] [CrossRef] [PubMed]
- Huang, J.; Yan, L.; Cheng, Z.; Wu, H.; Du, L.; Wang, J.; Xu, Y.; Zeng, Y. A Randomized Trial Comparing Radiofrequency Ablation and Surgical Resection for HCC Conforming to the Milan Criteria. Ann. Surg. 2010, 252, 903–912. [Google Scholar] [CrossRef] [PubMed]
- Vivarelli, M.; Guglielmi, A.; Ruzzenente, A.; Cucchetti, A.; Bellusci, R.; Cordiano, C.; Cavallari, A. Surgical resection versus percutaneous radiofrequency ablation in the treatment of hepatocellular carcinoma on cirrhotic liver. Ann. Surg. 2004, 240, 102. [Google Scholar] [CrossRef]
- Tiong, L.; Maddern, G.J. Systematic review and meta-analysis of survival and disease recurrence after radiofrequency ablation for hepatocellular carcinoma. Br. J. Surg. 2011, 98, 1210–1224. [Google Scholar] [CrossRef] [PubMed]
- Sové, R.J.; Verma, B.K.; Wang, H.; Ho, W.J.; Yarchoan, M.; Popel, A.S. Virtual clinical trials of anti-PD-1 and anti-CTLA-4 immunotherapy in advanced hepatocellular carcinoma using a quantitative systems pharmacology model. J. Immunother. Cancer 2022, 10, e005414. [Google Scholar] [CrossRef] [PubMed]


| Variables | Categories | Training Set (n = 375) | Testing Set (n = 162) | Total Set (n = 537) | |
|---|---|---|---|---|---|
| Survival Time | >1 year | 154 | 71 | 225 | |
| ≤1 year | 221 | 91 | 312 | ||
| Treatment | |||||
| 1 | Surgery | adopt | 105 | 47 | 152 |
| 2 | Systemic chemotherapy | adopt | 0 | 0 | 0 |
| 3 | TACE | adopt | 156 | 69 | 225 |
| 4 | Symptomatic treatment (including palliative treatment) | adopt | 25 | 10 | 35 |
| 5 | Refused treatment | adopt | 3 | 1 | 4 |
| 6 | Radiation therapy | adopt | 14 | 4 | 18 |
| 7 | RFA | adopt | 9 | 2 | 11 |
| 8 | Targeted drug therapy | adopt | 36 | 18 | 54 |
| 9 | Liver transplant | adopt | 0 | 0 | 0 |
| 10 | Immunotherapy | adopt | 1 | 0 | 1 |
| 11 | Yttrium 90 | adopt | 0 | 0 | 0 |
| 12 | Surgery + targeted drug therapy | adopt | 1 | 0 | 1 |
| 13 | TACE + radiation therapy | adopt | 2 | 0 | 2 |
| 14 | TACE + radiation therapy + targeted drug therapy | adopt | 5 | 3 | 8 |
| 15 | TACE + radiation therapy + targeted drug therapy + immunotherapy | adopt | 0 | 0 | 0 |
| 16 | TACE + targeted drug therapy | adopt | 12 | 5 | 17 |
| 17 | TACE + targeted drug therapy + immunotherapy | adopt | 1 | 1 | 2 |
| 18 | Radiation therapy + targeted drug therapy | adopt | 3 | 2 | 5 |
| 19 | Targeted drug therapy + immunotherapy | adopt | 2 | 0 | 2 |
| Hepatitis 1: Non-Hepatitis | yes | 81 | 28 | 109 | |
| Hepatitis 2: Hepatitis B | yes | 164 | 69 | 233 | |
| Hepatitis 3: Hepatitis C | yes | 114 | 58 | 172 | |
| Hepatitis 4: Hepatitis B and C | yes | 16 | 7 | 23 | |
| Variables | Training Set (n = 375), Avg | Testing Set (n = 162), Avg | Total Set (n = 537), Avg |
|---|---|---|---|
| GOT (µkat/L) | 1.51 | 1.62 | 1.54 |
| GPT (µkat/L) | 1.28 | 1.23 | 1.26 |
| ALB (mmol/L) | 0.55 | 0.55 | 0.55 |
| INR | 1.11 | 1.10 | 1.10 |
| T-bil (mmol/L) | 0.02 | 0.02 | 0.02 |
| AFP (mcg/L) | 21,003.15 | 19,673.33 | 20,601.97 |
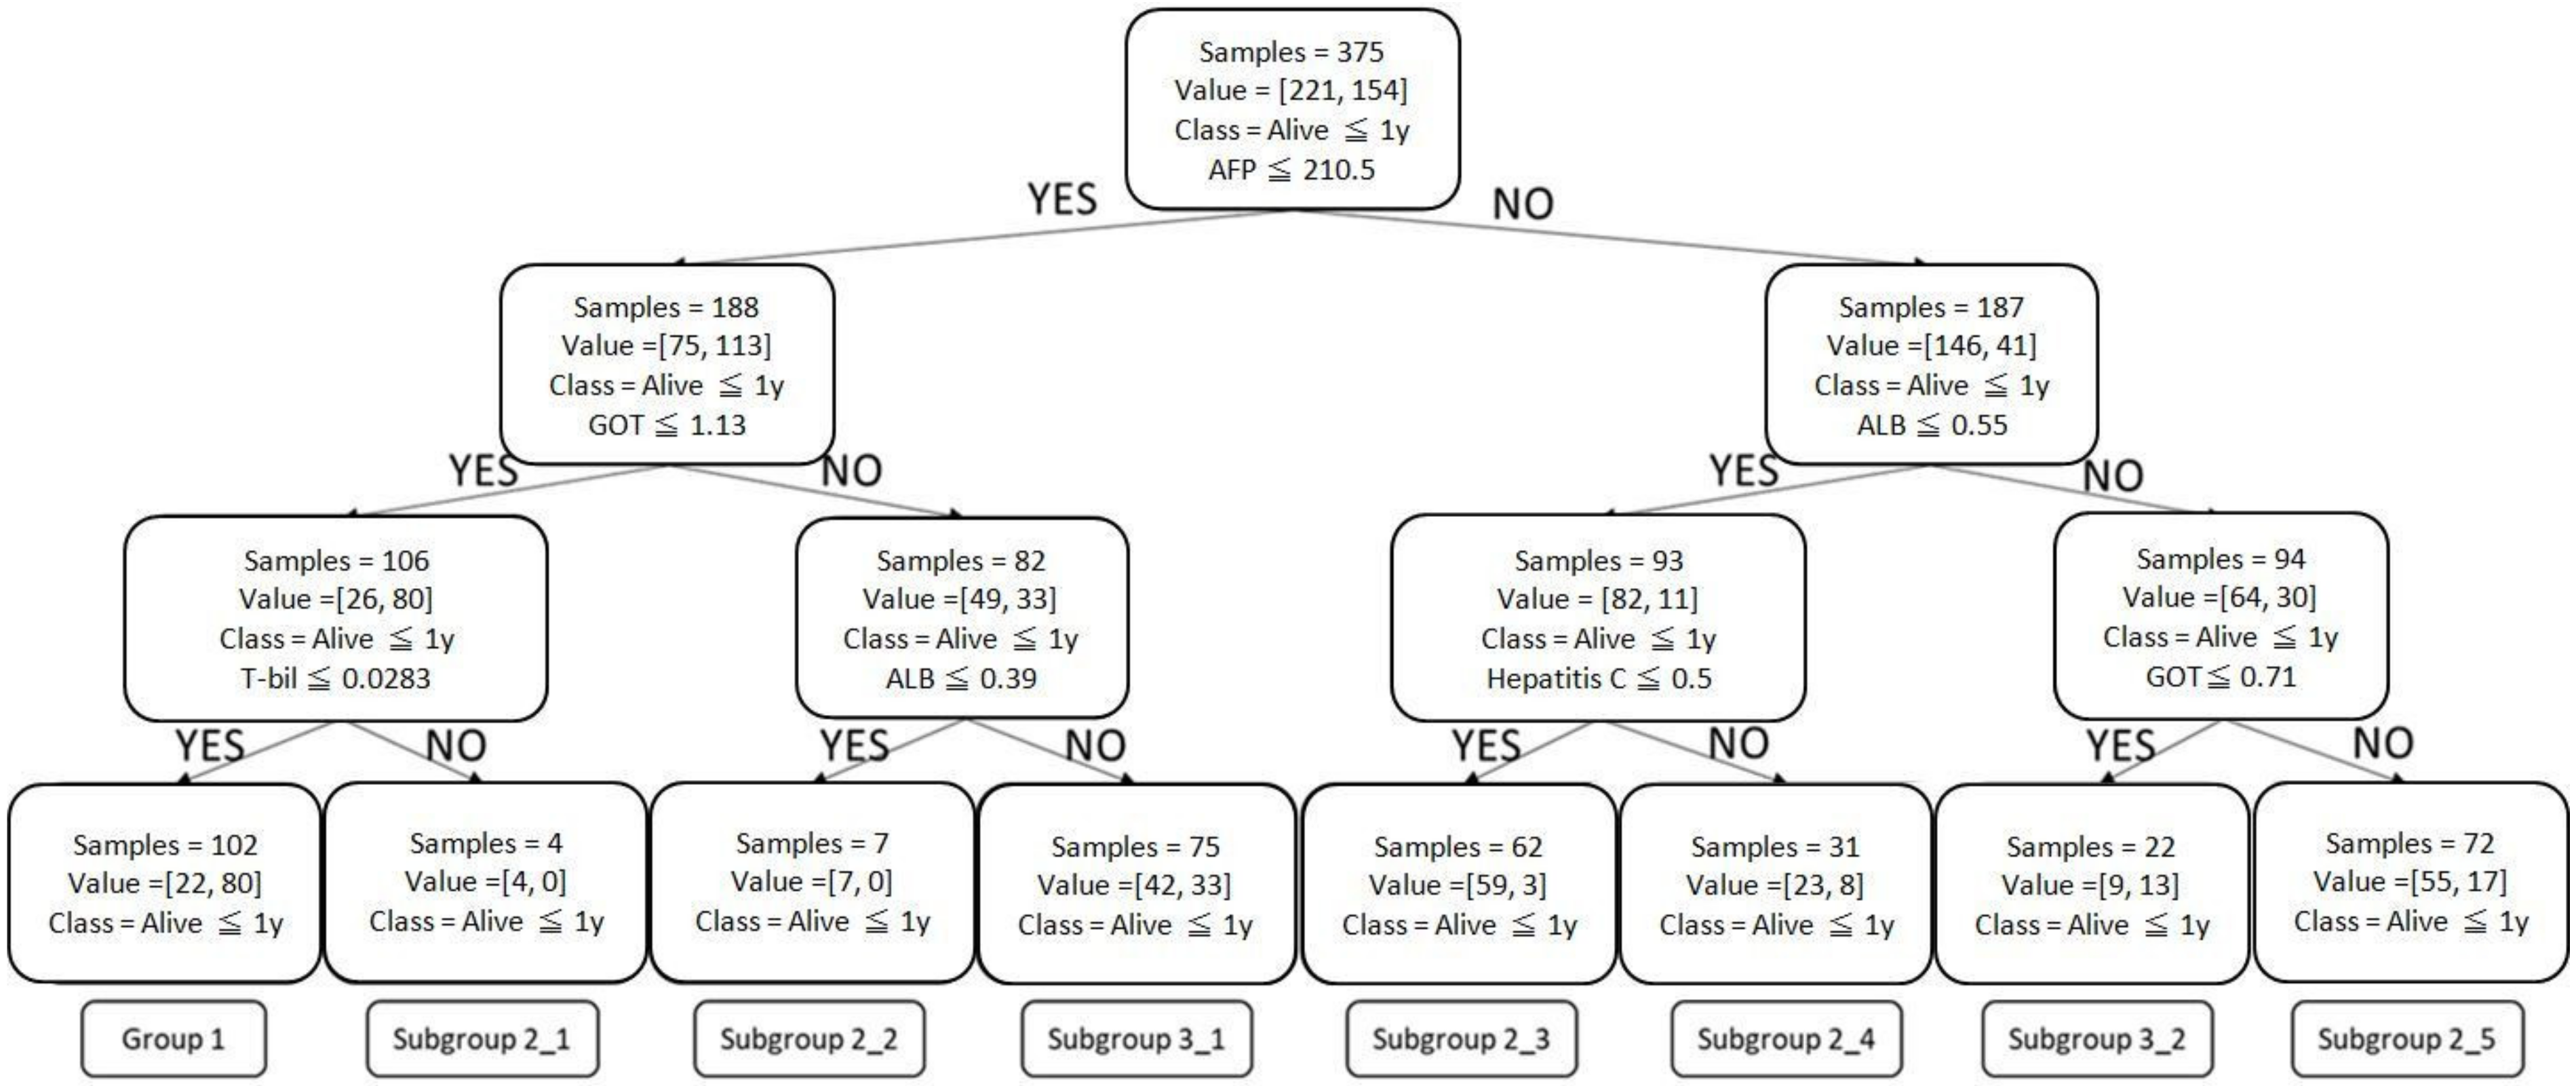
| Input Variables | |||||||||
|---|---|---|---|---|---|---|---|---|---|
| Group | Subgroup | n = 375 | 1-Year Survival | Prediction | AFP (mcg/L) | GOT (µkat/L) | ALB (mmol/L) | T-Bil (mmol/L) | Hepatitis C |
| 1 | 102 | 78% | >1 year | ≤210.5 | ≤1.13 | - | ≤0.0283 | - | |
| 2 | 2-1 | 4 | 0% | ≤210.5 | ≤1.13 | - | >0.0283 | - | |
| 2-2 | 7 | 0% | ≤210.5 | >1.13 | ≤0.39 | - | - | ||
| 2-3 | 62 | 5% | ≤1 year | >210.5 | - | ≤0.55 | - | No | |
| 2-4 | 31 | 26% | >210.5 | - | ≤0.55 | - | Yes | ||
| 2-5 | 72 | 24% | >210.5 | >0.71 | >0.55 | - | - | ||
| 3 | 3-1 | 75 | 44% | ≤1 year | ≤210.5 | >1.13 | >0.39 | - | - |
| 3-2 | 22 | 59% | >1 year | >210.5 | ≤0.71 | >0.55 | - | - | |
| Accuracy | Sensitivity | Specificity | LR(+) | LR(−) | |
|---|---|---|---|---|---|
| CART | 0.72 | 0.70 | 0.77 | 3 | 0.39 |
| Post-pruning CART | 0.72 | 0.90 | 0.48 | 2 | 0.21 |
| Random forest | 0.76 | 0.74 | 0.80 | 4 | 0.33 |
| XGBoost | 0.70 | 0.71 | 0.69 | 2 | 0.42 |
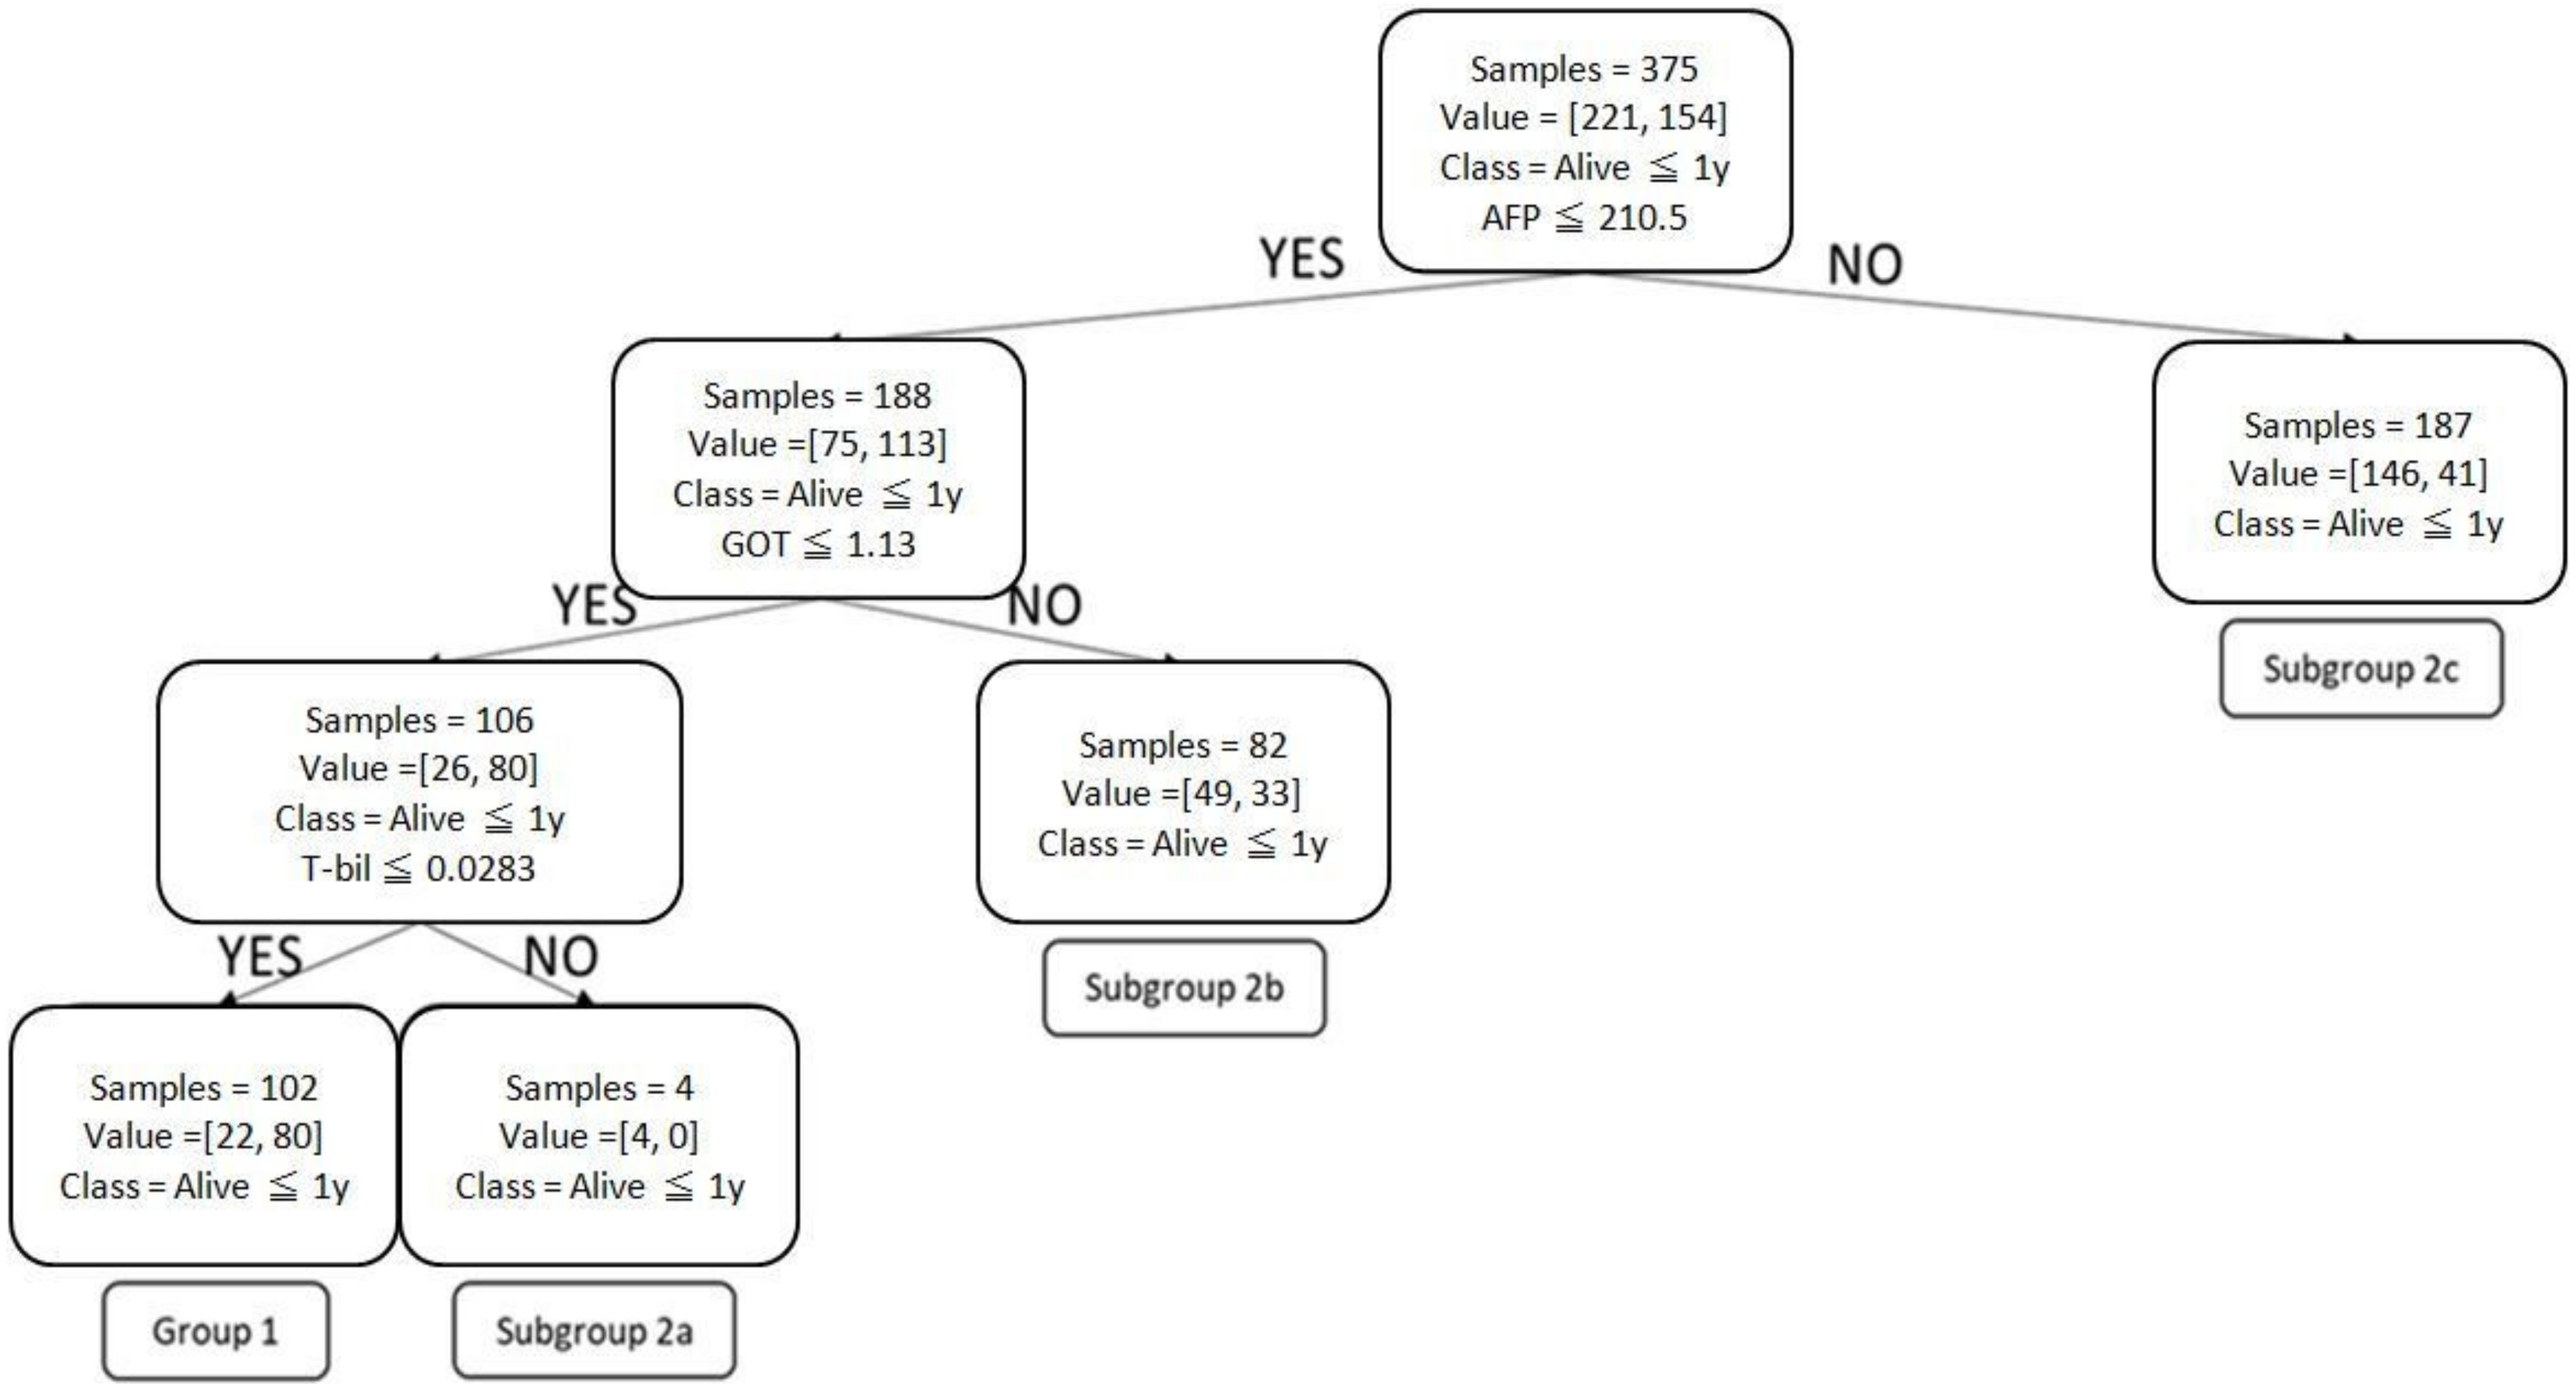
| Input Variables | Most Common Treatment(s) No. of Patients (1-Year SR, %) | Treatment with Highest SR No. of Patients (1-Year SR, %) | Treatment with 2nd-Highest SR No. of Patients (1-Year SR, %) | Treatment with 3rd-Highest SR No. of Patients (1-Year SR, %) | |||||||
|---|---|---|---|---|---|---|---|---|---|---|---|
| Prediction | Group | Subgroup | n = 375 | 1-year Survival | AFP (mcg/L) | GOT (µkat/L) | T-bil (mmol/L) | ||||
| SR > 1 year | 1 | 102 | 78% | ≤210.5 | ≤1.13 | ≤0.0283 | Surgery 45 patients (44%) | RFA 7 patients (100%) | TACE + RT 1 patient (100%) | Surgery 45 patients (82%) | |
| SR ≤ 1 year | 2 | 2a | 4 | 0% | ≤210.5 | ≤1.13 | >0.0283 | TACE 1 patient (25%) ST 1 patient (25%) RT 1 patient (25%) IT 1 patient (25%) | |||
| 2b | 82 | 40% | ≤210.5 | >1.13 | TACE 41 patients (50%) | RFA 1 patient (100%) TACE + RT + TDT 1 patient (100%) | Surgery 20 patients (50%) RT 2 patients (50%) | TACE 41 patients (41%) | |||
| 2c | 187 | 22% | >210.5 | TACE 75 patients (40%) | RFA 1 patient (100%) TACE + TDT + IT 1 patient (100%) | TACE + TDT 5 patients (60%) | RT + TDT 2 patients (50%) | ||||
Disclaimer/Publisher’s Note: The statements, opinions and data contained in all publications are solely those of the individual author(s) and contributor(s) and not of MDPI and/or the editor(s). MDPI and/or the editor(s) disclaim responsibility for any injury to people or property resulting from any ideas, methods, instructions or products referred to in the content. |
© 2023 by the authors. Licensee MDPI, Basel, Switzerland. This article is an open access article distributed under the terms and conditions of the Creative Commons Attribution (CC BY) license (https://creativecommons.org/licenses/by/4.0/).
Share and Cite
Liu, C.-Y.; Cheng, C.-Y.; Yang, S.-Y.; Chai, J.-W.; Chen, W.-H.; Chang, P.-Y. Mortality Evaluation and Life Expectancy Prediction of Patients with Hepatocellular Carcinoma with Data Mining. Healthcare 2023, 11, 925. https://doi.org/10.3390/healthcare11060925
Liu C-Y, Cheng C-Y, Yang S-Y, Chai J-W, Chen W-H, Chang P-Y. Mortality Evaluation and Life Expectancy Prediction of Patients with Hepatocellular Carcinoma with Data Mining. Healthcare. 2023; 11(6):925. https://doi.org/10.3390/healthcare11060925
Chicago/Turabian StyleLiu, Che-Yu, Chen-Yang Cheng, Szu-Ying Yang, Jyh-Wen Chai, Wei-Hao Chen, and Pi-Yi Chang. 2023. "Mortality Evaluation and Life Expectancy Prediction of Patients with Hepatocellular Carcinoma with Data Mining" Healthcare 11, no. 6: 925. https://doi.org/10.3390/healthcare11060925