
Evaluating State-Level Prescription Drug Monitoring Program (PDMP) and Pill Mill Effects on Opioid Consumption in Pharmaceutical Supply Chain


Abstract
:1. Introduction
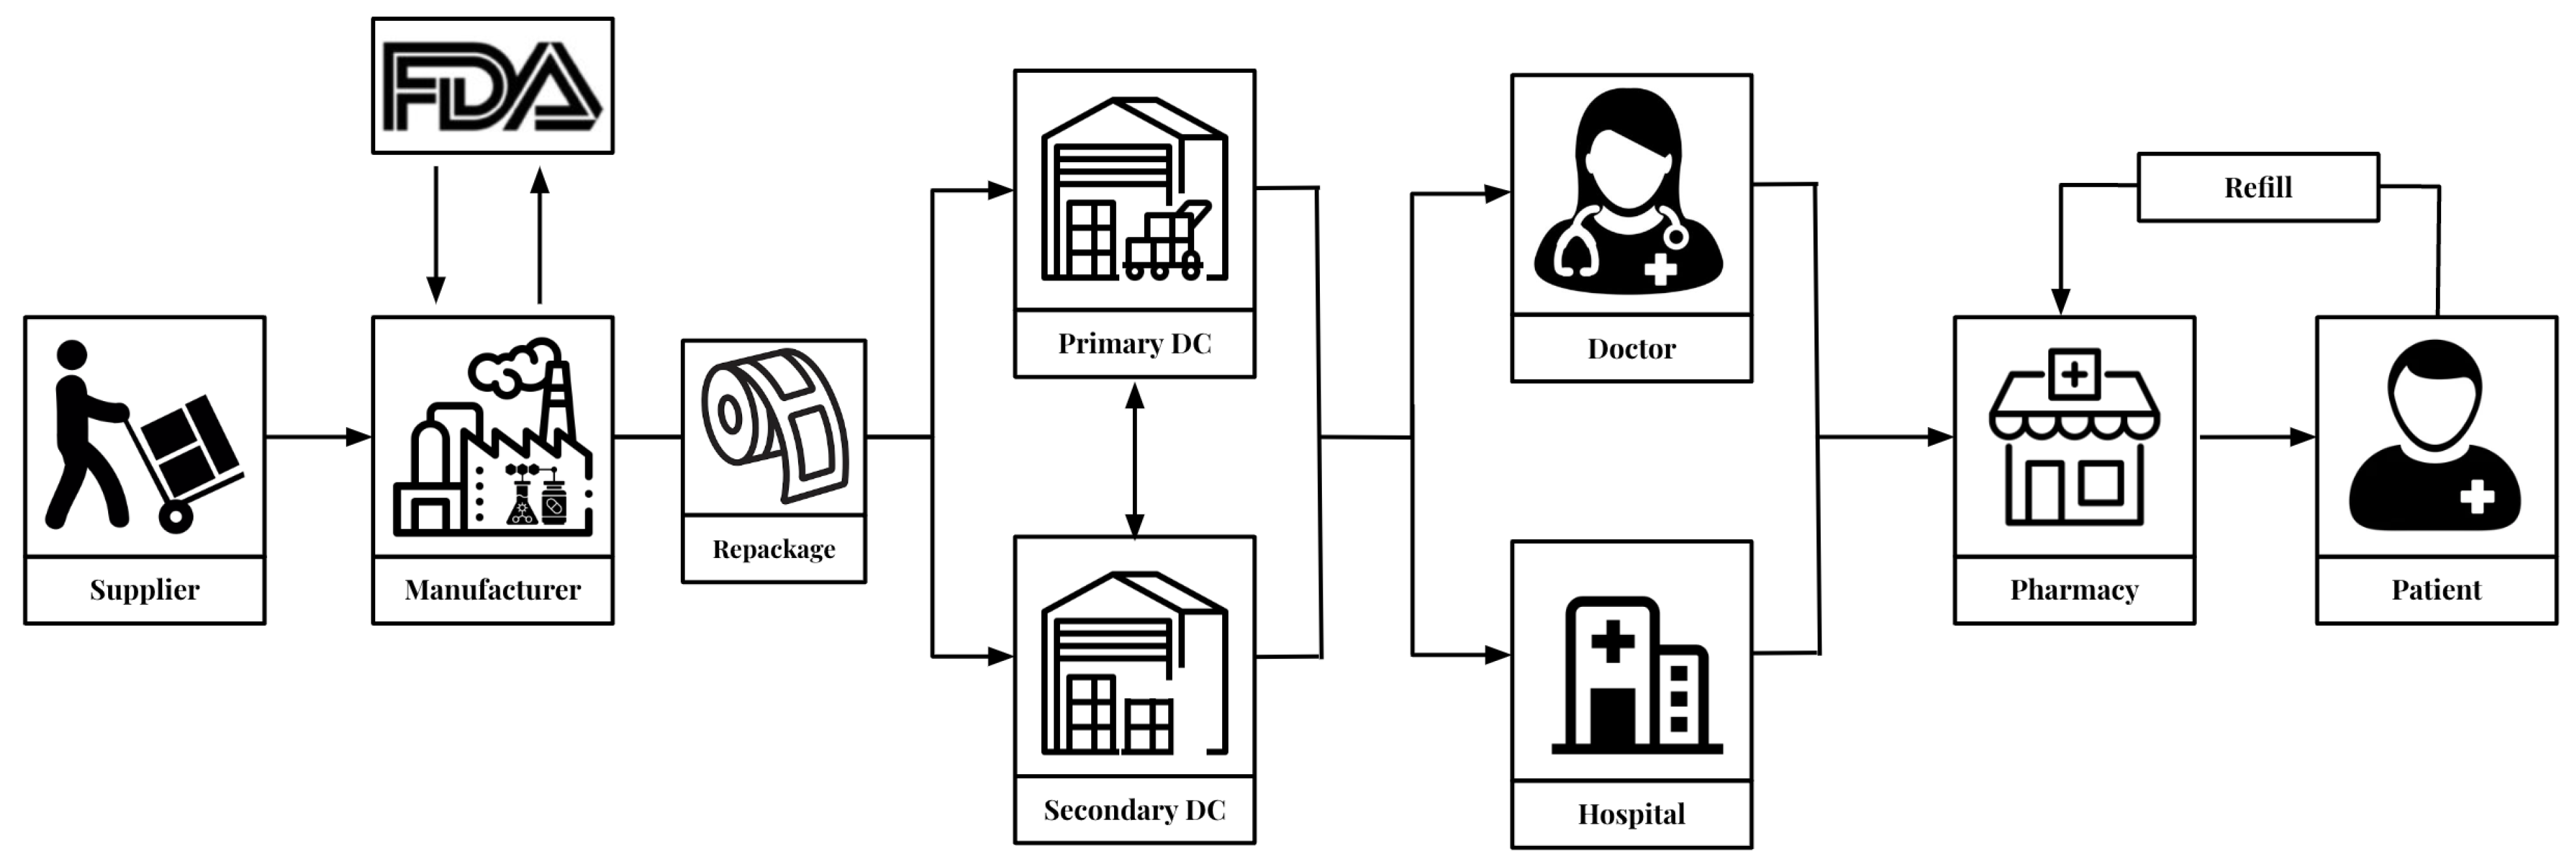
2. Methodology
2.1. Overview
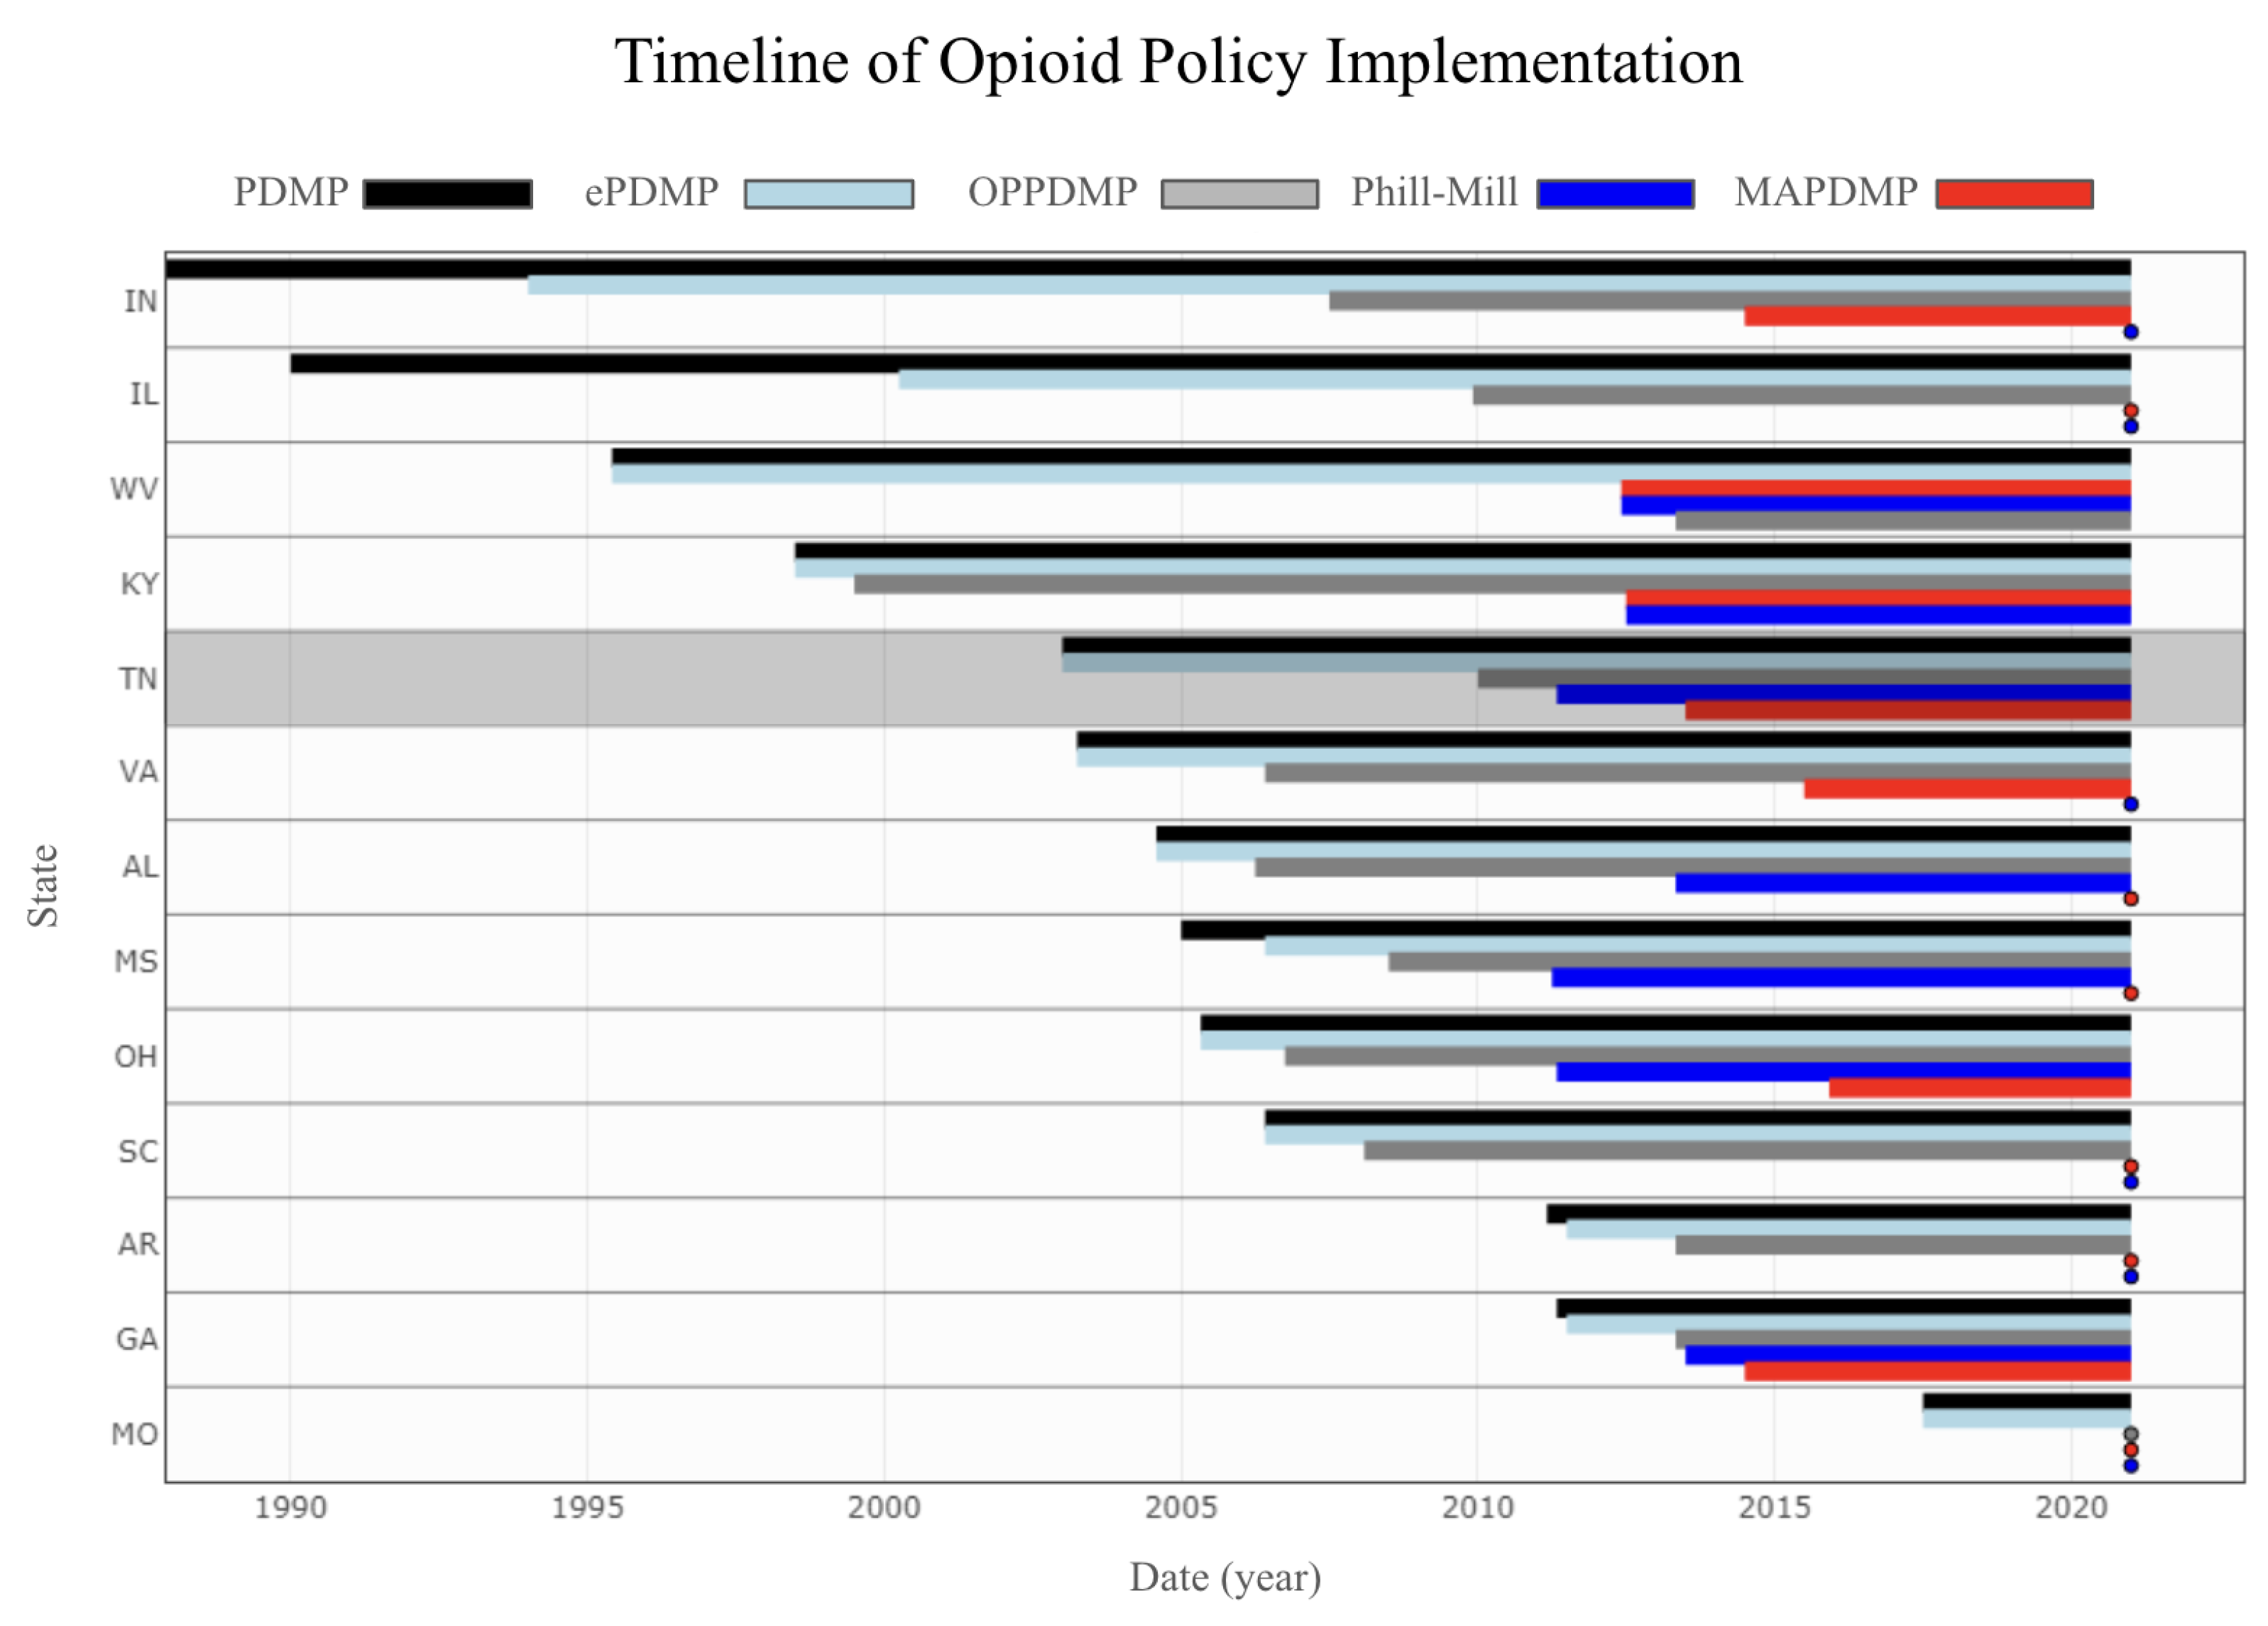
2.2. State Policies
- 1.
- PDMP access laws that provide access to any type of PDMP.
- 2.
- Mandatory PDMPs that require prescribers to access the PDMP database before prescribing opioids under certain circumstances.
- 3.
- Operational PDMPs, which are defined as having access to a modern system as the database.
- 4.
- Electronic PDMPs, which means having access to an electronic database
2.3. Statistical Analysis
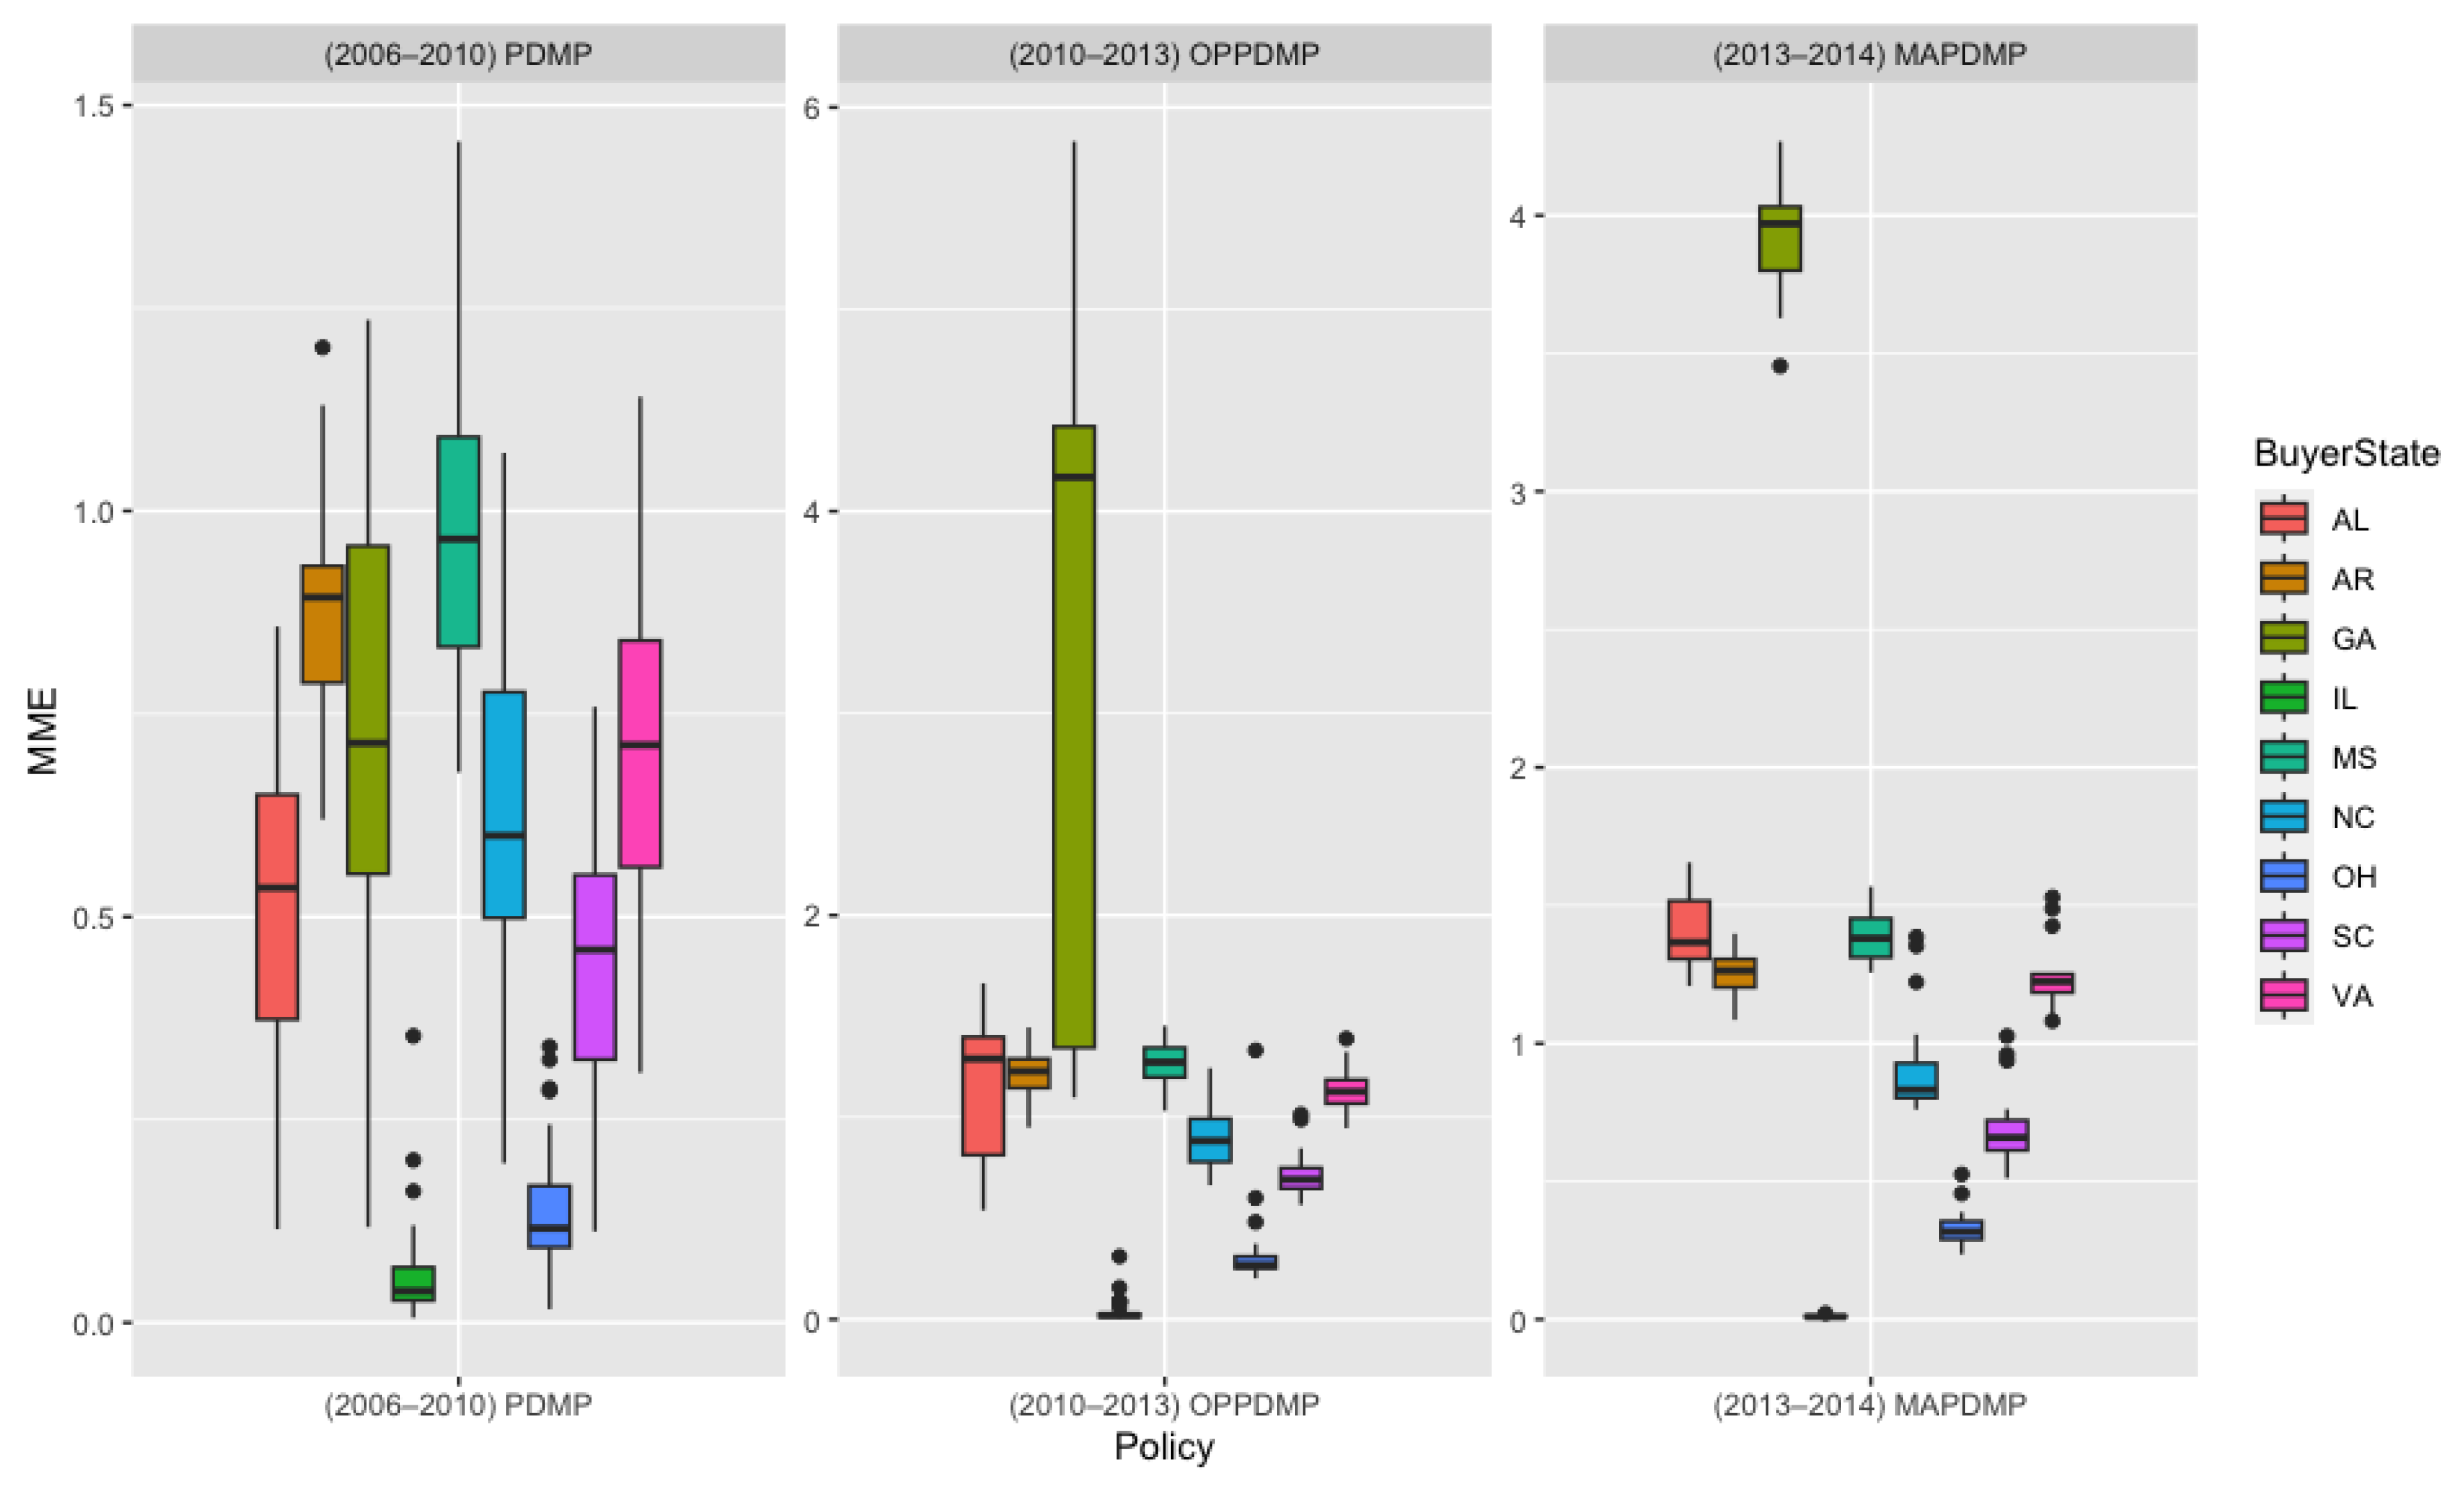
3. Results
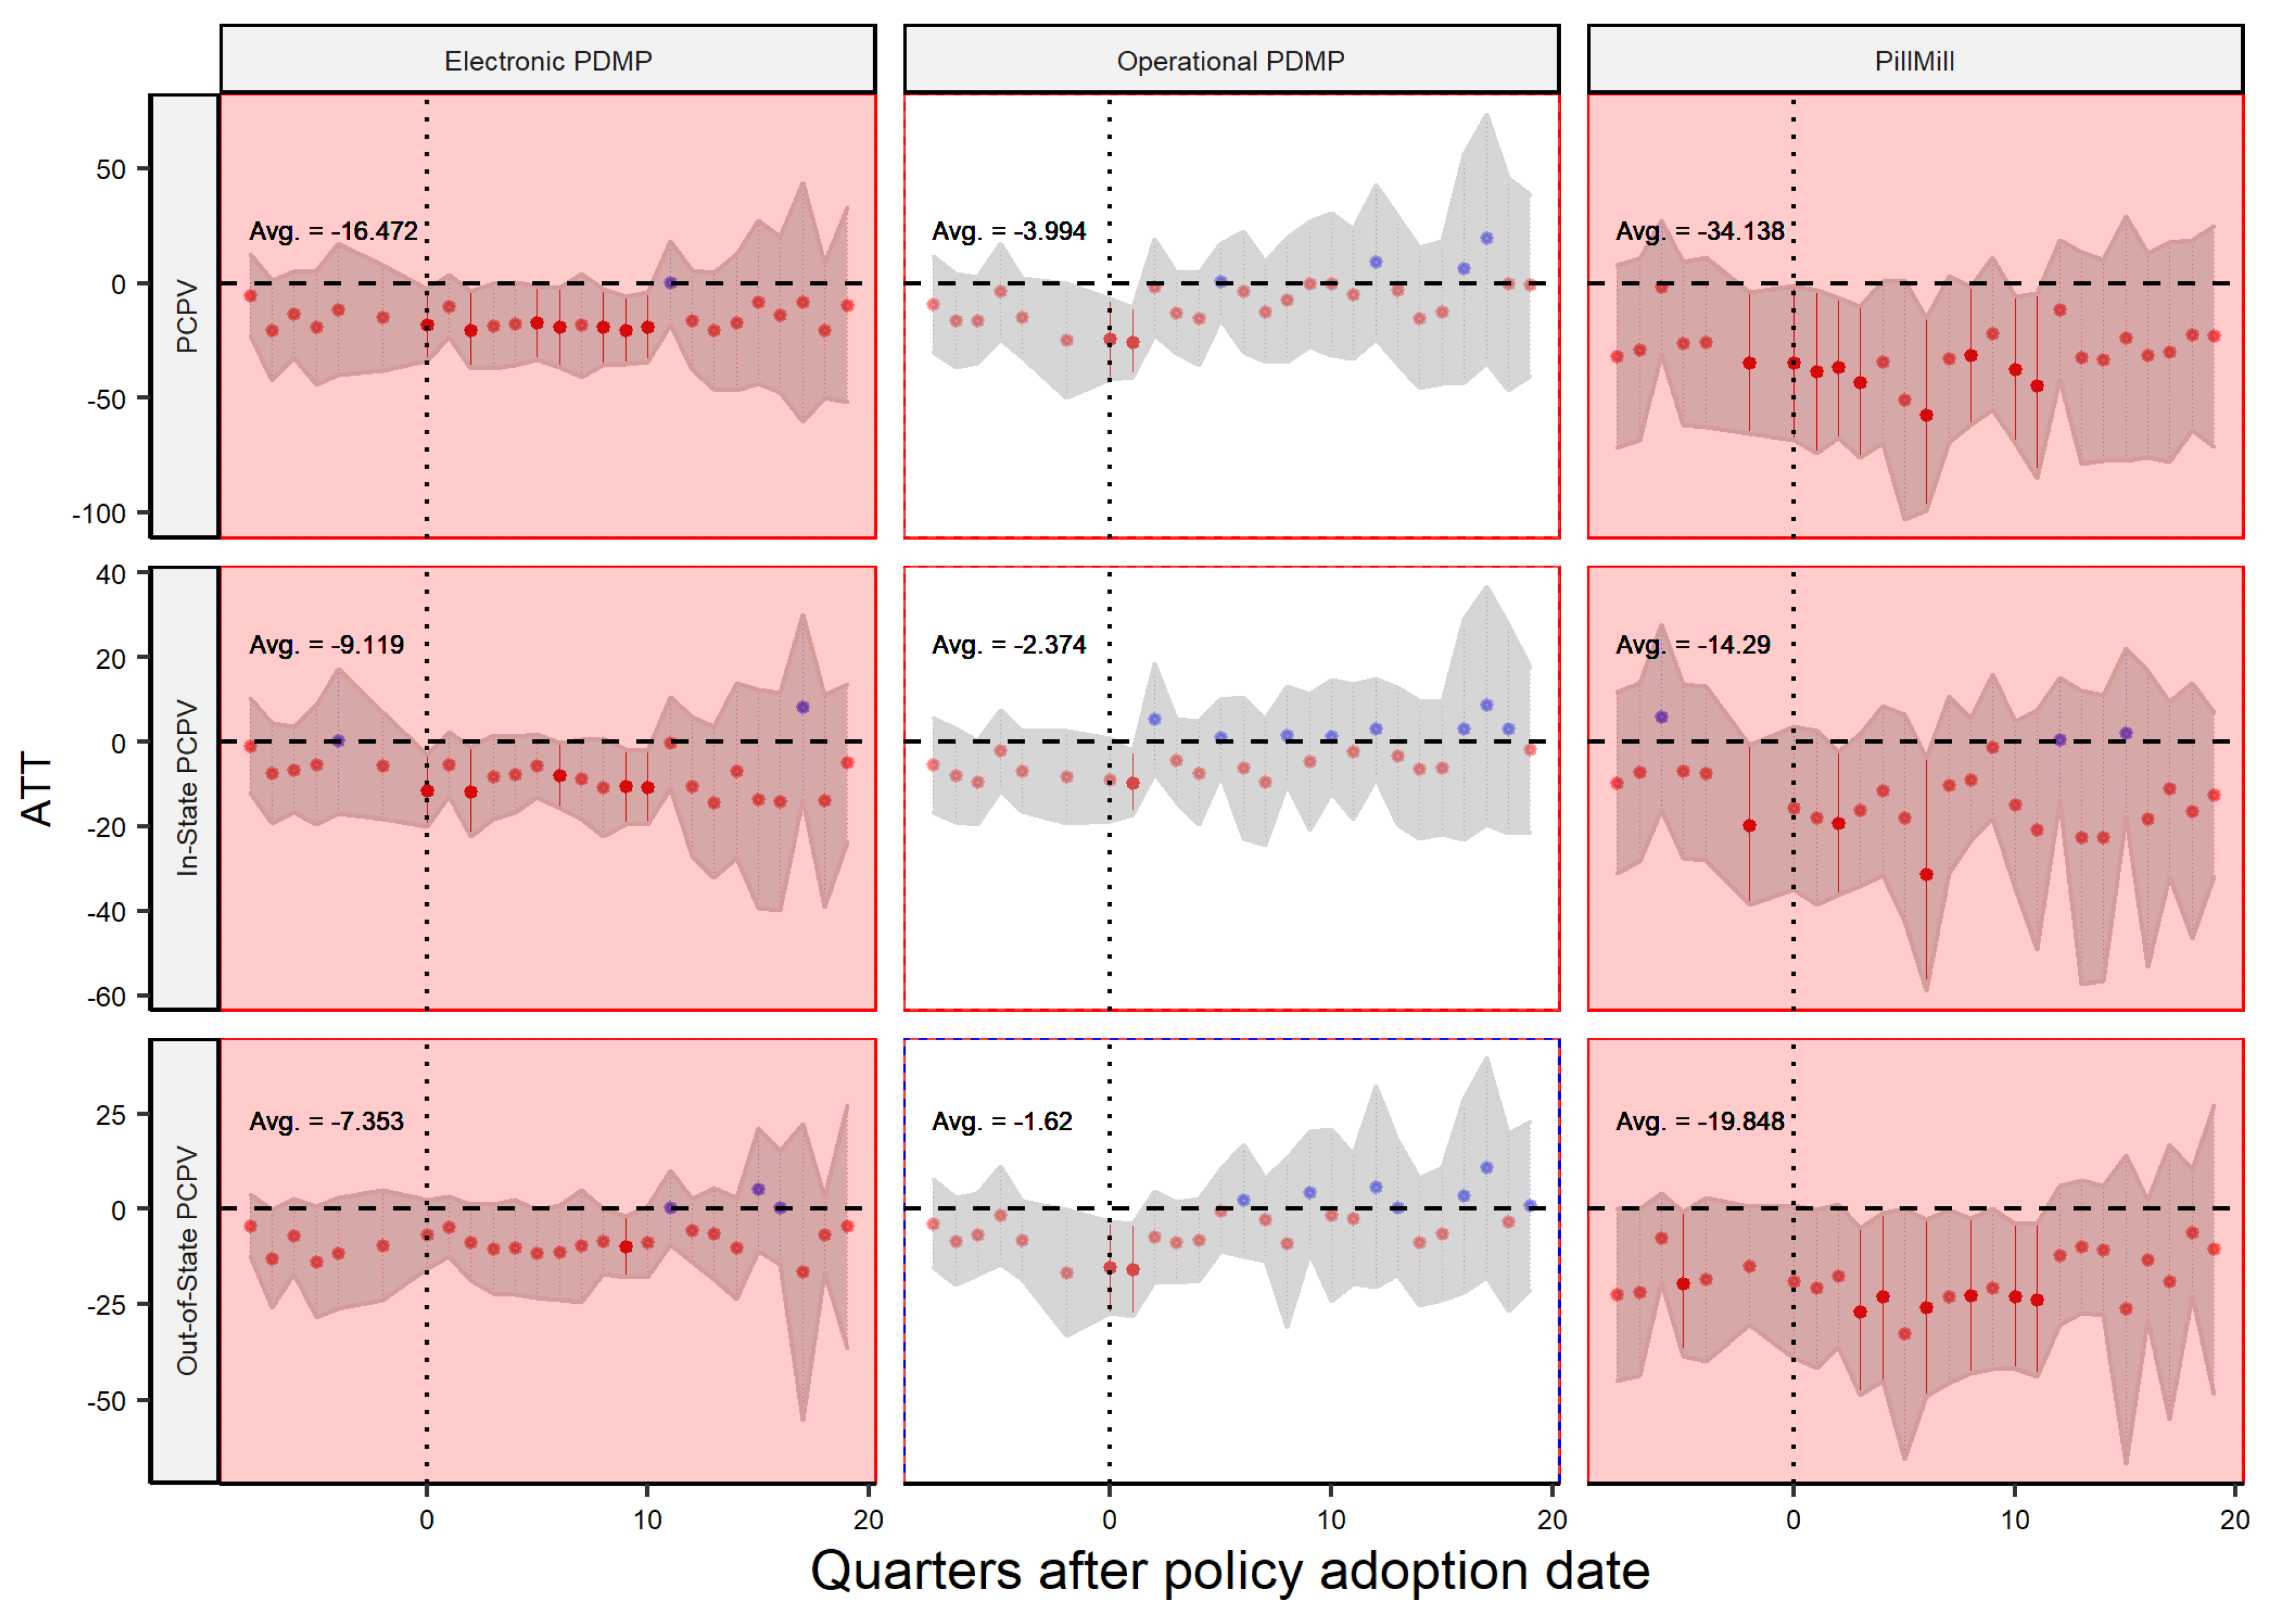
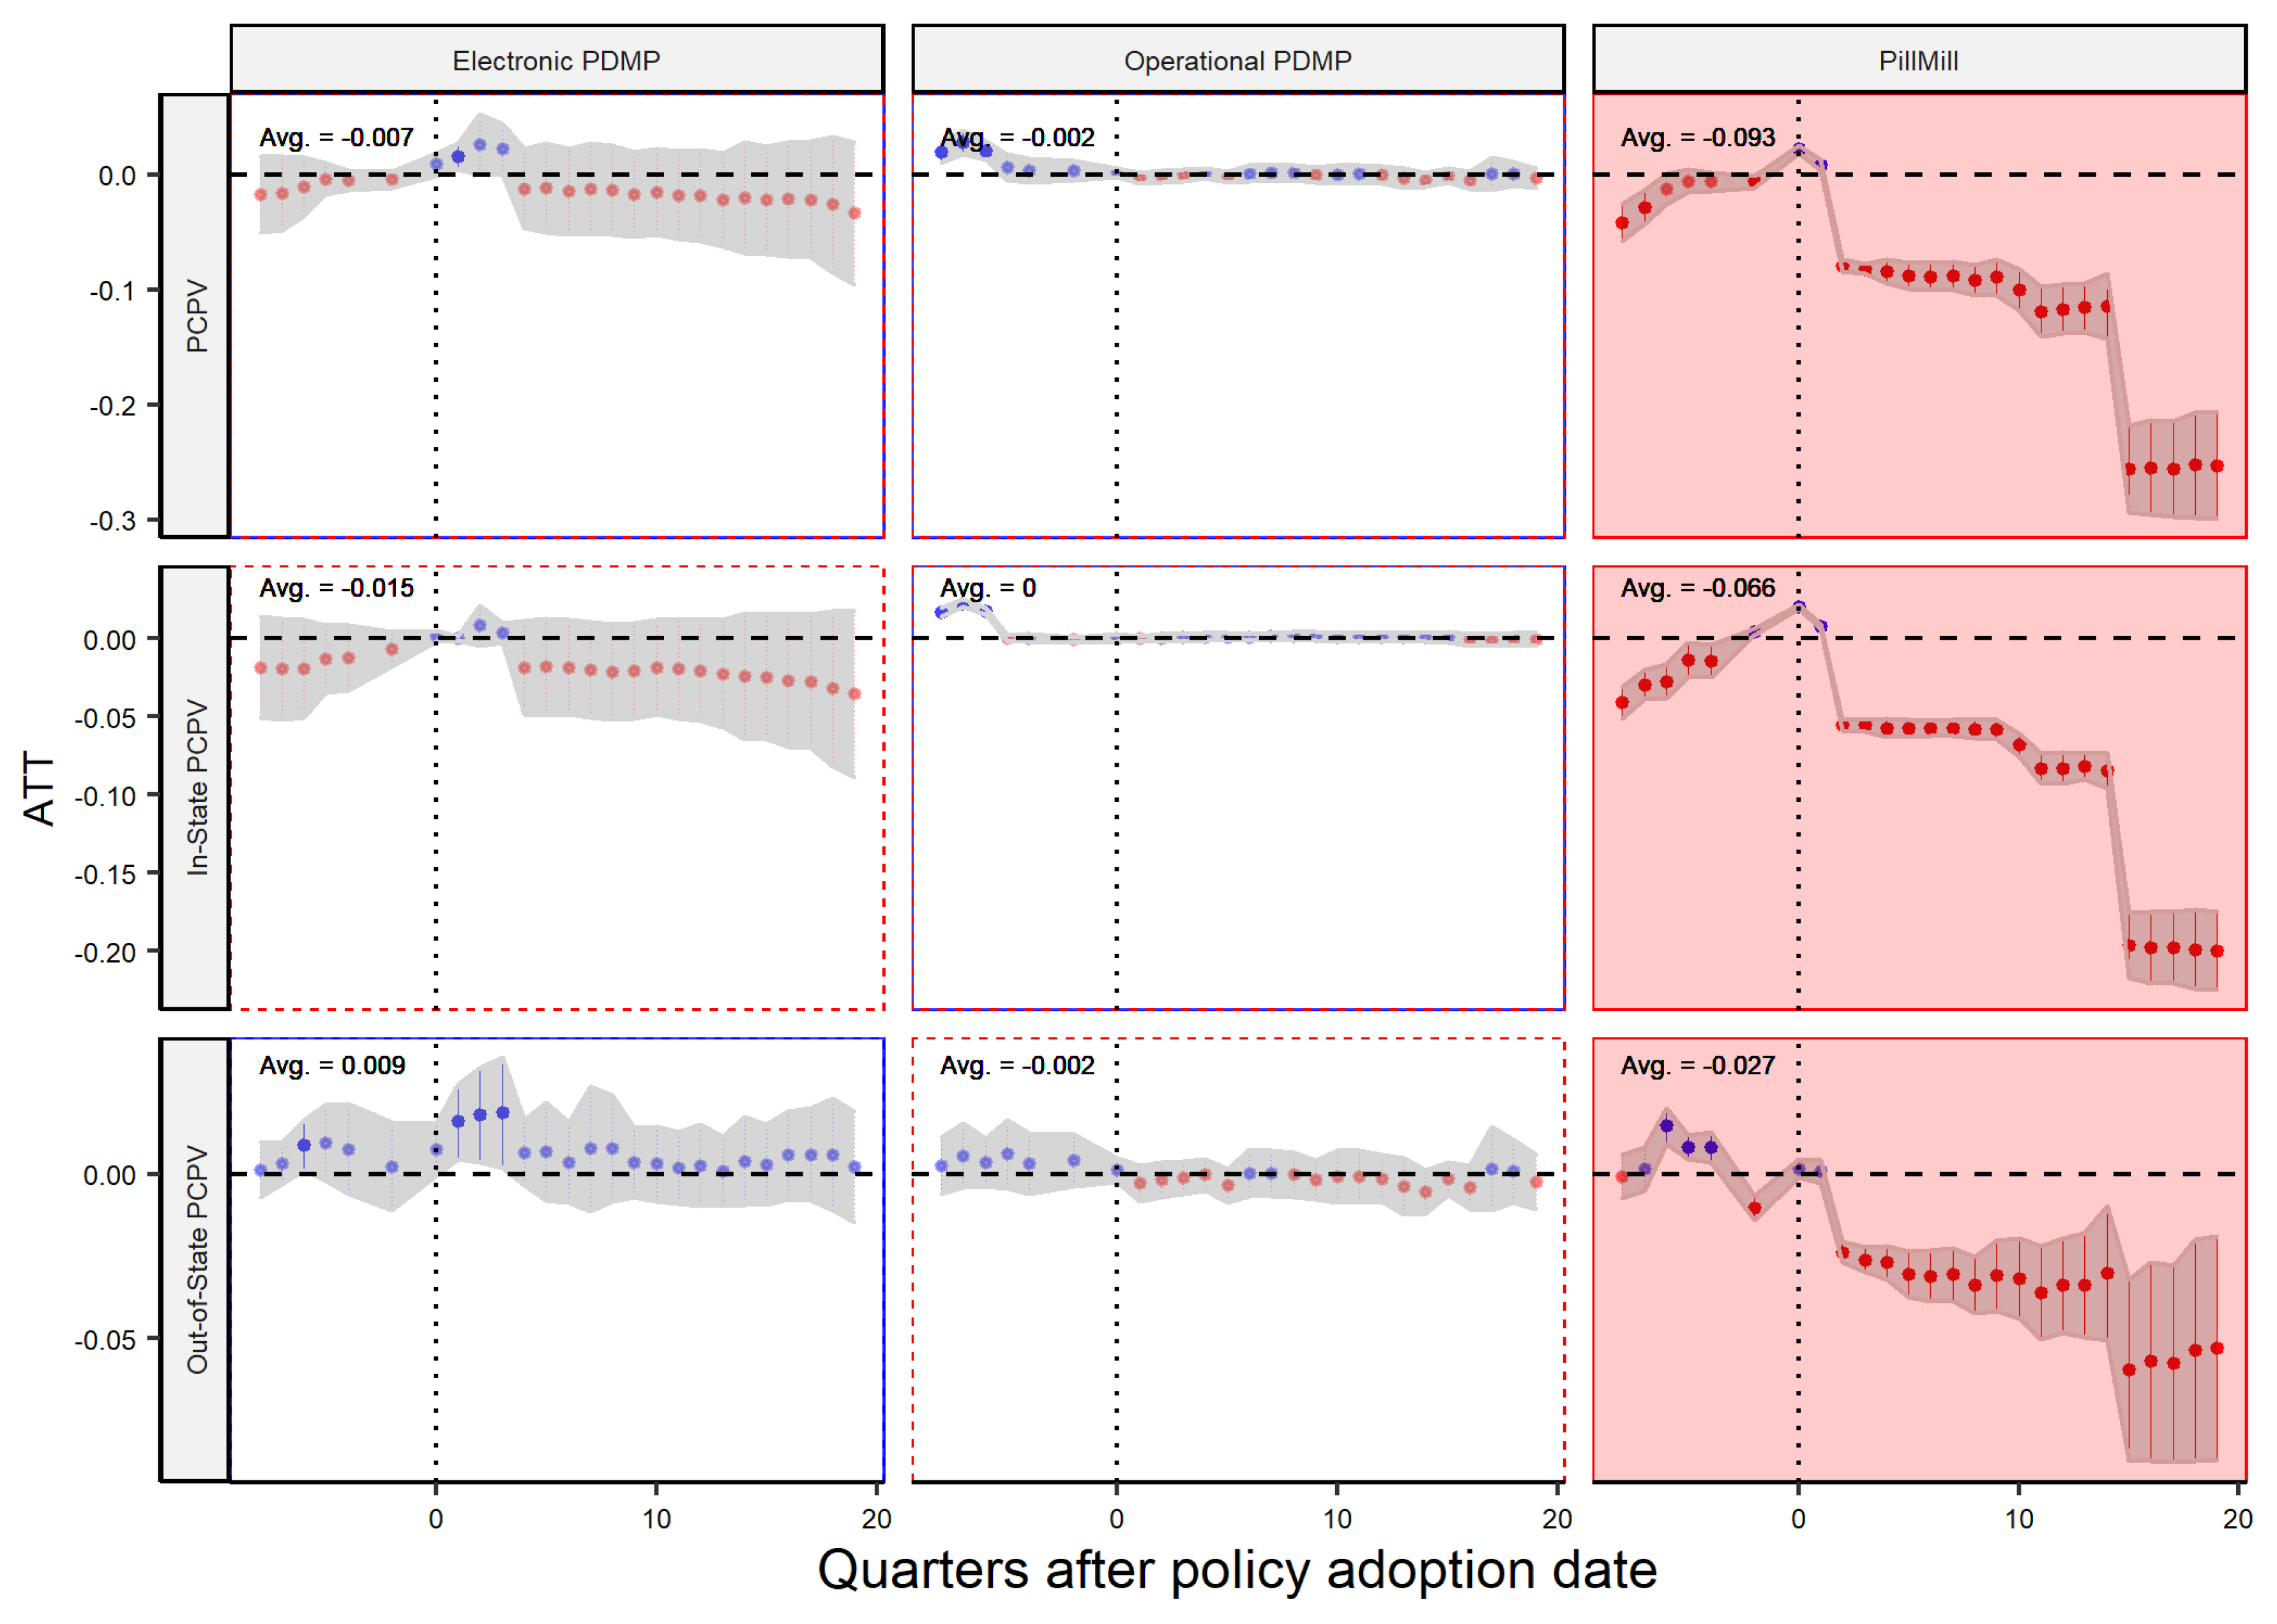
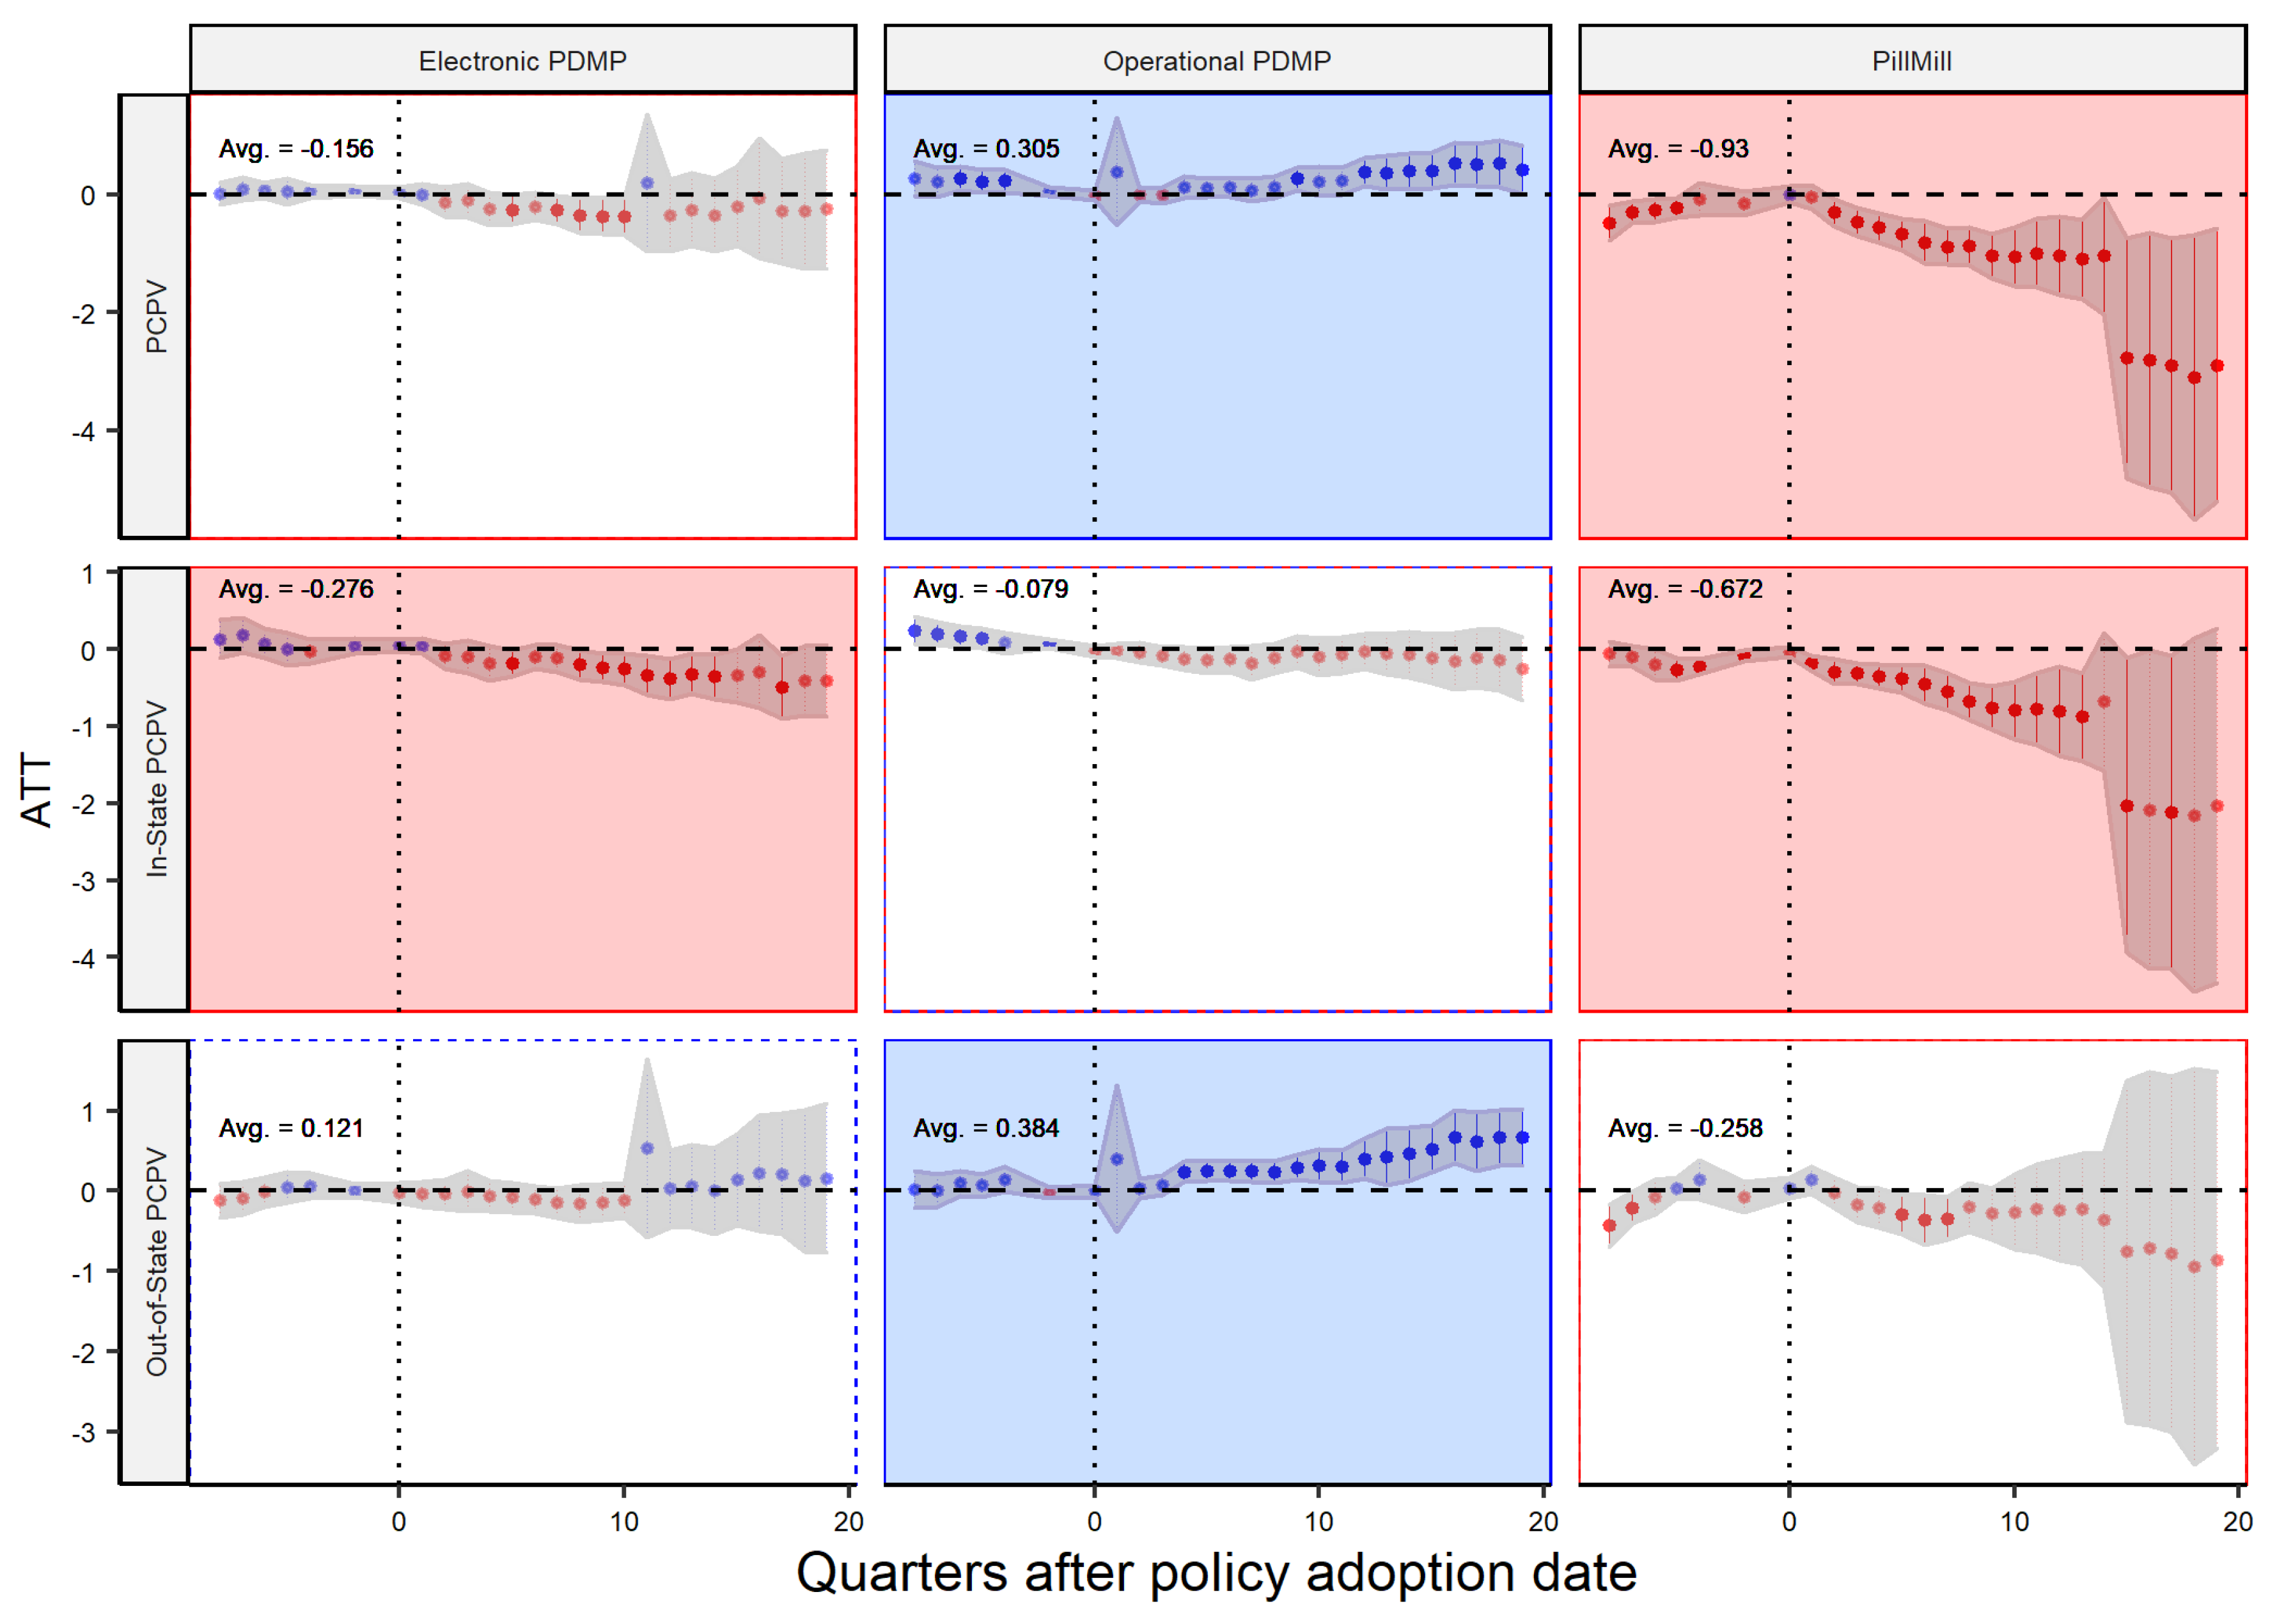
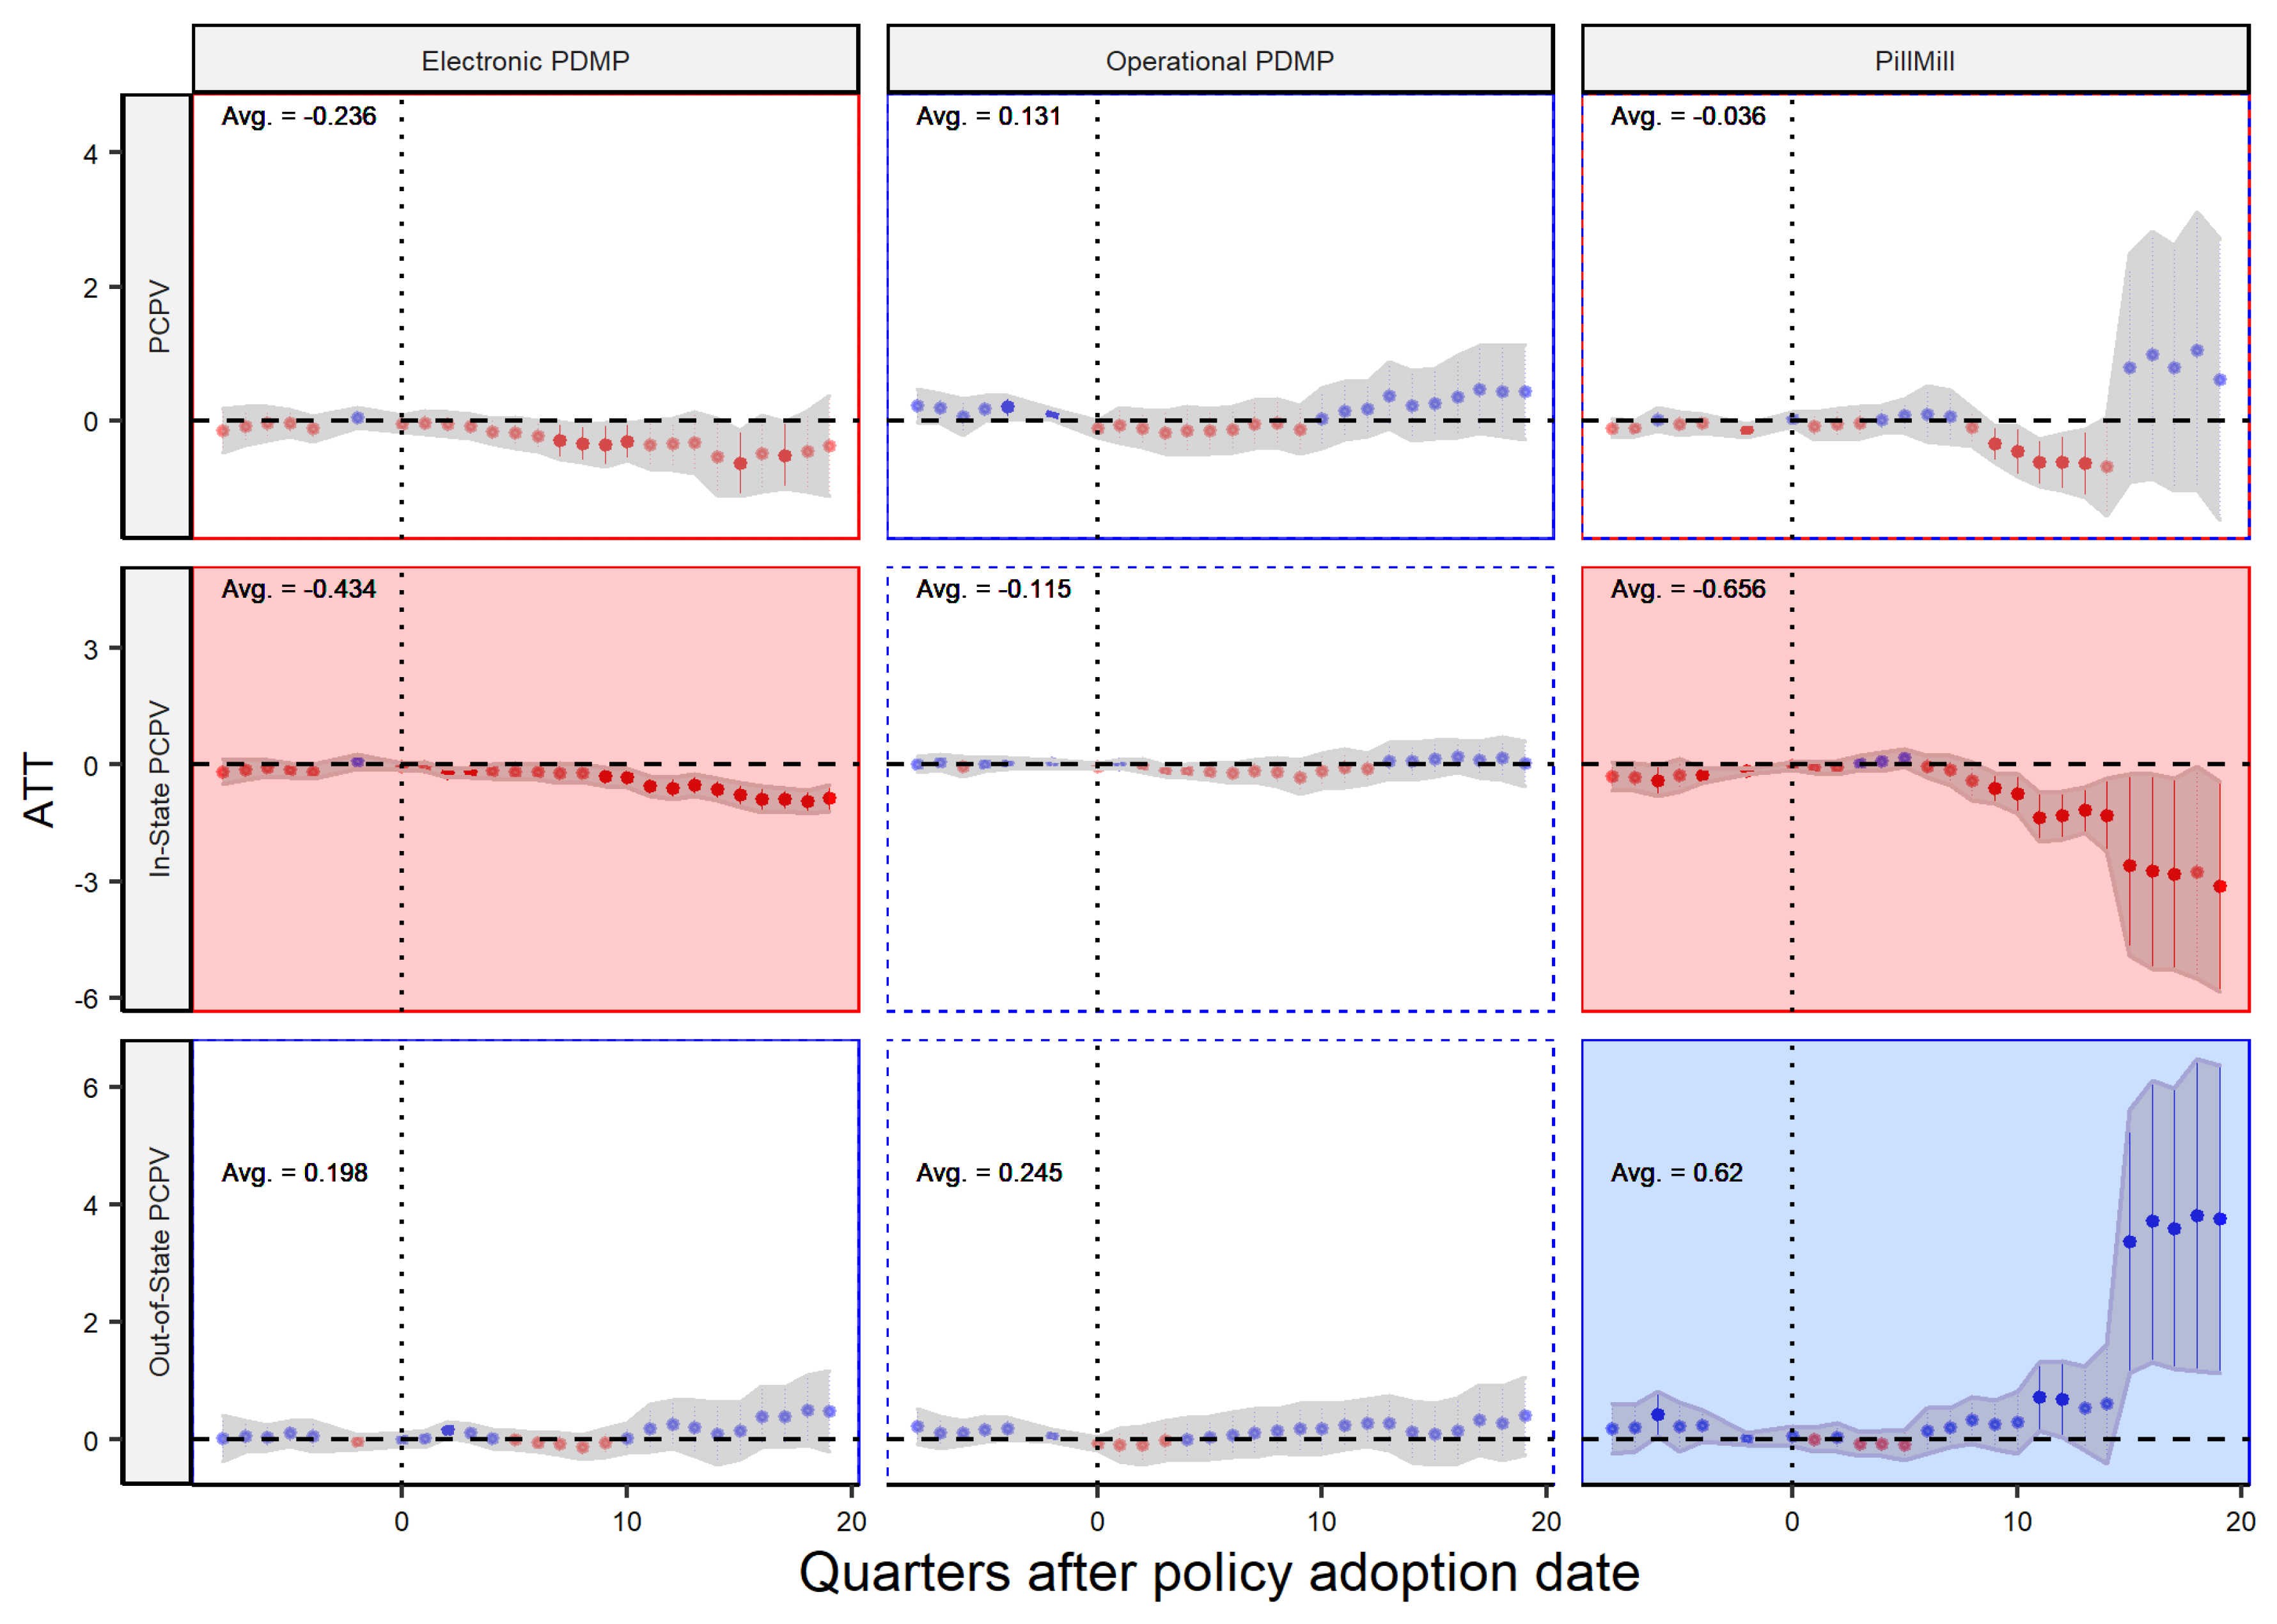
3.1. Overall
3.2. Dispenser Type Analysis
4. Discussion
- 1.
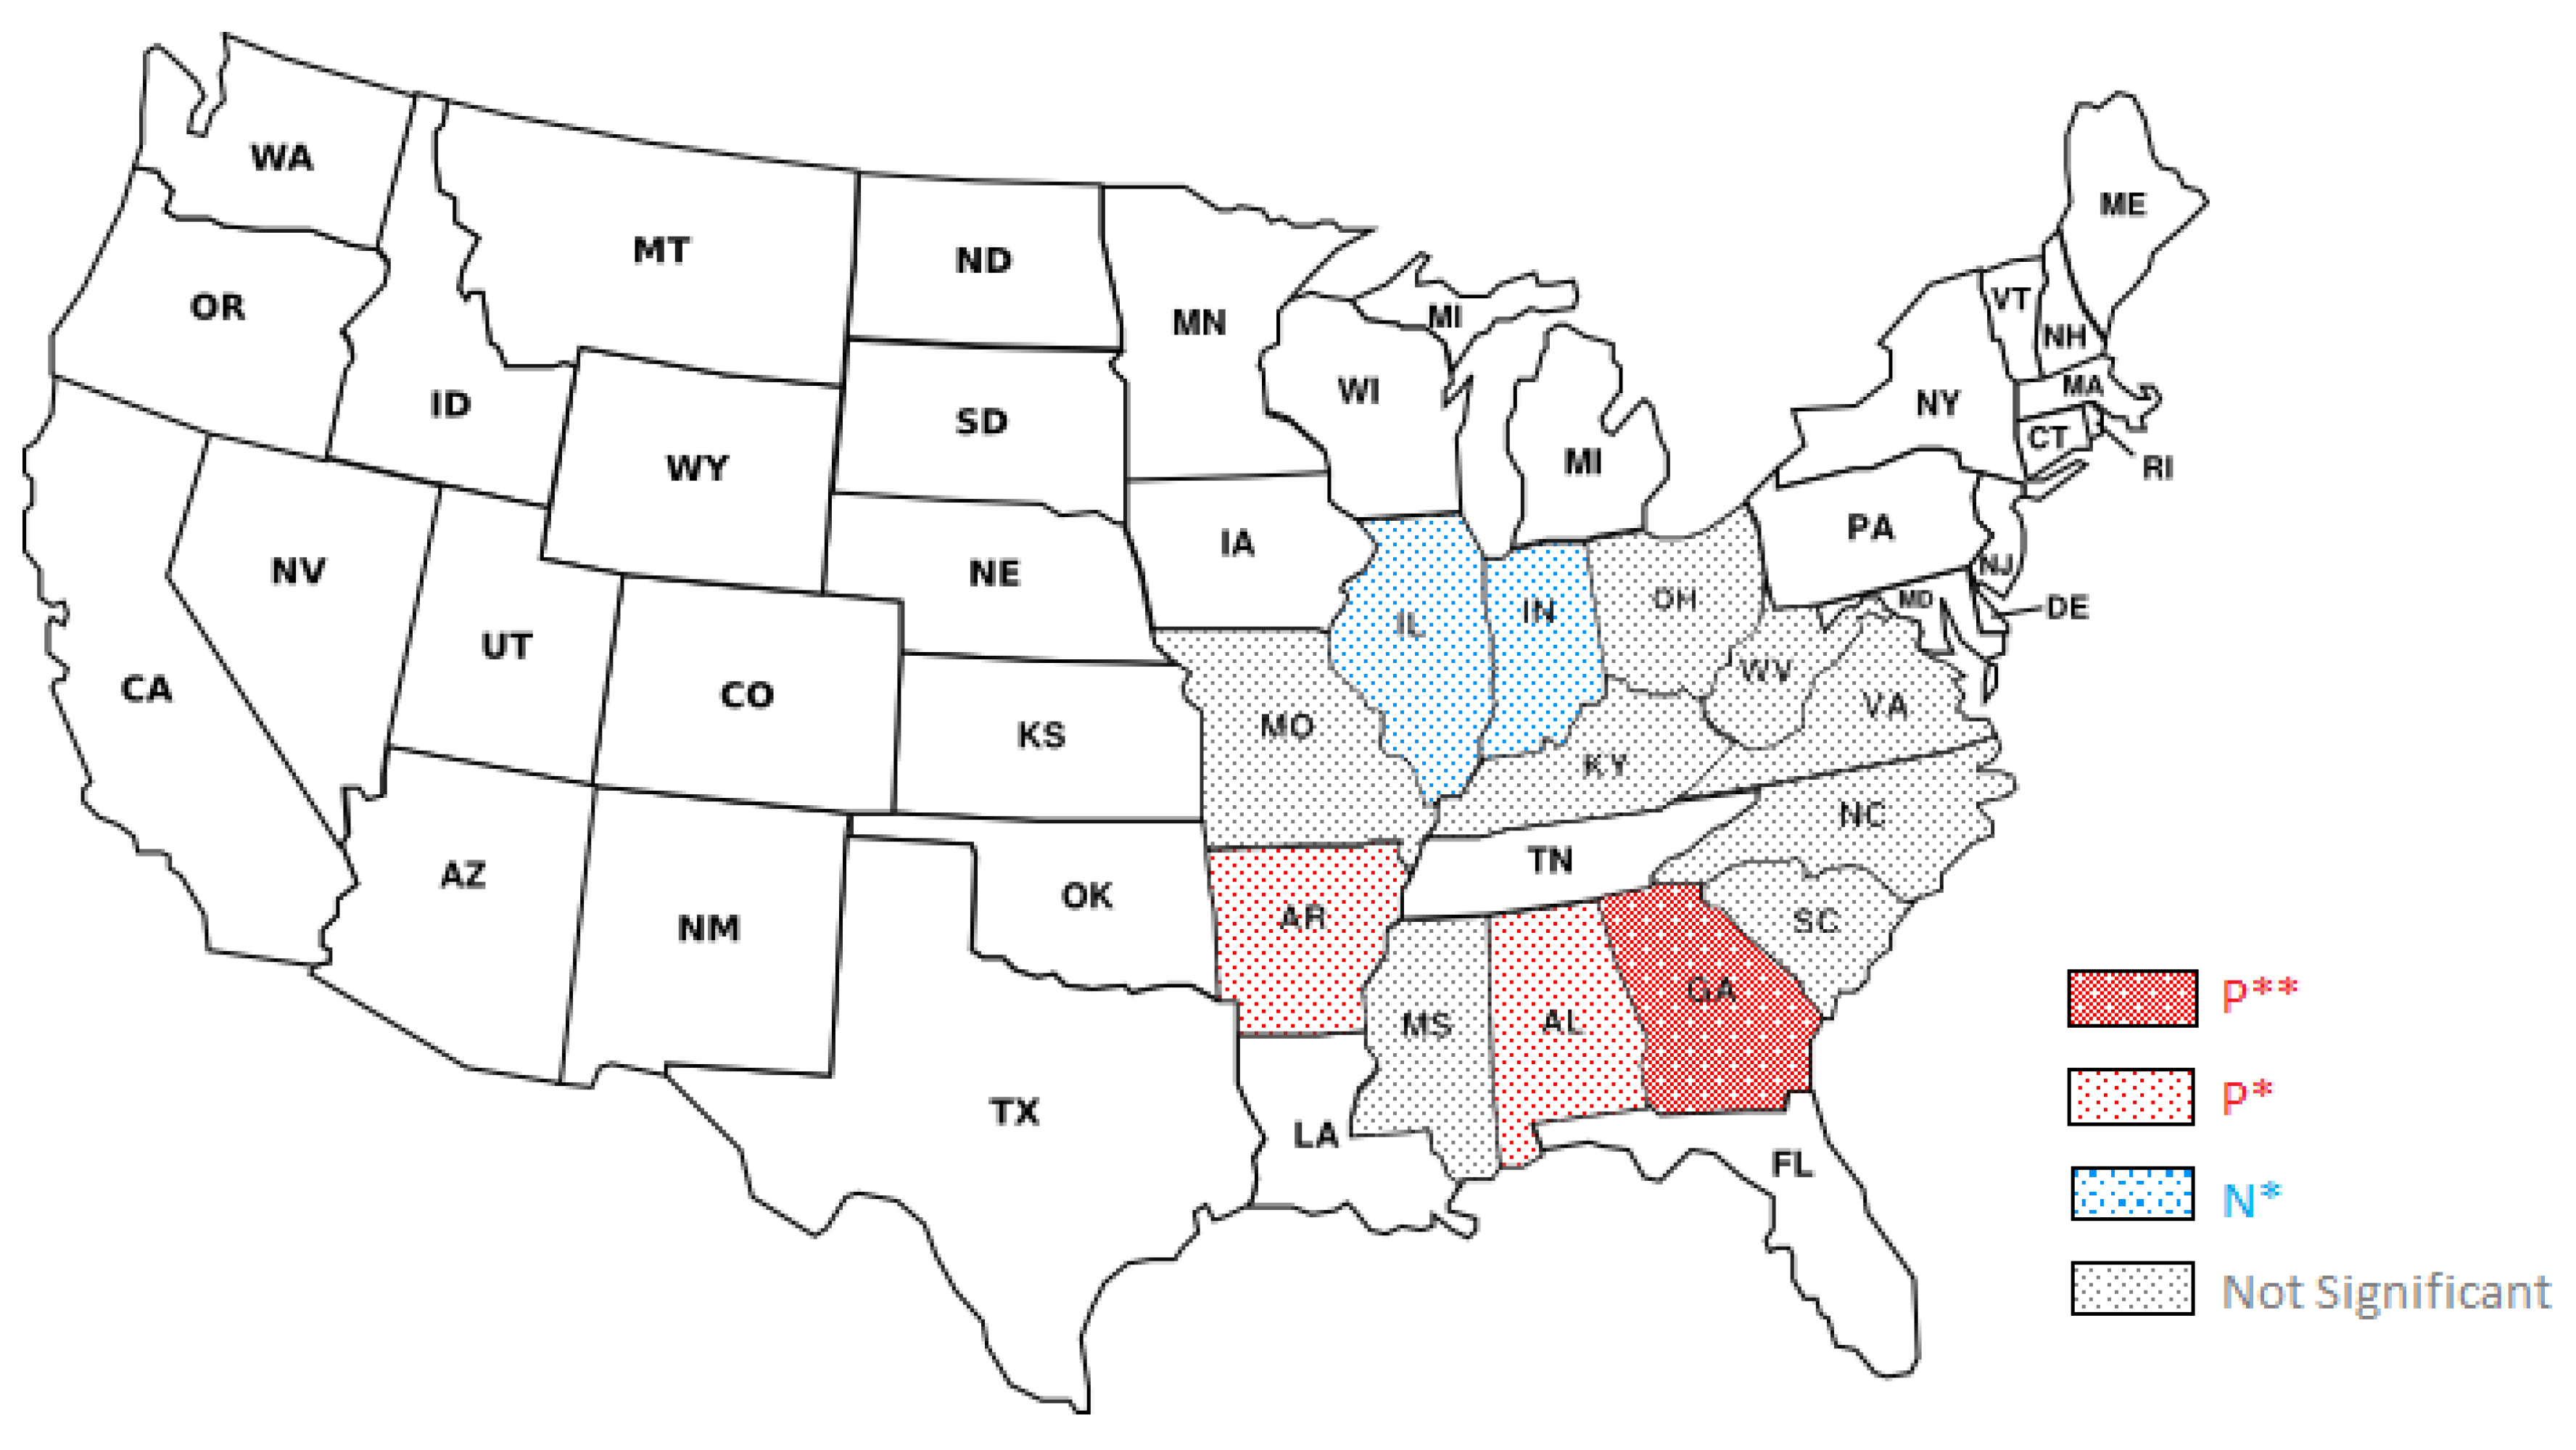
- Different policies may be more effective for different types of dispensers, and there is no one-size-fits-all solution. For example, based on the findings of the study, Pill Mill laws may be more effective in reducing Per Capita Pill Volume (PCPV) sold by practitioners, while Electronic PDMP (ePDMP) and Operational PDMP (OP-PDMP) laws may be more effective in reducing PCPV sold by pharmacies. As our results suggest, it is important for policymakers to consider the unique characteristics of different types of dispensers and tailor policies accordingly to achieve the desired outcome. These findings are in line with previous studies that show pharmacists and primary care physicians value the information provided by prescription drug monitoring programs, and that efforts to improve these programs should focus on making it easy for them to access all relevant information about a patient’s controlled substance prescriptions at the time they are making treatment decisions [33].
- 2.
- The study has highlighted the potential for unintended consequences of opioid-related policies. For instance, it suggests that as a result of these laws, there may be an increase in opioid sales or procurement from out-of-state dispensers or distributors. This could lead to an increase in opioid use disorder in neighboring states. Therefore, policymakers should be cognizant of these potential spillover effects and take steps to mitigate them. Previous research has also shown that individuals who frequently obtain opioid prescriptions tend to travel farther and go to different states to fill them. Additionally, they disproportionately contribute to the overall number of opioid prescriptions dispensed. These findings underline the need for sharing information among programs that track prescription data in order to curb excessive opioid procurement [34].
- 3.
- Policies may have impacts beyond their intended targets and may be more effective for different groups than originally intended. Policymakers should consider whether these unintended impacts are positive or negative and how they align with their goals. For example, while a law aimed at reducing opioid prescribing may be successful in achieving that goal, it may also have negative impacts on patients who depend on opioids for pain management. Policymakers should take a holistic approach when evaluating the impact of these laws and consider all potential consequences. Additionally, policymakers should continuously monitor and evaluate the laws’ effectiveness and make necessary adjustments to achieve the desired outcome.
5. Conclusions
Author Contributions
Funding
Institutional Review Board Statement
Informed Consent Statement
Data Availability Statement
Acknowledgments
Conflicts of Interest
Abbreviations
| PDMP | Prescription Drug Monitoring Programs |
| ePDMP | Electronic Prescription Drug Monitoring Programs |
| OP-PDMP, OPPDMP | Operational Prescription Drug Monitoring Programs |
| DEA | Drug Enforcement Administration |
| MA-PDMP, MAPDMP | Mandatory Prescription Drug Monitoring Programs |
| ARCOS | Automation of Reports and Consolidation Orders System |
| DID | difference-in-differences |
| PCPV | Per Capita Pill Volume |
| ATT | average treatment effect |
References
- Compton, W.M.; Jones, C.M. Epidemiology of the US opioid crisis: The importance of the vector. Ann. N. Y. Acad. Sci. 2019, 1451, 130–143. [Google Scholar] [CrossRef]
- Hedegaard, H.; Miniño, A.; Spencer, M.R.; Warner, M. Drug overdose deaths in the United States, 1999–2020. NCHS Data Brief 2022, 482, 1–8. [Google Scholar]
- Osmundson, S.S.; Min, J.Y.; Grijalva, C.G. Opioid prescribing after childbirth: Over-prescribing and chronic use. Curr. Opin. Obstet. Gynecol. 2019, 31, 83. [Google Scholar] [CrossRef] [PubMed]
- Rummans, T.A.; Burton, M.C.; Dawson, N.L. How good intentions contributed to bad outcomes: The opioid crisis. In Proceedings of the Mayo Clinic Proceedings; Elsevier: Amsterdam, The Netherlands, 2018; Volume 93, pp. 344–350. [Google Scholar]
- Cramer, J.D.; Gunaseelan, V.; Hu, H.M.; Bicket, M.C.; Waljee, J.F.; Brenner, M.J. Association of state opioid prescription duration limits with changes in opioid prescribing for Medicare beneficiaries. JAMA Intern. Med. 2021, 181, 1656–1657. [Google Scholar] [CrossRef]
- Lee, B.; Zhao, W.; Yang, K.C.; Ahn, Y.Y.; Perry, B.L. Systematic evaluation of state policy interventions targeting the US opioid epidemic, 2007–2018. JAMA Netw. Open 2021, 4, e2036687. [Google Scholar] [CrossRef] [PubMed]
- Cunningham, D.J.; Blatter, M.; Adams, S.B.; Gage, M.J. State regulation positively impacts opioid prescribing patterns in ankle fracture surgery: A national and state-level analysis. Injury 2022, 53, 445–452. [Google Scholar] [CrossRef]
- Clark, T.; Eadie, J.; Kreiner, P.; Strickler, G. Prescription drug monitoring programs: An assessment of the evidence for best practices. Prescr. Drug Monit. Program Cent. Excell. 2012. Available online: https://www.ojp.gov/ncjrs/virtual-library/abstracts/prescription-drug-monitoring-programs-assessment-evidence-best (accessed on 15 December 2022).
- Moyo, P.; Simoni-Wastila, L.; Griffin, B.A.; Onukwugha, E.; Harrington, D.; Alexander, G.C.; Palumbo, F. Impact of prescription drug monitoring programs (PDMPs) on opioid utilization among Medicare beneficiaries in 10 US States. Addiction 2017, 112, 1784–1796. [Google Scholar] [CrossRef]
- Holmgren, A.J.; Botelho, A.; Brandt, A.M. A history of prescription drug monitoring programs in the United States: Political appeal and public health efficacy. Am. J. Public Health 2020, 110, 1191–1197. [Google Scholar] [CrossRef]
- Kilby, A. Opioids for the Masses: Welfare Tradeoffs in the Regulation of Narcotic Pain Medications. Technical Report, in the Role of Research in Making Government More Effective. 2016. Available online: https://appam.confex.com/appam/2016/webprogram/Paper17364.html (accessed on 15 December 2022).
- Goldacre, B. Bad Pharma: How Drug Companies Mislead Doctors and Harm Patients; Macmillan: New York, NY, USA, 2014. [Google Scholar]
- Lopez, G. The Growing Number of Lawsuits against Opioid Companies Explained. Updat. May 2018, 15, 436. [Google Scholar]
- Ziedan, E.; Kaestner, R. Effect of Prescription Opioids and Prescription Opioid Control Policies on Infant Health. Technical Report, National Bureau of Economic Research. 2020. Available online: https://www.nber.org/papers/w26749 (accessed on 15 December 2022).
- Brass, E.P. Changing the status of drugs from prescription to over-the-counter availability. N. Engl. J. Med. 2001, 345, 810–816. [Google Scholar] [CrossRef]
- Jaberidoost, M.; Nikfar, S.; Abdollahiasl, A.; Dinarvand, R. Pharmaceutical supply chain risks: A systematic review. DARU J. Pharm. Sci. 2013, 21, 1–7. [Google Scholar] [CrossRef] [PubMed]
- Shah, N. Pharmaceutical supply chains: Key issues and strategies for optimisation. Comput. Chem. Eng. 2004, 28, 929–941. [Google Scholar] [CrossRef]
- Cunningham, D.J.; George, S.Z.; Lewis, B.D. The impact of state level public policy, prescriber education, and patient factors on opioid prescribing in elective orthopedic surgery: Findings from a tertiary, academic setting. Mayo Clin. Proc. Innov. Qual. Outcomes 2021, 5, 23–34. [Google Scholar] [CrossRef] [PubMed]
- Schuler, M.S.; Heins, S.E.; Smart, R.; Griffin, B.A.; Powell, D.; Stuart, E.A.; Pardo, B.; Smucker, S.; Patrick, S.W.; Pacula, R.L.; et al. The state of the science in opioid policy research. Drug Alcohol Depend. 2020, 214, 108137. [Google Scholar] [CrossRef]
- Ayres, I.; Jalal, A. The impact of prescription drug monitoring programs on US opioid prescriptions. J. Law Med. Ethics 2018, 46, 387–403. [Google Scholar] [CrossRef] [PubMed]
- Dickson-Gomez, J.; Christenson, E.; Weeks, M.; Galletly, C.; Wogen, J.; Spector, A.; McDonald, M.; Ohlrich, J. Effects of implementation and enforcement differences in prescription drug monitoring programs in 3 States: Connecticut, Kentucky, and Wisconsin. Subst. Abus. Res. Treat. 2021, 15, 1178221821992349. [Google Scholar] [CrossRef] [PubMed]
- Lyapustina, T.; Rutkow, L.; Chang, H.Y.; Daubresse, M.; Ramji, A.F.; Faul, M.; Stuart, E.A.; Alexander, G.C. Effect of a “pill mill” law on opioid prescribing and utilization: The case of Texas. Drug Alcohol Depend. 2016, 159, 190–197. [Google Scholar] [CrossRef]
- Von Korff, M.; Saunders, K.; Ray, G.T.; Boudreau, D.; Campbell, C.; Merrill, J.; Sullivan, M.D.; Rutter, C.; Silverberg, M.; Banta-Green, C.; et al. Defacto long-term opioid therapy for non-cancer pain. Clin. J. Pain 2008, 24, 521. [Google Scholar] [CrossRef]
- Cabrera, F.F.; Gamarra, E.R.; Garcia, T.E.; Littlejohn, A.D.; Chinga, P.A.; Pinentel-Morillo, L.D.; Tirado, J.R.; Chung, D.Y.; Pande, L.J.; McCall, K.L.; et al. Opioid distribution trends (2006–2017) in the US Territories. PeerJ 2019, 7, e6272. [Google Scholar] [CrossRef]
- Griffith, K.N.; Feyman, Y.; Auty, S.G.; Crable, E.L.; Levengood, T.W. County-level data on US opioid distributions, demographics, healthcare supply, and healthcare access. Data Brief 2021, 35, 106779. [Google Scholar] [CrossRef]
- Abadie, A. Semiparametric difference-in-differences estimators. Rev. Econ. Stud. 2005, 72, 1–19. [Google Scholar] [CrossRef]
- Imai, K.; Kim, I.S. On the use of two-way fixed effects regression models for causal inference with panel data. Political Anal. 2021, 29, 405–415. [Google Scholar] [CrossRef]
- Callaway, B.; Sant’Anna, P.H. Difference-in-differences with multiple time periods. J. Econom. 2021, 225, 200–230. [Google Scholar] [CrossRef]
- Griffin, B.A.; Schuler, M.S.; Stuart, E.A.; Patrick, S.; McNeer, E.; Smart, R.; Powell, D.; Stein, B.; Schell, T.; Pacula, R.L. Variation in Performance of Commonly Used Statistical Methods for Estimating Effectiveness of State-Level Opioid Policies on Opioid-Related Mortality. Technical Report, National Bureau of Economic Research. 2020. Available online: https://www.nber.org/papers/w27029 (accessed on 15 December 2022).
- Sun, L.; Abraham, S. Estimating dynamic treatment effects in event studies with heterogeneous treatment effects. J. Econom. 2021, 225, 175–199. [Google Scholar] [CrossRef]
- Bergé, L. Efficient Estimation of Maximum Likelihood Models with Multiple Fixed-Effects: The R Package FENmlm. Technical Report, Department of Economics at the University of Luxembourg. 2018. Available online: https://ideas.repec.org/p/luc/wpaper/18-13.html (accessed on 15 December 2022).
- Fakhrabad, A.; Sadeghi, A.H.; Kemahlioglu-Ziya, E.; Handfield, R.; Tohidi, H.; Farahani, I. The Impact of Opioid Prescribing Limits on Drug Usage in South Carolina: A Novel Geospatial and Time Series Data Analysis. arXiv 2023, arXiv:2301.08878. [Google Scholar]
- Freeman, P.R.; Curran, G.M.; Drummond, K.L.; Martin, B.C.; Teeter, B.S.; Bradley, K.; Schoenberg, N.; Edlund, M.J. Utilization of prescription drug monitoring programs for prescribing and dispensing decisions: Results from a multi-site qualitative study. Res. Soc. Adm. Pharm. 2019, 15, 754–760. [Google Scholar] [CrossRef] [PubMed]
- Cepeda, M.S.; Fife, D.; Yuan, Y.; Mastrogiovanni, G. Distance traveled and frequency of interstate opioid dispensing in opioid shoppers and nonshoppers. J. Pain 2013, 14, 1158–1161. [Google Scholar] [CrossRef] [Green Version]


| Supply Chain Player Policy | ||||||
|---|---|---|---|---|---|---|
| Dispenser | Distributor | |||||
| Pill Mill | ePDMP | opPDMP | Pill Mill | ePDMP | opPDMP | |
| Variables | ||||||
| ATT | −1.3 *** (0.44) | −0.27 (0.49) | 0.39 (0.28) | −34.1 *** (15.1) | −16.5 ** (6.6) | −4.0 (10.4) |
| Fixed-effects | ||||||
| State | yes | yes | yes | yes | yes | yes |
| Quarter | yes | yes | yes | yes | yes | yes |
| Fit statistics | ||||||
| 0.956 | 0.951 | 0.975 | 0.918 | 0.918 | 0.918 | |
| Observations | 1368 | 1475 | 1474 | 1401 | 1402 | 1402 |
Disclaimer/Publisher’s Note: The statements, opinions and data contained in all publications are solely those of the individual author(s) and contributor(s) and not of MDPI and/or the editor(s). MDPI and/or the editor(s) disclaim responsibility for any injury to people or property resulting from any ideas, methods, instructions or products referred to in the content. |
© 2023 by the authors. Licensee MDPI, Basel, Switzerland. This article is an open access article distributed under the terms and conditions of the Creative Commons Attribution (CC BY) license (https://creativecommons.org/licenses/by/4.0/).
Share and Cite
Sahebi-Fakhrabad, A.; Sadeghi, A.H.; Handfield, R. Evaluating State-Level Prescription Drug Monitoring Program (PDMP) and Pill Mill Effects on Opioid Consumption in Pharmaceutical Supply Chain. Healthcare 2023, 11, 437. https://doi.org/10.3390/healthcare11030437
Sahebi-Fakhrabad A, Sadeghi AH, Handfield R. Evaluating State-Level Prescription Drug Monitoring Program (PDMP) and Pill Mill Effects on Opioid Consumption in Pharmaceutical Supply Chain. Healthcare. 2023; 11(3):437. https://doi.org/10.3390/healthcare11030437
Chicago/Turabian StyleSahebi-Fakhrabad, Amirreza, Amir Hossein Sadeghi, and Robert Handfield. 2023. "Evaluating State-Level Prescription Drug Monitoring Program (PDMP) and Pill Mill Effects on Opioid Consumption in Pharmaceutical Supply Chain" Healthcare 11, no. 3: 437. https://doi.org/10.3390/healthcare11030437