
Current and Future Applications of Artificial Intelligence in Coronary Artery Disease

 , ,
, ,  , and
, and
Abstract
:1. Introduction
2. Integration of Genetics and AI in Cardiovascular Diseases
3. Risk Prediction Models and Imaging Modalities for Estimating Pretest Probability of CAD
4. Artificial Intelligence in Management of CAD in the Emergency Department
5. Artificial Intelligence to Predict Functionally Obstructive CAD and Lesion-Specific Ischemia—As a Gatekeeper to the Catheterization Laboratory
5.1. ML-Based CT-FFR Estimation and Diagnostic Accuracy
5.2. Impact of Calcification Burden on the Performance of CT-FFRML
5.3. CT-FFRML in Predicting Revascularization Events
6. Artificial Intelligence in the Field of Intracoronary Imaging
6.1. Artificial Intelligence to Optimize Peri-Intervention Workflow
6.2. Applications of Artificial Intelligence in Intra and Post-Intervention Workflow
7. Artificial Intelligence-Based Post-Procedure Risk Prediction Models
8. Artificial Intelligence-Based Long-Term Mortality and MACE Prediction Models
9. Discussions
10. Conclusions
Author Contributions
Funding
Data Availability Statement
Conflicts of Interest
References
- Virani, S.S.; Alonso, A.; Aparicio, H.J.; Benjamin, E.J.; Bittencourt, M.S.; Callaway, C.W.; Carson, A.P.; Chamberlain, A.M.; Cheng, S.; Delling, F.N.; et al. Heart Disease and Stroke Statistics—2021 Update. Circulation 2021, 143, e254–e743. [Google Scholar] [CrossRef]
- Benjamin, E.J.; Muntner, P.; Alonso, A.; Bittencourt, M.S.; Callaway, C.W.; Carson, A.P.; Chamberlain, A.M.; Chang, A.R.; Cheng, S.; Das, S.R.; et al. Heart Disease and Stroke Statistics—2019 Update: A Report From the American Heart Association. Circulation 2019, 139, e56–e528. [Google Scholar] [CrossRef]
- Arnett, D.K.; Blumenthal, R.S.; Albert, M.A.; Buroker, A.B.; Goldberger, Z.D.; Hahn, E.J.; Himmelfarb, C.D.; Khera, A.; Lloyd-Jones, D.; McEvoy, J.W.; et al. 2019 ACC/AHA Guideline on the Primary Prevention of Cardiovascular Disease: A Report of the American College of Cardiology/American Heart Association Task Force on Clinical Practice Guidelines. Circulation 2019, 140, e596–e646. [Google Scholar] [CrossRef]
- Aragam, K.G.; Natarajan, P. Polygenic Scores to Assess Atherosclerotic Cardiovascular Disease Risk: Clinical Perspectives and Basic Implications. Circ. Res. 2020, 126, 1159–1177. [Google Scholar] [CrossRef]
- Schaap, J.; de Groot, J.A.H.; Nieman, K.; Meijboom, W.B.; Boekholdt, S.M.; Kauling, R.M.; Post, M.C.; Van der Heyden, J.A.; de Kroon, T.L.; Rensing, B.J.W.M.; et al. Added value of hybrid myocardial perfusion SPECT and CT coronary angiography in the diagnosis of coronary artery disease. Eur. Heart J.-Cardiovasc. Imaging 2014, 15, 1281–1288. [Google Scholar] [CrossRef] [Green Version]
- Andreini, D.; Magnoni, M.; Conte, E.; Masson, S.; Mushtaq, S.; Berti, S.; Canestrari, M.; Casolo, G.; Gabrielli, D.; Latini, R.; et al. Coronary Plaque Features on CTA Can Identify Patients at Increased Risk of Cardiovascular Events. JACC Cardiovasc. Imaging 2020, 13, 1704–1717. [Google Scholar] [CrossRef]
- Budoff, M.J.; Mayrhofer, T.; Ferencik, M.; Bittner, D.; Lee, K.L.; Lu, M.T.; Coles, A.; Jang, J.; Krishnam, M.; Douglas, P.S.; et al. Prognostic Value of Coronary Artery Calcium in the PROMISE Study (Prospective Multicenter Imaging Study for Evaluation of Chest Pain). Circulation 2017, 136, 1993–2005. [Google Scholar] [CrossRef]
- Patel, V.L.; Shortliffe, E.H.; Stefanelli, M.; Szolovits, P.; Berthold, M.R.; Bellazzi, R.; Abu-Hanna, A. The coming of age of artificial intelligence in medicine. Artif. Intell. Med. 2009, 46, 5–17. [Google Scholar] [CrossRef] [Green Version]
- Ranka, S.; Reddy, M.; Noheria, A. Artificial intelligence in cardiovascular medicine. Curr. Opin. Cardiol. 2021, 36, 26–35. [Google Scholar] [CrossRef]
- Dey, D.; Slomka, P.J.; Leeson, P.; Comaniciu, D.; Shrestha, S.; Sengupta, P.P.; Marwick, T.H. Artificial Intelligence in Cardiovascular Imaging: JACC State-of-the-Art Review. J. Am. Coll. Cardiol. 2019, 73, 1317–1335. [Google Scholar] [CrossRef]
- Johnson, K.W.; Torres Soto, J.; Glicksberg, B.S.; Shameer, K.; Miotto, R.; Ali, M.; Ashley, E.; Dudley, J.T. Artificial Intelligence in Cardiology. J. Am. Coll. Cardiol. 2018, 71, 2668–2679. [Google Scholar] [CrossRef] [PubMed]
- Sprangers, M.A.G.; Sloan, J.A.; Barsevick, A.; Chauhan, C.; Dueck, A.C.; Raat, H.; Shi, Q.; Van Noorden, C.J.F.; Consortium, G. Scientific imperatives, clinical implications, and theoretical underpinnings for the investigation of the relationship between genetic variables and patient-reported quality-of-life outcomes. Qual. Life Res. 2010, 19, 1395–1403. [Google Scholar] [CrossRef] [PubMed] [Green Version]
- Erdmann, J.; Kessler, T.; Munoz Venegas, L.; Schunkert, H. A decade of genome-wide association studies for coronary artery disease: The challenges ahead. Cardiovasc. Res. 2018, 114, 1241–1257. [Google Scholar] [CrossRef] [PubMed]
- Noll, D.R.; Ginsberg, T.; Elahi, A.; Cavalieri, T.A. Effective Patient-Physician Communication Based on Osteopathic Philosophy in Caring for Elderly Patients. J. Osteopath. Med. 2016, 116, 42–47. [Google Scholar] [CrossRef] [Green Version]
- Kathiresan, S.; Melander, O.; Anevski, D.; Guiducci, C.; Burtt, N.P.; Roos, C.; Hirschhorn, J.N.; Berglund, G.; Hedblad, B.; Groop, L.; et al. Polymorphisms associated with cholesterol and risk of cardiovascular events. N. Engl. J. Med. 2008, 358, 1240–1249. [Google Scholar] [CrossRef] [Green Version]
- Brautbar, A.; Pompeii, L.A.; Dehghan, A.; Ngwa, J.S.; Nambi, V.; Virani, S.S.; Rivadeneira, F.; Uitterlinden, A.G.; Hofman, A.; Witteman, J.C.; et al. A genetic risk score based on direct associations with coronary heart disease improves coronary heart disease risk prediction in the Atherosclerosis Risk in Communities (ARIC), but not in the Rotterdam and Framingham Offspring, Studies. Atherosclerosis 2012, 223, 421–426. [Google Scholar] [CrossRef] [Green Version]
- Eraslan, G.; Avsec, Ž.; Gagneur, J.; Theis, F.J. Deep learning: New computational modelling techniques for genomics. Nat. Rev. Genet. 2019, 20, 389–403. [Google Scholar] [CrossRef]
- Wang, Y.; Liu, T.; Liu, Y.; Chen, J.; Xin, B.; Wu, M.; Cui, W. Coronary artery disease associated specific modules and feature genes revealed by integrative methods of WGCNA, MetaDE and machine learning. Gene 2019, 710, 122–130. [Google Scholar] [CrossRef]
- Balashanmugam, M.V.; Shivanandappa, T.B.; Nagarethinam, S.; Vastrad, B.; Vastrad, C. Analysis of Differentially Expressed Genes in Coronary Artery Disease by Integrated Microarray Analysis. Biomolecules 2019, 10, 35. [Google Scholar] [CrossRef] [Green Version]
- Zhang, D.; Guan, L.; Li, X. Bioinformatics analysis identifies potential diagnostic signatures for coronary artery disease. J. Int. Med. Res. 2020, 48, 300060520979856. [Google Scholar] [CrossRef]
- Dogan, M.V.; Grumbach, I.M.; Michaelson, J.J.; Philibert, R.A. Integrated genetic and epigenetic prediction of coronary heart disease in the Framingham Heart Study. PLoS ONE 2018, 13, e0190549. [Google Scholar] [CrossRef] [Green Version]
- Pattarabanjird, T.; Cress, C.; Nguyen, A.; Taylor, A.; Bekiranov, S.; McNamara, C. A Machine Learning Model Utilizing a Novel SNP Shows Enhanced Prediction of Coronary Artery Disease Severity. Genes 2020, 11, 1446. [Google Scholar] [CrossRef]
- Naushad, S.M.; Hussain, T.; Indumathi, B.; Samreen, K.; Alrokayan, S.A.; Kutala, V.K. Machine learning algorithm-based risk prediction model of coronary artery disease. Mol. Biol. Rep. 2018, 45, 901–910. [Google Scholar] [CrossRef]
- Ferguson, J.F.; Matthews, G.J.; Townsend, R.R.; Raj, D.S.; Kanetsky, P.A.; Budoff, M.; Fischer, M.J.; Rosas, S.E.; Kanthety, R.; Rahman, M.; et al. Candidate gene association study of coronary artery calcification in chronic kidney disease: Findings from the CRIC study (Chronic Renal Insufficiency Cohort). J. Am. Coll. Cardiol. 2013, 62, 789–798. [Google Scholar] [CrossRef] [Green Version]
- O’Donnell, C.J.; Kavousi, M.; Smith, A.V.; Kardia, S.L.; Feitosa, M.F.; Hwang, S.J.; Sun, Y.V.; Province, M.A.; Aspelund, T.; Dehghan, A.; et al. Genome-wide association study for coronary artery calcification with follow-up in myocardial infarction. Circulation 2011, 124, 2855–2864. [Google Scholar] [CrossRef]
- Oguz, C.; Sen, S.K.; Davis, A.R.; Fu, Y.P.; O’Donnell, C.J.; Gibbons, G.H. Genotype-driven identification of a molecular network predictive of advanced coronary calcium in ClinSeq® and Framingham Heart Study cohorts. BMC Syst. Biol. 2017, 11, 99. [Google Scholar] [CrossRef] [Green Version]
- Diamond, G.A.; Forrester, J.S. Analysis of probability as an aid in the clinical diagnosis of coronary-artery disease. N. Engl. J. Med. 1979, 300, 1350–1358. [Google Scholar] [CrossRef]
- Foldyna, B.; Udelson, J.E.; Karády, J.; Banerji, D.; Lu, M.T.; Mayrhofer, T.; Bittner, D.O.; Meyersohn, N.M.; Emami, H.; Genders, T.S.S.; et al. Pretest probability for patients with suspected obstructive coronary artery disease: Re-evaluating Diamond-Forrester for the contemporary era and clinical implications: Insights from the PROMISE trial. Eur. Heart J. Cardiovasc. Imaging 2019, 20, 574–581. [Google Scholar] [CrossRef] [Green Version]
- Genders, T.S.; Steyerberg, E.W.; Alkadhi, H.; Leschka, S.; Desbiolles, L.; Nieman, K.; Galema, T.W.; Meijboom, W.B.; Mollet, N.R.; de Feyter, P.J.; et al. A clinical prediction rule for the diagnosis of coronary artery disease: Validation, updating, and extension. Eur. Heart J. 2011, 32, 1316–1330. [Google Scholar] [CrossRef]
- Genders, T.S.; Steyerberg, E.W.; Hunink, M.G.; Nieman, K.; Galema, T.W.; Mollet, N.R.; de Feyter, P.J.; Krestin, G.P.; Alkadhi, H.; Leschka, S.; et al. Prediction model to estimate presence of coronary artery disease: Retrospective pooled analysis of existing cohorts. BMJ 2012, 344, e3485. [Google Scholar] [CrossRef] [Green Version]
- Bittencourt, M.S.; Hulten, E.; Polonsky, T.S.; Hoffman, U.; Nasir, K.; Abbara, S.; Di Carli, M.; Blankstein, R. European Society of Cardiology-Recommended Coronary Artery Disease Consortium Pretest Probability Scores More Accurately Predict Obstructive Coronary Disease and Cardiovascular Events Than the Diamond and Forrester Score: The Partners Registry. Circulation 2016, 134, 201–211. [Google Scholar] [CrossRef] [PubMed] [Green Version]
- Li, D.; Xiong, G.; Zeng, H.; Zhou, Q.; Jiang, J.; Guo, X. Machine learning-aided risk stratification system for the prediction of coronary artery disease. Int. J. Cardiol. 2021, 326, 30–34. [Google Scholar] [CrossRef] [PubMed]
- Velusamy, D.; Ramasamy, K. Ensemble of heterogeneous classifiers for diagnosis and prediction of coronary artery disease with reduced feature subset. Comput. Methods Programs Biomed. 2021, 198, 105770. [Google Scholar] [CrossRef] [PubMed]
- Muhammad, L.J.; Al-Shourbaji, I.; Haruna, A.A.; Mohammed, I.A.; Ahmad, A.; Jibrin, M.B. Machine Learning Predictive Models for Coronary Artery Disease. SN Comput. Sci. 2021, 2, 350. [Google Scholar] [CrossRef]
- Lin, S.; Li, Z.; Fu, B.; Chen, S.; Li, X.; Wang, Y.; Wang, X.; Lv, B.; Xu, B.; Song, X.; et al. Feasibility of using deep learning to detect coronary artery disease based on facial photo. Eur. Heart J. 2020, 41, 4400–4411. [Google Scholar] [CrossRef]
- Gulati, M.; Levy, P.D.; Mukherjee, D.; Amsterdam, E.; Bhatt, D.L.; Birtcher, K.K.; Blankstein, R.; Boyd, J.; Bullock-Palmer, R.P.; Conejo, T.; et al. 2021 AHA/ACC/ASE/CHEST/SAEM/SCCT/SCMR Guideline for the Evaluation and Diagnosis of Chest Pain: A Report of the American College of Cardiology/American Heart Association Joint Committee on Clinical Practice Guidelines. Circulation 2021, 78, e187–e285. [Google Scholar] [CrossRef]
- Baskaran, L.; Ying, X.; Xu, Z.; Al’Aref, S.J.; Lee, B.C.; Lee, S.E.; Danad, I.; Park, H.B.; Bathina, R.; Baggiano, A.; et al. Machine learning insight into the role of imaging and clinical variables for the prediction of obstructive coronary artery disease and revascularization: An exploratory analysis of the CONSERVE study. PLoS ONE 2020, 15, e0233791. [Google Scholar] [CrossRef]
- Al’Aref, S.J.; Maliakal, G.; Singh, G.; van Rosendael, A.R.; Ma, X.; Xu, Z.; Alawamlh, O.A.H.; Lee, B.; Pandey, M.; Achenbach, S.; et al. Machine learning of clinical variables and coronary artery calcium scoring for the prediction of obstructive coronary artery disease on coronary computed tomography angiography: Analysis from the CONFIRM registry. Eur. Heart J. 2020, 41, 359–367. [Google Scholar] [CrossRef] [Green Version]
- Arsanjani, R.; Xu, Y.; Dey, D.; Fish, M.; Dorbala, S.; Hayes, S.; Berman, D.; Germano, G.; Slomka, P. Improved accuracy of myocardial perfusion SPECT for the detection of coronary artery disease using a support vector machine algorithm. J. Nucl. Med. 2013, 54, 549–555. [Google Scholar] [CrossRef] [Green Version]
- Betancur, J.; Hu, L.H.; Commandeur, F.; Sharir, T.; Einstein, A.J.; Fish, M.B.; Ruddy, T.D.; Kaufmann, P.A.; Sinusas, A.J.; Miller, E.J.; et al. Deep Learning Analysis of Upright-Supine High-Efficiency SPECT Myocardial Perfusion Imaging for Prediction of Obstructive Coronary Artery Disease: A Multicenter Study. J. Nucl. Med. 2019, 60, 664–670. [Google Scholar] [CrossRef]
- Guner, L.A.; Karabacak, N.I.; Akdemir, O.U.; Karagoz, P.S.; Kocaman, S.A.; Cengel, A.; Unlu, M. An open-source framework of neural networks for diagnosis of coronary artery disease from myocardial perfusion SPECT. J. Nucl. Cardiol. 2010, 17, 405–413. [Google Scholar] [CrossRef]
- Rahmani, R.; Niazi, P.; Naseri, M.; Neishabouri, M.; Farzanefar, S.; Eftekhari, M.; Derakhshan, F.; Mollazadeh, R.; Meysami, A.; Abbasi, M. Improved diagnostic accuracy for myocardial perfusion imaging using artificial neural networks on different input variables including clinical and quantification data. Rev. Esp. Med. Nucl. E Imagen. Mol. 2019, 38, 275–279. [Google Scholar] [CrossRef]
- Betancur, J.; Commandeur, F.; Motlagh, M.; Sharir, T.; Einstein, A.J.; Bokhari, S.; Fish, M.B.; Ruddy, T.D.; Kaufmann, P.; Sinusas, A.J.; et al. Deep Learning for Prediction of Obstructive Disease From Fast Myocardial Perfusion SPECT: A Multicenter Study. JACC Cardiovasc. Imaging 2018, 11, 1654–1663. [Google Scholar] [CrossRef]
- Arsanjani, R.; Xu, Y.; Dey, D.; Vahistha, V.; Shalev, A.; Nakanishi, R.; Hayes, S.; Fish, M.; Berman, D.; Germano, G.; et al. Improved accuracy of myocardial perfusion SPECT for detection of coronary artery disease by machine learning in a large population. J. Nucl. Cardiol. 2013, 20, 553–562. [Google Scholar] [CrossRef] [Green Version]
- Rabbat, M.G.; Ramchandani, S.; Sanders, W.E., Jr. Cardiac Phase Space Analysis: Assessing Coronary Artery Disease Utilizing Artificial Intelligence. Biomed. Res. Int. 2021, 2021, 6637039. [Google Scholar] [CrossRef]
- Stuckey, T.D.; Gammon, R.S.; Goswami, R.; Depta, J.P.; Steuter, J.A.; Meine, F.J., 3rd; Roberts, M.C.; Singh, N.; Ramchandani, S.; Burton, T.; et al. Cardiac Phase Space Tomography: A novel method of assessing coronary artery disease utilizing machine learning. PLoS ONE 2018, 13, e0198603. [Google Scholar] [CrossRef]
- Medina, R.; Panidis, I.P.; Morganroth, J.; Kotler, M.N.; Mintz, G.S. The value of echocardiographic regional wall motion abnormalities in detecting coronary artery disease in patients with or without a dilated left ventricle. Am. Heart J. 1985, 109, 799–803. [Google Scholar] [CrossRef]
- Kusunose, K.; Abe, T.; Haga, A.; Fukuda, D.; Yamada, H.; Harada, M.; Sata, M. A Deep Learning Approach for Assessment of Regional Wall Motion Abnormality From Echocardiographic Images. JACC Cardiovasc. Imaging 2020, 13, 374–381. [Google Scholar] [CrossRef]
- Huang, M.-S.; Wang, C.-S.; Chiang, J.-H.; Liu, P.-Y.; Tsai, W.-C. Automated Recognition of Regional Wall Motion Abnormalities Through Deep Neural Network Interpretation of Transthoracic Echocardiography. Circulation 2020, 142, 1510–1520. [Google Scholar] [CrossRef]
- Asch, F.M.; Poilvert, N.; Abraham, T.; Jankowski, M.; Cleve, J.; Adams, M.; Romano, N.; Hong, H.; Mor-Avi, V.; Martin, R.P.; et al. Automated Echocardiographic Quantification of Left Ventricular Ejection Fraction Without Volume Measurements Using a Machine Learning Algorithm Mimicking a Human Expert. Circ. Cardiovasc. Imaging 2019, 12, e009303. [Google Scholar] [CrossRef]
- Kwon, J.M.; Lee, S.Y.; Jeon, K.H.; Lee, Y.; Kim, K.H.; Park, J.; Oh, B.H.; Lee, M.M. Deep Learning—Based Algorithm for Detecting Aortic Stenosis Using Electrocardiography. J. Am. Heart Assoc. 2020, 9, e014717. [Google Scholar] [CrossRef]
- Acharya, U.R.; Fujita, H.; Sudarshan, V.K.; Oh, S.L.; Adam, M.; Koh, J.E.W.; Tan, J.H.; Ghista, D.N.; Martis, R.J.; Chua, C.K.; et al. Automated detection and localization of myocardial infarction using electrocardiogram: A comparative study of different leads. Knowl.-Based Syst. 2016, 99, 146–156. [Google Scholar] [CrossRef]
- Han, C.; Shi, L. ML–ResNet: A novel network to detect and locate myocardial infarction using 12 leads ECG. Comput. Methods Programs Biomed. 2020, 185, 105138. [Google Scholar] [CrossRef]
- Lih, O.S.; Jahmunah, V.; San, T.R.; Ciaccio, E.J.; Yamakawa, T.; Tanabe, M.; Kobayashi, M.; Faust, O.; Acharya, U.R. Comprehensive electrocardiographic diagnosis based on deep learning. Artif. Intell. Med. 2020, 103, 101789. [Google Scholar] [CrossRef]
- Keller, T.; Zeller, T.; Ojeda, F.; Tzikas, S.; Lillpopp, L.; Sinning, C.; Wild, P.; Genth-Zotz, S.; Warnholtz, A.; Giannitsis, E. Serial changes in highly sensitive troponin I assay and early diagnosis of myocardial infarction. JAMA 2011, 306, 2684–2693. [Google Scholar] [CrossRef]
- Collet, J.P.; Thiele, H.; Barbato, E.; Barthelemy, O.; Bauersachs, J.; Bhatt, D.L.; Dendale, P.; Dorobantu, M.; Edvardsen, T.; Folliguet, T.; et al. 2020 ESC Guidelines for the management of acute coronary syndromes in patients presenting without persistent ST-segment elevation. Eur. Heart J. 2021, 42, 1289–1367. [Google Scholar] [CrossRef]
- Reichlin, T.; Schindler, C.; Drexler, B.; Twerenbold, R.; Reiter, M.; Zellweger, C.; Moehring, B.; Ziller, R.; Hoeller, R.; Rubini Gimenez, M.; et al. One-hour rule-out and rule-in of acute myocardial infarction using high-sensitivity cardiac troponin T. Arch. Intern. Med. 2012, 172, 1211–1218. [Google Scholar] [CrossRef]
- Reichlin, T.; Twerenbold, R.; Wildi, K.; Gimenez, M.R.; Bergsma, N.; Haaf, P.; Druey, S.; Puelacher, C.; Moehring, B.; Freese, M.; et al. Prospective validation of a 1-hour algorithm to rule-out and rule-in acute myocardial infarction using a high-sensitivity cardiac troponin T assay. Can. Med. Assoc. J. 2015, 187, E243. [Google Scholar] [CrossRef] [Green Version]
- Gimenez, M.R.; Twerenbold, R.; Jaeger, C.; Schindler, C.; Puelacher, C.; Wildi, K.; Reichlin, T.; Haaf, P.; Merk, S.; Honegger, U. One-hour rule-in and rule-out of acute myocardial infarction using high-sensitivity cardiac troponin I. Am. J. Med. 2015, 128, 861–870.e864. [Google Scholar] [CrossRef] [Green Version]
- Druey, S.; Wildi, K.; Twerenbold, R.; Jaeger, C.; Reichlin, T.; Haaf, P.; Gimenez, M.R.; Puelacher, C.; Wagener, M.; Radosavac, M. Early rule-out and rule-in of myocardial infarction using sensitive cardiac Troponin I. Int. J. Cardiol. 2015, 195, 163–170. [Google Scholar] [CrossRef] [Green Version]
- Neumann, J.T.; Sörensen, N.A.; Schwemer, T.; Ojeda, F.; Bourry, R.; Sciacca, V.; Schaefer, S.; Waldeyer, C.; Sinning, C.; Renné, T.; et al. Diagnosis of Myocardial Infarction Using a High-Sensitivity Troponin I 1-Hour Algorithm. JAMA Cardiol. 2016, 1, 397–404. [Google Scholar] [CrossRef] [Green Version]
- Twerenbold, R.; Badertscher, P.; Boeddinghaus, J.; Nestelberger, T.; Wildi, K.; Puelacher, C.; Sabti, Z.; Gimenez, M.R.; Tschirky, S.; Lavallaz, J.d.F.d.; et al. 0/1-Hour Triage Algorithm for Myocardial Infarction in Patients with Renal Dysfunction. Circulation 2018, 137, 436–451. [Google Scholar] [CrossRef]
- Boeddinghaus, J.; Nestelberger, T.; Twerenbold, R.; Neumann, J.T.; Lindahl, B.; Giannitsis, E.; Sörensen, N.A.; Badertscher, P.; Jann, J.E.; Wussler, D.; et al. Impact of age on the performance of the ESC 0/1h-algorithms for early diagnosis of myocardial infarction. Eur. Heart J. 2018, 39, 3780–3794. [Google Scholar] [CrossRef] [Green Version]
- McCarthy, C.P.; Neumann, J.T.; Michelhaugh, S.A.; Ibrahim, N.E.; Gaggin, H.K.; Sorensen, N.A.; Schaefer, S.; Zeller, T.; Magaret, C.A.; Barnes, G.; et al. Derivation and External Validation of a High-Sensitivity Cardiac Troponin-Based Proteomic Model to Predict the Presence of Obstructive Coronary Artery Disease. J. Am. Heart Assoc. 2020, 9, e017221. [Google Scholar] [CrossRef]
- Liu, C.Y.; Tang, C.X.; Zhang, X.L.; Chen, S.; Xie, Y.; Zhang, X.Y.; Qiao, H.Y.; Zhou, C.S.; Xu, P.P.; Lu, M.J.; et al. Deep learning powered coronary CT angiography for detecting obstructive coronary artery disease: The effect of reader experience, calcification and image quality. Eur. J. Radiol. 2021, 142, 109835. [Google Scholar] [CrossRef]
- Lee, J.-G.; Kim, H.; Kang, H.; Koo, H.J.; Kang, J.-W.; Kim, Y.-H.; Yang, D.H. Fully Automatic Coronary Calcium Score Software Empowered by Artificial Intelligence Technology: Validation Study Using Three CT Cohorts. Korean J. Radiol. 2021, 22, 1764–1776. [Google Scholar] [CrossRef]
- van Velzen, S.G.M.; Lessmann, N.; Velthuis, B.K.; Bank, I.E.M.; van den Bongard, D.; Leiner, T.; de Jong, P.A.; Veldhuis, W.B.; Correa, A.; Terry, J.G.; et al. Deep Learning for Automatic Calcium Scoring in CT: Validation Using Multiple Cardiac CT and Chest CT Protocols. Radiology 2020, 295, 66–79. [Google Scholar] [CrossRef]
- Baskaran, L.; Maliakal, G.; Al’Aref, S.J.; Singh, G.; Xu, Z.; Michalak, K.; Dolan, K.; Gianni, U.; van Rosendael, A.; van den Hoogen, I.; et al. Identification and Quantification of Cardiovascular Structures From CCTA: An End-to-End, Rapid, Pixel-Wise, Deep-Learning Method. JACC Cardiovasc. Imaging 2020, 13, 1163–1171. [Google Scholar] [CrossRef]
- Wang, W.; Wang, H.; Chen, Q.; Zhou, Z.; Wang, R.; Wang, H.; Zhang, N.; Chen, Y.; Sun, Z.; Xu, L. Coronary artery calcium score quantification using a deep-learning algorithm. Clin. Radiol. 2020, 75, 237.e11–237.e16. [Google Scholar] [CrossRef]
- von Knebel Doeberitz, P.L.; De Cecco, C.N.; Schoepf, U.J.; Duguay, T.M.; Albrecht, M.H.; van Assen, M.; Bauer, M.J.; Savage, R.H.; Pannell, J.T.; De Santis, D.; et al. Coronary CT angiography-derived plaque quantification with artificial intelligence CT fractional flow reserve for the identification of lesion-specific ischemia. Eur. Radiol. 2019, 29, 2378–2387. [Google Scholar] [CrossRef]
- Koo, H.J.; Lee, J.G.; Ko, J.Y.; Lee, G.; Kang, J.W.; Kim, Y.H.; Yang, D.H. Automated Segmentation of Left Ventricular Myocardium on Cardiac Computed Tomography Using Deep Learning. Korean J. Radiol. 2020, 21, 660–669. [Google Scholar] [CrossRef]
- Morris, E.D.; Ghanem, A.I.; Dong, M.; Pantelic, M.V.; Walker, E.M.; Glide-Hurst, C.K. Cardiac substructure segmentation with deep learning for improved cardiac sparing. Med. Phys. 2020, 47, 576–586. [Google Scholar] [CrossRef] [Green Version]
- Muscogiuri, G.; Chiesa, M.; Trotta, M.; Gatti, M.; Palmisano, V.; Dell’Aversana, S.; Baessato, F.; Cavaliere, A.; Cicala, G.; Loffreno, A.; et al. Performance of a deep learning algorithm for the evaluation of CAD-RADS classification with CCTA. Atherosclerosis 2020, 294, 25–32. [Google Scholar] [CrossRef] [Green Version]
- Fihn, S.D.; Gardin, J.M.; Abrams, J.; Berra, K.; Blankenship, J.C.; Dallas, A.P.; Douglas, P.S.; Foody, J.M.; Gerber, T.C.; Hinderliter, A.L.; et al. 2012 ACCF/AHA/ACP/AATS/PCNA/SCAI/STS Guideline for the Diagnosis and Management of Patients With Stable Ischemic Heart Disease. Circulation 2012, 126, e354–e471. [Google Scholar] [CrossRef]
- Biagini, E.; Shaw, L.J.; Poldermans, D.; Schinkel, A.F.; Rizzello, V.; Elhendy, A.; Rapezzi, C.; Bax, J.J. Accuracy of non-invasive techniques for diagnosis of coronary artery disease and prediction of cardiac events in patients with left bundle branch block: A meta-analysis. Eur. J. Nucl. Med. Mol. Imaging 2006, 33, 1442–1451. [Google Scholar] [CrossRef]
- Mahajan, N.; Polavaram, L.; Vankayala, H.; Ference, B.; Wang, Y.; Ager, J.; Kovach, J.; Afonso, L. Diagnostic accuracy of myocardial perfusion imaging and stress echocardiography for the diagnosis of left main and triple vessel coronary artery disease: A comparative meta-analysis. Heart 2010, 96, 956–966. [Google Scholar] [CrossRef]
- Jaarsma, C.; Leiner, T.; Bekkers Sebastiaan, C.; Crijns Harry, J.; Wildberger Joachim, E.; Nagel, E.; Nelemans Patricia, J.; Schalla, S. Diagnostic Performance of Noninvasive Myocardial Perfusion Imaging Using Single-Photon Emission Computed Tomography, Cardiac Magnetic Resonance, and Positron Emission Tomography Imaging for the Detection of Obstructive Coronary Artery Disease. J. Am. Coll. Cardiol. 2012, 59, 1719–1728. [Google Scholar] [CrossRef] [Green Version]
- Takx, R.A.P.; Blomberg, B.A.; Aidi, H.E.; Habets, J.; de Jong, P.A.; Nagel, E.; Hoffmann, U.; Leiner, T. Diagnostic Accuracy of Stress Myocardial Perfusion Imaging Compared to Invasive Coronary Angiography With Fractional Flow Reserve Meta-Analysis. Circ. Cardiovasc. Imaging 2015, 8, e002666. [Google Scholar] [CrossRef] [Green Version]
- Fleischmann, K.E.; Hunink, M.G.; Kuntz, K.M.; Douglas, P.S. Exercise echocardiography or exercise SPECT imaging? A meta-analysis of diagnostic test performance. JAMA 1998, 280, 913–920. [Google Scholar] [CrossRef]
- Holder, L.; Lewis, S.; Abrames, E.; Wolin, E.A. Review of SPECT myocardial perfusion imaging. J. Am. Osteopath. Coll. Radiol. 2016, 5, 5–13. [Google Scholar]
- Czaja, M.; Wygoda, Z.; Duszańska, A.; Szczerba, D.; Głowacki, J.; Gąsior, M.; Wasilewski, J.P. Interpreting myocardial perfusion scintigraphy using single-photon emission computed tomography. Part 1. Kardiochir. Torakochirurgia Pol. 2017, 14, 192–199. [Google Scholar] [CrossRef] [Green Version]
- Slomka, P.; Xu, Y.; Berman, D.; Germano, G. Quantitative analysis of perfusion studies: Strengths and pitfalls. J. Nucl. Cardiol. Off. Publ. Am. Soc. Nucl. Cardiol. 2012, 19, 338–346. [Google Scholar] [CrossRef] [Green Version]
- Hachamovitch, R.; Hayes, S.W.; Friedman, J.D.; Cohen, I.; Berman, D.S. A prognostic score for prediction of cardiac mortality risk after adenosine stress myocardial perfusion scintigraphy. J. Am. Coll. Cardiol. 2005, 45, 722–729. [Google Scholar] [CrossRef] [Green Version]
- Arsanjani, R.; Xu, Y.; Hayes, S.W.; Fish, M.; Lemley, M., Jr.; Gerlach, J.; Dorbala, S.; Berman, D.S.; Germano, G.; Slomka, P. Comparison of fully automated computer analysis and visual scoring for detection of coronary artery disease from myocardial perfusion SPECT in a large population. J. Nucl. Med. 2013, 54, 221–228. [Google Scholar] [CrossRef] [Green Version]
- Hu, L.H.; Betancur, J.; Sharir, T.; Einstein, A.J.; Bokhari, S.; Fish, M.B.; Ruddy, T.D.; Kaufmann, P.A.; Sinusas, A.J.; Miller, E.J.; et al. Machine learning predicts per-vessel early coronary revascularization after fast myocardial perfusion SPECT: Results from multicentre REFINE SPECT registry. Eur. Heart J. Cardiovasc. Imaging 2020, 21, 549–559. [Google Scholar] [CrossRef]
- Arsanjani, R.; Dey, D.; Khachatryan, T.; Shalev, A.; Hayes, S.W.; Fish, M.; Nakanishi, R.; Germano, G.; Berman, D.S.; Slomka, P. Prediction of revascularization after myocardial perfusion SPECT by machine learning in a large population. J. Nucl. Cardiol. 2015, 22, 877–884. [Google Scholar] [CrossRef]
- Koo, B.K.; Erglis, A.; Doh, J.H.; Daniels, D.V.; Jegere, S.; Kim, H.S.; Dunning, A.; DeFrance, T.; Lansky, A.; Leipsic, J.; et al. Diagnosis of ischemia-causing coronary stenoses by noninvasive fractional flow reserve computed from coronary computed tomographic angiograms. Results from the prospective multicenter DISCOVER-FLOW (Diagnosis of Ischemia-Causing Stenoses Obtained Via Noninvasive Fractional Flow Reserve) study. J. Am. Coll. Cardiol. 2011, 58, 1989–1997. [Google Scholar] [CrossRef] [Green Version]
- Min, J.K.; Berman, D.S.; Budoff, M.J.; Jaffer, F.A.; Leipsic, J.; Leon, M.B.; Mancini, G.B.; Mauri, L.; Schwartz, R.S.; Shaw, L.J. Rationale and design of the DeFACTO (Determination of Fractional Flow Reserve by Anatomic Computed Tomographic AngiOgraphy) study. J. Cardiovasc. Comput. Tomogr. 2011, 5, 301–309. [Google Scholar] [CrossRef]
- Nørgaard, B.L.; Leipsic, J.; Gaur, S.; Seneviratne, S.; Ko, B.S.; Ito, H.; Jensen, J.M.; Mauri, L.; Bruyne, B.D.; Bezerra, H.; et al. Diagnostic Performance of Noninvasive Fractional Flow Reserve Derived From Coronary Computed Tomography Angiography in Suspected Coronary Artery Disease. J. Am. Coll. Cardiol. 2014, 63, 1145–1155. [Google Scholar] [CrossRef] [Green Version]
- Rabbat, M.G.; Berman, D.S.; Kern, M.; Raff, G.; Chinnaiyan, K.; Koweek, L.; Shaw, L.J.; Blanke, P.; Scherer, M.; Jensen, J.M.; et al. Interpreting results of coronary computed tomography angiography-derived fractional flow reserve in clinical practice. J. Cardiovasc. Comput. Tomogr. 2017, 11, 383–388. [Google Scholar] [CrossRef]
- Rabbat, M.; Leipsic, J.; Bax, J.; Kauh, B.; Verma, R.; Doukas, D.; Allen, S.; Pontone, G.; Wilber, D.; Mathew, V.; et al. Fractional Flow Reserve Derived from Coronary Computed Tomography Angiography Safely Defers Invasive Coronary Angiography in Patients with Stable Coronary Artery Disease. J. Clin. Med. 2020, 9, 604. [Google Scholar] [CrossRef] [Green Version]
- Yeri, A.; Shah, R.V. Comparison of Computational Fluid Dynamics and Machine Learning-Based Fractional Flow Reserve in Coronary Artery Disease. Circ. Cardiovasc. Imaging 2018, 11, e007950. [Google Scholar] [CrossRef] [Green Version]
- Itu, L.; Rapaka, S.; Passerini, T.; Georgescu, B.; Schwemmer, C.; Schoebinger, M.; Flohr, T.; Sharma, P.; Comaniciu, D. A machine-learning approach for computation of fractional flow reserve from coronary computed tomography. J. Appl. Physiol. 2016, 121, 42–52. [Google Scholar] [CrossRef] [Green Version]
- Han, D.; Lee, J.H.; Rizvi, A.; Gransar, H.; Baskaran, L.; Schulman-Marcus, J.; Hartaigh, B.ó.; Lin, F.Y.; Min, J.K. Incremental role of resting myocardial computed tomography perfusion for predicting physiologically significant coronary artery disease: A machine learning approach. J. Nucl. Cardiol. 2018, 25, 223–233. [Google Scholar] [CrossRef] [Green Version]
- Zreik, M.; Lessmann, N.; van Hamersvelt, R.W.; Wolterink, J.M.; Voskuil, M.; Viergever, M.A.; Leiner, T.; Isgum, I. Deep learning analysis of the myocardium in coronary CT angiography for identification of patients with functionally significant coronary artery stenosis. Med. Image Anal. 2018, 44, 72–85. [Google Scholar] [CrossRef] [Green Version]
- Zreik, M.; van Hamersvelt, R.W.; Khalili, N.; Wolterink, J.M.; Voskuil, M.; Viergever, M.A.; Leiner, T.; Isgum, I. Deep Learning Analysis of Coronary Arteries in Cardiac CT Angiography for Detection of Patients Requiring Invasive Coronary Angiography. IEEE Trans. Med. Imaging 2020, 39, 1545–1557. [Google Scholar] [CrossRef] [Green Version]
- Coenen, A.; Kim, Y.H.; Kruk, M.; Tesche, C.; De Geer, J.; Kurata, A.; Lubbers, M.L.; Daemen, J.; Itu, L.; Rapaka, S.; et al. Diagnostic Accuracy of a Machine-Learning Approach to Coronary Computed Tomographic Angiography-Based Fractional Flow Reserve: Result From the MACHINE Consortium. Circ. Cardiovasc. Imaging 2018, 11, e007217. [Google Scholar] [CrossRef] [Green Version]
- Di Jiang, M.; Zhang, X.L.; Liu, H.; Tang, C.X.; Li, J.H.; Wang, Y.N.; Xu, P.P.; Zhou, C.S.; Zhou, F.; Lu, M.J.; et al. The effect of coronary calcification on diagnostic performance of machine learning-based CT-FFR: A Chinese multicenter study. Eur. Radiol. 2021, 31, 1482–1493. [Google Scholar] [CrossRef]
- Koo, H.J.; Kang, J.W.; Kang, S.J.; Kweon, J.; Lee, J.G.; Ahn, J.M.; Park, D.W.; Lee, S.W.; Lee, C.W.; Park, S.W.; et al. Impact of coronary calcium score and lesion characteristics on the diagnostic performance of machine-learning-based computed tomography-derived fractional flow reserve. Eur. Heart J. Cardiovasc. Imaging 2021, 22, 998–1006. [Google Scholar] [CrossRef]
- Kumamaru, K.K.; Fujimoto, S.; Otsuka, Y.; Kawasaki, T.; Kawaguchi, Y.; Kato, E.; Takamura, K.; Aoshima, C.; Kamo, Y.; Kogure, Y.; et al. Diagnostic accuracy of 3D deep-learning-based fully automated estimation of patient-level minimum fractional flow reserve from coronary computed tomography angiography. Eur. Heart J. Cardiovasc. Imaging 2020, 21, 437–445. [Google Scholar] [CrossRef] [Green Version]
- Kurata, A.; Fukuyama, N.; Hirai, K.; Kawaguchi, N.; Tanabe, Y.; Okayama, H.; Shigemi, S.; Watanabe, K.; Uetani, T.; Ikeda, S.; et al. On-Site Computed Tomography-Derived Fractional Flow Reserve Using a Machine-Learning Algorithm—Clinical Effectiveness in a Retrospective Multicenter Cohort. Circ. J. 2019, 83, 1563–1571. [Google Scholar] [CrossRef] [Green Version]
- Rother, J.; Moshage, M.; Dey, D.; Schwemmer, C.; Trobs, M.; Blachutzik, F.; Achenbach, S.; Schlundt, C.; Marwan, M. Comparison of invasively measured FFR with FFR derived from coronary CT angiography for detection of lesion-specific ischemia: Results from a PC-based prototype algorithm. J. Cardiovasc. Comput. Tomogr. 2018, 12, 101–107. [Google Scholar] [CrossRef]
- Tang, C.X.; Wang, Y.N.; Zhou, F.; Schoepf, U.J.; Assen, M.V.; Stroud, R.E.; Li, J.H.; Zhang, X.L.; Lu, M.J.; Zhou, C.S.; et al. Diagnostic performance of fractional flow reserve derived from coronary CT angiography for detection of lesion-specific ischemia: A multi-center study and meta-analysis. Eur. J. Radiol. 2019, 116, 90–97. [Google Scholar] [CrossRef]
- Tesche, C.; Otani, K.; De Cecco, C.N.; Coenen, A.; De Geer, J.; Kruk, M.; Kim, Y.H.; Albrecht, M.H.; Baumann, S.; Renker, M.; et al. Influence of Coronary Calcium on Diagnostic Performance of Machine Learning CT-FFR: Results From MACHINE Registry. JACC Cardiovasc. Imaging 2020, 13, 760–770. [Google Scholar] [CrossRef]
- Wang, Z.Q.; Zhou, Y.J.; Zhao, Y.X.; Shi, D.M.; Liu, Y.Y.; Liu, W.; Liu, X.L.; Li, Y.P. Diagnostic accuracy of a deep learning approach to calculate FFR from coronary CT angiography. J. Geriatr. Cardiol. 2019, 16, 42–48. [Google Scholar] [CrossRef]
- Wardziak, L.; Kruk, M.; Pleban, W.; Demkow, M.; Ruzyllo, W.; Dzielinska, Z.; Kepka, C. Coronary CTA enhanced with CTA based FFR analysis provides higher diagnostic value than invasive coronary angiography in patients with intermediate coronary stenosis. J. Cardiovasc. Comput. Tomogr. 2019, 13, 62–67. [Google Scholar] [CrossRef]
- Tesche, C.; De Cecco, C.N.; Baumann, S.; Renker, M.; McLaurin, T.W.; Duguay, T.M.; Bayer, R.R., 2nd; Steinberg, D.H.; Grant, K.L.; Canstein, C.; et al. Coronary CT Angiography-derived Fractional Flow Reserve: Machine Learning Algorithm versus Computational Fluid Dynamics Modeling. Radiology 2018, 288, 64–72. [Google Scholar] [CrossRef] [Green Version]
- Arbab-Zadeh, A.; Miller, J.M.; Rochitte, C.E.; Dewey, M.; Niinuma, H.; Gottlieb, I.; Paul, N.; Clouse, M.E.; Shapiro, E.P.; Hoe, J.; et al. Diagnostic accuracy of computed tomography coronary angiography according to pre-test probability of coronary artery disease and severity of coronary arterial calcification. The CORE-64 (Coronary Artery Evaluation Using 64-Row Multidetector Computed Tomography Angiography) International Multicenter Study. J. Am. Coll. Cardiol. 2012, 59, 379–387. [Google Scholar] [CrossRef] [Green Version]
- Chen, C.-C.; Chen, C.-C.; Hsieh, I.C.; Liu, Y.-C.; Liu, C.-Y.; Chan, T.; Wen, M.-S.; Wan, Y.-L. The effect of calcium score on the diagnostic accuracy of coronary computed tomography angiography. Int. J. Cardiovasc. Imaging 2011, 27, 37–42. [Google Scholar] [CrossRef]
- Vavere, A.L.; Arbab-Zadeh, A.; Rochitte, C.E.; Dewey, M.; Niinuma, H.; Gottlieb, I.; Clouse, M.E.; Bush, D.E.; Hoe, J.W.M.; de Roos, A.; et al. Coronary artery stenoses: Accuracy of 64-detector row CT angiography in segments with mild, moderate, or severe calcification--a subanalysis of the CORE-64 trial. Radiology 2011, 261, 100–108. [Google Scholar] [CrossRef] [Green Version]
- Arjmand Shabestari, A. Coronary artery calcium score: A review. Iran Red. Crescent. Med. J. 2013, 15, e16616. [Google Scholar] [CrossRef] [Green Version]
- Agatston, A.S.; Janowitz, W.R.; Hildner, F.J.; Zusmer, N.R.; Viamonte, M., Jr.; Detrano, R. Quantification of coronary artery calcium using ultrafast computed tomography. J. Am. Coll. Cardiol. 1990, 15, 827–832. [Google Scholar] [CrossRef] [Green Version]
- Yu, M.; Li, Y.; Li, W.; Lu, Z.; Wei, M.; Zhang, J. Calcification remodeling index assessed by cardiac CT predicts severe coronary stenosis in lesions with moderate to severe calcification. J. Cardiovasc. Comput. Tomogr. 2018, 12, 42–49. [Google Scholar] [CrossRef] [Green Version]
- Sekimoto, T.; Akutsu, Y.; Hamazaki, Y.; Sakai, K.; Kosaki, R.; Yokota, H.; Tsujita, H.; Tsukamoto, S.; Kaneko, K.; Sakurai, M.; et al. Regional calcified plaque score evaluated by multidetector computed tomography for predicting the addition of rotational atherectomy during percutaneous coronary intervention. J. Cardiovasc. Comput. Tomogr. 2016, 10, 221–228. [Google Scholar] [CrossRef]
- Qiao, H.Y.; Tang, C.X.; Schoepf, U.J.; Tesche, C.; Bayer, R.R., 2nd; Giovagnoli, D.A.; Todd Hudson, H., Jr.; Zhou, C.S.; Yan, J.; Lu, M.J.; et al. Impact of machine learning-based coronary computed tomography angiography fractional flow reserve on treatment decisions and clinical outcomes in patients with suspected coronary artery disease. Eur. Radiol. 2020, 30, 5841–5851. [Google Scholar] [CrossRef]
- Liu, X.; Mo, X.; Zhang, H.; Yang, G.; Shi, C.; Hau, W.K. A 2-year investigation of the impact of the computed tomography-derived fractional flow reserve calculated using a deep learning algorithm on routine decision-making for coronary artery disease management. Eur. Radiol. 2021, 31, 7039–7046. [Google Scholar] [CrossRef]
- Martin, S.S.; Mastrodicasa, D.; van Assen, M.; De Cecco, C.N.; Bayer, R.R.; Tesche, C.; Varga-Szemes, A.; Fischer, A.M.; Jacobs, B.E.; Sahbaee, P.; et al. Value of Machine Learning-based Coronary CT Fractional Flow Reserve Applied to Triple-Rule-Out CT Angiography in Acute Chest Pain. Radiol. Cardiothorac. Imaging 2020, 2, e190137. [Google Scholar] [CrossRef]
- Nous, F.M.A.; Budde, R.P.J.; Lubbers, M.M.; Yamasaki, Y.; Kardys, I.; Bruning, T.A.; Akkerhuis, J.M.; Kofflard, M.J.M.; Kietselaer, B.; Galema, T.W.; et al. Impact of machine-learning CT-derived fractional flow reserve for the diagnosis and management of coronary artery disease in the randomized CRESCENT trials. Eur. Radiol. 2020, 30, 3692–3701. [Google Scholar] [CrossRef]
- Cook, C.M.; Petraco, R.; Shun-Shin, M.J.; Ahmad, Y.; Nijjer, S.; Al-Lamee, R.; Kikuta, Y.; Shiono, Y.; Mayet, J.; Francis, D.P.; et al. Diagnostic Accuracy of Computed Tomography–Derived Fractional Flow Reserve: A Systematic Review. JAMA Cardiol. 2017, 2, 803–810. [Google Scholar] [CrossRef]
- Gaur, S.; Ovrehus, K.A.; Dey, D.; Leipsic, J.; Botker, H.E.; Jensen, J.M.; Narula, J.; Ahmadi, A.; Achenbach, S.; Ko, B.S.; et al. Coronary plaque quantification and fractional flow reserve by coronary computed tomography angiography identify ischaemia-causing lesions. Eur. Heart J. 2016, 37, 1220–1227. [Google Scholar] [CrossRef]
- Kawasaki, T.; Kidoh, M.; Kido, T.; Sueta, D.; Fujimoto, S.; Kumamaru, K.K.; Uetani, T.; Tanabe, Y.; Ueda, T.; Sakabe, D.; et al. Evaluation of Significant Coronary Artery Disease Based on CT Fractional Flow Reserve and Plaque Characteristics Using Random Forest Analysis in Machine Learning. Acad. Radiol. 2020, 27, 1700–1708. [Google Scholar] [CrossRef]
- Vasquez, A.; Mistry, N.; Singh, J. Impact of Intravascular Ultrasound in Clinical Practice. Interv. Cardiol. 2014, 9, 156–163. [Google Scholar] [CrossRef] [Green Version]
- Metz, J.A.; Yock, P.G.; Fitzgerald, P.J. Intravascular ultrasound: Basic interpretation. Cardiol. Clin. 1997, 15, 1–15. [Google Scholar] [CrossRef]
- Ma, T.; Yu, M.; Li, J.; Munding, C.E.; Chen, Z.; Fei, C.; Shung, K.K.; Zhou, Q. Multi-frequency intravascular ultrasound (IVUS) imaging. IEEE Trans. Ultrason. Ferroelectr. Freq. Control 2015, 62, 97–107. [Google Scholar] [CrossRef] [Green Version]
- Pu, J.; Mintz, G.S.; Biro, S.; Lee, J.-B.; Sum, S.T.; Madden, S.P.; Burke, A.P.; Zhang, P.; He, B.; Goldstein, J.A.; et al. Insights Into Echo-Attenuated Plaques, Echolucent Plaques, and Plaques With Spotty Calcification: Novel Findings From Comparisons Among Intravascular Ultrasound, Near-Infrared Spectroscopy, and Pathological Histology in 2294 Human Coronary Artery Segments. J. Am. Coll. Cardiol. 2014, 63, 2220–2233. [Google Scholar] [CrossRef]
- Mintz, G.S.; Pichard, A.D.; Popma, J.J.; Kent, K.M.; Satler, L.F.; Bucher, T.A.; Leon, M.B. Determinants and Correlates of Target Lesion Calcium in Coronary Artery Disease: A Clinical, Angiographic and Intravascular Ultrasound Study. J. Am. Coll. Cardiol. 1997, 29, 268–274. [Google Scholar] [CrossRef] [Green Version]
- Kobayashi, Y.; Okura, H.; Kume, T.; Yamada, R.; Kobayashi, Y.; Fukuhara, K.; Koyama, T.; Nezuo, S.; Neishi, Y.; Hayashida, A.; et al. Impact of target lesion coronary calcification on stent expansion. Circ. J. 2014, 78, 2209–2214. [Google Scholar] [CrossRef] [Green Version]
- Nair, A.; Kuban, B.D.; Tuzcu, E.M.; Schoenhagen, P.; Nissen, S.E.; Vince, D.G. Coronary Plaque Classification With Intravascular Ultrasound Radiofrequency Data Analysis. Circulation 2002, 106, 2200–2206. [Google Scholar] [CrossRef] [Green Version]
- Sonoda, S.; Hibi, K.; Okura, H.; Fujii, K.; Honda, Y.; Kobayashi, Y. Current clinical use of intravascular ultrasound imaging to guide percutaneous coronary interventions. Cardiovasc. Interv. 2020, 35, 30–36. [Google Scholar] [CrossRef]
- Maehara, A.; Matsumura, M.; Ali, Z.A.; Mintz, G.S.; Stone, G.W. IVUS-Guided Versus OCT-Guided Coronary Stent Implantation: A Critical Appraisal. JACC Cardiovasc. Imaging 2017, 10, 1487–1503. [Google Scholar] [CrossRef]
- Malik, A.H.; Yandrapalli, S.; Aronow, W.S.; Panza, J.A.; Cooper, H.A. Intravascular ultrasound-guided stent implantation reduces cardiovascular mortality—Updated meta-analysis of randomized controlled trials. Int. J. Cardiol. 2020, 299, 100–105. [Google Scholar] [CrossRef]
- Chieffo, A.; Latib, A.; Caussin, C.; Presbitero, P.; Galli, S.; Menozzi, A.; Varbella, F.; Mauri, F.; Valgimigli, M.; Arampatzis, C.; et al. A prospective, randomized trial of intravascular-ultrasound guided compared to angiography guided stent implantation in complex coronary lesions: The AVIO trial. Am. Heart J. 2013, 165, 65–72. [Google Scholar] [CrossRef]
- Sinclair, H.; Bourantas, C.; Bagnall, A.; Mintz, G.S.; Kunadian, V. OCT for the identification of vulnerable plaque in acute coronary syndrome. JACC Cardiovasc. Imaging 2015, 8, 198–209. [Google Scholar] [CrossRef] [Green Version]
- Cheng, J.M.; Garcia-Garcia, H.M.; de Boer, S.P.; Kardys, I.; Heo, J.H.; Akkerhuis, K.M.; Oemrawsingh, R.M.; van Domburg, R.T.; Ligthart, J.; Witberg, K.T.; et al. In vivo detection of high-risk coronary plaques by radiofrequency intravascular ultrasound and cardiovascular outcome: Results of the ATHEROREMO-IVUS study. Eur. Heart J. 2014, 35, 639–647. [Google Scholar] [CrossRef] [Green Version]
- Räber, L.; Ueki, Y. Outcomes of Intravascular Ultrasound-Guided Percutaneous Coronary Intervention in the United States. JACC Cardiovasc. Interv. 2020, 13, 1891–1893. [Google Scholar] [CrossRef]
- Ali, Z.A.; Karimi Galougahi, K.; Maehara, A.; Shlofmitz, R.A.; Ben-Yehuda, O.; Mintz, G.S.; Stone, G.W. Intracoronary Optical Coherence Tomography 2018: Current Status and Future Directions. JACC Cardiovasc. Interv. 2017, 10, 2473–2487. [Google Scholar] [CrossRef]
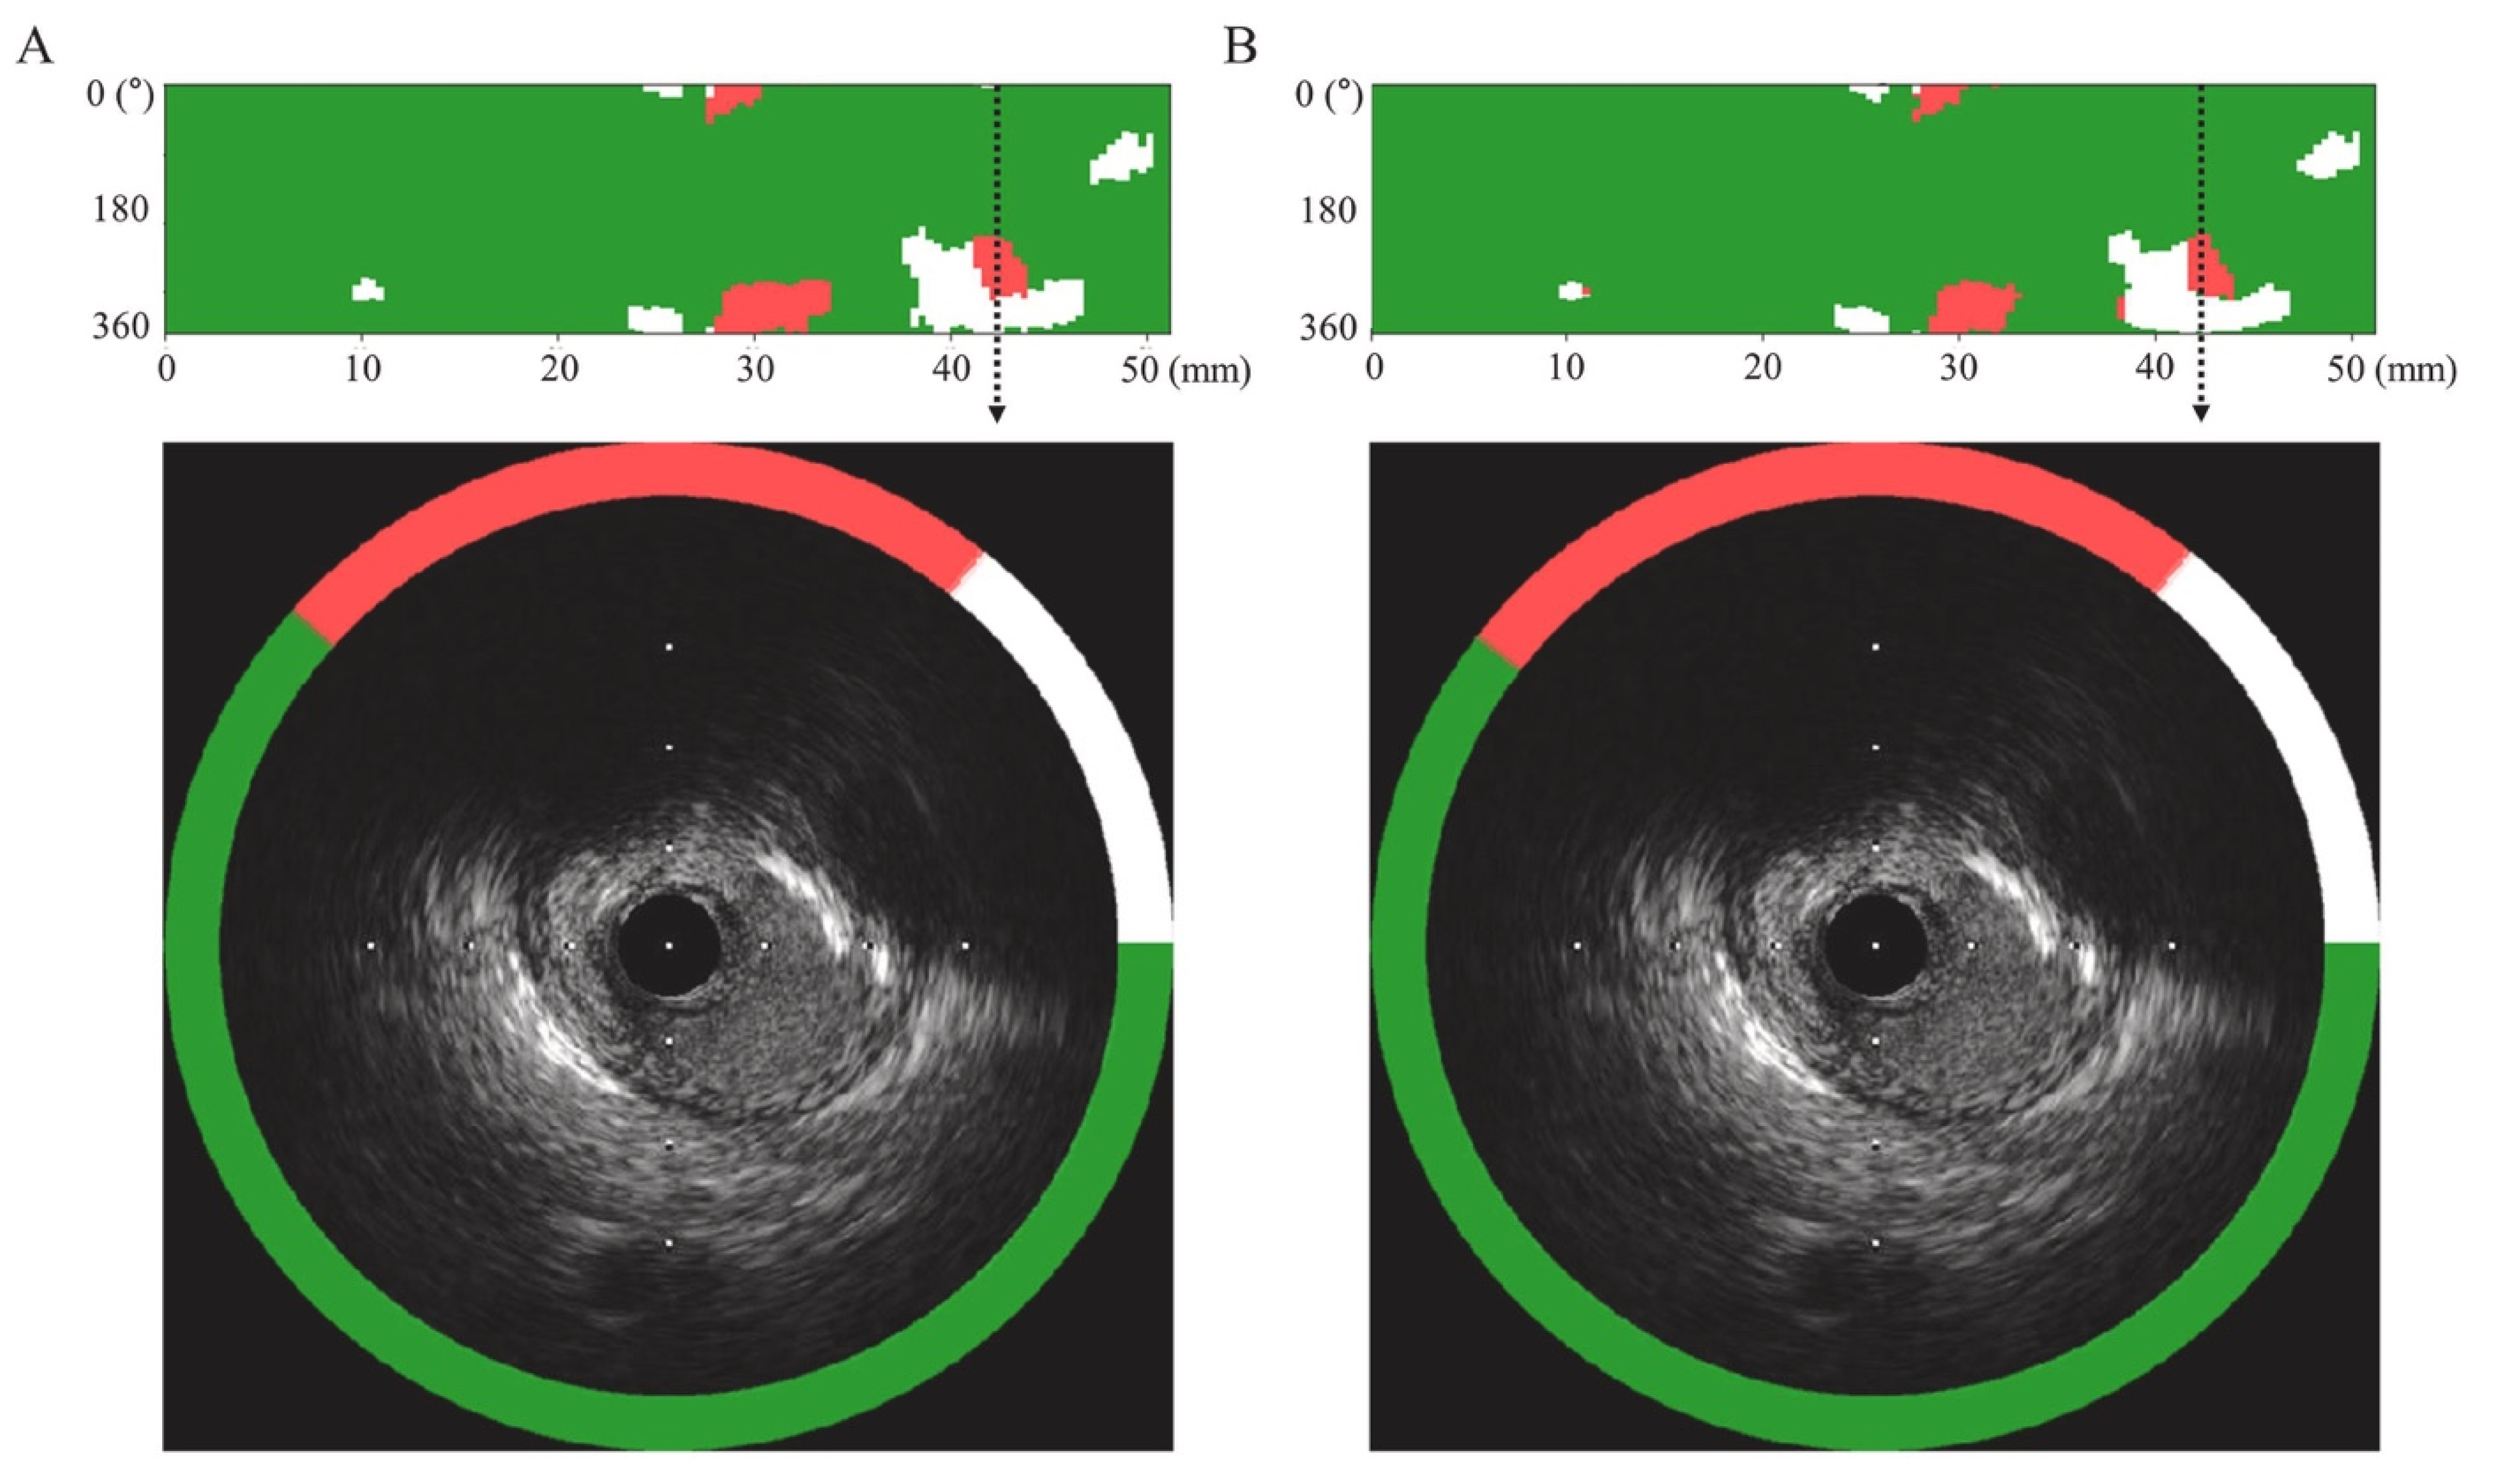
- Bae, Y.; Kang, S.J.; Kim, G.; Lee, J.G.; Min, H.S.; Cho, H.; Kang, D.Y.; Lee, P.H.; Ahn, J.M.; Park, D.W.; et al. Prediction of coronary thin-cap fibroatheroma by intravascular ultrasound-based machine learning. Atherosclerosis 2019, 288, 168–174. [Google Scholar] [CrossRef]
- Min, H.S.; Yoo, J.H.; Kang, S.J.; Lee, J.G.; Cho, H.; Lee, P.H.; Ahn, J.M.; Park, D.W.; Lee, S.W.; Kim, Y.H.; et al. Detection of optical coherence tomography-defined thin-cap fibroatheroma in the coronary artery using deep learning. EuroIntervention 2020, 16, 404–412. [Google Scholar] [CrossRef]
- Cho, H.; Kang, S.J.; Min, H.S.; Lee, J.G.; Kim, W.J.; Kang, S.H.; Kang, D.Y.; Lee, P.H.; Ahn, J.M.; Park, D.W.; et al. Intravascular ultrasound-based deep learning for plaque characterization in coronary artery disease. Atherosclerosis 2021, 324, 69–75. [Google Scholar] [CrossRef]
- Hong, M.K.; Mintz, G.S.; Lee, C.W.; Park, D.W.; Choi, B.R.; Park, K.H.; Kim, Y.H.; Cheong, S.S.; Song, J.K.; Kim, J.J.; et al. Intravascular ultrasound predictors of angiographic restenosis after sirolimus-eluting stent implantation. Eur. Heart J. 2006, 27, 1305–1310. [Google Scholar] [CrossRef] [Green Version]
- Song, H.G.; Kang, S.J.; Ahn, J.M.; Kim, W.J.; Lee, J.Y.; Park, D.W.; Lee, S.W.; Kim, Y.H.; Lee, C.W.; Park, S.W.; et al. Intravascular ultrasound assessment of optimal stent area to prevent in-stent restenosis after zotarolimus-, everolimus-, and sirolimus-eluting stent implantation. Catheter. Cardiovasc. Interv. 2014, 83, 873–878. [Google Scholar] [CrossRef] [PubMed]
- Fujii, K.; Carlier, S.G.; Mintz, G.S.; Yang, Y.M.; Moussa, I.; Weisz, G.; Dangas, G.; Mehran, R.; Lansky, A.J.; Kreps, E.M.; et al. Stent underexpansion and residual reference segment stenosis are related to stent thrombosis after sirolimus-eluting stent implantation: An intravascular ultrasound study. J. Am. Coll. Cardiol. 2005, 45, 995–998. [Google Scholar] [CrossRef] [PubMed] [Green Version]
- Doi, H.; Maehara, A.; Mintz, G.S.; Yu, A.; Wang, H.; Mandinov, L.; Popma, J.J.; Ellis, S.G.; Grube, E.; Dawkins, K.D.; et al. Impact of post-intervention minimal stent area on 9-month follow-up patency of paclitaxel-eluting stents: An integrated intravascular ultrasound analysis from the TAXUS IV, V, and VI and TAXUS ATLAS Workhorse, Long Lesion, and Direct Stent Trials. JACC Cardiovasc. Interv. 2009, 2, 1269–1275. [Google Scholar] [CrossRef] [PubMed] [Green Version]
- Min, H.S.; Ryu, D.; Kang, S.J.; Lee, J.G.; Yoo, J.H.; Cho, H.; Kang, D.Y.; Lee, P.H.; Ahn, J.M.; Park, D.W.; et al. Prediction of Coronary Stent Underexpansion by Pre-Procedural Intravascular Ultrasound-Based Deep Learning. JACC Cardiovasc. Interv. 2021, 14, 1021–1029. [Google Scholar] [CrossRef]
- Nishi, T.; Yamashita, R.; Imura, S.; Tateishi, K.; Kitahara, H.; Kobayashi, Y.; Yock, P.G.; Fitzgerald, P.J.; Honda, Y. Deep learning-based intravascular ultrasound segmentation for the assessment of coronary artery disease. Int. J. Cardiol. 2021, 333, 55–59. [Google Scholar] [CrossRef] [PubMed]
- Brown, A.J.; Teng, Z.; Calvert, P.A.; Rajani, N.K.; Hennessy, O.; Nerlekar, N.; Obaid, D.R.; Costopoulos, C.; Huang, Y.; Hoole, S.P.; et al. Plaque Structural Stress Estimations Improve Prediction of Future Major Adverse Cardiovascular Events After Intracoronary Imaging. Circ. Cardiovasc. Imaging 2016, 9, e004172. [Google Scholar] [CrossRef] [Green Version]
- Xie, Z.; Dong, N.; Sun, R.; Liu, X.; Gu, X.; Sun, Y.; Du, H.; Dai, J.; Liu, Y.; Hou, J.; et al. Relation between baseline plaque features and subsequent coronary artery remodeling determined by optical coherence tomography and intravascular ultrasound. Oncotarget 2017, 8, 4234–4244. [Google Scholar] [CrossRef] [Green Version]
- Stone, P.H.; Saito, S.; Takahashi, S.; Makita, Y.; Nakamura, S.; Kawasaki, T.; Takahashi, A.; Katsuki, T.; Nakamura, S.; Namiki, A.; et al. Prediction of progression of coronary artery disease and clinical outcomes using vascular profiling of endothelial shear stress and arterial plaque characteristics: The PREDICTION Study. Circulation 2012, 126, 172–181. [Google Scholar] [CrossRef]
- Calvert, P.A.; Obaid, D.R.; O’Sullivan, M.; Shapiro, L.M.; McNab, D.; Densem, C.G.; Schofield, P.M.; Braganza, D.; Clarke, S.C.; Ray, K.K.; et al. Association between IVUS findings and adverse outcomes in patients with coronary artery disease: The VIVA (VH-IVUS in Vulnerable Atherosclerosis) Study. JACC Cardiovasc. Imaging 2011, 4, 894–901. [Google Scholar] [CrossRef] [Green Version]
- Zhang, L.; Wahle, A.; Chen, Z.; Lopez, J.J.; Kovarnik, T.; Sonka, M. Predicting Locations of High-Risk Plaques in Coronary Arteries in Patients Receiving Statin Therapy. IEEE Trans. Med. Imaging 2018, 37, 151–161. [Google Scholar] [CrossRef]
- Farooq, V.; Brugaletta, S.; Serruys, P.W. The SYNTAX score and SYNTAX-based clinical risk scores. Semin Thorac Cardiovasc Surg 2011, 23, 99–105. [Google Scholar] [CrossRef] [PubMed]
- Singh, M.; Rihal, C.S.; Lennon, R.J.; Spertus, J.; Rumsfeld, J.S.; Holmes, D.R., Jr. Bedside estimation of risk from percutaneous coronary intervention: The new Mayo Clinic risk scores. Mayo Clin. Proc. 2007, 82, 701–708. [Google Scholar] [CrossRef]
- Chowdhary, S.; Ivanov, J.; Mackie, K.; Seidelin, P.H.; Dzavík, V. The Toronto score for in-hospital mortality after percutaneous coronary interventions. Am. Heart J. 2009, 157, 156–163. [Google Scholar] [CrossRef] [PubMed]
- Hannan, E.L.; Farrell, L.S.; Walford, G.; Jacobs, A.K.; Berger, P.B.; Holmes, D.R., Jr.; Stamato, N.J.; Sharma, S.; King, S.B., 3rd. The New York State risk score for predicting in-hospital/30-day mortality following percutaneous coronary intervention. JACC Cardiovasc. Interv. 2013, 6, 614–622. [Google Scholar] [CrossRef] [PubMed] [Green Version]
- MacKenzie, T.A.; Malenka, D.J.; Olmstead, E.M.; Piper, W.D.; Langner, C.; Ross, C.S.; O’Connor, G.T. Prediction of survival after coronary revascularization: Modeling short-term, mid-term, and long-term survival. Ann. Thorac. Surg. 2009, 87, 463–472. [Google Scholar] [CrossRef] [PubMed]
- O’Connor, G.T.; Malenka, D.J.; Quinton, H.; Robb, J.F.; Kellett, M.A., Jr.; Shubrooks, S.; Bradley, W.A.; Hearne, M.J.; Watkins, M.W.; Wennberg, D.E.; et al. Multivariate prediction of in-hospital mortality after percutaneous coronary interventions in 1994-1996. Northern New England Cardiovascular Disease Study Group. J. Am. Coll. Cardiol. 1999, 34, 681–691. [Google Scholar] [CrossRef] [Green Version]
- Rihal, C.S.; Grill, D.E.; Bell, M.R.; Berger, P.B.; Garratt, K.N.; Holmes, D.R., Jr. Prediction of death after percutaneous coronary interventional procedures. Am. Heart J. 2000, 139, 1032–1038. [Google Scholar] [CrossRef]
- Wu, C.; Hannan, E.L.; Walford, G.; Ambrose, J.A.; Holmes, D.R., Jr.; King, S.B., 3rd; Clark, L.T.; Katz, S.; Sharma, S.; Jones, R.H. A risk score to predict in-hospital mortality for percutaneous coronary interventions. J. Am. Coll. Cardiol. 2006, 47, 654–660. [Google Scholar] [CrossRef] [Green Version]
- Fanaroff, A.C.; Zakroysky, P.; Dai, D.; Wojdyla, D.; Sherwood, M.W.; Roe, M.T.; Wang, T.Y.; Peterson, E.D.; Gurm, H.S.; Cohen, M.G.; et al. Outcomes of PCI in Relation to Procedural Characteristics and Operator Volumes in the United States. J. Am. Coll. Cardiol. 2017, 69, 2913–2924. [Google Scholar] [CrossRef]
- Iverson, A.; Stanberry, L.I.; Tajti, P.; Garberich, R.; Antos, A.; Burke, M.N.; Chavez, I.; Gössl, M.; Henry, T.D.; Lips, D.; et al. Prevalence, Trends, and Outcomes of Higher-Risk Percutaneous Coronary Interventions Among Patients without Acute Coronary Syndromes. Cardiovasc. Revasc. Med. 2019, 20, 289–292. [Google Scholar] [CrossRef]
- Singh, M.; Lennon, R.J.; Gulati, R.; Holmes, D.R. Risk scores for 30-day mortality after percutaneous coronary intervention: New insights into causes and risk of death. Mayo Clin. Proc. 2014, 89, 631–637. [Google Scholar] [CrossRef] [PubMed]
- Zack, C.J.; Senecal, C.; Kinar, Y.; Metzger, Y.; Bar-Sinai, Y.; Widmer, R.J.; Lennon, R.; Singh, M.; Bell, M.R.; Lerman, A.; et al. Leveraging Machine Learning Techniques to Forecast Patient Prognosis After Percutaneous Coronary Intervention. JACC Cardiovasc. Interv. 2019, 12, 1304–1311. [Google Scholar] [CrossRef] [PubMed]
- Al’Aref, S.J.; Singh, G.; van Rosendael, A.R.; Kolli, K.K.; Ma, X.; Maliakal, G.; Pandey, M.; Lee, B.C.; Wang, J.; Xu, Z.; et al. Determinants of In-Hospital Mortality after Percutaneous Coronary Intervention: A Machine Learning Approach. J. Am. Heart Assoc. 2019, 8, e011160. [Google Scholar] [CrossRef] [PubMed] [Green Version]
- Rao, S.V.; Kaul, P.R.; Liao, L.; Armstrong, P.W.; Ohman, E.M.; Granger, C.B.; Califf, R.M.; Harrington, R.A.; Eisenstein, E.L.; Mark, D.B. Association between bleeding, blood transfusion, and costs among patients with non-ST-segment elevation acute coronary syndromes. Am. Heart J. 2008, 155, 369–374. [Google Scholar] [CrossRef] [PubMed]
- Kinnaird, T.D.; Stabile, E.; Mintz, G.S.; Lee, C.W.; Canos, D.A.; Gevorkian, N.; Pinnow, E.E.; Kent, K.M.; Pichard, A.D.; Satler, L.F.; et al. Incidence, predictors, and prognostic implications of bleeding and blood transfusion following percutaneous coronary interventions. Am. J. Cardiol. 2003, 92, 930–935. [Google Scholar] [CrossRef]
- Rao, S.V.; McCoy, L.A.; Spertus, J.A.; Krone, R.J.; Singh, M.; Fitzgerald, S.; Peterson, E.D. An Updated Bleeding Model to Predict the Risk of Post-Procedure Bleeding Among Patients Undergoing Percutaneous Coronary Intervention: A Report Using an Expanded Bleeding Definition From the National Cardiovascular Data Registry CathPCI Registry. JACC Cardiovasc. Interv. 2013, 6, 897–904. [Google Scholar] [CrossRef] [Green Version]
- Mortazavi, B.J.; Bucholz, E.M.; Desai, N.R.; Huang, C.; Curtis, J.P.; Masoudi, F.A.; Shaw, R.E.; Negahban, S.N.; Krumholz, H.M. Comparison of Machine Learning Methods With National Cardiovascular Data Registry Models for Prediction of Risk of Bleeding After Percutaneous Coronary Intervention. JAMA Netw. Open 2019, 2, e196835. [Google Scholar] [CrossRef]
- Kim, M.S.; Dean, L.S. In-stent restenosis. Cardiovasc. Ther. 2011, 29, 190–198. [Google Scholar] [CrossRef]
- Cassese, S.; Byrne, R.A.; Tada, T.; Pinieck, S.; Joner, M.; Ibrahim, T.; King, L.A.; Fusaro, M.; Laugwitz, K.L.; Kastrati, A. Incidence and predictors of restenosis after coronary stenting in 10 004 patients with surveillance angiography. Heart 2014, 100, 153–159. [Google Scholar] [CrossRef]
- Singh, M.; Gersh, B.J.; McClelland, R.L.; Ho, K.K.L.; Willerson, J.T.; Penny, W.F.; Holmes, D.R. Clinical and Angiographic Predictors of Restenosis After Percutaneous Coronary Intervention. Circulation 2004, 109, 2727–2731. [Google Scholar] [CrossRef]
- Stolker, J.M.; Kennedy, K.F.; Lindsey, J.B.; Marso, S.P.; Pencina, M.J.; Cutlip, D.E.; Mauri, L.; Kleiman, N.S.; Cohen, D.J. Predicting Restenosis of Drug-Eluting Stents Placed in Real-World Clinical Practice. Circ. Cardiovasc. Interv. 2010, 3, 327–334. [Google Scholar] [CrossRef] [PubMed] [Green Version]
- Sampedro-Gomez, J.; Dorado-Diaz, P.I.; Vicente-Palacios, V.; Sanchez-Puente, A.; Jimenez-Navarro, M.; San Roman, J.A.; Galindo-Villardon, P.; Sanchez, P.L.; Fernandez-Aviles, F. Machine Learning to Predict Stent Restenosis Based on Daily Demographic, Clinical, and Angiographic Characteristics. Can. J. Cardiol. 2020, 36, 1624–1632. [Google Scholar] [CrossRef] [PubMed]
- Steele, A.J.; Denaxas, S.C.; Shah, A.D.; Hemingway, H.; Luscombe, N.M. Machine learning models in electronic health records can outperform conventional survival models for predicting patient mortality in coronary artery disease. PLoS ONE 2018, 13, e0202344. [Google Scholar] [CrossRef] [Green Version]
- Bertsimas, D.; Orfanoudaki, A.; Weiner, R.B. Personalized treatment for coronary artery disease patients: A machine learning approach. Health Care Manag. Sci. 2020, 23, 482–506. [Google Scholar] [CrossRef] [PubMed]
- Farhadian, M.; Dehdar Karsidani, S.; Mozayanimonfared, A.; Mahjub, H. Risk factors associated with major adverse cardiac and cerebrovascular events following percutaneous coronary intervention: A 10-year follow-up comparing random survival forest and Cox proportional-hazards model. BMC Cardiovasc. Disord. 2021, 21, 38. [Google Scholar] [CrossRef]
- Krittanawong, C.; Zhang, H.; Wang, Z.; Aydar, M.; Kitai, T. Artificial Intelligence in Precision Cardiovascular Medicine. J. Am. Coll. Cardiol. 2017, 69, 2657–2664. [Google Scholar] [CrossRef]
- Taylor, A.J.; Bindeman, J.; Feuerstein, I.; Cao, F.; Brazaitis, M.; O’Malley, P.G. Coronary calcium independently predicts incident premature coronary heart disease over measured cardiovascular risk factors: Mean three-year outcomes in the Prospective Army Coronary Calcium (PACC) project. J. Am. Coll. Cardiol. 2005, 46, 807–814. [Google Scholar] [CrossRef] [Green Version]
- Detrano, R.; Guerci, A.D.; Carr, J.J.; Bild, D.E.; Burke, G.; Folsom, A.R.; Liu, K.; Shea, S.; Szklo, M.; Bluemke, D.A.; et al. Coronary Calcium as a Predictor of Coronary Events in Four Racial or Ethnic Groups. N. Engl. J. Med. 2008, 358, 1336–1345. [Google Scholar] [CrossRef] [Green Version]
- Rozanski, A.; Gransar, H.; Shaw, L.J.; Kim, J.; Miranda-Peats, L.; Wong, N.D.; Rana, J.S.; Orakzai, R.; Hayes, S.W.; Friedman, J.D.; et al. Impact of coronary artery calcium scanning on coronary risk factors and downstream testing the EISNER (Early Identification of Subclinical Atherosclerosis by Noninvasive Imaging Research) prospective randomized trial. J. Am. Coll. Cardiol. 2011, 57, 1622–1632. [Google Scholar] [CrossRef] [Green Version]
- Hwang, I.-C.; Park, H.E.; Choi, S.-Y. Epicardial Adipose Tissue Contributes to the Development of Non-Calcified Coronary Plaque: A 5-Year Computed Tomography Follow-up Study. J. Atheroscler. Thromb. 2017, 24, 262–274. [Google Scholar] [CrossRef] [Green Version]
- Nakanishi, R.; Rajani, R.; Cheng, V.Y.; Gransar, H.; Nakazato, R.; Shmilovich, H.; Otaki, Y.; Hayes, S.W.; Thomson, L.E.; Friedman, J.D.; et al. Increase in epicardial fat volume is associated with greater coronary artery calcification progression in subjects at intermediate risk by coronary calcium score: A serial study using non-contrast cardiac CT. Atherosclerosis 2011, 218, 363–368. [Google Scholar] [CrossRef] [PubMed]
- Berman, D.S.; Arnson, Y.; Rozanski, A. Coronary Artery Calcium Scanning: The Agatston Score and Beyond. JACC Cardiovasc. Imaging 2016, 9, 1417–1419. [Google Scholar] [CrossRef] [PubMed]
- Chao, H.; Shan, H.; Homayounieh, F.; Singh, R.; Khera, R.D.; Guo, H.; Su, T.; Wang, G.; Kalra, M.K.; Yan, P. Deep learning predicts cardiovascular disease risks from lung cancer screening low dose computed tomography. Nat. Commun. 2021, 12, 2963. [Google Scholar] [CrossRef] [PubMed]
- Wolterink, J.; Leiner, T.; Takx, R.A.; Viergever, M.; Išgum, I. An Automatic Machine Learning System for Coronary Calcium Scoring in Clinical Non-Contrast Enhanced, ECG-Triggered Cardiac CT; SPIE: San Diego, CA, USA, 2014; Volume 9035. [Google Scholar]
- Sandstedt, M.; Henriksson, L.; Janzon, M.; Nyberg, G.; Engvall, J.; De Geer, J.; Alfredsson, J.; Persson, A. Evaluation of an AI-based, automatic coronary artery calcium scoring software. Eur. Radiol. 2020, 30, 1671–1678. [Google Scholar] [CrossRef] [PubMed] [Green Version]
- Commandeur, F.; Slomka, P.J.; Goeller, M.; Chen, X.; Cadet, S.; Razipour, A.; McElhinney, P.; Gransar, H.; Cantu, S.; Miller, R.J.H.; et al. Machine learning to predict the long-term risk of myocardial infarction and cardiac death based on clinical risk, coronary calcium, and epicardial adipose tissue: A prospective study. Cardiovasc. Res. 2020, 116, 2216–2225. [Google Scholar] [CrossRef] [Green Version]
- Eisenberg, E.; McElhinney, P.A.; Commandeur, F.; Chen, X.; Cadet, S.; Goeller, M.; Razipour, A.; Gransar, H.; Cantu, S.; Miller, R.J.H.; et al. Deep Learning-Based Quantification of Epicardial Adipose Tissue Volume and Attenuation Predicts Major Adverse Cardiovascular Events in Asymptomatic Subjects. Circ. Cardiovasc. Imaging 2020, 13, e009829. [Google Scholar] [CrossRef]
- Han, D.; Kolli, K.K.; Gransar, H.; Lee, J.H.; Choi, S.Y.; Chun, E.J.; Han, H.W.; Park, S.H.; Sung, J.; Jung, H.O.; et al. Machine learning based risk prediction model for asymptomatic individuals who underwent coronary artery calcium score: Comparison with traditional risk prediction approaches. J. Cardiovasc. Comput. Tomogr. 2020, 14, 168–176. [Google Scholar] [CrossRef]
- Tamarappoo, B.K.; Lin, A.; Commandeur, F.; McElhinney, P.A.; Cadet, S.; Goeller, M.; Razipour, A.; Chen, X.; Gransar, H.; Cantu, S.; et al. Machine learning integration of circulating and imaging biomarkers for explainable patient-specific prediction of cardiac events: A prospective study. Atherosclerosis 2021, 318, 76–82. [Google Scholar] [CrossRef]
- Nakanishi, R.; Slomka, P.J.; Rios, R.; Betancur, J.; Blaha, M.J.; Nasir, K.; Miedema, M.D.; Rumberger, J.A.; Gransar, H.; Shaw, L.J.; et al. Machine Learning Adds to Clinical and CAC Assessments in Predicting 10-Year CHD and CVD Deaths. JACC Cardiovasc. Imaging 2021, 14, 615–625. [Google Scholar] [CrossRef]
- Min, J.K.; Feignoux, J.; Treutenaere, J.; Laperche, T.; Sablayrolles, J. The prognostic value of multidetector coronary CT angiography for the prediction of major adverse cardiovascular events: A multicenter observational cohort study. Int. J. Cardiovasc. Imaging 2010, 26, 721–728. [Google Scholar] [CrossRef]
- Hadamitzky, M.; Achenbach, S.; Al-Mallah, M.; Berman, D.; Budoff, M.; Cademartiri, F.; Callister, T.; Chang, H.J.; Cheng, V.; Chinnaiyan, K.; et al. Optimized prognostic score for coronary computed tomographic angiography: Results from the CONFIRM registry (COronary CT Angiography EvaluatioN For Clinical Outcomes: An InteRnational Multicenter Registry). J. Am. Coll. Cardiol. 2013, 62, 468–476. [Google Scholar] [CrossRef] [PubMed] [Green Version]
- Min, J.K.; Shaw, L.J.; Devereux, R.B.; Okin, P.M.; Weinsaft, J.W.; Russo, D.J.; Lippolis, N.J.; Berman, D.S.; Callister, T.Q. Prognostic Value of Multidetector Coronary Computed Tomographic Angiography for Prediction of All-Cause Mortality. J. Am. Coll. Cardiol. 2007, 50, 1161–1170. [Google Scholar] [CrossRef] [PubMed] [Green Version]
- Johnson, K.M.; Dowe, D.A. Prognostic Implications of Coronary CT Angiography: 12-Year Follow-Up of 6892 Patients. AJR Am. J. Roentgenol. 2020, 215, 818–827. [Google Scholar] [CrossRef] [PubMed]
- Motwani, M.; Dey, D.; Berman, D.S.; Germano, G.; Achenbach, S.; Al-Mallah, M.H.; Andreini, D.; Budoff, M.J.; Cademartiri, F.; Callister, T.Q.; et al. Machine learning for prediction of all-cause mortality in patients with suspected coronary artery disease: A 5-year multicentre prospective registry analysis. Eur. Heart J. 2016, 38, 500–507. [Google Scholar] [CrossRef] [PubMed]
- Tesche, C.; Bauer, M.J.; Baquet, M.; Hedels, B.; Straube, F.; Hartl, S.; Gray, H.N.; Jochheim, D.; Aschauer, T.; Rogowski, S.; et al. Improved long-term prognostic value of coronary CT angiography-derived plaque measures and clinical parameters on adverse cardiac outcome using machine learning. Eur. Radiol. 2021, 31, 486–493. [Google Scholar] [CrossRef]
- van Rosendael, A.R.; Maliakal, G.; Kolli, K.K.; Beecy, A.; Al’Aref, S.J.; Dwivedi, A.; Singh, G.; Panday, M.; Kumar, A.; Ma, X.; et al. Maximization of the usage of coronary CTA derived plaque information using a machine learning based algorithm to improve risk stratification; insights from the CONFIRM registry. J. Cardiovasc. Comput. Tomogr. 2018, 12, 204–209. [Google Scholar] [CrossRef]
- Hoshino, M.; Zhang, J.; Sugiyama, T.; Yang, S.; Kanaji, Y.; Hamaya, R.; Yamaguchi, M.; Hada, M.; Misawa, T.; Usui, E.; et al. Prognostic value of pericoronary inflammation and unsupervised machine-learning-defined phenotypic clustering of CT angiographic findings. Int. J. Cardiol. 2021, 333, 226–232. [Google Scholar] [CrossRef]
- Johnson, K.M.; Johnson, H.E.; Zhao, Y.; Dowe, D.A.; Staib, L.H. Scoring of Coronary Artery Disease Characteristics on Coronary CT Angiograms by Using Machine Learning. Radiology 2019, 292, 354–362. [Google Scholar] [CrossRef]
- Antonopoulos, A.S.; Sanna, F.; Sabharwal, N.; Thomas, S.; Oikonomou, E.K.; Herdman, L.; Margaritis, M.; Shirodaria, C.; Kampoli, A.M.; Akoumianakis, I.; et al. Detecting human coronary inflammation by imaging perivascular fat. Sci. Transl. Med. 2017, 9, eaal2658. [Google Scholar] [CrossRef] [Green Version]
- Oikonomou, E.K.; Marwan, M.; Desai, M.Y.; Mancio, J.; Alashi, A.; Hutt Centeno, E.; Thomas, S.; Herdman, L.; Kotanidis, C.P.; Thomas, K.E.; et al. Non-invasive detection of coronary inflammation using computed tomography and prediction of residual cardiovascular risk (the CRISP CT study): A post-hoc analysis of prospective outcome data. Lancet 2018, 392, 929–939. [Google Scholar] [CrossRef] [Green Version]
- Oikonomou Evangelos, K.; Desai Milind, Y.; Marwan, M.; Kotanidis Christos, P.; Antonopoulos Alexios, S.; Schottlander, D.; Channon Keith, M.; Neubauer, S.; Achenbach, S.; Antoniades, C. Perivascular Fat Attenuation Index Stratifies Cardiac Risk Associated with High-Risk Plaques in the CRISP-CT Study. J. Am. Coll. Cardiol. 2020, 76, 755–757. [Google Scholar] [CrossRef] [PubMed]
- Oikonomou, E.K.; Williams, M.C.; Kotanidis, C.P.; Desai, M.Y.; Marwan, M.; Antonopoulos, A.S.; Thomas, K.E.; Thomas, S.; Akoumianakis, I.; Fan, L.M.; et al. A novel machine learning-derived radiotranscriptomic signature of perivascular fat improves cardiac risk prediction using coronary CT angiography. Eur. Heart J. 2019, 40, 3529–3543. [Google Scholar] [CrossRef] [PubMed]
- Cabitza, F.; Rasoini, R.; Gensini, G.F. Unintended Consequences of Machine Learning in Medicine. JAMA 2017, 318, 517–518. [Google Scholar] [CrossRef] [PubMed]
- Petch, J.; Di, S.; Nelson, W. Opening the black box: The promise and limitations of explainable machine learning in cardiology. Can. J. Cardiol. 2021. [Google Scholar] [CrossRef]
- Lundberg, S.M.; Lee, S.-I. A unified approach to interpreting model predictions. In Proceedings of the 31st International Conference on Neural Information Processing Systems, Long Beach, CA, USA, 4–9 December 2017; pp. 4768–4777. [Google Scholar]
- Vokinger, K.N.; Feuerriegel, S.; Kesselheim, A.S. Mitigating bias in machine learning for medicine. Commun. Med. 2021, 1, 25. [Google Scholar] [CrossRef]
- Tat, E.; Bhatt, D.L.; Rabbat, M.G. Addressing bias: Artificial intelligence in cardiovascular medicine. Lancet Digit Health 2020, 2, e635–e636. [Google Scholar] [CrossRef]
- Luo, Y. Evaluating the state of the art in missing data imputation for clinical data. Brief. Bioinform. 2021, 23, bbab489. [Google Scholar] [CrossRef]
- Dietterich, T. Overfitting and undercomputing in machine learning. ACM Comput. Surv. (CSUR) 1995, 27, 326–327. [Google Scholar] [CrossRef]
- Murdoch, B. Privacy and artificial intelligence: Challenges for protecting health information in a new era. BMC Med. Ethics 2021, 22, 122. [Google Scholar] [CrossRef]


| Study | Center/Sample Size | ML Technology | Brief Description and Outcomes | Result | Limitations |
|---|---|---|---|---|---|
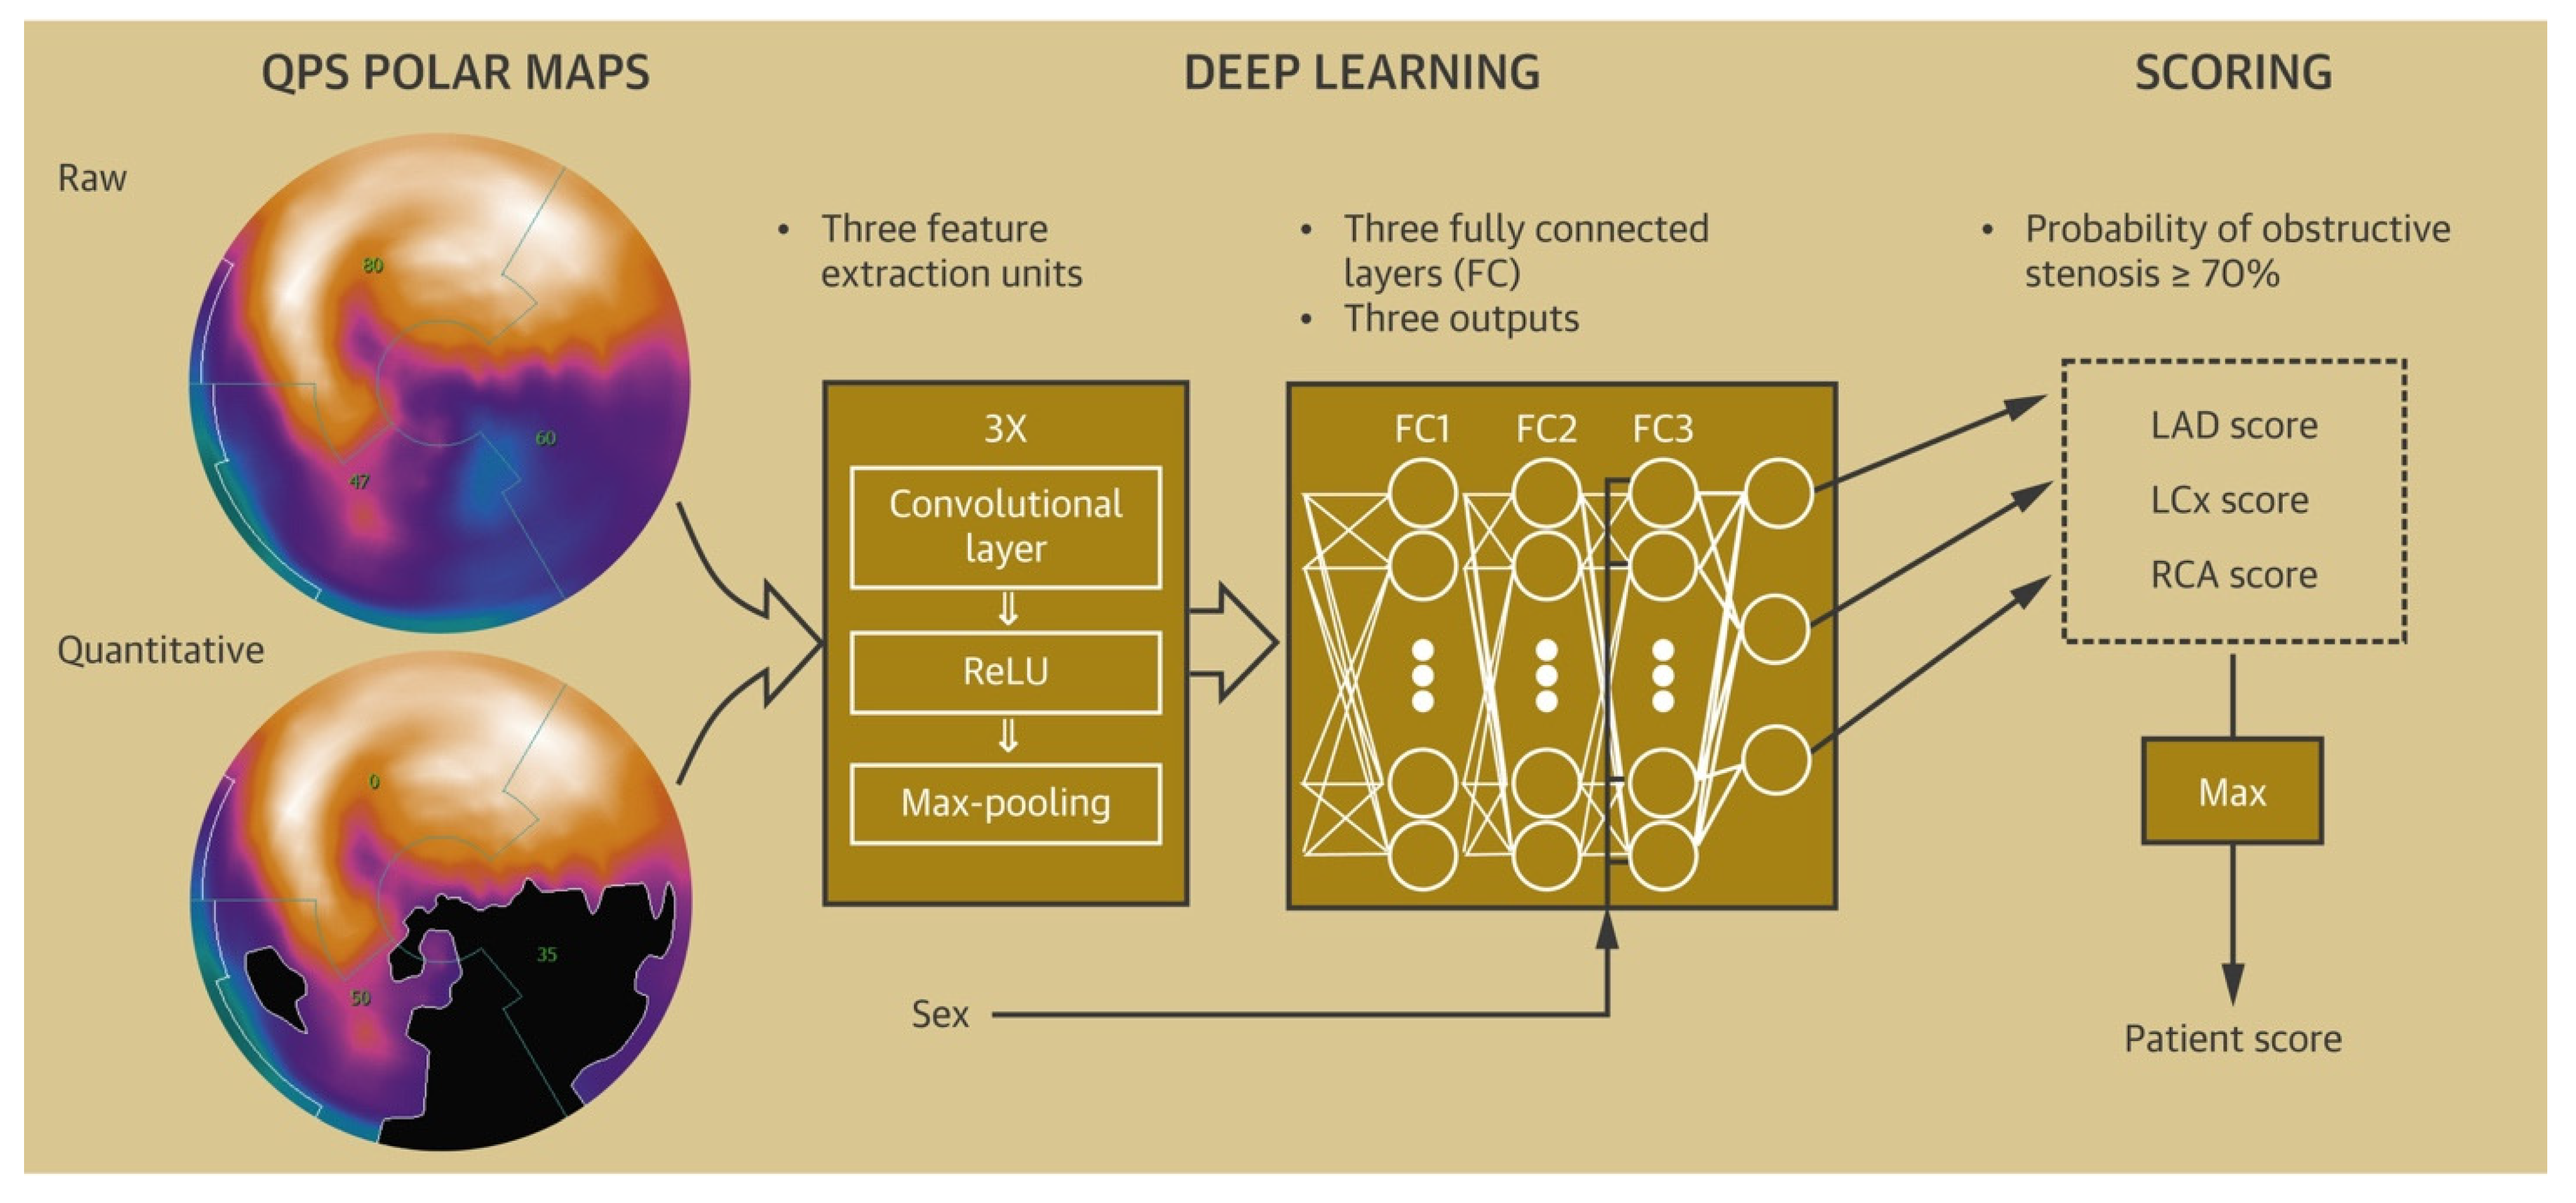
| Guner et al. [41] 2010 | Retrospective Single-center study 243 patients | Artificial neural networks | ML model trained from image data from stress and difference (devised from rest and stress maps) polar maps. Outcome: ML model vs. expert interpretation in the prediction of obstructive (>70% stenosis) CAD | AUC 0.74 and 0.84 for ML and expert read, no statistical difference found between ML-trained model and expert read. |
|
| Arsanjani et al. [44] 2013 | Retrospective Single-center study 1181 patients | Boosted ensemble | ML model using quantitative variables (TPD, stress/rest perfusion change, TID) and clinical variables (age, sex, and post-ECG probability) created. Outcome: ML vs. visual analysis and TPD in prediction of obstructive CAD. | AUC: ML (quantitative + clinical − 0.94 ) > ML (quantitative, 0.90) > combined supine/prone TPD − 0.88. Also, better than experts (0.89 and 0.85 for two different experts). |
|
| Arsanjani et al. [39] 2013 | Retrospective Single-center study 957 patients with no history of CAD. | Support vector machines | ML model using quantitative and functional variables derived from SPECT. Outcome: ML model vs. quantitative and visual analysis in prediction of obstructive CAD or LAD stenosis > 50%. | AUC: ML (0.92) > TPD (0.90) > Expert analysis (0.88 and 0.87 for two different experts) |
|
| Betancur et al. [43] 2018 | Retrospective Multicenter study 1638 patients | Convolutional neural networks | DL model developed from single-view polar maps; trained and compared with TPD for prediction of CAD. Outcome: ML model vs. TPD for prediction of obstructive CAD. | DL > TPD on per patient (AUC 0.80 vs. 0.78) and per vessel level (AUC 0.76 vs. 0.73) for prediction of obstructive CAD, p < 0.01. |
|
| Betancur et al. [40] 2018 | Retrospective Multicenter study 1160 patients with no history of CAD | Convolutional neural networks | DL model developed to automatically combine upright and supine MPI polar maps. Outcome: ML model vs. TPD for prediction of obstructive CAD. | DL > TPD on per patient (AUC 0.81 vs. 0.78) and per vessel (AUC 0.77 vs. 0.73) for prediction of obstructive CAD, p < 0.001 |
|
| Rahmani et al. [42] 2019 | Retrospective Single-center study 93 patients | Artificial neural networks | ML model created using clinical, demographic, and polar-map data. Outcome: ML model vs. expert interpretation in prediction of obstructive CAD and abnormal angiographic results. | Accuracy for ML vs. visual interpretation for prediction of: Obstructive CAD:85.7% vs. 65.0% Abnormal angiographic results: 92.9 % vs. 81.7% |
|
| Study | Study Design/Sample Size | ML Model | Brief Description and Follow-Up | Results | Limitations |
|---|---|---|---|---|---|
| Eisenberg et al. [187] 2020 | Prospective single-center study, 2068 asymptomatic patients | Convolutional neural network | To check for impact of EAT volume and EAT attenuation computed via deep learning in prediction of MACE, defined as defined as MI, late (>180 days) revascularization and cardiac death. Follow up: >14 years | Increased EAT volume (HR: 1.35) and decreased EAT attenuation (HR 0.83) independently associated with MACE in addition to CACS (HR 1.25) and ASCVD score (HR 1.03), p < 0.01 for all. |
|
| Han et al. [188] 2020 | Retrospective multicenter study, 86,155 asymptomatic patients | Boosted ensemble | ML model with 35 clinical, 32 lab, and 3 CACS parameters (CACS, calcium volume, and calcium mass) in prediction of all-cause mortality Median follow up: 4.6 years | ML (0.82) > ASCVD score + CACS (0.74) > Framingham risk score + CACS (0.70)—reported as AUC in the test set. No statistical difference in the performance in the validation set. |
|
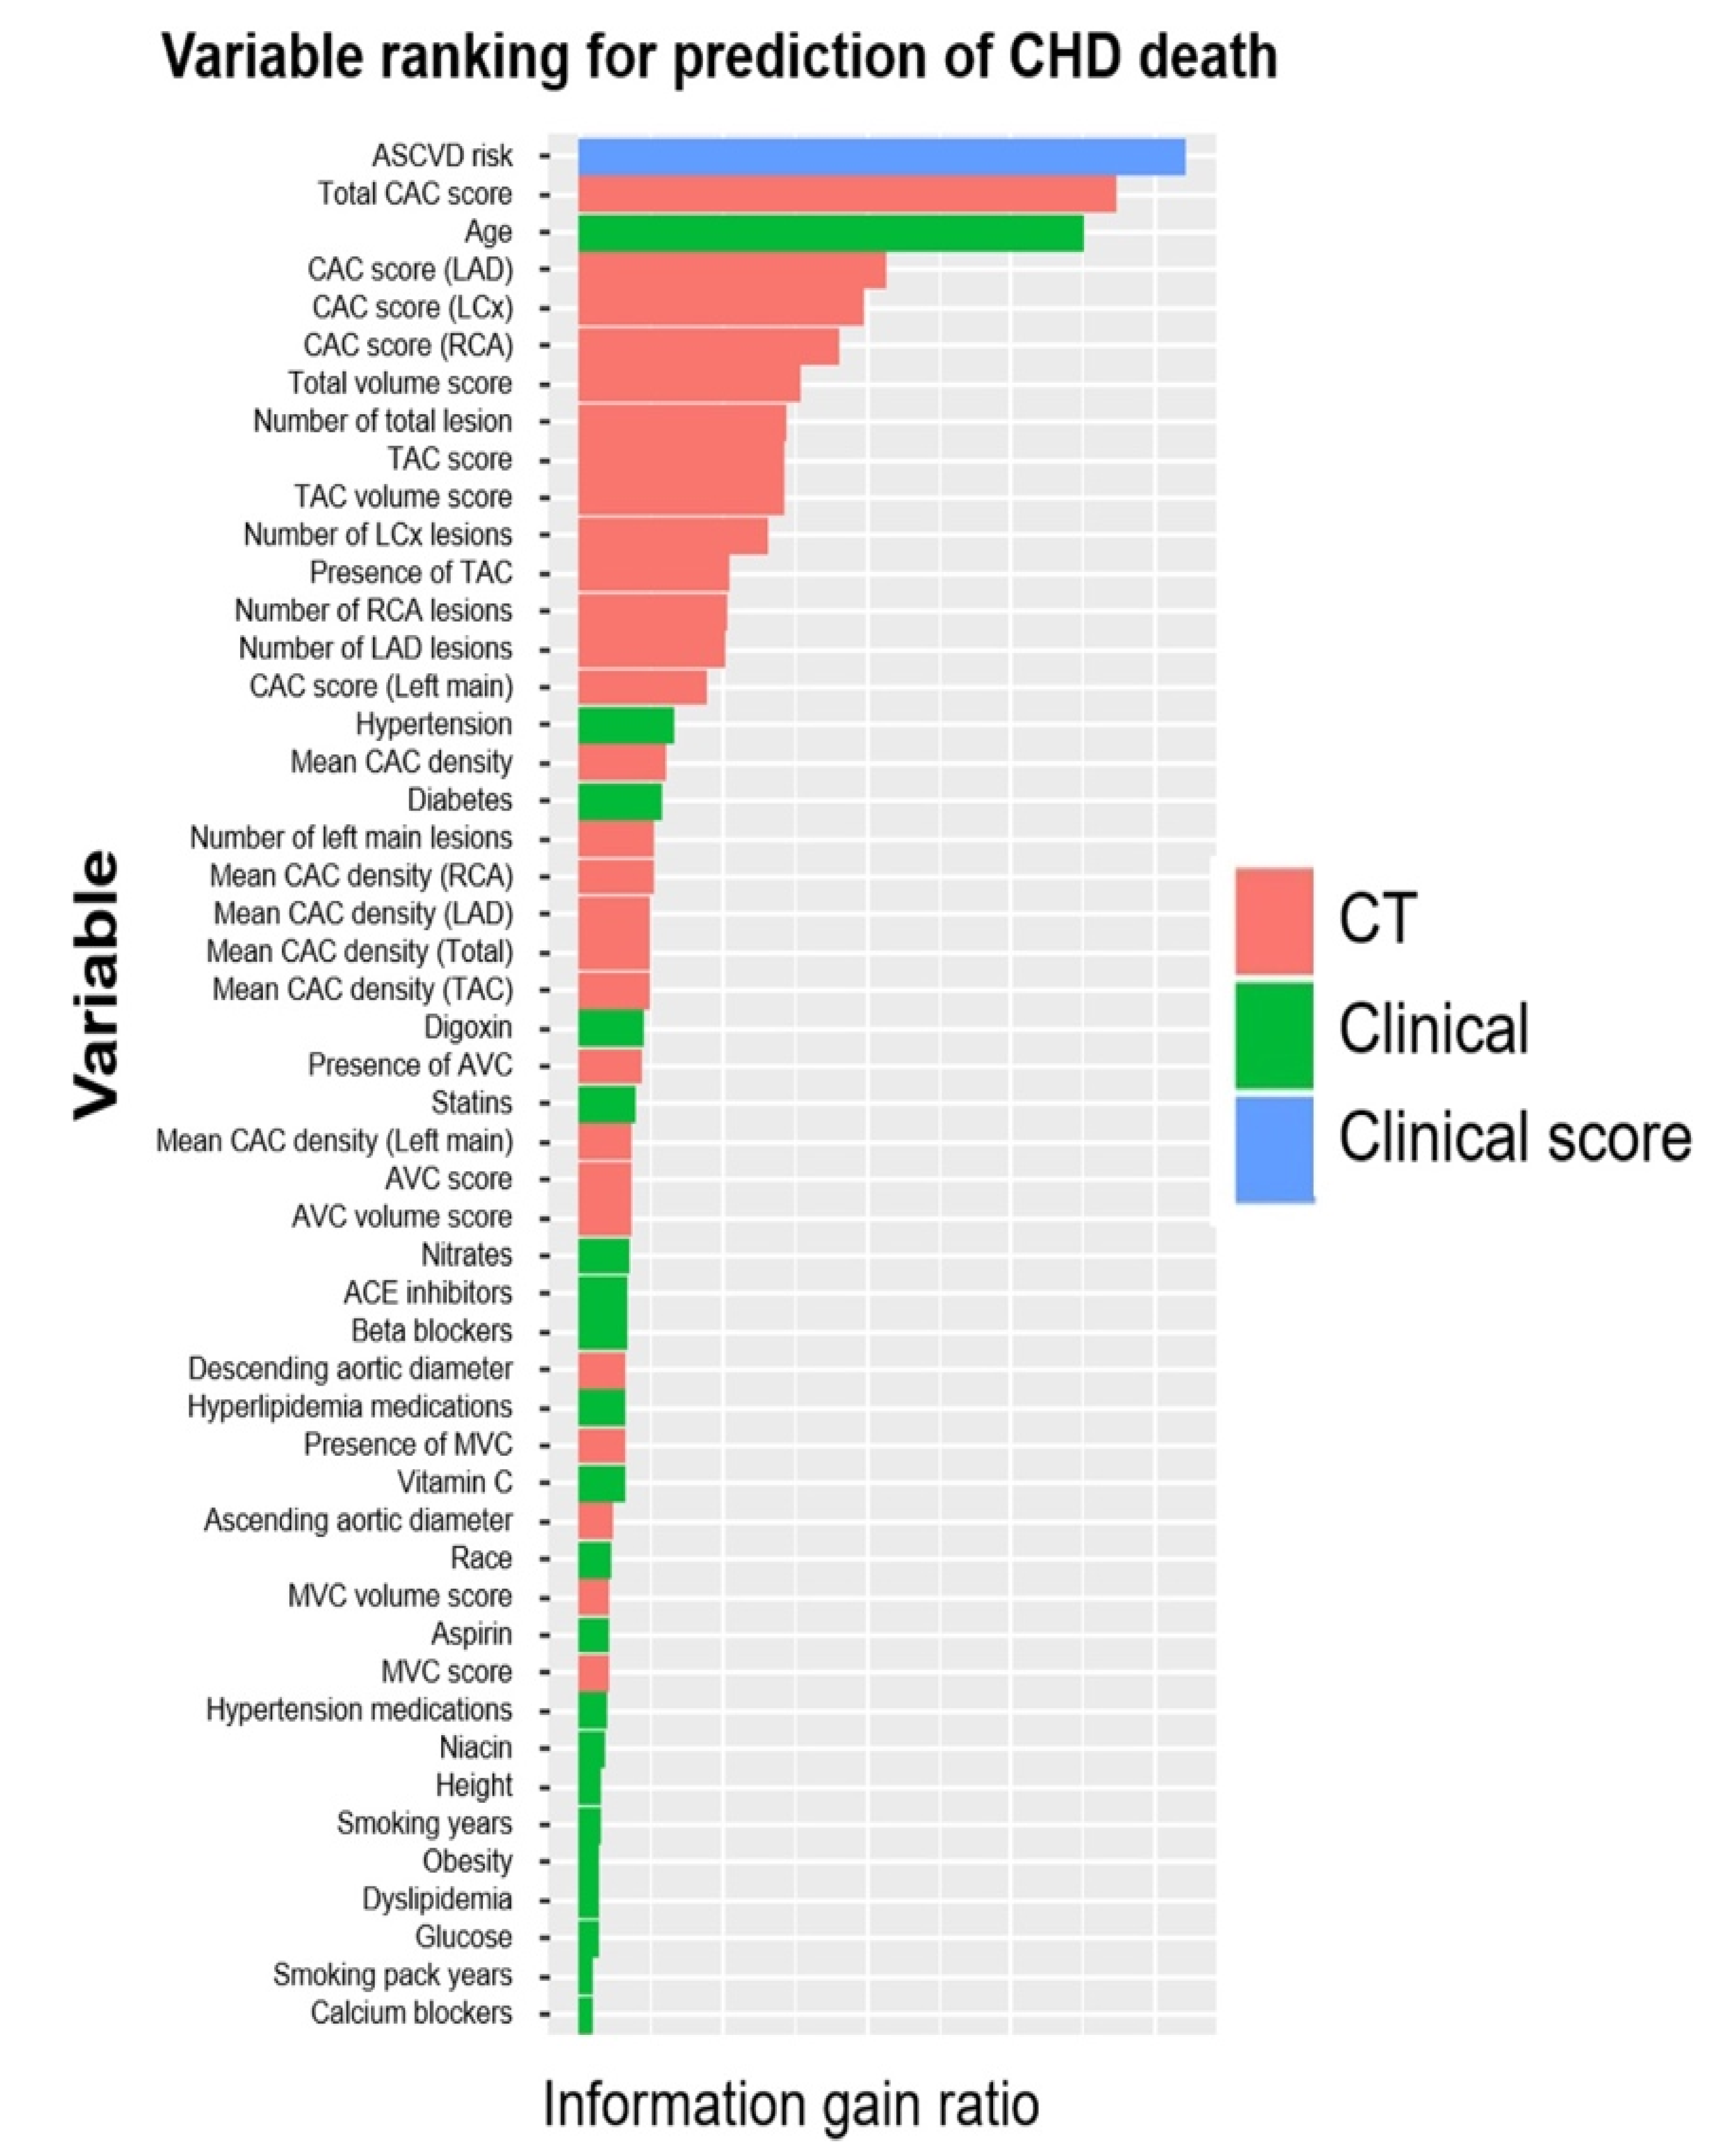
| Nakanishi et al. [190] 2021 | Multicenter observational study, 66,636 asymptomatic patients | Boosted ensemble (Logitboost) | ML model incorporating 46 clinical and 31 CT variables—CAC score, extra coronary scores (not including EAT) in prediction of cardiovascular (CHD + stroke + CHF + other circulatory diseases), and coronary heart disease (CHD) deaths Follow up: 10 years |
|
|
| Commandeur et al. [186] 2020 | Prospective single-center study, 1912 asymptomatic patients | Boosted ensemble (XgBoost) | ML model using clinical variables, plasma lipid panel measurements, CAC, aortic calcium, and automated EAT measures in prediction of MI and cardiac deaths. Median follow up: 14.5 years |
|
|
| Tamarappoo et al. [189] 2021 | Prospective single-center study, 1069 asymptomatic patients | Boosted ensemble (XgBoost) | ML model using 12 variables from ASCVD score, 5 CT parameters (including EAT volume and attenuation) and top 15 serum biomarkers) to predict cardiac events Mean follow up: 14.5 years | ML (0.81) > CAC (0.75) > ASCVD (0.74). |
|
| Study | Study Design/Sample Size | ML | Brief Description and Outcomes | Results | Limitations |
|---|---|---|---|---|---|
| Motwani et al. [195] 2016 | Multicenter prospective study, 10,030 patients with suspected CAD | Boosted ensemble (LogitBoost) | 25 clinical and 44 CCTA parameter used to create ML model Outcome: Prediction of 5-year ACM; compared against clinical risk scores and CCTA parameters. | AUC: ML (0.79) > Segment stenosis score (SSS) (0.64) and FRS (0.61); p < 0.001. |
|
| Hoshino et al. [198] 2016 | Multicenter retrospective study, 220 patients with intermediate LAD stenosis | Unsupervised hierarchical clustering | Two clusters (CS1 and CS2) using 42 variables created via ML. Outcome:
|
|
|
| Van Rosendael et al. [197] 2018 | Multicenter prospective study, 8844 patients with suspected CAD | Boosted ensemble | 35 variables (SS and plaque composition for 16 coronary segments and 3 additional variables) compared with traditional CT scores. Outcome: ML vs. traditional CT scores in predicting 5-year composite MI and death. | AUC for ML (0.77) > SSS (0.70) |
|
| Johnson et al. [194] 2019 | Single-center retrospective study, 6892 patients | K nearest neighbors | ML model (64 vessel-related features) vs. CAD-RADS. Outcome: Prediction of ACM, CAD-related deaths. Also, decision to start statin. |
|
|
| Johnson et al. [199] 2020 | Single-center retrospective study, 6892 patients | ML model developed via radiologist report. Outcome: Prediction of ACM and CAD-related mortality; compared against FRS. Also, decision to start statin. |
|
| |
| Tesche et al. [196] 2021 | Single-center retrospective study, 361 patients with suspected and confirmed CAD | Boosted ensemble (RUSBoost) | 28 clinical, CCTA scores and adverse plaque characteristics included. Outcome: 5-year MACE prediction; compared against FRS, CCTA scores and adverse plaque features. |
|
|
Publisher’s Note: MDPI stays neutral with regard to jurisdictional claims in published maps and institutional affiliations. |
© 2022 by the authors. Licensee MDPI, Basel, Switzerland. This article is an open access article distributed under the terms and conditions of the Creative Commons Attribution (CC BY) license (https://creativecommons.org/licenses/by/4.0/).
Share and Cite
Gautam, N.; Saluja, P.; Malkawi, A.; Rabbat, M.G.; Al-Mallah, M.H.; Pontone, G.; Zhang, Y.; Lee, B.C.; Al’Aref, S.J. Current and Future Applications of Artificial Intelligence in Coronary Artery Disease. Healthcare 2022, 10, 232. https://doi.org/10.3390/healthcare10020232
Gautam N, Saluja P, Malkawi A, Rabbat MG, Al-Mallah MH, Pontone G, Zhang Y, Lee BC, Al’Aref SJ. Current and Future Applications of Artificial Intelligence in Coronary Artery Disease. Healthcare. 2022; 10(2):232. https://doi.org/10.3390/healthcare10020232
Chicago/Turabian StyleGautam, Nitesh, Prachi Saluja, Abdallah Malkawi, Mark G. Rabbat, Mouaz H. Al-Mallah, Gianluca Pontone, Yiye Zhang, Benjamin C. Lee, and Subhi J. Al’Aref. 2022. "Current and Future Applications of Artificial Intelligence in Coronary Artery Disease" Healthcare 10, no. 2: 232. https://doi.org/10.3390/healthcare10020232