
Economics of Artificial Intelligence in Healthcare: Diagnosis vs. Treatment

 , , , , , , , , ,
  ,
,
Abstract
:1. Introduction
2. Background Literature
3. Search Strategy
4. An Overview of Artificial Intelligence Applications in Healthcare
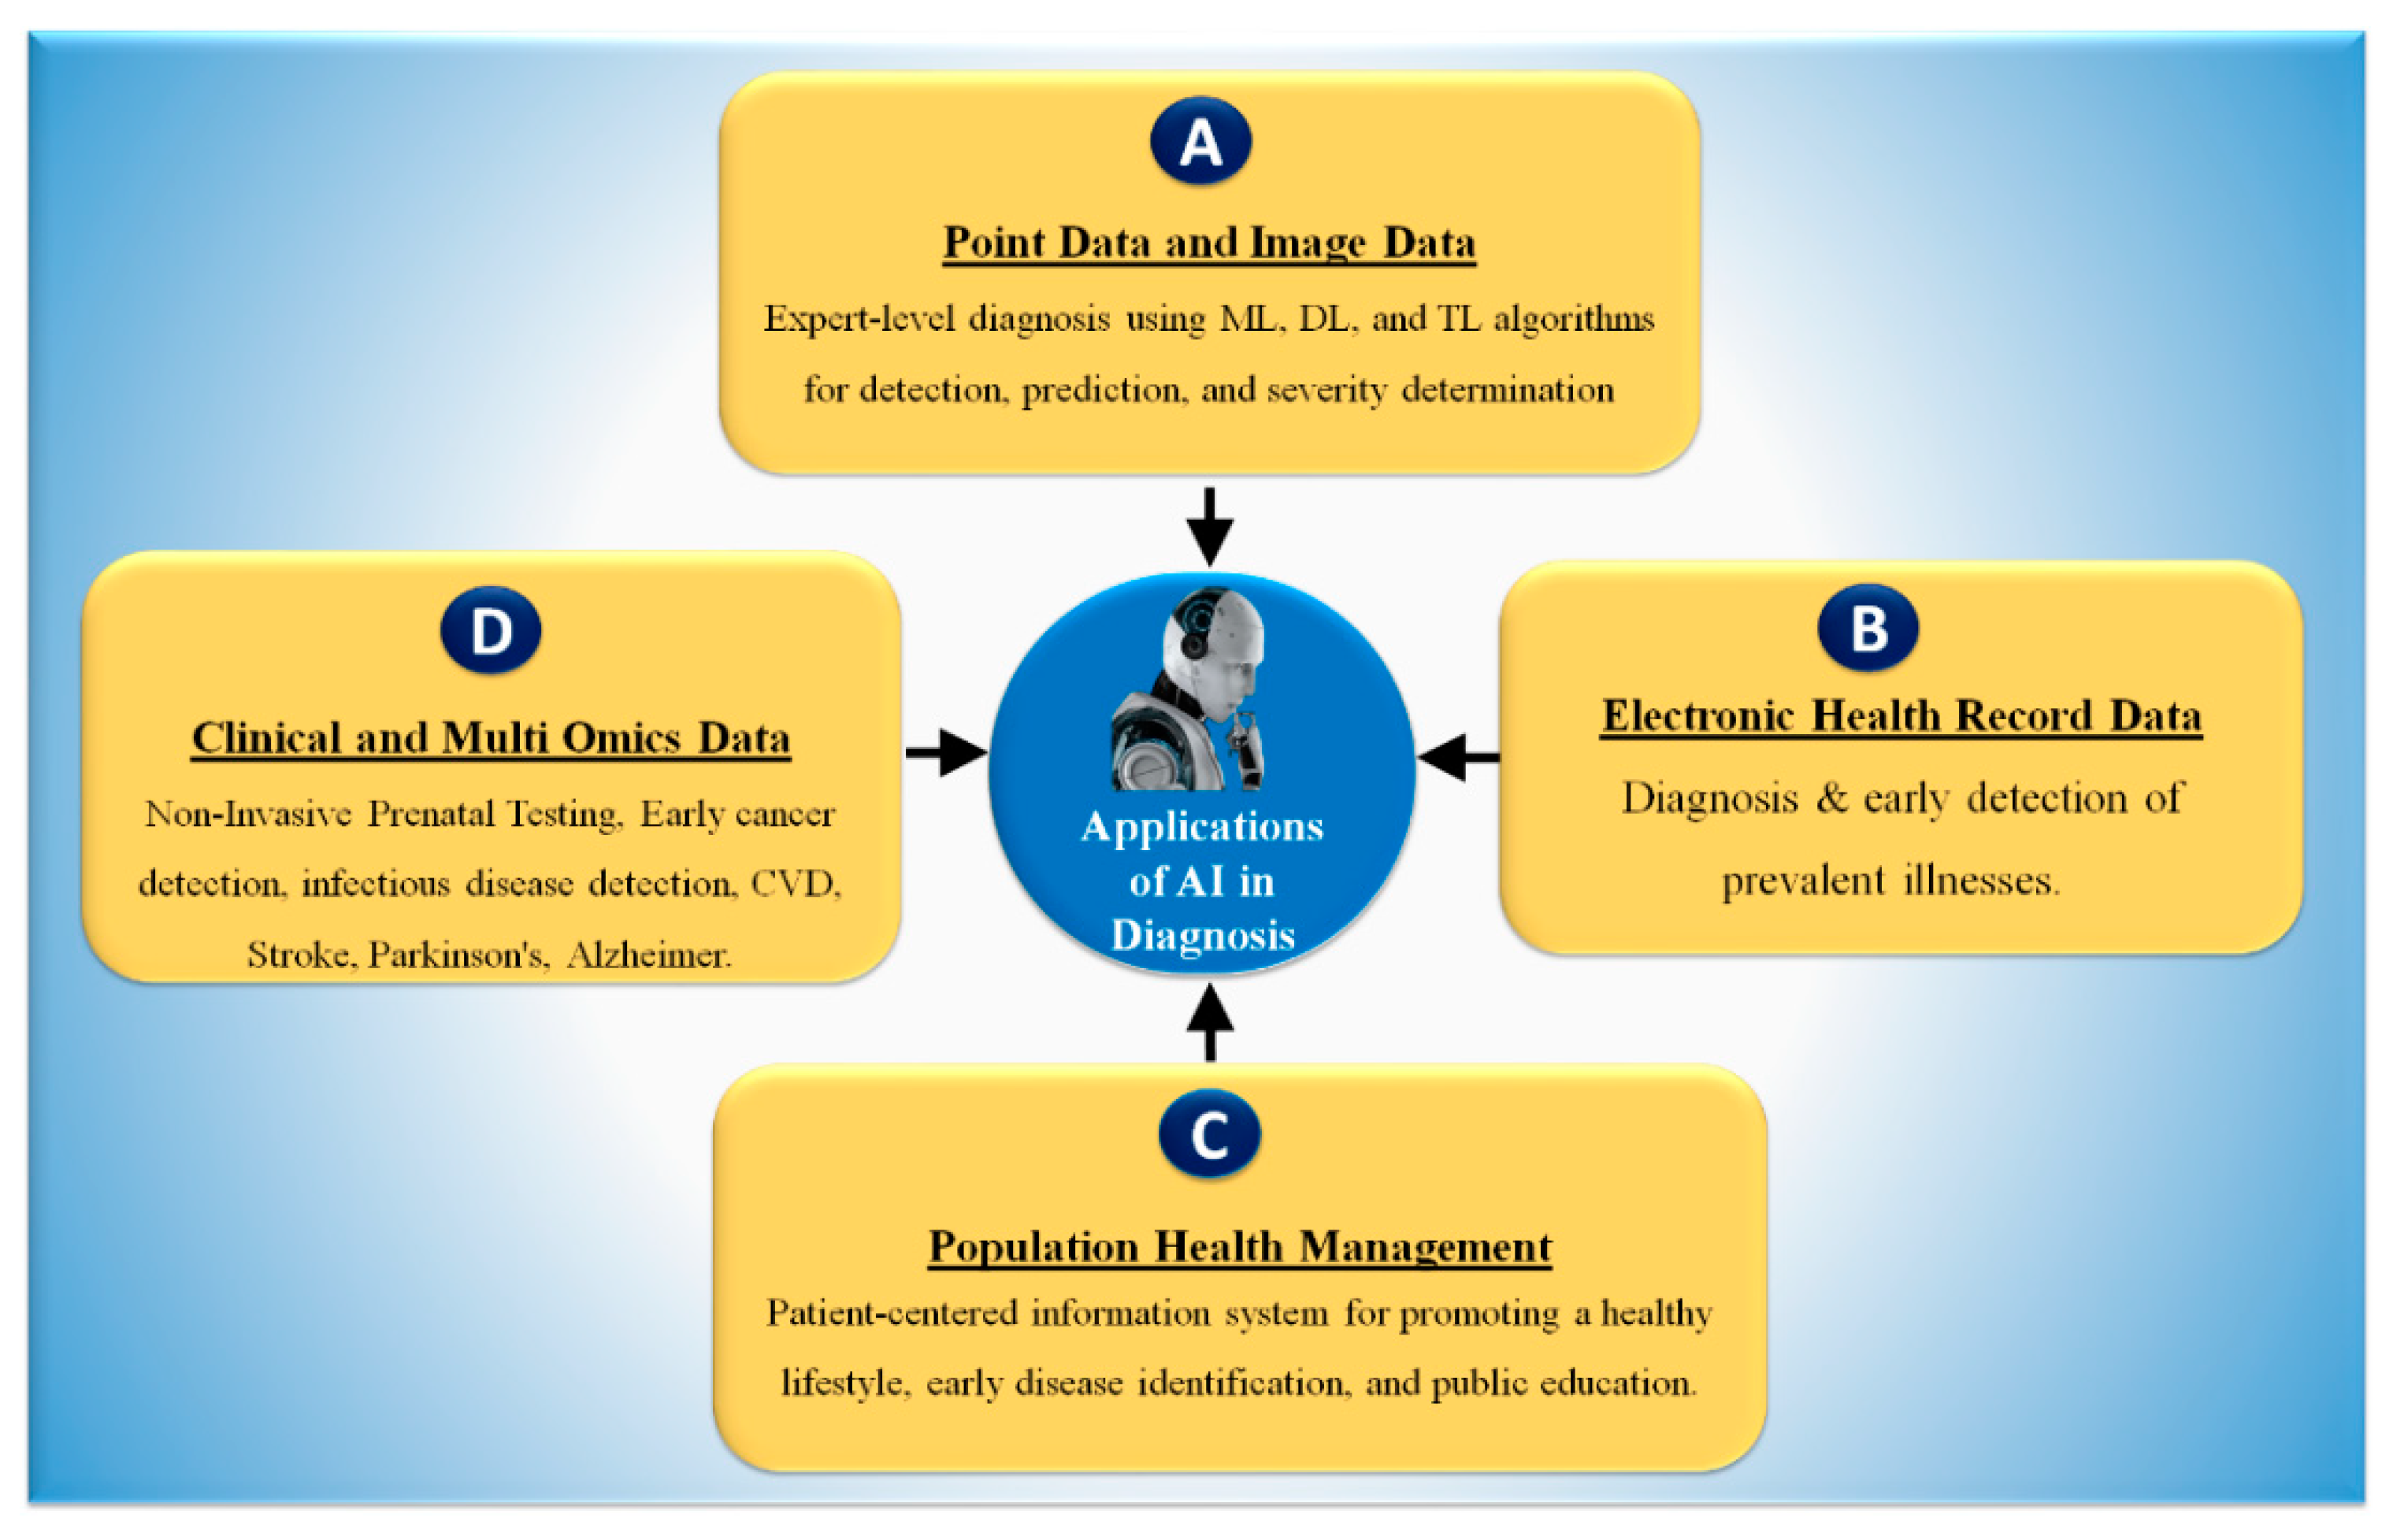
4.1. Artificial Intelligence-Based Diagnosis Systems
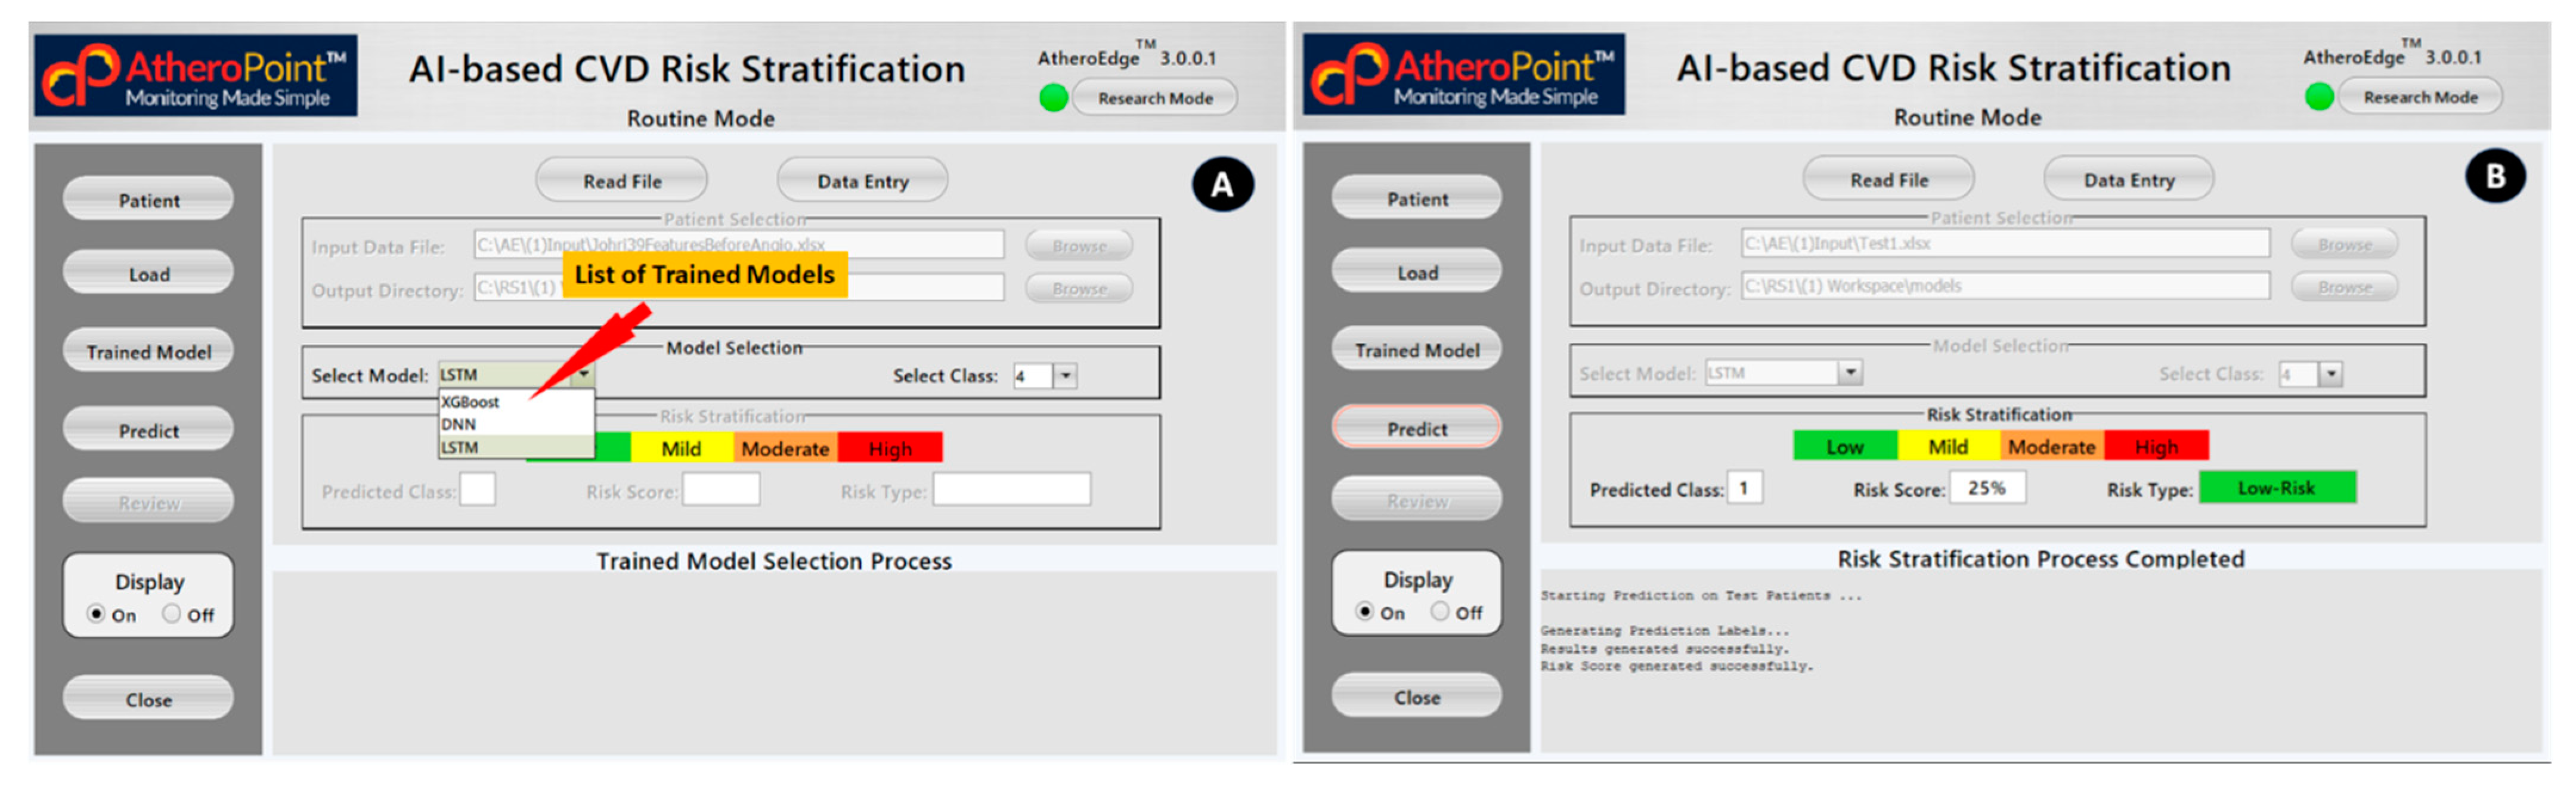
4.2. AI-Based Cardiovascular Disease Risk Stratification: A Classic Example of Diagnosis
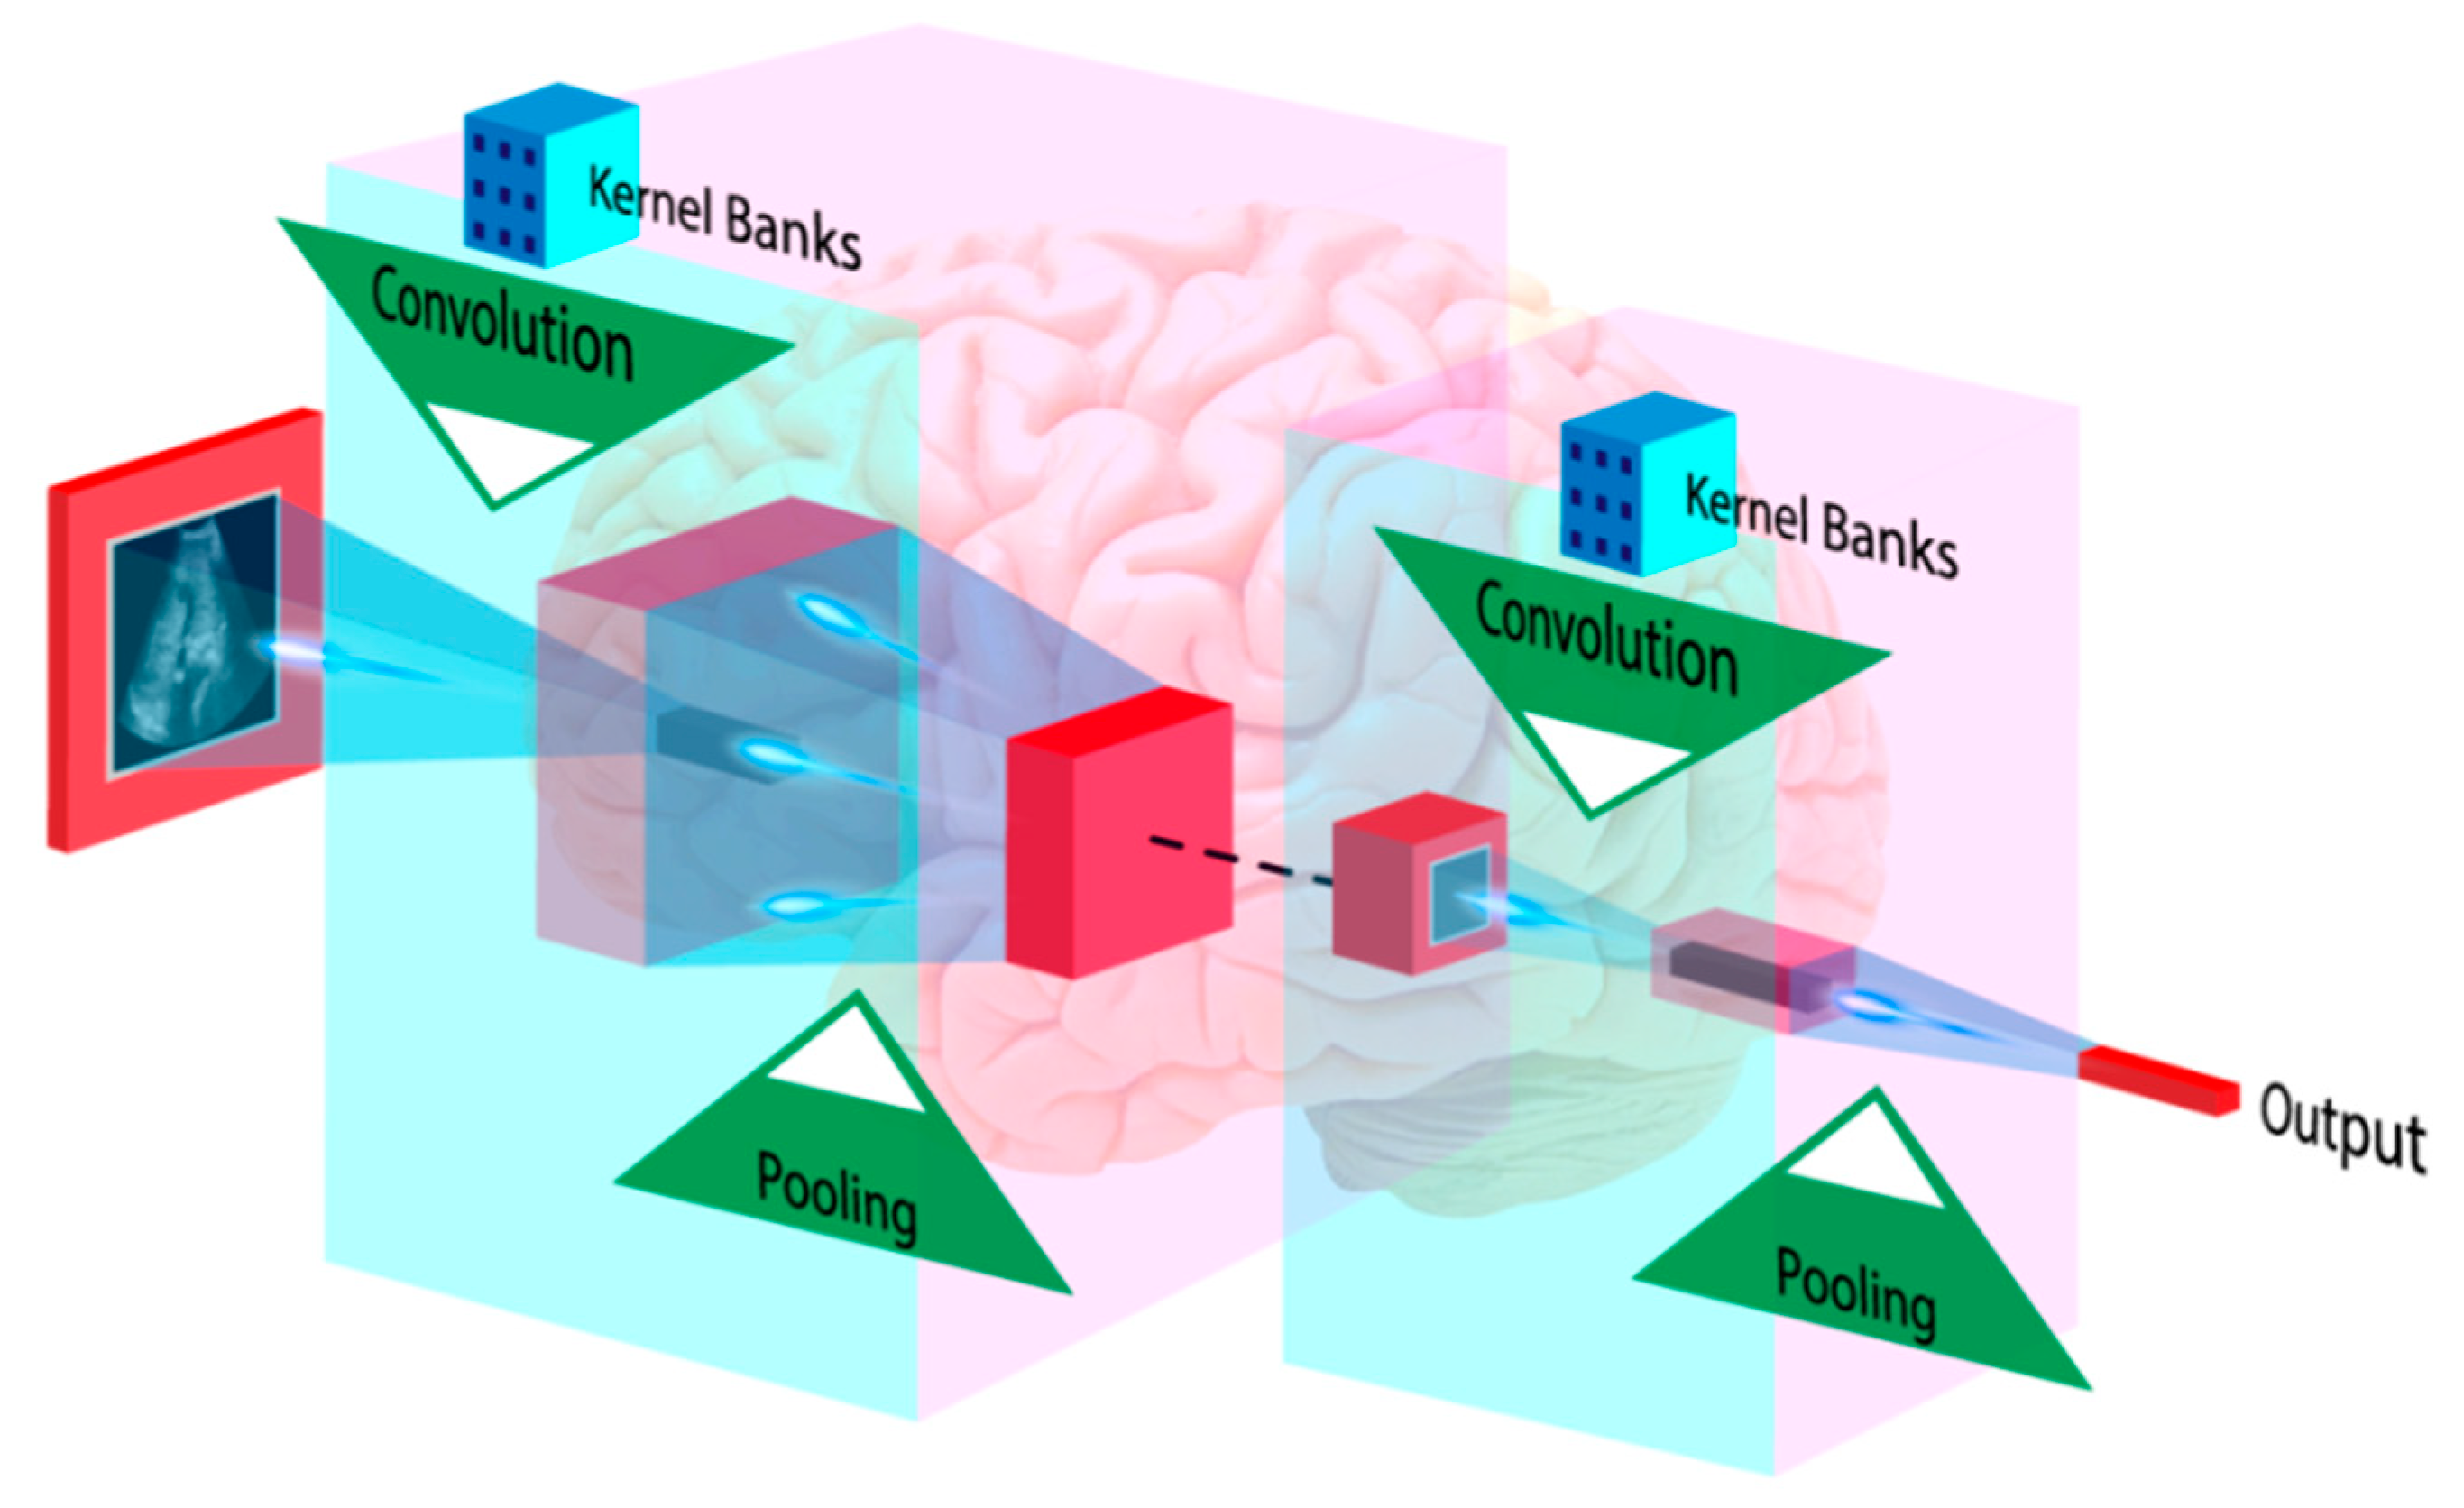
4.3. Deep Learning-Based Diagnosis and Risk Stratification
4.4. Artificial Intelligence-Based Treatment Systems
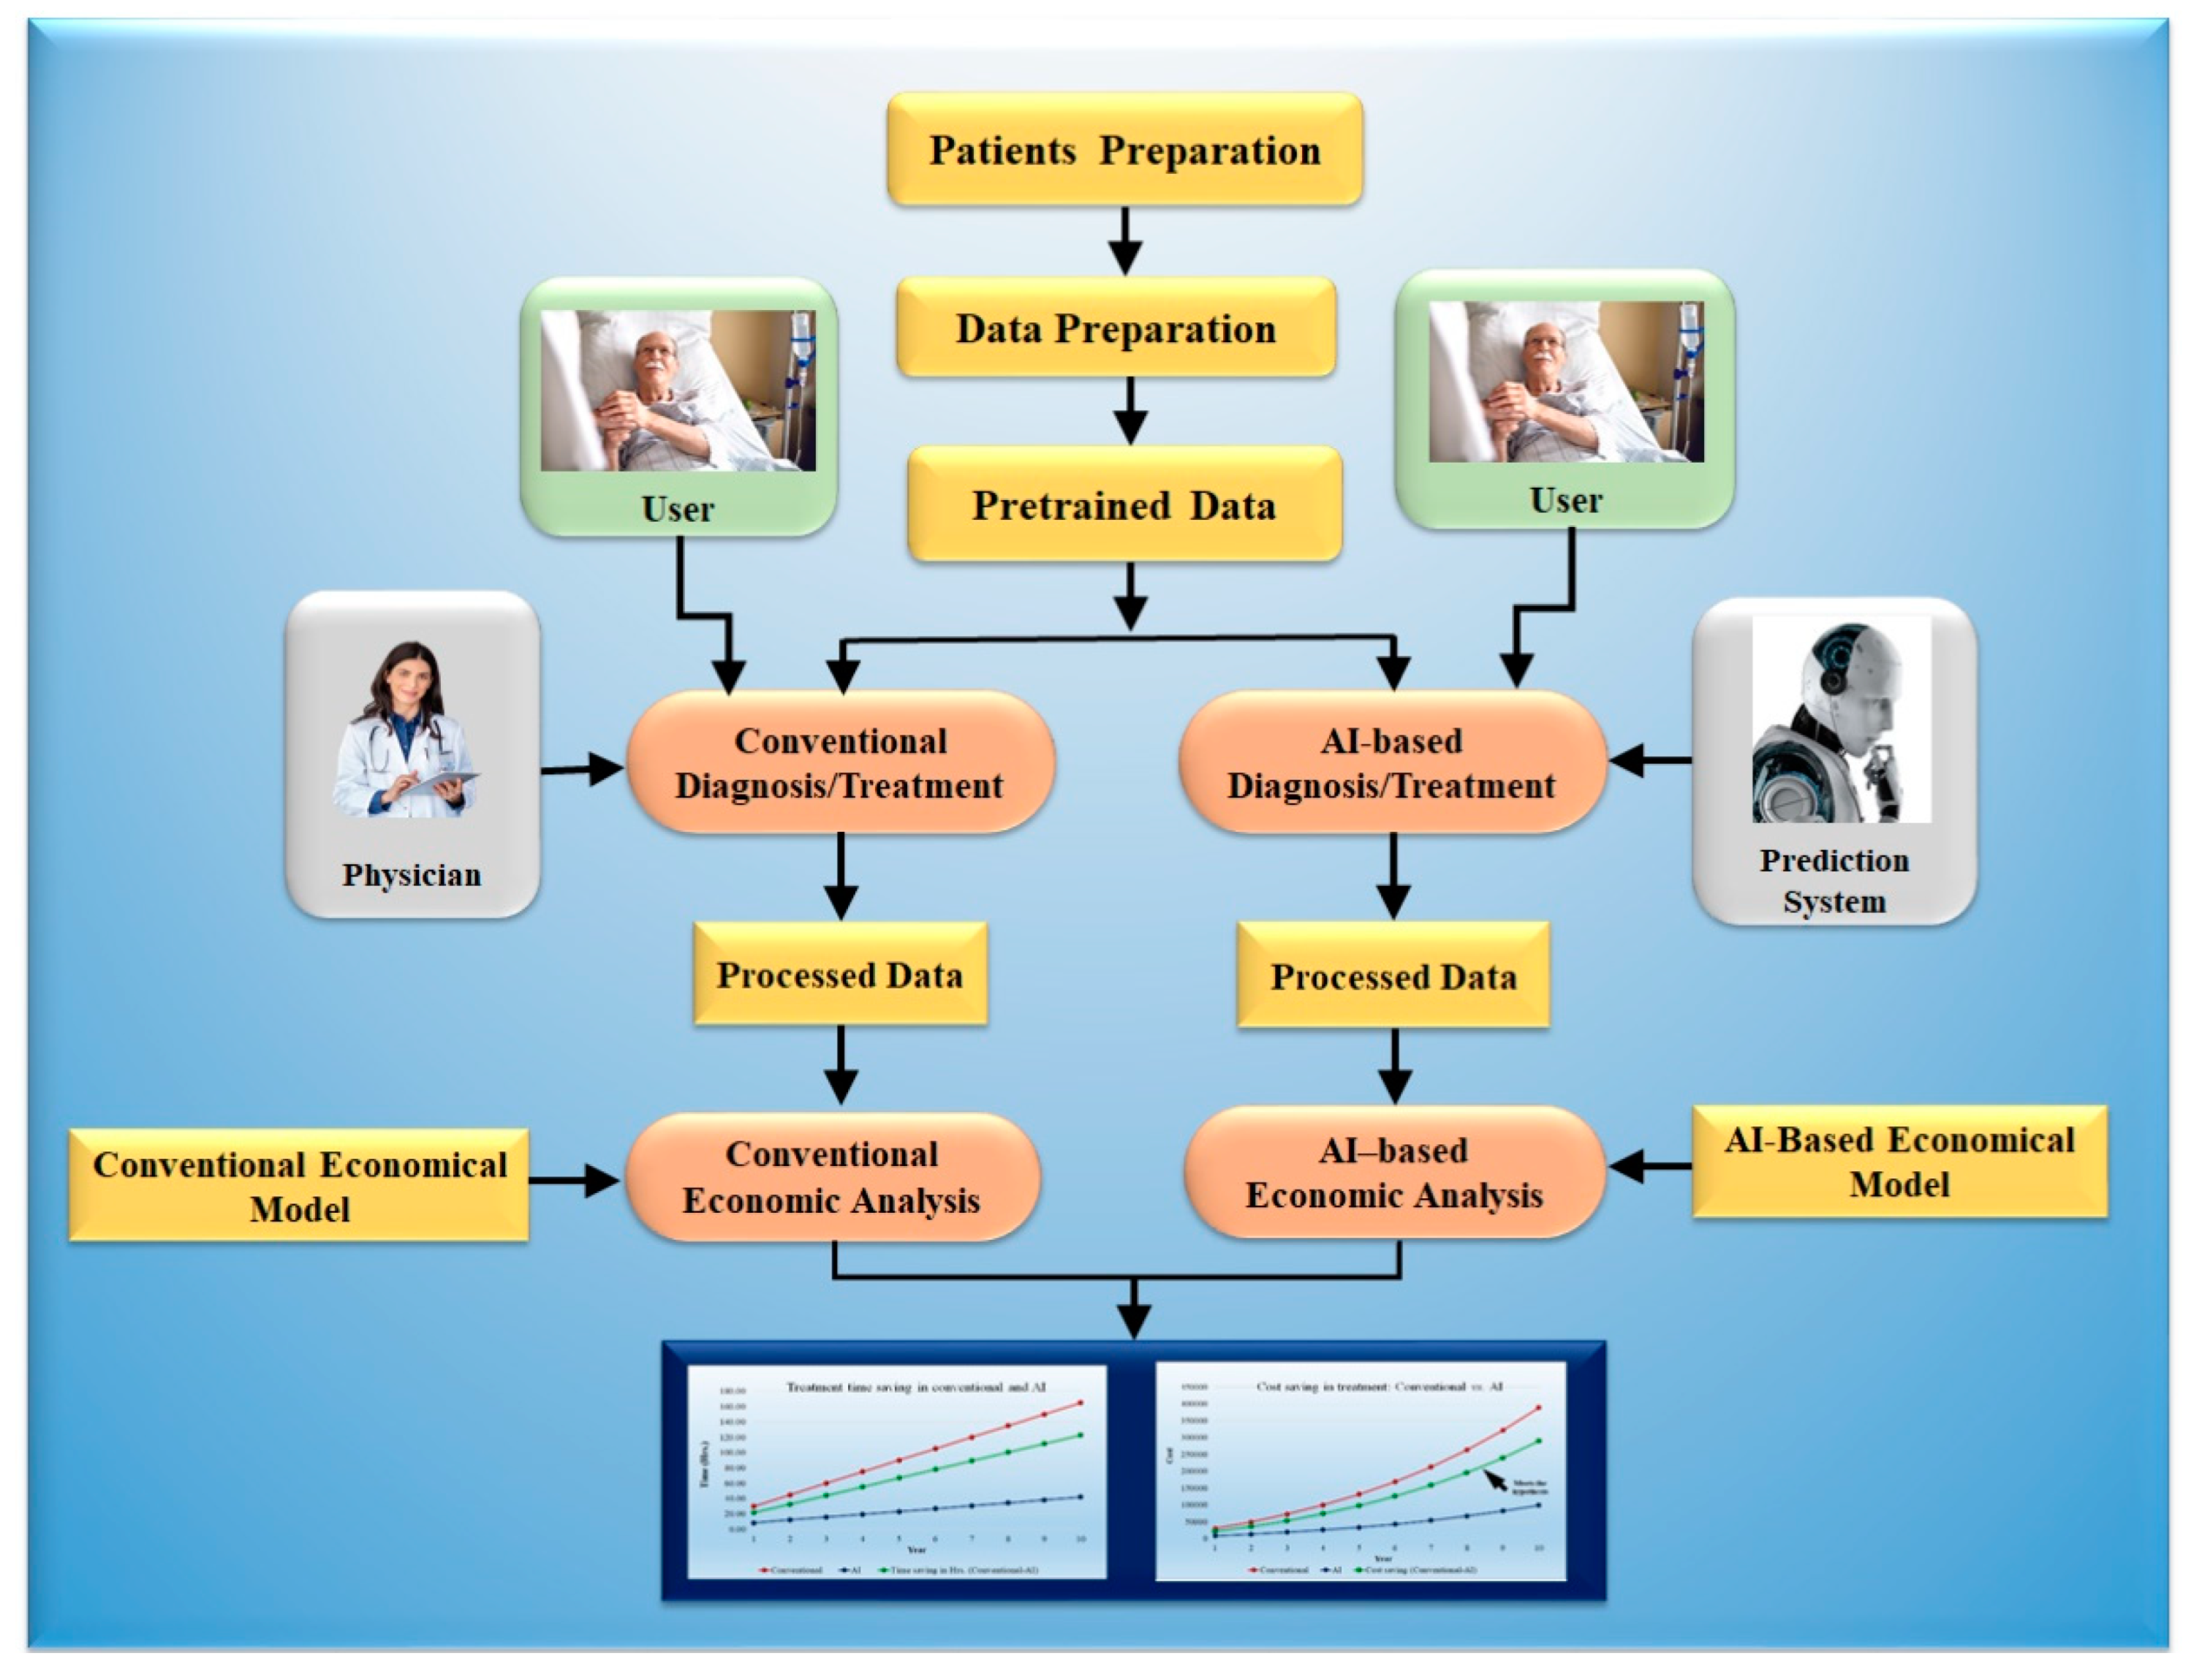
5. Economics of Artificial Intelligence Models
5.1. Modeling Cost Analysis for Diagnosis
5.2. Modeling Cost Analysis for Treatment
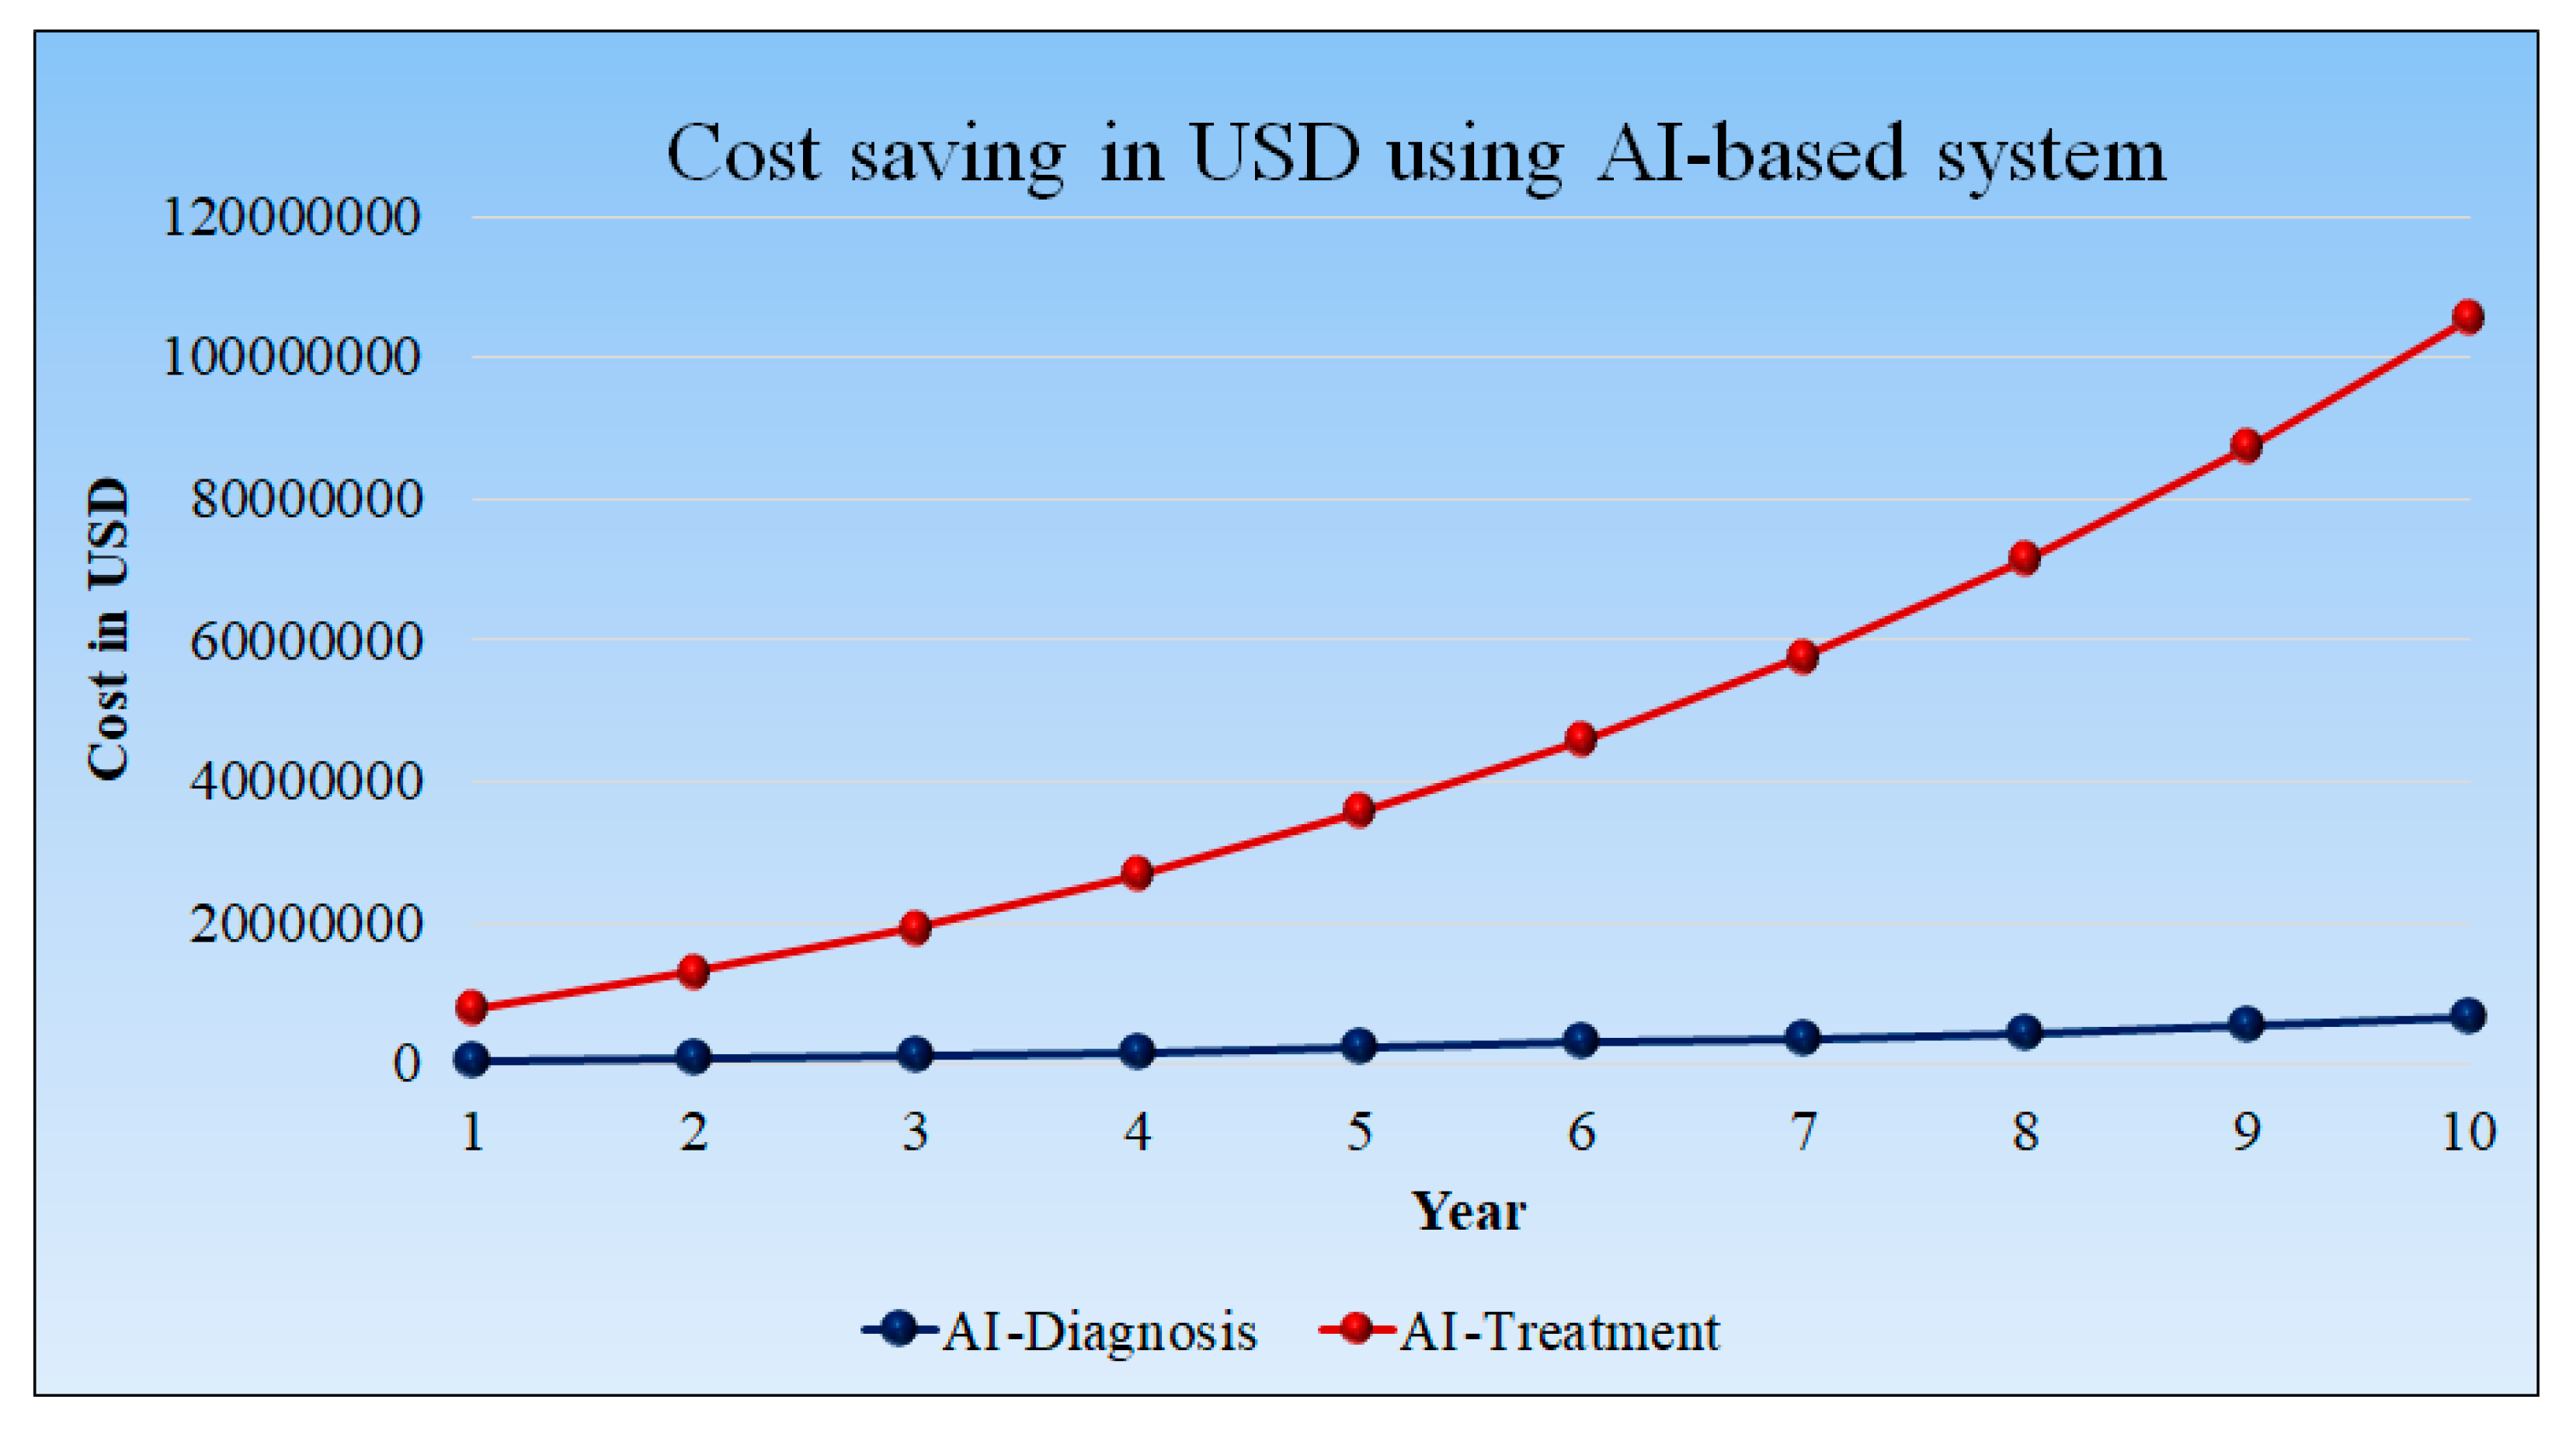
5.3. Cost Saving in USD Using AI-Based Diagnosis and Treatment Tools
6. Recent Advances in Artificial Intelligence and Its Relationship to Economics
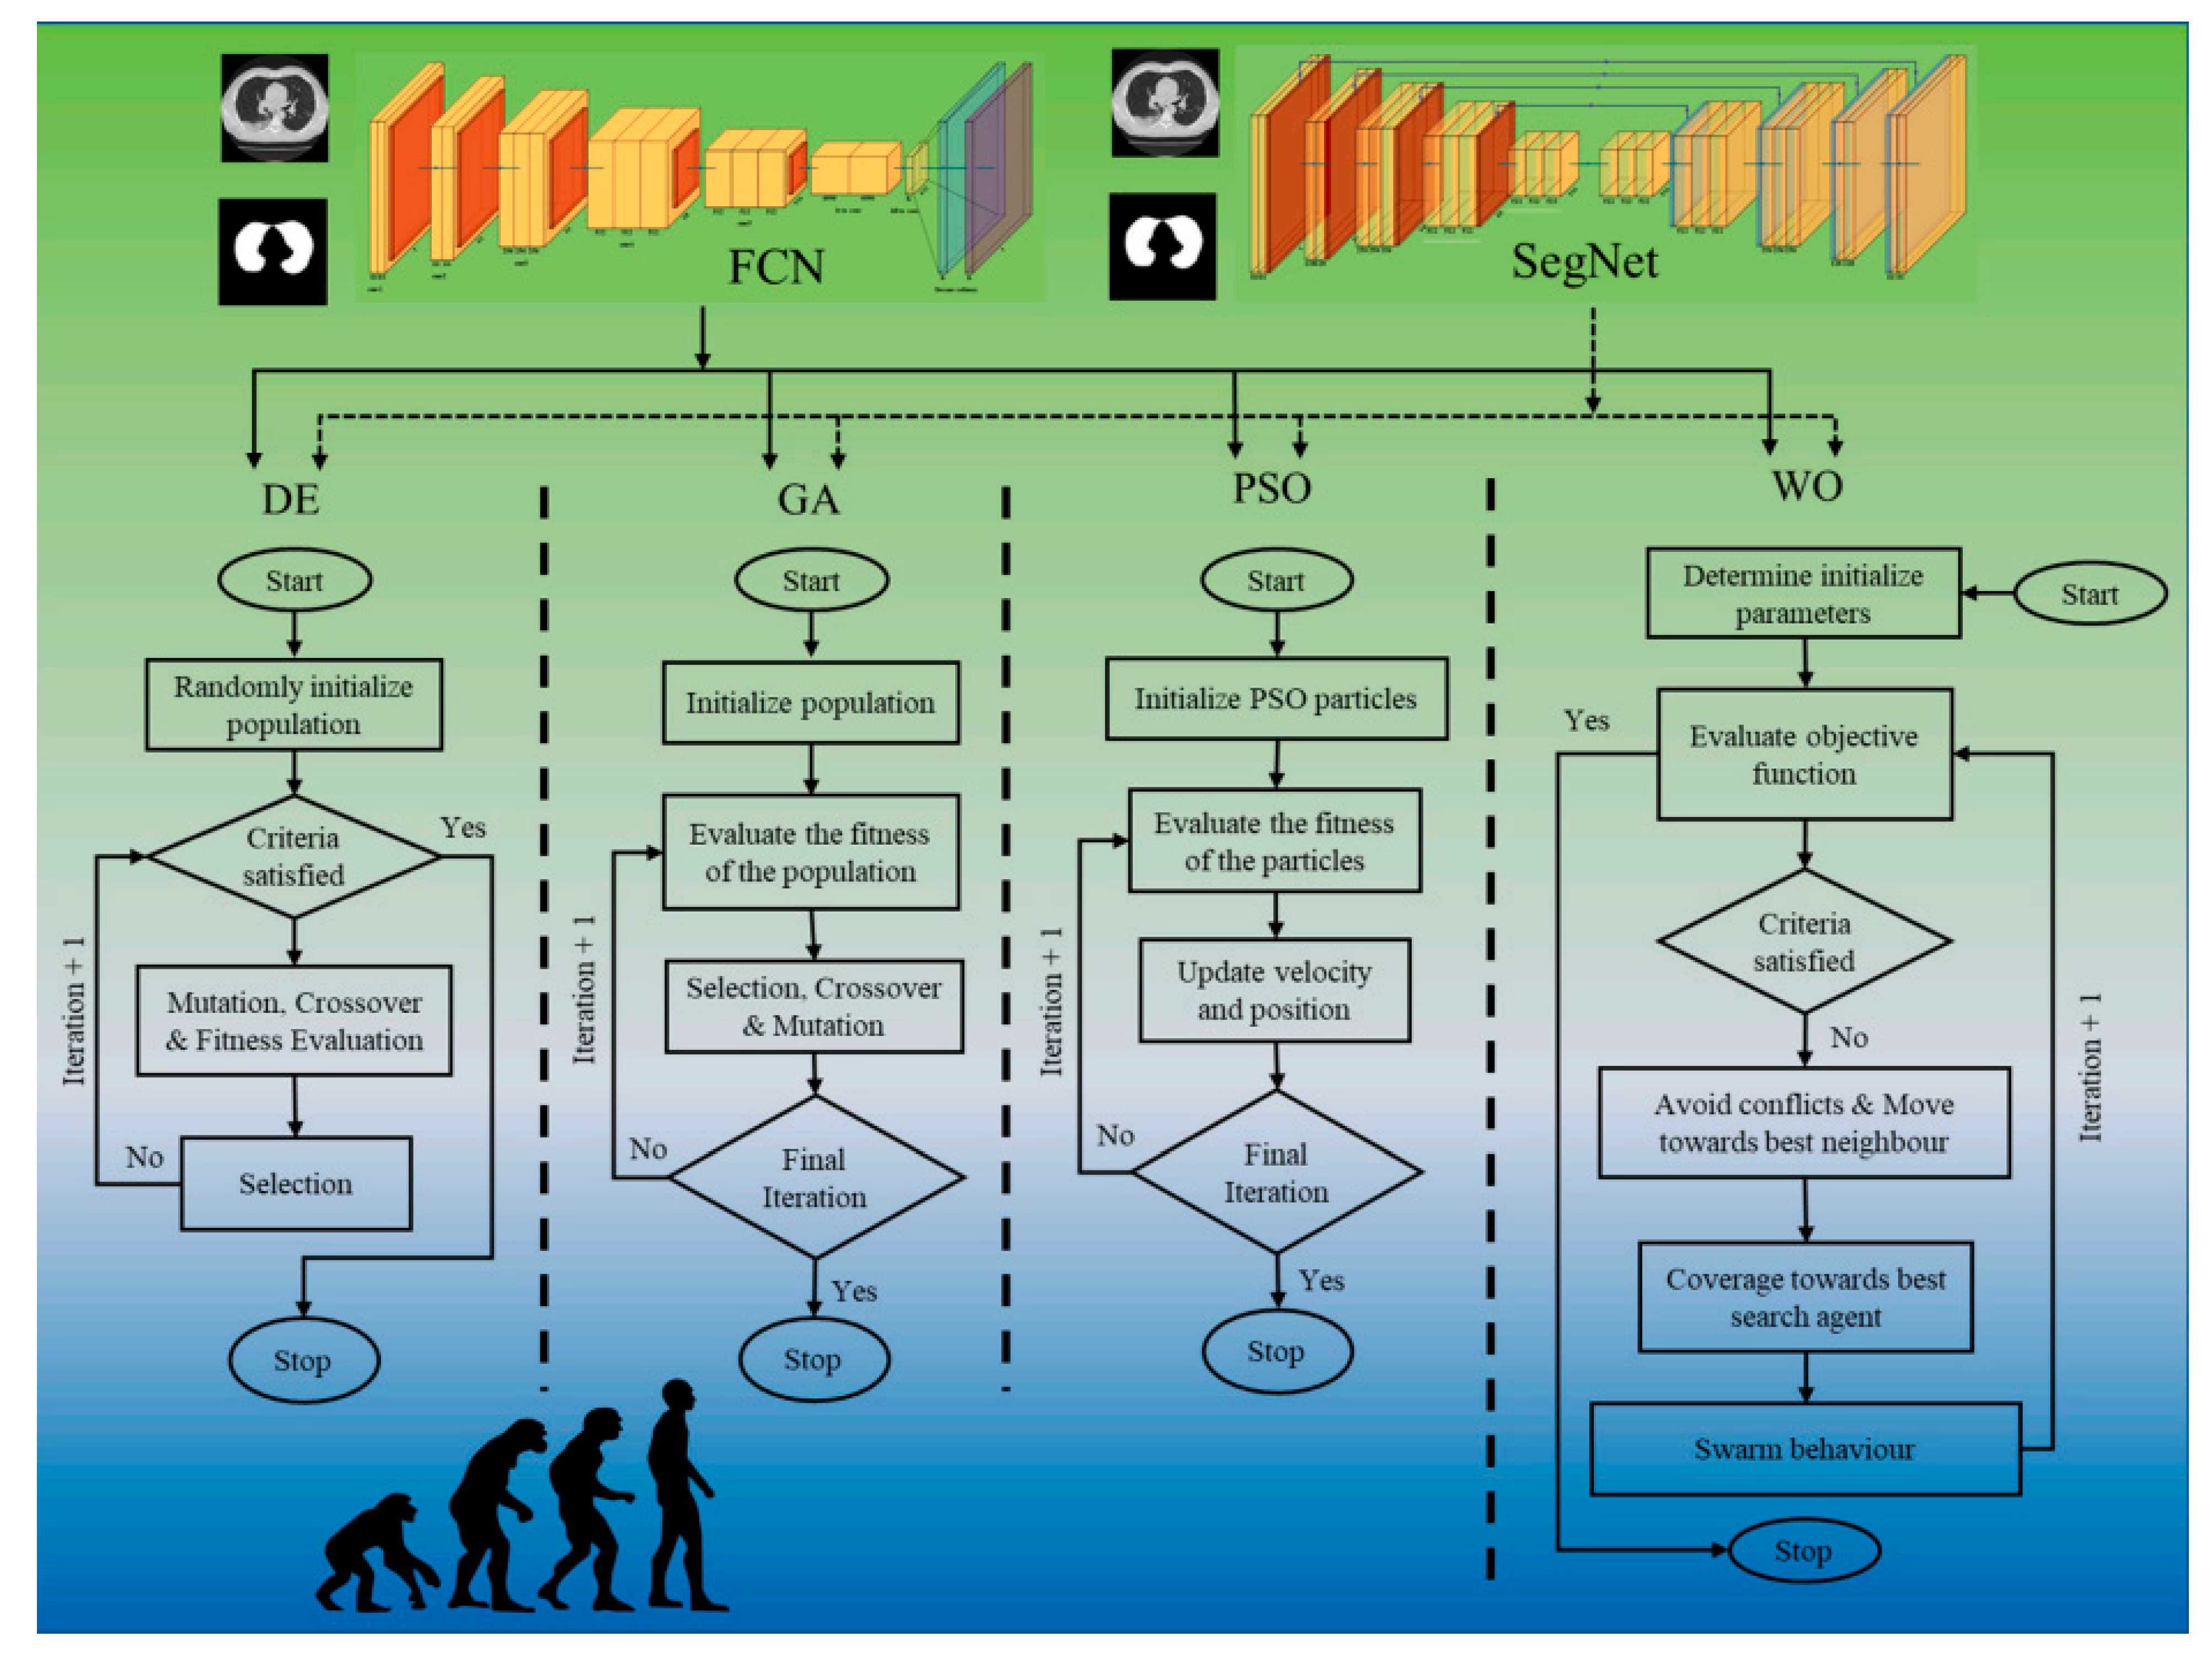
6.1. Pruned Artificial Intelligence Systems and Its Effect on Economics
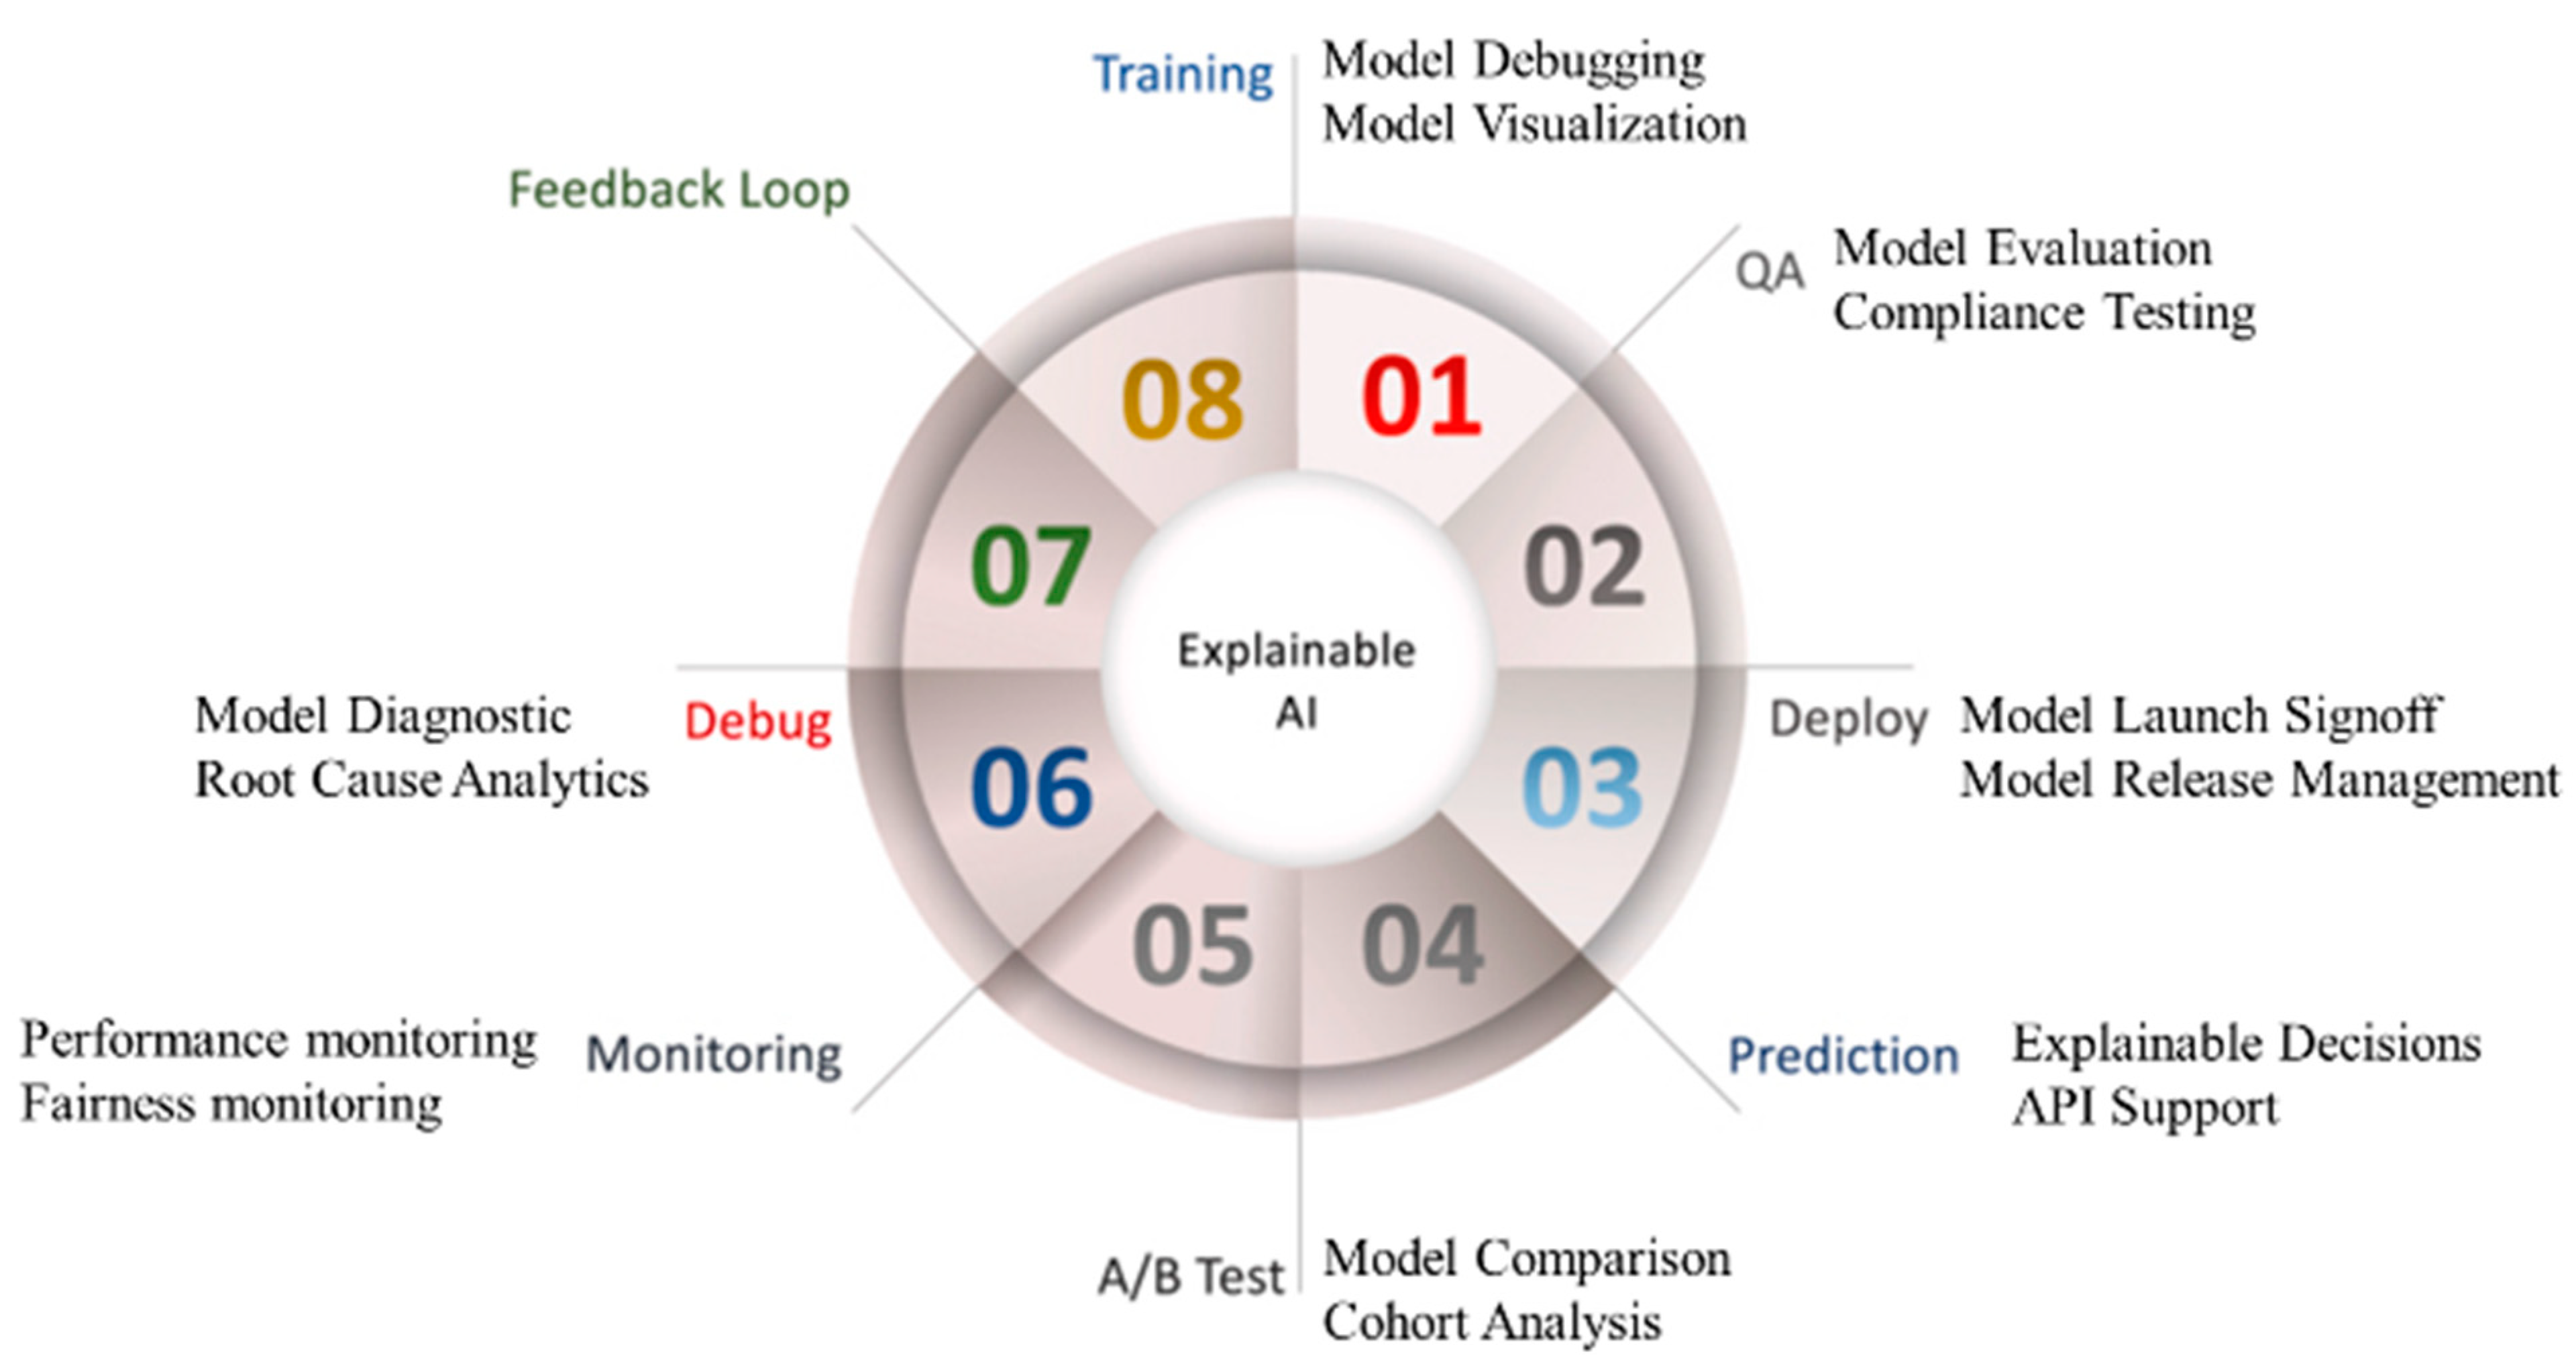
6.2. Explainable Artificial Intelligence Systems and Its Effect on Economics
6.3. Bias in Artificial Intelligence Systems and Its Economics
7. Regulations and Artificial Intelligence-Based Systems
7.1. Motivation for Building AI-Based Products for a Successful Regulatory Market Approval
7.2. What Should an AI-Based Product Undergo for a Successful FDA 510 (K) Approval?
7.3. A Short Note on the Influence of the Changing Technology and Economics
8. Discussion
8.1. Principal Findings
8.2. Benchmarking
8.3. A View for the Future
8.4. Strength, Weakness, and Extensions

| C1 | C2 | C3 | C4 | C5 | C6 | C7 | C8 | C9 | C10 | C11 | ||||||
| SN | Author | Country | Journal | Study Type | FoV | Objective | PS | Cli-Val | Diagnosis (Invasive/Noninvasive) | Treatment (Invasive/Noninvasive) | ||||||
| 1 | Smetherman et al. [182] (2021) | USA | Breast Imaging | P.R. | Cancer | Improving the quality of care and/or reducing healthcare costs by using AI | 1012 | No | Noninvasive | NR | ||||||
| 2 | Challen et al. [183] (2019) | UK | Artificial intelligence, bias and clinical safety | R. | Clinical safety | To set short and medium ML clinical safety goals | NR | No | Noninvasive | NR | ||||||
| 3 | Almazán et al. [82] (2019) | Italy | Clinical Pharmacy | P.R. | Renal | Evaluate the effectiveness, safety, and economic cost of nivolumab in real-world clinical practice | 221 | No | Noninvasive | NR | ||||||
| 4 | Yuan et al. [184] (2020) | China | Medical Sciences | P.R. | Renal | Challenges in kidney diagnosis and treatment | NR | No | Noninvasive | NR | ||||||
| 5 | Solanki et al. [185] (2022) | Australia | Operational ethics in AI framework | R | NA | NR | NR | No | Noninvasive | NR | ||||||
| 6 | Biswas et al. [102] (2018) | India | DL-based strategy for accurate Carotid Intima-Media Measurement | R | Heart | The carotid intima-media thickness (cIMT) is an important biomarker for monitoring cardiovascular disease and stroke | 204 | No | Noninvasive | NR | ||||||
| 7 | Siy et al. [186] (2018) | Taiwan | IEEE Conference | R | Skin | DL-based psoriasis detection | 5700 | No | Noninvasive | NR | ||||||
| 8 | Aijaz et al. [71] (2022) | Pakistan | Journal of Healthcare Engineering | R | Skin | Effective classification of different psoriasis types using deep learning applications | 473 | No | Noninvasive | NR | ||||||
| 9 | Ali et al. [188] (2022) | Iraq | Kidney Diseases Transplantation | P. | Renal | Renal medicine | NR | No | NR | NR | ||||||
| 10 | Viswanathan et al. [189] (2020) | India | Preventive health check in patients with diabetes | R. | Diabetes | Cost-effective carotid ultrasound screening for diabetes patients | NR | NR | Noninvasive | NR | ||||||
| 11 | Sarki et al. [198] (2020) | USA | Health Information Science and Systems | P.R. | Diabetes Retinopathy | Deep learning-based automated identification of multiple classes of diabetic eye disorders | 1748 | NR | Noninvasive | NR | ||||||
| 12 | Quan et al. [199] (2021) | Japan | IEEE Access | P.R. | Parkinson’s | Using dynamic speech features, a deep learning-based approach for Parkinson’s disease detection | 45 | NR | Noninvasive | NR | ||||||
| 13 | Kamble et al. [191] (2021) | India | Measurement and Sensor | P.R. | Parkinson’s | Parkinson’s disease classification using digital spiral drawings | 25 | NR | Noninvasive | NR | ||||||
| C12 | C13 | C14 | ||||||||||||||
| SN | Author | AI Type | Cost Analysis Parameter | Outcome of study | ||||||||||||
| AI Type | ACC | SEN | SPE | AUC | MCC | F1 | Cost Analysis Parameter | Input Modality | Model Analysis | Screening cost | Maintain Cost | Cost Savings (USD) Per. Sample | ||||
| 1 | Smetherman et al. [182] (2021) | NR | NR | NR | NR | NR | NR | NR | NR | Image | Yes | Yes | NR | 318 | AI could assess individual situations, make appropriate decisions, and aid in the management of renal disease. | |
| 2 | Challen et al. [183] (2019) | NR | NR | NR | NR | NR | NR | NR | NR | NR | NR | NR | NR | NR | ML DSS deployment will most likely concentrate on diagnostic decision support. ML Diagnostic decision assistance should be assessed with the same rigors as a novel laboratory screening test. | |
| 3 | Almazán et al. [82] (2019) | NR | NR | NR | NR | NR | NR | NR | NR | Point Data | Yes | Yes | NR | 61 | AI for improved clinical benefit from nivolumab therapy. | |
| 4 | Yuan et al. [184] (2020) | NR | NR | NR | NR | NR | NR | NR | NR | Point Data | Yes | Yes | NR | 62 | Artificial intelligence can consider individual situations, make appropriate decisions, and make significant advancements in the management of renal disease. | |
| 5 | Solanki et al. [185] (2022) | NR | NR | NR | NR | NR | NR | NR | NR | NR | Yes | Yes | Yes | Yes | Guidelines, frameworks, and advancement of technologies for ethical AI that reflect human values, such as self-direction, in healthcare. | |
| 6 | Biswas et al. [102] (2018) | DL | 86.78 | 0.76 | NR | 0.86 | NR | NR | NR | Image | NR | NR | NR | NR | High-level features are extracted from the CCA US photos using CNN’s 13 layers. To produce clear and crisp segmented images, these features were upsampled using FCN upsampling layers, and the skipping operation was carried out. | |
| 7 | Siy et al. [186] (2018) | DL | 91.5 | NR | NR | NR | NR | NR | NR | Image | NR | NR | NR | NR | A DNN-based psoriasis detection presented having 91.5% accuracy. | |
| 8 | Aijaz et al. [71] (2022) | DL | 84.2 | 0.81 | 0.71 | NR | NR | NR | NR | Image | NR | NR | NR | NR | This study employed a CNN-based deep learning classification strategy to categorize the five types of psoriasis. | |
| 9 | Ali et al. [188] (2022) | NR | NR | NR | NR | NR | NR | NR | NR | NR | NR | NR | NR | NR | Machine learning and artificial intelligence have ushered in a new era in medicine and nephrology. | |
| 10 | Viswanathan et al. [189] (2020) | NR | NR | NR | NR | NR | NR | NR | NR | Image | NR | NR | NR | 14 | Diabetes exacerbated the deposition of atherosclerotic plaque. Risk assessment includes other factors in addition to the degree of vessel stenosis. | |
| 11 | Sarki et al. [198] (2020) | DL | 84.88 | 0.87 | NR | NR | NR | NR | NR | Image | NR | NR | NR | NR | The development of moderate and multi-class DL algorithms for the automatic detection of DED, according to the British Diabetic Association (BDA) criteria. | |
| 12 | Quan et al. [199] (2021) | DL | 80.90 | 0.87 | 0.92 | 0.83 | 0.53 | NR | NR | Speech | NR | NR | NR | NR | The dynamic articulation transition features and the bidirectional LSTM model are combined ingeniously in the proposed method to record the time-series properties of continuous speech data. | |
| 13 | Kamble et al. [191] (2021) | ML | 91.6 | NR | NR | NR | NR | 0.8 | NR | Image | NR | NR | NR | NR | Digitalized spiral drawing tests significantly affect how PD patients and healthy controls are classified. | |
9. Conclusions
Author Contributions
Funding
Institutional Review Board Statement
Informed Consent Statement
Data Availability Statement
Conflicts of Interest
Appendix A
| Categories | Count | Years | |||||||||
|---|---|---|---|---|---|---|---|---|---|---|---|
| 1 | 2 | 3 | 4 | 5 | 6 | 7 | 8 | 9 | 10 | ||
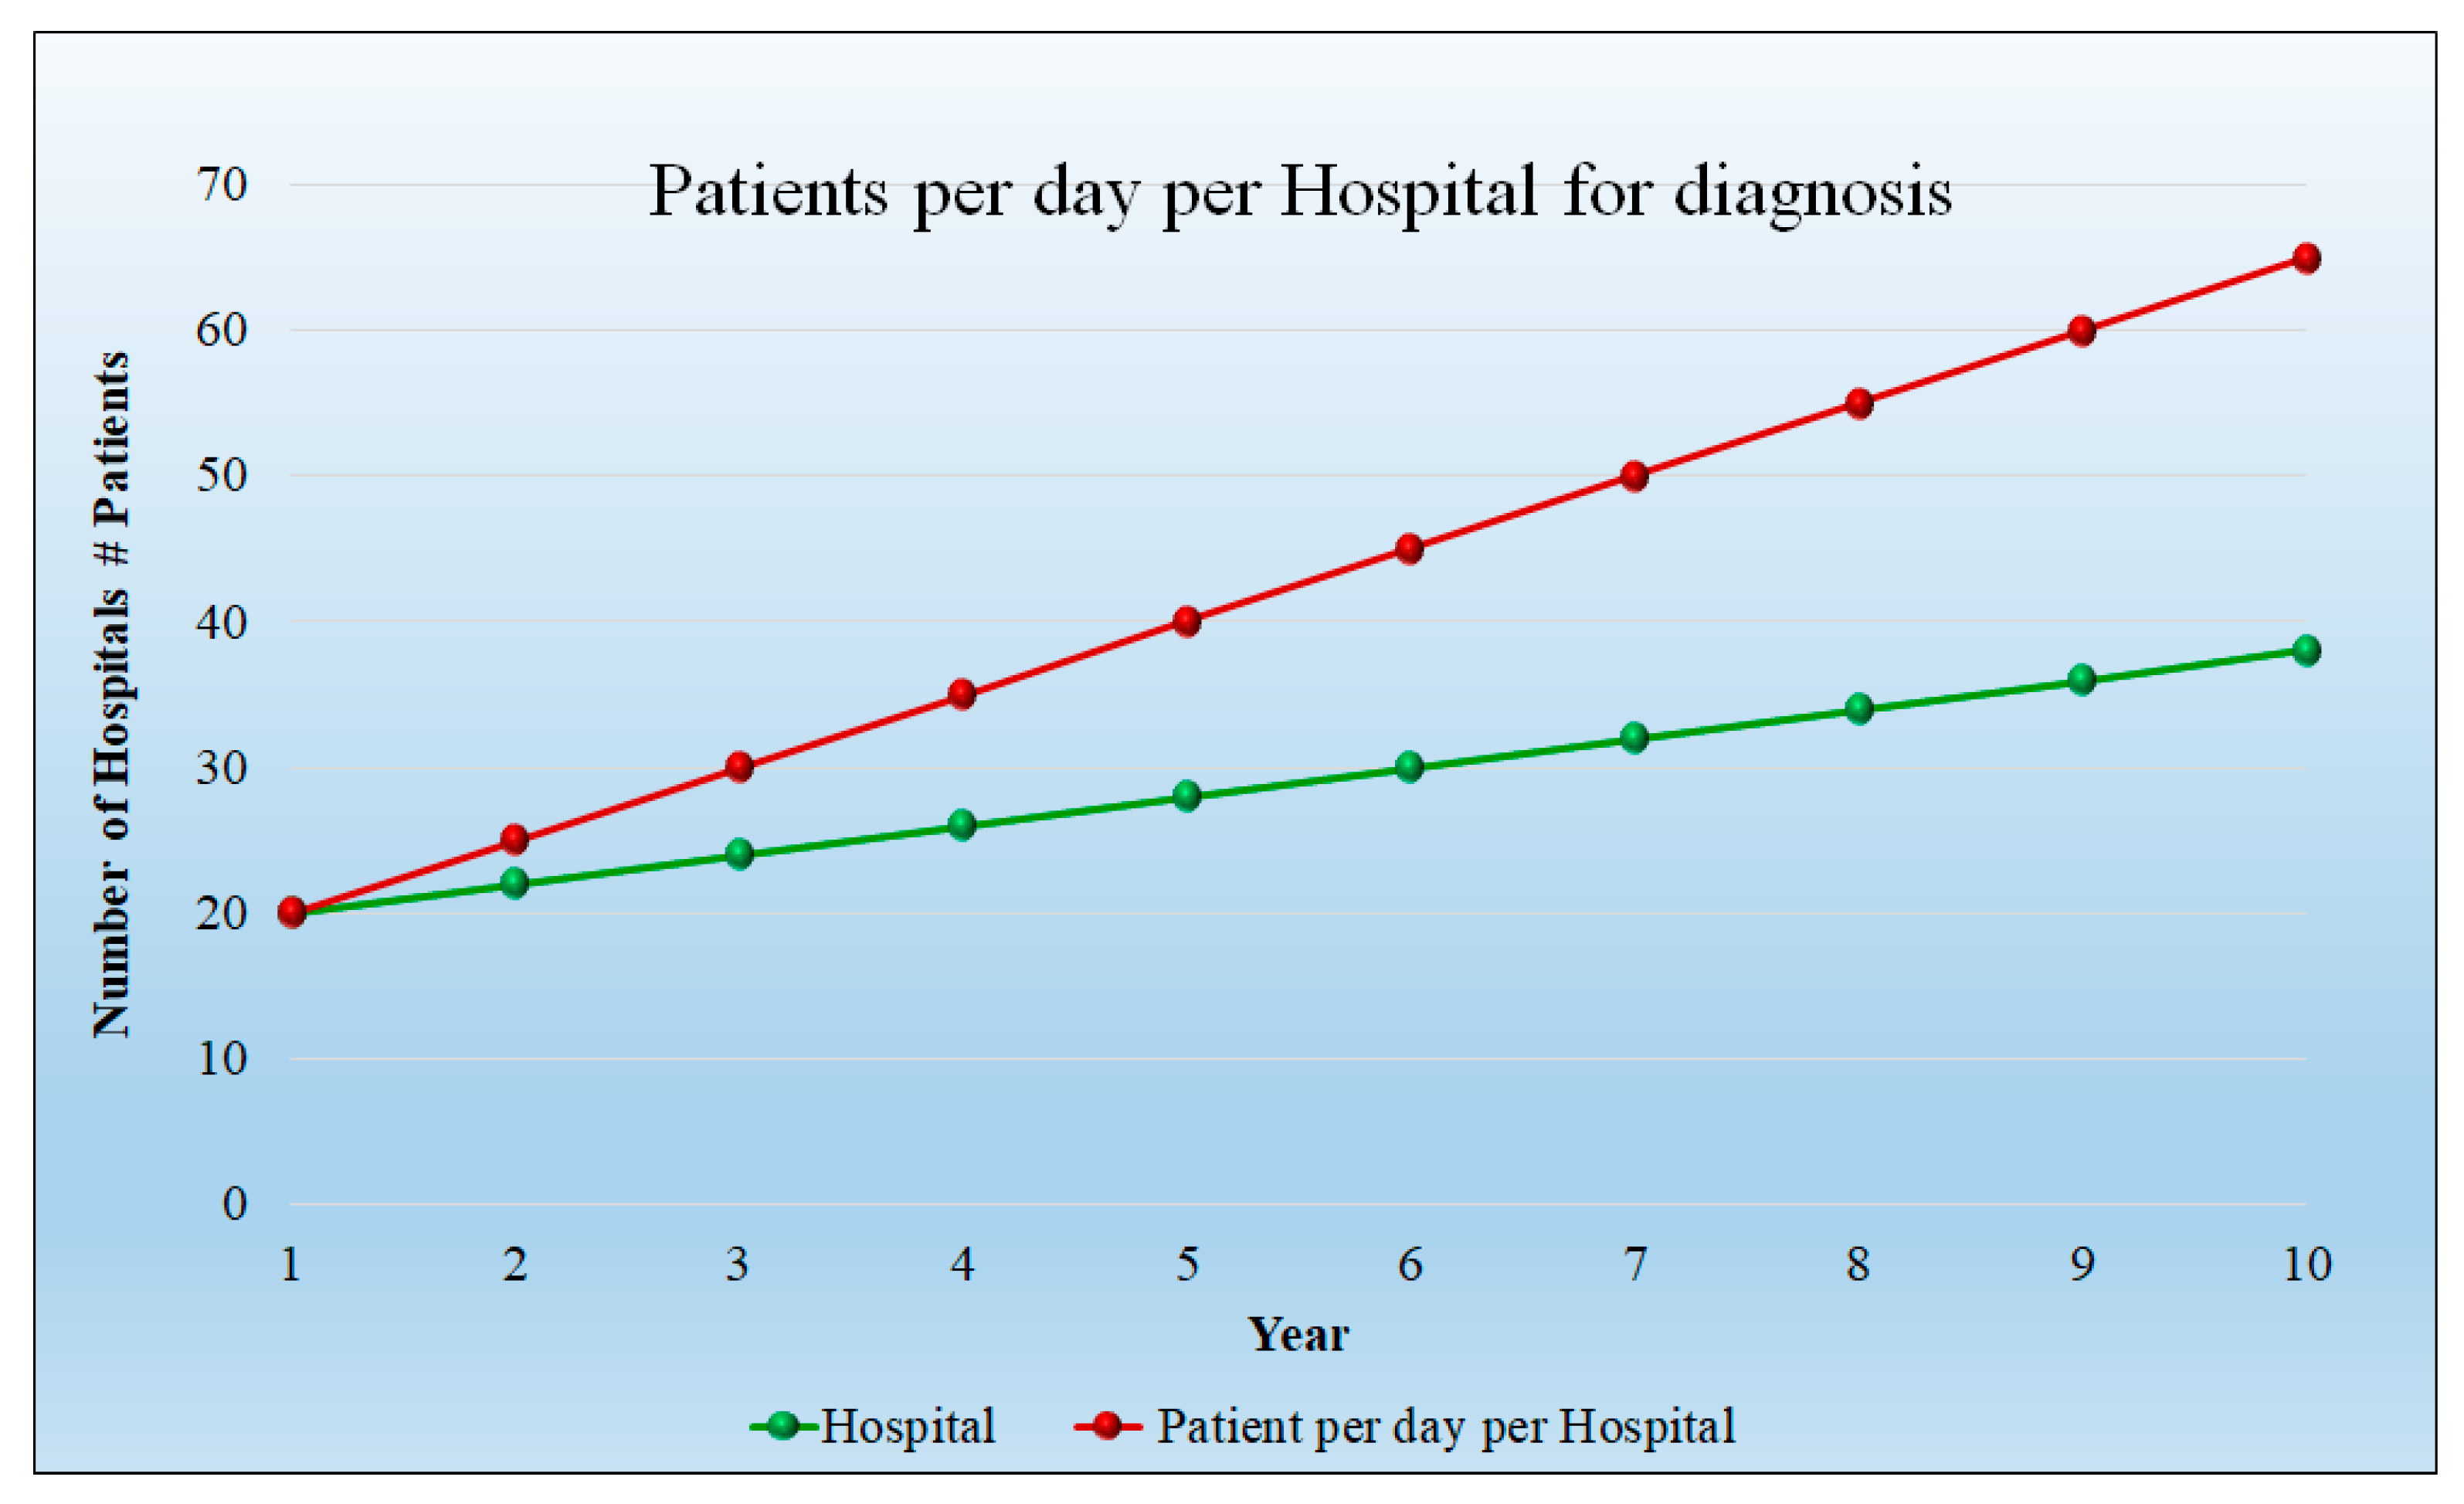
| Patient Size per hospital per year | 3650 | 7300 | 9125 | 10,950 | 12,775 | 14,600 | 16,425 | 18,250 | 20,075 | 21,900 | 23,725 |
| No. of Hospital | 20 | 20 | 22 | 24 | 26 | 28 | 30 | 32 | 34 | 36 | 38 |
| Per day Patient Per hospital | 20 | 20 | 25 | 30 | 35 | 40 | 45 | 50 | 55 | 60 | 65 |
| Total patient | 73,000 | 2,920,000 | 5,018,750 | 7,884,000 | 1,162,5250 | 1,635,2000 | 22,173,750 | 29,200,000 | 37,540,250 | 47,304,000 | 58,600,750 |
| Conventional Method | |||||||||||
| Physician charges per hour | 500 | 500 | 550 | 605 | 665.5 | 732.05 | 805.255 | 885.7805 | 974.3586 | 1071.794 | 1178.974 |
| Conventional method time (minutes) per day | 60 | 1200 | 1500 | 1800 | 2100 | 2400 | 2700 | 3000 | 3300 | 3600 | 3900 |
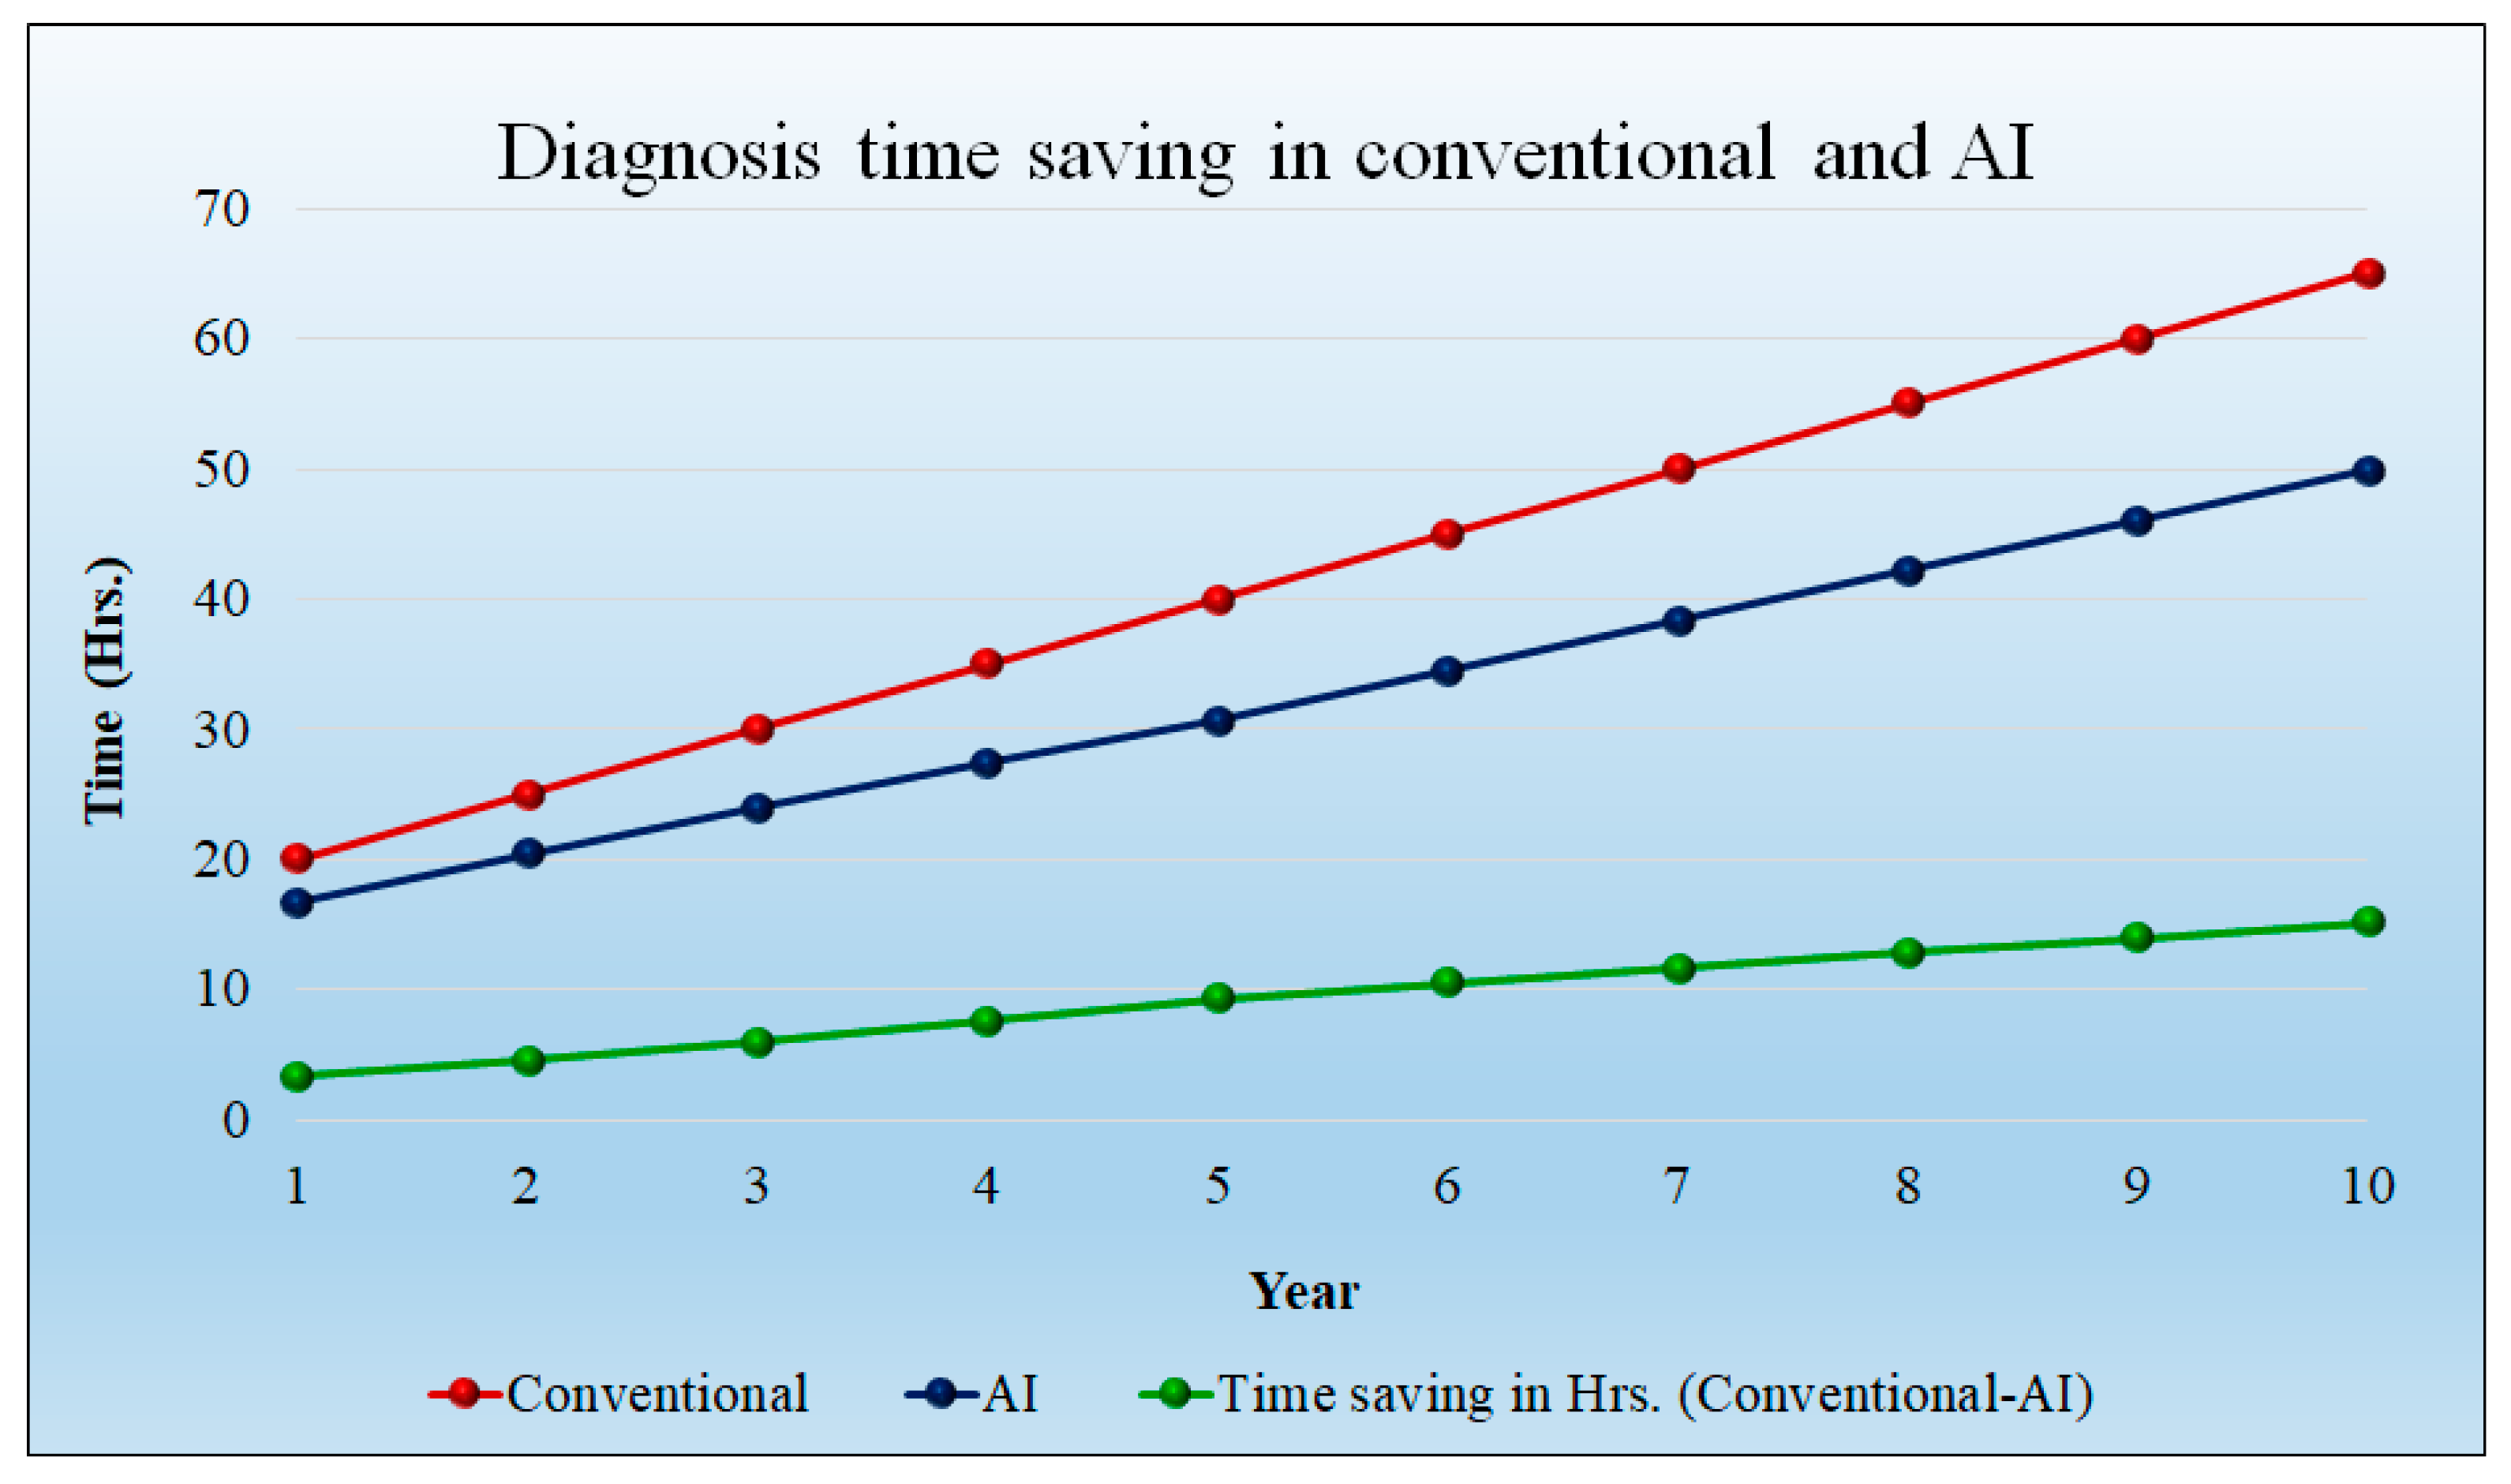
| Conventional method time (hours) per day | 1 | 20 | 25 | 30 | 35 | 40 | 45 | 50 | 55 | 60 | 65 |
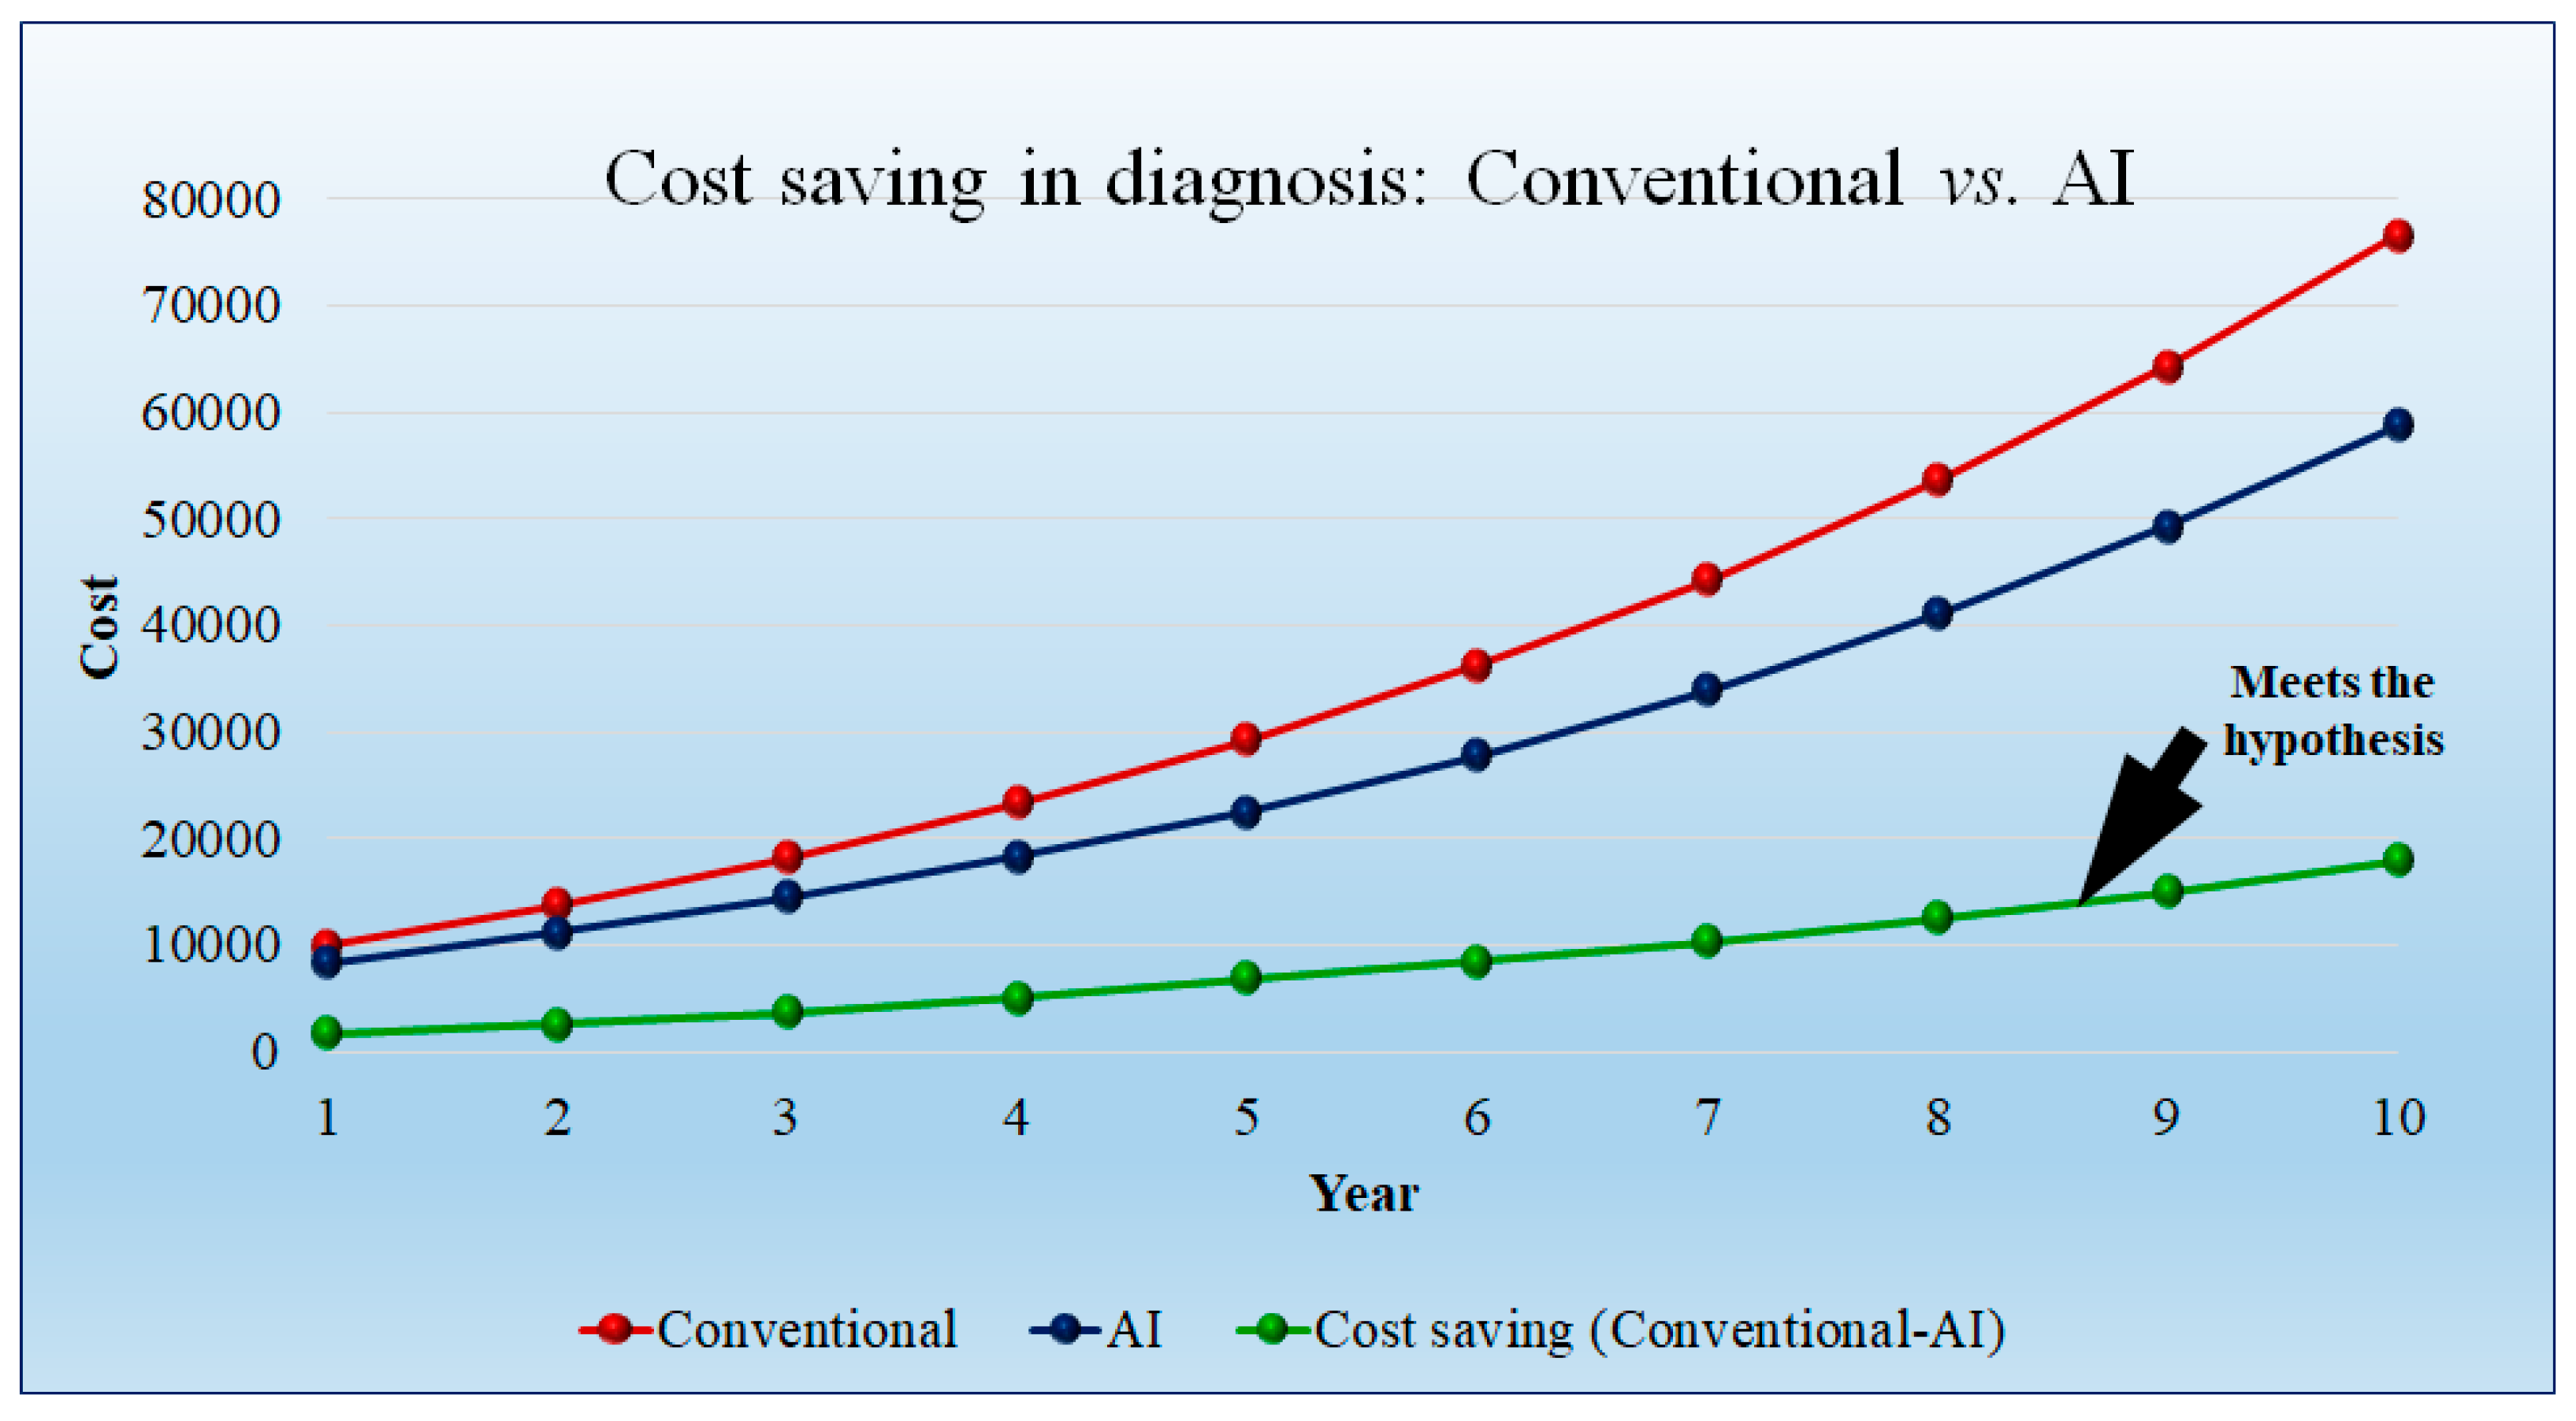
| Physician charges per day in USD | 10,000 | 13,750 | 18,150 | 23,292.5 | 29,282 | 36,236.48 | 44,289.03 | 53,589.72 | 64,307.66 | 76,633.3 | |
| Physician Charges per year per hospital | 3,650,000 | 5,018,750 | 6,624,750 | 8,501,763 | 10,687,930 | 13,226,313 | 16,165,494 | 19,560,248 | 23,472,297 | 27,971,154 | |
| AI-based Method | |||||||||||
| Physician charges per hour in USD | 500 | 500 | 550 | 605 | 665.5 | 732.05 | 805.255 | 885.7805 | 974.3586 | 1071.794 | 1178.974 |
| AI-based system time (minutes) per day | 60 | 1000 | 1225 | 1440 | 1645 | 1840 | 2070 | 2300 | 2530 | 2760 | 2990 |
| AI-based system time in (hours) per day | 1 | 16.66667 | 20.41667 | 24 | 27.41667 | 30.66667 | 34.5 | 38.33333 | 42.16667 | 46 | 49.83333 |
| Physician charges per day in USD | 8333.333 | 11,229.17 | 14,520 | 18,245.79 | 22,449.53 | 27,781.3 | 33,954.92 | 41,085.45 | 49,302.54 | 58,752.2 | |
| Physician charges per year per hospital in USD | 3,041,667 | 4,098,646 | 52,99,800 | 6,659,714 | 8,194,080 | 10,140,174 | 12,393,545 | 14,996,190 | 17,995,428 | 21,444,552 | |
| Difference (Conventional–AI) | |||||||||||
| Saving in time (minutes) per day | 200 | 275 | 360 | 455 | 560 | 630 | 700 | 770 | 840 | 910 | |
| Saving in time (hours) per day | 3.333333 | 4.583333 | 6 | 7.583333 | 9.333333 | 10.5 | 11.66667 | 12.83333 | 14 | 15.16667 | |
| Saving in Physician charges per day in USD | 1666.667 | 2520.833 | 3630 | 5046.708 | 6832.467 | 8455.178 | 10,334.11 | 12,504.27 | 15,005.12 | 17,881.1 | |
| Saving in Physician charges per year per hospital in USD | 608,333.3 | 920,104.2 | 1,324,950 | 1,842,049 | 2,493,850 | 3,086,140 | 3,771,949 | 4,564,058 | 5,476,869 | 6,526,603 | |
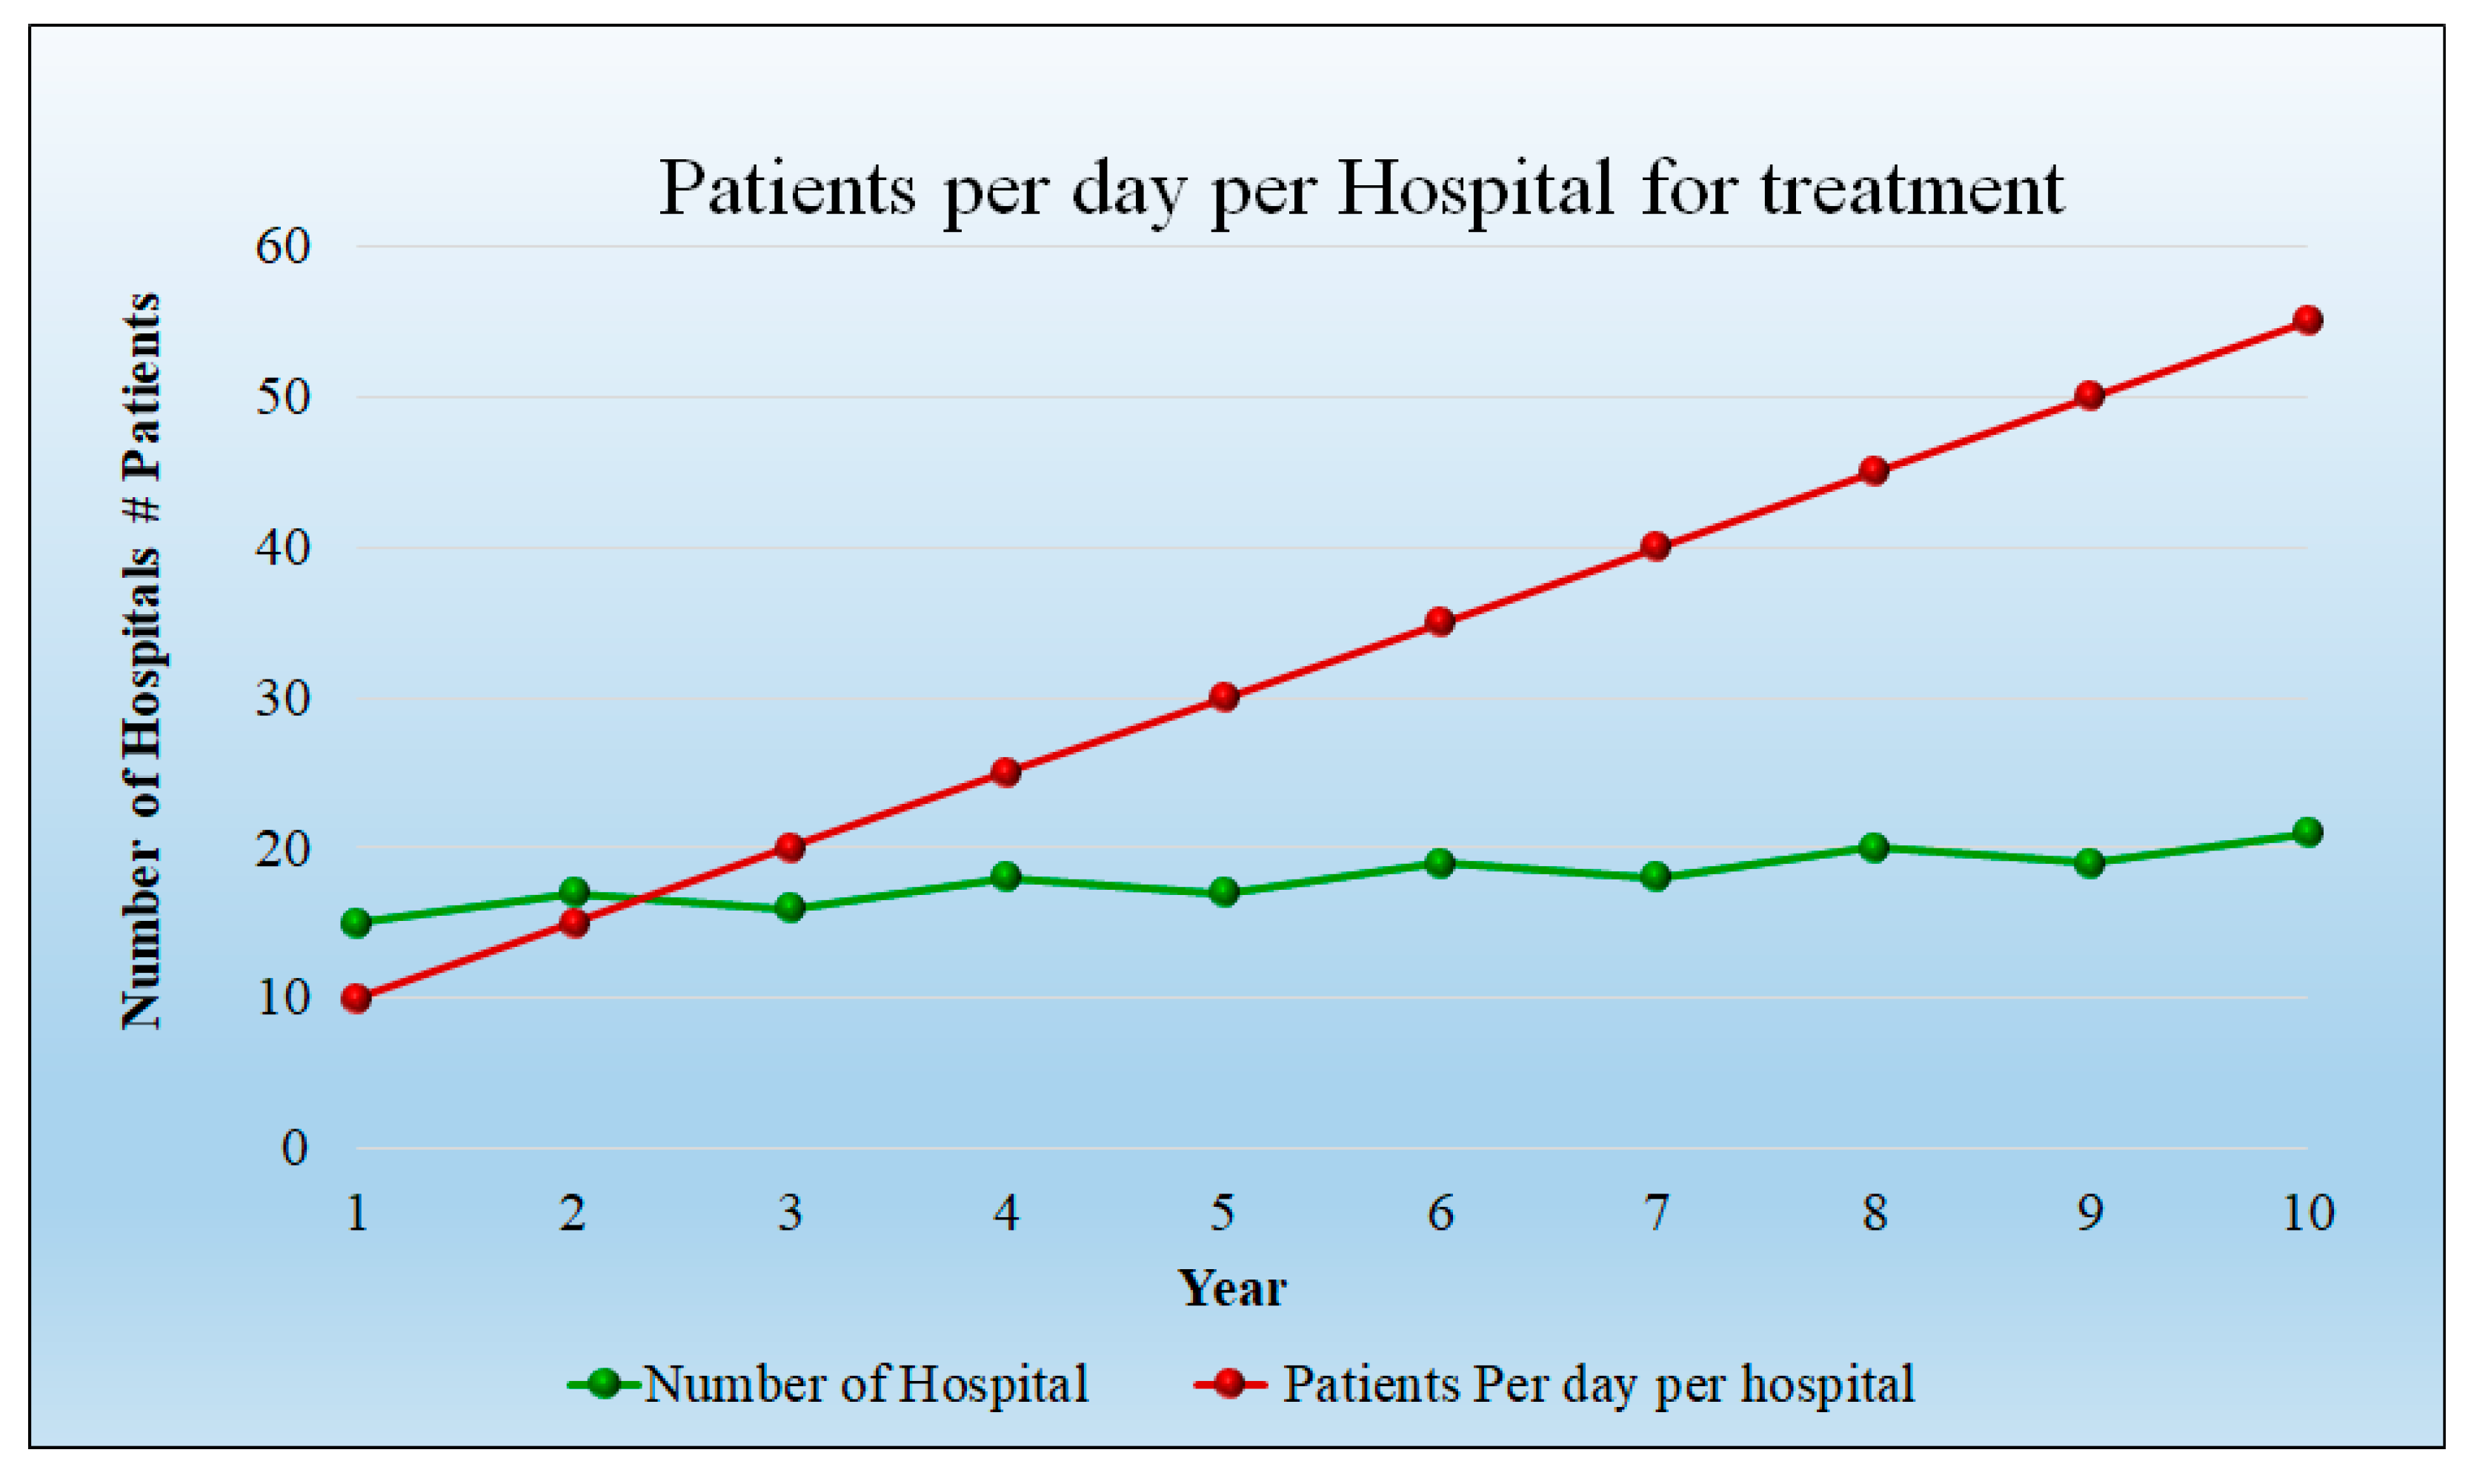
| Categories | Count | Year | |||||||||
|---|---|---|---|---|---|---|---|---|---|---|---|
| 1 | 2 | 3 | 4 | 5 | 6 | 7 | 8 | 9 | 10 | ||
| Patient Size per hospital per year | 3650 | 3650 | 5475 | 7300 | 9125 | 10,950 | 12,775 | 14,600 | 16,425 | 18,250 | 20,075 |
| No. of Hospital | 20 | 15 | 17 | 16 | 18 | 17 | 19 | 18 | 20 | 19 | 21 |
| Per day Patient Per hospital | 20 | 10 | 15 | 20 | 25 | 30 | 35 | 40 | 45 | 50 | 55 |
| Total patient | 73,000 | 547,500 | 1,396,125 | 2,336,000 | 4,106,250 | 5,584,500 | 8,495,375 | 10,512,000 | 14,782,500 | 17,337,500 | 23,186,625 |
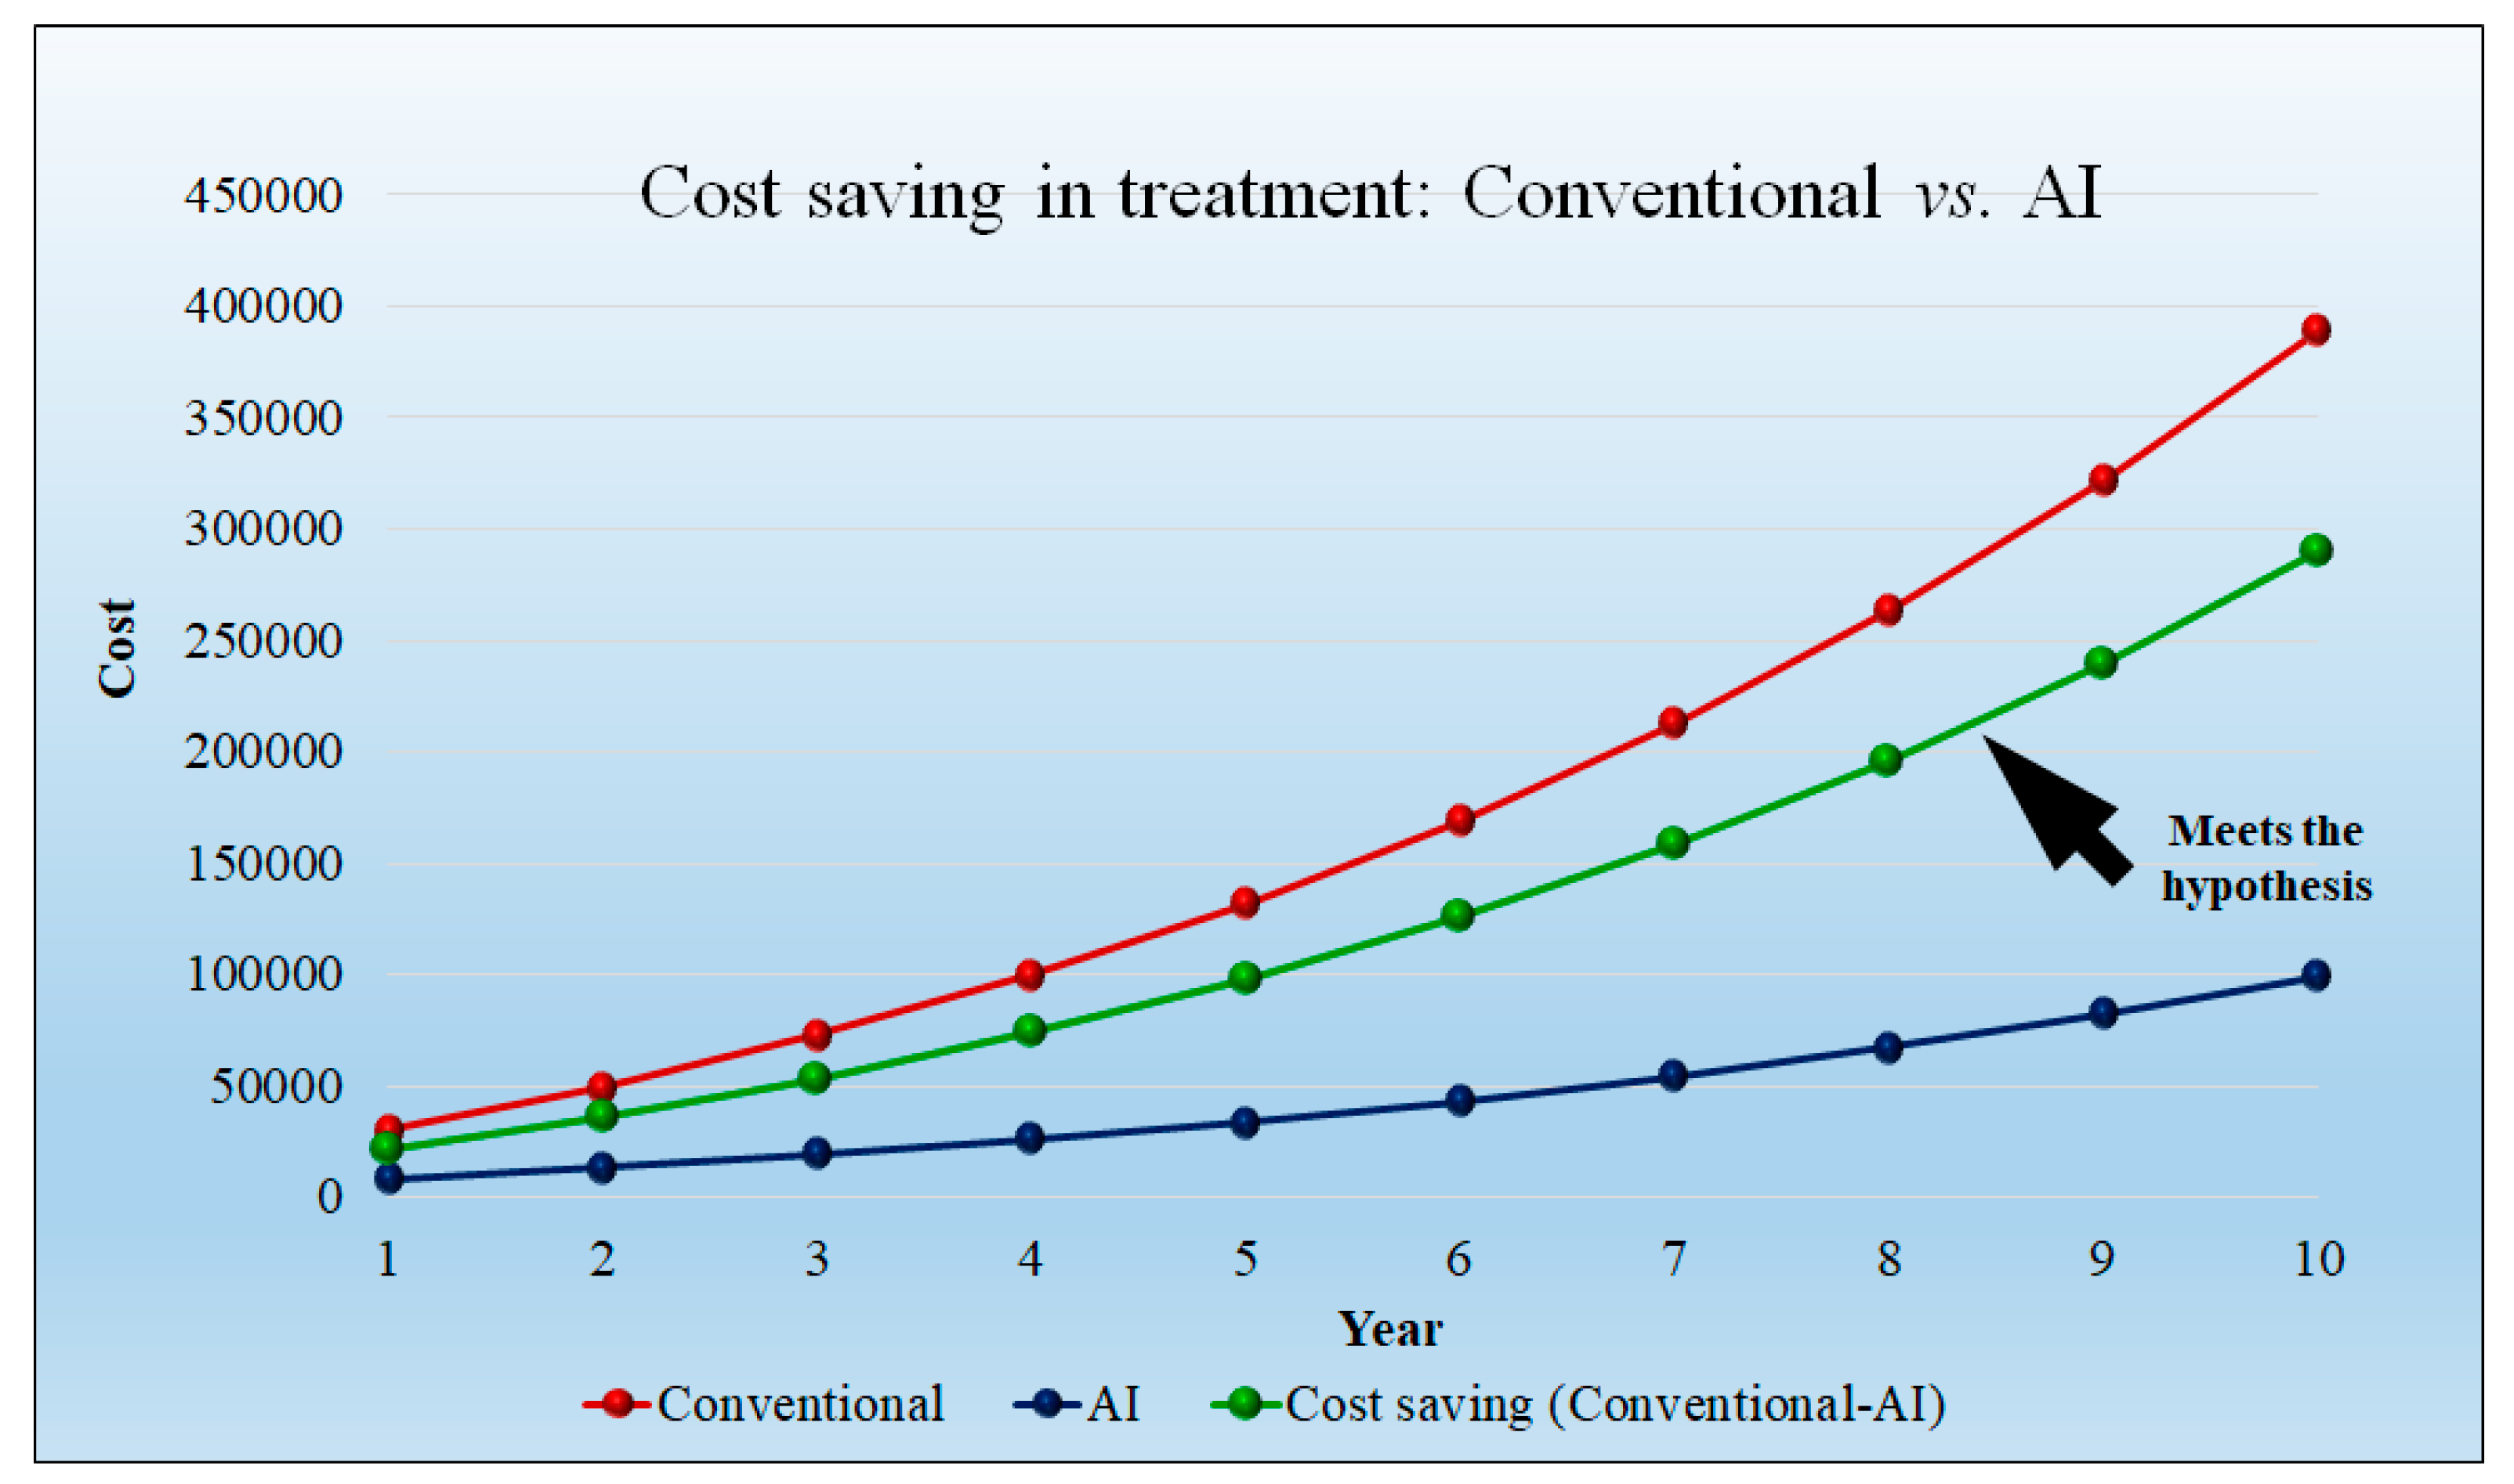
| Conventional Method | |||||||||||
| Physician charges per hour | 1000 | 1000 | 1100 | 1210 | 1331 | 1464.1 | 1610.51 | 1771.561 | 1948.7171 | 2143.58881 | 2357.947691 |
| Conventional method time (minutes) per day | 180 | 1800 | 2700 | 3600 | 4500 | 5400 | 6300 | 7200 | 8100 | 9000 | 9900 |
| Conventional method time (hours) per day | 3 | 30 | 45 | 60 | 75 | 90 | 105 | 120 | 135 | 150 | 165 |
| Physician charges per day in USD | 30,000 | 49,500 | 72,600 | 99,825 | 131,769 | 169,103.55 | 212,587.32 | 263,076.80 | 321,538.32 | 389,061.36 | |
| Physician Charges per year per hospital | 10,950,000 | 18,067,500 | 26,499,000 | 36,436,125 | 48,095,685 | 61,722,795.75 | 77,594,371.8 | 96,023,035.1 | 117,361,487.3 | 142,007,399.7 | |
| AI-based Method | |||||||||||
| Physician charges per hour in USD | 1000 | 1000 | 1100 | 1210 | 1331 | 1464.1 | 1610.51 | 1771.56 | 1948.71 | 2143.58 | 2357.94 |
| AI-based system time (minutes) per day | 90 | 500 | 735 | 960 | 1175 | 1380 | 1610 | 1840 | 2070 | 2300 | 2530 |
| AI-based system time in (hours) per day | 1.3 | 8.33 | 12.25 | 16 | 19.58 | 23 | 26.83 | 30.66666667 | 34.5 | 38.33 | 42.16 |
| Physician charges per day in USD | 8333.33 | 13,475 | 19,360 | 26,065.41 | 33,674.3 | 43,215.35 | 54,327.87067 | 67,230.73 | 82,170.90438 | 99,426.79 | |
| Physician charges per year per hospital in USD | 3,041,666.66 | 4,918,375 | 7,066,400 | 9,513,877.08 | 1,229,1119.5 | 1,577,3603.36 | 19,829,672.79 | 24,539,220.08 | 29,992,380.1 | 36,290,779.92 | |
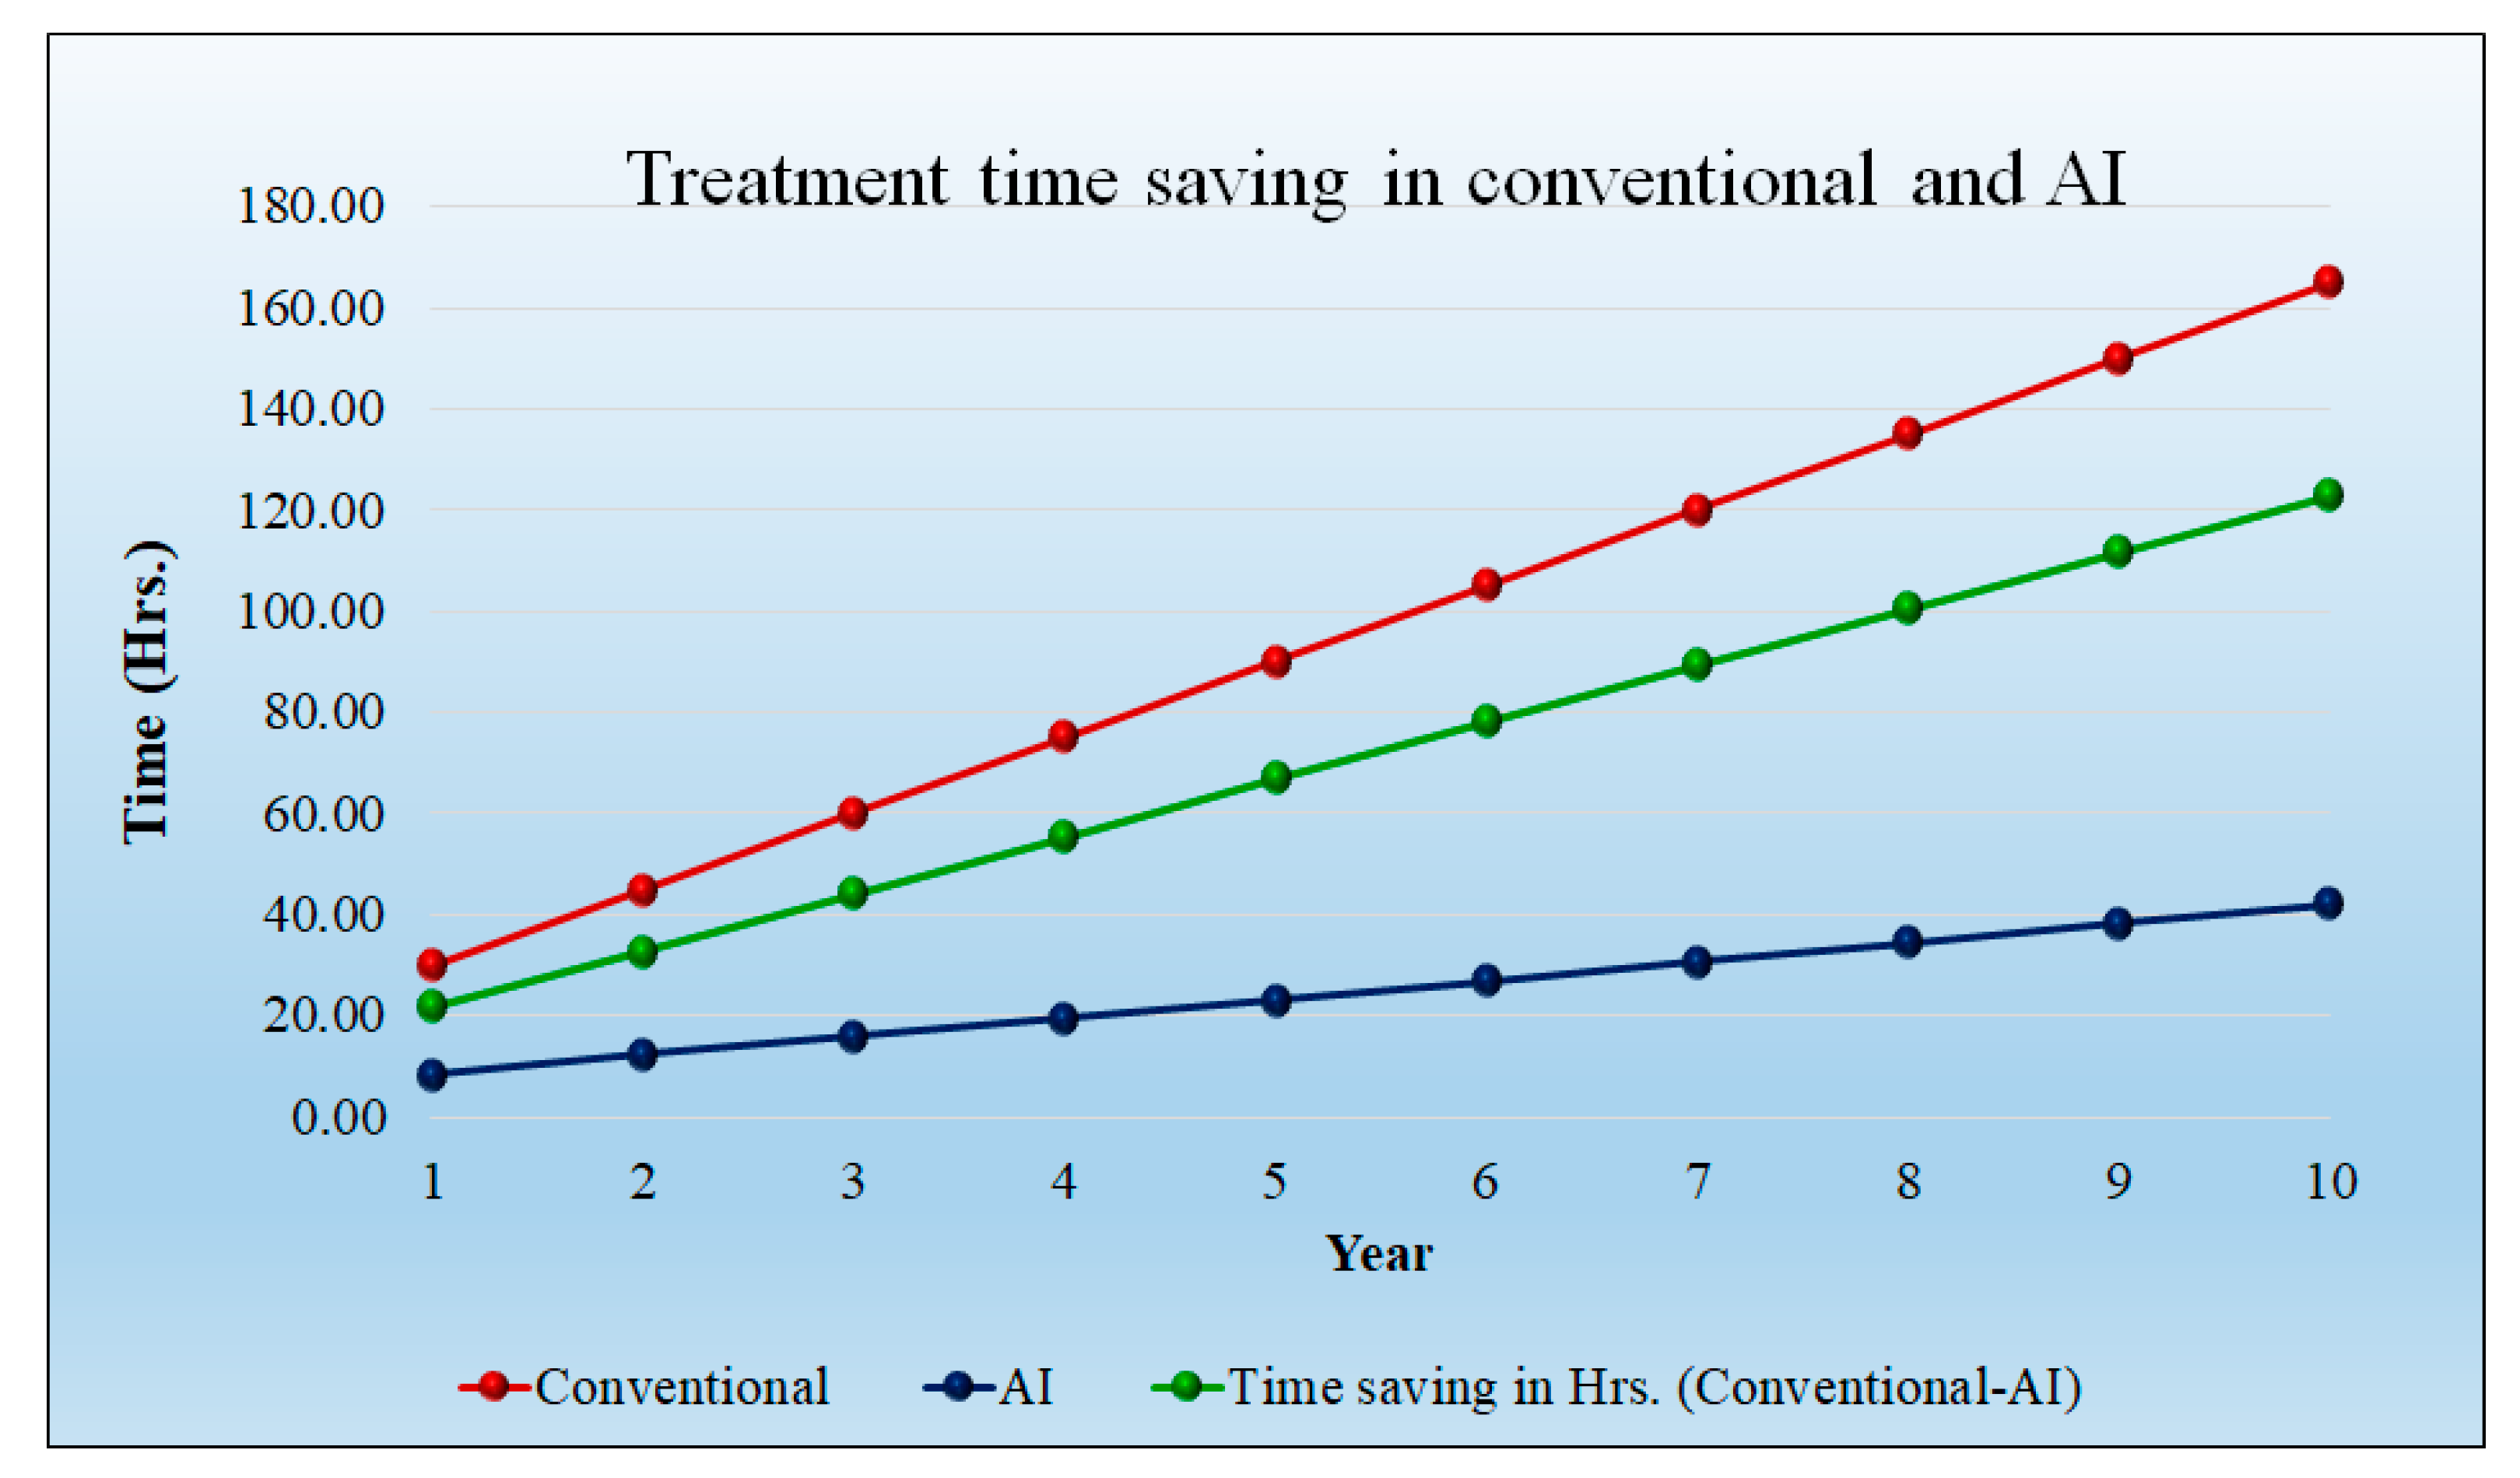
| Difference (Conventional–AI) | |||||||||||
| Saving in time (minutes) per day | 1300 | 1965 | 2640 | 3325 | 4020 | 4690 | 5360 | 6030 | 6700 | 7370 | |
| Saving in time (hours) per day | 21.66 | 32.75 | 44 | 55.41 | 67 | 78.16 | 89.33 | 100.5 | 111.66 | 122.83 | |
| Saving in Physician charges per day in USD | 21,666.66 | 36,025 | 53,240 | 73,759.58 | 98,094.7 | 125,888.19 | 158,259.44 | 195,846.068 | 239,367.41 | 289,634.57 | |
| Saving in Physician charges per year per hospital in USD | 7,908,333.33 | 131,49,125 | 19,432,600 | 26,922,247.92 | 35,804,565.5 | 45,949,192.39 | 57,764,699.01 | 71,483,815.02 | 87,369,107.25 | 105,716,619.8 | |
| SN | Category | Content |
|---|---|---|
| X1 | Data collection | Patient size per hospital |
| Enrollment cost per patient | ||
| X2 | Engineering R&D cost | Data verification |
| Data validation | ||
| Scientific algorithms | ||
| Graphical user interface (design) | ||
| Cloud/storage | ||
| Software technology updation | ||
| Hardware technology updation | ||
| Prototype testing | ||
| Maintenance and support | ||
| X3 | Human resource cost | ML scientist |
| DL scientist | ||
| Verification and validation scientist | ||
| Clinical scientist | ||
| Database engineer | ||
| Graphical user interface engineer | ||
| System administrator | ||
| Cloud engineer | ||
| Marketing professional | ||
| Secretary | ||
| X4 | Commercialization cost | FDA 5K approval |
| Regulatory costs of various countries | ||
| Release cost | ||
| X5 | Marketing cost | Marketing |
| Technical marketing | ||
| Installation | ||
| X6 | Infrastructure cost | Office space |
| Furniture | ||
| Hardware | ||
| Software | ||
| Electricity |
References
- Unwin, H.J.; Hillis, S.; Cluver, L.; Flaxman, S.; Goldman, P.S.; Butchart, A.; Bachman, G.; Rawlings, L.; Donnelly, C.A.; Ratmann, O. Global, regional, and national minimum estimates of children affected by COVID-19-associated orphanhood and caregiver death, by age and family circumstance up to Oct 31, 2021: An updated modelling study. Lancet Child Adolesc. Health 2022, 6, 249–259. [Google Scholar] [CrossRef] [PubMed]
- Bollyky, T.J.; Hulland, E.N.; Barber, R.M.; Collins, J.K.; Kiernan, S.; Moses, M.; Pigott, D.M.; Jr, R.C.R.; Sorensen, R.J.; Abbafati, C. Pandemic preparedness and COVID-19: An exploratory analysis of infection and fatality rates, and contextual factors associated with preparedness in 177 countries, from Jan 1, 2020, to Sept 30, 2021. Lancet 2022, 399, 1489–1512. [Google Scholar] [CrossRef] [PubMed]
- Bedir, S. Healthcare expenditure and economic growth in developing countries. J. Adv. Econ. Bus. 2016, 4, 76–86. [Google Scholar] [CrossRef] [Green Version]
- Zhang, P.; Zhang, X.; Brown, J.; Vistisen, D.; Sicree, R.; Shaw, J.; Nichols, G. Global healthcare expenditure on diabetes for 2010 and 2030. J. Diabetes Res. Clin. Pract. 2010, 87, 293–301. [Google Scholar] [CrossRef] [PubMed]
- Ishii-Rousseau, J.E.; Seino, S.; Ebner, D.K.; Vareth, M.; Po, M.J.; Celi, L.A. The “Ecosystem as a Service (EaaS)” approach to advance clinical artificial intelligence (cAI). J. PLoS Digit. Health 2022, 1, e0000011. [Google Scholar] [CrossRef]
- Al-Hassany, L.; Goadsby, P.J.; Danser, A.J.; MaassenVanDenBrink, A. Calcitonin gene-related peptide-targeting drugs for migraine: How pharmacology might inform treatment decisions. Lancet Neurol. 2022, 21, 284–294. [Google Scholar] [CrossRef]
- Salmon, J.W. Defining health and reorganizing medicine. J. Altern. Med. 2022, 103, 252–288. [Google Scholar]
- Saba, L.; Biswas, M.; Kuppili, V.; Godia, E.C.; Suri, H.S.; Edla, D.R.; Omerzu, T.; Laird, J.R.; Khanna, N.N.; Mavrogeni, S. The present and future of deep learning in radiology. J. Eur. J. Radiol. 2019, 114, 14–24. [Google Scholar] [CrossRef]
- Biswas, M.; Kuppili, V.; Saba, L.; Edla, D.R.; Suri, H.S.; Cuadrado-Godia, E.; Laird, J.; Marinhoe, R.; Sanches, J.; Nicolaides, A. State-of-the-art review on deep learning in medical imaging. Front. Biosci. Landmark Ed 2019, 24, 392–426. [Google Scholar]
- Joyia, G.J.; Liaqat, R.M.; Farooq, A.; Rehman, S. Internet of medical things (IoMT): Applications, benefits and future challenges in healthcare domain. J. Commun. 2017, 12, 240–247. [Google Scholar] [CrossRef] [Green Version]
- Suri, J.S. Mind of An Innovator. Stalk. Artic. 2022, 1, 1. [Google Scholar]
- Saxena, S.; Jena, B.; Gupta, N.; Das, S.; Sarmah, D.; Bhattacharya, P.; Nath, T.; Paul, S.; Fouda, M.M.; Kalra, M. Role of Artificial Intelligence in Radiogenomics for Cancers in the Era of Precision Medicine. J. Cancers 2022, 14, 2860. [Google Scholar] [CrossRef] [PubMed]
- Jena, B.; Saxena, S.; Nayak, G.K.; Balestrieri, A.; Gupta, N.; Khanna, N.N.; Laird, J.R.; Kalra, M.K.; Fouda, M.M.; Brain, L.S. Tumor Characterization Using Radiogenomics in Artificial Intelligence Framework. J. Cancers 2022, 14, 4052. [Google Scholar] [CrossRef]
- Khanna, N.N.; Maindarkar, M.; Saxena, A.; Ahluwalia, P.; Paul, S.; Srivastava, S.K.; Cuadrado-Godia, E.; Sharma, A.; Omerzu, T.; Saba, L. Cardiovascular/Stroke Risk Assessment in Patients with Erectile Dysfunction—A Role of Carotid Wall Arterial Imaging and Plaque Tissue Characterization Using Artificial Intelligence Paradigm: A Narrative Review. J. Diagn. 2022, 12, 1249. [Google Scholar] [CrossRef] [PubMed]
- Johri, A.M.; Mantella, L.E.; Jamthikar, A.D.; Saba, L.; Suri, J.S. Artificial Intelligence-based Survival Analysis and Coronary Artery Disease Prediction using a combination of Carotid B-model Image Phenotypes and Intraplaque Neovascularization. Int. J. Cardiovasc. Imaging 2021, 112–121, 2021. [Google Scholar]
- Suri, J.S.; Bhagawati, M.; Paul, S.; Protogerou, A.D.; Sfikakis, P.P.; Kitas, G.D.; Khanna, N.N.; Ruzsa, Z.; Sharma, A.M.; Saxena, S. A Powerful Paradigm for Cardiovascular Risk Stratification Using Multiclass, Multi-Label, and Ensemble-Based Machine Learning Paradigms: A Narrative Review. J. Diagn. 2022, 12, 722. [Google Scholar] [CrossRef]
- Agrawal, A.; Gans, J.; Goldfarb, A. Economic policy for artificial intelligence. J. Innov. Policy Econ. 2019, 19, 139–159. [Google Scholar] [CrossRef]
- Tuckson, R.V.; Edmunds, M.; Hodgkins, M.L. Telehealth. J. N. Engl. J. Med. 2017, 377, 1585–1592. [Google Scholar] [CrossRef]
- Fotiadis, D.I.; Glaros, C.; Likas, A. Wearable medical devices. In Wiley Encyclopedia of Biomedical Engineering; Wiley: Hoboken, NJ, USA, 2006. [Google Scholar]
- Antor, M.B.; Jamil, A.; Mamtaz, M.; Khan, M.M.; Aljahdali, S.; Kaur, M.; Singh, P.; Masud, M. A Comparative Analysis of Machine Learning Algorithms to Predict Alzheimer’s Disease. J. Healthc. Eng. 2021, 2021, 9917919. [Google Scholar]
- Hemapriya, D.; Viswanath, P.; Mithra, V.; Nagalakshmi, S.; Umarani, G. Wearable medical devices—Design challenges and issues. In Proceedings of the 2017 International Conference on Innovations in Green Energy and Healthcare Technologies (IGEHT), Coimbatore, India, 16–18 March 2017; IEEE: New York, NY, USA, 2017; pp. 1–6. [Google Scholar]
- Jiang, N.; Mück, J.E.; Yetisen, A.K. The regulation of wearable medical devices. J. Trends Biotechnol. 2020, 38, 129–133. [Google Scholar] [CrossRef]
- El-Baz, A.; Suri, J.S. Machine Learning in Medicine—Chapman & Hall/CRC Healthcare Informatics Series; CRC Press: Boca Raton, FL, USA, 2021. [Google Scholar]
- El-Baz, A.; Suri, J.S. Big Data in Multimodal Medical Imaging; CRC Press: Boca Raton, FL, USA, 2019. [Google Scholar]
- Goldstein, B.A.; Navar, A.M.; Carter, R.E. Moving beyond regression techniques in cardiovascular risk prediction: Applying machine learning to address analytic challenges. Eur. Heart J. 2016, 38, 1805–1814. [Google Scholar] [CrossRef] [PubMed] [Green Version]
- Ming, C.; Viassolo, V.; Probst-Hensch, N.; Chappuis, P.O.; Dinov, I.D.; Katapodi, M.C. Machine learning techniques for personalized breast cancer risk prediction: Comparison with the BCRAT and BOADICEA models. J. Breast Cancer Res. 2019, 21, 75. [Google Scholar] [CrossRef] [PubMed] [Green Version]
- Skandha, S.S.; Gupta, S.K.; Saba, L.; Koppula, V.K.; Johri, A.M.; Khanna, N.N.; Mavrogeni, S.; Laird, J.R.; Pareek, G.; Miner, M. 3-D optimized classification and characterization artificial intelligence paradigm for cardiovascular/stroke risk stratification using carotid ultrasound-based delineated plaque: Atheromatic™ 2.0. Comput. Biol. Med. 2020, 125, 103–114. [Google Scholar] [CrossRef]
- Acharya, U.R.; Faust, O.; Alvin, A.; Krishnamurthi, G.; Seabra, J.C.; Sanches, J.; Suri, J.S. Understanding symptomatology of atherosclerotic plaque by image-based tissue characterization. J. Comput. Methods Programs Biomed. 2013, 110, 66–75. [Google Scholar] [CrossRef] [PubMed]
- Acharya, U.R.; Mookiah, M.R.K.; Sree, S.V.; Yanti, R.; Martis, R.; Saba, L.; Molinari, F.; Guerriero, S.; Suri, J.S. Evolutionary algorithm-based classifier parameter tuning for automatic ovarian cancer tissue characterization and classification. J. Ultraschall Der Med.-Eur. J. Ultrasound 2014, 35, 237–245. [Google Scholar]
- Acharya, U.R.; Mookiah, M.R.K.; Sree, S.V.; Afonso, D.; Sanches, J.; Shafique, S.; Nicolaides, A.; Pedro, L.M.; Fernandes, J.F.e.; Suri, J.S. Atherosclerotic plaque tissue characterization in 2D ultrasound longitudinal carotid scans for automated classification: A paradigm for stroke risk assessment. Med. Biol. Eng. Comput. 2013, 51, 513–523. [Google Scholar] [CrossRef]
- Jamthikar, A.D.; Gupta, D.; Puvvula, A.; Johri, A.M.; Khanna, N.N.; Saba, L.; Mavrogeni, S.; Laird, J.R.; Pareek, G.; Miner, M. Cardiovascular risk assessment in patients with rheumatoid arthritis using carotid ultrasound B-mode imaging. Rheumatol. Int. 2020, 40, 1921–1939. [Google Scholar] [CrossRef] [PubMed]
- Saba, L.; Sanagala, S.S.; Gupta, S.K.; Koppula, V.K.; Johri, A.M.; Khanna, N.N.; Mavrogeni, S.; Laird, J.R.; Pareek, G.; Miner, M. Multimodality carotid plaque tissue characterization and classification in the artificial intelligence paradigm: A narrative review for stroke application. J. Ann. Transl. Med. 2021, 9, 1206. [Google Scholar] [CrossRef]
- Sharma, N.; Saba, L.; Khanna, N.N.; Kalra, M.K.; Fouda, M.M.; Suri, J.S. Segmentation-Based Classification Deep Learning Model Embedded with Explainable AI for COVID-19 Detection in Chest X-ray Scans. J. Diagn. 2022, 12, 2132. [Google Scholar]
- Jain, P.K.; Sharma, N.; Saba, L.; Paraskevas, K.I.; Kalra, M.K.; Johri, A.; Nicolaides, A.N.; Suri, J.S. Automated deep learning-based paradigm for high-risk plaque detection in B-mode common carotid ultrasound scans: An asymptomatic Japanese cohort study. Int. Angiol. A J. Int. Union Angiol. 2021, 41, 9–23. [Google Scholar] [CrossRef]
- Agarwal, M.; Agarwal, S.; Saba, L.; Chabert, G.L.; Gupta, S.; Carriero, A.; Pasche, A.; Danna, P.; Mehmedovic, A.; Faa, G.; et al. Eight Pruning Deep Learning Models for Low Storage and High-Speed COVID-19 Computed Tomography Lung Segmentation and Heatmap-based Lesion Localization: A Multicenter study using COVLIAS 2.0. Comput. Biol. Med. 2022, 2022, 105571. [Google Scholar] [CrossRef] [PubMed]
- Suri, J.S.; Agarwal, S.; Chabert, G.L.; Carriero, A.; Paschè, A.; Danna, P.S.C.; Saba, L.; Mehmedović, A.; Faa, G.; Singh, I.M.; et al. COVLIAS 1.0Lesion vs. MedSeg: An Artificial Intelligence Framework for Automated Lesion Segmentation in COVID-19 Lung Computed Tomography Scans. Diagnostics 2022, 12, 1283. [Google Scholar] [CrossRef] [PubMed]
- Suri, J.S.; Agarwal, S.; Carriero, A.; Paschè, A.; Danna, P.S.; Columbu, M.; Saba, L.; Viskovic, K.; Mehmedović, A.; Agarwal, S. COVLIAS 1.0 vs. MedSeg: Artificial Intelligence-Based Comparative Study for Automated COVID-19 Computed Tomography Lung Segmentation in Italian and Croatian Cohorts. Diagnostics 2021, 11, 2367. [Google Scholar] [CrossRef]
- Biswas, M.; Saba, L.; Omerzu, T.; Johri, A.M.; Khanna, N.N.; Viskovic, K.; Mavrogeni, S.; Laird, J.R.; Pareek, G.; Miner, M. A review on joint carotid intima-media thickness and plaque area measurement in ultrasound for cardiovascular/stroke risk monitoring: Artificial intelligence framework. J. Digit. Imaging 2021, 34, 581–604. [Google Scholar] [CrossRef]
- Chalakkal, R.; Hafiz, F.; Abdulla, W.; Swain, A. An efficient framework for automated screening of clinically significant macular edema. Comput. Biol. Med. 2021, 130, 104128. [Google Scholar] [CrossRef] [PubMed]
- Karbhari, Y.; Basu, A.; Geem, Z.W.; Han, G.-T.; Sarkar, R. Generation of synthetic chest X-ray images and detection of COVID-19: A deep learning based approach. J. Diagn. 2021, 11, 895. [Google Scholar] [CrossRef]
- Rim, T.H.; Lee, C.J.; Tham, Y.-C.; Cheung, N.; Yu, M.; Lee, G.; Kim, Y.; Ting, D.S.; Chong, C.C.Y.; Choi, Y.S. Deep-learning-based cardiovascular risk stratification using coronary artery calcium scores predicted from retinal photographs. Lancet Digit. Health Vol. 2021, 3, e306–e316. [Google Scholar] [CrossRef]
- Cheung, C.Y.; Xu, D.; Cheng, C.-Y.; Sabanayagam, C.; Tham, Y.-C.; Yu, M.; Rim, T.H.; Chai, C.Y.; Gopinath, B.; Mitchell, P. A deep-learning system for the assessment of cardiovascular disease risk via the measurement of retinal-vessel calibre. Nat. Biomed. Eng. 2021, 5, 498–508. [Google Scholar] [CrossRef]
- Nielsen, K.B.; Lautrup, M.L.; Andersen, J.K.; Savarimuthu, T.R.; Grauslund, J. Deep learning–based algorithms in screening of diabetic retinopathy: A systematic review of diagnostic performance. Ophthalmol. Retin. 2019, 3, 294–304. [Google Scholar] [CrossRef]
- Chalakkal, R.J. Automatic Retinal Image Analysis to Triage Retinal Pathologies. Ph.D. Thesis, University of Auckland, Auckland, New Zealand, 2019. [Google Scholar]
- Gayathri, S.; Gopi, V.P.; Palanisamy, P. Diabetic retinopathy classification based on multipath CNN and machine learning classifiers. Phys. Eng. Sci. Med. 2021, 44, 639–653. [Google Scholar] [CrossRef]
- Dashtipour, K.; Taylor, W.; Ansari, S.; Zahid, A.; Gogate, M.; Ahmad, J.; Assaleh, K.; Arshad, K.; Imran, M.A.; Abbai, Q. Detecting Alzheimer’s Disease Using Machine Learning Methods. In EAI; Springer: Cham, Switzerland, 2021. [Google Scholar]
- Li, J.-P.O.; Liu, H.; Ting, D.S.; Jeon, S.; Chan, R.P.; Kim, J.E.; Sim, D.A.; Thomas, P.B.; Lin, H.; Chen, Y. Digital technology, tele-medicine and artificial intelligence in ophthalmology: A global perspective. J. Prog. Retin. Eye Res. 2021, 82, 100900. [Google Scholar] [CrossRef] [PubMed]
- Khanna, N.N.; Jamthikar, A.D.; Gupta, D.; Nicolaides, A.; Araki, T.; Saba, L.; Cuadrado-Godia, E.; Sharma, A.; Omerzu, T.; Suri, H.S.; et al. Performance evaluation of 10-year ultrasound image-based stroke/cardiovascular (CV) risk calculator by comparing against ten conventional CV risk calculators: A diabetic study. Comput. Biol. Med. 2019, 105, 125–143. (In English) [Google Scholar] [CrossRef]
- Molinari, F.; Liboni, W.; Giustetto, P.; Badalamenti, S.; Suri, J.S. Automatic computer-based tracings (ACT) in longitudinal 2-D ultrasound images using different scanners. J. Mech. Med. Biol. 2009, 9, 481–505. [Google Scholar] [CrossRef]
- Tamang, H.K.; Timilsina, U.; Singh, K.P.; Shrestha, S.; Raman, R.K.; Panta, P.; Karna, P.; Khadka, L.; Dahal, C. Apo B/Apo AI ratio is statistically a better predictor of cardiovascular disease (CVD) than conventional lipid profile: A study from Kathmandu Valley, Nepal. J. Clin. Diagn. Res. JCDR 2014, 8, 34. [Google Scholar]
- Väänänen, A.; Haataja, K.; Vehviläinen-Julkunen, K.; Toivanen, P. AI in healthcare: A narrative review. J. Fres. 2021, 10, 6. [Google Scholar]
- Shaheen, M.Y. Applications of Artificial Intelligence (AI) in healthcare: A review. J. Sci. Prepr. 2021. [Google Scholar] [CrossRef]
- Elsayed, M.; Erol-Kantarci, M. AI-enabled future wireless networks: Challenges, opportunities, and open issues. J. IEEE Veh. Technol. Mag. 2019, 14, 70–77. [Google Scholar] [CrossRef]
- Saba, L.; Antignani, P.L.; Gupta, A.; Cau, R.; Paraskevas, K.I.; Poredos, P.; Wasserman, B.; Kamel, H.; Avgerinos, E.D.; Salgado, R. International Union of Angiology (IUA) consensus paper on imaging strategies in atherosclerotic carotid artery imaging: From basic strategies to advanced approaches. J. Atheroscler. 2022, 354, 23–40. [Google Scholar] [CrossRef]
- Avnimelech, G.; Teubal, M. Venture capital start-up co-evolution and the emergence & development of Israel’s new high tech cluster: Part 1: Macro-background and industry analysis. J. Econ. Innov. New Technol. 2004, 13, 33–60. [Google Scholar]
- Tschider, C.A. Medical Device Artificial Intelligence: The New Tort Frontier. J. BYU L. Rev. 2020, 46, 1551. [Google Scholar]
- Mesquita, P.N.; Maia, J.M.C.; Andrade, S.R.d.; Bandeira, F. Postmenopausal Osteoporosis. J. Endocrinol. Diabetes A Probl. Oriented Approach 2022, 257. [Google Scholar]
- Hair, J.F.; Page, M.; Brunsveld, N. Essentials of Business Research Methods; Routledge: London, UK, 2019. [Google Scholar]
- Shaheen, M.Y. AI in Healthcare: Medical and socio-economic benefits and challenges. J. Sci. Prepr. 2021. [Google Scholar] [CrossRef]
- Dick, R.S.; Steen, E.B.; Detmer, D.E. The Computer-Based Patient Record: An Essential Technology for Health Care; National Academies Press: Washington, DC, USA, 1997; pp. 112–123. [Google Scholar]
- Paraskevas, K.I.; Suri, J.S.; Saba, L.; Mikhailidis, D.P. Combination Therapy with Ezetimibe: An Alternative Strategy to Statin Monotherapy in the Management of Patients with Non-Cardiac Vascular Disease. Curr. Vasc. Pharmacol. 2022. online ahead of print. [Google Scholar] [CrossRef]
- Bennett, C.C.; Hauser, K. Artificial intelligence framework for simulating clinical decision-making: A Markov decision process approach. J. Artif. Intell. Med. 2013, 57, 9–19. [Google Scholar] [CrossRef] [PubMed] [Green Version]
- Carter, D. How real is the impact of artificial intelligence? The business information survey 2018. J. Bus. Inf. Rev. 2018, 35, 99–115. [Google Scholar] [CrossRef]
- Elkington, J. Green Swans: The Coming Boom in Regenerative Capitalism; Greenleaf Book Group: Austin, TX, USA, 2020. [Google Scholar]
- Chopra, H.; Baig, A.A.; Gautam, R.K.; Kamal, M.A. Application of Artificial intelligence in Drug Discovery. J. Curr. Pharm. Des. 2022, 28, 2690–2703. [Google Scholar]
- Rothstein, J.; Berry, J.; Svendsen, C.; Thompson, L.; Finkbeiner, S.; van Eyk, J.; Fraenkel, E.; Cudkowicz, M.; Maragakis, N.; Sareen, D. Answer ALS: A Large-Scale Resource for Sporadic and Familial ALS Combining Clinical Data with Multi-Omics Data from Induced Pluripotent Cell Lines. Nature Neurosci. 2020, 123, 110. [Google Scholar]
- Al-Shorbaji, N. Improving Healthcare Access through Digital Health: The Use of Information and Communication Technologies. J. Healthc. Access 2021, 125. [Google Scholar] [CrossRef]
- Lemos, J.; Gaspar, P.D.; Lima, T.M. Environmental Risk Assessment and Management in Industry 4.0: A Review of Technologies and Trends. J. Mach. 2022, 10, 702. [Google Scholar] [CrossRef]
- Thibaud, M.; Chi, H.; Zhou, W.; Piramuthu, S. Internet of Things (IoT) in high-risk Environment, Health and Safety (EHS) industries: A comprehensive review. J. Decis. Support Syst. 2018, 108, 79–95. [Google Scholar] [CrossRef]
- Hoshida, Y.; Fuchs, B.C.; Tanabe, K.K. Prevention of hepatocellular carcinoma: Potential targets, experimental models, and clinical challenges. J. Curr. Cancer Drug Targets 2012, 12, 1129–1159. [Google Scholar]
- Aijaz, S.F.; Khan, S.J.; Azim, F.; Shakeel, C.S.; Hassan, U. Deep Learning Application for Effective Classification of Different Types of Psoriasis. J. Healthc. Eng. 2022, 2022, 7541583. [Google Scholar] [CrossRef] [PubMed]
- Shrivastava, V.K.; Londhe, N.D.; Sonawane, R.S.; Suri, J.S. Reliable and accurate psoriasis disease classification in dermatology images using comprehensive feature space in machine learning paradigm. J. Expert Syst. Appl. 2015, 42, 6184–6195. [Google Scholar] [CrossRef]
- Pramanik, M.; Pradhan, R.; Nandy, P.; Qaisar, S.M.; Bhoi, A.K. Assessment of Acoustic Features and Machine Learning for Parkinson’s Detection. J. Healthc. Eng. 2021, 2021, 9957132. [Google Scholar] [CrossRef]
- Liu, Y.; Xue, L.; Zhang, Y.; Xie, A. Association Between Stroke and Parkinson’s Disease: A Meta-analysis. J. Mol. Neurosci. 2020, 70, 1169–1176. [Google Scholar] [CrossRef]
- Qiu, C.; Hu, G.; Kivipelto, M.; Laatikainen, T.; Antikainen, R.; Fratiglioni, L.; Jousilahti, P.; Tuomilehto, J. Association of blood pressure and hypertension with the risk of Parkinson disease: The National FINRISK Study. J. Hypertens. 2011, 57, 1094–1100. [Google Scholar] [CrossRef] [Green Version]
- Scorza, F.A.; Fiorini, A.C.; Scorza, C.A.; Finsterer, J. Cardiac abnormalities in Parkinson’s disease and Parkinsonism. J. Clin. Neurosci. 2018, 53, 1–5. [Google Scholar] [CrossRef]
- Baschi, R.; Luca, A.; Nicoletti, A.; Caccamo, M.; Cicero, C.E.; D’Agate, C.; di Giorgi, L.; la Bianca, G.; Castro, T.L.; Zappia, M. Changes in motor, cognitive, and behavioral symptoms in Parkinson’s disease and mild cognitive impairment during the COVID-19 lockdown. J. Front. Psychiatry 2020, 11, 590134. [Google Scholar] [CrossRef]
- Ferini-Strambi, L.; Salsone, M.J. COVID-19 and neurological disorders: Are neurodegenerative or neuroimmunological diseases more vulnerable? J. Neurol. 2021, 268, 409–419. [Google Scholar] [CrossRef]
- Jamthikar, A.D.; Gupta, D.; Mantella, L.E.; Saba, L.; Laird, J.R.; Johri, A.M.; Suri, J.S. Multiclass machine learning vs. conventional calculators for stroke/CVD risk assessment using carotid plaque predictors with coronary angiography scores as gold standard: A 500 participants study. J. Int. J. Cardiovasc. Imaging 2021, 37, 1171–1187. [Google Scholar] [CrossRef]
- IKakadiaris, A.; Vrigkas, M.; Yen, A.A.; Kuznetsova, T.; Budoff, M.; Naghavi, M. Machine learning outperforms ACC/AHA CVD risk calculator in MESA. J. Am. Heart Assoc. 2018, 7, e009476. [Google Scholar] [CrossRef] [PubMed] [Green Version]
- Acharya, U.R.; Sree, S.V.; Krishnan, M.M.R.; Saba, L.; Molinari, F.; Guerriero, S.; Suri, J.S. Ovarian tumor characterization using 3D ultrasound. J. Technol. Cancer Res. Treat. 2012, 11, 543–552. [Google Scholar] [CrossRef] [PubMed]
- Almazán, M.M.; Pérez, J.M.D.; Pozo, J.F.M.; Granados, A.L.O.; de Fuentes, B.M.; Sanz, P.Q.; Sánchez, A.I.G.; Gómez, P.R.; García, J.M.J.; Rodríguez-Hermida, F.A. A multicentre observational study of the effectiveness, safety and economic impact of nivolumab on non-small-cell lung cancer in real clinical practice. J. Int. J. Clin. Pharm. 2019, 41, 272–279. [Google Scholar] [CrossRef] [PubMed]
- VPrasad; Razia, S.; Sridevi, G. Applications of Machine Learning Andauxiliary Tumor Treatment in the Process of Medical Resource Allocation. J. ECS Trans. 2022, 107, 19949. [Google Scholar] [CrossRef]
- Jamthikar, A.; Gupta, D.; Saba, L.; Khanna, N.N.; Viskovic, K.; Mavrogeni, S.; Laird, J.R.; Sattar, N.; Johri, A.M.; Pareek, G. Artificial intelligence framework for predictive cardiovascular and stroke risk assessment models: A narrative review of integrated approaches using carotid ultrasound. J. Comput. Biol. Med. 2020, 126, 104043. [Google Scholar] [CrossRef]
- Saba, L.; Agarwal, M.; Sanagala, S.S.; Gupta, S.K.; Sinha, G.; Johri, A.; Khanna, N.; Mavrogeni, S.; Laird, J.; Pareek, G. Brain MRI-based Wilson disease tissue classification: An optimised deep transfer learning approach. J. Electron. Lett. 2020, 56, 1395–1398. [Google Scholar] [CrossRef]
- Suri, J.S.; Rangayyan, R.M. Breast Imaging, Mammography, and Computer-Aided Diagnosis of Breast Cancer; SPIE: Bellingham, WA, USA, 2006. [Google Scholar]
- Acharya, U.R.; Faust, O.; Sree, S.V.; Molinari, F.; Garberoglio, R.; Suri, J.S. Cost-effective and non-invasive automated benign & malignant thyroid lesion classification in 3D contrast-enhanced ultrasound using combination of wavelets and textures: A class of ThyroScan™ algorithms. J. Technol. Cancer Res. Treat. 2011, 10, 371–380. [Google Scholar]
- Sanagala, S.S.; Gupta, S.K.; Koppula, V.K.; Agarwal, M. A fast and light weight deep convolution neural network model for cancer disease identification in human Lung(s). In Proceedings of the 2019 18th IEEE International Conference On Machine Learning And Applications (ICMLA), Boca Raton, FL, USA, 16–19 December 2019; IEEE: New York, NY, USA, 2019; pp. 1382–1387. [Google Scholar]
- Suri, J.S.; Paul, S.; Maindarkar, M.A.; Puvvula, A.; Saxena, S.; Saba, L.; Turk, M.; Laird, J.R.; Khanna, N.N.; Viskovic, K.; et al. Cardiovascular/Stroke Risk Stratification in Parkinson’s Disease Patients Using Atherosclerosis Pathway and Artificial Intelligence Paradigm: A Systematic Review. Metabolites 2022, 12, 312. [Google Scholar] [CrossRef]
- Munjral, S.; Maindarkar, M.; Ahluwalia, P.; Puvvula, A.; Jamthikar, A.; Jujaray, T.; Suri, N.; Paul, S.; Pathak, R.; Saba, L. Cardiovascular Risk Stratification in Diabetic Retinopathy via Atherosclerotic Pathway in COVID-19/Non-COVID-19 Frameworks Using Artificial Intelligence Paradigm: A Narrative Review. J Diagn. 2022, 12, 1234. [Google Scholar] [CrossRef]
- Khanna, N.N.; Maindarkar, M.; Puvvula, A.; Paul, S.; Bhagawati, M.; Ahluwalia, P.; Ruzsa, Z.; Sharma, A.; Munjral, S.; Kolluri, R. Vascular Implications of COVID-19: Role of Radiological Imaging, Artificial Intelligence, and Tissue Characterization: A Special Report. J. Cardiovasc. Dev. Dis. 2022, 9, 268. [Google Scholar] [CrossRef]
- Suri, J.S.; Maindarkar, M.A.; Paul, S.; Ahluwalia, P.; Bhagawati, M.; Saba, L.; Faa, G.; Saxena, S.; Singh, I.M.; Chadha, P.S. Deep Learning Paradigm for Cardiovascular Disease/Stroke Risk Stratification in Parkinson’s Disease Affected by COVID-19: A Narrative Review. J. Diagn. 2022, 12, 1543. [Google Scholar] [CrossRef] [PubMed]
- Davenport, T.; Kalakota, R. The potential for artificial intelligence in healthcare. Future Healthc. J. 2019, 6, 94. [Google Scholar] [CrossRef] [PubMed] [Green Version]
- Jamthikar, A.; Gupta, D.; Saba, L.; Khanna, N.N.; Araki, T.; Viskovic, K.; Mavrogeni, S.; Laird, J.R.; Pareek, G.; Miner, M. Cardiovascular/stroke risk predictive calculators: A comparison between statistical and machine learning models. J. Cardiovasc. Diagn. Ther. 2020, 10, 919. [Google Scholar] [CrossRef] [PubMed]
- Kaur, I.; Behl, T.; Aleya, L.; Rahman, H.; Kumar, A.; Arora, S.; Bulbul, I.J. Artificial intelligence as a fundamental tool in management of infectious diseases and its current implementation in COVID-19 pandemic. J. Environ. Sci. Pollut. Res. 2021, 28, 40515–40532. [Google Scholar] [CrossRef]
- Maniruzzaman, M.; Kumar, N.; Abedin, M.M.; Islam, M.S.; Suri, H.S.; El-Baz, A.; Suri, J.S. Comparative approaches for classification of diabetes mellitus data: Machine learning paradigm. Comput. Methods Programs Biomed. 2017, 152, 23–34. [Google Scholar] [CrossRef] [PubMed]
- El-Baz, A.S.; Acharya, R.; Mirmehdi, M.; Suri, J.S. Multi Modality State-of-the-Art Medical Image Segmentation and Registration Methodologies: Volume 1; Springer Science & Business Media: Cham, Switzerland, 2011. [Google Scholar]
- Kuppili, V.; Biswas, M.; Sreekumar, A.; Suri, H.S.; Saba, L.; Edla, D.R.; Marinhoe, R.T.; Sanches, J.M.; Suri, J.S. Extreme learning machine framework for risk stratification of fatty liver disease using ultrasound tissue characterization. J. Med. Syst. 2017, 41, 152. [Google Scholar] [CrossRef]
- Tandel, G.S.; Balestrieri, A.; Jujaray, T.; Khanna, N.N.; Saba, L.; Suri, J.S. Multiclass magnetic resonance imaging brain tumor classification using artificial intelligence paradigm. J. Comput. Biol. Med. 2020, 122, 103804. [Google Scholar] [CrossRef]
- Acharya, R.; Ng, Y.E.; Suri, J.S. Image Modeling of the Human Eye; Artech House: Norwood, MA, USA, 2008. [Google Scholar]
- Viswanathan, V.; Puvvula, A.; Jamthikar, A.D.; Saba, L.; Johri, A.M.; Kotsis, V.; Khanna, N.N.; Dhanjil, S.K.; Majhail, M.; Misra, D.P. Bidirectional link between diabetes mellitus and coronavirus disease 2019 leading to cardiovascular disease: A narrative review. World J. Diabetes 2021, 12, 215–222. [Google Scholar] [CrossRef]
- Biswas, M.; Kuppili, V.; Saba, L.; Edla, D.R.; Suri, H.S.; Sharma, A.; Cuadrado-Godia, E.; Laird, J.R.; Nicolaides, A.; Suri, J.S. Deep learning fully convolution network for lumen characterization in diabetic patients using carotid ultrasound: A tool for stroke risk. J Med. Biol. Eng. Comput. 2019, 57, 543–564. [Google Scholar] [CrossRef]
- Jamthikar, A.; Gupta, D.; Johri, A.M.; Mantella, L.E.; Saba, L.; Suri, J.S. A machine learning framework for risk prediction of multi-label cardiovascular events based on focused carotid plaque B-Mode ultrasound: A Canadian study. J Comput. Biol. Med. 2022, 140, 105102. [Google Scholar] [CrossRef]
- Biswas, M.; Kuppili, V.; Edla, D.R.; Suri, H.S.; Saba, L.; Marinhoe, R.T.; Sanches, J.M.; Suri, J.S. Symtosis: A liver ultrasound tissue characterization and risk stratification in optimized deep learning paradigm. J. Comput. Methods Programs Biomed. 2018, 155, 165–177. [Google Scholar] [CrossRef]
- Acharya, U.R.; Sree, S.V.; Krishnan, M.M.R.; Molinari, F.; Garberoglio, R.; Suri, J.S. Non-invasive automated 3D thyroid lesion classification in ultrasound: A class of ThyroScan™ systems. J. Ultrason. 2012, 52, 508–520. [Google Scholar] [CrossRef] [PubMed]
- Acharya, U.R.; Sree, S.V.; Krishnan, M.M.R.; Molinari, F.; ZieleŸnik, W.; Bardales, R.H.; Witkowska, A.; Suri, J.S. Computer-aided diagnostic system for detection of Hashimoto thyroiditis on ultrasound images from a Polish population. J. Ultrasound Med. 2014, 33, 245–253. [Google Scholar] [CrossRef] [PubMed]
- Liu, K.; Suri, J.S. Automatic Vessel Indentification for Angiographic Screening. U.S. Patent 6,845,260, 18 January 2005. [Google Scholar]
- Acharya, U.R.; Sree, S.V.; Saba, L.; Molinari, F.; Guerriero, S.; Suri, J.S. Ovarian tumor characterization and classification using ultrasound—A new online paradigm. J. Digit. Imaging 2013, 26, 544–553. [Google Scholar] [CrossRef] [Green Version]
- Araki, T.; Ikeda, N.; Shukla, D.; Jain, P.K.; Londhe, N.D.; Shrivastava, V.K.; Banchhor, S.K.; Saba, L.; Nicolaides, A.; Shafique, S. PCA-based polling strategy in machine learning framework for coronary artery disease risk assessment in intravascular ultrasound: A link between carotid and coronary grayscale plaque morphology. Comput. Methods Programs Biomed. 2016, 128, 137–158. [Google Scholar] [CrossRef] [PubMed]
- Acharya, U.R.; Faust, O.; Sree, S.V.; Molinari, F.; Saba, L.; Nicolaides, A.; Suri, J.S. An accurate and generalized approach to plaque characterization in 346 carotid ultrasound scans. IEEE Trans. Instrum. Meas. 2011, 61, 1045–1053. [Google Scholar] [CrossRef]
- Battineni, G.; Chintalapudi, N.; Amenta, F.; Traini, E. A Comprehensive Machine-Learning Model Applied to Magnetic Resonance Imaging (MRI) to Predict Alzheimer’s Disease (AD) in Older Subjects. J. Clin. Med. 2020, 9, 2146. [Google Scholar] [CrossRef]
- Saba, L.; Suri, J.S. Multi-Detector CT Imaging: ABDOMEN, Pelvis, and CAD Applications; CRC Press: Boca Raton, FL, USA, 2013. [Google Scholar]
- JSanches, M.; Laine, A.F.; Suri, J.S. Ultrasound Imaging; Springer: Berlin/Heidelberg, Germany, 2012. [Google Scholar]
- Agarwal, M.; Saba, L.; Gupta, S.K.; Carriero, A.; Falaschi, Z.; Paschè, A.; Danna, P.; El-Baz, A.; Naidu, S.; Suri, J.S. A novel block imaging technique using nine artificial intelligence models for COVID-19 disease classification, characterization and severity measurement in lung computed tomography scans on an Italian cohort. J. Med. Syst. 2021, 45, 28. [Google Scholar] [CrossRef]
- Suri, J.; Agarwal, S.; Gupta, S.K.; Puvvula, A.; Viskovic, K.; Suri, N.; Alizad, A.; El-Baz, A.; Saba, L.; Fatemi, M. Systematic Review of Artificial Intelligence in Acute Respiratory Distress Syndrome for COVID-19 Lung Patients: A Biomedical Imaging Perspective. IEEE J. Biomed. Health Inform. 2021, 25, 4128–4139. [Google Scholar] [CrossRef]
- Suri, J.S.; Puvvula, A.; Biswas, M.; Majhail, M.; Saba, L.; Faa, G.; Singh, I.M.; Oberleitner, R.; Turk, M.; Chadha, P.S. COVID-19 pathways for brain and heart injury in comorbidity patients: A role of medical imaging and artificial intelligence-based COVID severity classification: A review. Comput. Biol. 2020, 124, 103960. [Google Scholar] [CrossRef]
- Suri, J.S.; Puvvula, A.; Majhail, M.; Biswas, M.; Jamthikar, A.D.; Saba, L.; Faa, G.; Singh, I.M.; Oberleitner, R.; Turk, M.; et al. Integration of cardiovascular risk assessment with COVID-19 using artificial intelligence. Rev. Cardiovasc. Med. 2020, 21, 541–560. (In English) [Google Scholar] [PubMed]
- Jamthikar, A.D.; Gupta, D.; Johri, A.M.; Mantella, L.E.; Saba, L.; Kolluri, R.; Sharma, A.M.; Viswanathan, V.; Nicolaides, A.; Suri, J.S. Low-cost office-based cardiovascular risk stratification using machine learning and focused carotid ultrasound in an Asian-Indian cohort. J. Med. Syst. 2020, 44, 1–15. [Google Scholar] [CrossRef] [PubMed]
- Khan; Urooj, M.; Zuriat-e-Zehra Ali, S.; Ishtiaq, A.; Habib, K.; Gul, T.; Samer, A. Classification of Multi-Class Cardiovascular Disorders using Ensemble Classifier and Impulsive Domain Analysis. In Proceedings of the 2021 Mohammad Ali Jinnah University International Conference on Computing (MAJICC), Karachi, Pakistan, 15–17 July 2021; Volume 21, pp. 201–210. [Google Scholar]
- Khanna, N.N.; Jamthikar, A.D.; Araki, T.; Gupta, D.; Piga, M.; Saba, L.; Carcassi, C.; Nicolaides, A.; Laird, J.R.; Suri, H.S.; et al. Nonlinear model for the carotid artery disease 10-year risk prediction by fusing conventional cardiovascular factors to carotid ultrasound image phenotypes: A Japanese diabetes cohort study. Echocardiography 2019, 36, 345–361. [Google Scholar] [CrossRef] [PubMed]
- Khanna, N.N.; Jamthikar, A.D.; Gupta, D.; Araki, T.; Piga, M.; Saba, L.; Carcassi, C.; Nicolaides, A.; Laird, J.R.; Suri, H.S.; et al. Effect of carotid image-based phenotypes on cardiovascular risk calculator: AECRS1. 0. Med. Biol. Eng. Comput. 2019, 57, 1553–1566. [Google Scholar] [CrossRef]
- Lin, M.; Cui, H.; Chen, W.; van Engelen, A.; de Bruijne, M.; Azarpazhooh, M.R.; Sohrevardi, S.M.; Spence, J.D.; Chiu, B. Longitudinal assessment of carotid plaque texture in three-dimensional ultrasound images based on semi-supervised graph-based dimensionality reduction and feature selection. Comput. Biol. Med. 2020, 116, 103586. [Google Scholar] [CrossRef]
- Kim, J.O.; Jeong, Y.S.; Kim, J.H.; Lee, J.W.; Park, D.; Kim, H.S. Machine learning-based cardiovascular disease prediction model: A cohort study on the Korean National Health Insurance Service Health Screening Database. Diagnostics 2021, 11, 943. [Google Scholar] [CrossRef]
- Puvvula, A.; Jamthikar, A.D.; Gupta, D.; Khanna, N.N.; Porcu, M.; Saba, L.; Viskovic, K.; Ajuluchukwu, J.N.; Gupta, A.; Mavrogeni, S. Morphological carotid plaque area is associated with glomerular filtration rate: A study of south asian indian patients with diabetes and chronic kidney disease. J. Angiol. 2020, 71, 520–535. [Google Scholar] [CrossRef]
- Jamthikar, A.; Gupta, D.; Cuadrado-Godia, E.; Puvvula, A.; Khanna, N.N.; Saba, L.; Viskovic, K.; Mavrogeni, S.; Turk, M.; Laird, J.R. Ultrasound-based stroke/cardiovascular risk stratification using Framingham Risk Score and ASCVD Risk Score based on “Integrated Vascular Age” instead of “Chronological Age”: A multi-ethnic study of Asian Indian, Caucasian, and Japanese cohorts. J Cardiovasc. Diagn. Ther. 2020, 10, 939. [Google Scholar] [CrossRef]
- Guo, Y. A New Paradigm of “Real-Time” Stroke Risk Prediction and Integrated Care Management in the Digital Health Era: Innovations Using Machine Learning and Artificial Intelligence Approaches. Thromb. Haemost. 2022, 122, 005–007. [Google Scholar] [CrossRef]
- Hijazi, S.; Page, A.; Kantarci, B.; Soyata, T. Machine learning in cardiac health monitoring and decision support. J. Comput. 2016, 49, 38–48. [Google Scholar] [CrossRef]
- Ruan, W.; He, Y.; Shao, X.; Yang, S.; Li, X.; Ding, J.; Hua, F.; Lian, X. The ability of Micropure® ultrasound technique to identify microcalcifications in carotid plaques. Clin. Neurol. Neurosurg. 2021, 201, 106401. [Google Scholar] [CrossRef] [PubMed]
- Jamthikar, A.; Gupta, D.; Khanna, N.N.; Saba, L.; Laird, J.R.; Suri, J.S. Cardiovascular/stroke risk prevention: A new machine learning framework integrating carotid ultrasound image-based phenotypes and its harmonics with conventional risk factors. Indian Heart J. 2020, 72, 258–264. [Google Scholar] [CrossRef]
- Weng, S.F.; Reps, J.; Kai, J.; Garibaldi, J.M.; Qureshi, N. Can machine-learning improve cardiovascular risk prediction using routine clinical data? PLoS ONE 2017, 12, e0174944. [Google Scholar] [CrossRef] [Green Version]
- Sharma, N.; Mishra, M.K.; Chadha, J.S.; Lalwani, P. Heart Stroke Risk Analysis: A Deep Learning Approach. In Proceedings of the 2021 10th IEEE International Conference on Communication Systems and Network Technologies (CSNT), Bhopal, India, 18–19 June 2021; pp. 543–598. [Google Scholar]
- Anthimopoulos, M.; Christodoulidis, S.; Ebner, L.; Christe, A.; Mougiakakou, S. Lung pattern classification for interstitial lung diseases using a deep convolutional neural network. IEEE Trans. Med. Imaging 2016, 35, 1207–1216. [Google Scholar] [CrossRef]
- Chong, J.; Tjurin, P.; Niemelä, M.; Jämsä, T.; Farrahi, V. Machine-learning models for activity class prediction: A comparative study of feature selection and classification algorithms. J. Gait Posture 2021, 89, 45–53. [Google Scholar] [CrossRef] [PubMed]
- Shen, D.; Wu, G.; Suk, H.-I. Deep learning in medical image analysis. Annu. Rev. Biomed. Eng. 2017, 19, 221–248. [Google Scholar] [CrossRef] [PubMed]
- Lekadir, K.; Galimzianova, A.; Betriu, À.; Vila, M.d.; Igual, L.; Rubin, D.L.; Fernández, E.; Radeva, P.; Napel, S. A Convolutional Neural Network for Automatic Characterization of Plaque Composition in Carotid Ultrasound. IEEE J. Biomed. Health Inform. 2017, 21, 48–55. [Google Scholar] [CrossRef] [Green Version]
- Biswas, M.; Kuppili, V.; Araki, T.; Edla, D.R.; Godia, E.C.; Saba, L.; Suri, H.S.; Omerzu, T.; Laird, J.R.; Khanna, N.N.; et al. Deep learning strategy for accurate carotid intima-media thickness measurement: An ultrasound study on Japanese diabetic cohort. Comput. Biol. Med. 2018, 98, 100–117. (In English) [Google Scholar] [CrossRef] [Green Version]
- Muller, K.-R.; Mika, S.; Ratsch, G.; Tsuda, K.; Scholkopf, B. An introduction to kernel-based learning algorithms. IEEE Trans. Neural Netw. 2001, 12, 181–201. [Google Scholar] [CrossRef] [Green Version]
- Jain, P.K.; Sharma, N.; Giannopoulos, A.A.; Saba, L.; Nicolaides, A.; Suri, J.S. Hybrid deep learning segmentation models for atherosclerotic plaque in internal carotid artery B-mode ultrasound. Comput. Biol. Med. 2021, 136, 104721. [Google Scholar] [CrossRef]
- Dai, L.; Wu, L.; Li, H.; Cai, C.; Wu, Q.; Kong, H.; Liu, R.; Wang, X.; Hou, X.; Liu, Y. A deep learning system for detecting diabetic retinopathy across the disease spectrum. Nat. Commun. 2021, 12, 3242. [Google Scholar] [CrossRef]
- Porcu, M.; Solinas, C.; Mannelli, L.; Micheletti, G.; Lambertini, M.; Willard-Gallo, K.; Neri, E.; Flanders, A.E.; Saba, L. Radiomics and “radi-… omics” in cancer immunotherapy: A guide for clinicians. J Crit. Rev. Oncol./Hematol. 2020, 154, 103068. [Google Scholar] [CrossRef]
- Panayides, A.S.; Pattichis, M.S.; Leandrou, S.; Pitris, C.; Constantinidou, A.; Pattichis, C.S. Radiogenomics for precision medicine with a big data analytics perspective. IEEE J. Biomed. Health Inform. 2018, 23, 2063–2079. [Google Scholar] [CrossRef]
- Shui, L.; Ren, H.; Yang, X.; Li, J.; Chen, Z.; Yi, C.; Zhu, H.; Shui, P. The era of radiogenomics in precision medicine: An emerging approach to support diagnosis, treatment decisions, and prognostication in oncology. J. Front. Oncol. 2021, 10, 570465. [Google Scholar] [CrossRef]
- Liu, Z.; Keller, P.J. Emerging imaging and genomic tools for developmental systems biology. J. Dev. Cell 2016, 36, 597–610. [Google Scholar] [CrossRef] [Green Version]
- Razek, A.A.K.A.; Alksas, A.; Shehata, M.; AbdelKhalek, A.; Baky, K.A.; El-Baz, A.; Helmy, E. Clinical applications of artificial intelligence and radiomics in neuro-oncology imaging. J. Insights Imaging 2021, 12, 152. [Google Scholar] [CrossRef]
- Rudie, J.D.; Rauschecker, A.M.; Bryan, R.N.; Davatzikos, C.; Mohan, S. Emerging applications of artificial intelligence in neuro-oncology. J Radiol. 2019, 290, 607. [Google Scholar] [CrossRef]
- Xu, M.; Qiao, X.; Liu, S.; Li, Z.; Ji, C.; Li, H.; Shi, T.; Li, L.; Gu, Q.; Zhou, K. CT radiomics for predicting PD-L1 expression on tumor cells in gastric cancer. J. Acta Cardiol. 2021. [Google Scholar] [CrossRef]
- el Naqa, I.; Kerns, S.L.; Coates, J.; Luo, Y.; Speers, C.; West, C.M.; Rosenstein, B.S.; Ten, R.K. Haken Radiogenomics and radiotherapy response modeling. J. Phys. Med. Biol. 2017, 62, R179. [Google Scholar] [CrossRef]
- Mazurowski, M.A. Radiogenomics: What it is and why it is important. J. Am. Coll. Radiol. 2015, 12, 862–866. [Google Scholar] [CrossRef]
- Blumen, H.; Fitch, K.; Polkus, V. Comparison of treatment costs for breast cancer, by tumor stage and type of service. J. Am. Health Drug Benefits 2016, 9, 23. [Google Scholar]
- Eaglehouse, Y.L.; Manjelievskaia, J.; Shao, S.; Brown, D.; Hofmann, K.; Richard, P.; Shriver, C.D.; Zhu, K. Costs for breast cancer care in the military health system: An analysis by benefit type and care source. J. Mil. Med. 2018, 183, e500–e508. [Google Scholar] [CrossRef] [PubMed] [Green Version]
- Jain, P.K.; Sharma, N.; Saba, L.; Paraskevas, K.I.; Kalra, M.K.; Johri, A.; Laird, J.R.; Nicolaides, A.N.; Suri, J.S. Unseen artificial intelligence—Deep learning paradigm for segmentation of low atherosclerotic plaque in carotid ultrasound: A multicenter cardiovascular study. J. Diagn. 2021, 11, 2257. [Google Scholar] [CrossRef]
- Suri, J.S.; Agarwal, S.; Elavarthi, P.; Pathak, R.; Ketireddy, V.; Columbu, M.; Saba, L.; Gupta, S.K.; Faa, G.; Singh, I.M. Inter-Variability Study of COVLIAS 1.0: Hybrid Deep Learning Models for COVID-19 Lung Segmentation in Computed Tomography. J. Diagn. 2021, 11, 2025. [Google Scholar] [CrossRef]
- Suri, J.S.; Laxminarayan, S. Angiography and Plaque Imaging: Advanced Segmentation Techniques; CRC Press: Boca Raton, FL, USA, 2003. [Google Scholar]
- Skandha, S.S.; Nicolaides, A.; Gupta, S.K.; Koppula, V.K.; Saba, L.; Johri, A.M.; Kalra, M.S.; Suri, J.S. A hybrid deep learning paradigm for carotid plaque tissue characterization and its validation in multicenter cohorts using a supercomputer framework. J. Comput. Biol. Med. 2021, 141, 105131. [Google Scholar] [CrossRef] [PubMed]
- Suri, J.S.; Agarwal, S.; Jena, B.; Saxena, S.; El-Baz, A.; Agarwal, V.; Kalra, M.K.; Saba, L.; Viskovic, K.; Fatemi, M.; et al. Five Strategies for Bias Estimation in Artificial Intelligence-based Hybrid Deep Learning for Acute Respiratory Distress Syndrome COVID-19 Lung Infected Patients using AP(ai)Bias 2.0: A Systematic Review. IEEE TIM 2022, 14, 113–118. [Google Scholar] [CrossRef]
- Agarwal, M.; Saba, L.; Gupta, S.K.; Johri, A.M.; Khanna, N.N.; Mavrogeni, S.; Laird, J.R.; Pareek, G.; Miner, M.; Sfikakis, P.P. Wilson disease tissue classification and characterization using seven artificial intelligence models embedded with 3D optimization paradigm on a weak training brain magnetic resonance imaging datasets: A supercomputer application. J Med. Biol. Eng. Comput. 2021, 59, 511–533. [Google Scholar] [CrossRef]
- Silva FC, S.; Júnior, R.A. A Multifactorial Analysis of Extracranial Carotid Disease: A Comprehensive Approach to Sonographic Criteria. Ultrasound Q. 2022, 10, 1097. [Google Scholar] [CrossRef]
- Hu, X.; Naiel, M.A.; Wong, A.; Lamm, M.; Fieguth, P. RUNet: A Robust UNet Architecture for Image Super-Resolution. In Proceedings of the IEEE/CVF Conference on Computer Vision and Pattern Recognition Workshops, Long Beach, CA, USA, 16–17 June 2019. [Google Scholar]
- LeCun, Y.; Denker, J.; Solla, S. Optimal brain damage. Adv. Neural Inf. Process. Syst. 1989, 2, 104–116. [Google Scholar]
- Zhu, M.; Gupta, S. To prune, or not to prune: Exploring the efficacy of pruning for model compression. arXiv 2017, arXiv:1710.01878. [Google Scholar]
- Brodzicki, A.; Piekarski, M.; Jaworek-Korjakowska, J. The whale optimization algorithm approach for deep neural networks. J. Sens. 2021, 21, 8003. [Google Scholar] [CrossRef] [PubMed]
- Weiskopf, N.; Edwards, L.J.; Helms, G.; Mohammadi, S.; Kirilina, E. Quantitative magnetic resonance imaging of brain anatomy and in vivo histology. Nat. Rev. Phys. 2021, 3, 570–588. [Google Scholar] [CrossRef]
- Guo, Y.; Sivaramakrishna, R.; Lu, C.-C.; Suri, J.S.; Laxminarayan, S. Breast image registration techniques: A survey. Med. Biol. Eng. Comput. 2006, 44, 15–26. [Google Scholar] [CrossRef] [PubMed]
- Petrova, M.; Kiat, H.; Gavino, A.; McLachlan, C.S. Carotid ultrasound screening programs in rural communities: A systematic review. J. Pers. Med. 2021, 11, 897. [Google Scholar] [CrossRef] [PubMed]
- Yang, G.; Ye, Q.; Xia, J. Unbox the black-box for the medical explainable AI via multi-modal and multi-centre data fusion: A mini-review, two showcases and beyond. Inf. Fusion 2022, 77, 29–52. [Google Scholar] [CrossRef] [PubMed]
- Vlachopoulos, C.; Aznaouridis, K.; Ioakeimidis, N.; Rokkas, K.; Vasiliadou, C.; Alexopoulos, N.; Stefanadi, E.; Askitis, A.; Stefanadis, C. Unfavourable endothelial and inflammatory state in erectile dysfunction patients with or without coronary artery disease. Eur. Heart J. 2006, 27, 2640–2648. [Google Scholar] [CrossRef] [Green Version]
- Gandaglia, G.; Briganti, A.; Jackson, G.; Kloner, R.A.; Montorsi, F.; Montorsi, P.; Vlachopoulos, C. A systematic review of the association between erectile dysfunction and cardiovascular disease. Eur. Urol. 2014, 65, 968–978. [Google Scholar] [CrossRef]
- Suri, J.S.; Bhagawati, M.; Paul, S.; Protogeron, A.; Sfikakis, P.P.; Kitas, G.D.; Khanna, N.N.; Ruzsa, Z.; Sharma, A.M.; Saxena, S. Understanding the bias in machine learning systems for cardiovascular disease risk assessment: The first of its kind review. Comput. Biol. Med. 2022, 142, 105204. [Google Scholar] [CrossRef]
- Paul, S.; Maindarkar, M.; Saxena, S.; Saba, L.; Turk, M.; Kalra, M.; Krishnan, P.R.; Suri, J.S. Bias Investigation in Artificial Intelligence Systems for Early Detection of Parkinson’sDisease: A Narrative Review. Diagnostics 2022, 12, 166. [Google Scholar] [CrossRef]
- Liu, X.; Rivera, S.C.; Moher, D.; Calvert, M.J.; Denniston, A.K. Group Reporting guidelines for clinical trial reports for interventions involving artificial intelligence: The CONSORT-AI extension. Nat. Med. 2020, 26, 1364–1374. [Google Scholar] [CrossRef]
- Gupta, A.; Kesavabhotla, K.; Baradaran, H.; Kamel, H.; Pandya, A.; Giambrone, A.E.; Wright, D.; Pain, K.J.; Mtui, E.E.; Suri, J.S. Plaque echolucency and stroke risk in asymptomatic carotid stenosis: A systematic review and meta-analysis. Stroke 2015, 46, 91–97. [Google Scholar] [CrossRef] [Green Version]
- Cheng, J.Y.; Abel, J.T.; Balis, U.G.; McClintock, D.S.; Pantanowitz, L. Challenges in the development, deployment, and regulation of artificial intelligence in anatomic pathology. Am. J. Pathol. 2021, 191, 1684–1692. [Google Scholar] [CrossRef]
- Xuan, J.; Jiang, H.; Hu, Y.; Ren, Z.; Zou, W.; Luo, Z.; Wu, X. Towards effective bug triage with software data reduction techniques. IEEE Trans. Knowl. Data Eng. 2014, 27, 264–280. [Google Scholar] [CrossRef] [Green Version]
- Gerke, S.; Babic, B.; Evgeniou, T.; Cohen, I.G. The need for a system view to regulate artificial intelligence/machine learning-based software as medical device. NPJ Digit. Med. 2020, 3, 53. [Google Scholar] [CrossRef] [Green Version]
- Lee, D.; Yoon, S.N. Application of artificial intelligence-based technologies in the healthcare industry: Opportunities and challenges. Int. J. Environ. Res. 2021, 18, 271. [Google Scholar] [CrossRef]
- Benjamens, S.; Dhunnoo, P.; Meskó, B. The state of artificial intelligence-based FDA-approved medical devices and algorithms: An online database. NPJ Digit. Med. 2020, 3, 118. [Google Scholar] [CrossRef]
- Muehlematter, U.J.; Daniore, P.; Vokinger, K.N. Approval of artificial intelligence and machine learning-based medical devices in the USA and Europe (2015–20): A comparative analysis. Lancet Digit. Health 2021, 3, e195–e203. [Google Scholar] [CrossRef]
- Hawkins, R.E.; Welcher, C.M.; Holmboe, E.S.; Kirk, L.M.; Norcini, J.J.; Simons, K.B.; Skochelak, S.E. Implementation of competency-based medical education: Are we addressing the concerns and challenges? Med. Educ. 2015, 49, 1086–1102. [Google Scholar] [CrossRef]
- Shahin, M.; Babar, M.A.; Zhu, L. Continuous integration, delivery and deployment: A systematic review on approaches, tools, challenges and practices. IEEE Access 2017, 5, 3909–3943. [Google Scholar] [CrossRef]
- Retson, T.A.; Eghtedari, M. Computer-aided detection/diagnosis in breast imaging: A focus on the evolving FDA regulations for using software as a medical device. Curr. Radiol. Rep. 2020, 8, 7. [Google Scholar] [CrossRef]
- Parwani, A.V.; Hassell, L.; Glassy, E.; Pantanowitz, L. Regulatory barriers surrounding the use of whole slide imaging in the United States of America. J. Pathol. Inform. 2014, 5, 38. [Google Scholar] [CrossRef] [PubMed]
- Smetherman, D.; Golding, L.; Moy, L.; Rubin, E. The economic impact of AI on breast imaging. J. Breast Imaging 2022, 4, 302–308. [Google Scholar] [CrossRef]
- Challen, R.; Denny, J.; Pitt, M.; Gompels, L.; Edwards, T.; Tsaneva-Atanasova, K. Artificial intelligence, bias and clinical safety. BMJ Qual. Saf. 2019, 28, 231–237. [Google Scholar] [CrossRef]
- Yuan, Q.; Zhang, H.; Deng, T.; Tang, S.; Yuan, X.; Tang, W.; Xie, Y.; Ge, H.; Wang, X.; Zhou, Q. Role of artificial intelligence in kidney disease. Int. J. Med. Sci. 2020, 17, 970. [Google Scholar] [CrossRef] [PubMed] [Green Version]
- Solanki, P.; Grundy, J.; Hussain, W. Operationalising ethics in artificial intelligence for healthcare: A framework for AI developers. AI Ethics 2022, 16, 1–18. [Google Scholar] [CrossRef]
- Syu, J.-M.; Lai, C.-H.; Lin, G.-S.; Chai, S.-K. Psoriasis detection based on deep neural network. In Proceedings of the 2018 IEEE International Conference on Consumer Electronics-Taiwan (ICCE-TW), Taichung, Taiwan, 19–21 May 2018; Volume 6, pp. 1–2. [Google Scholar]
- El-Baz, A.; Gimel’farb, G.; Suri, J.S. Stochastic Modeling for Medical Image Analysis; CRC Press: Boca Raton, FL, USA, 2015. [Google Scholar]
- Ali, A. Insights into Futuristic Renal Medicine. Saudi J. Kidney Dis. Transplant. 2021, 32, 901. [Google Scholar] [CrossRef]
- Viswanathan, V.; Jamthikar, A.; Gupta, D.; Shanu, N.; Puvvula, A.; Khanna, N.N.; Saba, L.; Omerzum, T.; Viskovic, K.; Mavrogeni, S. Low-cost preventive screening using carotid ultrasound in patients with diabetes. Front. Biosci.-Landmark 2020, 25, 1132–1171. [Google Scholar]
- Nissar, I.; Rizvi, D.; Masood, S.; Mir, A. Voice-based detection of Parkinson’s disease through ensemble machine learning approach: A Performance study. EAI Endorsed Trans. Pervasive Health Technol. 2019, 5, e2. [Google Scholar] [CrossRef] [Green Version]
- Kamble, M.; Shrivastava, P.; Jain, M. Digitized spiral drawing classification for Parkinson’s disease diagnosis. Meas. Sens. 2021, 16, 100047. [Google Scholar] [CrossRef]
- Yarlagadda, R.T. AI Automation and it’s Future in the UnitedStates. Int. J. Creat. Res. Thoughts 2017, 5, 2320–2882. [Google Scholar]
- Smith, A.; Anderson, J. AI, Robotics, and the Future of Jobs. Pew Res. Cent. 2014, 6, 51. [Google Scholar]
- Nissim, G.; Simon, T. The future of labor unions in the age of automation and at the dawn of AI. Technol. Soc. 2021, 67, 101732. [Google Scholar] [CrossRef]
- Howard, J. Artificial intelligence: Implications for the future of work. Am. J. Ind. Med. 2019, 62, 917–926. [Google Scholar] [CrossRef] [PubMed]
- Korinek, A.; Stiglitz, J.E. Covid-19 driven advances in automation and artificial intelligence risk exacerbating economic inequality. BMJ 2021, 11, 372. [Google Scholar] [CrossRef]
- Davenport, T.H.; Ronanki, R. Artificial intelligence for the real world. Harv. Bus. Rev. 2018, 96, 108–116. [Google Scholar]
- Sarki, R.; Ahmed, K.; Wang, H.; Zhang, Y. Automated detection of mild and multi-class diabetic eye diseases using deep learning. Health Inf. Sci. Syst. 2020, 8, 32. [Google Scholar] [CrossRef]
- Quan, C.; Ren, K.; Luo, Z. A deep learning based method for Parkinson’s disease detection using dynamic features of speech. IEEE Access 2021, 9, 10239–10252. [Google Scholar] [CrossRef]


| SN | FDA Approval Stages | Description |
|---|---|---|
| 1 | 510 (k) clearance | A 510 (k) authorization is granted to an algorithm if it is at least as secure and effective as another equivalent, commercially available algorithm. Alongside the claim, the applicant for this clearance must provide substantial proof of equivalence. It is illegal to commercialize the algorithm that is awaiting approval until it has been determined to be reasonably comparable to the other algorithm. |
| 2 | Premarket approval | For Class III medical devices, algorithms receive premarket approval. The safety and efficacy of the latter are assessed through more comprehensive scientific and regulatory processes since they can have a significant impact on human health. The FDA must find sufficient scientific evidence supporting the device’s usefulness and safety before approving an application. The applicant can move further with product marketing after receiving approval. |
| 3 | de novo pathway | The de novo category is used to categorize novel medical devices with sufficient safety and efficacy and with broad controls, but in which there are no lawfully marketed equivalents. Before approving and permitting the devices to be marketed, the FDA conducts a risk-based evaluation of the device. |
Publisher’s Note: MDPI stays neutral with regard to jurisdictional claims in published maps and institutional affiliations. |
© 2022 by the authors. Licensee MDPI, Basel, Switzerland. This article is an open access article distributed under the terms and conditions of the Creative Commons Attribution (CC BY) license (https://creativecommons.org/licenses/by/4.0/).
Share and Cite
Khanna, N.N.; Maindarkar, M.A.; Viswanathan, V.; Fernandes, J.F.E.; Paul, S.; Bhagawati, M.; Ahluwalia, P.; Ruzsa, Z.; Sharma, A.; Kolluri, R.; et al. Economics of Artificial Intelligence in Healthcare: Diagnosis vs. Treatment. Healthcare 2022, 10, 2493. https://doi.org/10.3390/healthcare10122493
Khanna NN, Maindarkar MA, Viswanathan V, Fernandes JFE, Paul S, Bhagawati M, Ahluwalia P, Ruzsa Z, Sharma A, Kolluri R, et al. Economics of Artificial Intelligence in Healthcare: Diagnosis vs. Treatment. Healthcare. 2022; 10(12):2493. https://doi.org/10.3390/healthcare10122493
Chicago/Turabian StyleKhanna, Narendra N., Mahesh A. Maindarkar, Vijay Viswanathan, Jose Fernandes E Fernandes, Sudip Paul, Mrinalini Bhagawati, Puneet Ahluwalia, Zoltan Ruzsa, Aditya Sharma, Raghu Kolluri, and et al. 2022. "Economics of Artificial Intelligence in Healthcare: Diagnosis vs. Treatment" Healthcare 10, no. 12: 2493. https://doi.org/10.3390/healthcare10122493