
Artificial Intelligence Analysis of Gene Expression Predicted the Overall Survival of Mantle Cell Lymphoma and a Large Pan-Cancer Series


Abstract
:1. Introduction
2. Materials and Methods
2.1. Hardware
2.2. Software
- EditPad Lite 8 (Just Great Software Co. Ltd., Rawai Phuket 83130, Thailand; page URL: http://www.just-great-software.com/aboutjg.html (accessed on 29 August 2021));
- Microsoft Excel 2016 [(16.0.5173.1000) MSO (16.0.5173.1000) 64-bit, Microsoft K.K., Shinagawa, Tokyo, Japan; page URL: https://www.microsoft.com/ja-jp/microsoft-365/excel (accessed on 29 August 2021)];
- R 3.6.3 (page URL: https://www.r-project.org/ (accessed on 29 August 2021) [47]);
- R Studio 1.3.959 (R Studio, Boston, MA 02210, USA; page URL: https://www.rstudio.com/products/rstudio/#rstudio-desktop (accessed on 29 August 2021));
- IBM SPSS Statistics 26 and Modeler 18 (IBM Japan Ltd., Tokyo 103-8510, Japan; page URL: https://www.ibm.com/jp-ja/analytics/spss-statistics-software (accessed on 29 August 2021));
- Gene Set Enrichment Analysis (GSEA) 4.1.0 (UC San Diego, Broad Institute, Cambridge, MA 02142, USA; page URL: http://www.gsea-msigdb.org/gsea/index.jsp (accessed on 29 August 2021) [48,49]); https://github.com/GSEA-MSigDB/gsea-desktop (accessed on 8 December 2021);
- JMP Pro 14 Statistical Discovery (SAS Institute Inc., Cary, NC 27513-2414, USA; page URL: https://www.jmp.com/ja_jp/home.html (accessed on 29 August 2021));
- Morpheus matrix visualization and analysis software (Broad Institute, Cambridge, MA 02142, USA), https://software.broadinstitute.org/morpheus) (accessed on 29 November 2021);
- String (version 11, String consortium 2020) [19]; https://string-db.org/ (accessed on 29 November 2021).
2.3. Predictive Genes and Artificial Neural Network Analysis
2.3.1. Gene Expression Series of Mantle Cell Lymphoma
2.3.2. Identification of Prognostic Genes for Overall Survival
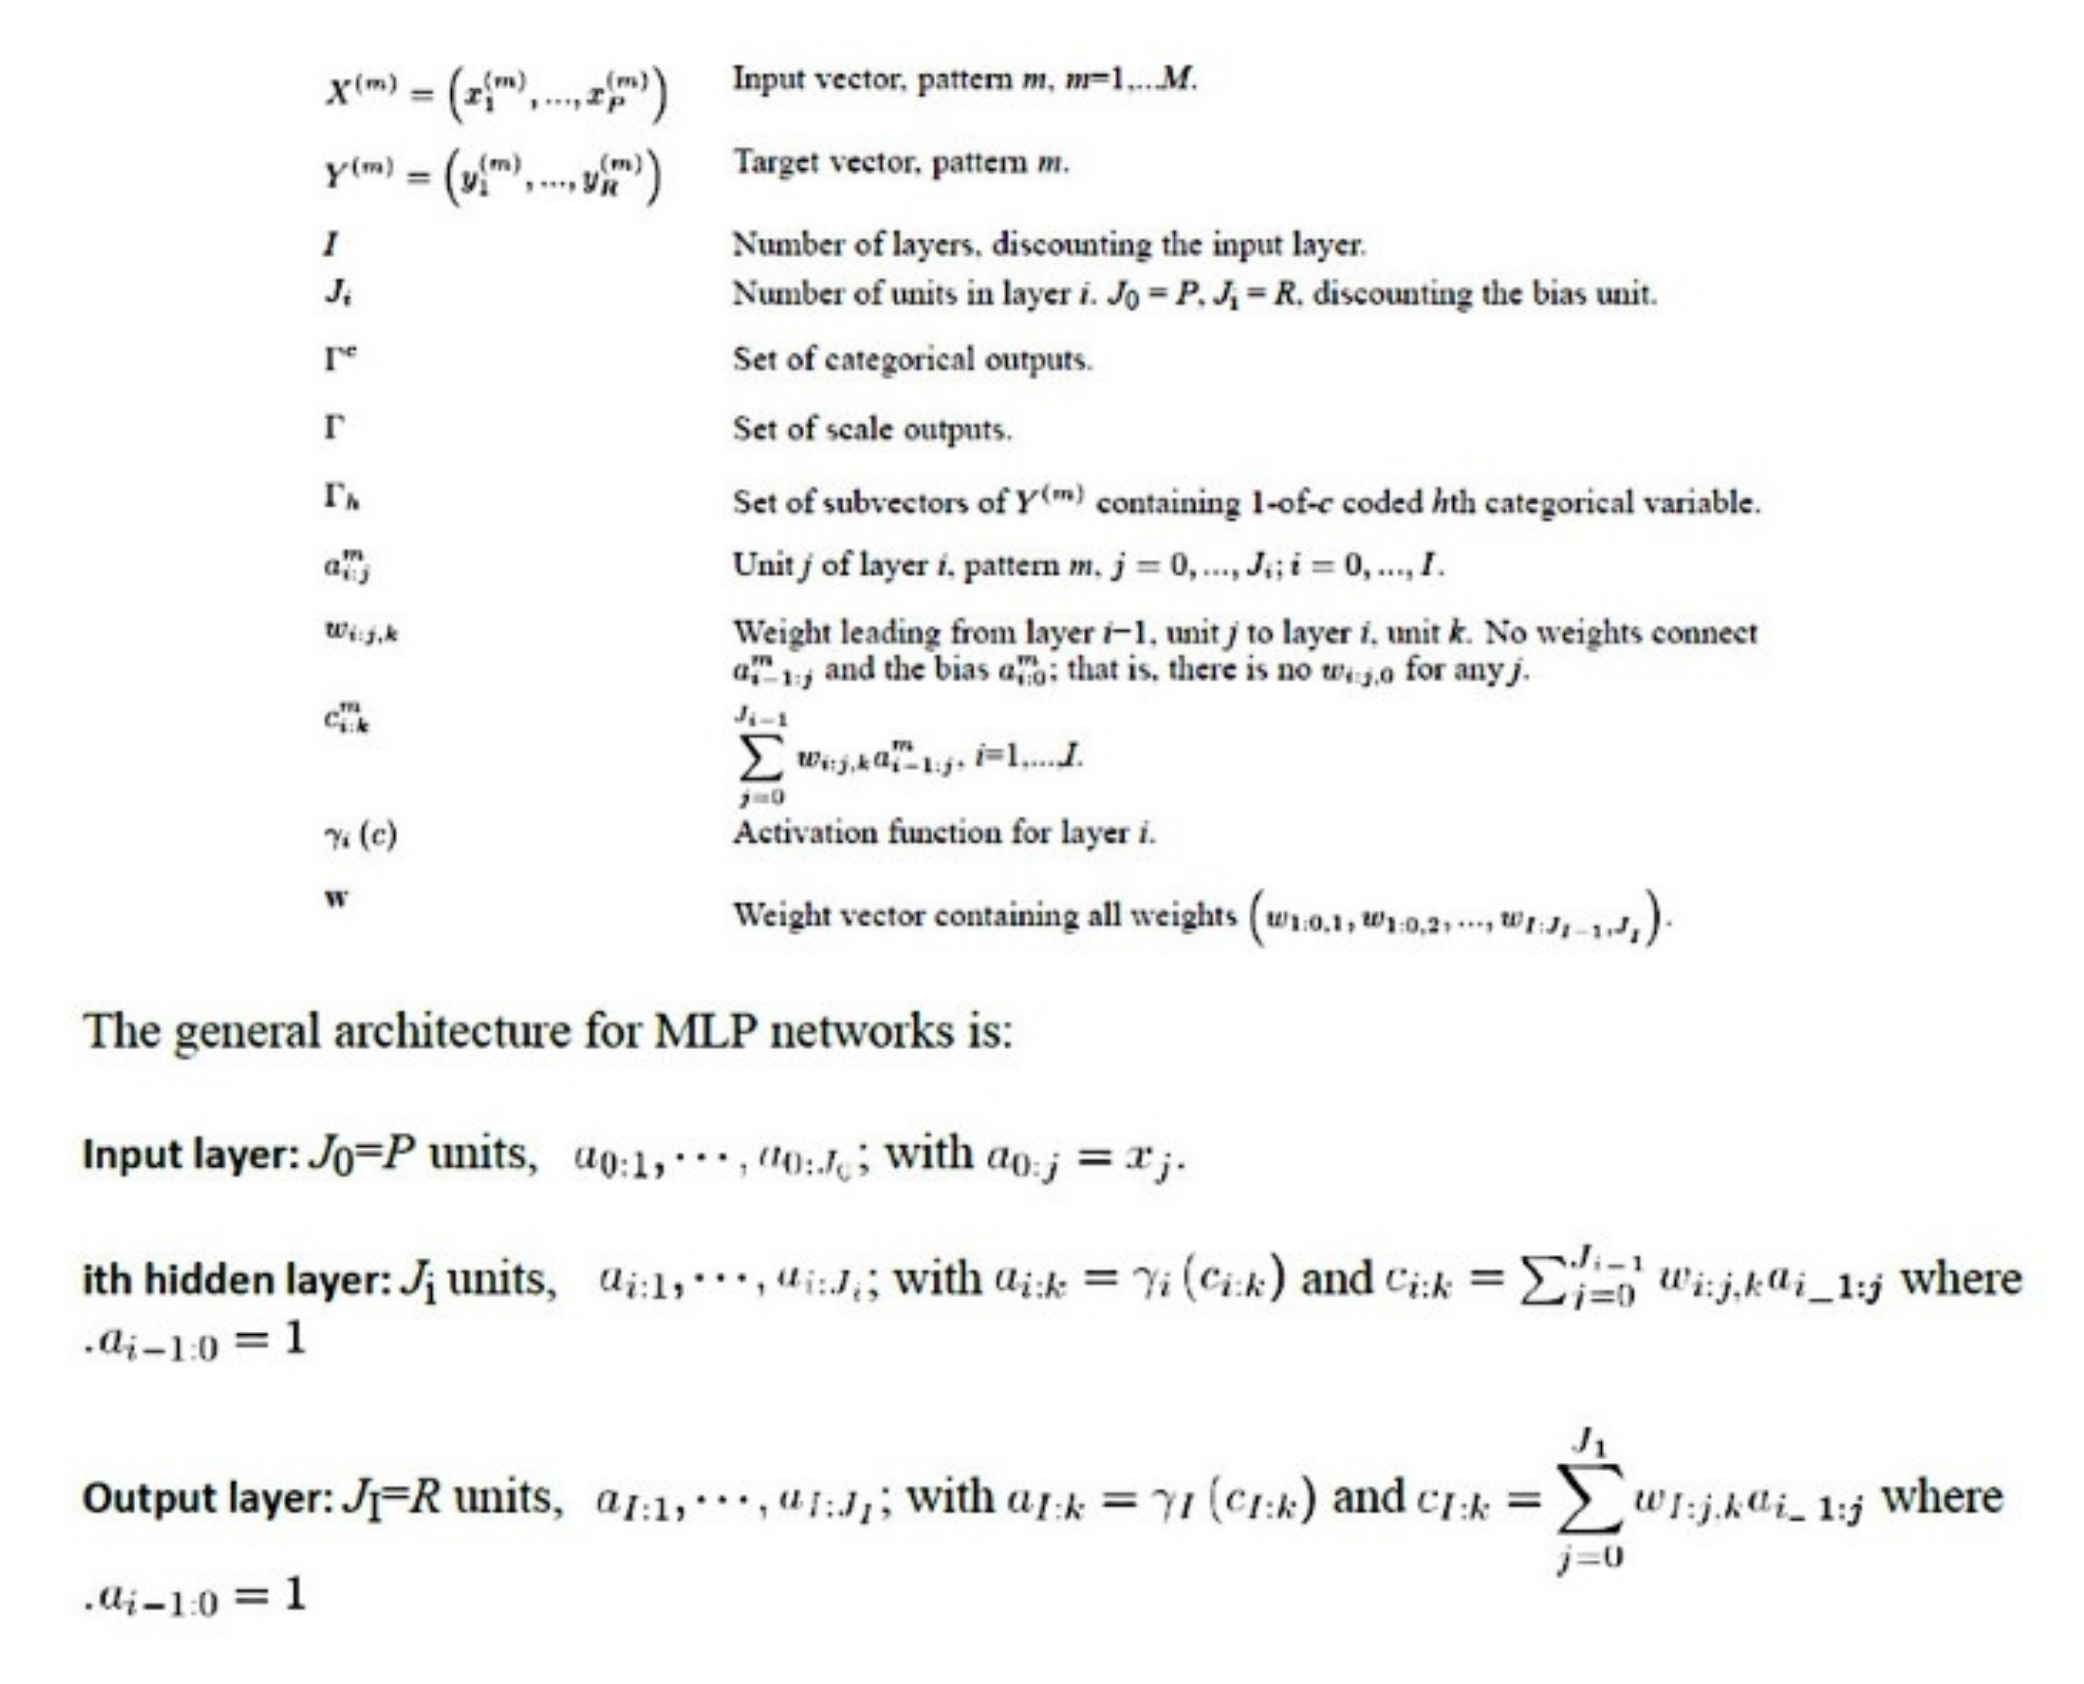
2.3.3. Description of the Basic Neural Network Architecture
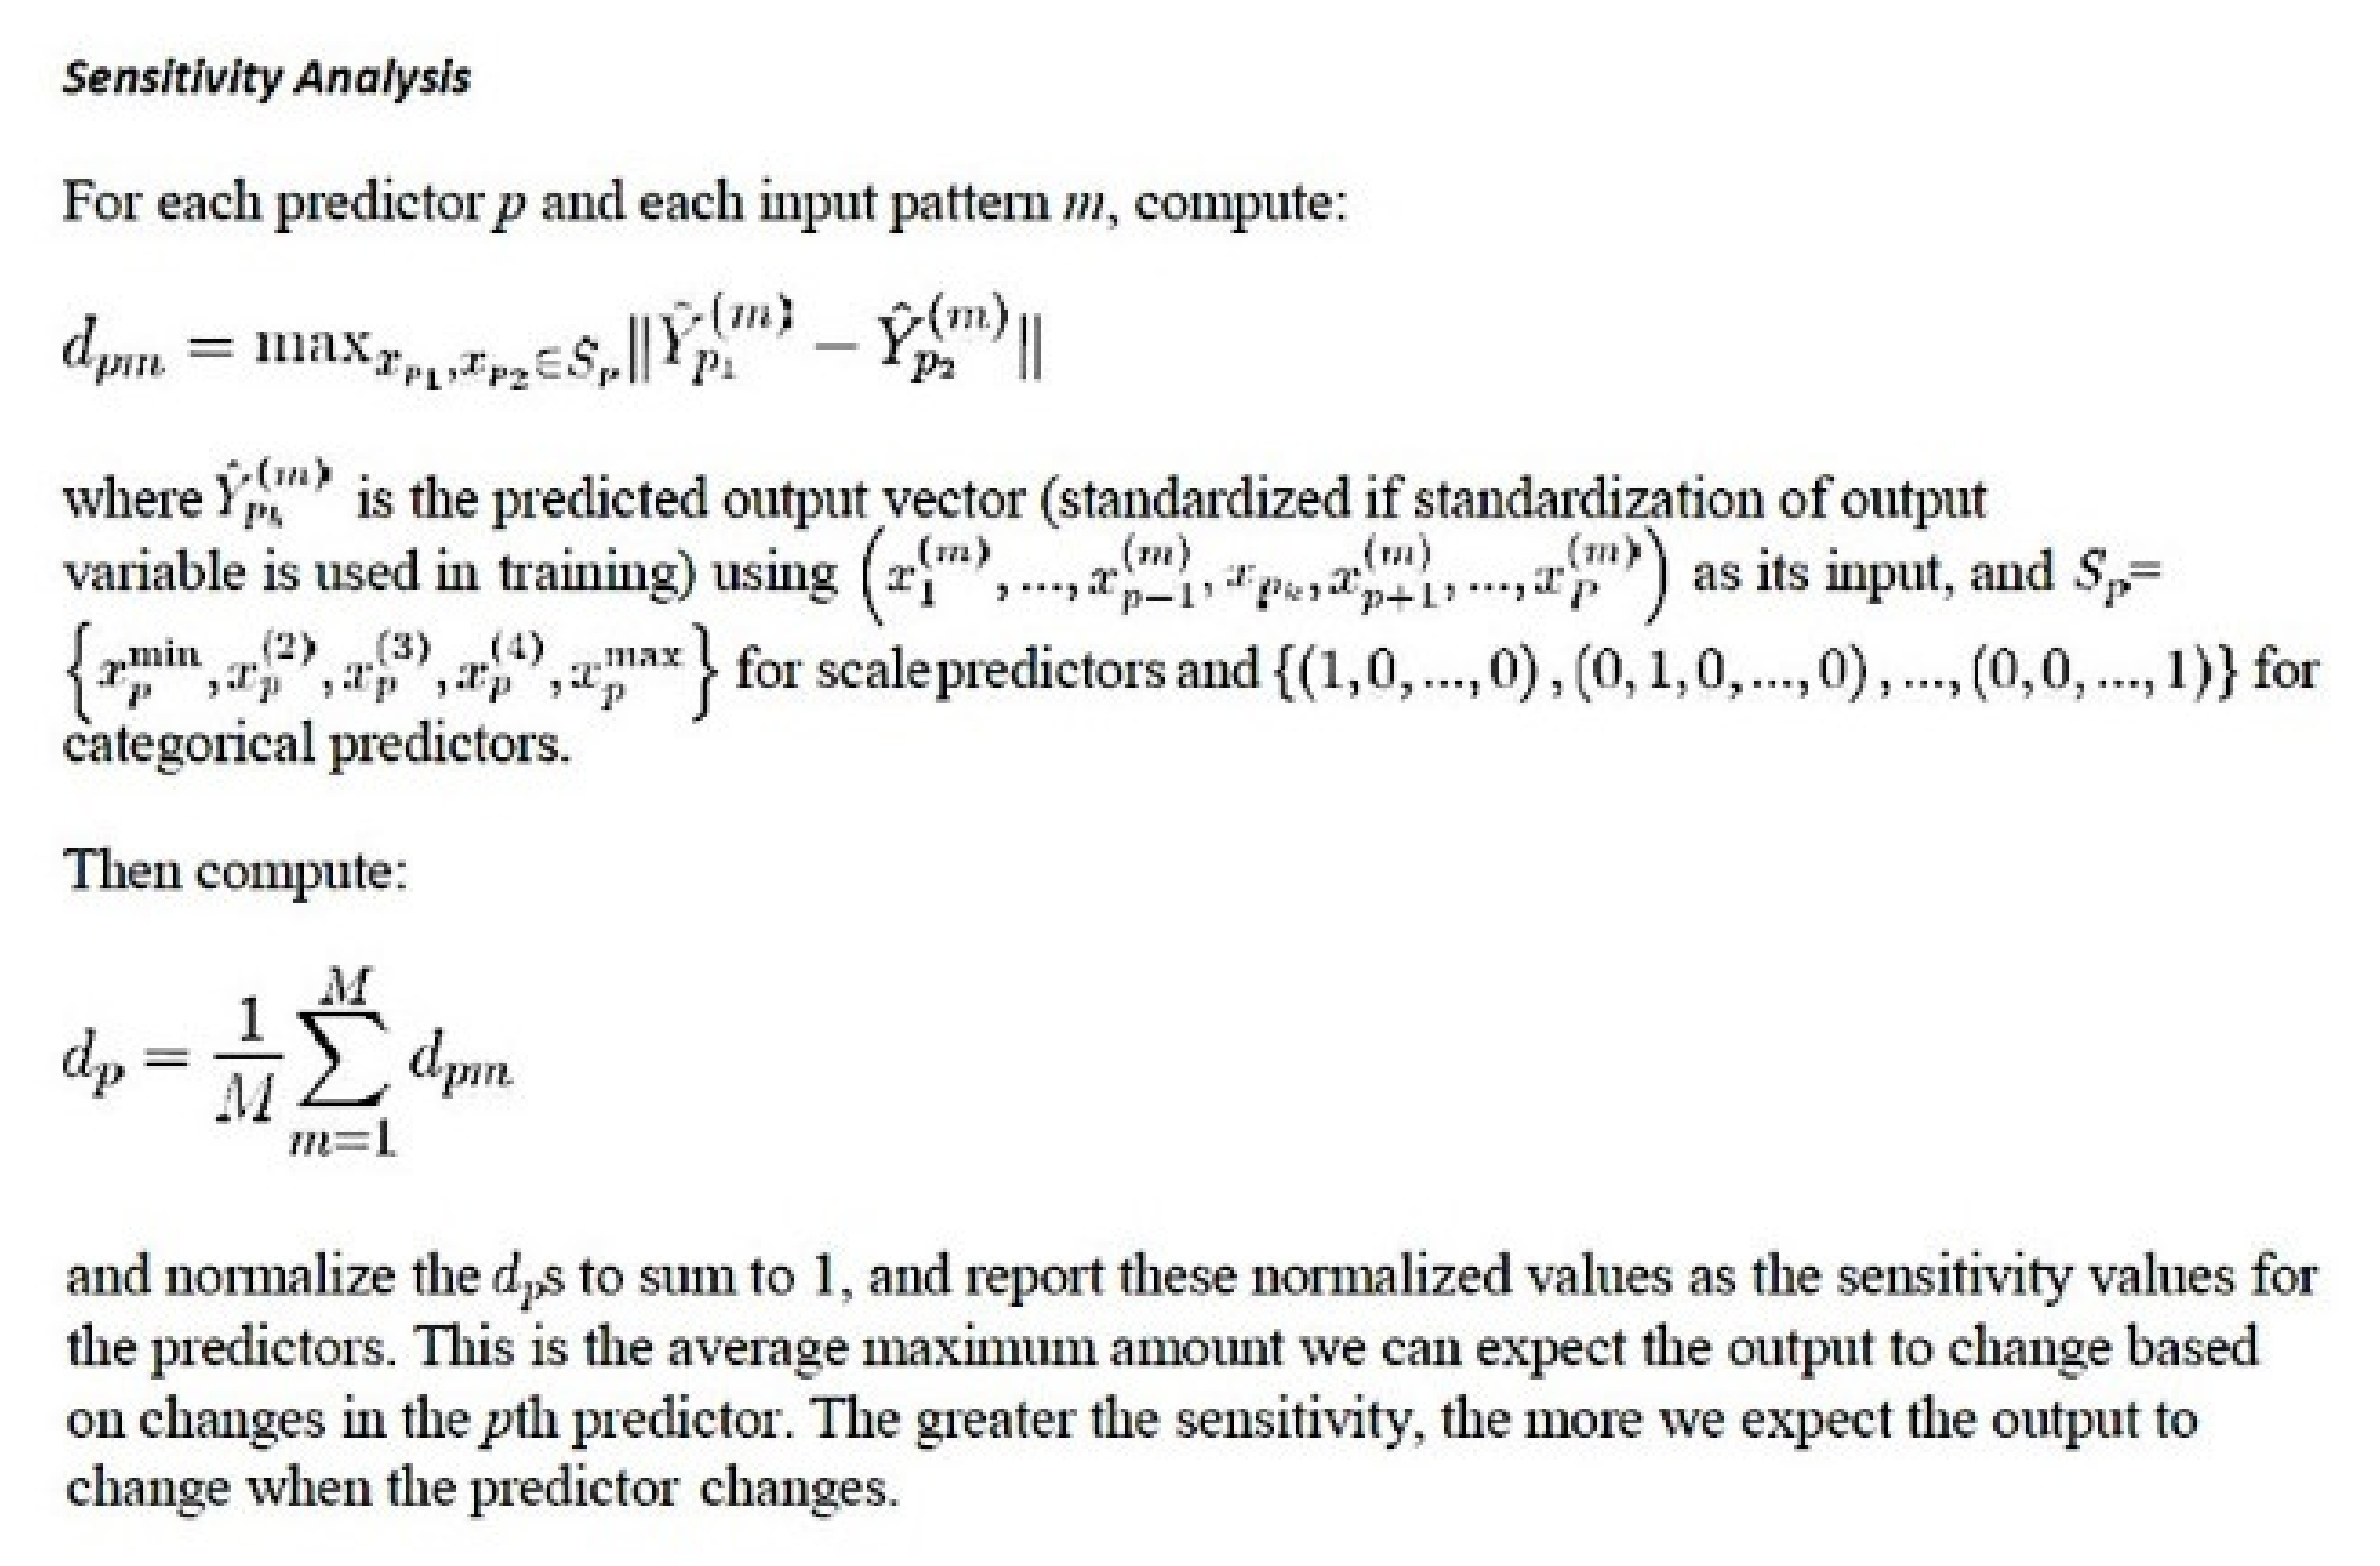
2.3.4. Parameters of the Neural Network


2.4. Gene Set Enrichment Analysis (GSEA)
2.5. Summary of the Research Analysis Algorithm
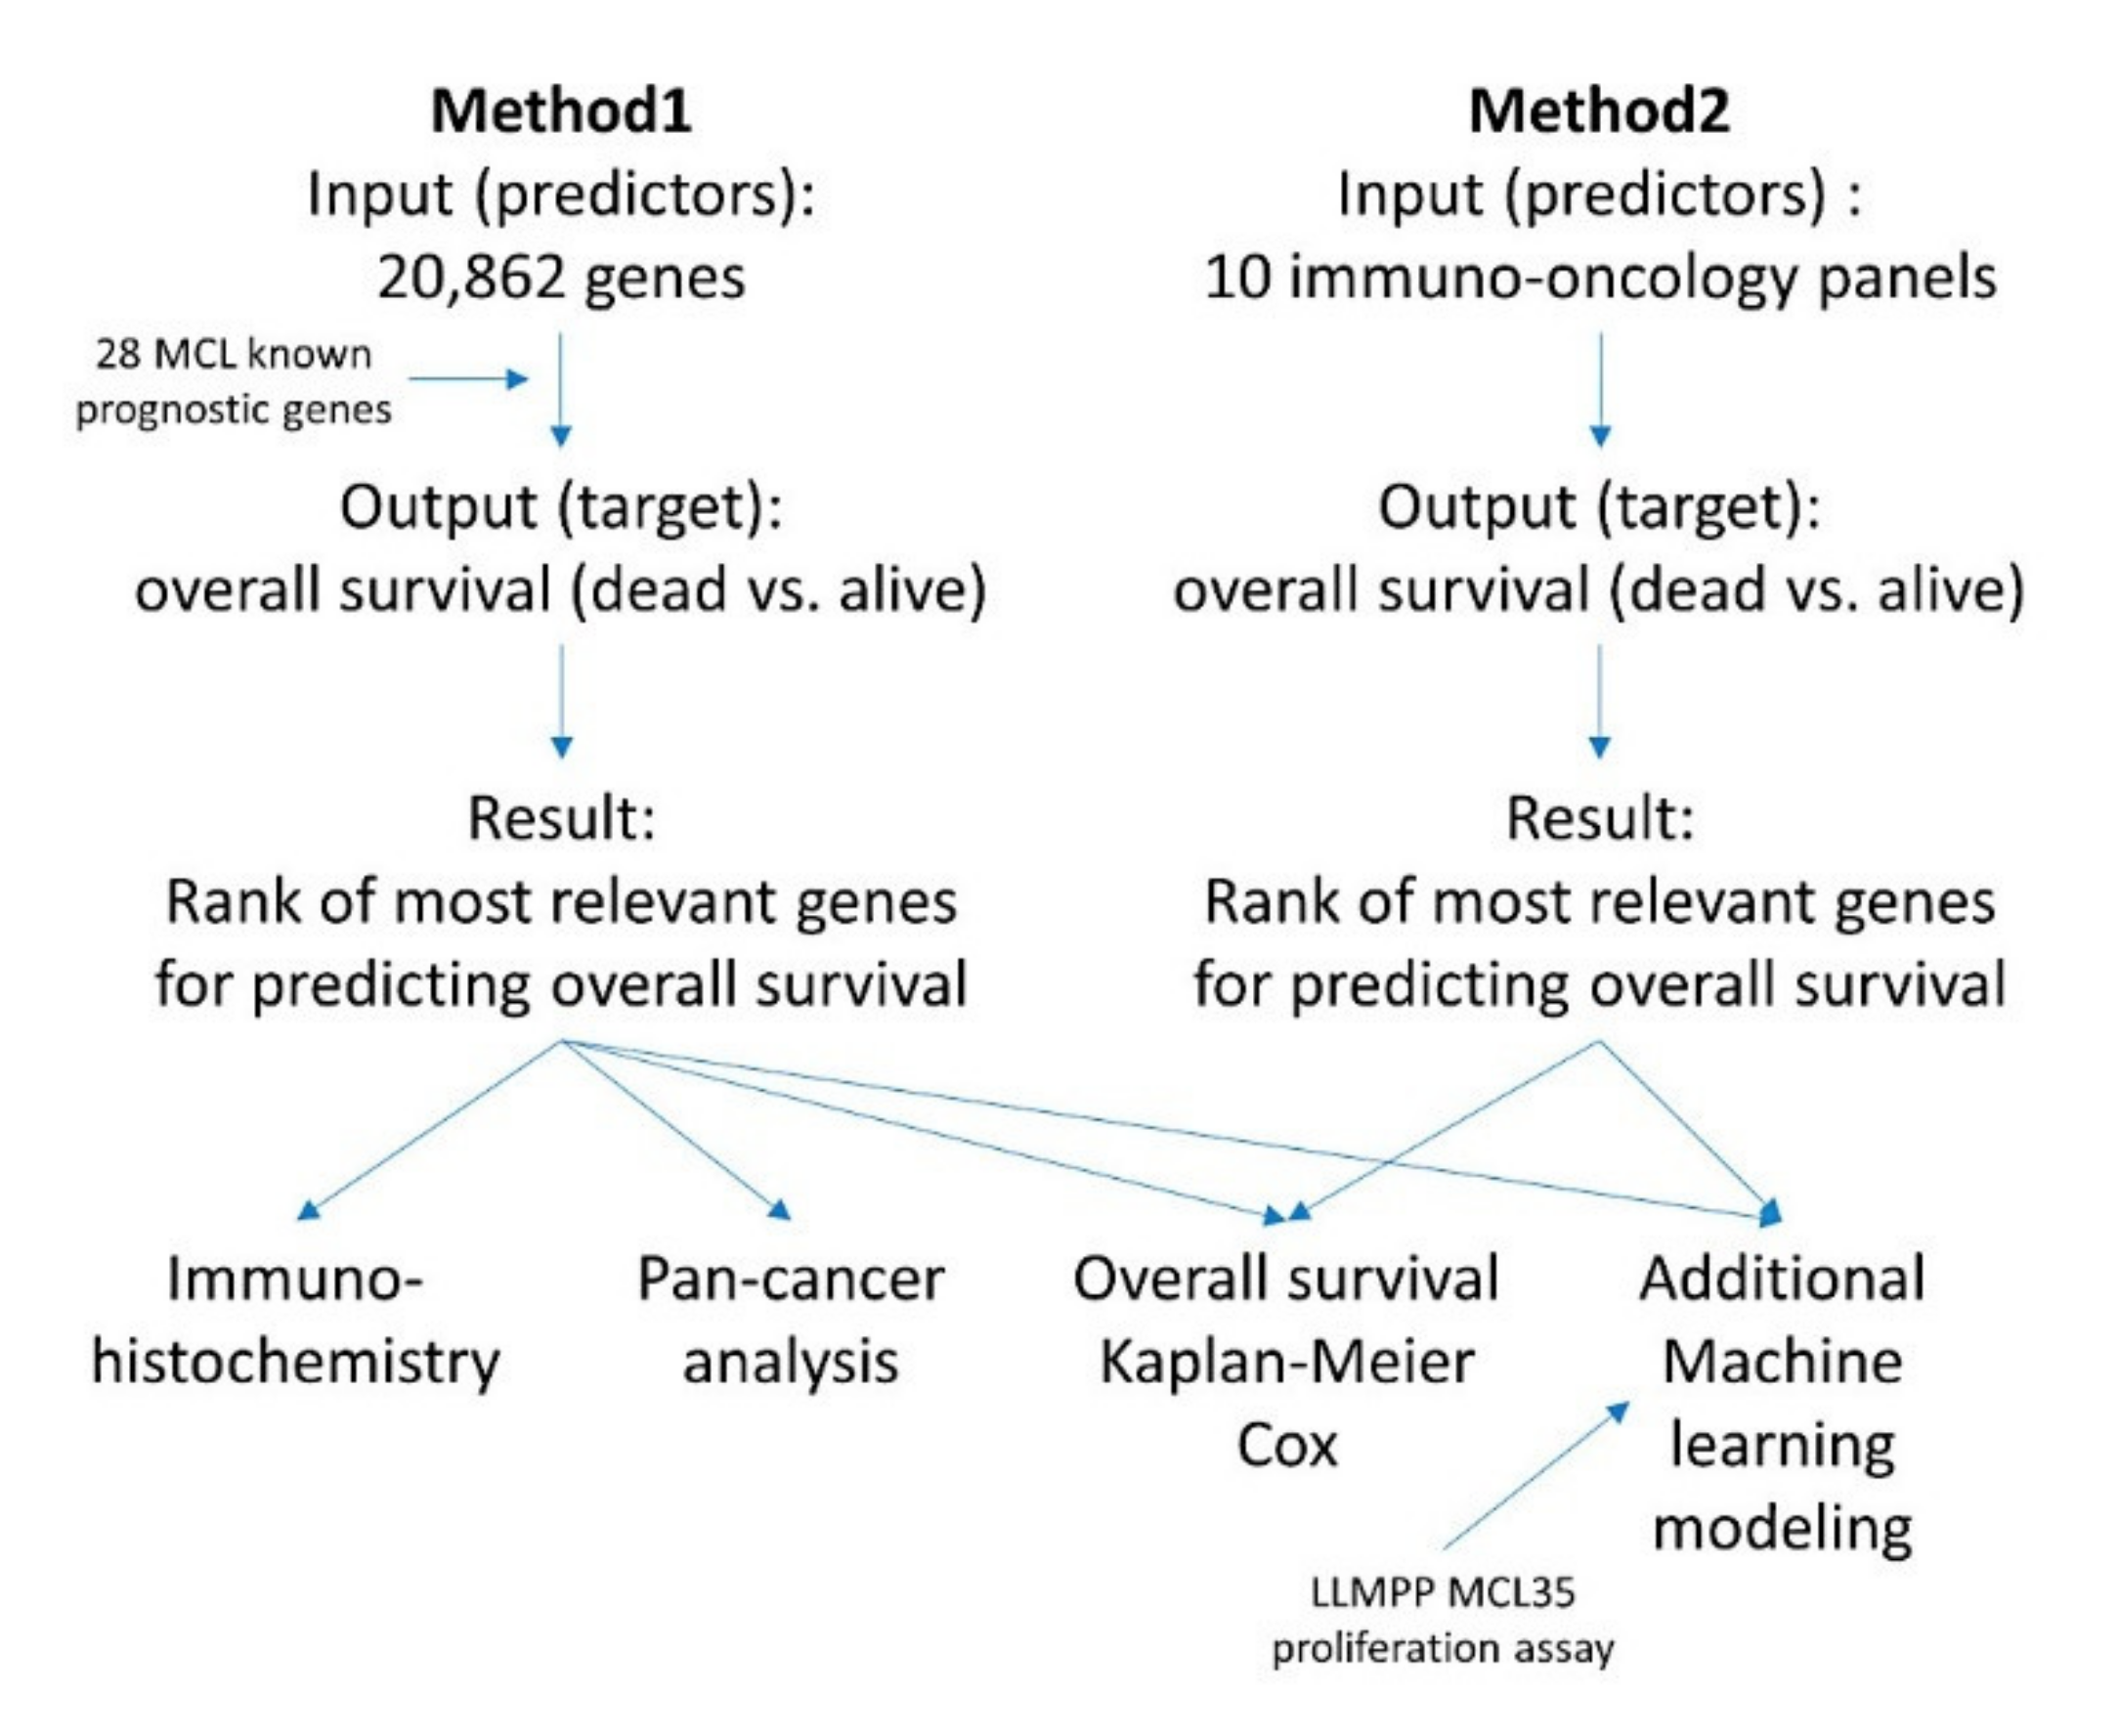
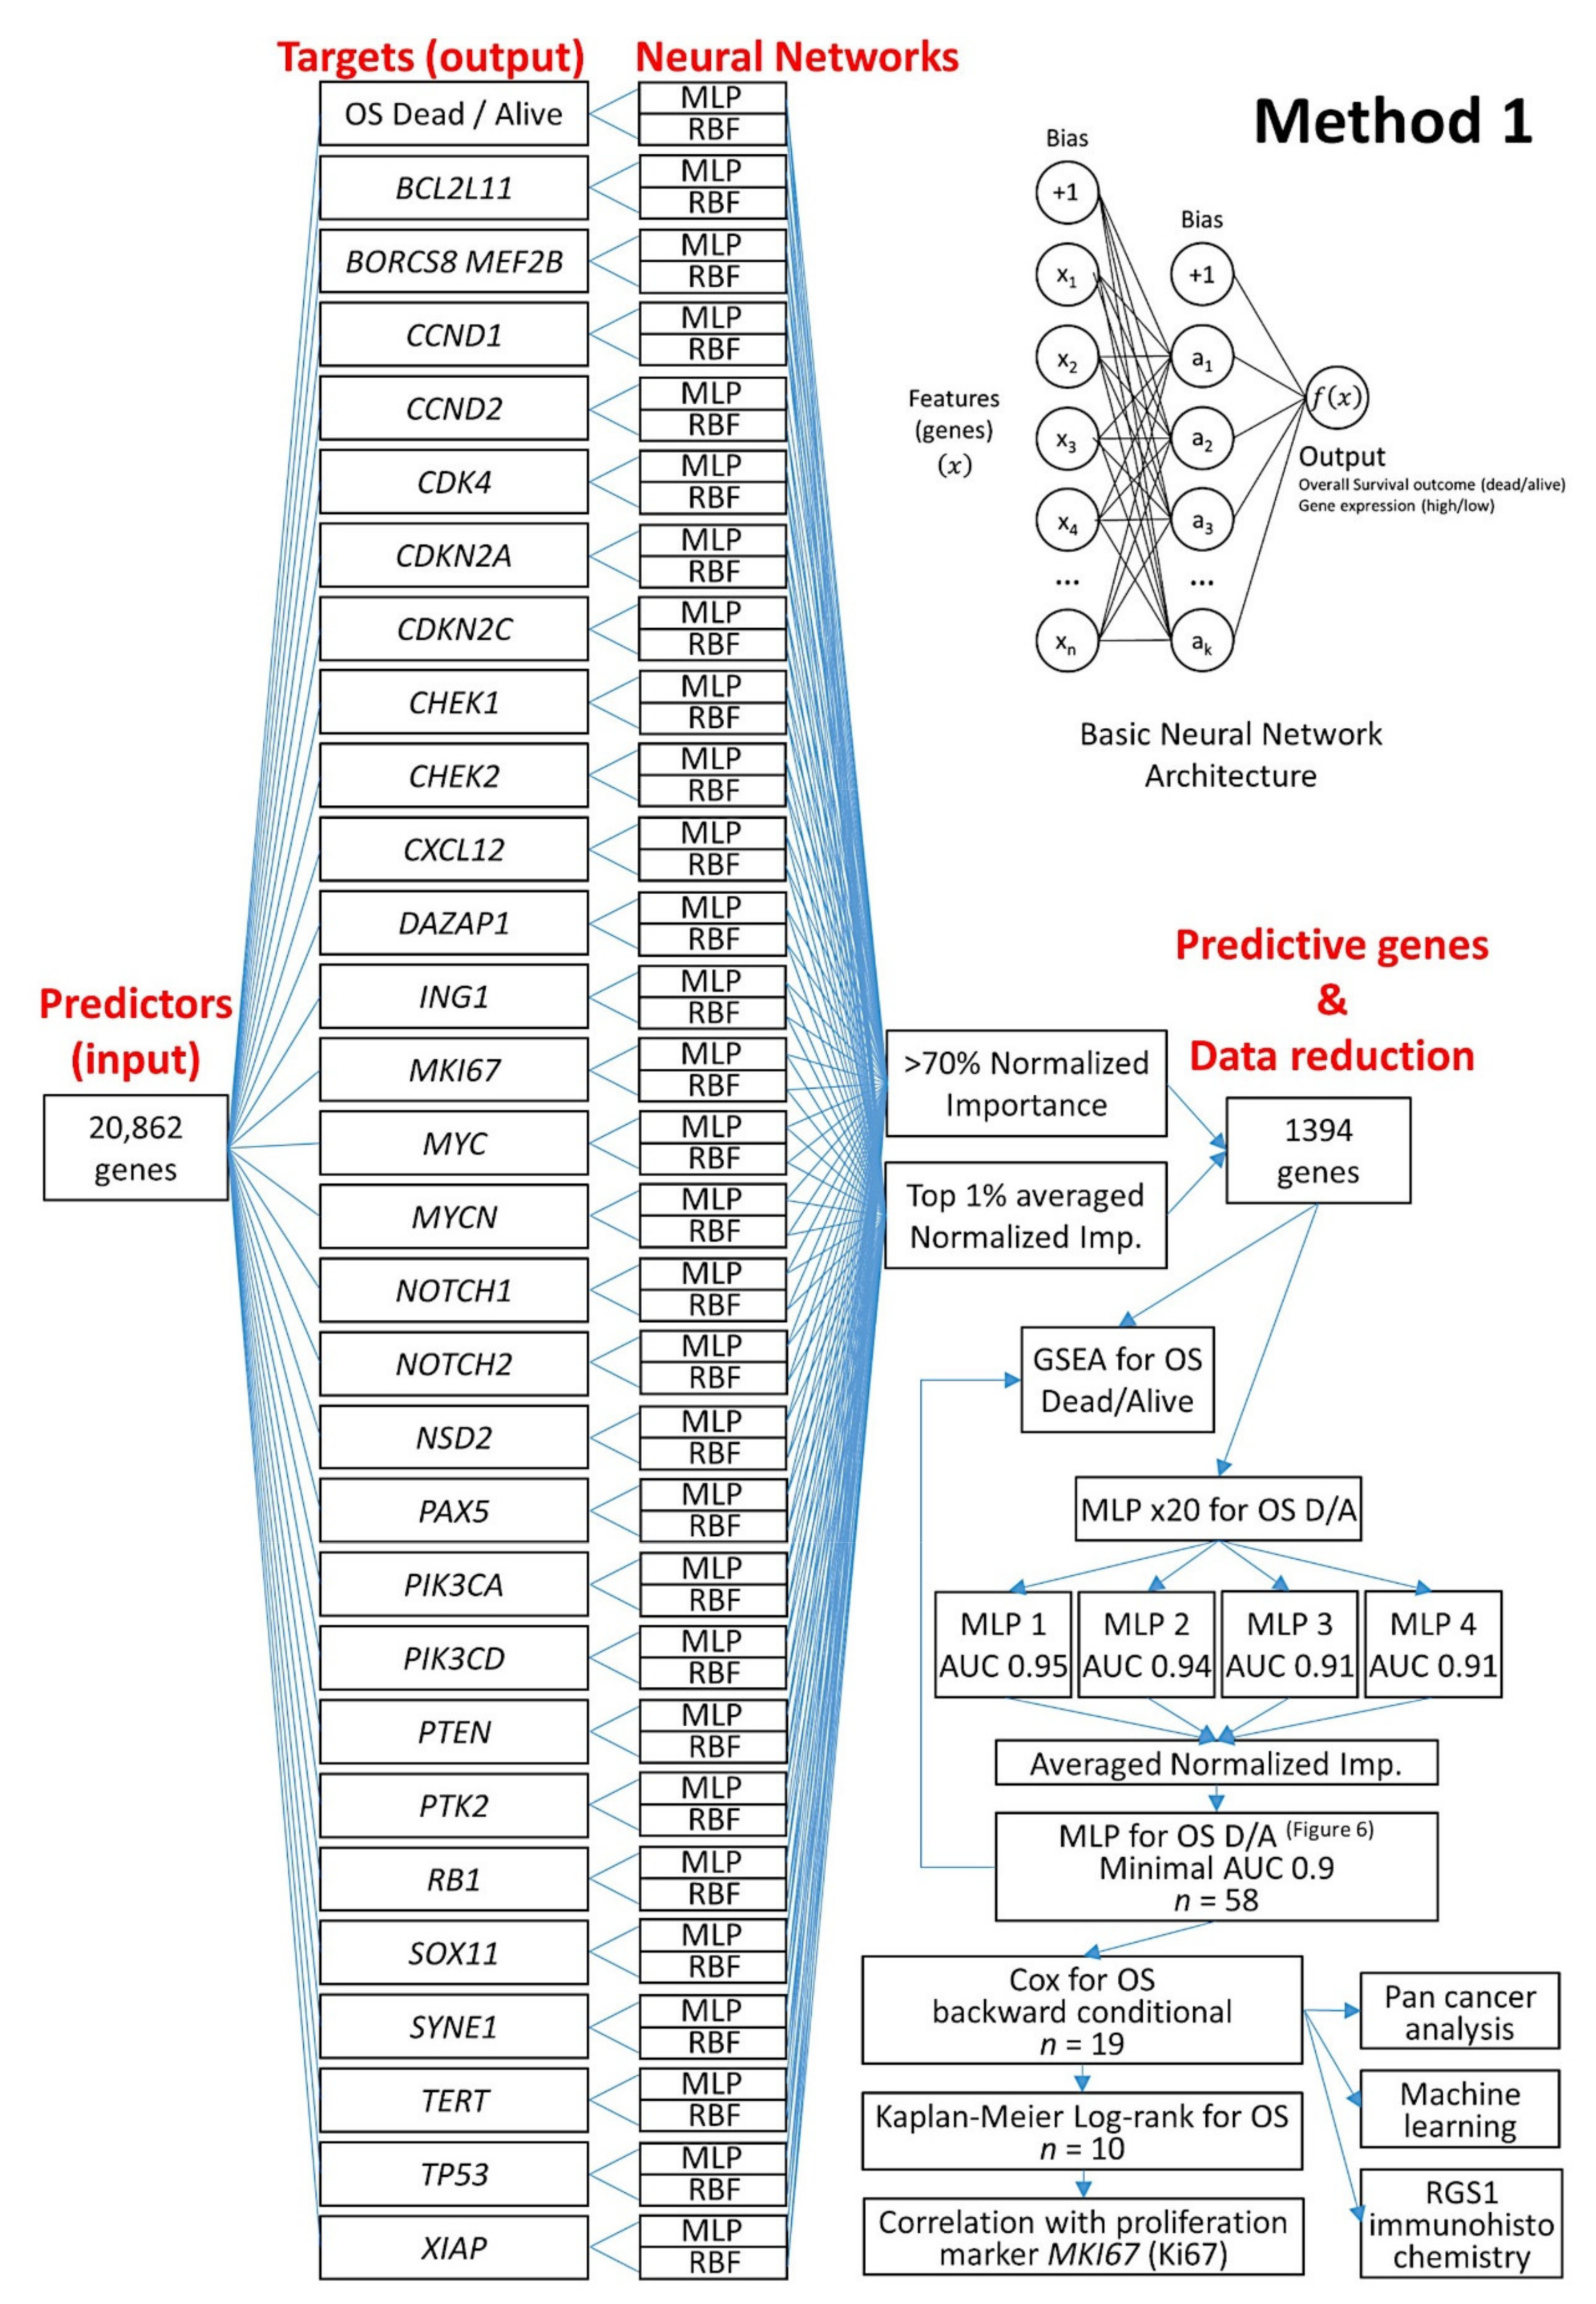
2.5.1. Algorithm Based on the Input of 20,862 Genes (Method 1)
2.5.2. Algorithm Based on the Input of 10 Immune Oncology Panels (Method 2)
2.6. Conventional Statistical Analyses
2.7. Immunohistochemistry
3. Results
3.1. Highlights
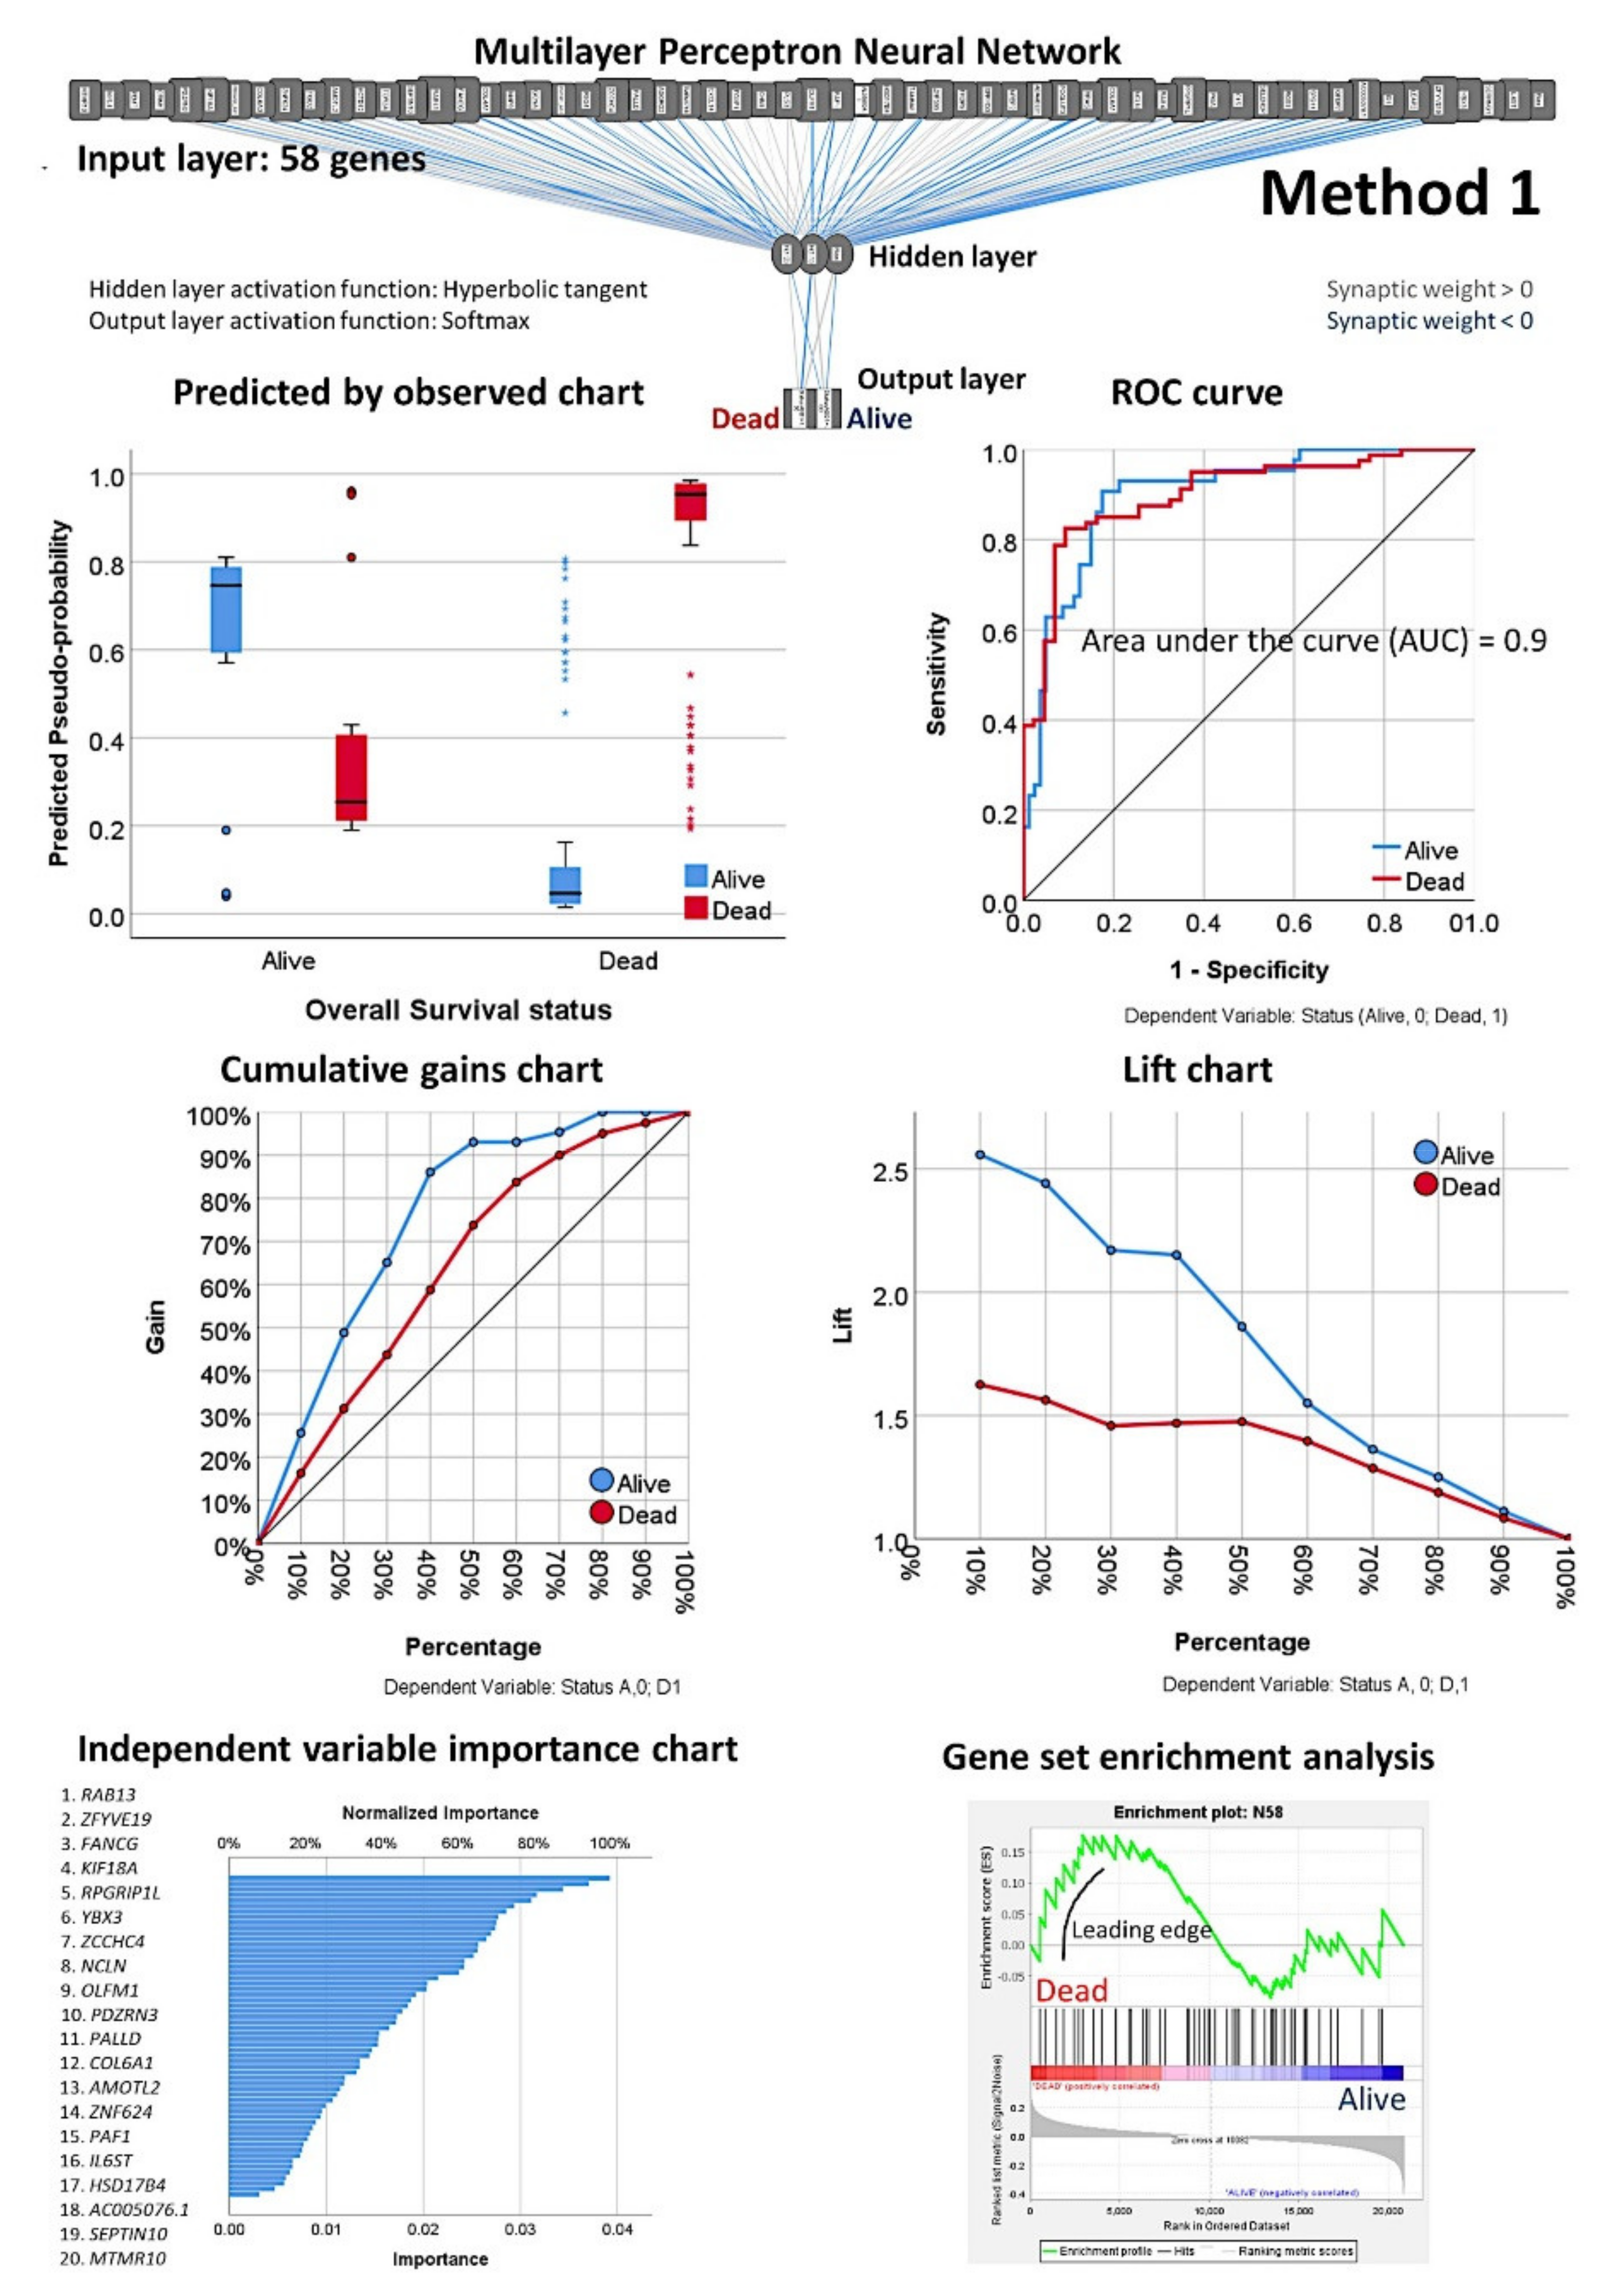
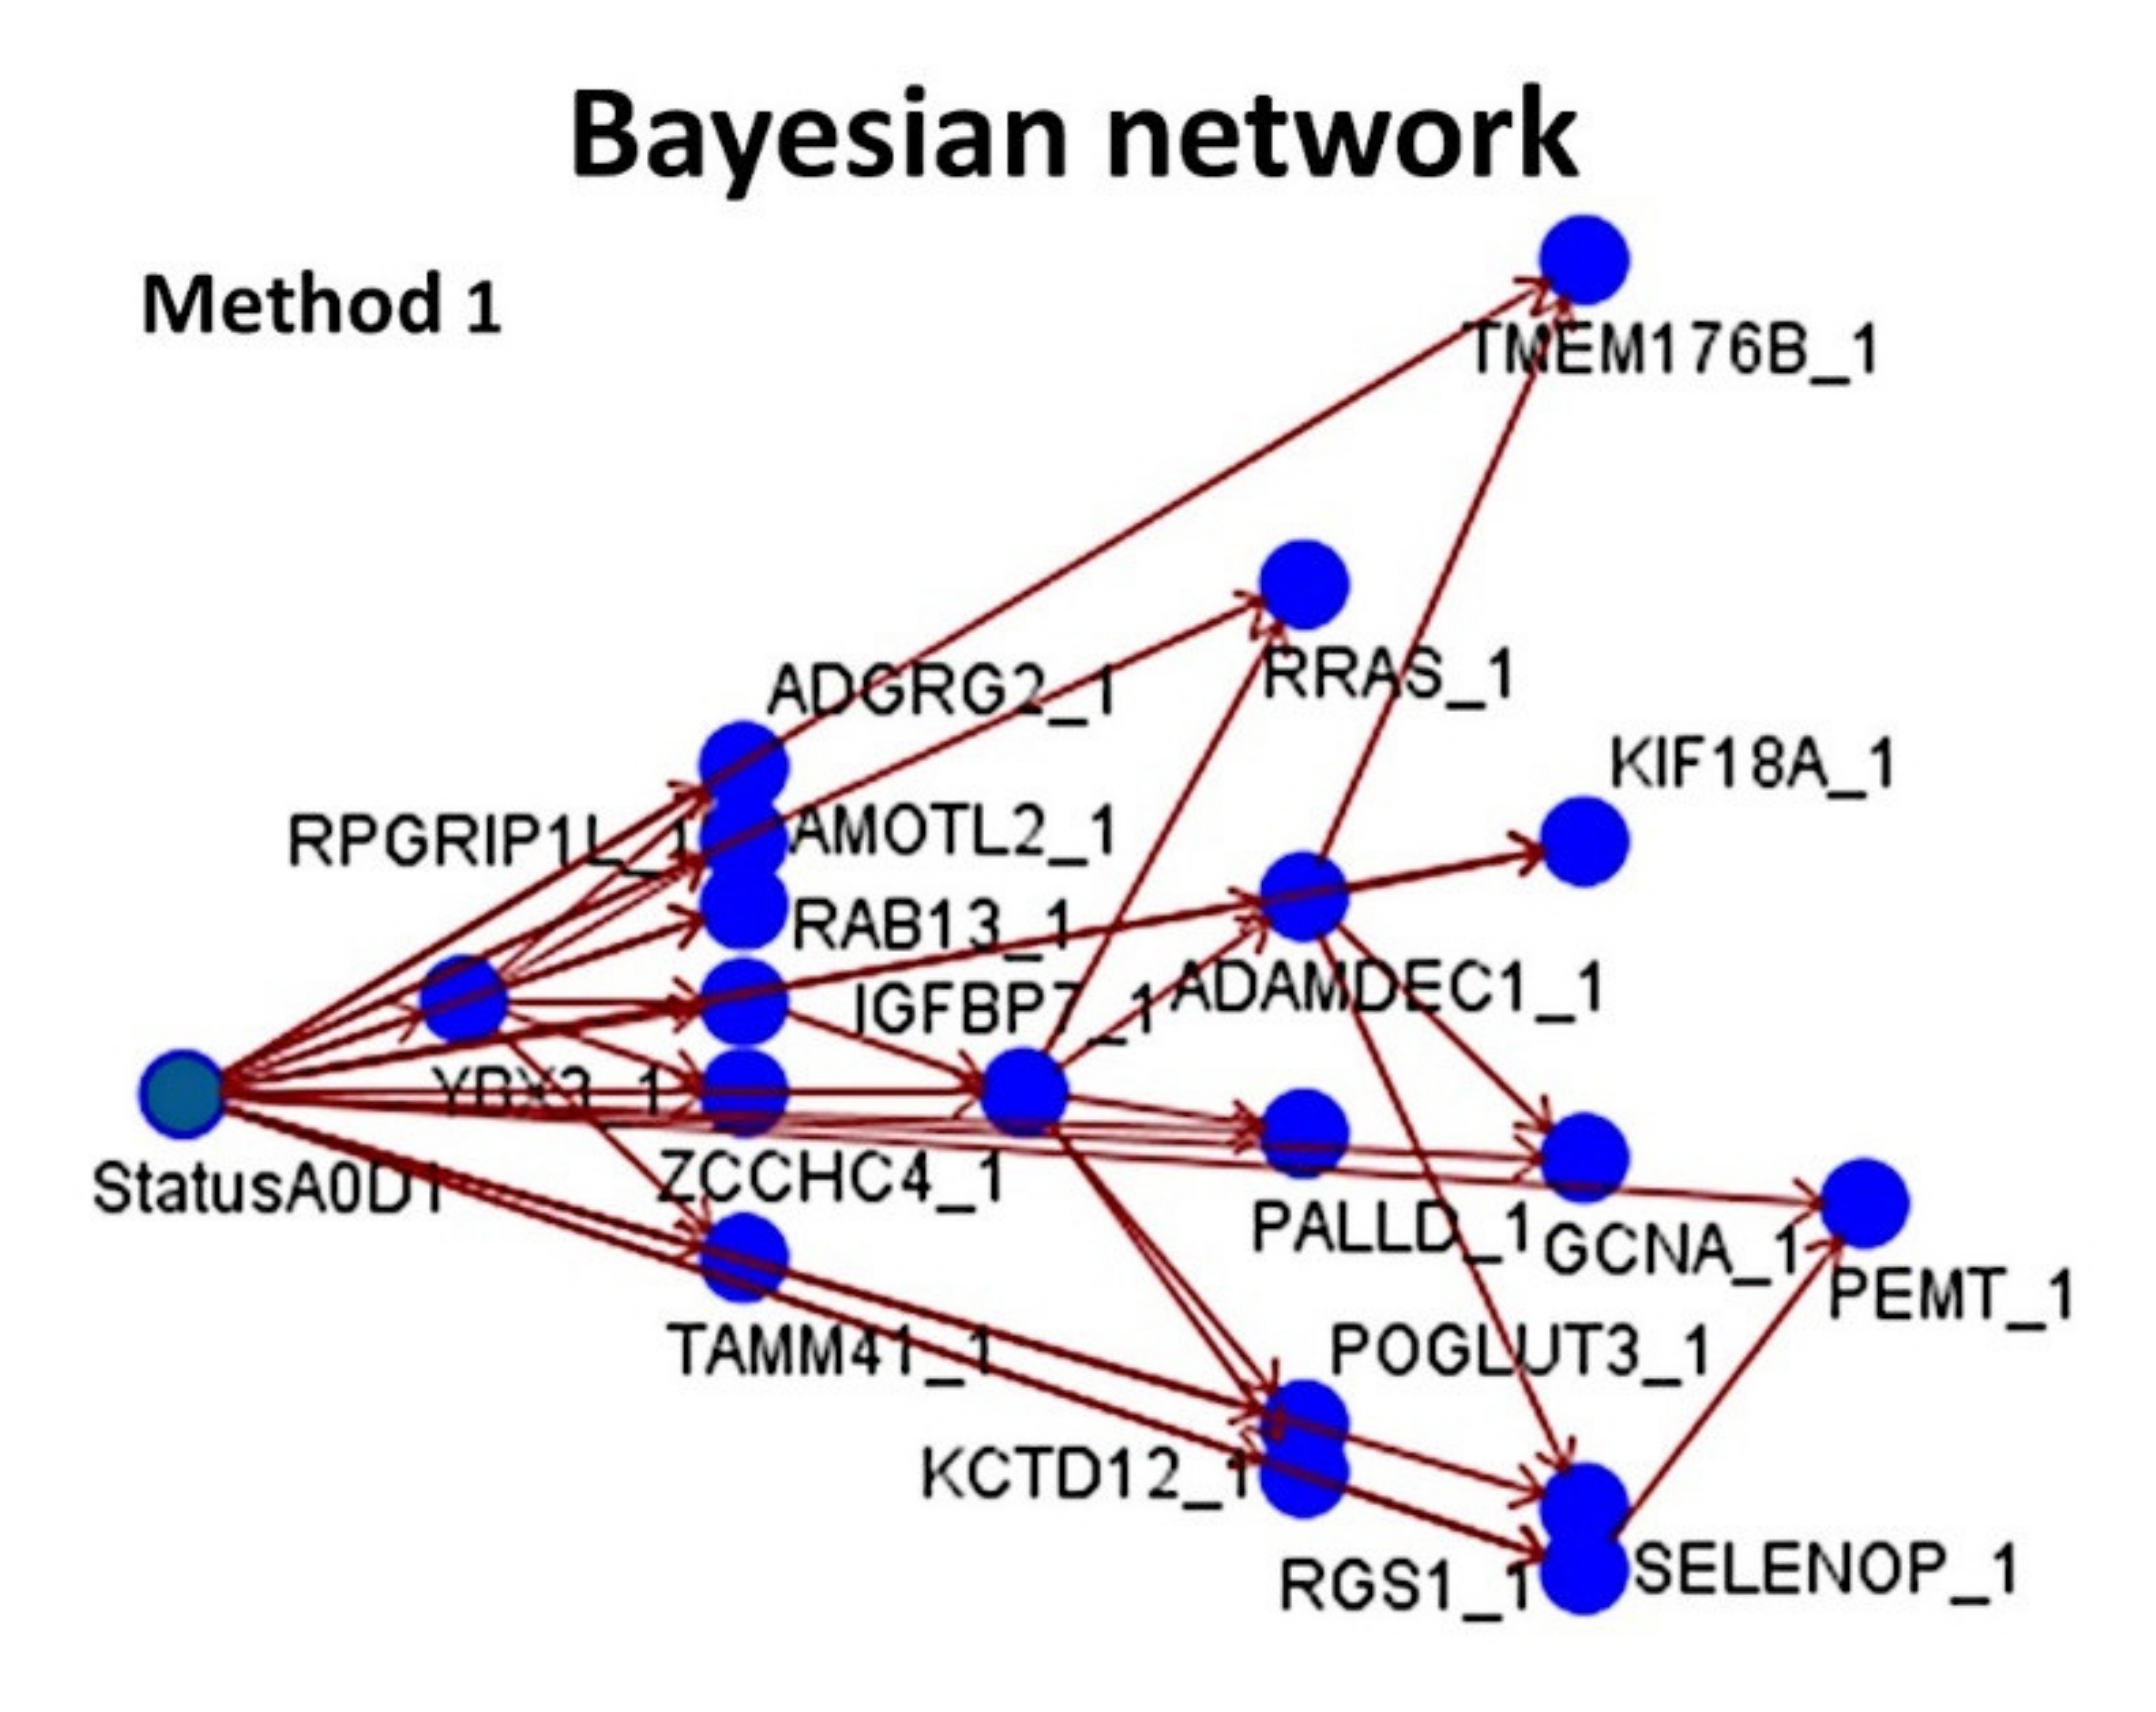
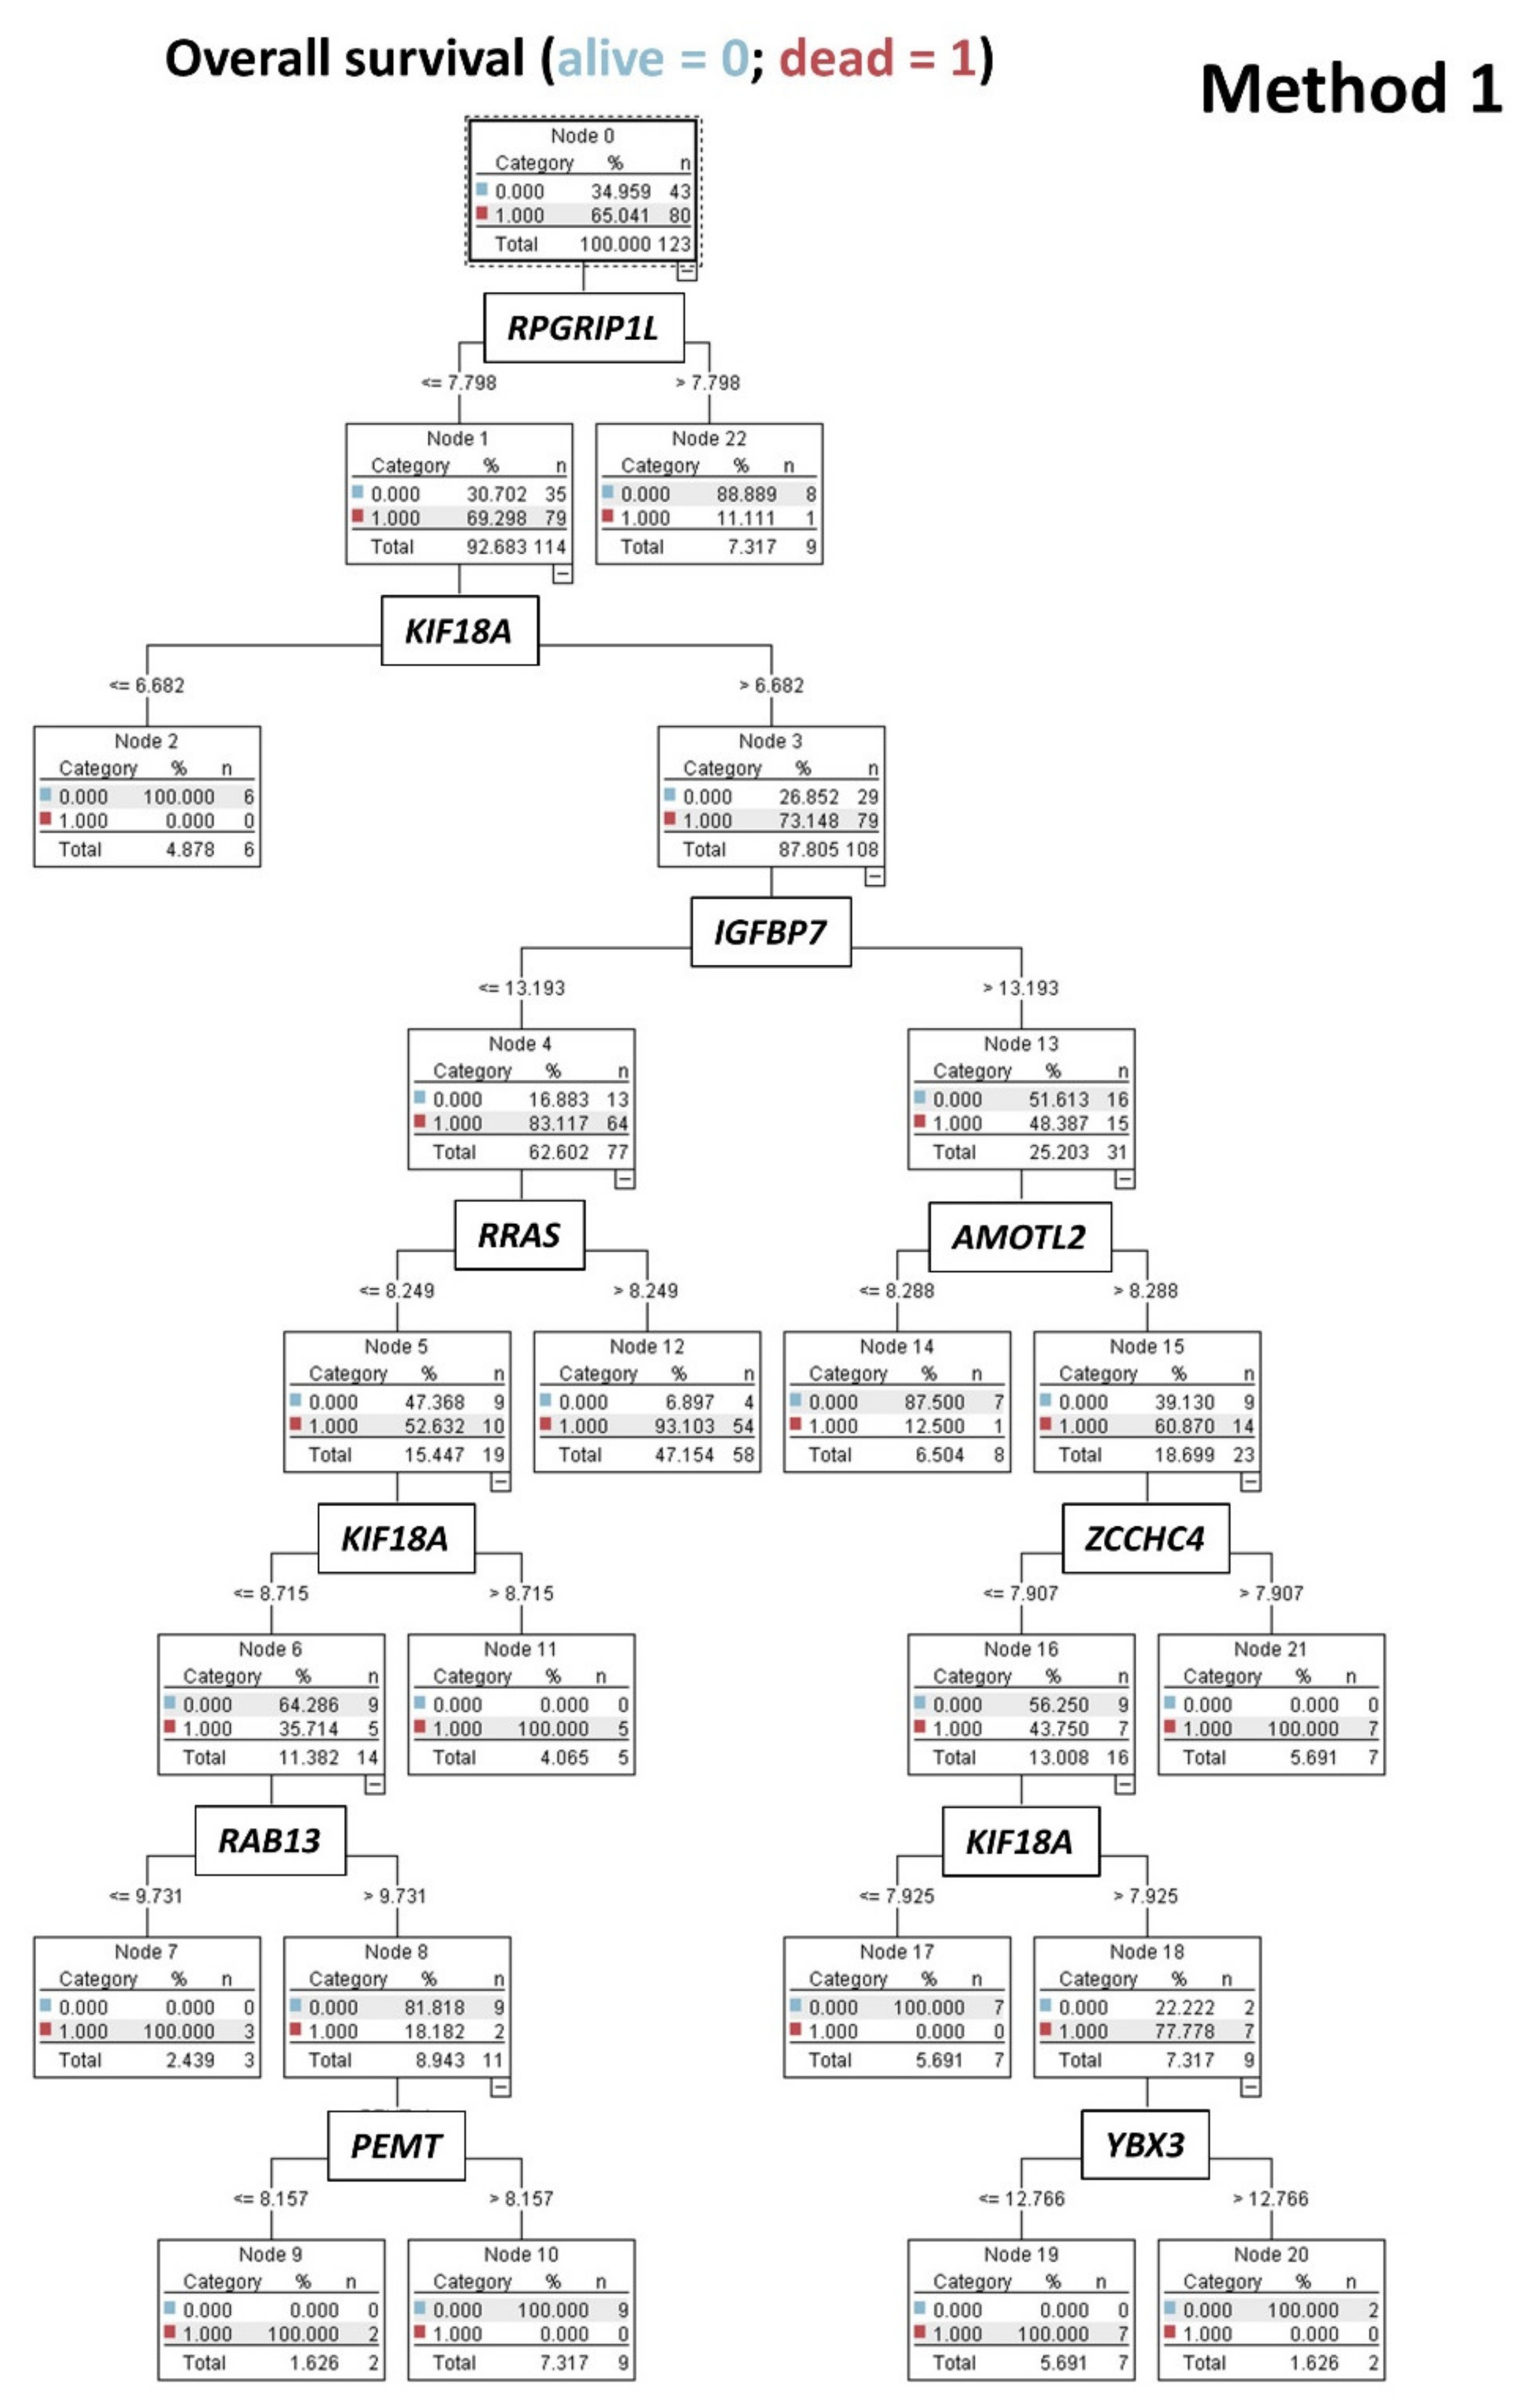
- Using 20,862 genes as a start point (input layers) (Method 1), several neural network analyses correlated with the overall survival outcome and with known pathogenic genes of MCL (output layers), and a final set of 19 genes with predictive value was highlighted (Figure 5);
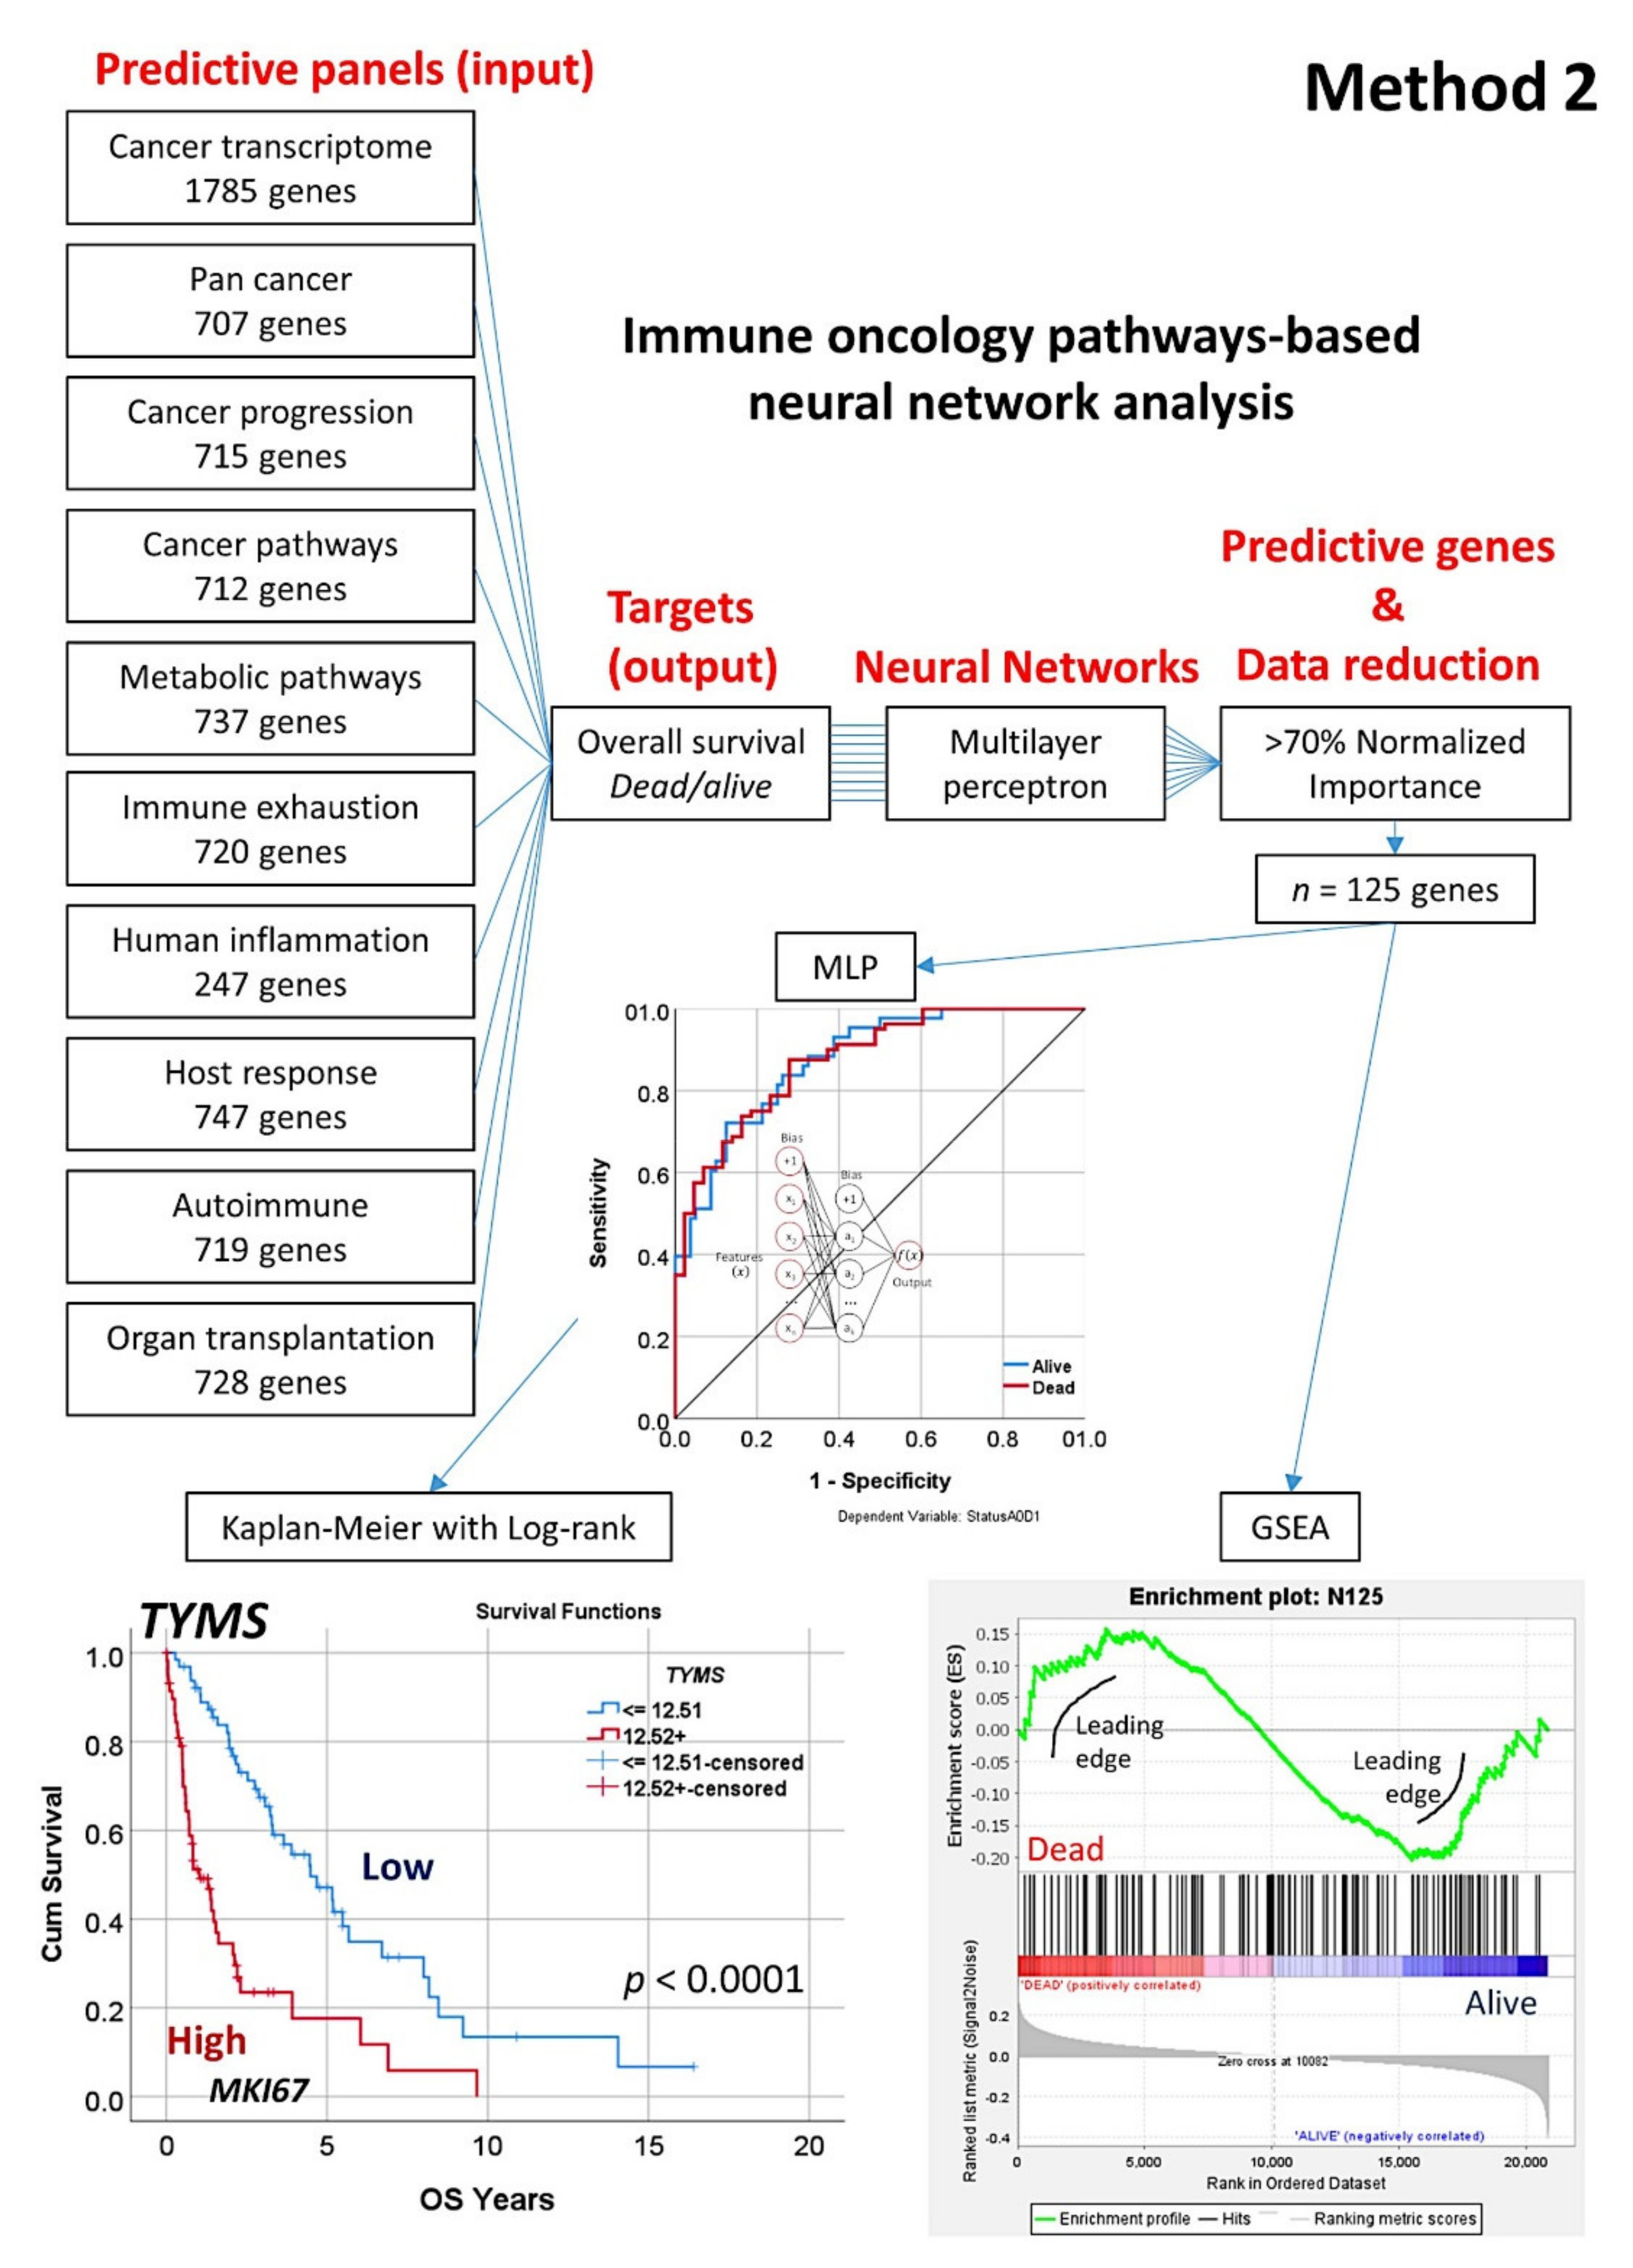
- This type of analysis was repeated focusing on 10 immune, cancer, and immuno-oncology panels (Method 2), and 15 genes were highlighted (Figure 8);
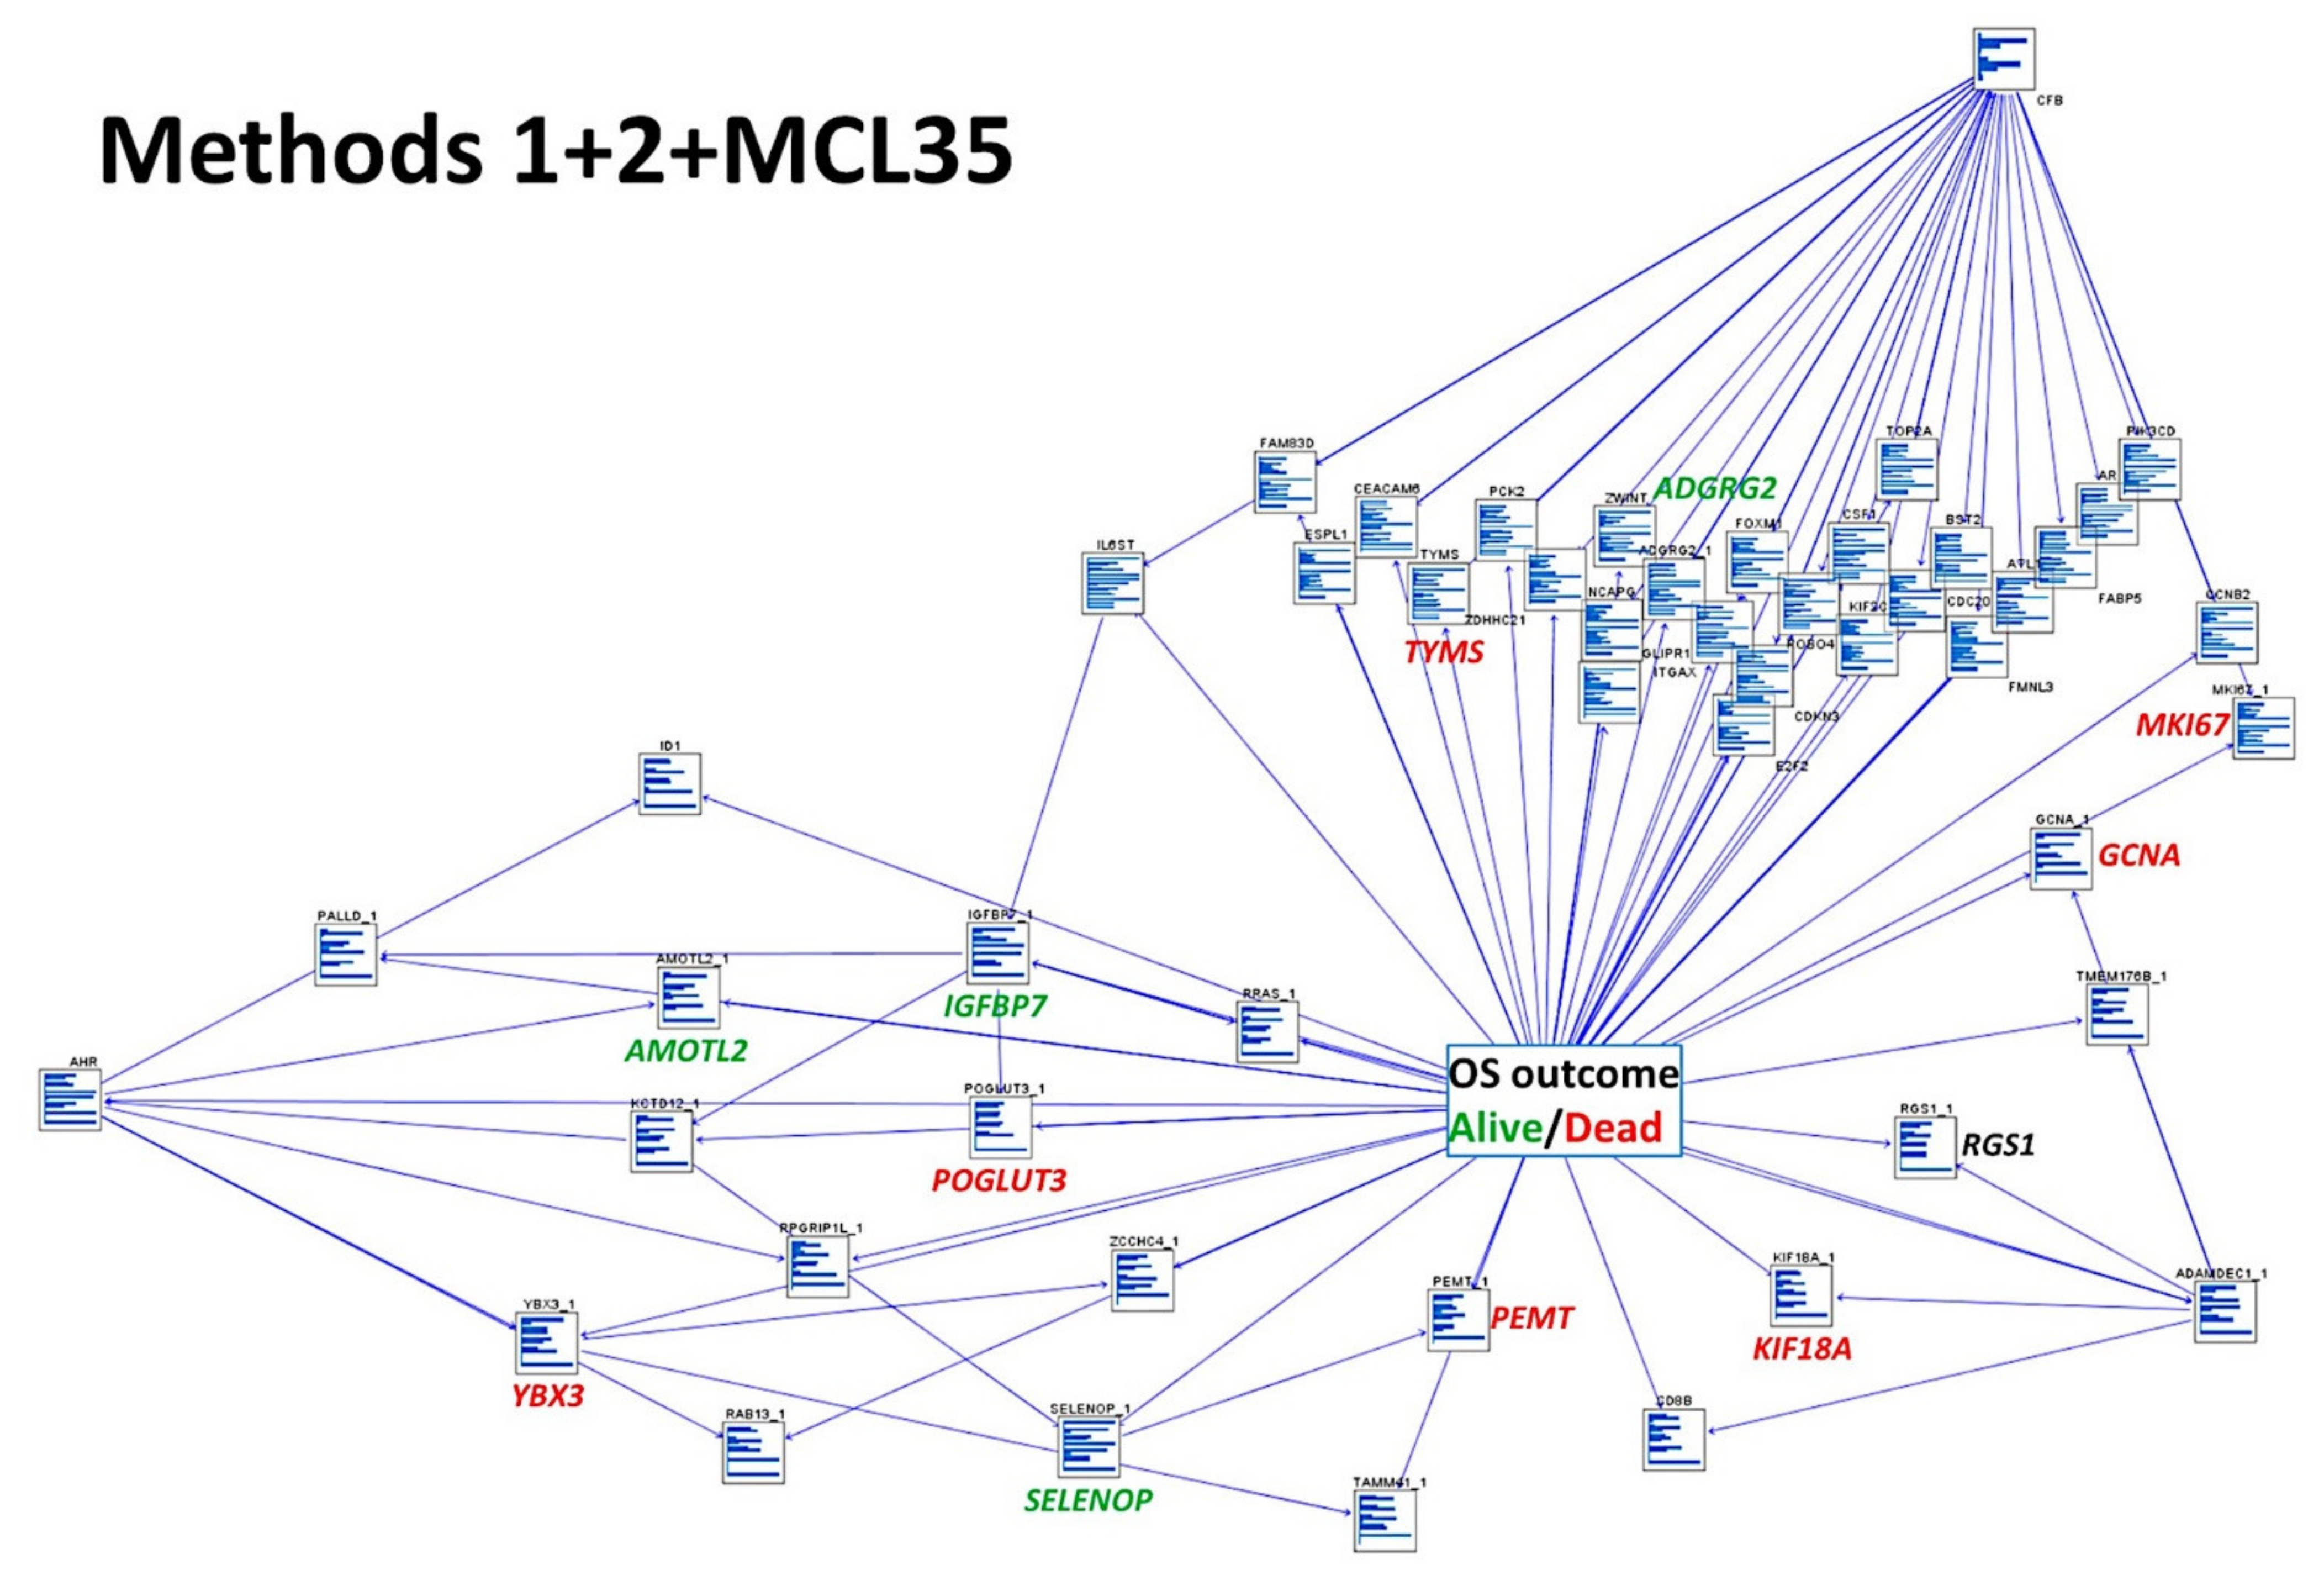
- The combination of both Methods 1 (19 genes) and 2 (15 genes) with the LLMPP MCL35 assay (17) genes and analysis using several machine learning and neural networks techniques predicted the overall survival outcome (dead vs. alive) with high accuracy.
3.2. Prediction of Overall Survival Based on the 20,862 Genes of the Array (Method 1)
3.3. Prediction of Overall Survival Based on the Immuno-Oncology Panels (Method 2)
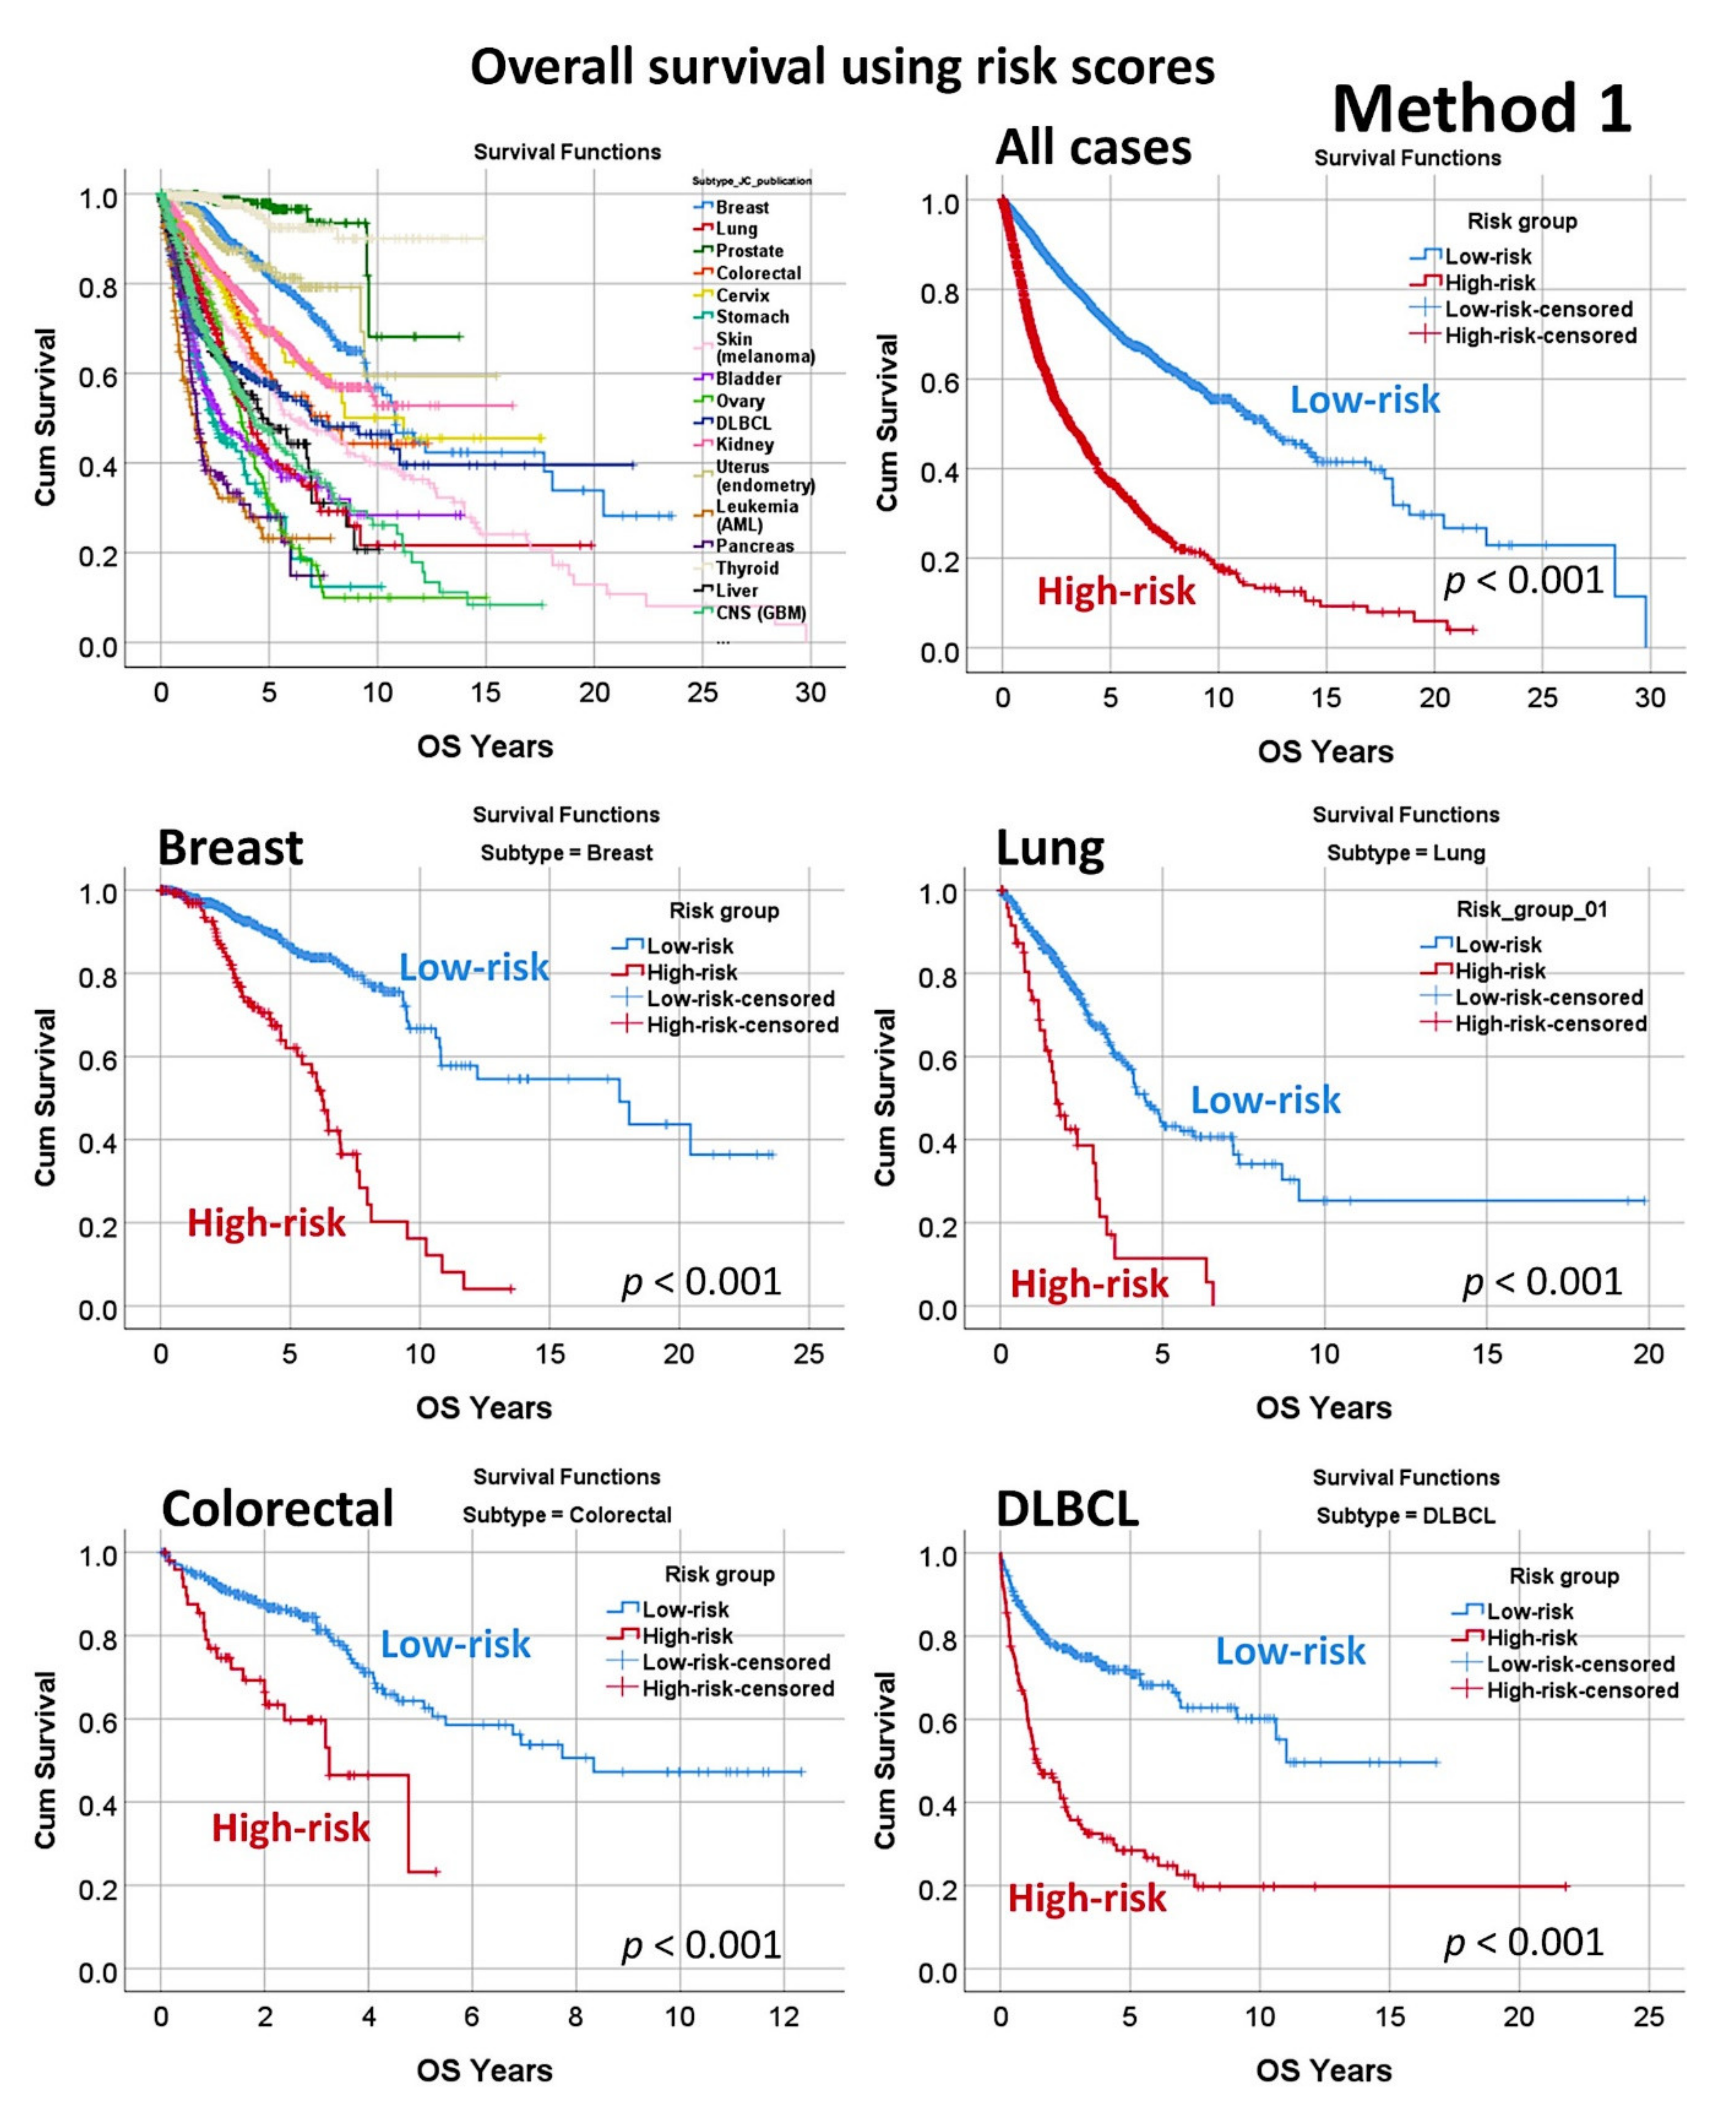
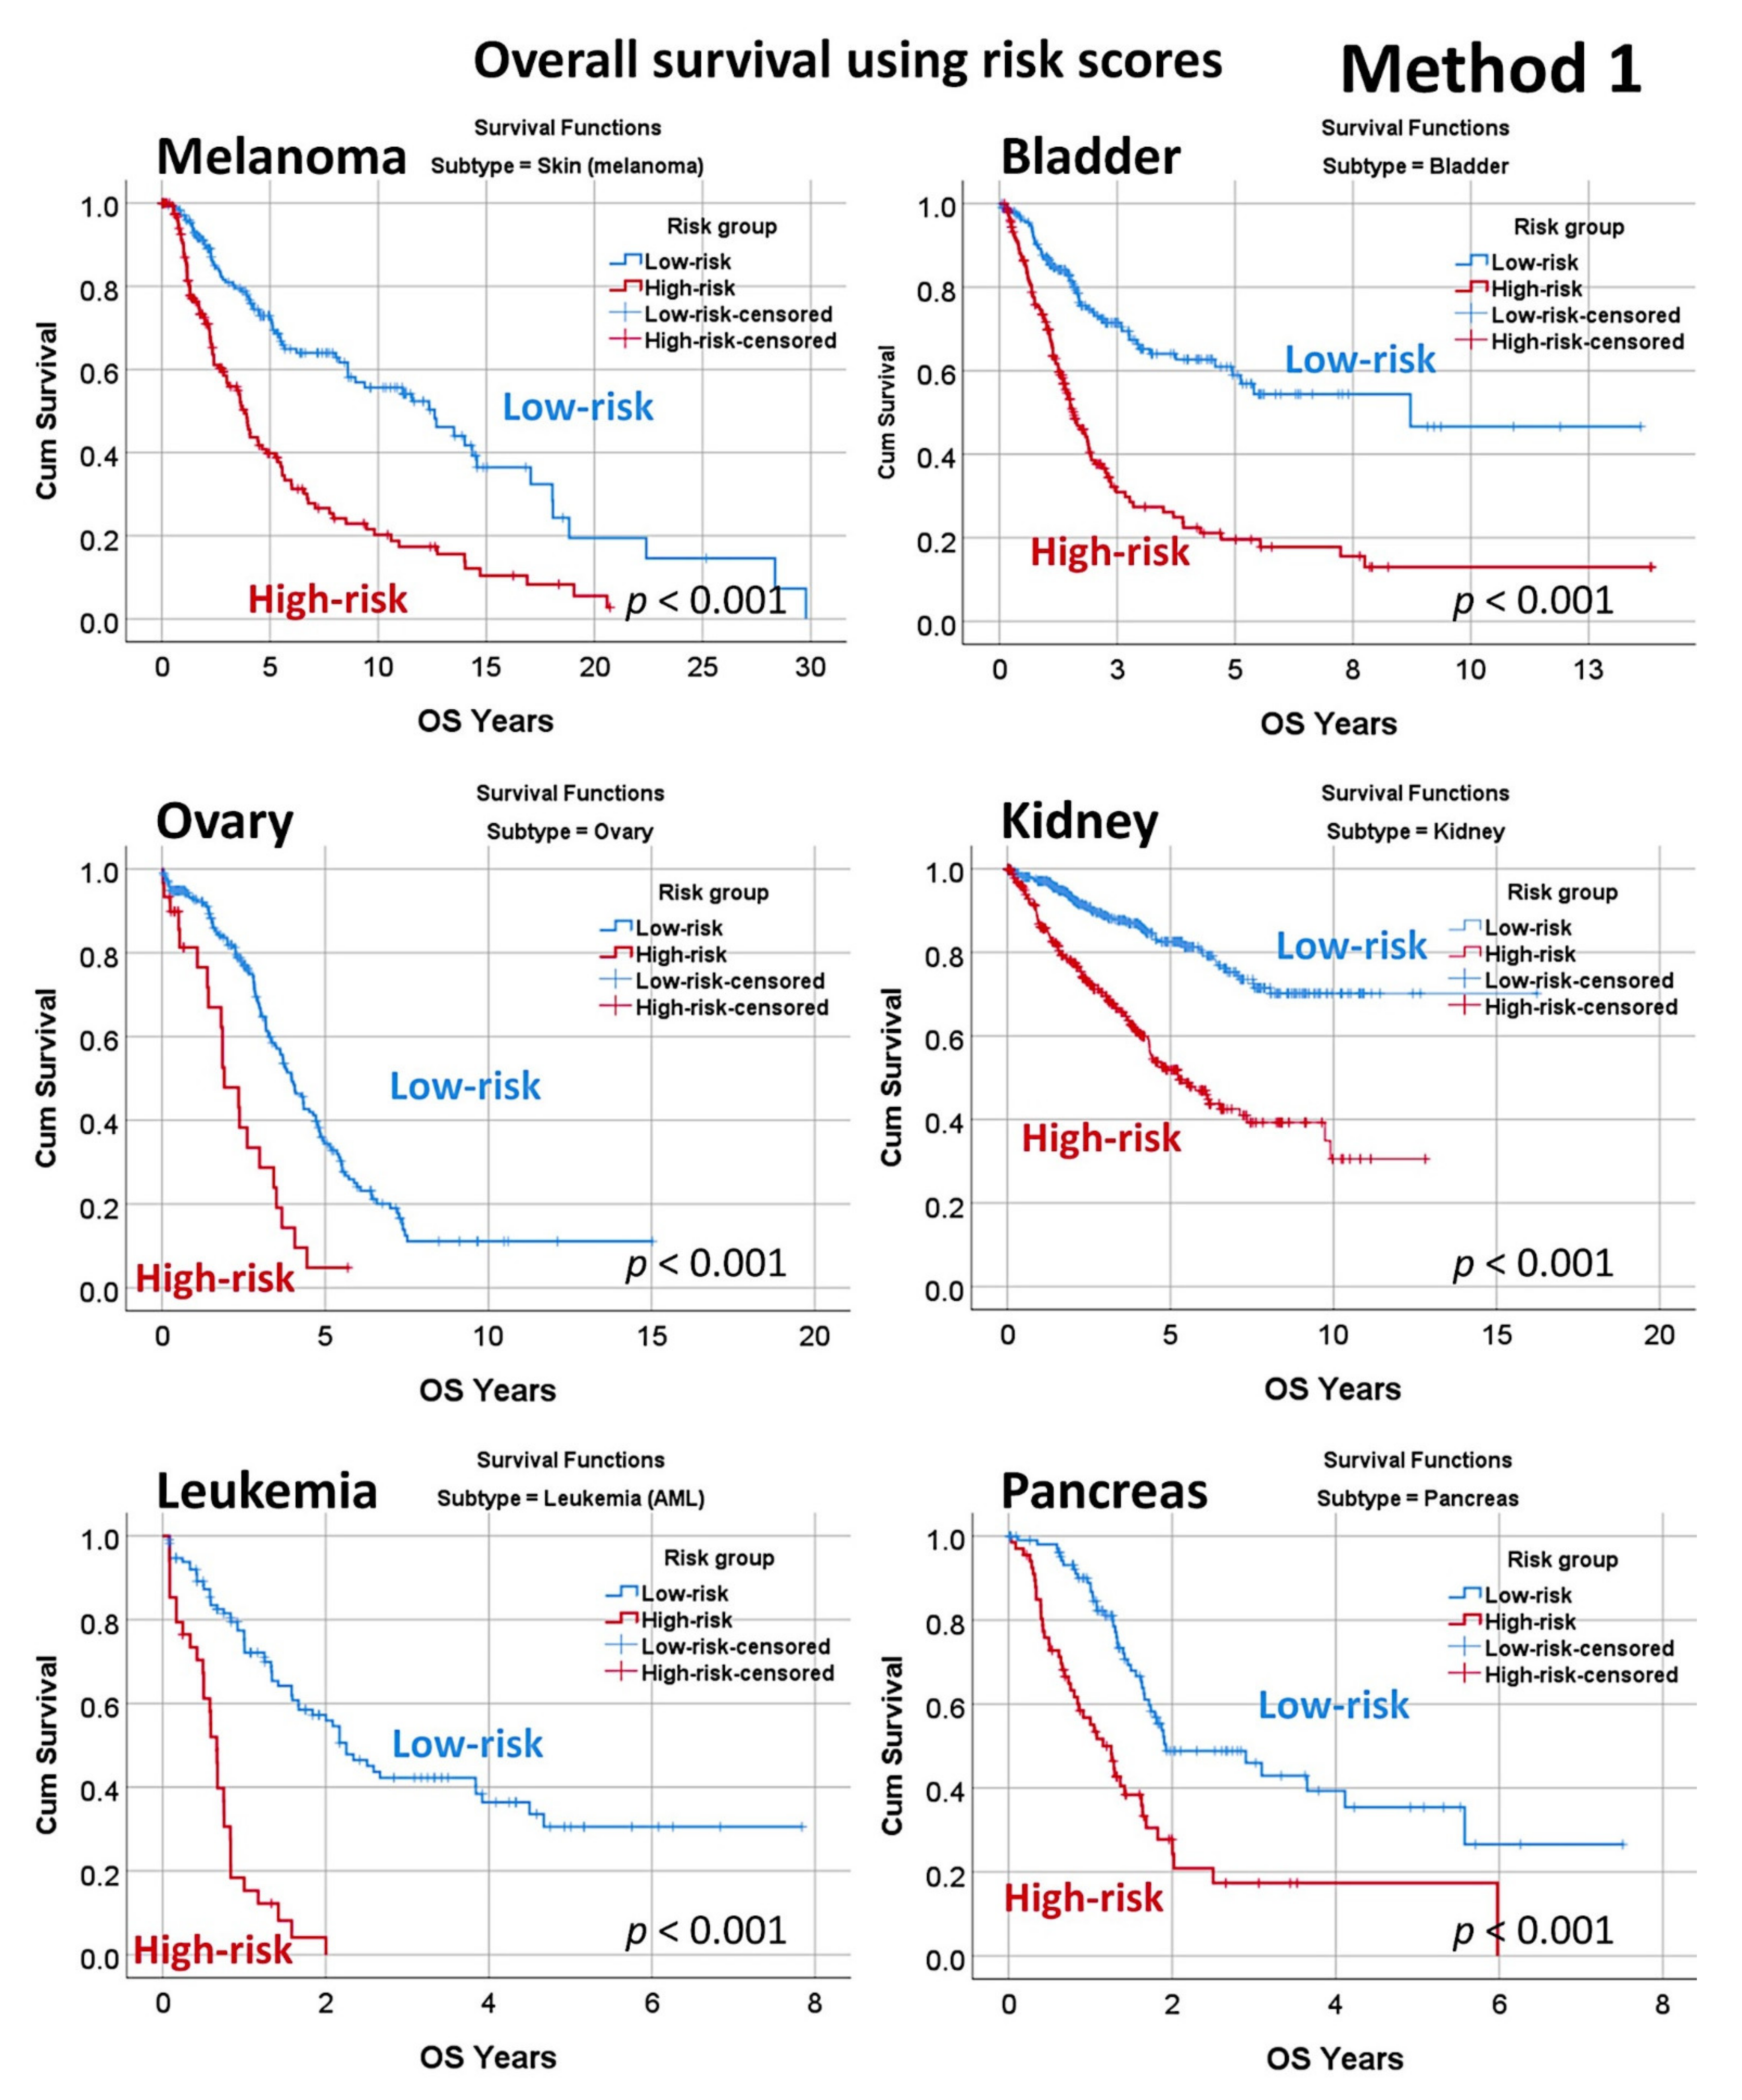
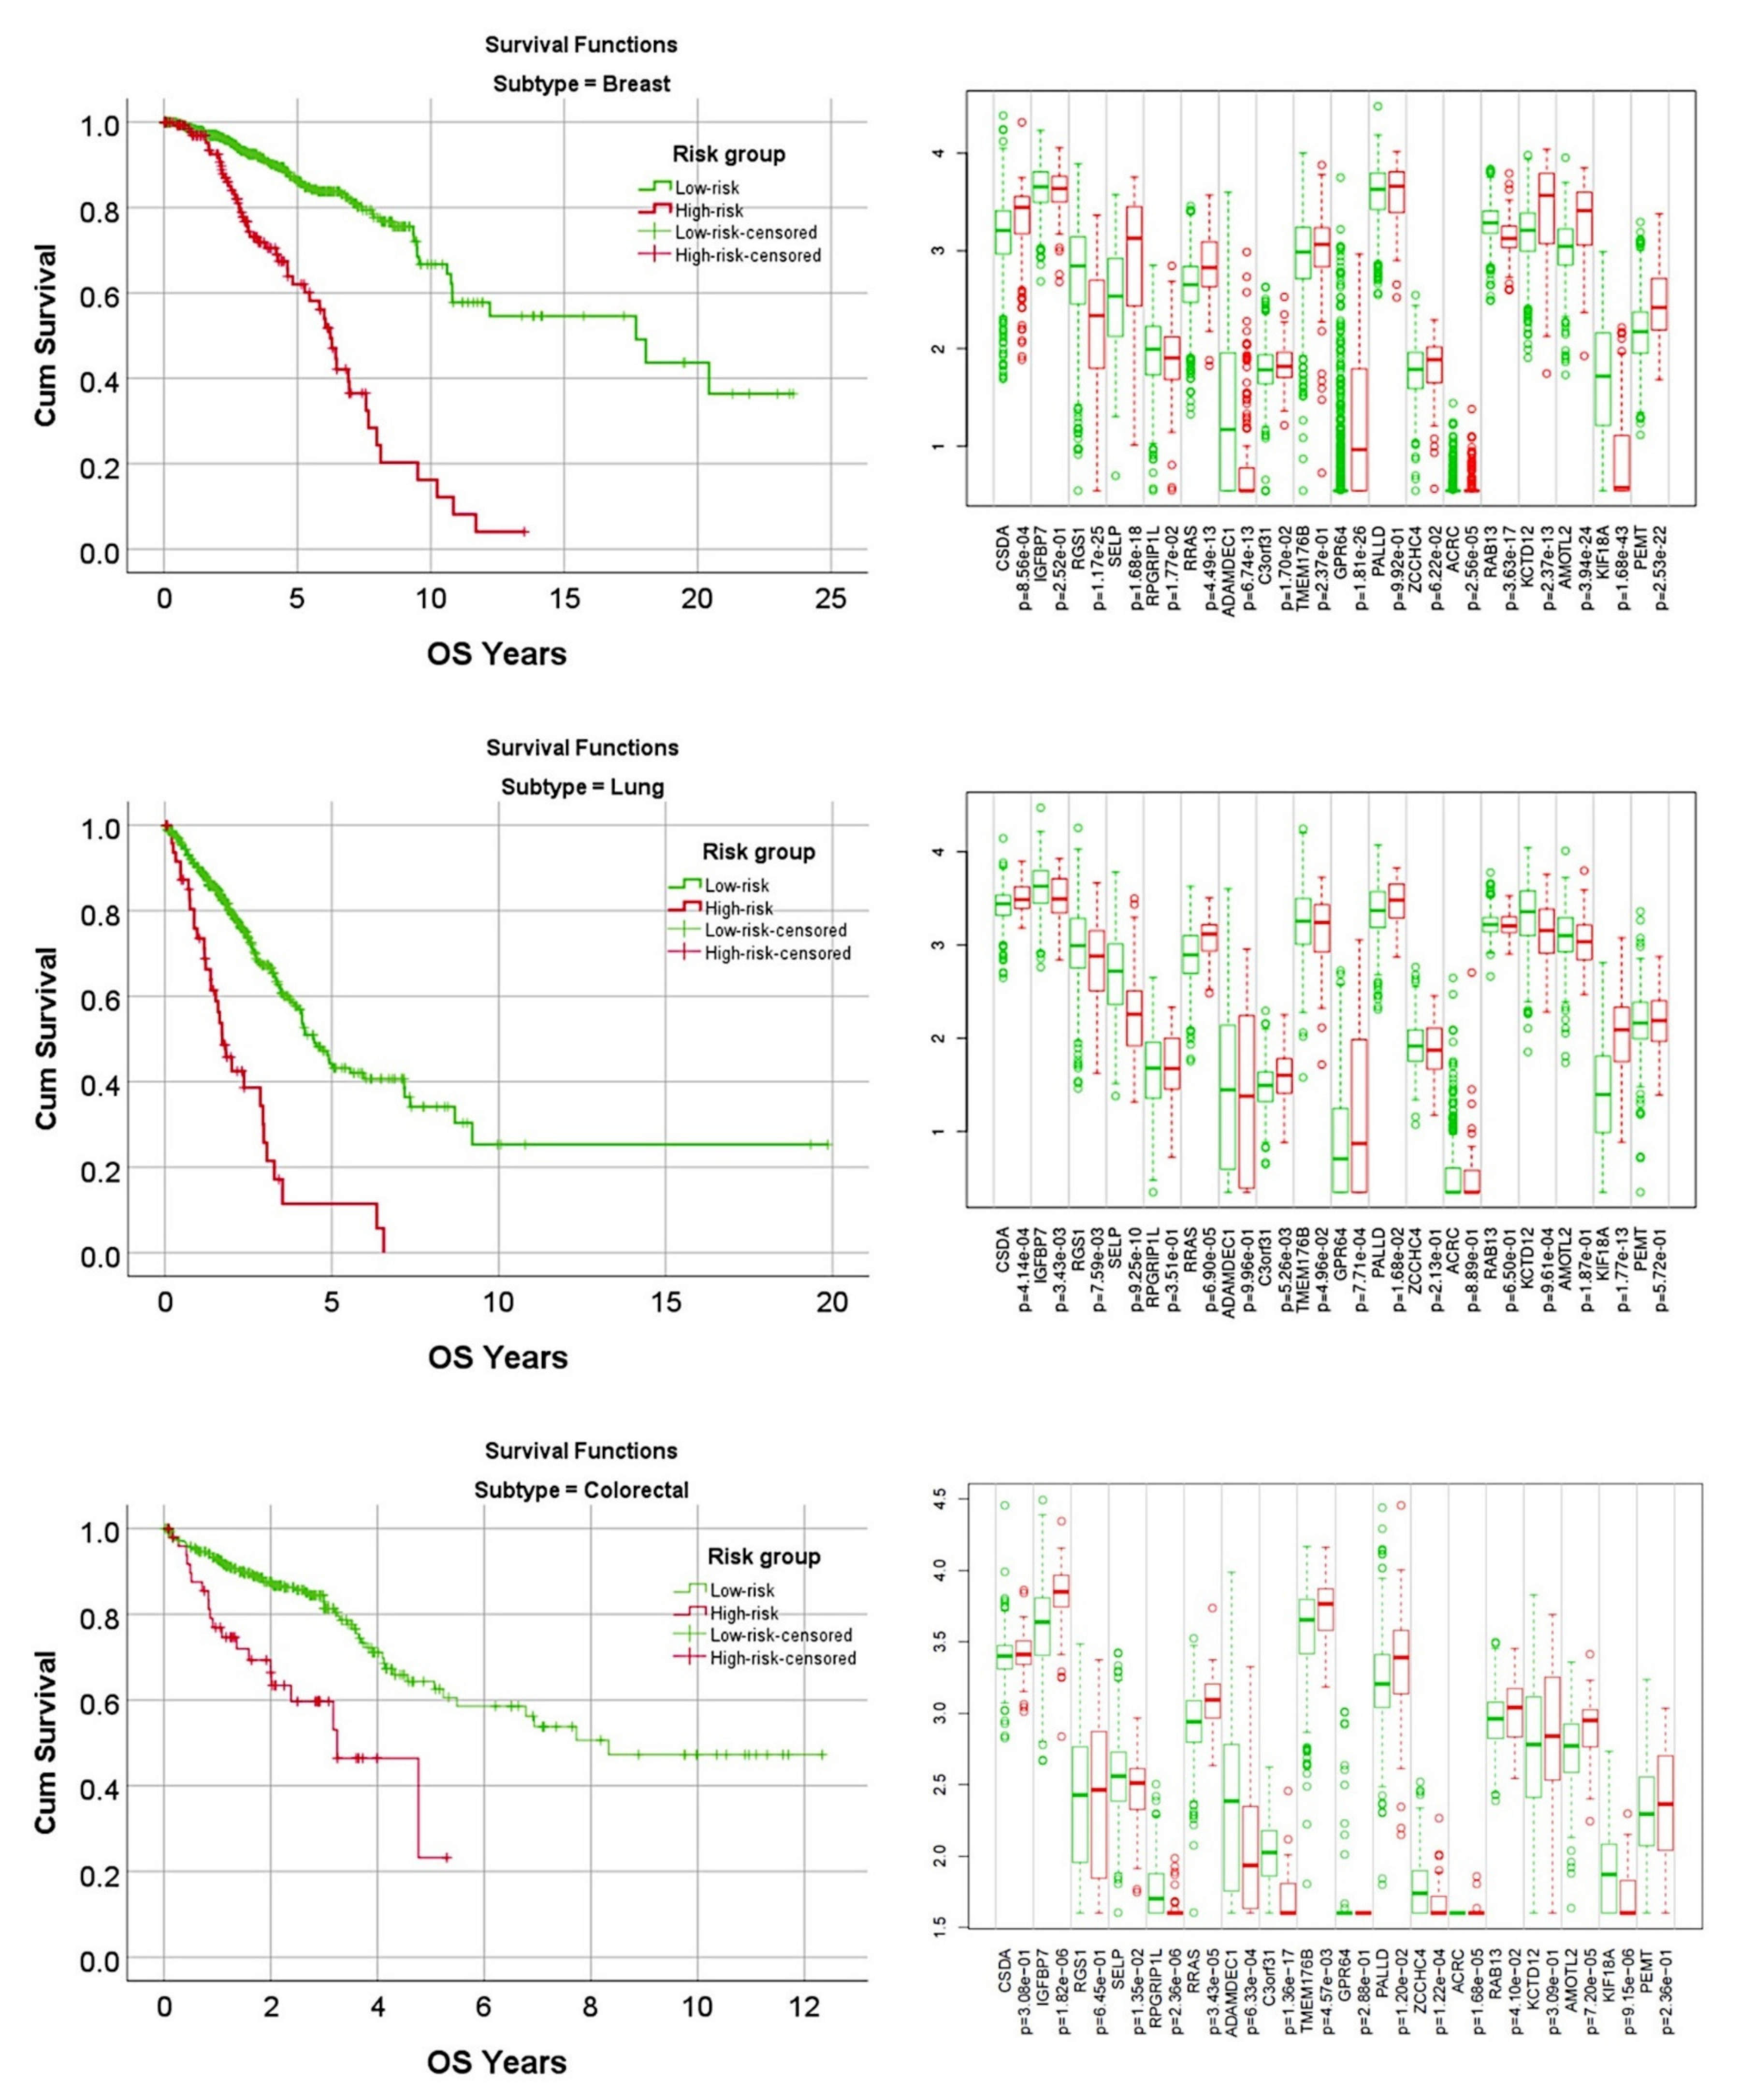
3.4. Prediction of Overall Survival of a Pan-Cancer Series
3.5. Prediction of Overall Survival Outcome Using other Machine Learning Techniques
3.6. Combination of Method 1, Method 2, and the LLMPP MCL35 Prognostic Gene Signature
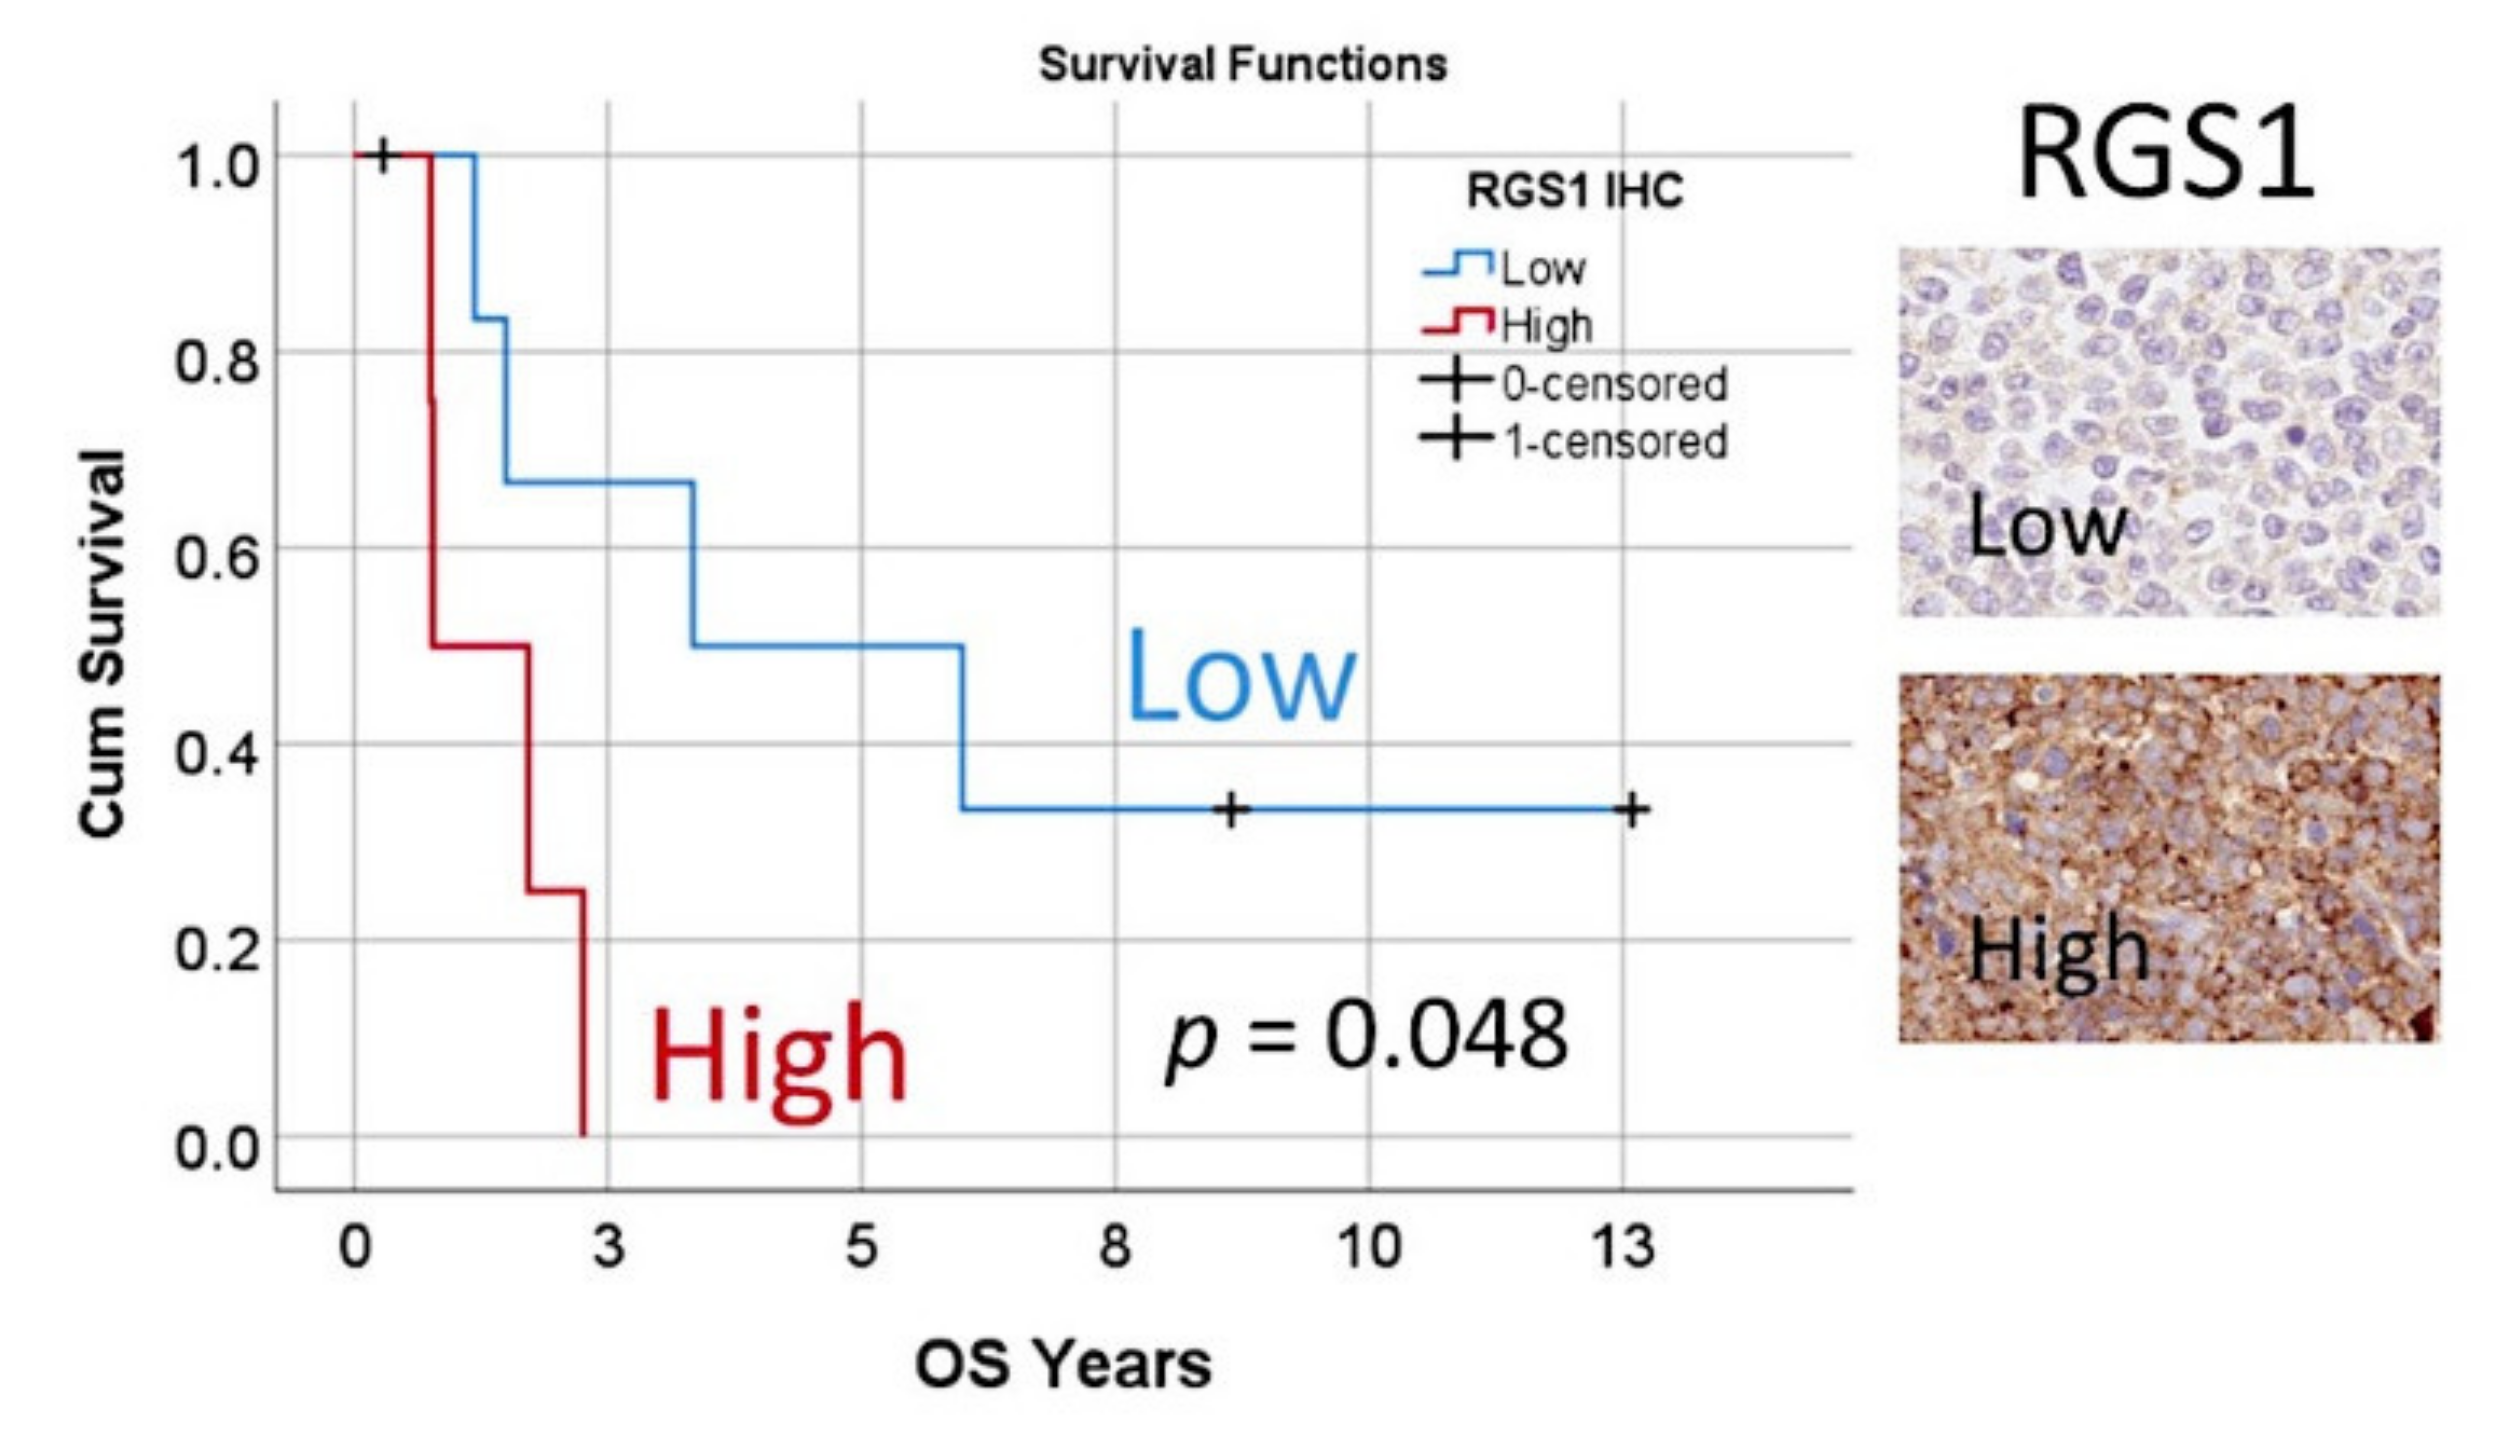
3.7. Immunohistochemical Analysis of RGS1
4. Discussion
5. Conclusions
Author Contributions
Funding
Institutional Review Board Statement
Informed Consent Statement
Data Availability Statement
Acknowledgments
Conflicts of Interest
Appendix A

| Gene | Num. Genes Top 70% | Case Processing Summary | Network Layers | Model Summary | Classification | Area under the Curve (AUC) | ||||||||||||||||
|---|---|---|---|---|---|---|---|---|---|---|---|---|---|---|---|---|---|---|---|---|---|---|
| Training | Testing | Input | Hidden | Output | Training | Testing | Training (% Correct) | Testing (% Correct) | ||||||||||||||
| Num. | % | Num. | % | Units | Num. | Units | Num. | Units | Cross Entropy Error | Incorrect Predictions % | Training Time | Cross Entropy Error | Incorrect Predictions % | Observed 0 | Observed 1 | Overall | Observed 0 | Observed 1 | Overall | |||
| Dead/Alive | 80 | 84 | 68.3 | 39 | 31.7 | 20863 | 1 | 6 | 1 | 2 | 38.2 | 21.4 | 01:04.9 | 10.4 | 12.8 | 67.6 | 86 | 78.6 | 88.9 | 86.7 | 87.2 | 0.90 |
| SYNE1 | 6 | 90 | 73.2 | 33 | 26.8 | 20862 | 1 | 12 | 1 | 2 | 38.5 | 18.9 | 01:05.8 | 8.8 | 9.1 | 59.3 | 90.5 | 81.1 | 66.7 | 96.3 | 90.9 | 0.86 |
| DAZAP1 | 80 | 87 | 70.7 | 36 | 29.3 | 20862 | 1 | 11 | 1 | 2 | 32.0 | 14.9 | 01:06.3 | 6.4 | 5.6 | 64 | 93.5 | 85.1 | 83.3 | 96.7 | 94.4 | 0.92 |
| MYCN | 154 | 85 | 69.1 | 38 | 30.9 | 20862 | 1 | 8 | 1 | 2 | 37.5 | 27.1 | 01:01.5 | 14.4 | 13.2 | 36.4 | 85.7 | 72.9 | 66.7 | 93.1 | 86.8 | 0.82 |
| CXCL12 | 56 | 87 | 70.7 | 36 | 29.3 | 20862 | 1 | 8 | 1 | 2 | 40.5 | 19.5 | 00:57.4 | 10.1 | 8.3 | 44 | 95.2 | 80.5 | 83.3 | 93.3 | 91.7 | 0.83 |
| NOTCH2 | 20 | 84 | 68.3 | 39 | 31.7 | 20862 | 1 | 9 | 1 | 2 | 29.9 | 20.2 | 00:58.2 | 11.8 | 17.9 | 92.3 | 36.8 | 79.8 | 93.1 | 50 | 82.1 | 0.90 |
| CDK4 | 47 | 87 | 70.7 | 36 | 29.3 | 20862 | 1 | 11 | 1 | 2 | 30.4 | 13.8 | 00:51.2 | 13.8 | 22.2 | 91.3 | 66.7 | 86.2 | 100 | 27.3 | 77.8 | 0.89 |
| BMI1 | 25 | 93 | 85.6 | 30 | 24.4 | 20862 | 1 | 8 | 1 | 2 | 53.0 | 26.9 | 00:56.3 | 13.2 | 16.7 | 71.7 | 74.5 | 73.1 | 93.8 | 71.4 | 83.3 | 0.81 |
| ING1 | 94 | 76 | 61.8 | 47 | 38.2 | 20862 | 1 | 10 | 1 | 2 | 36.3 | 17.1 | 00:52.7 | 22.7 | 27.7 | 50 | 93.1 | 82.9 | 30.8 | 88.2 | 72.3 | 0.76 |
| NSD2 | 38 | 91 | 74 | 32 | 26 | 20862 | 1 | 9 | 1 | 2 | 43.0 | 20.9 | 01:04.7 | 15.1 | 15.6 | 82.4 | 75 | 79.1 | 91.7 | 80 | 84.4 | 0.86 |
| PTK2 | 6 | 93 | 75.6 | 30 | 24.4 | 20862 | 1 | 13 | 1 | 2 | 40.2 | 16.1 | 01:07.3 | 7.9 | 10 | 97.1 | 43.5 | 83.9 | 91.3 | 85.7 | 90 | 0.85 |
| PIK3CA | 4 | 76 | 61.8 | 47 | 38.2 | 20862 | 1 | 10 | 1 | 2 | 26.4 | 13.2 | 00:52.4 | 17.7 | 12.8 | 94.8 | 61.1 | 86.8 | 94.3 | 66.7 | 87.2 | 0.88 |
| CHEK1 | 86 | 91 | 74 | 32 | 26 | 20862 | 1 | 9 | 1 | 2 | 45.3 | 27.5 | 00:58.7 | 12.9 | 18.8 | 68.8 | 76.7 | 72.5 | 92.9 | 72.2 | 81.3 | 0.85 |
| CHEK2 | 8 | 90 | 73.2 | 33 | 26.8 | 20862 | 1 | 10 | 1 | 2 | 39.8 | 18.9 | 01:07.6 | 13.0 | 15.2 | 77.3 | 84.8 | 81.1 | 83.3 | 86.7 | 84.8 | 0.88 |
| PIK3CD | 50 | 82 | 66.7 | 41 | 33.3 | 20862 | 1 | 10 | 1 | 2 | 17.6 | 11.0 | 01:08.1 | 14.6 | 14.6 | 90.9 | 86.8 | 89 | 90.9 | 78.9 | 85.4 | 0.96 |
| XIAP | 22 | 85 | 69.1 | 38 | 30.9 | 20862 | 1 | 12 | 1 | 2 | 40.2 | 18.8 | 00:49.9 | 17.7 | 23.7 | 83.7 | 78.6 | 81.2 | 85.7 | 64.7 | 76.3 | 0.87 |
| PAX5 | 23 | 88 | 71.5 | 35 | 28.5 | 20862 | 1 | 7 | 1 | 2 | 45.3 | 27.3 | 00:55.2 | 13.0 | 8.6 | 20 | 93.7 | 72.7 | 50 | 100 | 91.4 | 0.75 |
| BCL2L11 | 12 | 71 | 57.7 | 52 | 42.3 | 20862 | 1 | 5 | 1 | 2 | 29.9 | 19.7 | 00:50.1 | 24.2 | 23.1 | 92.6 | 41.2 | 80.3 | 94.9 | 23.1 | 76.9 | 0.82 |
| BORCS8_MEF2B | 12 | 85 | 69.1 | 38 | 30.9 | 20862 | 1 | 11 | 1 | 2 | 39.2 | 21.2 | 00:53.3 | 11.6 | 10.5 | 40.9 | 92.1 | 78.8 | 55.6 | 100 | 89.5 | 0.83 |
| PTEN | 86 | 84 | 68.3 | 39 | 31.7 | 20862 | 1 | 10 | 1 | 2 | 36.0 | 20.2 | 00:57.0 | 12.2 | 7.7 | 92.1 | 42.9 | 79.8 | 93.3 | 88.9 | 92.3 | 0.85 |
| MYC | 10 | 84 | 68.3 | 39 | 31.7 | 20862 | 1 | 9 | 1 | 2 | 28.9 | 16.7 | 00:56.2 | 14.2 | 20.5 | 87.7 | 68.4 | 83.3 | 96.4 | 36.4 | 79.5 | 0.90 |
| CCND1 | 23 | 87 | 70.7 | 36 | 29.3 | 20862 | 1 | 8 | 1 | 2 | 38.3 | 23.0 | 01:03.5 | 6.7 | 2.8 | 92.3 | 31.8 | 77 | 96.4 | 100 | 97.2 | 0.89 |
| MKI67 | 2 | 93 | 75.6 | 30 | 24.4 | 20862 | 1 | 10 | 1 | 2 | 40.2 | 20.4 | 01:04.6 | 11.7 | 16.7 | 78 | 81.4 | 79.6 | 85.7 | 81.3 | 83.3 | 0.89 |
| CCND2 | 46 | 76 | 61.8 | 47 | 38.2 | 20862 | 1 | 9 | 1 | 2 | 32.4 | 21.1 | 00:54.9 | 17.7 | 14.9 | 90.7 | 50 | 78.9 | 92.3 | 50 | 85.1 | 0.84 |
| CDKN2A | 112 | 91 | 74 | 32 | 26 | 20862 | 1 | 14 | 1 | 2 | 22.0 | 9.9 | 00:53.6 | 11.3 | 21.9 | 94.4 | 73.7 | 90.1 | 91.3 | 44.4 | 78.1 | 0.93 |
| CDKN2C | 6 | 90 | 73.2 | 33 | 26.8 | 20862 | 1 | 8 | 1 | 2 | 46.7 | 26.7 | 00:58.1 | 13.5 | 15.2 | 67.4 | 78.7 | 73.3 | 89.5 | 78.6 | 84.8 | 0.85 |
| TERT | 205 | 82 | 66.7 | 41 | 33.3 | 20862 | 1 | 9 | 1 | 2 | 34.6 | 20.7 | 01:00.8 | 14.9 | 19.5 | 93.7 | 31.6 | 79.3 | 93.3 | 45.5 | 80.5 | 0.85 |
| NOTCH1 | 15 | 85 | 69.1 | 38 | 30.9 | 20862 | 1 | 11 | 1 | 2 | 32.4 | 17.6 | 00:49.1 | 16.3 | 21.1 | 88.2 | 58.8 | 82.4 | 88.5 | 58.3 | 78.9 | 0.85 |
| RB1 | 47 | 88 | 71.5 | 35 | 28.5 | 20862 | 1 | 12 | 1 | 2 | 48.9 | 27.3 | 00:56.3 | 14.3 | 17.1 | 65.1 | 80 | 72.7 | 78.9 | 87.5 | 82.9 | 0.83 |
| Combined | 18 | 91 | 74 | 32 | 26 | 20835 | 1 | 8 | 29 | 58 | 1348.9 | 25.7 | 01:22.2 | 525.3 | 29.4 | - | - | 74.3 | - | - | 70.6 | - |
| Average | 85.9 | 70.1 | 37.1 | 30.2 | 20861 | 1 | 9.6 | - | - | 80.4 | 20.1 | - | 30.6 | 15.8 | 75.0 | 70.8 | 79.9 | 84.2 | 73.5 | 84.2 | 0.9 | |
| Gene | Num. Genes Top 70% | Case Processing Summary | Network Layers | Model Summary | Classification | Area under the Curve (AUC) | ||||||||||||||||
|---|---|---|---|---|---|---|---|---|---|---|---|---|---|---|---|---|---|---|---|---|---|---|
| Training | Testing | Input | Hidden | Output | Training | Testing | Training (% Correct) | Testing (% Correct) | ||||||||||||||
| Num. | % | Num. | % | Units | Num. | Units | Num. | Units | Sum of Squares Error | Incorrect Predictions % | Training Time | Sum of Squares Error | Incorrect Predictions % | Observed 0 | Observed 1 | Overall | Observed 0 | Observed 1 | Overall % | |||
| Dead/Alive | 37 | 92 | 74.8 | 31 | 25.2 | 20863 | 1 | 8 | 1 | 2 | 16.9 | 27.2 | 04:13.3 | 6.7 | 38.7 | 45.5 | 88.1 | 72.8 | 10.0 | 85.7 | 61.3 | 0.73 |
| SYNE1 | 18 | 85 | 69.1 | 38 | 30.9 | 20862 | 1 | 8 | 1 | 2 | 10.4 | 17.6 | 02:46.3 | 7.4 | 23.7 | 40.9 | 96.8 | 82.4 | 27.3 | 96.3 | 76.3 | 0.79 |
| DAZAP1 | 28 | 80 | 65 | 43 | 35 | 20862 | 1 | 6 | 1 | 2 | 8.2 | 16.3 | 02:24.1 | 3.1 | 9.3 | 81.8 | 84.5 | 83.8 | 100.0 | 88.2 | 90.7 | 0.93 |
| MYCN | 48 | 82 | 66.7 | 41 | 33.3 | 20862 | 1 | 6 | 1 | 2 | 11.1 | 20.7 | 02:32.2 | 7.4 | 31.7 | 30.0 | 95.2 | 79.3 | 9.1 | 90.0 | 68.3 | 0.78 |
| CXCL12 | 50 | 82 | 66.7 | 41 | 33.3 | 20862 | 1 | 5 | 1 | 2 | 12.7 | 22.0 | 02:39.9 | 8.2 | 26.8 | 10.0 | 100.0 | 78.0 | 0.0 | 100.0 | 73.2 | 0.74 |
| NOTCH2 | 29 | 92 | 74.8 | 31 | 25.2 | 20862 | 1 | 10 | 1 | 2 | 11.7 | 15.2 | 03:18.6 | 4.9 | 25.8 | 98.6 | 35.0 | 84.8 | 100.0 | 11.1 | 74.2 | 0.80 |
| CDK4 | 16 | 82 | 66.7 | 41 | 33.3 | 20862 | 1 | 10 | 1 | 2 | 11.4 | 20.7 | 02:21.8 | 4.9 | 17.1 | 98.3 | 27.3 | 79.3 | 100.0 | 0.0 | 82.9 | 0.83 |
| BMI1 | 41 | 90 | 73.2 | 33 | 26.8 | 20862 | 1 | 5 | 1 | 2 | 20.0 | 34.4 | 03:21.6 | 7.4 | 39.4 | 77.6 | 51.2 | 65.6 | 100.0 | 35.0 | 60.6 | 0.70 |
| ING1 | 40 | 79 | 64.2 | 44 | 35.8 | 20862 | 1 | 4 | 1 | 2 | 14.8 | 26.6 | 02:14.7 | 7.6 | 22.7 | 0.0 | 100.0 | 73.4 | 0.0 | 100.0 | 77.3 | 0.60 |
| NSD2 | 39 | 92 | 74.8 | 31 | 25.2 | 20862 | 1 | 10 | 1 | 2 | 13.6 | 20.7 | 03:11.6 | 4.1 | 9.7 | 85.7 | 72.1 | 79.3 | 85.7 | 94.1 | 90.3 | 0.88 |
| PTK2 | 19 | 90 | 73.2 | 33 | 26.8 | 20862 | 1 | 3 | 1 | 2 | 16.2 | 24.4 | 03:15.7 | 5.8 | 24.2 | 100.0 | 0.0 | 75.6 | 100.0 | 0.0 | 75.8 | 0.64 |
| PIK3CA | 46 | 79 | 64.2 | 44 | 35.8 | 20862 | 1 | 8 | 1 | 2 | 12.5 | 24.1 | 02:23.1 | 7.7 | 25.0 | 93.3 | 21.1 | 75.9 | 100.0 | 0.0 | 75.0 | 0.74 |
| CHEK1 | 51 | 92 | 74.8 | 31 | 25.2 | 20862 | 1 | 8 | 1 | 2 | 16.4 | 26.1 | 03:12.5 | 7.0 | 41.9 | 78.6 | 70.0 | 73.9 | 50.0 | 72.7 | 58.1 | 0.80 |
| CHEK2 | 80 | 88 | 71.5 | 35 | 28.5 | 20862 | 1 | 9 | 1 | 2 | 13.5 | 25.0 | 02:57.1 | 5.9 | 22.9 | 59.1 | 90.9 | 75.0 | 66.7 | 88.2 | 77.1 | 0.86 |
| PIK3CD | 47 | 79 | 64.2 | 44 | 35.8 | 20862 | 1 | 3 | 1 | 2 | 12.1 | 20.3 | 02:15.3 | 8.0 | 27.3 | 66.7 | 90.7 | 79.7 | 63.3 | 92.9 | 72.9 | 0.83 |
| XIAP | 89 | 79 | 64.2 | 44 | 35.8 | 20862 | 1 | 8 | 1 | 2 | 10.7 | 17.7 | 02:20.4 | 11.0 | 43.2 | 88.4 | 75.0 | 82.3 | 66.7 | 47.8 | 56.8 | 0.80 |
| PAX5 | 81 | 89 | 72.4 | 34 | 27.6 | 20862 | 1 | 9 | 1 | 2 | 14.5 | 24.7 | 02:55.3 | 6.0 | 26.5 | 13.0 | 97.0 | 75.3 | 0.0 | 96.2 | 73.5 | 0.71 |
| BCL2L11 | 28 | 88 | 71.5 | 35 | 28.5 | 20862 | 1 | 8 | 1 | 2 | 10.9 | 14.8 | 02:51.2 | 4.1 | 14.3 | 100.0 | 43.5 | 85.2 | 96.4 | 42.9 | 85.7 | 0.86 |
| BORCS8_MEF2B | 41 | 86 | 69.9 | 37 | 30.1 | 20862 | 1 | 3 | 1 | 2 | 13.8 | 23.3 | 02:45.9 | 5.8 | 18.9 | 19.0 | 95.4 | 76.7 | 30.0 | 100.0 | 81.1 | 0.76 |
| PTEN | 23 | 92 | 74.8 | 31 | 25.2 | 20862 | 1 | 7 | 1 | 2 | 11.1 | 16.3 | 03:14.2 | 3.5 | 12.9 | 95.4 | 55.6 | 83.7 | 92.9 | 33.3 | 87.1 | 0.84 |
| MYC | 18 | 92 | 74.8 | 31 | 25.2 | 20862 | 1 | 9 | 1 | 2 | 9.8 | 16.3 | 03:31.2 | 4.1 | 25.8 | 91.8 | 52.6 | 83.7 | 95.0 | 36.4 | 74.2 | 0.90 |
| CCND1 | 42 | 82 | 66.7 | 41 | 33.3 | 20862 | 1 | 10 | 1 | 2 | 11.2 | 19.5 | 02:29.4 | 6.0 | 26.8 | 88.3 | 59.1 | 80.5 | 87.9 | 12.5 | 73.2 | 0.81 |
| MKI67 | 37 | 90 | 73.2 | 33 | 26.8 | 20862 | 1 | 10 | 1 | 2 | 12.6 | 21.1 | 03:00.8 | 5.0 | 21.2 | 88.0 | 67.5 | 78.9 | 78.6 | 78.9 | 78.8 | 0.89 |
| CCND2 | 40 | 79 | 64.2 | 44 | 35.8 | 20862 | 1 | 4 | 1 | 2 | 12.3 | 24.1 | 02:14.5 | 7.6 | 25.0 | 100.0 | 0.0 | 75.9 | 100.0 | 0.0 | 75.0 | 0.74 |
| CDKN2A | 56 | 92 | 74.8 | 31 | 25.2 | 20862 | 1 | 6 | 1 | 2 | 14.1 | 20.7 | 03:02.7 | 5.0 | 25.8 | 97.2 | 15.0 | 79.3 | 100.0 | 0.0 | 74.2 | 0.73 |
| CDKN2C | 34 | 88 | 71.5 | 35 | 28.5 | 20862 | 1 | 9 | 1 | 2 | 17.6 | 21.6 | 02:50.9 | 8.9 | 34.3 | 86.8 | 72.0 | 78.4 | 58.3 | 81.8 | 65.7 | 0.78 |
| TERT | 58 | 79 | 64.2 | 44 | 35.8 | 20862 | 1 | 10 | 1 | 2 | 10.3 | 17.7 | 02:17.2 | 10.0 | 27.3 | 93.7 | 37.5 | 82.3 | 100.0 | 14.3 | 72.7 | 0.71 |
| NOTCH1 | 71 | 79 | 64.2 | 44 | 35.8 | 20862 | 1 | 3 | 1 | 2 | 12.4 | 22.8 | 02:14.6 | 7.3 | 25.0 | 100.0 | 0.0 | 77.2 | 100.0 | 0.0 | 75.0 | 0.74 |
| RB1 | 87 | 89 | 72.4 | 34 | 27.6 | 20862 | 1 | 2 | 1 | 2 | 22.2 | 47.2 | 02:55.3 | 8.7 | 55.9 | 100.0 | 0.0 | 52.8 | 100.0 | 0.0 | 44.1 | 0.49 |
| Combined | 87 | 93 | 75.6 | 30 | 24.4 | 20835 | 1 | 14 | 29 | 58 | 366.4 | 20.4 | 09:53.4 | 147.2 | 23.7 | - | - | 79.6 | - | - | 76.3 | - |
| Average | 86.0 | 69.9 | 37.0 | 30.1 | 20861 | 1 | 7.2 | 25.0 | 22.3 | 11.2 | 26.4 | 73.4 | 58.4 | 77.7 | 69.6 | 51.7 | 73.6 | 0.77 | ||||
| Num | Gene | B | SE | Wald | df | p Value | Hazard Risk | 95.0% CI for HR | |
|---|---|---|---|---|---|---|---|---|---|
| Lower | Upper | ||||||||
| 1 | KIF18A | 2.7 | 0.3 | 58.3 | 1 | <0.001 | 14.2 | 7.2 | 28.1 |
| 2 | YBX3 | 0.8 | 0.2 | 19.0 | 1 | <0.001 | 2.2 | 1.6 | 3.2 |
| 3 | GCNA | 0.9 | 0.2 | 14.6 | 1 | <0.001 | 2.5 | 1.6 | 4.1 |
| 4 | POGLUT3 | 1.2 | 0.3 | 13.4 | 1 | <0.001 | 3.2 | 1.7 | 6.0 |
| 5 | AMOTL2 | 0.9 | 0.3 | 10.1 | 1 | 0.001 | 2.5 | 1.4 | 4.3 |
| 6 | RAB13 | 1.2 | 0.4 | 9.8 | 1 | 0.002 | 3.3 | 1.6 | 7.0 |
| 7 | ZCCHC4 | 1.1 | 0.3 | 9.5 | 1 | 0.002 | 2.9 | 1.5 | 5.7 |
| 8 | PEMT | 0.6 | 0.2 | 8.4 | 1 | 0.004 | 1.9 | 1.2 | 2.8 |
| 9 | RRAS | 0.8 | 0.4 | 4.7 | 1 | 0.029 | 2.2 | 1.1 | 4.4 |
| 10 | PALLD | 0.6 | 0.3 | 3.9 | 1 | 0.048 | 1.8 | 1.0 | 3.1 |
| 11 | ADAMDEC1 | 0.7 | 0.4 | 3.5 | 1 | 0.063 | 1.9 | 1.0 | 3.9 |
| 12 | ADGRG2 | 0.4 | 0.2 | 2.8 | 1 | 0.094 | 1.5 | 0.9 | 2.3 |
| 13 | IGFBP7 | −1.5 | 0.3 | 20.3 | 1 | <0.001 | 0.2 | 0.1 | 0.4 |
| 14 | TMEM176B | −1.6 | 0.4 | 18.9 | 1 | <0.001 | 0.2 | 0.1 | 0.4 |
| 15 | SELENOP | −1.0 | 0.2 | 15.6 | 1 | <0.001 | 0.4 | 0.2 | 0.6 |
| 16 | RPGRIP1L | −0.5 | 0.1 | 10.5 | 1 | 0.001 | 0.6 | 0.5 | 0.8 |
| 17 | TAMM41 | −0.8 | 0.3 | 7.5 | 1 | 0.006 | 0.4 | 0.3 | 0.8 |
| 18 | KCTD12 | −1.2 | 0.5 | 7.5 | 1 | 0.006 | 0.3 | 0.1 | 0.7 |
| 19 | RGS1 | −0.4 | 0.2 | 4.5 | 1 | 0.034 | 0.7 | 0.5 | 1.0 |
| Gene | B | SE | Wald | df | Sig. | HR | 95.0% CI for HR | |
|---|---|---|---|---|---|---|---|---|
| Lower | Upper | |||||||
| MKI67 | 1.3 | 0.3 | 20.5 | 1 | 0.000 | 3.8 | 2.1 | 6.8 |
| YBX3 | 0.9 | 0.3 | 11.3 | 1 | 0.001 | 2.6 | 1.5 | 4.4 |
| SELENOP | −0.5 | 0.3 | 3.0 | 1 | 0.085 | 0.6 | 0.3 | 1.1 |
| POGLUT3 | 0.6 | 0.2 | 6.9 | 1 | 0.009 | 1.9 | 1.2 | 3.1 |
| ADGRG2 | −0.7 | 0.3 | 4.5 | 1 | 0.035 | 0.5 | 0.2 | 0.9 |
| GCNA | 0.8 | 0.3 | 5.3 | 1 | 0.021 | 2.2 | 1.1 | 4.2 |
| KIF18A | 1.5 | 0.3 | 26.6 | 1 | 0.000 | 4.3 | 2.5 | 7.6 |
| PEMT | 0.8 | 0.3 | 6.6 | 1 | 0.010 | 2.1 | 1.2 | 3.8 |
| Pathway | Num. Genes Top 70% | Case Processing Summary | Network Layers | Model Summary | Classification | Area under the Curve (AUC) | ||||||||||||||||
|---|---|---|---|---|---|---|---|---|---|---|---|---|---|---|---|---|---|---|---|---|---|---|
| Training | Testing | Input | Hidden | Output | Training | Testing | Training (% Correct) | Testing (% Correct) | ||||||||||||||
| Num. | % | Num. | % | Units | Num. | Units | Num. | Units | Cross Entropy Error | Incorrect Predictions % | Training Time | Cross Entropy Error | Incorrect Predictions % | Observed Alive | Observed Dead | Overall | Observed Alive | Observed Dead | Overall % | |||
| Cancer Transcriptome | 13 | 84 | 68.3 | 39 | 31.7 | 1785 | 1 | 6 | 1 | 2 | 41.1 | 27.4 | 00:03.9 | 17.6 | 23.1 | 58.8 | 82.0 | 72.6 | 55.6 | 83.3 | 76.9 | 0.84 |
| Pan Cancer Human IO360 | 15 | 84 | 68.3 | 39 | 31.7 | 727 | 1 | 8 | 1 | 2 | 22.5 | 13.1 | 00:01.4 | 14.7 | 15.4 | 82.4 | 90.0 | 86.9 | 88.9 | 83.3 | 84.6 | 0.94 |
| Pan Cancer Immune Profiling | 1 | 84 | 68.3 | 39 | 31.7 | 707 | 1 | 5 | 1 | 2 | 44.9 | 26.2 | 00:01.5 | 15.0 | 12.8 | 64.7 | 80.0 | 73.8 | 88.9 | 86.7 | 87.2 | 0.82 |
| Pan Cancer Progression | 18 | 84 | 68.3 | 39 | 31.7 | 715 | 1 | 11 | 1 | 2 | 51.2 | 32.1 | 00:01.7 | 18.7 | 12.8 | 29.4 | 94.0 | 67.9 | 66.7 | 93.3 | 87.2 | 0.74 |
| Pan Cancer Pathways | 6 | 84 | 68.3 | 39 | 31.7 | 712 | 1 | 8 | 1 | 2 | 36.9 | 21.4 | 00:01.8 | 16.8 | 15.4 | 67.6 | 86.0 | 78.6 | 77.8 | 86.7 | 84.6 | 0.89 |
| Metabolic Pathways | 27 | 84 | 68.3 | 39 | 31.7 | 737 | 1 | 14 | 1 | 2 | 39.8 | 22.6 | 00:01.6 | 13.7 | 17.9 | 55.9 | 92.0 | 77.4 | 66.7 | 86.7 | 82.1 | 0.87 |
| Immune Exhaustion | 12 | 84 | 68.3 | 39 | 31.7 | 720 | 1 | 10 | 1 | 2 | 47.2 | 31.0 | 00:01.6 | 18.2 | 17.9 | 50.0 | 82.0 | 69.0 | 66.7 | 86.7 | 82.1 | 0.79 |
| Human Inflammation | 23 | 84 | 68.3 | 39 | 31.7 | 247 | 1 | 9 | 1 | 2 | 33.7 | 17.9 | 00:00.6 | 16.6 | 23.1 | 73.5 | 88.0 | 82.1 | 55.6 | 83.3 | 76.9 | 0.89 |
| Host Response | 8 | 84 | 68.3 | 39 | 31.7 | 747 | 1 | 9 | 1 | 2 | 41.1 | 21.4 | 00:01.6 | 18.1 | 20.5 | 67.6 | 86.0 | 78.6 | 66.7 | 83.3 | 79.5 | 0.83 |
| Autoimmune | 13 | 84 | 68.3 | 39 | 31.7 | 719 | 1 | 10 | 1 | 2 | 11.9 | 6.0 | 00:01.5 | 12.5 | 10.3 | 88.2 | 98.0 | 94.0 | 88.9 | 90.0 | 89.7 | 0.98 |
| Organ Transplantation | 12 | 84 | 68.3 | 39 | 31.7 | 728 | 1 | 11 | 1 | 2 | 41.5 | 21.4 | 00:01.6 | 15.7 | 10.3 | 64.7 | 88.0 | 78.6 | 88.9 | 90.0 | 89.7 | 0.85 |
| Subtype | Overall | Low-Risk | High-Risk | K–M Log-Rank p Value | Cox p Value | Cox HR | 95% CI for HR | |
|---|---|---|---|---|---|---|---|---|
| Lower | Higher | |||||||
| Breast | 962 | 821 | 141 | 4.0 × 10⁻¹⁷ | 6.5 × 10⁻¹⁵ | 4.0 | 2.8 | 5.6 |
| Lung | 475 | 426 | 49 | 1.0 × 10⁻¹⁰ | 1.1 × 10⁻⁹ | 3.3 | 2.3 | 4.9 |
| Prostate | 497 | 446 | 51 | 1.5 × 10⁻⁴ | 2.0 × 10⁻³ | 9.2 | 2.3 | 37.2 |
| Colorectal | 466 | 415 | 51 | 1.4 × 10⁻⁵ | 3.3 × 10⁻⁵ | 2.9 | 1.7 | 4.8 |
| Cervix | 191 | 169 | 22 | 3.4 × 10⁻¹⁰ | 8.9 × 10⁻⁸ | 7.7 | 3.6 | 16.2 |
| Stomach | 440 | 293 | 147 | 2.6 × 10⁻⁴ | 3.1 × 10⁻⁴ | 1.8 | 1.3 | 2.4 |
| Skin (melanoma) | 335 | 177 | 158 | 3.2 × 10⁻¹⁰ | 1.3 × 10⁻⁹ | 2.6 | 1.9 | 3.5 |
| Bladder | 389 | 207 | 182 | 9.2 × 10⁻¹³ | 9.7 × 10⁻¹² | 3.0 | 2.2 | 4.1 |
| Ovary | 247 | 217 | 30 | 0.6 × 10⁻⁵ | 1.5 × 10⁻⁵ | 2.9 | 1.8 | 4.6 |
| DLBCL | 414 | 289 | 125 | 3.3 × 10⁻¹⁶ | 1.5 × 10⁻¹⁴ | 3.3 | 2.5 | 4.5 |
| Kidney | 792 | 470 | 322 | 5.9 × 10⁻¹⁷ | 2.5 × 10⁻¹⁵ | 3.2 | 2.4 | 4.3 |
| Uterus (endometrium) | 247 | 214 | 33 | 5.5 × 10⁻¹¹ | 2.4 × 10⁻⁸ | 7.4 | 3.7 | 15.0 |
| Leukemia (AML) | 149 | 115 | 34 | 1.9 × 10⁻¹⁴ | 7.0 × 10⁻¹² | 5.5 | 3.4 | 9.0 |
| Pancreas | 176 | 109 | 67 | 0.4 × 10⁻⁵ | 9.0 × 10⁻⁶ | 2.6 | 1.7 | 3.9 |
| Thyroid | 489 | 434 | 55 | 9.9 × 10⁻¹² | 6.4 × 10⁻⁷ | 17.4 | 5.6 | 53.5 |
| Liver | 361 | 197 | 164 | 6.7 × 10⁻¹⁰ | 4.0 × 10⁻⁹ | 3.0 | 2.1 | 4.3 |
| CNS (GBM) | 659 | 209 | 450 | 2.6 × 10⁻¹⁷ | 8.9 × 10⁻¹⁵ | 4.5 | 3.1 | 6.6 |
| Overall | 7289 | 5208 | 2081 | 2.8 × 10−178 | 2.5 × 10−159 | 3.3 | 2.9 | 3.6 |

References
- Swerdlow, S.H.; Campo, E.; Pileri, S.A.; Harris, N.L.; Stein, H.; Siebert, R.; Advani, R.; Ghielmini, M.; Salles, G.A.; Zelenetz, A.D.; et al. The 2016 revision of the World Health Organization classification of lymphoid neoplasms. Blood 2016, 127, 2375–2390. [Google Scholar] [CrossRef] [Green Version]
- Armitage, J.O. A clinical evaluation of the International Lymphoma Study Group classification of non-Hodgkin’s lymphoma. The Non-Hodgkin’s Lymphoma Classification Project. Blood 1997, 89, 3909–3918. [Google Scholar]
- Armitage, J.O.; Weisenburger, D.D. New approach to classifying non-Hodgkin’s lymphomas: Clinical features of the major histologic subtypes. Non-Hodgkin’s Lymphoma Classification Project. J. Clin. Oncol. 1998, 16, 2780–2795. [Google Scholar] [CrossRef]
- Sant, M.; Allemani, C.; Tereanu, C.; De Angelis, R.; Capocaccia, R.; Visser, O.; Marcos-Gragera, R.; Maynadie, M.; Simonetti, A.; Lutz, J.M.; et al. Incidence of hematologic malignancies in Europe by morphologic subtype: Results of the HAEMACARE project. Blood 2010, 116, 3724–3734. [Google Scholar] [CrossRef]
- Shivdasani, R.A.; Hess, J.L.; Skarin, A.T.; Pinkus, G.S. Intermediate lymphocytic lymphoma: Clinical and pathologic features of a recently characterized subtype of non-Hodgkin’s lymphoma. J. Clin. Oncol. 1993, 11, 802–811. [Google Scholar] [CrossRef] [PubMed]
- Smith, A.; Howell, D.; Patmore, R.; Jack, A.; Roman, E. Incidence of haematological malignancy by sub-type: A report from the Haematological Malignancy Research Network. Br. J. Cancer 2011, 105, 1684–1692. [Google Scholar] [CrossRef] [Green Version]
- Zhou, Y.; Wang, H.; Fang, W.; Romaguer, J.E.; Zhang, Y.; Delasalle, K.B.; Kwak, L.; Yi, Q.; Du, X.L.; Wang, M. Incidence trends of mantle cell lymphoma in the United States between 1992 and 2004. Cancer 2008, 113, 791–798. [Google Scholar] [CrossRef] [PubMed]
- Freedman, A.S.; Aster, J.C. Clinical manifestations, pathologic features, and diagnosis of mantle cell lymphoma. In UpToDate; Wolters Kluwer: Waltham, MA, USA, 2021. [Google Scholar]
- Campo, E.; Raffeld, M.; Jaffe, E.S. Mantle-cell lymphoma. Semin. Hematol. 1999, 36, 115–127. [Google Scholar]
- Tsujimoto, Y.; Yunis, J.; Onorato-Showe, L.; Erikson, J.; Nowell, P.C.; Croce, C.M. Molecular cloning of the chromosomal breakpoint of B-cell lymphomas and leukemias with the t(11;14) chromosome translocation. Science 1984, 224, 1403–1406. [Google Scholar] [CrossRef]
- De Wolf-Peeters, C.; Pittaluga, S. Mantle-cell lymphoma. Ann. Oncol. 1994, 5 (Suppl. 1), 35–37. [Google Scholar] [CrossRef]
- Bertoni, F.; Zucca, E.; Genini, D.; Cazzaniga, G.; Roggero, E.; Ghielmini, M.; Cavalli, F.; Biondi, A. Immunoglobulin light chain kappa deletion rearrangement as a marker of clonality in mantle cell lymphoma. Leuk. Lymphoma 1999, 36, 147–150. [Google Scholar] [CrossRef] [PubMed]
- Argatoff, L.H.; Connors, J.M.; Klasa, R.J.; Horsman, D.E.; Gascoyne, R.D. Mantle cell lymphoma: A clinicopathologic study of 80 cases. Blood 1997, 89, 2067–2078. [Google Scholar] [CrossRef]
- Romaguera, J.E.; Medeiros, L.J.; Hagemeister, F.B.; Fayad, L.E.; Rodriguez, M.A.; Pro, B.; Younes, A.; McLaughlin, P.; Goy, A.; Sarris, A.H.; et al. Frequency of gastrointestinal involvement and its clinical significance in mantle cell lymphoma. Cancer 2003, 97, 586–591. [Google Scholar] [CrossRef] [PubMed]
- Ferrer, A.; Salaverria, I.; Bosch, F.; Villamor, N.; Rozman, M.; Bea, S.; Gine, E.; Lopez-Guillermo, A.; Campo, E.; Montserrat, E. Leukemic involvement is a common feature in mantle cell lymphoma. Cancer 2007, 109, 2473–2480. [Google Scholar] [CrossRef]
- Brown, J.R.; Freedman, A.S.; Aster, J.C.; Lister, A.; Rosmarin, A. Pathobiology of mantle cell lymphoma. In UpToDate; Wolters Kluwer: Waltham, MA, USA, 2020. [Google Scholar]
- Beekman, R.; Amador, V.; Campo, E. SOX11, a key oncogenic factor in mantle cell lymphoma. Curr. Opin. Hematol. 2018, 25, 299–306. [Google Scholar] [CrossRef]
- Hoster, E.; Dreyling, M.; Klapper, W.; Gisselbrecht, C.; van Hoof, A.; Kluin-Nelemans, H.C.; Pfreundschuh, M.; Reiser, M.; Metzner, B.; Einsele, H.; et al. A new prognostic index (MIPI) for patients with advanced-stage mantle cell lymphoma. Blood 2008, 111, 558–565. [Google Scholar] [CrossRef] [PubMed]
- Moller, M.B.; Pedersen, N.T.; Christensen, B.E. Mantle cell lymphoma: Prognostic capacity of the Follicular Lymphoma International Prognostic Index. Br. J. Haematol. 2006, 133, 43–49. [Google Scholar] [CrossRef]
- Meusers, P.; Engelhard, M.; Bartels, H.; Binder, T.; Fulle, H.H.; Gorg, K.; Gunzer, U.; Havemann, K.; Kayser, W.; Konig, E.; et al. Multicentre randomized therapeutic trial for advanced centrocytic lymphoma: Anthracycline does not improve the prognosis. Hematol. Oncol. 1989, 7, 365–380. [Google Scholar] [CrossRef]
- Berger, F.; Felman, P.; Sonet, A.; Salles, G.; Bastion, Y.; Bryon, P.A.; Coiffier, B. Nonfollicular small B-cell lymphomas: A heterogeneous group of patients with distinct clinical features and outcome. Blood 1994, 83, 2829–2835. [Google Scholar] [CrossRef] [Green Version]
- Hartmann, E.; Fernandez, V.; Moreno, V.; Valls, J.; Hernandez, L.; Bosch, F.; Abrisqueta, P.; Klapper, W.; Dreyling, M.; Hoster, E.; et al. Five-gene model to predict survival in mantle-cell lymphoma using frozen or formalin-fixed, paraffin-embedded tissue. J. Clin. Oncol. 2008, 26, 4966–4972. [Google Scholar] [CrossRef]
- Tiemann, M.; Schrader, C.; Klapper, W.; Dreyling, M.H.; Campo, E.; Norton, A.; Berger, F.; Kluin, P.; Ott, G.; Pileri, S.; et al. Histopathology, cell proliferation indices and clinical outcome in 304 patients with mantle cell lymphoma (MCL): A clinicopathological study from the European MCL Network. Br. J. Haematol. 2005, 131, 29–38. [Google Scholar] [CrossRef]
- Raty, R.; Franssila, K.; Jansson, S.E.; Joensuu, H.; Wartiovaara-Kautto, U.; Elonen, E. Predictive factors for blastoid transformation in the common variant of mantle cell lymphoma. Eur. J. Cancer 2003, 39, 321–329. [Google Scholar] [CrossRef]
- Andersen, N.S.; Jensen, M.K.; de Nully Brown, P.; Geisler, C.H. A Danish population-based analysis of 105 mantle cell lymphoma patients: Incidences, clinical features, response, survival and prognostic factors. Eur. J. Cancer 2002, 38, 401–408. [Google Scholar] [CrossRef]
- Matutes, E.; Parry-Jones, N.; Brito-Babapulle, V.; Wotherspoon, A.; Morilla, R.; Atkinson, S.; Elnenaei, M.O.; Jain, P.; Giustolisi, G.M.; A’Hern, R.P.; et al. The leukemic presentation of mantle-cell lymphoma: Disease features and prognostic factors in 58 patients. Leuk. Lymphoma 2004, 45, 2007–2015. [Google Scholar] [CrossRef]
- Fisher, R.I.; Dahlberg, S.; Nathwani, B.N.; Banks, P.M.; Miller, T.P.; Grogan, T.M. A clinical analysis of two indolent lymphoma entities: Mantle cell lymphoma and marginal zone lymphoma (including the mucosa-associated lymphoid tissue and monocytoid B-cell subcategories): A Southwest Oncology Group study. Blood 1995, 85, 1075–1082. [Google Scholar] [CrossRef] [PubMed]
- Jain, P.; Wang, M. Mantle cell lymphoma: 2019 update on the diagnosis, pathogenesis, prognostication, and management. Am. J. Hematol. 2019, 94, 710–725. [Google Scholar] [CrossRef] [Green Version]
- Nadeu, F.; Martin-Garcia, D.; Clot, G.; Diaz-Navarro, A.; Duran-Ferrer, M.; Navarro, A.; Vilarrasa-Blasi, R.; Kulis, M.; Royo, R.; Gutierrez-Abril, J.; et al. Genomic and epigenomic insights into the origin, pathogenesis, and clinical behavior of mantle cell lymphoma subtypes. Blood 2020, 136, 1419–1432. [Google Scholar] [CrossRef]
- Navarro, A.; Bea, S.; Jares, P.; Campo, E. Molecular Pathogenesis of Mantle Cell Lymphoma. Hematol. Oncol. Clin. N. Am. 2020, 34, 795–807. [Google Scholar] [CrossRef]
- Roue, G.; Sola, B. Management of Drug Resistance in Mantle Cell Lymphoma. Cancers 2020, 12, 1565. [Google Scholar] [CrossRef]
- IBM. IBM SPSS Neural Networks 26; IBM: Armonk, NY, USA, 2019. [Google Scholar]
- IBM. IBM SPSS Neural Networks; New tools for building predictive models; YTD03119-GBEN-01; IBM: Somers, NY, USA, 2012. [Google Scholar]
- Banihabib, M.E.; Bandari, R.; Valipour, M. Improving Daily Peak Flow Forecasts Using Hybrid Fourier-Series Autoregressive Integrated Moving Average and Recurrent Artificial Neural Network Models. AI 2020, 1, 263–275. [Google Scholar] [CrossRef]
- Carreras, J.; Kikuti, Y.Y.; Miyaoka, M.; Hiraiwa, S.; Tomita, S.; Ikoma, H.; Kondo, Y.; Ito, A.; Nakamura, N.; Hamoudi, R. A Combination of Multilayer Perceptron, Radial Basis Function Artificial Neural Networks and Machine Learning Image Segmentation for the Dimension Reduction and the Prognosis Assessment of Diffuse Large B-Cell Lymphoma. AI 2021, 2, 106–134. [Google Scholar] [CrossRef]
- Carreras, J.; Kikuti, Y.Y.; Miyaoka, M.; Hiraiwa, S.; Tomita, S.; Ikoma, H.; Kondo, Y.; Ito, A.; Shiraiwa, S.; Hamoudi, R.; et al. A Single Gene Expression Set Derived from Artificial Intelligence Predicted the Prognosis of Several Lymphoma Subtypes; and High Immunohistochemical Expression of TNFAIP8 Associated with Poor Prognosis in Diffuse Large B-Cell Lymphoma. AI 2020, 1, 342–360. [Google Scholar] [CrossRef]
- Carreras, J.; Kikuti, Y.Y.; Miyaoka, M.; Hiraiwa, S.; Tomita, S.; Ikoma, H.; Kondo, Y.; Ito, A.; Nakamura, N.; Hamoudi, R. Artificial Intelligence Analysis of the Gene Expression of Follicular Lymphoma Predicted the Overall Survival and Correlated with the Immune Microenvironment Response Signatures. Mach. Learn. Knowl. Extr. 2020, 2, 647–671. [Google Scholar] [CrossRef]
- Lin, H.; Zheng, W.; Peng, X. Orientation-Encoding CNN for Point Cloud Classification and Segmentation. Mach. Learn. Knowl. Extr. 2021, 3, 601–614. [Google Scholar] [CrossRef]
- Mayr, F.; Yovine, S.; Visca, R. Property Checking with Interpretable Error Characterization for Recurrent Neural Networks. Mach. Learn. Knowl. Extr. 2021, 3, 205–227. [Google Scholar] [CrossRef]
- Pickens, A.; Sengupta, S. Benchmarking Studies Aimed at Clustering and Classification Tasks Using K-Means, Fuzzy C-Means and Evolutionary Neural Networks. Mach. Learn. Knowl. Extr. 2021, 3, 695–719. [Google Scholar] [CrossRef]
- Shah, S.A.A.; Manzoor, M.A.; Bais, A. Canopy Height Estimation at Landsat Resolution Using Convolutional Neural Networks. Mach. Learn. Knowl. Extr. 2020, 2, 23–36. [Google Scholar] [CrossRef] [Green Version]
- Silva Araújo, V.J.; Guimarães, A.J.; de Campos Souza, P.V.; Rezende, T.S.; Araújo, V.S. Using Resistin, Glucose, Age and BMI and Pruning Fuzzy Neural Network for the Construction of Expert Systems in the Prediction of Breast Cancer. Mach. Learn. Knowl. Extr. 2019, 1, 466–482. [Google Scholar] [CrossRef] [Green Version]
- Škrlj, B.; Kralj, J.; Lavrač, N.; Pollak, S. Towards Robust Text Classification with Semantics-Aware Recurrent Neural Architecture. Mach. Learn. Knowl. Extr. 2019, 1, 575–589. [Google Scholar] [CrossRef] [Green Version]
- Knapič, S.; Malhi, A.; Saluja, R.; Främling, K. Explainable Artificial Intelligence for Human Decision Support System in the Medical Domain. Mach. Learn. Knowl. Extr. 2021, 3, 740–770. [Google Scholar] [CrossRef]
- Carreras, J.; Hamoudi, R.; Nakamura, N. Artificial Intelligence Analysis of Gene Expression Data Predicted the Prognosis of Patients with Diffuse Large B-Cell Lymphoma. Tokai J. Exp. Clin. Med. 2020, 45, 37–48. [Google Scholar]
- Carreras, J.; Hamoudi, R. Artificial Neural Network Analysis of Gene Expression Data Predicted Non-Hodgkin Lymphoma Subtypes with High Accuracy. Mach. Learn. Knowl. Extr. 2021, 3, 720–739. [Google Scholar] [CrossRef]
- Team, R.C. R: A Language and Environment for Statistical Computing; R Foundation for Statistical Computing: Vienna, Austria, 2013. [Google Scholar]
- Subramanian, A.; Tamayo, P.; Mootha, V.K.; Mukherjee, S.; Ebert, B.L.; Gillette, M.A.; Paulovich, A.; Pomeroy, S.L.; Golub, T.R.; Lander, E.S.; et al. Gene set enrichment analysis: A knowledge-based approach for interpreting genome-wide expression profiles. Proc. Natl. Acad. Sci. USA 2005, 102, 15545–15550. [Google Scholar] [CrossRef] [PubMed] [Green Version]
- Mootha, V.K.; Lindgren, C.M.; Eriksson, K.F.; Subramanian, A.; Sihag, S.; Lehar, J.; Puigserver, P.; Carlsson, E.; Ridderstrale, M.; Laurila, E.; et al. PGC-1alpha-responsive genes involved in oxidative phosphorylation are coordinately downregulated in human diabetes. Nat. Genet. 2003, 34, 267–273. [Google Scholar] [CrossRef] [PubMed]
- Scott, D.W.; Abrisqueta, P.; Wright, G.W.; Slack, G.W.; Mottok, A.; Villa, D.; Jares, P.; Rauert-Wunderlich, H.; Royo, C.; Clot, G.; et al. New Molecular Assay for the Proliferation Signature in Mantle Cell Lymphoma Applicable to Formalin-Fixed Paraffin-Embedded Biopsies. J. Clin. Oncol. 2017, 35, 1668–1677. [Google Scholar] [CrossRef]
- Rosenwald, A.; Wright, G.; Wiestner, A.; Chan, W.C.; Connors, J.M.; Campo, E.; Gascoyne, R.D.; Grogan, T.M.; Muller-Hermelink, H.K.; Smeland, E.B.; et al. The proliferation gene expression signature is a quantitative integrator of oncogenic events that predicts survival in mantle cell lymphoma. Cancer Cell 2003, 3, 185–197. [Google Scholar] [CrossRef] [Green Version]
- Carreras, J.; Lopez-Guillermo, A.; Kikuti, Y.Y.; Itoh, J.; Masashi, M.; Ikoma, H.; Tomita, S.; Hiraiwa, S.; Hamoudi, R.; Rosenwald, A.; et al. High TNFRSF14 and low BTLA are associated with poor prognosis in Follicular Lymphoma and in Diffuse Large B-cell Lymphoma transformation. J. Clin. Exp. Hematop. 2019, 59, 1–16. [Google Scholar] [CrossRef] [Green Version]
- Tsuda, S.; Carreras, J.; Kikuti, Y.Y.; Nakae, H.; Dekiden-Monma, M.; Imai, J.; Tsuruya, K.; Nakamura, J.; Tsukune, Y.; Uchida, T.; et al. Prediction of steroid demand in the treatment of patients with ulcerative colitis by immunohistochemical analysis of the mucosal microenvironment and immune checkpoint: Role of macrophages and regulatory markers in disease severity. Pathol. Int. 2019, 69, 260–271. [Google Scholar] [CrossRef] [PubMed]
- UniProt, C. UniProt: The universal protein knowledgebase in 2021. Nucleic Acids Res. 2021, 49, D480–D489. [Google Scholar] [CrossRef]
- Safran, M.; Dalah, I.; Alexander, J.; Rosen, N.; Iny Stein, T.; Shmoish, M.; Nativ, N.; Bahir, I.; Doniger, T.; Krug, H.; et al. GeneCards Version 3: The human gene integrator. Database 2010, 2010, baq020. [Google Scholar] [CrossRef]
- Carreras, J.; Kikuti, Y.Y.; Miyaoka, M.; Roncador, G.; Garcia, J.F.; Hiraiwa, S.; Tomita, S.; Ikoma, H.; Kondo, Y.; Ito, A.; et al. Integrative Statistics, Machine Learning and Artificial Intelligence Neural Network Analysis Correlated CSF1R with the Prognosis of Diffuse Large B-Cell Lymphoma. Hemato 2021, 2, 182–206. [Google Scholar] [CrossRef]
- Carreras, J.; Kikuti, Y.Y.; Roncador, G.; Miyaoka, M.; Hiraiwa, S.; Tomita, S.; Ikoma, H.; Kondo, Y.; Ito, A.; Shiraiwa, S.; et al. High Expression of Caspase-8 Associated with Improved Survival in Diffuse Large B-Cell Lymphoma: Machine Learning and Artificial Neural Networks Analyses. BioMedInformatics 2021, 1, 18–46. [Google Scholar] [CrossRef]
- Carreras, J.; Hiraiwa, S.; Kikuti, Y.Y.; Miyaoka, M.; Tomita, S.; Ikoma, H.; Ito, A.; Kondo, Y.; Roncador, G.; Garcia, J.F.; et al. Artificial Neural Networks Predicted the Overall Survival and Molecular Subtypes of Diffuse Large B-Cell Lymphoma Using a Pancancer Immune-Oncology Panel. Cancers 2021, 13, 6384. [Google Scholar] [CrossRef]
- Carreras, J.; Kikuti, Y.Y.; Hiraiwa, S.; Miyaoka, M.; Tomita, S.; Ikoma, H.; Ito, A.; Kondo, Y.; Itoh, J.; Roncador, G.; et al. High PTX3 expression is associated with a poor prognosis in diffuse large B-cell lymphoma. Cancer Sci. 2021, 113, 334–348. [Google Scholar] [CrossRef]
- Corporation, I. IBM SPSS Statistics Algorithms; IBM Corporation: Armonk, NY, USA, 2017; pp. 685–686. [Google Scholar]
- Cheson, B.D.; Horning, S.J.; Coiffier, B.; Shipp, M.A.; Fisher, R.I.; Connors, J.M.; Lister, T.A.; Vose, J.; Grillo-Lopez, A.; Hagenbeek, A.; et al. Report of an international workshop to standardize response criteria for non-Hodgkin’s lymphomas. NCI Sponsored International Working Group. J. Clin. Oncol. 1999, 17, 1244. [Google Scholar] [CrossRef]
- Cheson, B.D.; Pfistner, B.; Juweid, M.E.; Gascoyne, R.D.; Specht, L.; Horning, S.J.; Coiffier, B.; Fisher, R.I.; Hagenbeek, A.; Zucca, E.; et al. Revised response criteria for malignant lymphoma. J. Clin. Oncol. 2007, 25, 579–586. [Google Scholar] [CrossRef]
- Carreras, J.; Kikuti, Y.Y.; Bea, S.; Miyaoka, M.; Hiraiwa, S.; Ikoma, H.; Nagao, R.; Tomita, S.; Martin-Garcia, D.; Salaverria, I.; et al. Clinicopathological characteristics and genomic profile of primary sinonasal tract diffuse large B cell lymphoma (DLBCL) reveals gain at 1q31 and RGS1 encoding protein; high RGS1 immunohistochemical expression associates with poor overall survival in DLBCL not otherwise specified (NOS). Histopathology 2017, 70, 595–621. [Google Scholar] [CrossRef]
- Carreras, J.; Yukie Kikuti, Y.; Miyaoka, M.; Hiraiwa, S.; Tomita, S.; Ikoma, H.; Kondo, Y.; Shiraiwa, S.; Ando, K.; Sato, S.; et al. Genomic Profile and Pathologic Features of Diffuse Large B-Cell Lymphoma Subtype of Methotrexate-associated Lymphoproliferative Disorder in Rheumatoid Arthritis Patients. Am. J. Surg. Pathol 2018, 42, 936–950. [Google Scholar] [CrossRef]
- Fujisawa, M.; Matsushima, M.; Carreras, J.; Hirabayashi, K.; Kikuti, Y.Y.; Ueda, T.; Kaneko, M.; Fujimoto, R.; Sano, M.; Teramura, E.; et al. Whole-genome copy number and immunohistochemical analyses on surgically resected intracholecystic papillary neoplasms. Pathol. Int. 2021, 71, 823–830. [Google Scholar] [CrossRef]
- Brownlee, J. Machine Learning Mastery. Available online: https://machinelearningmastery.com/dimensionality-reduction-for-machine-learning/ (accessed on 15 October 2021).
- Holte, H.; Beiske, K.; Boyle, M.; Troen, G.; Blaker, Y.N.; Myklebust, J.; Kvaloy, S.; Rosenwald, A.; Lingjaerde, O.C.; Rimsza, L.M.; et al. The MCL35 gene expression proliferation assay predicts high-risk MCL patients in a Norwegian cohort of younger patients given intensive first line therapy. Br. J. Haematol. 2018, 183, 225–234. [Google Scholar] [CrossRef] [Green Version]
- Ramsower, C.A.; Maguire, A.; Robetorye, R.S.; Feldman, A.L.; Syrbu, S.I.; Rosenthal, A.C.; Rimsza, L.M. Clinical laboratory validation of the MCL35 assay for molecular risk stratification of mantle cell lymphoma. J. Hematop. 2020, 13, 231–238. [Google Scholar] [CrossRef]
- Rauert-Wunderlich, H.; Mottok, A.; Scott, D.W.; Rimsza, L.M.; Ott, G.; Klapper, W.; Unterhalt, M.; Kluin-Nelemans, H.C.; Hermine, O.; Hartmann, S.; et al. Validation of the MCL35 gene expression proliferation assay in randomized trials of the European Mantle Cell Lymphoma Network. Br. J. Haematol. 2019, 184, 616–624. [Google Scholar] [CrossRef] [Green Version]
- Walsh, S.H.; Thorselius, M.; Johnson, A.; Soderberg, O.; Jerkeman, M.; Bjorck, E.; Eriksson, I.; Thunberg, U.; Landgren, O.; Ehinger, M.; et al. Mutated VH genes and preferential VH3-21 use define new subsets of mantle cell lymphoma. Blood 2003, 101, 4047–4054. [Google Scholar] [CrossRef] [Green Version]
- Camacho, F.I.; Algara, P.; Rodriguez, A.; Ruiz-Ballesteros, E.; Mollejo, M.; Martinez, N.; Martinez-Climent, J.A.; Gonzalez, M.; Mateo, M.; Caleo, A.; et al. Molecular heterogeneity in MCL defined by the use of specific VH genes and the frequency of somatic mutations. Blood 2003, 101, 4042–4046. [Google Scholar] [CrossRef] [Green Version]
- Lai, R.; Lefresne, S.V.; Franko, B.; Hui, D.; Mirza, I.; Mansoor, A.; Amin, H.M.; Ma, Y. Immunoglobulin VH somatic hypermutation in mantle cell lymphoma: Mutated genotype correlates with better clinical outcome. Mod. Pathol. 2006, 19, 1498–1505. [Google Scholar] [CrossRef]
- Sabnis, R.W. Novel KIF18A Inhibitors for Treating Cancer. ACS Med. Chem. Lett. 2020, 11, 2368–2369. [Google Scholar] [CrossRef]
- Wong, J.J.; Lau, K.A.; Pinello, N.; Rasko, J.E. Epigenetic modifications of splicing factor genes in myelodysplastic syndromes and acute myeloid leukemia. Cancer Sci. 2014, 105, 1457–1463. [Google Scholar] [CrossRef] [Green Version]
- Li, D.; Bi, F.F.; Chen, N.N.; Cao, J.M.; Sun, W.P.; Zhou, Y.M.; Cao, C.; Li, C.Y.; Yang, Q. Epigenetic repression of phosphatidylethanolamine N-methyltransferase (PEMT) in BRCA1-mutated breast cancer. Oncotarget 2014, 5, 1315–1325. [Google Scholar] [CrossRef] [Green Version]
- Dokshin, G.A.; Davis, G.M.; Sawle, A.D.; Eldridge, M.D.; Nicholls, P.K.; Gourley, T.E.; Romer, K.A.; Molesworth, L.W.; Tatnell, H.R.; Ozturk, A.R.; et al. GCNA Interacts with Spartan and Topoisomerase II to Regulate Genome Stability. Dev. Cell 2020, 52, 53–68. [Google Scholar] [CrossRef] [Green Version]
- Bjornsti, M.A.; Kaufmann, S.H. Topoisomerases and cancer chemotherapy: Recent advances and unanswered questions. F1000Research 2019, 8, 1704. [Google Scholar] [CrossRef]
- Tsai, Y.L.; Chang, H.H.; Chen, Y.C.; Chang, Y.C.; Chen, Y.; Tsai, W.C. Molecular Mechanisms of KDELC2 on Glioblastoma Tumorigenesis and Temozolomide Resistance. Biomedicines 2020, 8, 339. [Google Scholar] [CrossRef]
- Donadio, J.L.S.; Liu, L.; Freeman, V.L.; Ekoue, D.N.; Diamond, A.M.; Bermano, G. Interaction of NKX3.1 and SELENOP genotype with prostate cancer recurrence. Prostate 2019, 79, 462–467. [Google Scholar] [CrossRef]
- Cui, R.; Jiang, N.; Zhang, M.; Du, S.; Ou, H.; Ge, R.; Ma, D.; Zhang, J. AMOTL2 inhibits JUN Thr239 dephosphorylation by binding PPP2R2A to suppress the proliferation in non-small cell lung cancer cells. Biochim. Biophys. Acta Mol. Cell Res. 2021, 1868, 118858. [Google Scholar] [CrossRef]
- Guo, Z.; Wang, X.; Yang, Y.; Chen, W.; Zhang, K.; Teng, B.; Huang, C.; Zhao, Q.; Qiu, Z. Hypoxic Tumor-Derived Exosomal Long Noncoding RNA UCA1 Promotes Angiogenesis via miR-96-5p/AMOTL2 in Pancreatic Cancer. Mol. Ther. Nucleic Acids 2020, 22, 179–195. [Google Scholar] [CrossRef]
- Silveira, V.S.; Scrideli, C.A.; Moreno, D.A.; Yunes, J.A.; Queiroz, R.G.; Toledo, S.C.; Lee, M.L.; Petrilli, A.S.; Brandalise, S.R.; Tone, L.G. Gene expression pattern contributing to prognostic factors in childhood acute lymphoblastic leukemia. Leuk. Lymphoma 2013, 54, 310–314. [Google Scholar] [CrossRef]
- Ye, R.Y.; Kuang, X.Y.; Zeng, H.J.; Shao, N.; Lin, Y.; Wang, S.M. KCTD12 promotes G1/S transition of breast cancer cell through activating the AKT/FOXO1 signaling. J. Clin. Lab. Anal. 2020, 34, e23315. [Google Scholar] [CrossRef] [Green Version]
- Ahn, J.I.; Yoo, J.Y.; Kim, T.H.; Kim, Y.I.; Broaddus, R.R.; Ahn, J.Y.; Lim, J.M.; Jeong, J.W. G-protein coupled receptor 64 (GPR64) acts as a tumor suppressor in endometrial cancer. BMC Cancer 2019, 19, 810. [Google Scholar] [CrossRef] [Green Version]
- Zhou, J.Y.; Shi, R.; Yu, H.L.; Zeng, Y.; Zheng, W.L.; Ma, W.L. Association between polymorphic sites in thymidylate synthase gene and risk of non-Hodgkin lymphoma: A systematic review and pooled analysis. Leuk. Lymphoma 2012, 53, 1953–1960. [Google Scholar] [CrossRef]
- Fu, Z.; Jiao, Y.; Li, Y.; Ji, B.; Jia, B.; Liu, B. TYMS presents a novel biomarker for diagnosis and prognosis in patients with pancreatic cancer. Medicine 2019, 98, e18487. [Google Scholar] [CrossRef]
- Turek, M. Explainable Artificial Intelligence (XAI). Available online: https://www.darpa.mil/program/explainable-artificial-intelligence (accessed on 10 January 2022).
- McCoy, L.G.; Brenna, C.T.A.; Chen, S.S.; Vold, K.; Das, S. Believing in black boxes: Machine learning for healthcare does not need explainability to be evidence-based. J. Clin. Epidemiol. 2021; in press. [Google Scholar] [CrossRef]


| Genes (n = 86) |
|---|
| ADAMDEC1, ADGRG2, AKT1, AKT3, AMOTL2, ARID2, ATM, BCL2, BCL2L11, BCL6, BCOR, BIRC3, BMI1, BORCS8_MEF2B, BTK, CARD11, CASP8, CCND1, CCND2, CCND3, CD5, CD79A, CDK4, CDKN1B, CDKN2A, CDKN2C, CFLAR, CHEK1, CHEK2, CUL4A, CXCL12, CXCR4, DAZAP1, GCNA, HNRNPH1, IGFBP7, ING1, KCTD12, KIF18A, KMT2C, KMT2D, LYN, MDM2, MIR17HG, MKI67, MTOR, MYC, MYCN, NFKB1, NFKBIE, NOTCH1, NOTCH2, NSD2, PALLD, PAX5, PDGFA, PEMT, PIK3CA, PIK3CD, POGLUT3, PTEN, PTK2, RAB13, RB1, RGS1, RPGRIP1L, RRAS, SAMHD1, SELENOP, SMARCA2, SMARCA4, SMARCB1, SOX11, SYK, SYNE1, TAMM41, TERT, TET2, TMEM176B, TNFAIP3, TP53, TRAF2, UBR5, XIAP, YBX3, and ZCCHC4 |
| Gene | Keyword | Function | Correlation with the Overall Survival of MCL | ||
|---|---|---|---|---|---|
| beta | p | HR | |||
| BCL2L11 | Apoptosis | B-cell apoptotic process | 1.0 | <0.01 | 2.7 |
| BMI1 | Regulation of gene expression | Component of the Polycomb group (PcG) multiprotein PRC1-like complex, negative regulation of gene expression, epigenetic | −0.5 | 0.042 | 0.6 |
| BORCS8_MEF2B | Lysosomes | BORC complex, role in lysosomes movement and localization at the cell periphery | −1.0 | <0.01 | 0.4 |
| CCND1 | Cell cycle | Positive regulation of G1/S transition of the mitotic cell cycle | 1.1 | <0.01 | 3.1 |
| CCND2 | Cell cycle, apoptosis | Positive regulation of G1/S transition of the mitotic cell cycle, negative regulation of apoptosis | −0.7 | 0.018 | 0.5 |
| CDK4 | Cell cycle, apoptosis | Negative regulation of G1/S transition of the mitotic cell cycle, positive regulation of apoptotic process | 1.4 | <0.01 | 4.0 |
| CDKN2A | Cell cycle, NF-kB, apoptosis | Negative regulation of G1/S transition of the mitotic cell cycle, negative regulation of NF-kB, positive regulation of apoptotic process | 1.0 | <0.01 | 2.7 |
| CDKN2C | Cell cycle | Negative regulation of G1/S transition of the mitotic cell cycle | 1.0 | <0.01 | 2.8 |
| CHEK1 | Cell cycle, DNA repair, apoptosis | Positive regulation of cell cycle, DNA damage checkpoint and repair, apoptosis | 1.1 | <0.01 | 3.0 |
| CHEK2 | Cell cycle, DNA repair, apoptosis | Positive regulation of cell cycle, DNA damage checkpoint and repair, apoptosis | 0.8 | <0.01 | 2.1 |
| CXCL12 | Chemotaxis, apoptosis | Cell chemotaxis, defense response, negative regulation of apoptotic process, DNA damage | −0.6 | 0.014 | 0.5 |
| DAZAP1 | Cell differentiation and proliferation | Cell differentiation, cell proliferation, positive regulation of mRNA splicing | 0.8 | 0.016 | 2.3 |
| ING1 | Cell cycle | Negative regulation of cell growth, cooperates with TP53 | −1.1 | <0.01 | 0.3 |
| MKI67 | Cell proliferation | rRNA transcription | 1.5 | <0.01 | 4.4 |
| MYC | Cell proliferation | Transcription factor that binds DNA and activates transcription of growth-related genes (positive regulation of gene expression), negative regulation of apoptotic process | 0.9 | <0.01 | 2.5 |
| MYCN | Gene expression | Regulation of gene expression, DNA-binding | −0.5 | 0.052 | 0.6 |
| NOTCH1 | Multiple negative regulations | Affects the implementation of differentiation, proliferation, angiogenesis, and apoptotic programs. Multiple negative regulations | −0.8 | <0.01 | 0.5 |
| NOTCH2 | Multiple regulations | Affects the implementation of differentiation, proliferation and apoptotic programs | 0.6 | 0.020 | 1.8 |
| NSD2 | B-cell development | Histone methyltransferase, B-cell development (B1), and B2 activation, humoral immune response, isotype class switch recombination, germinal center formation | 1.0 | <0.01 | 2.7 |
| PAX5 | B-cell development | The commitment of lymphoid progenitors to B-lymphocyte lineage, promotes development of the mature B-cell stage. | −0.7 | 0.010 | 0.5 |
| PIK3CA | ERBB2 signaling, apoptosis | Cell migration, ERBB2 signaling pathway, negative regulation of apoptosis, | 0.5 | 0.042 | 1.7 |
| PIK3CD | B-cell development and function | Mediates immune responses. Contributes to B-cell development, proliferation, migration, and function. Required for B-cell receptor (BCR) signaling | 0.5 | 0.025 | 1.7 |
| PTEN | Cell cycle, tumor suppressor gene | Negative regulation of G1/S transition of the mitotic cell cycle | −0.8 | 0.012 | 0.5 |
| PTK2 | Multiple regulations | Regulation of cell migration, adhesion, cell cycle progression, cell proliferation, apoptosis, MAPK/ERK1 pathway, MDM2 and TP53 recruitment | 0.5 | 0.035 | 1.7 |
| RB1 | Cell cycle, tumor suppressor gene | Tumor suppressor that is a key regulator of the G1/S transition of the cell cycle | −0.5 | 0.043 | 0.6 |
| SYNE1 | Cytoskeleton | Cytoskeleton-nuclear membrane anchor activity, maintaining of subcellular spatial organization | −0.6 | <0.01 | 0.5 |
| TERT | Telomerase, multiple functions | Telomerase, negative regulation apoptosis, positive regulation G1/S transition of the mitotic cell cycle, negative regulation of gene expression | 0.7 | <0.01 | 2.0 |
| XIAP | Multiple functions, regulation of caspases and apoptosis | Multi-functional protein that regulates not only caspases and apoptosis, but also modulates inflammatory signaling and immunity, copper homeostasis, mitogenic kinase signaling, cell proliferation, as well as cell invasion and metastasis | −0.8 | <0.01 | 0.5 |
| m | Gene | Cut-Off | Log-Rank p Value | Breslow p Value | Hazard Risk | Correlation with High MKI67, Odds Ratio (OR) | OR p Value |
|---|---|---|---|---|---|---|---|
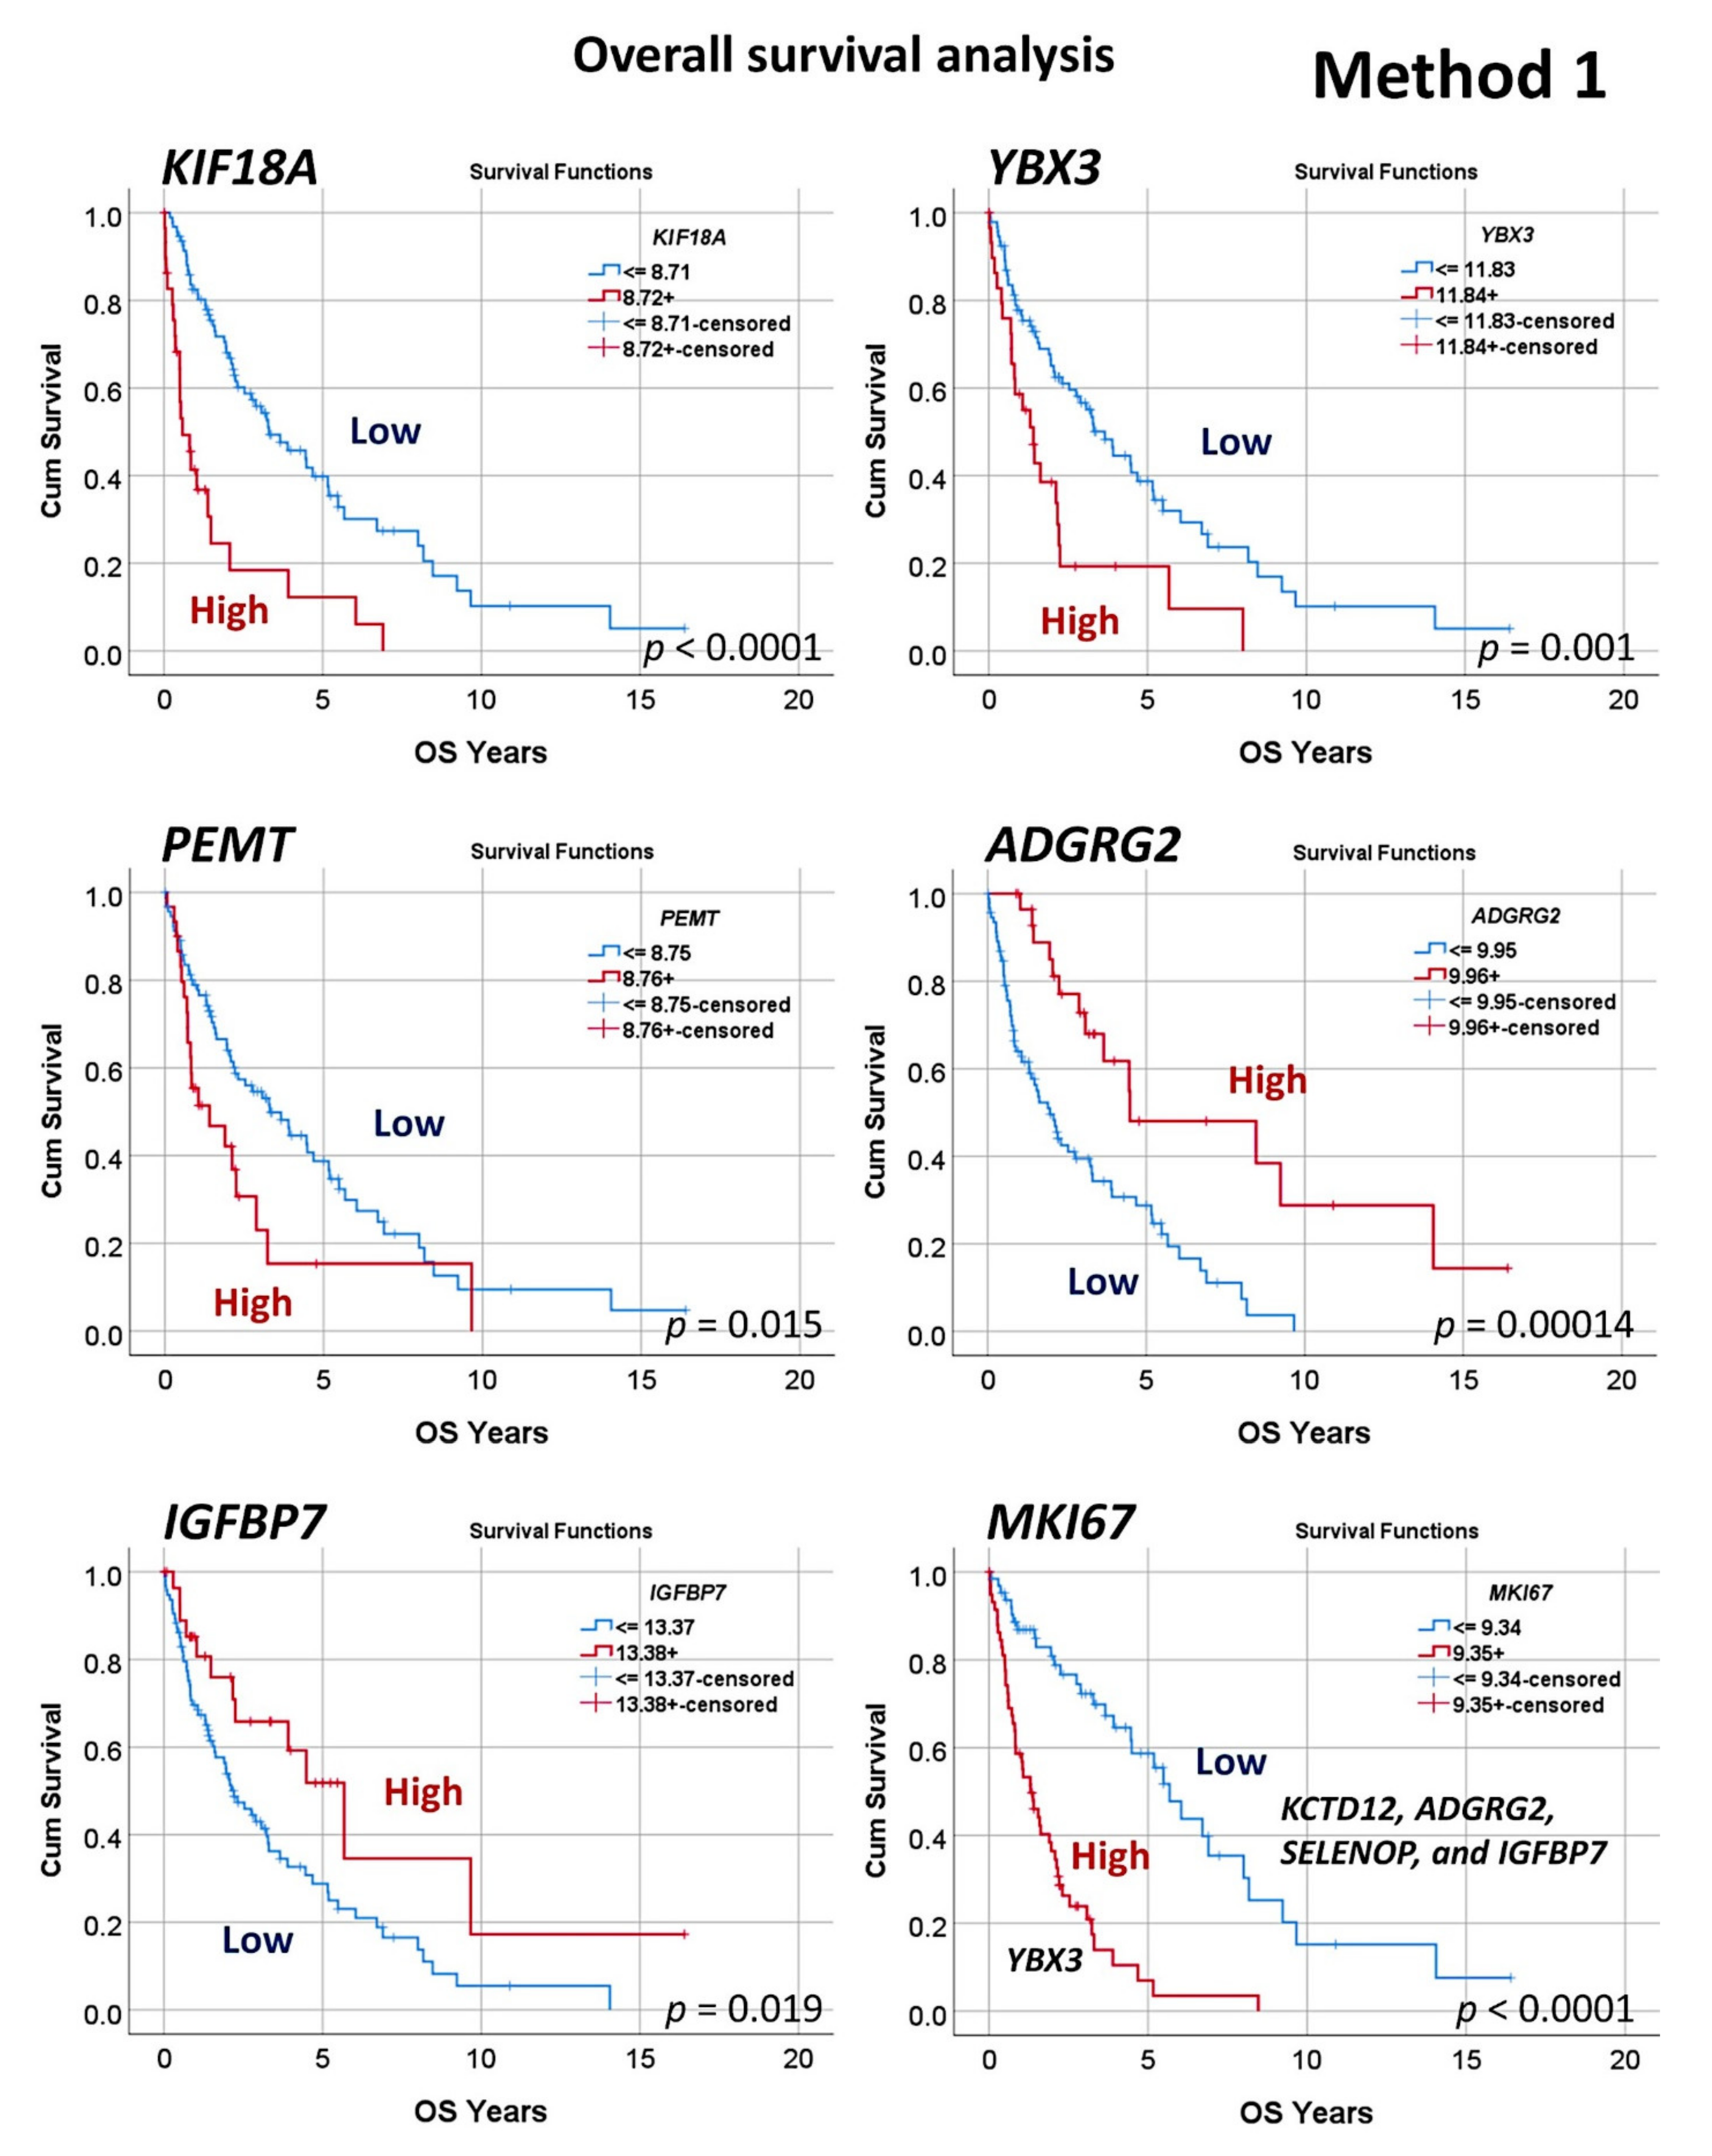
| 1 | KIF18A | 8.71 | <0.001 | <0.001 | 3.5 (2.1–5.8) | 1.3 (0.6–3.0) | 0.499 |
| 2 | YBX3 | 11.83 | 0.001 | 0.002 | 2.3 (1.4–3.8) | 2.3 (0.9–5.3) | 0.056 |
| 3 | PEMT | 8.75 | 0.015 | 0.016 | 1.9 (1.1–3.1) | 1.1 (0.5–2.5) | 0.798 |
| 4 | GCNA | 7.66 | 0.037 | 0.137 | 1.8 (1.0–3.3) | 2.1 (0.9–4.9) | 0.077 |
| 5 | POGLUT3 | 8.81 | 0.034 | 0.014 | 1.6 (1.0–2.5) | 0.9 (0.4–1.7) | 0.649 |
| 6 | SELENOP | 12.81 | 0.028 | 0.048 | 0.6 (0.4–0.9) | 0.2 (0.1–0.5) | 0.001 |
| 7 | AMOTL2 | 8.99 | 0.039 | 0.029 | 0.5 (0.3–0.9) | 0.5 (0.2–1.1) | 0.068 |
| 8 | IGFBP7 | 13.37 | 0.019 | 0.042 | 0.5 (0.3–0.9) | 0.2 (0.1–0.4) | <0.001 |
| 9 | KCTD12 | 12.02 | 0.022 | 0.042 | 0.5 (0.3–0.9) | 0.2 (0.1–0.5) | 0.01 |
| 10 | ADGRG2 | 9.95 | <0.001 | <0.001 | 0.3 (0.2–0.6) | 0.2 (0.1–0.5) | 0.001 |
| Model | Overall Accuracy for Predicting the Overall Survival | No. of Genes Used in the Final Model | Gene Names |
|---|---|---|---|
| Logistic regression | 100 | 50 | All the 50 |
| Bayesian network | 92 | 50 | All the 50 |
| Discriminant | 86 | 50 | All the 50 |
| CHAID | 85 | 6 | E2F2, GCNA, FMNL3, POGLUT3, SELENOP, and ZDHHC21 |
| C&R tree | 85 | 21 | ADGRG2, CDC20, CEACAM6, ESPL1, FABP5, FAM83D, FMNL3, GCNA, GLIPR1, ID1, ITGAX, KIF2C, MKI67, RGS1, ROBO4, RPGRIP1L, RRAS, SELENOP, TAMM41, ZDHHC21, and ZWINT |
| SVM | 81 | 50 | All the 50 |
| KNN algorithm | 78 | 50 | All the 50 |
| Neural network | 76 | 50 | All the 50 |
| C5 | 76 | 3 | ESPL1, RPGRIP1L, and ZWINT |
| Quest | 65 | 50 | All the 50 |
| Gene | Function | Role in Cancer |
|---|---|---|
| KIF18A | Microtubule motor activity, role in mitosis | Overexpressed in various types of cancer; inhibitors are available [73] |
| YBX3 | Translation repression, negative regulation of intrinsic apoptosis signaling | Related to myelodysplastic syndromes and acute myeloid leukemia [74] |
| PEMT | Negative regulation of cell proliferation, positive regulation of lipoprotein metabolic process | Critical role in breast cancer progression [75] |
| GCNA | Acidic repeat-containing protein, expressed in germ cells (testis) | Regulate genome stability [76,77] |
| POGLUT3 | Protein glucosyltransferase, specifically targets extracellular EGF repeats of proteins (NOTCH1 and NOTCH3) | Related to glioblastoma multiforme tumorigenesis [78] |
| SELENOP | Transport of selenium, response to oxidative stress | Prostate cancer recurrence [79] |
| AMOTL2 | Actin cytoskeleton organization, angiogenesis, cell migration, Wnt-signaling pathway | Angiogenesis in pancreatic, and proliferation in lung cancer [80,81] |
| IGFBP7 | Cell adhesion, metabolic process (retinoic acid, cortisol), regulation of cell growth | Prognosis of acute lymphoblastic leukemia [82] |
| KCTD12 | GABA-B receptors auxiliary subunit | Proliferation in breast cancer [83] |
| ADGRG2 | G protein-coupled receptor signaling pathway | Tumor suppressor in endometrial cancer [84] |
| TYMS | Regulation of mitotic cell cycle (G1/S transition) | Association with non-Hodgkin lymphomas, prognosis of pancreatic cancer [85,86] |
Publisher’s Note: MDPI stays neutral with regard to jurisdictional claims in published maps and institutional affiliations. |
© 2022 by the authors. Licensee MDPI, Basel, Switzerland. This article is an open access article distributed under the terms and conditions of the Creative Commons Attribution (CC BY) license (https://creativecommons.org/licenses/by/4.0/).
Share and Cite
Carreras, J.; Nakamura, N.; Hamoudi, R. Artificial Intelligence Analysis of Gene Expression Predicted the Overall Survival of Mantle Cell Lymphoma and a Large Pan-Cancer Series. Healthcare 2022, 10, 155. https://doi.org/10.3390/healthcare10010155
Carreras J, Nakamura N, Hamoudi R. Artificial Intelligence Analysis of Gene Expression Predicted the Overall Survival of Mantle Cell Lymphoma and a Large Pan-Cancer Series. Healthcare. 2022; 10(1):155. https://doi.org/10.3390/healthcare10010155
Chicago/Turabian StyleCarreras, Joaquim, Naoya Nakamura, and Rifat Hamoudi. 2022. "Artificial Intelligence Analysis of Gene Expression Predicted the Overall Survival of Mantle Cell Lymphoma and a Large Pan-Cancer Series" Healthcare 10, no. 1: 155. https://doi.org/10.3390/healthcare10010155