Article

A Consolidated Decision Tree-Based Intrusion Detection System for Binary and Multiclass Imbalanced Datasets

1
Department of Computer Applications, Sikkim Manipal Institute of Technology, Sikkim Manipal University, Majitar 737136, Sikkim, India
2
Department of Electrical and Electronics Engineering, Sikkim Manipal Institute of Technology, Sikkim Manipal University, Majitar 737136, Sikkim, India
3
Department of Intelligent Mechatronics Engineering, Sejong University, Seoul 05006, Korea
4
Department of Computer Science and Engineering, Chandigarh Group of Colleges, Landran 140301, Punjab, India
5
Department of Computer Science and Engineering, School of Technology, Pandit Deendayal Energy University, Gandhinagar 382007, Gujarat, India
*
Author to whom correspondence should be addressed.
These authors contributed equally to this work and are first co-authors.
Mathematics 2021, 9(7), 751; https://doi.org/10.3390/math9070751
Submission received: 17 February 2021 / Revised: 19 March 2021 / Accepted: 23 March 2021 / Published: 31 March 2021
(This article belongs to the Section Mathematics and Computer Science)

Abstract

:
The widespread acceptance and increase of the Internet and mobile technologies have revolutionized our existence. On the other hand, the world is witnessing and suffering due to technologically aided crime methods. These threats, including but not limited to hacking and intrusions and are the main concern for security experts. Nevertheless, the challenges facing effective intrusion detection methods continue closely associated with the researcher’s interests. This paper’s main contribution is to present a host-based intrusion detection system using a C4.5-based detector on top of the popular Consolidated Tree Construction (CTC) algorithm, which works efficiently in the presence of class-imbalanced data. An improved version of the random sampling mechanism called Supervised Relative Random Sampling (SRRS) has been proposed to generate a balanced sample from a high-class imbalanced dataset at the detector’s pre-processing stage. Moreover, an improved multi-class feature selection mechanism has been designed and developed as a filter component to generate the IDS datasets’ ideal outstanding features for efficient intrusion detection. The proposed IDS has been validated with state-of-the-art intrusion detection systems. The results show an accuracy of 99.96% and 99.95%, considering the NSL-KDD dataset and the CICIDS2017 dataset using 34 features.

1. Introduction

Due to the extensive proliferation of network and communication devices in data-centric environments, security experts’ managing security becomes an utmost challenge. The challenge is the evolvement of newfangled network threats that sneak into the computing environments to compromise the security policies, privacy, and even locking down the system indefinitely. Intrusion Detection System (IDS) plays a crucial role in countering incoming network threats before it starts its harmful behavior. Intrusion detection consists of identifying the malevolent activities in a host, which eventually propagate to the other hosts over the network. The harmful behavior of these activities is visible once it starts affecting the target hosts. An efficient IDS acts as a second line of defense and comes into action when a firewall fails to detect a threat. The objective of IDS is to analyze, detect and report malicious activities in a host or network [1]. For efficient detection, an IDS employs anomaly-based detection [2,3], signature-based detection [4,5,6], or a combination of both [7,8].
An Anomaly-based Detection Engine (ADE) relies on normal profiles of metrics such as protocol, flow duration, total forwarded packets, and the total length of forwarded packets. Any deviation of the normal profile is triggered as an intrusion. On the other hand, a Signature-based Detection Engine (SDE) builds a detection model using the normal and attack patterns of network traffics. These methods have their advantages and disadvantages. The ADE detects unknown attacks [9], and an SDE efficiently detects known attacks [10]. The SDEs effectively detect threats and employ various cutting-edge technologies such as machine learning, artificial intelligence, and deep learning. Almost all the SDEs have three standard stages of pre-processing, processing, and post-processing. However, a design flaw in any of these stages of SDEs may make the system ineffective, and the detection model ends up generating numerous false alarms. This limitation is related to the detection model’s training on the high-class imbalance [11] dataset. In a high-class imbalanced dataset, the ratio of majority to minority class instances is significantly high. This situation destabilizes and biased the detector towards the majority class. Therefore, this scenario generates false alarms. Class imbalance is critical challenging to solve even for the hosts present in a network of nominal size.
Therefore, this paper’s main objective is to propose a C4.5 based IDS based on Consolidated Tree Construction (CTC) algorithm to solve the class imbalance issue. The main contribution is to propose a mechanism of intrusion detection designed to be placed in the hosts of a computer network to monitor and detect incoming network threats. The proposed IDS functions in two phases. In phase 1 deals with pre-processing, and phase 2 deals with intrusion detection. At the pre-processing stage, an improved random sampling mechanism, namely, Supervised Relative Random Sampling (SRRS) has been proposed to generate a balanced sample even from a high-class imbalanced dataset.
Furthermore, an improved probabilistic graph-based feature selection mechanism called Improved Infinite Feature Selection for Multiclass Classification (IIFS-MC), which is based on the top of Infinite Feature Selection (IFS) [12,13] has been deployed to select the n-best feature of the designed sample. The IIFS-MC allocates appropriate weights to each feature of the underlying IDS dataset and ranks them accordingly. This feature ranking approach is considered to be the most effective mechanism for selecting attributes [12,13]. It is possible to select the best number of attributes for classification and detection by ranking the attributes. Moreover, at the detection phase, a C4.5 based classification mechanism called J48Consolidated [14] empowered with CTC [15] is deployed to detect possible threats. The detector has been tested extensively on three widely cited datasets of the Canadian Institute of Cybersecurity, i.e., NSL-KDD, an extension of the famous KDD dataset, ISCXIDS2012, and the latest CICIDS2017 dataset.
The remaining document is structured as follows: Section 2 presents the related works; Section 3 describes the materials and methods; Section 4 shows the results and discussion, and Section 5 concludes the paper by presenting the most significant shortcomings of the proposed work.

2. Related Works

Multiple research proposals in the field of signature-based intrusion detection are available in the literature. Most of such work focuses on binary detection engines, i.e., evaluating instances as an attack or benign or multiclass detection engines, i.e., evaluating instances to determine the class of threats. This section presents a literature review on binary detection engines and multiclass detection engines in Section 2.1 and Section 2.2, respectively.

2.1. Binary Detection Engines

The binary class intrusion detection model addresses an incoming instance as to whether attack or benign. Due to the involvement of two classes, this type of detection model is essential. A new multi-objective optimization approach [16] plays a crucial role in efficient intrusion detection. The bagging and boosting approach of multiple detection models on the top of features selected through Naïve Bayes (NB) detects intrusions with a detection rate of 92.7%. Similarly, an unsupervised machine learning-based IDS [17] categorizes network traffic into standard and suspicious profiles without prior knowledge about the attack events. The unsupervised approach is adaptive and a distributed structure for intrusion detection. The distributed structure of intrusion detection is appealing as compared to the centralized model of intrusion detection.
Apart from NB and unsupervised learning, the decision tree is also significantly used for designing IDS. A Snort based intrusion detection approach [18] and decision tree have been designed for high-speed networks. The Snort detection model trained and tested three features of the ISCXIDS2012 dataset that reveal a detection accuracy of 99%. A C4.5 decision tree and Multilayer Perceptron (MCP) combined to form a hybrid detection model [19], which demonstrated 99.50% accuracy with a lower false alarm rate of 0.03%. This performance is associated with the discernibility function-based feature selection that the author employed during the preprocessing stage. The high-speed big data networks also influenced the researchers to design parallel machine learning-based intrusion detection systems. A cutting-edge machine learning-based technique known as XGBoost specifically designed for big data acts as an IDS [20] in a parallel computing environment. The XGBoost IDS achieves a detection rate of 99.60% and an accuracy rate of 99.65%, with a low false alarm rate of 0.302%. However, the system should be validated on other datasets to understand the true capability of the XGBoost based IDS.
Several other binary intrusion detection models have been proposed. A Bayesian network-based IDS using a flow-based validation to detect network worms and brute force attacks is proposed by [21]. The authors of [22] present a multilayer feedforward Neural Network in collaboration with the decision tree to detect P2P Botnets. A bigram technique on the top of Recursive Feature Addition (RFA) feature selection to detect stealthy and low profile attacks is presented [23].

2.2. Multiclass Detection Engines

A multi-class intrusion detection model provides detailed attack information as compared to binary IDS. Similar to a binary IDS, a multi-class IDS identifies an instance either as an attack or benign. Numerous authors proposed multiple variations of multi-class IDS. A multi-class IDS has been proposed using an ensemble of Support Vector Machine (SVM) [24] to detect four categories of attacks such as R2L, U2R, DoS, and Probe. The SVM ensemble IDS shows a detection rate of 93.40% on the NSL-KDD dataset. Though this multi-class detection model reveals an impressive detection rate, at the same time, it suffers from a substantial false alarm rate of 14%. SVM is also hybridized with Genetic Algorithm (GA) [25] and Multiple Criteria Linear Programming (MCLP) [26] for intrusion detection, where both GA and MCLP extracted suitable features from CICIDS2017 and NSL-KDD intrusion dataset respectively. The CICIDS2017 and NSL-KDD datasets are highly imbalanced, where the CICIDS2017 dataset contains a huge instance set representing up-to-date attack features. Therefore, an appropriate sampling technique should have been deployed to generate a suitable balanced sample, which is not clear in [25]. Similarly, an updated version of SVM called Ramp Loss K-Support Vector Classification-Regression (Ramp-KSVCR) [27] has been proposed as an intrusion detector, which proved to be robust and intelligently takes care of imbalanced and skewed attack distributions, where the Ramp Loss function handles the noise present in the intrusion dataset. The Ramp-KSVCR detection model is silent about any feature selection mechanisms. Adopting a feature selection mechanism may be beneficial in improving the detection rate and accuracy further. Another variation of SVM called Least Square Support Vector Machine (LSSVM) [28] acts as an SDE where LSSVM reveals the accuracy of 99.94% on the features selected through a mutual information-based feature selection mechanism.
The NB classifier also plays an imperative role in intrusion detection. NB-based IDS has been proposed to tackle HTTP attacks [29], where NB acts as both feature selector and intrusion detector. The NB detection model successfully achieved a 99.38% detection rate, 1% false-positive rate, and 0.25% false-negative rate on the NSL-KDD dataset.
Similar to supervised learning, unsupervised learning principles have been used extensively to design cutting-edge IDSs. Growing Hierarchical Self-Organizing Maps (GHSOMs), as an unsupervised intrusion detection scheme [30], employs a multi-objective approach for extracting suitable features. The detector makes it possible to differentiate between normal and anomalous traffic and different anomalies. The GHSOMs approach on multi-objective feature selection shows detection rates up to 99.8% and 99.6% with normal and anomalous traffic and accuracy values up to 99.12%. Furthermore, an IDS approach is proposed [31] using a modified version of Optimum-Path Forest (OPF) and K-means unsupervised learning. The K-means algorithm is used for producing different homogeneous training subsets from original heterogeneous training samples. The pruning module of MOPF uses centrality and the social network analysis’s prestige concepts for finding attack instances. The experiment is conducted on the NSL-KDD dataset, and the forestalling results reveal that the method shows superior results in terms of detection and false alarm rate.
Supervised and unsupervised techniques are also combined to design intrusion detection engines. For instance, a Non-symmetric Deep AutoEncoder (NDAE) and Random Forest classifiers [32] have been used on the top of NDAE based unsupervised feature learning. The stacked classifiers have been implemented in the Graphics Processing Unit (GPU) -enabled TensorFlow and evaluated using the benchmark KDD Cup ’99 and NSL-KDD datasets. The proposed architecture [32] of NDAE has demonstrated high accuracy, precision, and recall and reduced training time. Though the approach appears to be stable and accurate, the authors acknowledged that it is not perfect, and there is further room for improvement.

3. Materials and Methods

The proposed approach includes three broad logical modules: preprocessing, feature ranking and selection, and decision making. The issue of class imbalance has been reduced in three stages in all the modules [33]. Figure 1 presents the proposed framework block diagram.
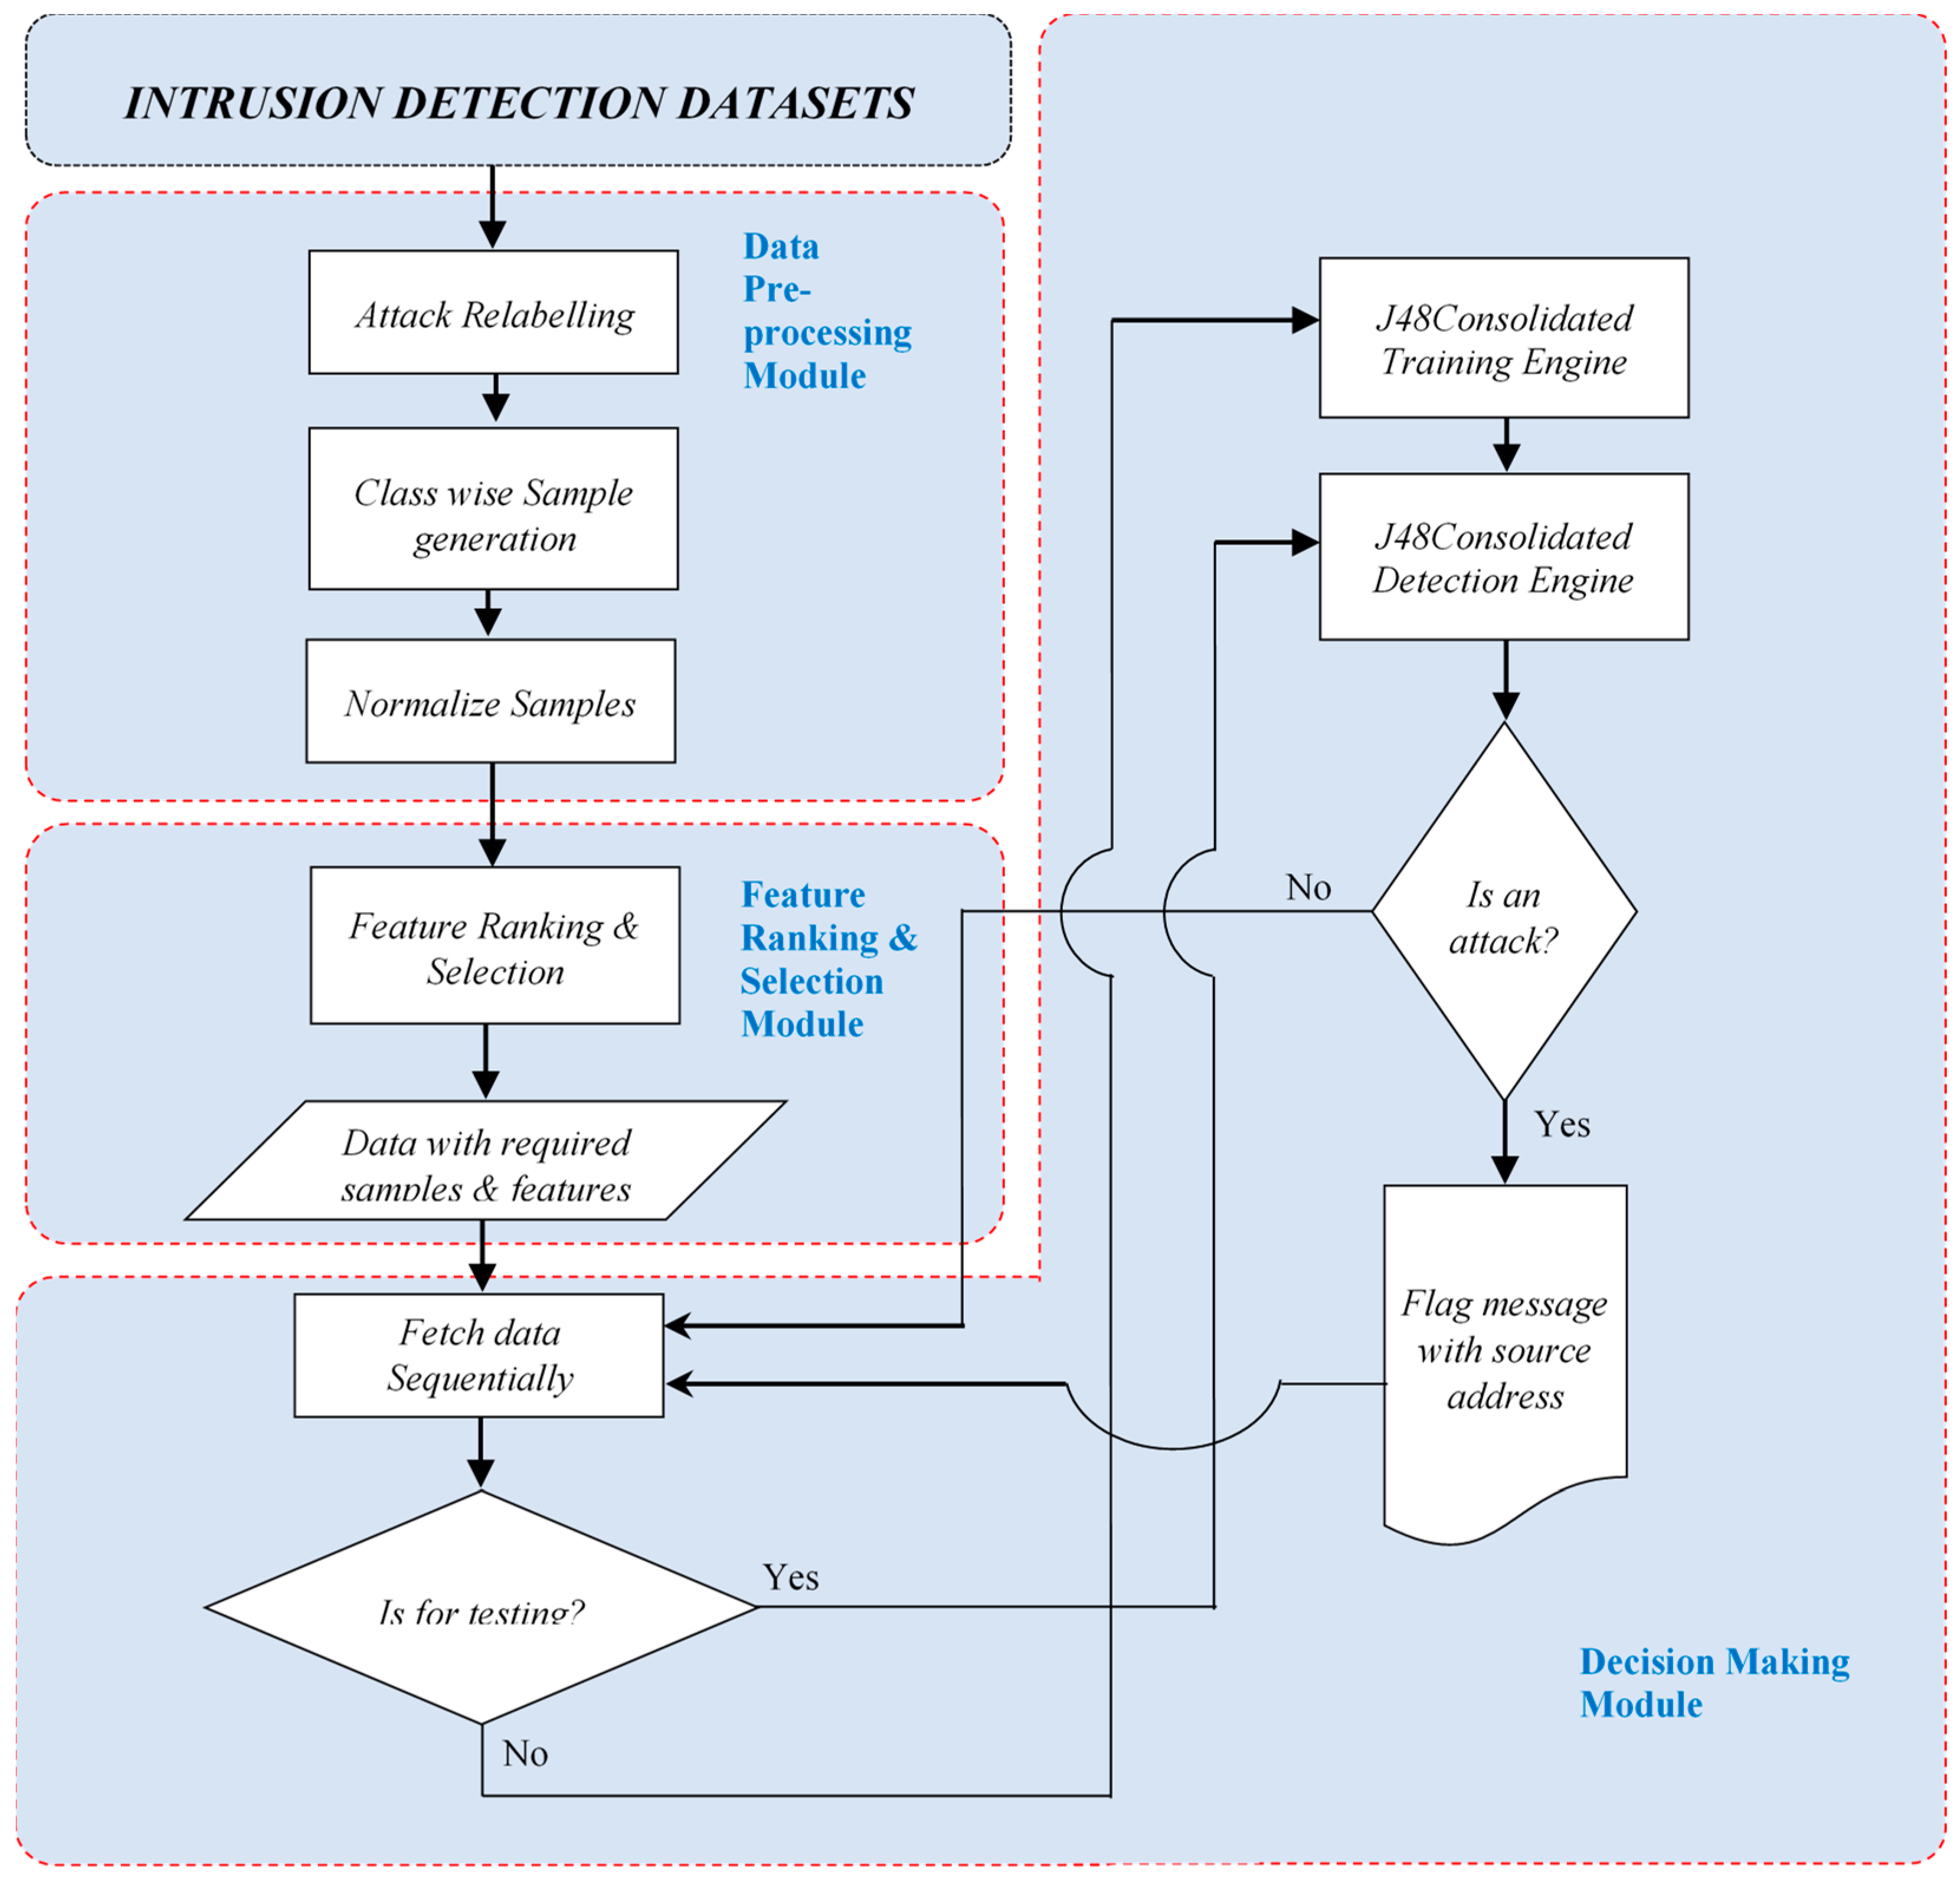
Data preprocessing starts with first removing duplicate and missing value instances of the dataset on which the system will be trained. Once the duplicate and missing values are removed, the related attack labels are merged with new class labels. By forming the new attack labels, it reduces the class imbalance issue significantly. A supervised sampling approach has been proposed to generate class-wise samples. Therefore, the class imbalance issue of the IDS datasets has been improved. A suitable normalizer has been applied to fix the dataset values in the range of 0 and 1.
In the feature selection phase, a suitable feature selector is deployed to retrieve the essential features by eliminating redundant features of the dataset. In the final stage, an intelligent C4.5 classifier is deployed, which resumes the training samples using CTC. The detailed procedure from dataset selection to intrusion detection is described as follows.

3.1. IDS Datasets

The preparation of data is critical for the training and testing of the IDS model. The candidate datasets NSLKDD [34], ISCXIDS2012 [35], CICIDS2017 [36] provided by the Canadian Institute for Cybersecurity are the basis of the proposed IDS. On the one hand, the NSLKDD and CICIDS2017 datasets are multiclass and contain benign and multi-attack instances. On the other hand, the ISCXIDS2012 is a binary IDS dataset containing a mixture of benign and attack instances. These datasets’ features contain normal and the most recent frequent attacks resembling the real-world network environment. These datasets contain a considerable number of instances and feature sets, which is sufficient enough to be a bottleneck for any IDS. Therefore, these datasets can be considered reliable candidates for evaluating the proposed IDS architecture’s actual performance.
The system has been designed to select a required number of features with a reasonably small number of samples from these datasets for training and testing purposes. Before sampling and feature selection, the duplicate instances have been removed using Weka’s unsupervised RemoveDuplicates filter, and the unique instances are considered for feature selection and sampling. Furthermore, biases of the detector towards majority classes happen if the dataset is a high-class imbalance in nature. A reliable IDS detector must be prepared for such an adverse situation. The three datasets considered here are prone to high-class imbalance.
The prevalence ratio of normal labels and attack labels is 51.882% and 48.118%, respectively, for the NSLKDD dataset. Though the prevalence ratio seems to be convincing by just keeping normal instances on one side and attacking instances on the other side but observing the individual attack labels, the ratio seems discouraging. There is a considerable gap between majority class labels (Normal) and minority class labels (Spy, udpstorm, worm, SQL attack). This prevalence gap of attack labels makes the dataset imbalanced. By combining a few attack labels through forming a new label is possible to solve the imbalance issue.
In the ISCXIDS2012 dataset, data of normal and malicious instances are scattered in seven different XML files. The data from those XML files are merged into a single CSV file for analyzing the characteristics of the whole dataset. An XML file named “TestbedThuJun17-1Flows.xml” was found to be corrupted at the source during the extraction process. Therefore, it has been decided to drop that file from the analysis. The rest of the data files of the ISCXIDS2012 dataset are so large that the idea of excluding the file “TestbedThuJun17-1Flows.xml” had a negligible contribution to the entire set of data and hence will not affect the detection process. The ISCXIDS2012 is a high-class imbalanced dataset. The majority class (Normal) has a 96.98% prevalence rate. By considering this, the dataset directly may bias the detection model towards the majority class. Therefore, an efficient sampling technique is needed that can generate a balanced sample from this unbalanced dataset.
Finally, the most recent dataset, named CICIDS2017, is considered. The dataset contains a mixture of the most up-to-date attacks and normal data. The dataset claims to fulfill all the 11 criteria of an IDS described by Gharib et al. [37]. By analyzing these IDS dataset design criteria, CICIDS2017 appears to be the most prominent dataset in evaluating the proposed IDS. Physically inspecting the dataset, it has been found that the dataset contains 3,119,345 records. Out of which, 288,602 instances have missing class labels, and 203 instances have missing values. Therefore, it has been decided to remove these outliers before conducting any further experiments. After removing 203 missing values and 288,602 missing class labels, a dataset is reduced to 2,830,540 distinct records. Furthermore, it is found that the dataset contains 15 attack labels and 83 features. It is also observed that there is a considerable class imbalance between the majority class and other classes. In this situation, if a detection model is created considering this CICIDS2017 dataset directly, then a false alarm might be generated for any incoming instance of attack class Heartbleed or Infiltration. Therefore, the dataset must be sampled in a balanced manner before training the IDS detector.
All the datasets NSLKDD, ISCXIDS2012, and CICIDS2017 are highly class imbalanced. Therefore, the challenge is to design a sampling model and detector, which can work efficiently on these imbalanced datasets.

3.2. Attack Relabeling

The class imbalance problem is widely cited in [11,38,39], and its countermeasures have been addressed elaborately in [40]. The problem of class imbalance lies more with the multiclass intrusion datasets. Numerous attack labels are found in a multiclass intrusion dataset that needs to be relabeled by merging two or more similar kinds of attacks either in terms of similar characteristics, features, or behaviors. Therefore, the NSLKDD and CICIDS2017 multiclass intrusion datasets have been considered to merge the respective minor class labels to form the new class information.
The NSLKDD dataset contains 39 types of attack and benign instances. The normal labels have more than 51% occurrence, whereas many attacks have a very low prevalence rate of 0.001%. Various similar attack labels of the NSLKDD dataset have been merged to generate new attack labels to reduce such imbalances. The selection of new attack labels has been considered per the guideline provided in [41,42]. The newly formed attack labels are presented as follows.
  • Denial of Service Attack (DoS): It is an attack in which the attacker makes some computing or memory resource too busy or too full to handle legitimate requests or denies legitimate users access to a machine. The NSLKDD dataset’s various attacks that fall within this category are apache2, back, land, mailbomb, neptune, pod, processtable, smurf, teardrop, udpstorm, and warezclient.
  • User to Root Attack (U2R): It is a class of exploit in which the attacker starts with access to a normal user account on the system (perhaps gained by sniffing passwords, a dictionary attack, or social engineering) and can exploit some vulnerability to gain root access to the system. U2R attacks of the NSLKDD dataset are buffer_overflow, httptunnel, loadmodule, perl, ps, rootkit, sqlattack, and xterm.
  • Remote to Local Attack (R2L): It occurs when an attacker who can send packets to a machine over a network but does not account on that machine exploits some vulnerability to gain local access as a user of that machine. The attacks that fall into this group are ftp_write, guess_passwd, imap, ftp_write, multihop, named, phf, sendmail, snmpgetattack, snmpguess, spy, warezmaster, worm, xlock, and xsnoop.
  • Probing Attack: It is an attempt to gather information about a network of computers for the apparent purpose of circumventing its security controls. Probing attacks are ipsweep, mscan, nmap, portsweep, saint, and satan.
Once the new attack labels are identified, the old labels are mapped to form new attack labels. The characteristics of new attack labels in the NSLKDD dataset with their prevalence rate are presented in Table 1.
The imbalance ratio of newly created attack labels has been improved significantly as compared to the old attack labels. The prevalence rate of majority to minority class becomes 51.88:0.17, which is far better than earlier 51.88:0.001. Moreover, comparing the majority benign label (Normal) with other attack labels, it can be realized that the imbalance ratio has also been improved to a great extent.
Multiclass dataset CICIDS2017 has 15 different types of attack information. The normal label (Benign) has more than 83% occurrence, whereas many attacks have a very low prevalence rate of 0.00039%. To reduce such imbalances, various similar attack labels of this dataset have to be merged to generate new attack labels. The selection of new attack labels has been considered as per the guideline provided by the publisher of the CICIDS2017 dataset. The newly formed attack labels with their characteristics are presented in Table 2.
The imbalance ratio of newly created attack labels has been improved significantly compared to the old attack labels of the CICIDS2017 dataset. The majority’s prevalence rate to minority class becomes 83.34%:0.001%, which is far better than earlier 83.34%: 0.00039%. Moreover, comparing the majority label (Normal) with other attack labels, it can be realized that the imbalance ratio has also been improved to a great extent.

3.3. Supervised Relative Random Sampling (SRRS)

The random sampling procedure is either a probability sampling or nonprobability in nature. In probability sampling, the probability of an object being included in the sample is defined by the researcher. On the other hand, there is no tactic of estimating the probability of an item being included in the sample in nonprobability sampling. Suppose the interest is to infer that a sample is in line with the original data’s finding. In that case, probability sampling is the better approach to consider. Random sampling is popularly known as a probability sampling mechanism [43].
Random sampling ensures each item of the original item set stands a chance to be selected in the sample. The n samples are selected tuple-by-tuple from an original dataset of size N through random numbers between 1 and N . By signifying the dataset having N tuples as F i n —the focusing input and the desired samples as F o u t —focusing output, and the random sampling procedure has been represented in Algorithm 1.
Algorithm 1 Random Sampling
Mathematics 09 00751 i001
In this algorithm, the sampling is done with replacement, i.e., each tuple has the same chance at each draw regardless of whether it has already been sampled or not. However, this kind of simple random sampling is purely unsupervised. In the case of a high-class imbalanced dataset, it does not guarantee a specific class label tuple will fall in the sample set. By observing the datasets considered here, especially the CICIDS2017 dataset, it is evident that the minority class contains only 36 tuples, whereas the primary class contains a vast volume of 2,359,087 tuples. In such a scenario, merely drawing a random sample will not help retrieve a balanced sample consisting of instances of all the class labels. Therefore, a specialized sampling mechanism needs to be developed, which should guarantee all class labels’ equal chances to participate in the sample space.
Keeping in view this requirement a supervised sampling technique has been designed that generates random samples for each class label of the dataset. Each instance of each class label has an equal priority and probability of participating in the sample space. The proposed sampling algorithm generates a sample of each class by assigning weight to each class label based on the frequency it holds. The number of random samples of a class label is generated according to the allocated weight at each iteration. The iteration continues until the desired samples of the specified size are generated. The allocated weight is relative and depends upon the frequency of the class label in the current sample set. The more the frequency, the less the weight allocated. This strategy has been imposed deliberately to give more weight to the class, having low frequency. The detailed step of the SRRS has been presented in Algorithm 2.
Algorithm 2 Supervised Relative Random Sampling (SRRS)
Mathematics 09 00751 i002
The main logic behind sample generation is generating class-wise random samples. The class-wise random sample is possible through
W C [ P ] = 100 [ s f C [ p ] | s t e p S c | 100 ]
where, W C [ P ] = desired sample weight for class number p, s t e p S c = stepwise total instances for all classes. Once the desired weight is on hand, the random sampling algorithm (Algorithm 1) is called to get the required sample from each attack class instance. It should be noted that the sampling generation holds the principle k | F o u t | .
The proposed Supervised Relative Random Sampling (SRRS) has been validated using NSLKDD, ISCXIDS2012, and CICIDS2017 datasets through—
  • Improvement in class imbalance
  • The margin of sampling error.
Class imbalance of a class is measured as the ratio of the number of instances of a class with the total number of instances of the dataset. On the other hand, the margin of sampling error is calculated through the Yamene formula as
n = N 1 + N ( e ) 2
where, n = required sample size, N = total number of instances in a dataset, e = Margin of error. Simplifying the formulae, the margin of error e is
e = N n N · n
The output of the SRRS algorithm is presented in Table 3, Table 4 and Table 5.
The SRRS algorithm performs consistently for all three datasets for varying sampling thresholds. The sampling thresholds considered here are 20,000, 60,000, and 100,000. In the case of the NSLKDD dataset for these sampling thresholds, SRRS generates 19,080, 56,032, and 87,312, respectively. This sample set leads to a very low sampling error of 0.007, 0.003, and 0.002, respectively. A similar kind of performance outcome is found for the ISCXIDS2012 and CICIDS2017 datasets.
Furthermore, considering class prevalence, it is found that the SRRS maintains a consistent prevalence ratio for all the attack labels. The improvement of prevalence (%) for all three datasets are summarized in Table 6.

3.4. Feature Ranking and Selection using IIFS-MC

The principle of feature selection falls into three types [44]. i.e., wrapper based, embedded and filter based. In wrapper-based feature selection, classifiers are used to generate feature subsets. Similarly, in embedded methods where feature selection is an inbuilt approach within the classifier, and the filter methods where properties of instances are analyzed to rank features followed by a feature subset selection. In the ranking phase, the reputation of each feature is evaluated through weight allocation [45]. Moreover, in the subset selection phase, only those ranked features are selected for which a classifier shows the highest accuracy [46,47,48,49,50,51]. However, the features can also be chosen, ignoring ranks [52]. In most cases, the subset selection procedure is supervised in nature.
There are several variations of filter-based feature selection mechanisms found in the literature. These feature selection mechanisms have their outcomes and limitations. The IFS is one of the recent unsupervised filter-based feature selection schemes that proved to be a magnificent feature selector over traditional popular schemes such as Fisher score [52], Relief [53], Mutual information (MI) [49,54], and Laplacian Score (LS) [55]. As a filter-based algorithm, the feature selection process in IFS [12] takes place in two steps. First, each feature of the underlying dataset is ranked in an unsupervised manner, and then the best m ranked features are selected through a cross-validation strategy. The distinguishing characteristic of IFS over other peer FS schemes is that all the features participate in estimating each feature’s weight. The idea is to construct an affinity graph from the feature set where the subset of features is realized as a path connecting them. The detailed steps of the IFS have been outlined in Algorithm 3.
Algorithm 3 Infinite Feature Selection (IFS)
Mathematics 09 00751 i003
For a generic distribution F = { f 1 , f 2 , , f c } , x represents the random set of samples of the instance set R, i.e., x R (where |x| = t). Now the target is to construct a fully connected graph G = ( V , E ) so that V represents the set of vertices representing each feature of sample x. The graph G is nothing but an adjacency matrix A, where E represents the weighted edges through pairwise relation of the feature distribution. In other words, each element aij of matrix A ( 1 i , j t ) , represents a pairwise energy term. Therefore, the element a i j can be represented as a weighted linear combination of two features f i and f j is
a i j = σ i j + ( 1 ) c i j
where,
α=a loading coefficient [0, 1]
σij=max(σi, σj), where σi and σj are the standard deviation of fi and fj, respectively.
cij=1 − Spearman(fi, fj) is the absolute Spearman’s rank correlation coefficient
Once the matrix A has been determined, the score of each feature can be estimated as:
S = e [ ( I 0.9 ρ ( A ) A ) 1 I ]
where ρ ( A ) denotes spectral radius and can be calculated as
ρ ( A ) = m a x ( | λ i | )
Here, λ i ϵ { λ 1 , λ 1 , λ 1 , λ t 1 } represent the eigenvalues of matrix A.
The authors found that there is considerable scope for improvement in the IFS algorithm. Equation (4) is the IFS algorithm’s heart, where the correlation matrix C i j has been generated in an unsupervised manner. It should be noted that the correlation between the features of intraclass instances is close to each other. Similarly, the correlation between the features of inter-class distances hugely deviates. Therefore, analyzing features using a correlation matrix for each class will provide better insight than the overall correlation matrix of all the instances. Algorithm 3 can be used for each class of the sample and a weighted matrix should be prepared to contain weights of features of all the classes, where the total number of rows represents the number of classes and the columns represent the number of features, respectively. As a final step, the real weight of features can be realized by calculating each column of the weight matrix’s average. The improved version of IFS has been named IIFS-MC has been represented in Algorithm 4. The idea behind IIFS-MC is to calculate the weight of features based on the class information of instances. The class-wise feature weights improve classification accuracy to an impressive level.
As the class-wise weights of features have been calculated, therefore the complexity of this algorithm would be
O { C [ n 2.37 ( 1 + T ) ] }
T is the number of samples, n is the number of initial features, and C is the number of classes.
Algorithm 4 Improved Infinite Feature Selection for Multiclass classification (IIFS-MC)
Mathematics 09 00751 i004
The proposed IIFS-MC analysis has been conducted similar to the guideline provided in [12], where the mechanisms have been analyzed through a variety of datasets. Unfortunately, the analysis [12] missed the standard intrusion detection datasets such as NSLKDD or CICIDS2017. Therefore, it has been decided to analyze the FS mechanisms through the most widely used NSLKDD, ISCXIDS2012, and CICIDS2017 datasets. In this regard, 5000 random samples of the NSLKDD dataset have been generated using the proposed Supervised Relative Random Sampling (SRRS) consisting of a mixture of normal and intrusion instances.
Furthermore, six popular supervised classifiers such as SVM, NB, Neural Network, Logistic Regression, C4.5, and Random Forest has been analyzed to judge the performance of the FS mechanisms discussed in this chapter along with the improved version of the infinite multiclass feature selection scheme. The classification accuracy of these supervised classifiers has been observed considering the varying size of features.
Table 7 reflects the performance of SVM on varying feature size. It can be seen that the accuracy of SVM improves with a change in feature size.
Using five features of NSLKDD, the SVM method shows the highest accuracy of 88.237% when the features are selected using IIFS-MC. Nevertheless, with the increase in feature size, the IFS magnificently improves the classifier’s accuracy, leading to an accuracy of 92.844%. However, IIFS-MC consistently shows significantly better accuracy for varying feature subsets among all other feature selection schemes.
A similar outcome has been observed for IIFS-MC when the classification has been conducted with NB. The adequate class information and class-wise feature weight calculation enable IIFS-MC to boost the accuracy of NB (Table 8).
For Neural Network classification (Table 9), IIFS-MC again performs better as compared to other FS schemes.
The IIFS-MC shows a distinct improvement over LSFS for almost all feature sizes. On the other hand, IIFS-MC shows distinctive accuracy only between 10–20 features. However, for all other feature sizes, both IFS and IIFS-MC produce a similar amount of accuracy. The logistic regression results FS schemes results are presented in Table 10. Though the IIFS-MC scheme shows better accuracy as compared to other peer schemes, at the same time, IFS shows equivalent classification accuracy along with IIFS-MC. Similarly, Logistic Regression suffers from the original five features through MIFS. However, the situation becomes comfortable with an increase in feature size. Slowly, MIFS shows Logistic Regression’s performance at par with other FS schemes with 30 features in hand. The accuracy output of Logistic Regression for all the feature selectors has been presented in Table 10.
Similarly, with all the ranked features in hand, the IFS, RelieF, and IIFS-MC show improved accuracy than that of the Fisher, MIFS, and LSFS schemes.
All the feature selection schemes show a close accuracy rate for Naïve Bayes and Function-based classifiers. However, the decision tree shows a distinct result and outperforms the other classifiers (Table 11).
According to Table 11, it is evident that IIFS-MC shows better accuracy for a little number of feature segments. However, with the increase in several features, the accuracy of C4.5 becomes close for all the feature selectors.
The Random Forest also reveals a similar accuracy rate for all the FS schemes except the Fisher score method. Random Forest’s accuracy improves with the Feature score, which was not visible earlier in the case of other decision trees (Table 12).
Furthermore, up to the 20th feature, there was a close accuracy observed between IFS and IIFS-MC approaches. After the 20th feature to 30th, Random Forest’s accuracy deviates to a better position due to IIFS-MC. However, all the feature selectors show equivalent results while attaining the 37th feature of the NSLKDD dataset.
While analyzing the accuracy of supervised classifiers with various feature selection schemes, the following broad inferences have been observed.
(i)
The improvised version of the IFS scheme ranks the features better to boost supervised classifiers’ accuracy to the maximum extent possible.
(ii)
Moreover, it is observed that from the 20th feature onwards, the supervised classifiers show a similar accuracy as it is achieved with the whole set of features. Therefore, 20 features of the NSLKDD dataset are viable to achieve a similar accuracy level to the original feature set.
In this way, it has been observed that 20 ranked features of the NSLKDD dataset provide optimum detection results for a variety of supervised classifiers. Therefore out of all the ranked features of NSLKDD, the top 20 features are considered as feature subsets. All the ranked features of the NSL-KDD dataset have been outlined in Table 13.
A similar kind of analysis on ISCXIDS2012 and CICIDS2017 datasets was also conducted, and the ranks of features for these two datasets are outlined in Table 14 and Table 15, respectively.
Similarly, observing the drifting of the accuracy of various classifiers similar to inference (ii), an attempt has been made to generate a feature subset of NSLKDD, ISCXIDS2012, and CICIDS2017 dataset, which will be taken into account to improve the performance of IDS detector in the subsequent stages of detection. The ideal feature subsets of IDS datasets are presented in Table 16, Table 17 and Table 18.
It should be noted that, before the features ranking and subset selection process, all the identification attributes, such as Source and destination IP address, protocol name, system name, etc. have been removed from the dataset. This is because the feature selection technique used here is designed to work on numerical features only. Once the required numbers of features are selected, the training and testing data have been extracted from the samples. To achieve an unbiased experiment, both train and test data have been selected from the samples randomly in such a way that, T r T s = 0 , where T r represents the training and T r represents the testing instances. In this case, 66% of the sample has been used for training, and 34% of the sample has been used for testing [56,57], the proposed detection model. The generated training and test samples that have been used to train and test the IDS detection engine are presented in Table 19.

3.5. IDS Detector

The J48Consolidated is a C4.5 supervised classifier, which is based on CTC [14,15,58] algorithm to counter the class imbalance problem. Instead of using several samples to build a classifier model, the CTC builds a single decision tree [15]. The CTC procedure used in J48Consolidated has been described in Algorithm 5.
Algorithm 5 CTC of J48Consolidated
Mathematics 09 00751 i005
The algorithm attracts the researchers for its inherent ability to be trained on class imbalance datasets. Initially, the CTC-based classifier was used in car insurance fraud detection [58]. From an architectural point of view, the technique of J48Consolidated is fundamentally different from boosting and bagging. Only one tree is built, and the agreement is achieved at each step of the tree building process. However, the different subsamples are used to select suitable features that ultimately split in the current node. Information gain ratio criterion, Gini Index, or χ2 (CHAID) are used as the split function during the tree building process. The splitting decision of the tree is achieved node by node voting process. The resampling methodology [15] undertaken by the CTC classifier helps to achieve the notion of coverage. The notion of coverage in a sense, considering the class-wise lowest number of sample instances from training data having a different class distribution, to identify the number of subsamples required. Therefore, the class distribution, type of subsample, and the coverage value chosen jointly determine the number of subsamples to be selected. The subsamples to be generated are directly proportional to the degree of class imbalance in the dataset. Subsequently, a consolidated tree has been built with the similar principle of a C4.5 decision tree.
The J48Consolidated is built upon the CTC algorithm described in Algorithm 5 and employs a C4.5 classification algorithm to classify test instances. It has been seen that the CTC algorithm resample the data to a balanced form and classifies the data using the C4.5 decision tree, hence making the detection mechanism remains stable in case of high-class imbalanced training data. This unique feature, J48Consolidated, is best suited as the base detector in the proposed IDS scenario.

4. Results and Discussion

In Section 3, the proposed SRRS algorithm has been used to generate class-wise true random samples from NSLKDD, ISCXIDS2012, and CICIDS2017 datasets. Furthermore, the IIFS-MC has been used with the samples to rank features and to generate feature subsets. In this section, to validate the proposed model, both the features subset and all the features (as per ranking given by IIFS-MC) have been considered separately for individual datasets. The outcome of the proposed system has been described in the following sections.

4.1. Performance of Proposed IDS on NSL-KDD Dataset

When the proposed IDS model is validated on the NSL-KDD dataset separately using the feature subset (20 features) and all the ranked features generated by IIFS-MC, the proposed IDS model reveals a decent detection output. For the best 20 features obtained out of the NSL-KDD dataset, the proposed CTC detector’s overall performance remains consistent as that of the performance of the same detector on all features. The performance of the proposed model combining CTC, IIFS, and SRRS is outlined in Table 20, and detection output has been depicted in Figure 2 and Figure 3. By observing the overall performance outcomes outlined in Table 20 of the proposed model, it can be realized that the IDS detection engine has an impressive accuracy and detection rate of 99.9562% with a low misclassification rate of 0.0438%. Out of the testing instances of 29,686, the proposed model cannot detect attack labels of 13 instances correctly, which is considered very low in the field of intrusion detection. The model also consumes a very lower amount of training and testing time of 11.8 and 0.25 s because of fewer features. Similarly, the model also reveals a very low FPR and FNR of 0.0004. Extending, the validation process on the NSL-KDD dataset, the entire features of the NSL-KDD sample arranged according to the rank given by IIFS-MC has been used for training and testing purposes. In this regard, it is observed to have a little better overall accuracy of the model. An accuracy of 99.9629% has been achieved but with the cost of a higher model build time of 19.41 s. It should be noted that the average testing time for each instance consumes 0.07 s due to the additional feature information. Again, the proposed model also achieves a significantly low misclassification rate of 0.0371%.
Comparing the performance of the proposed model, both for 20 and all features of IIFS, the detection accuracy of the detector was almost the same as approximately 99.96%. The false-positive rate and false-negative rate also remain the same for both cases. This shows the detector remains stable even in the presence of 20 features. On the other hand, the detector takes a convincing amount of testing time per instance when all the features ranked as per IIFS-MC are fueled for training.
Similarly, visualizing the detection output of the model on the NSL-KDD dataset separately for 20 prominent and all the ranked features the classification and misclassification output appears to be promising. In both cases, the detector swiftly detects the event of intrusions. However, in very few cases the model struggles to detect the intrusion, which is the main reason behind the FPR and FNR of 0.0004%. Out of all incoming attacks, the probe attacks are detected brilliantly by the model.

4.2. Performance of Proposed IDS on ISCXIDS2012 Dataset

With the similar guideline of the NSL-KDD dataset, the proposed IDS model has also been validated through the ISCXIDS2012 dataset separately using the feature subset (3 features) and features ranked according to their weights generated by IIFS-MC. The performance outcome for this dataset has been recorded in Table 21; whereas, the detection output has been depicted in Figure 4 (for best 3 features) and Figure 5 (for all the ranked features). It should be noted that, while considering the ISCXIDS2012 dataset, the proposed SRRS algorithm generates 87,906 instances randomly as training and testing instances. However, the ratio of training to testing instances has remained the same at 66% and 34%, respectively. Only three features provided by IIFS-MC have been selected to build the detection model. For 29,888 testing instances, a sum total of 162 misclassified instances has been generated; thus, producing a false positive rate and misclassification rate of 0.0054 and 0.5420%, respectively. At the same time, the mean absolute error (MAE) generated by the detector is 0.0083. Furthermore, the model’s training time lies at 6.06 s, and the testing time of the model is 0.06 s. Overall accuracy and detection rate of the system achieved consistently with 99.4580%. It should be noted that the proposed system can detect the underlying attacks with such an appealing detection rate that too considering only three features (Table 21 and Figure 4).
The rates of MA and RMS errors generated by the system are 0.0083 and 0.0719, respectively. On the other hand, the proposed model’s RA and RRS error rates are 1.6552 and 14.3441, respectively. While considering all the features, it is observed that the performance of the detection model improves significantly. The detection model generates only 19 false positives and 19 false negatives, with improved accuracy of 99.9364%. Similarly, the system also exhibits a low misclassification rate of 0.0636%. Even with additional features, the training time remains low at 5.08 s. The testing time per instance was recorded as 0.05 s (Figure 5). One unique observation found in the case of the ISCXIDS2012 dataset is that the model shows a distinguished detection result with a higher number of features. In other words, the model shows superior results on all the features but ranked as per IIFS-MC for the ISCXIDS2012 dataset. This proves that any feature subsets on the IIFS-MC feature selection are not admirable for binary detection scenario.
The visualization of the CTC IDS model shows similar output in line with Table 21. The detected and undetected attacks and normal instances are shown in Figure 4 and Figure 5. Figure 4 and Figure 5 show the detection output of detected and missed attacks. It can be seen that with all the ranked features of the binary attack environment, the detector identifies almost all the attacks leaving few false alarms.

4.3. Performance of the Proposed IDS on CICIDS2017 Dataset

In this section, the recent CICIDS2017 dataset has been taken into consideration for validating the proposed model. It is interesting to see the proposed model’s performance as this dataset is a high-class imbalance in nature compared to other datasets considered previously. A similar evaluation procedure that was followed for NSL-KDD and ISCXIDS2012 has also been followed for the CICIDS2017 dataset. This dataset’s features have been ranked, and 34 optimum features having no similarity with each other have been retrieved. When the proposed IDS model is validated on the CICIDS2017 dataset, separately using the feature subset (34 features) and feature ranking of all the features generated by IIFS-MC, the performance outcomes observed are listed in Table 22 and visualized in Figure 6 and Figure 7, respectively. By observing the proposed detector’s overall performance, it is realized that the IDS detection engine has an attractive accuracy and detection rate of 99.9552% with a low misclassification rate of 0.0004%. Out of the testing instances of 31,222, the proposed model cannot detect attack labels of 14 instances correctly, which again proves to be very low. The model also consumes a lower amount of testing time of 0.41 s 34 features. It is clearly observed that the model’s performance quickly boost even with a little number of features in the adverse class imbalance condition. The proposed model also generates an MAE with a rate of 0.003.
Graphically the detected and undetected instances of the CICIDS2017 testing sample can be seen in Figure 6. The figure shows that almost all attack instances are detected correctly, leaving only 14 instances, which leads to a little misclassification rate of 0.0448%.
Extending the validation process on samples of the CICIDS2017 dataset using all the features ordered as per their ranks, it is observed that the performance of the model is slightly decreased. The overall accuracy was found to be 99.9488%, with a misclassification rate of 0.0512%.

4.4. Analysis of the Proposed Model with Existing IDSs

The proposed IDS model shows a great extent in all three datasets. However, the model itself alone cannot claim a good IDS model unless until it is compared with existing detection models in the literature. Therefore, it has been decided to compare the proposed approach of intrusion detection with the existing intrusion detectors described in the literature review section. As the proposed IDS model has been validated across three datasets, it is, therefore, essential to compare and analyze the model with the present works based on those datasets. Furthermore, several researchers evaluated their models based on a variety of performance measures. Only those parameters are considered for comparison, which is mostly used by most existing IDS.
The output of the proposed model is compared with 12 existing IDS models for the NSL-KDD dataset. The performance measures used for comparison are detection rate, false-positive rate, and accuracy (Table 23).
Several inferences have been deduced while comparing the proposed model for samples of the NSL-KDD dataset. These are—
(i)
The proposed model leads the IDS models pool with the highest amount of accuracy and detection rate of 99.9629%.
(ii)
The proposed model proves to be best by revealing the lowest false alarm rate of 0.004%.
(iii)
DLANID+FAL model performs very poorly in the IDS pool with a low detection rate and accuracy of 85.42%, while the system generates false alarms with a rate of 14.58%.
(iv)
The reason behind the poor performance of DLANID+FAL is that the model is based on 13 attack labels where the class imbalance ratio is very poor.
At the second stage of the analysis, the proposed IDS is compared with 11 existing state-of-the-art intrusion detection models. The models that have been taken for comparison are recent and well-validated through ISCXIDS2012. The performance outcome of these models, along with the proposed IDS, are tabulated in Table 24.
The inferences observed through the comparison are as follows.
(i)
The proposed model was placed equivalently at the top and the BN-IDS model with equal accuracy of 99.93%. However, the proposed model with all the features leads to detectors’ pool in terms of detection rate. The proposed model achieves the highest detection rate of 99.9%.
(ii)
The intrusion detector lies far ahead of its peers, with the lowest false-positive rate of 0.001.
(iii)
RFA-IDS+BIGRAM suffers due to its low detection rate of 89.6%. Similarly, the AMNN+PCA, AISIDS-ULA, and RFA-IDS+BIGRAM models reveal a low rate of false positives during the analysis.
(iv)
The PBMLT+XGB model is the runner up by consistently winning in two performance measures, i.e., accuracy and detection rate.
(v)
The proposed model is based on the considerably lowest number of features with an impressive detection rate and accuracy rate.
Finally, in the CICIDS2017 dataset, an attempt has been made to compare the proposed IDS with three existing cutting-edge intrusion detection models. These models are based on the CICIDS2017 dataset; hence, they are good candidate models to compare with the proposed IDS. As the CICIDS2017 dataset is very recent, the detection models that have been taken for comparison are also developed recently. These are the only three intrusion detection systems available and published recently while writing this thesis. The performance outcome of those models is silent about the detection rate. Therefore, the False Negative Rate (FNR) is considered in the detection rate for comparing the proposed detector. The performance outcome of these detection models and the proposed IDS are tabulated in Table 25.
In this case, the proposed work also performed well ahead of GA + SVM, MI + SVM, and SVM intrusion detection models. The proposed detection model successfully achieves the highest accuracy and the lowest equal amount of false-positive and false-negative rates. By just considering 34 features, the proposed model detects the underlying threats more efficiently than using all the features.
We compared our approach of IDS with many other supervised and unsupervised approaches including decision trees and Bayes oriented approaches. It has been found that the proposed approach shows a significantly better detection result. For an instance, the proposed approach shows 0.5% better detection accuracy as compared to Logitboost+RF [59] based decision tree approach on the NSL-KDD dataset, 0.93% and 0.7% more than the DT + SNORT [18] and AMNN + CART [22] decision tree approaches respectively on ISCXIDS2012 datasets. It has been observed earlier that the class-imbalance issue lies with both NSLKDD and ISCXIDS2012 datasets, which is the main reason for the Logitboost + RF [59] decision tree approach slightly lacks while detecting attacks. On the other hand, the class-imbalance issue has been addressed in a dual stage within our approach. At first, the class-imbalance issue has been addressed through the SRRS down sampling scheme, where an attempt has been made to arrange attack-wise random samples. Secondly, the J48Consolidated scheme generates synthetic samples for attacks keeping in view the majority attack instances. In this way, the proposed IDS gets balanced samples for training the model, which overall improves the detection result. Another aspect is that the Logitboost+RF [59] approach took all the features of NSL-KDD datasets as compared to 20 features of our proposed approach. This makes our proposed approach to be a better choice when it comes to handle Intrusions. Not only that, the proposed IDS also outperformed other state-of-the-art approaches presented in this decades. Therefore, it is proved that, in both multi attacks and binary attack scenarios, the proposed approach shows reasonably better detection results as compared to other intrusion detection approaches.

4.5. Analysis of the Proposed Model across Datasets

The proposed IDS model’s performance considering feature subset and feature ranking suggested by IIFS-MC on three high-class imbalance datasets performs consistently well for all three datasets. Furthermore, a comparison of the proposed IDS with existing models has also been conducted. In that comparison also, the proposed IDS performs consistently well over other existing models. In this section, the proposed IDS to come across the best setting specific to each dataset is analyzed. More emphasis is given to errors generated by the detector along with both training and testing time. Figure 8 shows the error of the proposed model for three datasets. It is observed that the model generates a very low amount of errors on the CICIDS2017 dataset. It is advisable to use 34 features to detect all the attacks most precisely as this setting reveals the very least amount of errors.
Figure 9 shows training time and testing time per instance of the proposed model across all the datasets. The following inferences are observed both for training and testing times:
(i)
The model works best with the ISCXIDS2012 dataset. With the ISCXIDS2012 dataset, the system quickly trained and detected the attacks.
(ii)
The system will be fast if deployed considering all the features of the ISCXIDS2012 dataset both for training and detecting.
(iii)
The system is fast for a binary attack scenario.
Finally, the proposed system has been tested through overall accuracy and false-positive rate. The outcome has been depicted in Figure 10. The following inferences have been outlined:
(i)
NSL-KDD is the ideal dataset for building the intrusion detection model as it exhibits the highest amount of accuracy significantly.
(ii)
If the NSL-KDD dataset is used, the system should be trained considering all the features.
(iii)
On the other hand, if the CICIDS2017 dataset is used, the system should be trained, considering 34 features generated by IIFS-MC. It is because the proposed system shows the highest ever accuracy under this feature set.
(iv)
It is observed that the proposed model works brilliantly with multiclass datasets (NSL-KDD, CICIDS2017).

4.6. Analysis of the Proposed Model Specific to Attacks in Datasets

The proposed model is suitable for NSL-KDD multiclass dataset. In this subsection, the comparison process to come across a conclusion specific to attacks is presented. The proposed IDS performance outcomes for various attacks have been analyzed to identify the specific attacks for which the system works considerably. Therefore, future researchers can design that attack specific detection engines. It should be noted that both NSL-KDD and CICIDS2017 are multiclass datasets, which contain varieties of attacks. Therefore, it is relevant to consider these two datasets to undertake an attack-specific comparison. Therefore, being a binary dataset, ISCXIDS2012 has been ignored in this analysis. The ROC curves of the proposed models’ attacks are shown in Table 26 and Table 27.
Considering the 20 features NSL-KDD dataset, it is observed that the proposed model works well for R2L attacks with 100% accuracy, detection rate, and precision. The Probe attacks are also detected considerably well with an accuracy and detection rate of 99.9899% and 100%, respectively. The traditional performance measures such as accuracy, detection rate, and precisions are not enough to understand a detection model’s real performance built upon a high-class imbalanced dataset. Therefore, the ROC curves of the NSL-KDD dataset’s attacks have been analyzed to observe the performance of the proposed IDS. The AUC value of the ROC curve of R2L attacks proves that the R2L attacks were detected well by considering 20 features of the NSL-KDD dataset.
Similarly, when all the features are used to build the detection model, it is observed that the U2R attacks are nicely detected with 100% accuracy, detection rate, and precision. The ROC curve of U2R attacks also supports the claim. The AUC value of U2R lies at 1, indicating the IDS detector is a perfect detector for U2R attacks.
In the CICIDS2017 dataset, when the proposed model is built upon 34 features, the model correctly detects attacks such as BruteForce, Infiltration, BotnetARES, and WebAttack. The model on 34 features also detects other attacks such a DoS/DDoS and PortScan brilliantly with 99%+ accuracy. In a nutshell, if the target is to detect BruteForce, Infiltration, BotnetARES, and WebAttack attacks, the proposed IDS model is ideally suited and hence can be trained on 34 features.
The proposed model using 34 features of the CICIDS2017 dataset presents an AUC of BruteForce, Infiltration, BotnetARES, and WebAttack also justifies the inference about the model for these attacks. In this case, the model is not that much convincing as that of 34 features of the CICIDS2017 dataset, considering all the features of the CICIDS2017. It is because BruteForce and WebAttacks are detected with lesser accuracy through all the features. Overall, though the model seems to be efficient for the CICIDS2017 dataset considering all the dataset features, it is advisable to consider only 34 stated features to achieve better accuracy for a maximum number of attacks.
The detection of new cyberattacks and the discovery of system intrusions can be automated to predict future intrusion patterns based on machine learning methods that can be tested in available historical datasets [61]. Future cyber-security research must focus on the development of novel automated methods of cyber-attack detection. Furthermore, machine learning methods must be used to automatically classify malicious trends and predict future cyber-attacks for enhanced cyber defense systems. These systems can support police officers’ decision-making and enable prompt response to cyber-attacks, and, consequently, provide an enhanced response to cyber-crimes.

5. Conclusions

This paper validates the proposed IDS through NSL-KDD, ISCXIDS2012, and CICIDS2017 datasets. A C4.5 based algorithm with the facility of CTC has been deployed to detect attacks quickly and efficiently. The model has been validated separately, considering the feature subset and all the features ordered as per the rank generated by IIFS-MC. The highest accuracy of 99.96% has been achieved for the NSL-KDD dataset for all the features and 99.95% for the CICIDS2017 dataset only for 34 features. The proposed model is best suitable for a binary class dataset. However, a multiclass environment also shows promising results in terms of detection and classification accuracy. The research works carried out here also tried to provide insight to choose the best dataset for the model. The NSL-KDD dataset has been identified as the best dataset for the proposed model.
Detailed performance analysis of the proposed IDS for each attack reveals that an attack-specific IDS provides a better detection rate and classification accuracy as compared to the IDS for all attack instances. The proposed model was also compared and validated through the new state-of-the-art intrusion detection systems separately for separate datasets. In the event of comparison, the proposed IDS stands firm with the highest ever detection rate and accuracy.
The proposed method has limitations, which can be addressed to improve the detection process further. A feedback approach in the proposed IDS is missing, which can be incorporated to strengthen the system towards more dynamism. The feedback approach helps the administrative host to isolate the malicious host out of the main network. Moreover, the proposed system is a standalone signature-based system, which can be incorporated along with an anomaly detection engine to improve the detection rate. Furthermore, the attack correlation strategies can be implemented to understand the severity of attacks, which helps the security managers to take preventive steps. It should be noted that the proposed system has been trained and tested on the samples of the two multiclass IDS datasets, where the sample contains a mixture of standard and various attack instances. However, it is observed that the SRRS sampling algorithm generates a perfect balanced sample for the binary ISCXIDS2012 dataset. Therefore, instead of generating a mixture of a sample of all types of attacks and benign instances, the sample can be realized on a mixture of benign and specific attack instances; thus, generating a binary attack sample set for each attack class. A corresponding IDS engine can be built for each sample set of benign and specific attack classes. The incoming testing instances must be passed through all these engines to be detected by at least one detector somewhere in the detection process, thus expected to reduce the detection time to a certain level.

Author Contributions

Conceptualization, R.P., S.B., and M.F.I.; data curation, R.P. and M.F.I.; formal analysis, A.K.B., M.P., Y.K., and R.H.J.; funding acquisition, R.H.J. and M.F.I.; investigation; R.P., S.B., M.F.I., and A.K.B.; methodology, R.P., S.B., Y.K., M.F.I., and M.P.; project administration, S.B., R.H.J., and A.K.B.; resources, S.B., A.K.B., Y.K., and M.P.; software, R.P., Y.K., M.F.I., and M.P.; supervision, S.B., A.K.B., and R.H.J.; validation, R.P., M.F.I., Y.K., and M.P.; visualization, R.P., S.B., M.F.I., R.H.J. and A.K.B.; writing—review and editing, R.P., M.F.I., S.B., Y.K., M.P., R.H.J., and A.K.B. All authors have read and agreed to the published version of the manuscript.

Funding

This research was supported by the Sejong University research fund.

Institutional Review Board Statement

Not applicable.

Informed Consent Statement

Not applicable.

Data Availability Statement

Publicly available datasets were analyzed in this study. This data can be found here: NSL-KDD—https://www.unb.ca/cic/datasets/nsl.html (Accessed on: 11 March 2019), ISCXIDS2012—https://www.unb.ca/cic/datasets/ids.html (Accessed on: 22 April 2019), CICIDS2017—https://www.unb.ca/cic/datasets/ids-2017.html (Accessed on: 27 November 2019).

Conflicts of Interest

The authors declare no conflict of interest.

References

  1. Khraisat, A.; Gondal, I.; Vamplew, P.; Kamruzzaman, J. Survey of intrusion detection systems: Techniques, datasets and challenges. Cybersecurity 2019, 2, 20. [Google Scholar] [CrossRef]
  2. Khan, I.A.; Pi, D.; Khan, Z.U.; Hussain, Y.; Nawaz, A. HML-IDS: A Hybrid-Multilevel Anomaly Prediction Approach for Intrusion Detection in SCADA Systems. IEEE Access 2019, 7, 89507–89521. [Google Scholar] [CrossRef]
  3. Hong, J.; Liu, C.-C. Intelligent electronic devices with collaborative intrusion detection systems. IEEE Trans. Smart Grid 2017, 10, 271–281. [Google Scholar] [CrossRef]
  4. Li, W.; Tug, S.; Meng, W.; Wang, Y. Designing collaborative blockchained signature-based intrusion detection in IoT environments. Future Gener. Comput. Syst. 2019, 96, 481–489. [Google Scholar] [CrossRef]
  5. Meng, Y.; Kwok, L.-F. Enhancing false alarm reduction using voted ensemble selection in intrusion detection. Int. J. Comput. Intell. Syst. 2013, 6, 626–638. [Google Scholar] [CrossRef] [Green Version]
  6. Almutairi, A.H.; Abdelmajeed, N.T. Innovative signature based intrusion detection system: Parallel processing and minimized database. In Proceedings of the 2017 International Conference on the Frontiers and Advances in Data Science (FADS), Xi’an, China, 23–25 October 2017; pp. 114–119. [Google Scholar]
  7. Hussein, S.M. Performance Evaluation of Intrusion Detection System Using Anomaly and Signature Based Algorithms to Reduction False Alarm Rate and Detect Unknown Attacks. In Proceedings of the 2016 International Conference on Computational Science and Computational Intelligence (CSCI), Las Vegas, NV, USA, 15–17 December 2016; pp. 1064–1069. [Google Scholar]
  8. Day, D.J.; Flores, D.A.; Lallie, H.S. CONDOR: A hybrid ids to offer improved intrusion detection. In Proceedings of the 2012 IEEE 11th International Conference on Trust, Security and Privacy in Computing and Communications, Liverpool, UK, 25–27 June 2012; pp. 931–936. [Google Scholar]
  9. Sato, M.; Yamaki, H.; Takakura, H. Unknown attacks detection using feature extraction from anomaly-based ids alerts. In Proceedings of the 2012 IEEE/IPSJ 12th International Symposium on Applications and the Internet, Izmir, Turkey, 16–20 July 2012; pp. 273–277. [Google Scholar]
  10. Saied, A.; Overill, R.E.; Radzik, T. Detection of known and unknown DDoS attacks using Artificial Neural Networks. Neurocomputing 2016, 172, 385–393. [Google Scholar] [CrossRef]
  11. Rodda, S.; Erothi, U.S.R. Class imbalance problem in the network intrusion detection systems. In Proceedings of the 2016 International Conference on Electrical, Electronics, and Optimization Techniques (ICEEOT), Chennai, India, 3–5 March 2016; pp. 2685–2688. [Google Scholar]
  12. Roffo, G.; Melzi, S.; Cristani, M. Infinite Feature Selection. In Proceedings of the 2015 IEEE International Conference on Computer Vision (ICCV), Santiago, Chile, 7–13 December 2015; pp. 4202–4210. [Google Scholar] [CrossRef]
  13. Roffo, G.; Melzi, S.; Castellani, U.; Vinciarelli, A. Infinite Latent Feature Selection: A Probabilistic Latent Graph-Based Ranking Approach. In Proceedings of the IEEE International Conference on Computer Vision, Venice, Italy, 22–29 October 2017; pp. 1407–1415. [Google Scholar] [CrossRef] [Green Version]
  14. Pérez, J.M.; Muguerza, J.; Arbelaitz, O.; Gurrutxaga, I.; Martín, J.I. Combining multiple class distribution modified subsamples in a single tree. Pattern Recognit. Lett. 2007, 28, 414–422. [Google Scholar] [CrossRef]
  15. Ibarguren, I.; Pérez, J.M.; Muguerza, J.; Gurrutxaga, I.; Arbelaitz, O. Coverage-based resampling: Building robust consolidated decision trees. Knowl. Based Syst. 2015, 79, 51–67. [Google Scholar] [CrossRef]
  16. Kumar, G.; Kumar, K. Design of an evolutionary approach for intrusion detection. Sci. World J. 2013, 2013, 962185. [Google Scholar] [CrossRef] [Green Version]
  17. Hosseinpour, F.; Amoli, P.V.; Farahnakian, F.; Plosila, J.; Hämäläinen, T. Artificial immune system based intrusion detection: Innate immunity using an unsupervised learning approach. Int. J. Digit. Content Technol. Appl. 2014, 8, 1. [Google Scholar]
  18. Ammar, A. A decision tree classifier for intrusion detection priority tagging. J. Comput. Commun. 2015, 3, 52. [Google Scholar] [CrossRef] [Green Version]
  19. Akyol, A.; Hacibeyoglu, M.; Karlik, B. Design of multilevel hybrid classifier with variant feature sets for intrusion detection system. IEICE Trans. Inf. Syst. 2016, E99D, 1810–1821. [Google Scholar] [CrossRef] [Green Version]
  20. Siddique, K.; Akhtar, Z.; Lee, H.; Kim, W.; Kim, Y. Toward bulk synchronous parallel-based machine learning techniques for anomaly detection in high-speed big data networks. Symmetry 2017, 9, 197. [Google Scholar] [CrossRef] [Green Version]
  21. Vargas-Munoz, M.J.; Martinez-Pelaez, R.; Velarde-Alvarado, P.; Moreno-Garcia, E.; Torres-Roman, D.L.; Ceballos-Mejia, J.J. Classification of network anomalies in flow level network traffic using Bayesian networks. In Proceedings of the 2018 28th International Conference on Electronics, Communications and Computers, CONIELECOMP 2018, Cholula, Mexico, 21–23 February 2018; pp. 238–243. [Google Scholar] [CrossRef]
  22. Alauthaman, M.; Aslam, N.; Zhang, L.; Alasem, R.; Hossain, M.A. A P2P Botnet detection scheme based on decision tree and adaptive multilayer neural networks. Neural Comput. Appl. 2018, 29, 991–1004. [Google Scholar] [CrossRef] [PubMed] [Green Version]
  23. Hamed, T.; Dara, R.; Kremer, S.C. Network intrusion detection system based on recursive feature addition and bigram technique. Comput. Secur. 2018, 73, 137–155. [Google Scholar] [CrossRef]
  24. de la Hoz, E.; Ortiz, A.; Ortega, J.; de la Hoz, E. Network anomaly classification by support vector classifiers ensemble and non-linear projection techniques. In Proceedings of the International Conference on Hybrid Artificial Intelligence Systems, Salamanca, Spain, 11–13 September 2013; pp. 103–111. [Google Scholar]
  25. Vijayanand, R.; Devaraj, D.; Kannapiran, B. Intrusion detection system for wireless mesh network using multiple support vector machine classifiers with genetic-algorithm-based feature selection. Comput. Secur. 2018, 77, 304–314. [Google Scholar] [CrossRef]
  26. Bamakan, S.M.H.; Wang, H.; Yingjie, T.; Shi, Y. An effective intrusion detection framework based on MCLP/SVM optimized by time-varying chaos particle swarm optimization. Neurocomputing 2016, 199, 90–102. [Google Scholar] [CrossRef]
  27. Bamakan, S.M.H.; Wang, H.; Shi, Y. Ramp loss K-Support Vector Classification-Regression; a robust and sparse multi-class approach to the intrusion detection problem. Knowl. Based Syst. 2017, 126, 113–126. [Google Scholar] [CrossRef]
  28. Ambusaidi, M.A.; He, X.; Nanda, P.; Tan, Z. Building an intrusion detection system using a filter-based feature selection algorithm. IEEE Trans. Comput. 2016, 65, 2986–2998. [Google Scholar] [CrossRef] [Green Version]
  29. Abd-Eldayem, M.M. A proposed HTTP service based IDS. Egypt. Inform. J. 2014, 15, 13–24. [Google Scholar] [CrossRef] [Green Version]
  30. De la Hoz, E.; De La Hoz, E.; Ortiz, A.; Ortega, J.; Martínez-Álvarez, A. Feature selection by multi-objective optimisation: Application to network anomaly detection by hierarchical self-organising maps. Knowl. Based Syst. 2014, 71, 322–338. [Google Scholar] [CrossRef]
  31. Bostani, H.; Sheikhan, M. Modification of supervised OPF-based intrusion detection systems using unsupervised learning and social network concept. Pattern Recognit. 2017, 62, 56–72. [Google Scholar] [CrossRef]
  32. Shone, N.; Ngoc, T.N.; Phai, V.D.; Shi, Q. A deep learning approach to network intrusion detection. IEEE Trans. Emerg. Top. Comput. Intell. 2018, 2, 41–50. [Google Scholar] [CrossRef] [Green Version]
  33. Panigrahi, R.; Borah, S. Design and Development of a Host Based Intrusion Detection System with Classification of Alerts; Sikkim Manipal University: Manipal, India, 2020. [Google Scholar]
  34. Tavallaee, M.; Bagheri, E.; Lu, W.; Ghorbani, A.A. A detailed analysis of the KDD CUP 99 data set. In Proceedings of the 2009 IEEE Symposium on Computational Intelligence for Security and Defense Applications, Ottawa, ON, Canada, 8–10 June 2009; pp. 1–6. [Google Scholar]
  35. Shiravi, A.; Shiravi, H.; Tavallaee, M.; Ghorbani, A.A. Toward developing a systematic approach to generate benchmark datasets for intrusion detection. Comput. Secur. 2012, 31, 357–374. [Google Scholar] [CrossRef]
  36. Sharafaldin, I.; Lashkari, A.H.; Ghorbani, A.A. Toward Generating a New Intrusion Detection Dataset and Intrusion Traffic Characterization. In Proceedings of the 4th International Conference on Information Systems Security and Privacy, Funchal, Portugal, 22–24 January 2018; pp. 108–116. [Google Scholar]
  37. Gharib, A.; Sharafaldin, I.; Lashkari, A.H.; Ghorbani, A.A. An Evaluation Framework for Intrusion Detection Dataset. In Proceedings of the 2016 International Conference on Information Science and Security (ICISS), Pattaya, Thailand, 19–22 December 2016. [Google Scholar] [CrossRef]
  38. Miao, Z.; Zhao, L.; Yuan, W.; Liu, R. Multi-class imbalanced learning implemented in network intrusion detection. In Proceedings of the 2011 International Conference on Computer Science and Service System, CSSS 2011, Nanjing, China, 27–29 June 2011; pp. 1395–1398. [Google Scholar] [CrossRef]
  39. Jing, X.Y.; Wu, F.; Dong, X.; Xu, B. An Improved SDA Based Defect Prediction Framework for Both Within-Project and Cross-Project Class-Imbalance Problems. IEEE Trans. Softw. Eng. 2017, 43, 321–339. [Google Scholar] [CrossRef]
  40. Wang, S.; Yao, X. Multiclass imbalance problems: Analysis and potential solutions. IEEE Trans. Syst. Man Cybern. Part B Cybern. 2012, 42, 1119–1130. [Google Scholar] [CrossRef] [PubMed]
  41. Thomas, C.; Sharma, V.; Balakrishnan, N. Usefulness of DARPA dataset for intrusion detection system evaluation. In Proceedings of the Data Mining, Intrusion Detection, Information Assurance, and Data Networks Security 2008, Orlando, FL, USA, 17–18 March 2008; Volume 6973, p. 69730G. [Google Scholar] [CrossRef] [Green Version]
  42. Botes, F.; Leenen, L.; de la Harpe, R. Ant colony induced decision trees for intrusion detection. In Proceedings of the 16th European Conference on Cyber Warfare and Security, Dublin, Ireland, 29–30 June 2017; pp. 53–62. [Google Scholar]
  43. Taherdoost, H. Sampling methods in research methodology. How to Choose a Sampling Technique for Research. Int. J. Acad. Res. Manag. 2016, 5, 18–27. [Google Scholar] [CrossRef]
  44. Guyon, I.; Gunn, S.; Nikravesh, M.; Zadeh, L.A. Feature Extraction: Foundations and Applications; Springer: Berlin/Heidelberg, Germany, 2008; Volume 207. [Google Scholar]
  45. Duch, W.; Wieczorek, T.; Biesiada, J.; Blachnik, M. Comparison of feature ranking methods based on information entropy. In Proceedings of the IEEE International Conference on Neural Networks, Budapest, Hungary, 25–29 July 2004; 2004; Volume 2, pp. 1415–1419. [Google Scholar] [CrossRef]
  46. Guyon, I.; Weston, J.; Barnhill, S.; Vapnik, V. Gene selection for cancer classification using support vector machines. Mach. Learn. 2002, 46, 389–422. [Google Scholar] [CrossRef]
  47. Bradley, P.S.; Mangasarian, O.L. Feature selection via concave minimization and support vector machines. In Proceedings of the Proceedings of the Fifteenth International Conference on Machine Learning, Madison, WI, USA, 24–27 July 1998; pp. 82–90. [Google Scholar]
  48. Grinblat, G.L.; Izetta, J.; Granitto, P.M. SVM based feature selection: Why are we using the dual? In Proceedings of the Ibero-American Conference on Artificial Intelligence, Bahía Blanca, Argentina, 1–5 November 2010; pp. 413–422. [Google Scholar]
  49. Zaffalon, M.; Hutter, M. Robust feature selection using distributions of mutual information. In Proceedings of the 18th International Conference on Uncertainty in Artificial Intelligence (UAI-2002), Edmonton, AB, Canada, 1–4 August 2002; pp. 577–584. [Google Scholar]
  50. Liu, H.; Motoda, H. Computational Methods of Feature Selection; CRC Press: Boca Raton, FL, USA, 2007. [Google Scholar]
  51. Yu, L.; Han, Y.; Berens, M.E. Stable gene selection from microarray data via sample weighting. IEEE/ACM Trans. Comput. Biol. Bioinform. 2011, 9, 262–272. [Google Scholar] [PubMed]
  52. Gu, Q.; Li, Z.; Han, J. Generalized fisher score for feature selection. arXiv 2012, arXiv:1202.3725. [Google Scholar]
  53. Kira, K.; Rendell, L.A. A practical approach to feature selection. In Machine Learning Proceedings 1992; Elsevier: Amsterdam, The Netherlands, 1992; pp. 249–256. [Google Scholar]
  54. Liu, H.; Liu, L.; Zhang, H. Feature selection using mutual information: An experimental study. In Proceedings of the Pacific Rim International Conference on Artificial Intelligence, Hanoi, Vietnam, 15–19 December 2008; pp. 235–246. [Google Scholar]
  55. He, X.; Cai, D.; Niyogi, P. Laplacian score for feature selection. Adv. Neural Inf. Process. Syst. 2005, 18, 507–514. [Google Scholar]
  56. Arbelaitz, O.; Gurrutxaga, I.; Muguerza, J. J48Consolidated: An Implementation of CTC Algorithm for WEKA; University of the Basque Country: Donostia, Spain, 2013. [Google Scholar]
  57. Eibe, F.; Hall, M.; Witten, I. The WEKA Workbench. Online Appendix for ‘Data Mining: Practical Machine Learning Tools and Techniques’; Morgan Kaufmann: San Francisco, CA, USA, 2016. [Google Scholar]
  58. Pérez, J.M.; Muguerza, J.; Arbelaitz, O.; Gurrutxaga, I.; Martín, J.I. Consolidated tree classifier learning in a car insurance fraud detection domain with class imbalance. In Proceedings of the International Conference on Pattern Recognition and Image Analysis, Bath, UK, 22–25 August 2005; pp. 381–389. [Google Scholar]
  59. Kamarudin, M.H.; Maple, C.; Watson, T.; Safa, N.S. A logitboost-based algorithm for detecting known and unknown web attacks. IEEE Access 2017, 5, 26190–26200. [Google Scholar] [CrossRef]
  60. Li, L.; Yu, Y.; Bai, S.; Hou, Y.; Chen, X. An Effective Two-Step Intrusion Detection Approach Based on Binary Classification and k-NN. IEEE Access 2017, 6, 12060–12073. [Google Scholar] [CrossRef]
  61. Shalaginov, A.; Kotsiuba, I.; Iqbal, A. Cybercrime Investigations in the Era of Smart Applications: Way Forward Through Big Data. In Proceedings of the 2019 IEEE International Conference on Big Data, Los Angeles, CA, USA, 9–12 December 2019; pp. 4309–4314. [Google Scholar] [CrossRef]
Figure 1. Block diagram of the proposed framework.
Mathematics 09 00751 g001
Figure 2. Classification and misclassification instances of CTC model + IIFS-MC feature subset (20 features) using NSL-KDD dataset.
Mathematics 09 00751 g002
Figure 3. Classification and misclassification instances of the proposed CTC model + IIFS-MC feature ranking (All features) using the NSL-KDD dataset.
Mathematics 09 00751 g003
Figure 4. Classification and misclassification instances of the proposed CTC model + IIFS-MC feature subset (3 features) using the ISCXIDS2012 dataset.
Mathematics 09 00751 g004
Figure 5. Classification and misclassification instances of the proposed CTC model + IIFS-MC feature ranking (All features) using the ISCXIDS2012 dataset.
Mathematics 09 00751 g005
Figure 6. Classification and misclassification instances of the proposed CTC model + IIFS-MC feature ranking (34 features) using the CICIDS2017 dataset.
Mathematics 09 00751 g006
Figure 7. Classification and misclassification instances of the proposed CTC model + IIFS-MC feature ranking (All features) using the CICIDS2017 dataset.
Mathematics 09 00751 g007
Figure 8. Errors generated by the proposed model across various datasets.
Mathematics 09 00751 g008
Figure 9. Training and testing times of the proposed model across various datasets.
Mathematics 09 00751 g009
Figure 10. Accuracy of the proposed model across various datasets.
Mathematics 09 00751 g010
Table 1. Characteristics of new attack labels in NSLKDD dataset with their prevalence rate.
Sl
No
Normal/Attack LabelsNumber of Instances% of Prevalence with Respect to the Majority Class% of Prevalence with
Respect to the Total Instances
1DoS54,27570.4436.54
2Normal77,054100.0051.88
3Probe14,07718.279.48
4R2L28593.711.93
5U2R2520.330.17
Table 2. Characteristics of new attack labels in CICIDS2017 dataset with their prevalence rate.
Sl NoNew LabelsOld LabelsNumber of Instances% of Prevalence with Respect to the Majority Class% of Prevalence with Respect to the Total Instances
1NormalBenign2,359,08710083.34
2Botnet ARESBot19660.0830.06
3Brute ForceFTP-Patator, SSH-Patator13,8350.590.48
4Dos/DDosDDoS, DoS GoldenEye, DoS Hulk, DoS Slowhttptest, DoS slowloris, Heartbleed294,50612.4910.4
5InfiltrationInfiltration360.0010.001
6PortScanPortScan158,9306.745.61
7Web AttackWeb Attack—Brute Force, Web Attack—Sql Injection, Web Attack—XSS21800.0920.07
Table 3. Performance outcome of Supervised Relative Random Sampling (SRRS) on NSLKDD dataset for varying sample threshold.
Dataset
(Total Number of Instances)
NSLKDD (148517)
Sample Threshold20,00060,000100,000
Sample Size Generated19,08056,03287,312
Margin of Error (MOE)0.0070.0030.002
Attack LabelsSample
Size
Prevalence (%)Sample
Size
Prevalence (%)Sample
Size
Prevalence (%)
DoS580429.0220,85534.7634,44034.44
Normal581729.0921,33235.5537,07637.08
Probe502925.1510,88218.1412,74212.74
R2L218710.9427134.5228032.80
U2R2431.222500.422510.25
Table 4. Performance outcome of SRRS on ISCXIDS2012 dataset for varying sample threshold.
Dataset
(Total Number of Instances)
ISCXIDS2012 (1500722)
Sample Threshold20,00060,000100,000
Sample Size Generated10,98843,95287,906
Margin of Error (MOE)0.0100.0050.003
Attack LabelsSample SizePrevalence (%)Sample SizePrevalence (%)Sample SizePrevalence (%)
Attack549427.4721,97636.6343,95343.95
Normal549427.4721,97636.6343,95343.95
Table 5. Performance outcome of SRRS on CICIDS2017 dataset for varying sample threshold.
Dataset(Total Number of Instances)CICIDS2017 (2830540)
Sample Threshold20,00060,000100,000
Sample Size Generated16,26452,31791,830
Margin of Error (MOE)0.0080.0040.003
Attack LabelsSample
Size
Prevalence (%)Sample
Size
Prevalence (%)Sample
Size
Prevalence (%)
Botnet ARES13596.8017852.9818731.87
Brute Force305515.28787013.1210,20110.20
Dos/DDos345917.3013,59522.6626,06626.07
Infiltration220.11270.05290.03
Normal346017.3013,61822.7026,18526.19
PortScan345317.2713,46222.4425,40925.41
Web Attack14567.2819603.2720672.07
Table 6. Improvement of class prevalence in samples due to SRRS.
Sampling Thresholds (→)20,00060,000100,000
Normal/Attack LabelsPrevalence % in Original DatasetPrevalence (%)Improvement (%)Prevalence (%)Improvement (%)Prevalence (%)Improvement (%)
NSLKDD
DoS36.5429.02−7.5234.76−1.7834.44−2.10
Normal51.8829.09−22.8035.55−16.3337.08−14.80
Probe9.4825.1515.6718.148.6612.743.26
R2L1.9310.949.014.522.592.800.87
U2R0.171.221.050.420.250.250.08
ISCXIDS2012
Attack3.0227.4724.4536.6333.6143.9540.93
Normal96.9827.47−69.5136.63−60.3543.95−53.03
CICIDS2017
Botnet ARES0.066.806.742.982.921.871.81
Brute Force0.4815.2814.8013.1212.6410.209.72
Dos/DDos10.417.306.9022.6612.2626.0715.67
Infiltration0.0010.110.110.050.040.030.03
Normal83.3417.30−66.0422.70−60.6426.19−57.16
PortScan5.6117.2711.6622.4416.8325.4119.80
Web Attack0.077.287.213.273.202.072.00
Table 7. Classification accuracy of Support Vector Machine (SVM) on various feature selection mechanisms.
FS Mechanisms (↓)
Feature Size (→)
5101520253037
ReliefF85.88586.28186.38890.40391.26792.58992.655
Fisher83.99984.91086.24990.35191.22592.35192.415
MIFS51.77155.53982.88385.17289.27290.50492.051
LSFS84.45785.71285.33290.10891.29492.17892.698
IFS86.21686.80686.44292.43992.01292.81992.844
IIFS-MC88.23788.91488.94192.44392.14492.82192.875
Table 8. Classification accuracy of Naïve Bayes (NB) on various feature selection mechanisms.
FS Mechanisms (↓)
Feature Size (→)
5101520253037
ReliefF83.81785.29885.56486.44287.00787.25486.585
Fisher83.74484.76485.48986.05686.92786.89886.833
MIFS51.54151.55353.44078.18786.70286.87386.370
LSFS84.41285.27985.63386.28986.97786.97786.865
IFS85.38385.08185.88586.45387.00787.43886.875
IIFS-MC85.59085.32185.88786.71587.41987.83886.875
Table 9. Classification accuracy of Neural Network on various feature selection mechanisms.
FS Mechanisms (↓)
Feature Size (→)
5101520253037
ReliefF87.16588.52994.65196.25797.09997.46597.686
Fisher85.97788.48994.33695.99297.04997.41897.606
MIFS48.23971.59288.90391.33995.00096.70897.557
LSFS82.33584.40688.89989.99194.66596.11097.557
IFS87.85689.90095.12696.89197.31797.47397.864
IIFS-MC87.85789.92296.14497.11997.59097.47997.864
Table 10. Classification accuracy of Logistic Regression on various feature selection mechanisms.
FS Mechanisms (↓)
Feature Size (→)
5101520253037
ReliefF83.99285.16288.26189.11990.70091.94392.013
Fisher84.99286.16089.24290.09191.63891.86891.938
MIFS51.77154.37859.71282.36588.85690.79691.891
LSFS86.43286.85389.34690.30491.71291.99291.985
IFS86.89087.17788.16592.73792.92892.04692.141
IIFS-MC86.91187.32188.16692.74192.93192.13792.140
Table 11. Classification accuracy of a C4.5 decision tree on various feature selection mechanisms.
FS Mechanisms (↓)
Feature Size (→)
5101520253037
ReliefF92.18192.99793.30195.52698.11998.35499.005
Fisher96.70897.38297.95898.30699.03299.06999.082
MIFS95.74596.69097.65798.02098.94899.04799.055
LSFS94.68494.73995.68196.64497.67997.68297.730
IFS98.15498.87498.91698.98599.04299.08799.106
IIFS-MC98.35998.92698.94199.05099.05799.10199.111
Table 12. Classification accuracy of Random Forest decision on various feature selection mechanisms.
FS Mechanisms (↓)
Feature Size (→)
5101520253037
ReliefF95.97196.91397.39398.76299.11599.13499.217
Fisher96.92197.72098.37198.75299.13999.16399.185
MIFS92.15393.32193.51096.61397.37098.98799.116
LSFS94.24594.74795.39997.55498.30899.10399.001
IFS98.00598.03398.16599.14499.15899.19899.256
IIFS-MC98.01198.05298.16899.14999.18899.20599.239
Table 13. Features of the NSLKDD dataset and the ranks achieved from the Improved Infinite Feature Selection for Multiclass Classification (IIFS-MC) scheme.
FeaturesWeightsRanksFeaturesWeightsRanks
duration88.41628count88.705927
src_bytes175.83771srv_count89.435424
dst_bytes124.76942serror_rate90.948119
land104.79414srv_serror_rate94.983116
wrong_fragment103.41895rerror_rate86.063834
urgent101.30828srv_rerror_rate84.942936
hot88.822426same_srv_rate89.611523
num_failed_logins98.886411diff_srv_rate90.23121
logged_in85.775435srv_diff_host_rate94.738217
num_compromised91.337618dst_host_count87.150530
root_shell97.020713dst_host_srv_count86.345832
su_attempted101.70047dst_host_same_srv_rate83.650738
num_root96.231214dst_host_diff_srv_rate87.272529
num_file_creations95.873515dst_host_same_src_port_rate86.182433
num_shells99.71789dst_host_srv_diff_host_rate89.963122
num_access_files99.517210dst_host_serror_rate88.980125
num_outbound_cmds106.43653dst_host_srv_serror_rate90.927720
is_host_login103.22516dst_host_rerror_rate86.744231
is_guest_login97.096112dst_host_srv_rerror_rate84.888937
Table 14. Features of the ISCXIDS2012 dataset and the ranks achieved from the IIFS-MC scheme.
FeaturesWeightsRanksFeaturesWeightsRanks
totalSourceBytes90.57242totalDestinationPackets67.99254
totalDestinationBytes131.71191totalSourcePackets68.70463
Table 15. Features of the CICIDS2017 dataset and the ranks achieved from the IIFS-MC scheme.
FeaturesWeightsRanksFeaturesWeightsRanks
Flow_Duration156.28781Max_Packet_Length75.06166
Total_Fwd_Packets72.256673Packet_Length_Mean76.655758
Total_Backward_Packets71.567975Packet_Length_Std74.51367
Total_Length_of_Fwd_Packets75.12664Packet_Length_Variance85.48346
Total_Length_of_Bwd_Packets72.364171FIN_Flag_Count105.804122
Fwd_Packet_Length_Max76.16561SYN_Flag_Count99.592128
Fwd_Packet_Length_Min92.598435RST_Flag_Count109.451220
Fwd_Packet_Length_Mean77.254355PSH_Flag_Count82.165151
Fwd_Packet_Length_Std77.066557ACK_Flag_Count83.061249
Bwd_Packet_Length_Max75.225863URG_Flag_Count89.108641
Bwd_Packet_Length_Min95.222231CWE_Flag_Count109.533218
Bwd_Packet_Length_Mean76.392259ECE_Flag_Count109.451220
Bwd_Packet_Length_Std75.989262Down_Up_Ratio86.756843
Flow_Bytess100.281627Average_Packet_Size78.445254
Flow_Packetss101.687225Avg_Fwd_Segment_Size77.254355
Flow_IAT_Mean86.364844Avg_Bwd_Segment_Size76.392259
Flow_IAT_Std89.009242Fwd_Avg_Bytes_Bulk110.078710
Flow_IAT_Max117.69917Fwd_Avg_Packets_Bulk110.078710
Flow_IAT_Min90.250640Fwd_Avg_Bulk_Rate110.078710
Fwd_IAT_Total151.74063Bwd_Avg_Bytes_Bulk110.078710
Fwd_IAT_Mean94.592232Bwd_Avg_Packets_Bulk110.078710
Fwd_IAT_Std86.309945Bwd_Avg_Bulk_Rate110.078710
Fwd_IAT_Max113.88318Subflow_Fwd_Packets72.256673
Fwd_IAT_Min102.582624Subflow_Fwd_Bytes75.12664
Bwd_IAT_Total151.80532Subflow_Bwd_Packets71.567975
Bwd_IAT_Mean91.17338Subflow_Bwd_Bytes72.364171
Bwd_IAT_Std83.989847Init_Win_bytes_forward82.936250
Bwd_IAT_Max110.50839Init_Win_bytes_backward81.416252
Bwd_IAT_Min90.775439act_data_pkt_fwd74.453568
Fwd_PSH_Flags99.592128min_seg_size_forward96.777830
Bwd_PSH_Flags110.078710Active_Mean92.429536
Fwd_URG_Flags109.533218Active_Std100.437926
Bwd_URG_Flags110.078710Active_Max93.352134
Fwd_Header_Length73.907969Active_Min92.077737
Bwd_Header_Length72.453570Idle_Mean122.14656
Fwd_Packetss80.014753Idle_Std104.551523
Bwd_Packetss83.901348Idle_Max123.59614
Min_Packet_Length93.466233Idle_Min122.22315
Table 16. Feature Subset generated by IIFS-MC for the NSLKDD dataset.
RanksFeaturesRanksFeatures
1src_bytes11num_failed_logins
2dst_bytes12is_guest_login
3num_outbound_cmds13root_shell
4land14num_root
5wrong_fragment15num_file_creations
6is_host_login16srv_serror_rate
7su_attempted17srv_diff_host_rate
8urgent18num_compromised
9num_shells19serror_rate
10num_access_files20dst_host_srv_serror_rate
Table 17. Feature Subset generated by IIFS-MC for the ISCXIDS2012 dataset.
RanksFeaturesRanksFeaturesRanksFeatures
1totalDestinationBytes2totalSourceBytes3totalSourcePackets
Table 18. Feature Subset generated by IIFS-MC for the CICIDS2017 dataset.
RanksFeaturesRanksFeatures
1Flow_Duration18Fwd_URG_Flags
2Bwd_IAT_Total19CWE_Flag_Count
3Fwd_IAT_Total20RST_Flag_Count
4Idle_Max21ECE_Flag_Count
5Idle_Min22FIN_Flag_Count
6Idle_Mean23Idle_Std
7Flow_IAT_Max24Fwd_IAT_Min
8Fwd_IAT_Max25Flow_Packetss
9Bwd_IAT_Max26Active_Std
10Bwd_PSH_Flags27Flow_Bytess
11Bwd_URG_Flags28Fwd_PSH_Flags
12Fwd_Avg_Bytes_Bulk29SYN_Flag_Count
13Fwd_Avg_Packets_Bulk30min_seg_size_forward
14Fwd_Avg_Bulk_Rate31Bwd_Packet_Length_Min
15Bwd_Avg_Bytes_Bulk32Fwd_IAT_Mean
16Bwd_Avg_Packets_Bulk33Min_Packet_Length
17Bwd_Avg_Bulk_Rate34Active_Max
Table 19. Training and Testing samples used in the proposed IDS.
DatasetsSample SizeTraining SamplesTesting Samples
NSL-KDD 87,32557,63929,686
ISCXIDS201287,90658,01829,888
CICIDS201791,83060,60831,222
Table 20. Overall performance of the CTC model + IIFS-MC on the NSL-KDD dataset.
Performance MetricsIIFS Ranked Features
20 FeaturesAll Features
Testing Time/instance0.25 s0.07 s
Overall Accuracy99.9562%99.9629%
Misclassification Rate0.0438%0.0371%
False Positive Rate (FPR)0.0004%0.0004%
False Negative Rate (FNR)0.0004%0.0004%
Mean Absolute Error0.0002%0.0002%
Root Mean Squared Error0.0132%0.0122%
Relative Absolute Error0.077%0.074%
Root Relative Squared Error3.6922%3.3961%
Table 21. Overall performance of the CTC model + IIFS-MC on the ISCXIDS2012 dataset.
Performance OutcomeIIFS Ranked Features
3 FeaturesAll Features
Testing Time/instance0.06 s0.04 s
Overall Accuracy99.4580%99.9364%
Misclassification Rate0.5420%0.0636%
False Positive Rate (FPR)0.0054%0.0006%
False Negative Rate (FNR)0.0054%0.0006%
Mean Absolute Error0.0083%0.0008%
Root Mean Squared Error0.0719%0.025%
Relative Absolute Error1.6552%0.1683%
Root Relative Squared Error14.3741%4.9932%
Table 22. Overall performance of the CTC model + IIFS-MC on CICIDS2017 dataset.
Performance OutcomeIIFS Ranked Features
34 FeaturesAll Features
Testing Time/instance0.41 s0.06 s
Overall Accuracy99.9552%99.9488%
Misclassification Rate0.0448%0.0512%
False Positive Rate (FPR)0.00040.0005
False Negative Rate (FNR)0.00040.0005
Mean Absolute Error0.00030.0003%
Root Mean Squared Error0.01130.0121%
Relative Absolute Error0.1191%0.1264%
Root Relative Squared Error3.4588%3.6978%
Table 23. Comparison of the proposed approach with existing approaches for the NSL-KDD dataset.
IDS ApproachesYear of ReleaseAttack Labels ConsideredFeatures SelectedDetection Rate (DR)False Positive Rate (FPR)Accuracy
SVC+KPCA[24]201352393.41493.4
HTTP based IDS [29]201451399.03199.38
GHSOM + NSGA-II [30]20145All99.71.5999.12
LSSVM-IDS + FMIFS [28]201651898.930.2899.94
TVCPSO–SVM [26]201651797.030.8797.84
TVCPSO–MCLP [26]201651797.232.4196.88
Logitboost + RF [59]20175All99.10.1899.45
Ramp-KSVCR [27]20175All98.480.8698.68
MOPF [31]20175All96.21.4491.74
BC + kNN [60]20185All92.281.5994.92
DLANID + TAL [32]201813All89.2210.7889.22
DLANID + FAL [32]20185All85.4214.5885.42
SRRS + IIFS-MC(20) + CTC52099.95620.000499.9562
SRRS + IIFS-MC(ALL) + CTC5All99.96290.000499.9629
Table 24. Comparison of the proposed approach with existing approaches on the ISCXIDS2012 dataset.
IDS ApproachesYear of ReleaseAttack Labels ConsideredFeatures SelectedDetection Rate (DR) (%)False Positive Rate (FPR)Accuracy (%)
BN-IDS [21]20182N/A98.790.02999.93
AMGA2-NB [16]20132994.50.0794.5
DT + SNORT [18]201525980.0699
RFA-IDS + BIGRAM [23]20182N/A89.62.692.9
PBMLT + LR [20]20172898.870.45499.27
PBMLT + XGB [20]20172899.60.30299.65
AISIDS-ULA [17]20142N/A95.374.5396.23
AMNN + CART [22]201821099.080.7599.2
AMNN + RELIEFF [22]201821093.771.0897.37
AMNN + PCA [22]201821093.235.8491.06
MHCVF [19]20162N/A99.50.000399.57
SRRS + IIFS-MC (3) + CTC2399.50.00599.458
SRRS + IIFS-MC(ALL) + CTC2All99.90.00199.9364
Table 25. Comparison of the proposed approach with existing approaches on the CICIDS2017 dataset.
IDS ApproachesYear of ReleaseAttack Labels ConsideredFeatures SelectedFalse Negative Rate (FNR)False Positive Rate (FPR)Accuracy
GA + SVM[25]20187N/A0.00090.000999.8
MI + SVM[25]20187N/A0.1850.004198.9
SVM[25]20187N/A0.1850.004198.9
SRRS + IIFS-MC (34) + CTC7340.00040.000499.9552
SRRS + IIFS-MC(ALL) + CTC7All0.00050.000599.9488
Table 26. Area under Curve of the detected attacks of the proposed CTC model IIFS-MC on the NSL-KDD Dataset.
DatasetFeaturesDoSProbeR2LU2R
NSL-KDD20 features0.99990.99991.0000.9999
NSL-KDDAll features0.99990.99981.0001.000
Table 27. Area under Curve of the detected attacks of the proposed CTC model IIFS-MC on CICIDS2017 Dataset.
DatasetFeaturesDoSPortScanBrute ForceInfiltrationBotnet ARESWeb Attack
CICIDS201734 features0.99961.00001.00001.00001.00001.0000
CICIDS2017All features0.99961.00001.00001.00001.00001.0000
Publisher’s Note: MDPI stays neutral with regard to jurisdictional claims in published maps and institutional affiliations.

