Article

Energy Crisis in Pakistan and Economic Progress: Decoupling the Impact of Coal Energy Consumption in Power and Brick Kilns

1
College of Economics and Management, Henan Agricultural University, Zhengzhou 450002, China
2
Department of Finance and Economics, Faculty of Economics and Law, University of Pitesti, Str. Targu din Vale, No.1, 110040 Pitesti, Arges, Romania
3
Doctoral and Post-Doctoral School, University “Lucian Blaga” Sibiu, Bd. Victoriei, No.10, 550024 Sibiu, Romania
4
Department of Management and Business Administration, University of Pitesti, Str. Targu din Vale, No.1, 110040 Pitesti, Arges, Romania
5
Government College of Management Sciences, Mansehra 21300, Pakistan
*
Authors to whom correspondence should be addressed.
Mathematics 2021, 9(17), 2083; https://doi.org/10.3390/math9172083
Submission received: 10 June 2021 / Revised: 11 August 2021 / Accepted: 26 August 2021 / Published: 28 August 2021
(This article belongs to the Special Issue Mathematical Methods in Energy Economy)

Abstract

:
This study aims to examine the impact of coal energy consumption on the economic progress in Pakistan by using annual time series data during 1972–2019. Three-unit root tests were employed to rectify the variables’ stationarity. The quantile regression approach with the extension of cointegration regression test was utilized to check the variables interaction with the economic progress. The outcomes of the quantile regression uncover that coal energy consumption in power sector and coal energy consumption in brick kilns have adverse influence to the economic progress, while total coal energy consumption has a productive association with the economic progress. Similarly, the findings of cointegration regression analysis uncover that via FMOLS (Fully Modified Least Squares) and DOLS (Dynamic Least Squares) that variables coal energy consumption in power sector and brick kilns have an adverse connection with the economic progress, while total coal energy consumption uncover a productive linkage to the economic progress in Pakistan. Pakistan is still facing a deep energy crisis because of the lack of energy production from cheap sources. New possible policies are required in this direction to improve the energy sector by paying more attention to the alternative energy sources to foster the economic progress.

1. Introduction

Energy plays a vital role in the economic development of any economy. Pakistan’s disastrous energy failure policies have led the economy to a major power crisis, with an important negative economic impact for almost two decades [1]. However, with the growing energy production and system transmission capacity, Pakistan has effectively overcome the energy crisis lately. The energy crisis directly and indirectly affected all the areas of the economy. The power industry now faces a demand gap and needs to increase its supply at a reduced cost with an improvement in its energy structure. As far as the energy structure is concerned, Pakistan’s dependency on energy has declined in recent years, including fossil fuel, local coal, and natural gas. Pakistan’s total reliance on natural gas is dropping in its energy mix and this might be ascribed to a fall in the natural gas reserves [2]. Coal has a crucial part in sustaining the economic development in the world and in eradicating the poverty. It is a major energy source for the world as well. Over time, global coal consumption is expected to rise to meet the power rate based on more than 29.6 percent of the world total coal supply. In addition to promoting the economic growth and environmental sustainability, coal is a significant source for several environmental issues including soil degradation, dust, water pollution, and local biological impacts [3,4].
Coal is widely known around the world as the cheapest fossil fuel. Therefore, it is seen as a reliable energy source. Moreover, the political instability and related volatility of the oil prices in some major oil-producing nations have prompted the industrialized economies to depend increasingly on some safe indigenous energy sources, such as coal. Dependence on coal, however, prompted some issues regarding to greenhouse gas emissions in the environment. This dependence has led to worldwide effects, such as greenhouse gas emissions, alternative energy production, and the launch of different governmental tax credit programs for renewable energy and sustainable development projects. In the light of the changes in the energy distribution system towards alternative energy sources, a subsequent investigation will look at the effect of coal use on the economic development [5,6,7,8]. Indeed, not only the energy consumption, but the environmental considerations are also reflected in the link between economic development and energy use. The use of traditional sources, such as charcoal, in view of the substantial environmental degradation generated by this use, reflects, to a certain degree, the local environmental pressure. Traditional energy sources including coal, oil, and natural gas are widely used. The energy system is mostly reliant on fossil fuels and the already vulnerable environment is subject to an increased energy demand [9,10].
The effects of global warming and greenhouse gas production are increasingly causing concerns for people regarding the usage of fossil fuels, which causes environmental degradation. Renewable energy has the greatest impact on lowering CO2 emissions and helping to protect the environment. According to this hypothesis, fossil fuels can split again for a long time, but they will face extinction in the near future. Renewable energy consumption has grown into an energy source that may alleviate people’s growing concerns about the greenhouse gas emissions, high costs, fluctuating energies, and foreign energy reliance, not to mention the geopolitics of fossil fuels in some parts of the world [11,12]. The utilization of the sustainable energy has an impact on the economic growth, but countries are abundant in coal resources and additional investigation is in progress in various places, although only a tiny fraction was exploited so far. We need to encourage and make more investments to local coal in the coming several years. The present research study makes a novel contribution to the existing literature by investigating the coal energy consumption in Pakistan and its contribution to the economic progress in Pakistan. Three-unit root techniques were employed to examine the variables’ stationarity. The quantile regression approach with the extension of cointegration regression test were utilized to check the variables interaction with the economic progress in Pakistan.

2. Literature Review

In addition to promoting sustainable development, the energy sector improves resource efficiency while also creating jobs, and it supports the global economic success. Every country’s economic development and expansion are heavily reliant on energy. The fact that energy promotes economic growth and growth based on productivity supports employment and increases incomes is indisputable. All cornerstones are the energy services of the efficient energy business: the transport industry, the home and the service industries of all economies. Energy has always been the lubricant for the sustainable development and economic prosperity [13,14,15]. In the interest of the sustainable development, the governments, international organizations, and other potential investors rapidly becomes very involved in the struggle for steady growth and a sustainable environmental quality. We have previously found that an increased use of energy, especially carbon sources, in economic development is associated with an increase in carbon emissions, which are harmful to the environment and human health. Developing countries believe that restrictions on carbon-intensive energy are detrimental to their economic expansion goals, implying that industrial economies should increase investments in industrial mitigation programs. In the developing economies, production and consumption of oil and natural gas are key drivers of the economic development, and regulating emissions of carbon dioxide may be problematic since it may ultimately impair the economic progress [16,17,18].
With the advent of the Great Industrial Revolution, urbanization and industrialization were seen as critical components of the economic progress. The idea of the connection between urbanization and industrialization has been extensively acknowledged globally from the beginning of the Western Industrial Revolution. This connection is based on a strong desire for a fast economic advancement [19,20]. This sort of connectivity shows, on the one hand, that promoting economic development in the developing nations via an expansion of production is no less than a benefit. On the other side, massive amounts of energy consumption of both households and industry sectors have generated pollutant emissions that are a curse of the humanity, among them we find carbon dioxide and other greenhouse gases. This has allowed society to modernize and enhance its living conditions, along with inevitable public health challenges, via urbanization and industrialization [21,22]. Abbasi et al. [23] proved in their study that energy consumption, industrial growth, and urbanization positively impact on the economic progress in Pakistan. Economic progress relies on the energy consumption; hence, any decrease in energy use is predicted to reduce the economic progress. In contrast, every increase in energy use has a negative effect on the economic development under certain circumstances. This is ascribed to an economic progress pattern, that is that of shifting output towards sectors with lower energy requirements or supplying energy to sectors with capacity limits and inefficiency that need energy reduction. In turn, the presence of double-way causality demonstrates that those two factors interconnect and fulfil the connection, therefore making no detrimental impact on the economic development in the context of an increased energy consumptions [24,25,26].
Global warming, geopolitical conflicts, and recent nuclear disasters have heightened worries about the energy security and the implications of energy generation and use on the environment. As such, several governments are now considering significant policies for energy substitution and drastic steps to save energy. The chances for the success and possible influence of such measures on the economic development must thus be evaluated. In such situations, fuel substitution is a method to support sustainable development in energy policy. Many nations are planning to replace coal with oil, natural gas, or renewables to minimize global warming, since the coal has the highest environmental effect [27,28,29]. The huge number of emissions from fossil fuels is responsible for global warming. Coal is the principal fossil fuel type and has a larger environmental effect than any other fossil fuel source. While the environmental benefits of reducing coal use are obvious, there is on-going debate over whether it is economically viable to reduce coal use in the energy generation. At the same time, the economic growth is highly dependent on the energy consumption and vulnerable to the external shocks; most developing economies still have vast coal reserves. The global economy is undeniably reliant on coal [30,31].
The primary sources of global warming and climate change are assumed to be fossil fuels, particularly oil, natural gas and coal energy usage. As a result, several nations are seeking alternatives, such as renewable energy. On the other hand, it is well-known that industrial and economic activity still relies on the use of fossil fuel in most nations. This generates a tangled situation, as economic progress influences the investments required for the renewable energy sector. Politicians are reasonable to raise the percentage of the renewable energy into the energy mix without jeopardizing economic activities. It is thus important to identify the influence of inefficient fossil-fuel usage on the economic development [32,33,34]. The low-carbon transformation of energy is of major importance for the climate change mitigation, air pollution reduction and fossil fuel usage. Uncontrolled economic expansion will pose real hazards to the world environment once natural resources (as the source of the economic activity) are not inexhaustible. Emissions of carbon dioxide originate from fossil fuels and hence rely on the energy demand or the energy intensity level. Without taking environmental damage into consideration, scholars, practitioners, and policy-makers from the mostly developed economies are now aware of the risks involved in industrialization, deforestation, and other human activities and responses that follow after several periods of economic progress [35,36,37].
Disputes concerning the sustainability of the current energy use in many nations have led to the dependency on fossil fuels in the energy production. One of the explored themes was how to employ the alternative energy sources to lessen the effect of carbon dioxide emissions on the environment and enhance energy usage sustainability in highly energy-dependent nations in order to foster economic development. Comprehensive knowledge of energy usage, CO2 emission and economic progress may support nations’ development of current energy sources, formulation of energy policies and promotion of sustainable development and sources. Different research has sought in recent years to establish links between the economic development and energy usage [38,39,40]. Over the past two decades, worldwide countries have worked hard to minimize the global warming and avert damaging climate change consequences, because greenhouse gas emissions from burning have been covered up for the consumption of fossil fuels. The aim is thus to enhance the energy supply sector in order to create safer and cheaper energy while minimizing the emissions of greenhouse gases. Every effort must be made to locate alternate fossil fuel energy sources. The challenges of addressing energy pollution and sustainability may be resolved by using either nuclear or renewable energy. However, it may not be easy to have an influence of renewable and nuclear energy usage on GHGs. While new renewable energy or nuclear power stations may result in the closure of coal-fired power stations, it may also reduce coal costs, which, in turn, encourages other energy users to burn them to substitute cleaner energy, thereby raising the global level of carbon dioxide emissions [41,42,43].
The decrease of the oil reserves may diminish the global energy supply during the next few decades. The environmental effect of fossil fuel dependence issues includes its adverse influence. Fossil fuels are responsible for generating CO2 and other harmful gases, increasing their greenhouse effects and leading to global warming. If greenhouse gas emissions continue to rise over the next decades, the above-historical global temperature will climb, hurting the earth’s ecology and affecting people. Significant measures should be taken to discover other energy sources and increase energy variety in order to alleviate these concerns, maintain energy security, and reduce reliance on oil. Our planet requires clean energy to accomplish its long-term growth and development. While fossil fuels are used, civil nuclear power is an important solution since it does not emit greenhouse gases. This is why clean energy is considered as important [44,45,46]. The relationship between the energy consumption and economic growth has a direct impact on the advancement of economic and industrial standards. With the increasing worldwide needs for energy, the energy consumption is directly proportional to current automation technologies and comfortable living conditions. As a result, various types of research analyses were conducted to examine, among other things, the dynamic relationship between economic growth and energy use. They are one-way correlation, reversal causation, and multiple-way causality. There is no clear relationship between energy use and economic growth [47,48].

3. Data and Methods

This analysis has used the annual data series during 1972–2019 for Pakistan. Because of the lack of the available data for the variables we have used in our analysis, this is the largest data sample we could collect to achieve some significant results. The main sources of data used in this study are WDI (World Development Indicators) and GOP (Government of Pakistan) [2]. Furthermore, the major variables of this study include economic progress, coal energy consumption in power sector, coal energy consumption in brick kilns sector, and total coal energy consumption in Pakistan. The graphical representations of the variables are illustrated in Figure 1.

Specification of Econometric Model

The variables linkages can be demonstrated by specifying the following model as
ECOP t = f CCPS t , CCBK t , TOCC t ,
The variables’ explanation in Equation (1) are as folllowing: ECOP t indicates the economic progress, CCPS t display the coal energy consumption in power sector, CCBK t reveals coal energy consumption in brick kilns, and TOCC t presents the total coal energy consumption in Pakistan.
The Equation (1) can be expended further as
ECOP t = β 0   +   β 1 CCPS t + β 2 CCBK t + β 3 TOCC t + + ε t
For unit root testing among the study variables, following Equation can be specified as
P t = ω ° + α ° T + α 1 R t 1 + m = 1 w ω 1 P t 1 + ε t
Equation (3) is the general demonstration of the unit root testing, where: P designates the variables estimated for the test; expose the main difference between the operators; t represents the time subscript; and ε t is a stochastic error that normally distributed. Furthermore, this analysis has utilized the quantile regression technique to study the economic progress linkage with coal energy consumption in the power sector, coal energy consumption in brick kilns and total coal energy consumption by following the approach of Koenker and Basset [49]. In this paradigm, different estimates of the dependent variables are verified, so that the independent variables may be changeable via many perspectives. Moreover, this procedure contradicts the limit on the assumption of the same misconception. The model may generally be defined as
z i = v i π θ   + τ θ i
In the Equation (4) z i expresses the dependent variable, τ θ i expresses the error term which is anonymous and π θ expresses the unacquainted vector regression estimation for the parameter (h × 1). The range of θ varies from 0–1. Further, the Equation (4) can be written in its conditional quantile form by ensuing z i and v i as
Q θ z i v i = v i π θ  
In addition, by reducing the appropriate value of π , we also measure the function π θ vector as
t : z t   > v t θ z t v i π θ   + t : z t   > v t 1 θ   z t v i π
In particular, quantile regression employs generalized time approach or a linear fundamental algorithm. Therefore, we limit to a moderate level the number of weighted absolute error criteria, such that in the given amount of valuing the weighting of positive and negative residues is different. Therefore, by taking Equation (2) further in the following direction, the interaction of relative variables can be obtained as
ECOP t = ϑ 0 θ + ϑ 1 θ CCPS t + ϑ 2 θ CCBK t + ϑ 3 θ TOCC t + ε t
In Equation (7), ϑ 0 θ , ϑ 1 θ , ϑ 2 θ , ϑ 3 θ , indicates that the quantile regression estimated coefficients varies from 0.1–0.9.

4. Empirical Results and Discussion

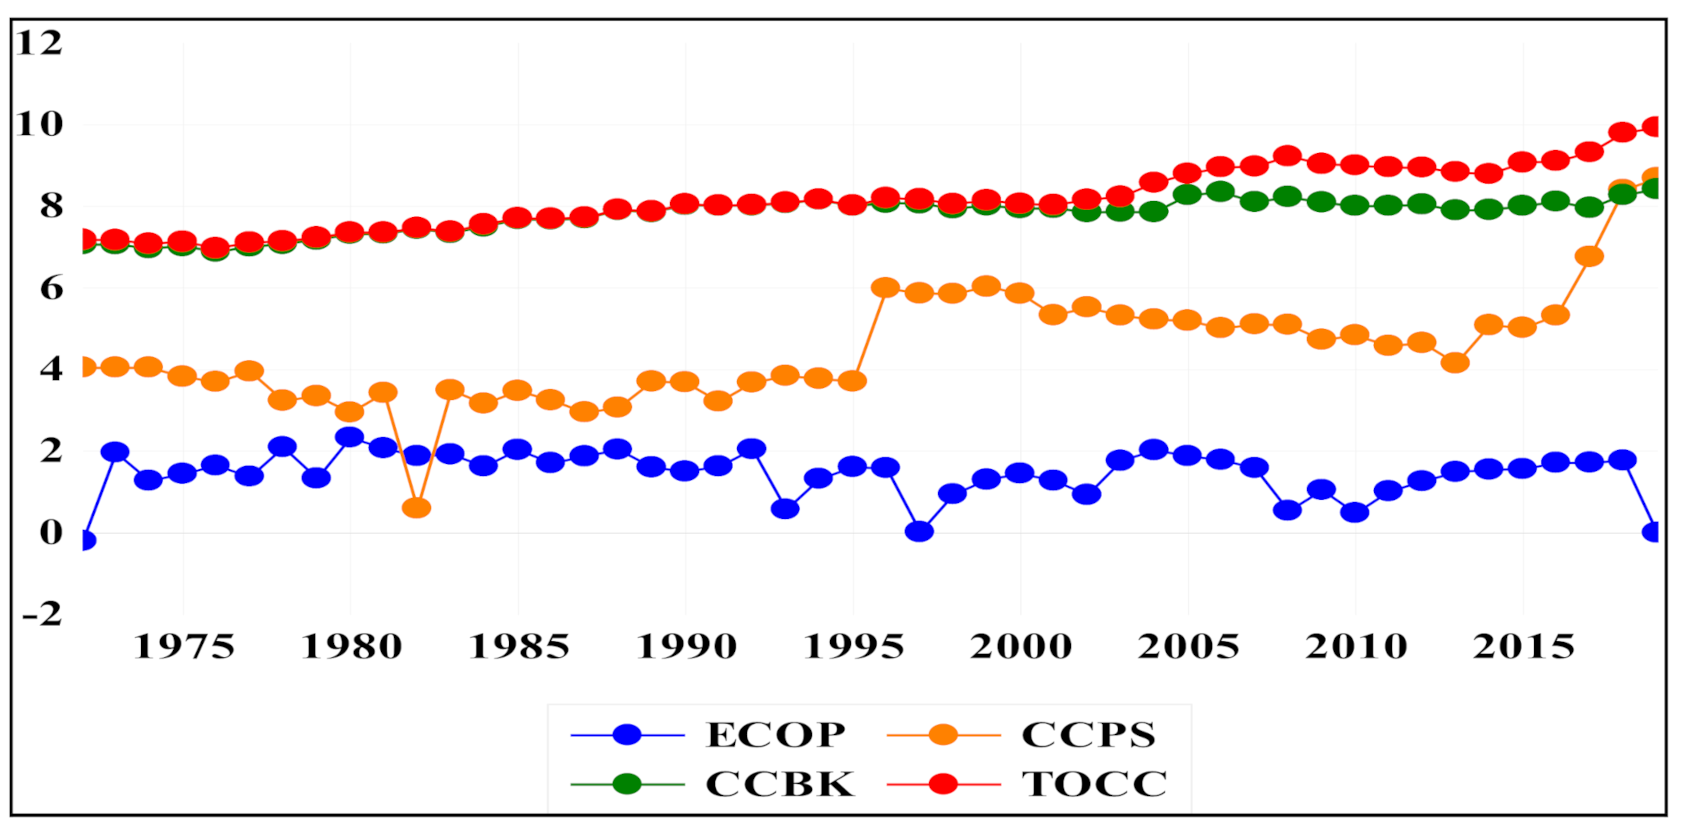
4.1. Exploratory Data Analyses and Correlation

The outcomes of the descriptive data and correlation estimation for the variables are displayed in the Table 1 with probability values. The correlation for the variables economic progress, coal energy consumption in the power sector, coal energy consumption in the brick kilns and total coal energy consumption demonstrated that all variables are correlated with each other.

4.2. Stationarity Testing

The change in the average or covalent time series is not stationary over the time. If the initial difference of this series is stationary, the integration of order one may be thought of as this sequence. A static time-series test, notably the unit root test, is frequently necessary to prevent erroneous regression induced by non-stationary data. In directive to examine the position of the time series data in this study, three kinds of unit root test techniques, namely, Augmented Dickey-Fuller (ADF) [50], Kwiatkowski-Phillips-Schmidt-Shin [51], and Phillips-Perron (P-P) [52] tests. These three categories of testing methodologies for unit roots nonetheless do not address whether data interruptions might lead to erroneous findings. Table 2 illustrates the key findings of these three-unit root testings’ at level and at the first difference. The examined results indicate that economic progress and all energy consumption variables are stationary at level and first difference.

4.3. Cointegration Testing for the Variables

The Johansen cointegration test, introduced by Johansen [53], is generally used to determine if there is a cointegration connection between the time series and the same sequential integration. The Johansen integration test is greater than two-time, contrary to the Engle-Granger test. Connection with Johansen focuses on the regression coefficient and his core assumption is that the challenge of obtaining the greatest probability function should be turned into a problem of identifying the root of the feature and the creator. Table 3 is exposing the outcomes of the cointegration test with trace and max-eigen value statistics.

4.4. Results of Quantile Regression Estimation

The findings of the Table 4 exhibited that variable total coal energy consumption exposed a productive linkage to the economic progress with coefficient (0.955) and p-value is (0.000) that indicates a positive and significant impact on the economic progress in Pakistan. Further, the variables coal energy consumption in power sector and coal energy consumption in brick kilns have an adverse and significant impact on the economic progress in Pakistan with coefficients (−0.489), (−0.540), and probability values (0.000), (0.083) respectively. There are two main concerns regarding the expanding interaction of energy consumption in advanced and emerging countries and the effluents in the rich countries: (1). the use of the most easily accessible sources of energy like coal, natural gas and oil, as well as (2). the rapid growth in greenhouse gas emissions such as methane and CO2 emission. The global character of the energy crisis calls for an appropriate renewable energy management and usage. Generally, renewable energies are described as energies that are generated from solar, wind, geothermal, tidal and wave energy, forestry, waste, and biomass. Renewable energy is clean, safe and limitless in contrast to the conventional energy. Switching to sustainable energy not only protects the environment but also supports the increasing of the revenue and opportunities. This will quickly expand throughout the globe and will exceed several conventional energy components and hold a prominent position in the total percentage of energy consumption according to the forecasts [54,55,56]. Although coal is very rich in economics and resources, its emissions from greenhouse gases will pose substantial environmental difficulties, amongst other things. For these reasons, the implementation of resource policies might be a worthwhile topic. Indeed, a decrease in coal usage may lower emissions of greenhouse gases. Although coal is a two-sided energy source, its use should be determined by any country or international body. Given the environmental cost of carbon dioxide, the policymakers may decide to use more coal in other sectors while reducing carbon emissions if carbon is perceived to be absolutely economically worthwhile [57,58,59].
For the economic output, energy is a crucial input. Moreover, the development in manufacturing helps to boost the demand for energy by increasing the energy consumption. The usage of energy is intimately linked to the country’s overall development. Thus, the energy consumption per capita is used to gauge a country’s social and economic progress [60,61]. For human existence, economic prosperity and societal advancement, the fossil energy is a material foundation. It is coming closer to the linkage between energy and economic development. The largest source of greenhouse gases is represented by the energy usage, which may greatly disrupt the balance of the international ecosystems. The shared objectives of worldwide nations have been to respond to the climate change, to reduce the carbon dioxide emissions and to adopt some sustainable development methods. The widespread use of fossil fuels is now an emblem of the contemporary civilizations. The primary source for greenhouse gas emissions, however, is energy use which would have a major impact on the global ecological balance. Moreover, the changes toward the energy-dependent economic development have become a hot subject globally [34,62,63]. Energy is clearly the most significant engine of the economic development in both emerging and developed countries. Even while the majority of energy originates from the use of the conventional energy sources, including oil, coal and natural gas, they create massive greenhouse gas emissions that might contribute to climate and global warming. The industrialized nations concentrated on the usage of clean energy and the production of sufficient energy for economic expansion for many years from now. Low costs and convenient old fuels, however, still prohibit these sophisticated giants from abandoning filthy fuels altogether. In other words, policymakers cannot even lower carbon dioxide emissions without sacrificing the great economic progress [64,65].

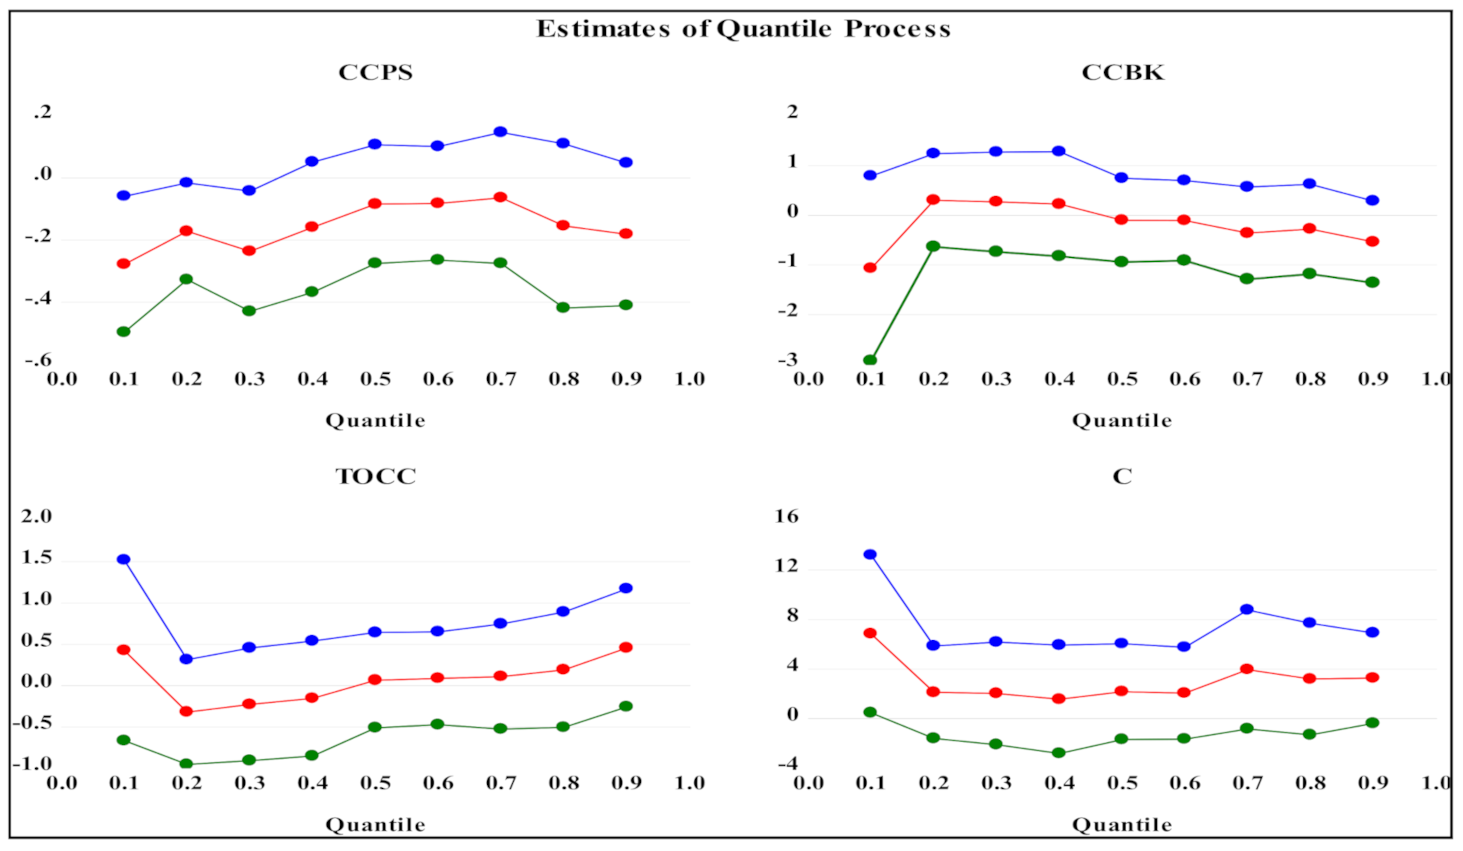
4.5. Estimation of Quantile Process

The Table 5 is presenting the estimated outcomes of the quantile process for CCPS, CCBK, TOCC, and C with having the quantile range of (0.1–0.9). All variable’s quantile range shows the significant impact of different coal energy consumption on the economic progress in Pakistan.
Similarly, the graphical representation of the quantile process estimates is illustrated in the Figure 2. It shows the relevance of the factors where improvements in economic progress are made through the whole cycle. The strong red line indicates the approximate value and provides a 90 percentage confidence interval.

4.6. Estimates of Symmetric Quantiles and Slope Equality Test

Table 6 is expressing the consequences of the symmetric quantile technique that varies from (0.1, 0.9), (0.2, 0.8), (0.3, 0.7), (0.4, 0.6), with chi-square statistics (14.520) and p-value is (0.560) correspondingly.
Furthermore, Table 7 is stating the consequences of the quantile equality test having value of chi-square (21.971) with probability value (0.581). The linkage amid variables is verified through quantiles range (0.1, 0.2), (0.2, 0.3), (0.3, 0.4), (0.4, 0.5), (0.7, 0.8), and (0.8, 0.9).

4.7. Estimates of Cointegration Regression Technique

This study has also employed the cointegration regression technique with fully modified least squares (FMOLS) and dynamic least squares (DOLS) in order to expose the linkages among variables.
Table 8 presents findings of FMOLS estimations and exposes that the variables coal energy consumption in power sector and coal energy consumption in brick kilns sector display an adverse and significant linkage with the economic progress in Pakistan with coefficients (−0.607), (−0.9694) with the probability values (0.006), (0.000) correspondingly. The variable total coal energy consumption reveals a positive association to the economic progress with coefficient (0.807), having p-value (0.007). Moving towards to the results of the DOLS estimations, they expose that both coal energy consumption in power sector and coal energy consumption in brick kilns sector have negative coefficients that express an adverse linkage to the economic progress, while total coal energy consumption has a constructive linkage to the economic progress in Pakistan.

5. Conclusions and Policy Recommendations

In the present investigation, the impact of the coal energy consumption on the economic progress in Pakistan was checked by using the annual data series. The stationarity was verified by using the three unit-root testing. The quantile regression approach with the extension of cointegration regression test was utilized to check the variables’ interaction. The outcomes of the quantile regression reveal that coal energy consumption in power and brick kilns sector has an adverse linkage to the economic progress, while total coal energy consumption has a positive relation with the economic progress in Pakistan. The outcomes of cointegration regression analysis through FMOLS and DOLS uncover that variables coal energy consumption in power sector and coal energy consumption in brick kilns have an adverse linkage to the economic progress, while total coal energy consumption has a productive connection to the economic progress in Pakistan.
Pakistan is a developing economy and has been facing an energy crisis for several years because of the insufficient energy production from different sources. The energy demand and consumption continue to grow as the population rises, as in other emerging economies. As a result of Pakistan’s strong dependency on oil and gas, lower capacity ratings, cyclical debt, security and dangers of resources and bad governance, the country has faced a huge energy crisis. Policies designed to attain minimal debt levels and avoid loan-based investments should be developed in order to manage the energy issues. Facts have shown the terrible day-to-day power difficulties. The unfortunate scenario is that although Pakistan possesses significant amounts of renewable energy, it will have to import vast quantities of hydrocarbons from outside the country to fulfil its energy requirements.
An important limitation of this study is the data sample we have used in our analysis. The number of observations that are usually used in this type of analysis is quite larger, but because of the lack of available data for all the variables we have used, this is the largest data sample we could use in order to achieve significant results. However, these obtained results must be carefully considered and interpreted with caution considering the data sample we have used. Therefore, a direction for further research must consider an analysis based on a larger number of observations so that the achieved results could be more reliable and sounder.

Author Contributions

This paper is the result of the joint work by all the authors. A.R.; (conceptualization, data, methodology, estimations, editing); H.M. (methodology, discussion); M.R. (literature review, introduction, editing); C.I.S. (introduction, editing); Z.Y. (conclusions, editing). All authors have read and agreed to the published version of the manuscript.

Funding

No funding was received for this research.

Institutional Review Board Statement

Not applicable.

Informed Consent Statement

Not applicable.

Data Availability Statement

Not applicable.

Conflicts of Interest

The authors declare no conflict of interest.

References

  1. Abbasi, K.R.; Hussain, K.; Abbas, J.; Adedoyin, F.F.; Shaikh, P.A.; Yousaf, H.; Muhammad, F. Analyzing the role of industrial sector’s electricity consumption, prices, and GDP: A modified empirical evidence from Pakistan. AIMS Energy 2021, 9, 29–49. [Google Scholar] [CrossRef]
  2. GOP. 2020. Available online: http://www.finance.gov.pk/survey/chapter_20/02_Agriculture.pdf (accessed on 28 April 2021).
  3. Al-Mulali, U.; Sab, C.N.B.C. The impact of coal consumption and CO2 emission on economic growth. Energy Sources Part B Econ. Plan. Policy 2018, 13, 218–223. [Google Scholar] [CrossRef]
  4. Xu, J.; Zhou, M.; Li, H. The drag effect of coal consumption on economic growth in China during 1953–2013. Resour. Conserv. Recycl. 2016, 129, 326–332. [Google Scholar] [CrossRef]
  5. Apergis, N.; Payne, J.E. Coal consumption and economic growth: Evidence from a panel of OECD countries. Energy Policy 2010, 38, 1353–1359. [Google Scholar] [CrossRef]
  6. Bhattacharya, M.; Rafiq, S.; Bhattacharya, S. The role of technology on the dynamics of coal consumption–economic growth: New evidence from China. Appl. Energy 2015, 154, 686–695. [Google Scholar] [CrossRef]
  7. Kim, H.-M.; Yoo, S.-H. Coal consumption and economic growth in Indonesia. Energy Sources Part B Econ. Plan. Policy 2016, 11, 547–552. [Google Scholar] [CrossRef]
  8. Zhang, M.; Bai, C.; Zhou, M. Decomposition analysis for assessing the progress in decoupling relationship between coal consumption and economic growth in China. Resour. Conserv. Recycl. 2016, 129, 454–462. [Google Scholar] [CrossRef]
  9. Li, S.; Shi, J.; Wu, Q. Environmental Kuznets Curve: Empirical Relationship between Energy Consumption and Economic Growth in Upper-Middle-Income Regions of China. Int. J. Environ. Res. Public Health 2020, 17, 6971. [Google Scholar] [CrossRef]
  10. Ahmad, N.; Du, L.; Lu, J.; Wang, J.; Li, H.-Z.; Hashmi, M.Z. Modelling the CO2 emissions and economic growth in Croatia: Is there any environmental Kuznets curve? Energy 2017, 123, 164–172. [Google Scholar] [CrossRef]
  11. Yazdi, S.K.; Shakouri, B. Renewable energy, nonrenewable energy consumption, and economic growth. Energy Sources Part B Econ. Plan. Policy 2017, 12, 1038–1045. [Google Scholar] [CrossRef]
  12. Ozcan, B.; Ozturk, I. Renewable energy consumption-economic growth nexus in emerging countries: A bootstrap panel causality test. Renew. Sustain. Energy Rev. 2019, 104, 30–37. [Google Scholar] [CrossRef]
  13. Ahmed, M.; Azam, M. Causal nexus between energy consumption and economic growth for high, middle and low income countries using frequency domain analysis. Renew. Sustain. Energy Rev. 2016, 60, 653–678. [Google Scholar] [CrossRef]
  14. Jebli, M.B.; Youssef, S.B. The environmental Kuznets curve, economic growth, renewable and non-renewable energy, and trade in Tunisia. Renew. Sustain. Energy Rev. 2015, 47, 173–185. [Google Scholar] [CrossRef] [Green Version]
  15. Chen, Y.; Wang, Z.; Zhong, Z. CO2 emissions, economic growth, renewable and non-renewable energy production and foreign trade in China. Renew. Energy 2018, 131, 208–216. [Google Scholar] [CrossRef]
  16. Awodumi, O.B.; Adeleke, A.M. Non-Renewable Energy and Macroeconomic Efficiency of Seven Major Oil Producing Economies in Africa. Zagreb Int. Rev. Econ. Bus. 2016, 19, 59–74. [Google Scholar] [CrossRef] [Green Version]
  17. Hanif, I. Impact of fossil fuels energy consumption, energy policies, and urban sprawl on carbon emissions in East Asia and the Pacific: A panel investigation. Energy Strat. Rev. 2018, 21, 16–24. [Google Scholar] [CrossRef]
  18. Kang, S.H.; Islam, F.; Tiwari, A.K. The dynamic relationships among CO2 emissions, renewable and non-renewable energy sources, and economic growth in India: Evidence from time-varying Bayesian VAR model. Struct. Chang. Econ. Dyn. 2019, 50, 90–101. [Google Scholar] [CrossRef]
  19. Rehman, A.; Ma, H.; Ozturk, I. Do industrialization, energy importations, and economic progress influence carbon emission in Pakistan. Environ. Sci. Pollut. Res. 2021, 1–13. [Google Scholar] [CrossRef]
  20. Ahmad, M.; Zhao, Z.-Y. Empirics on linkages among industrialization, urbanization, energy consumption, CO2 emissions and economic growth: A heterogeneous panel study of China. Environ. Sci. Pollut. Res. 2018, 25, 30617–30632. [Google Scholar] [CrossRef] [PubMed]
  21. Çetin, M.; Ecevit, E. Urbanization, energy consumption and CO2 emissions in Sub-Saharan countries: A panel cointegration and causality analysis. J. Econ. Dev. Stud. 2015, 3, 66–76. [Google Scholar] [CrossRef] [Green Version]
  22. Nasreen, S.; Saidi, S.; Ozturk, I. Assessing links between energy consumption, freight transport, and economic growth: Evidence from dynamic simultaneous equation models. Environ. Sci. Pollut. Res. 2018, 25, 16825–16841. [Google Scholar] [CrossRef] [PubMed]
  23. Abbasi, K.R.; Shahbaz, M.; Jiao, Z.; Tufail, M. How energy consumption, industrial growth, urbanization, and CO2 emissions affect economic growth in Pakistan? A novel dynamic ARDL simulations approach. Energy 2021, 221, 119793. [Google Scholar] [CrossRef]
  24. Yuan, C.; Liu, S.; Xie, N. The impact on chinese economic growth and energy consumption of the Global Financial Crisis: An input–output analysis. Energy 2010, 35, 1805–1812. [Google Scholar] [CrossRef]
  25. Ishida, H. The effect of ICT development on economic growth and energy consumption in Japan. Telemat. Inform. 2015, 32, 79–88. [Google Scholar] [CrossRef]
  26. Komal, R.; Abbas, F. Linking financial development, economic growth and energy consumption in Pakistan. Renew. Sustain. Energy Rev. 2015, 44, 211–220. [Google Scholar] [CrossRef]
  27. Bloch, H.; Rafiq, S.; Salim, R. Economic growth with coal, oil and renewable energy consumption in China: Prospects for fuel substitution. Econ. Model. 2015, 44, 104–115. [Google Scholar] [CrossRef] [Green Version]
  28. Khan, M.K.; Teng, J.-Z. Effect of energy consumption and economic growth on carbon dioxide emissions in Pakistan with dynamic ARDL simulations approach. Environ. Sci. Pollut. Res. 2019, 26, 23480–23490. [Google Scholar] [CrossRef]
  29. Awodumi, O.B.; Adewuyi, A.O. The role of non-renewable energy consumption in economic growth and carbon emission: Evidence from oil producing economies in Africa. Energy Strat. Rev. 2019, 27, 100434. [Google Scholar] [CrossRef]
  30. Chang, T.; Deale, D.; Gupta, R.; Hefer, R.; Inglesi-Lotz, R.; Simo-Kengne, B. The causal relationship between coal consumption and economic growth in the BRICS countries: Evidence from panel-Granger causality tests. Energy Sources Part B Econ. Plan. Policy 2016, 12, 138–146. [Google Scholar] [CrossRef] [Green Version]
  31. Odhiambo, N.M. Coal consumption and economic growth in South Africa: An empirical investigation. Energy Environ. 2016, 27, 215–226. [Google Scholar] [CrossRef]
  32. Destek, M.A.; Okumus, I. Disaggregated energy consumption and economic growth in G-7 countries. Energy Sources Part B Econ. Plan. Policy 2017, 3, 1–7. [Google Scholar] [CrossRef]
  33. Chen, C.; Pinar, M.; Stengos, T. Renewable energy consumption and economic growth nexus: Evidence from a threshold model. Energy Policy 2020, 139, 111295. [Google Scholar] [CrossRef]
  34. Gozgor, G.; Lau, C.K.M.; Lu, Z. Energy consumption and economic growth: New evidence from the OECD countries. Energy 2018, 153, 27–34. [Google Scholar] [CrossRef] [Green Version]
  35. Urban, F.; Nordensvärd, J. Low Carbon Energy Transitions in the Nordic Countries: Evidence from the Environmental Kuznets Curve. Energies 2018, 11, 2209. [Google Scholar] [CrossRef] [Green Version]
  36. Rahman, M.M.; Kashem, M.A. Carbon emissions, energy consumption and industrial growth in Bangladesh: Empirical evidence from ARDL cointegration and Granger causality analysis. Energy Policy 2017, 110, 600–608. [Google Scholar] [CrossRef]
  37. Arango-Miranda, R.; Hausler, R.; Romero-Lopez, R.; Glaus, M.; Ibarra-Zavaleta, S.P. Carbon Dioxide Emissions, Energy Consumption and Economic Growth: A Comparative Empirical Study of Selected Developed and Developing Countries. “The Role of Exergy”. Energies 2018, 11, 2668. [Google Scholar] [CrossRef] [Green Version]
  38. Zhao, Q.; Chen, Q.; Xiao, Y.; Tian, G.; Chu, X.; Liu, Q. Saving forests through development? Fuelwood consumption and the energy-ladder hypothesis in rural Southern China. Transform. Bus. Econ. 2017, 16, 199–219. [Google Scholar]
  39. Mardani, A.; Streimikiene, D.; Nilashi, M.; Aranda, D.A.; Loganathan, N.; Jusoh, A. Energy Consumption, Economic Growth, and CO2 Emissions in G20 Countries: Application of Adaptive Neuro-Fuzzy Inference System. Energies 2018, 11, 2771. [Google Scholar] [CrossRef] [Green Version]
  40. Esso, L.J.; Keho, Y. Energy consumption, economic growth and carbon emissions: Cointegration and causality evidence from selected African countries. Energy 2016, 114, 492–497. [Google Scholar] [CrossRef]
  41. Jin, T.; Kim, J. What is better for mitigating carbon emissions—Renewable energy or nuclear energy? A panel data analysis. Renew. Sustain. Energy Rev. 2018, 91, 464–471. [Google Scholar] [CrossRef]
  42. Piłatowska, M.; Geise, A.; Włodarczyk, A. The Effect of Renewable and Nuclear Energy Consumption on Decoupling Economic Growth from CO2 Emissions in Spain. Energies 2020, 13, 2124. [Google Scholar] [CrossRef]
  43. Dong, K.; Sun, R.; Jiang, H.; Zeng, X. CO2 emissions, economic growth, and the environmental Kuznets curve in China: What roles can nuclear energy and renewable energy play? J. Clean. Prod. 2018, 196, 51–63. [Google Scholar] [CrossRef]
  44. Mora, C.; Frazier, A.; Longman, R.J.; Dacks, R.S.; Walton, M.M.; Tong, E.J.; Sanchez, J.J.; Kaiser, L.; Stender, Y.O.; Anderson, J.; et al. The projected timing of climate departure from recent variability. Nature 2013, 502, 183–187. [Google Scholar] [CrossRef] [PubMed]
  45. Chang, T.; Gatwabuyege, F.; Gupta, R.; Inglesi-Lotz, R.; Manjezi, N.; Simo-Kengne, B. Causal relationship between nuclear energy consumption and economic growth in G6 countries: Evidence from panel Granger causality tests. Prog. Nucl. Energy 2014, 77, 187–193. [Google Scholar] [CrossRef] [Green Version]
  46. Ozcan, B.; Ari, A. Nuclear energy-economic growth nexus in OECD countries: A panel data analysis. J. Econ. Manag. Strategy 2017, 11, 138–154. [Google Scholar]
  47. Zhang, Y.-J. Interpreting the dynamic nexus between energy consumption and economic growth: Empirical evidence from Russia. Energy Policy 2011, 39, 2265–2272. [Google Scholar] [CrossRef]
  48. Rathnayaka, R.M.K.T.; Seneviratna, D.M.K.N.; Long, W. The dynamic relationship between energy consumption and economic growth in China. Energy Sources Part B Econ. Plan. Policy 2018, 13, 264–268. [Google Scholar] [CrossRef]
  49. Koenker, R.; Bassett, G., Jr. Regression quantiles. Econometrica 1978, 46, 33–50. [Google Scholar] [CrossRef]
  50. Dickey, D.A.; Fuller, W.A. Distribution of the estimators for autoregressive time series with a unit root. J. Am. Stat. Assoc. 1979, 74, 427–431. [Google Scholar]
  51. Kwiatkowski, D.; Phillips PC, B.; Schmidt, P.; Shin, Y. Testing the null hypothesis of stationarity against the alternative of a unit root: How sure are we that economic time series have a unit root? J. Econom. 1992, 54, 159–178. [Google Scholar] [CrossRef]
  52. Phillips, P.C.; Perron, P. Testing for a unit root in time series regression. Biometrika 1988, 75, 335–346. [Google Scholar] [CrossRef]
  53. Johansen, S.; Juselius, K. Maximum Likelihood Estimation and Inference on Cointegration—With Applications to the Demand for Money. Oxf. Bull. Econ. Stat. 2009, 52, 169–210. [Google Scholar] [CrossRef]
  54. Shakouri, B.; Yazdi, S.K. Causality between renewable energy, energy consumption, and economic growth. Energy Sources Part B Econ. Plan. Policy 2017, 12, 838–845. [Google Scholar] [CrossRef]
  55. Apergis, N.; Danuletiu, D.C. Renewable energy and economic growth: Evidence from the sign of panel long-run causality. Int. J. Energy Econ. Policy 2014, 4, 578. [Google Scholar]
  56. Koçak, E.; Şarkgüneşi, A. The renewable energy and economic growth nexus in Black Sea and Balkan countries. Energy Policy 2016, 100, 51–57. [Google Scholar] [CrossRef]
  57. Sawik, B.; Faulin, J.; Pérez-Bernabeu, E. Multi-Criteria Optimization for Fleet Size with Environmental Aspects. Transp. Res. Procedia 2017, 27, 61–68. [Google Scholar] [CrossRef]
  58. Riker, D.A. International coal trade and restrictions on coal consumption. Energy Econ. 2012, 34, 1244–1249. [Google Scholar] [CrossRef]
  59. Hao, Y.; Zhang, Z.-Y.; Liao, H.; Wei, Y.-M. China’s farewell to coal: A forecast of coal consumption through 2020. Energy Policy 2015, 86, 444–455. [Google Scholar] [CrossRef]
  60. Mahmood, A.; Javaid, N.; Zafar, A.; Riaz, R.A.; Ahmed, S.; Razzaq, S. Pakistan’s overall energy potential assessment, comparison of LNG, TAPI and IPI gas projects. Renew. Sustain. Energy Rev. 2014, 31, 182–193. [Google Scholar] [CrossRef]
  61. Latief, R.; Lefen, L. Foreign Direct Investment in the Power and Energy Sector, Energy Consumption, and Economic Growth: Empirical Evidence from Pakistan. Sustainability 2019, 11, 192. [Google Scholar] [CrossRef] [Green Version]
  62. Cheng, Y.; Wang, Z.; Ye, X.; Wei, Y.D. Spatiotemporal dynamics of carbon intensity from energy consumption in China. J. Geogr. Sci. 2014, 24, 631–650. [Google Scholar] [CrossRef] [Green Version]
  63. Xiong, C.; Yang, D.; Huo, J.; Zhao, Y. The relationship between energy consumption and economic growth and the development strategy of a low-carbon economy in Kazakhstan. J. Arid. Land 2015, 7, 706–715. [Google Scholar] [CrossRef]
  64. Cai, Y.; Sam, C.Y.; Chang, T. Nexus between clean energy consumption, economic growth and CO2 emissions. J. Clean. Prod. 2018, 182, 1001–1011. [Google Scholar] [CrossRef]
  65. Haseeb, M.; Hassan, S.; Azam, M. Rural–urban transformation, energy consumption, economic growth, and CO2 emissions using STRIPAT model for BRICS countries. Environ. Prog. Sustain. Energy 2017, 36, 523–531. [Google Scholar] [CrossRef]
Figure 1. Graphical display of variables.
Mathematics 09 02083 g001
Figure 2. Plot of the quantile process estimates.
Mathematics 09 02083 g002
Table 1. Outcomes of exploratory data analyses and correlation.
ECOPCCPSCCBKTOCC
Mean1.4394.4917.7838.163
Median1.5764.0917.9428.059
Maximum2.3238.6828.4169.931
Minimum−0.2060.5876.8816.970
Std. Dev.0.5681.4050.4160.766
Skewness−1.2200.595−0.8040.328
Kurtosis4.1474.7792.4342.255
Jarque-Bera14.5439.1675.8221.971
Probability0.0000.0100.0540.373
ECOG(1.000)
CCPS−0.384(1.000)
CCBK−0.2030.547(1.000)
TOCC−0.2510.7040.852(1.000)
Table 2. Unit root technique outcomes.
VariablesADF (Prob. *)P-P (Prob. *)KPSS (Prob. *)
LevelFirst DifferenceLevelFirst DifferenceLevelFirst Difference
ECOG−5.742
(0.000)
−10.608
(0.000)
−5.881
(0.000)
−16.385
(0.000)
0.258
(0.000)
0.396
(0.006)
CCPS−0.890
(0.782)
−9.224
(0.000)
−0.432
(0.894)
−9.132
(0.000)
0.652
(0.000)
0.228
(0.008)
CCBK−1.228
(0.654)
−7.953
(0.000)
−1.118
(0.700)
−7.943
(0.000)
0.686
(0.000)
0.100
(0.000)
TOCC1.000
(0.996)
−3.531
(0.011)
0.685
(0.990)
−6.329
(0.000)
0.861
(0.000)
0.153
(0.005)
* Displaying the probability values of MacKinnon (1996).
Table 3. Cointegration testing outcomes.
Statistical Outcomes of Trace Test
Hypo-No. of CE(s)Eig-ValueT-StatisticC-Values at 0.05Prob.
None *0.62560.15547.8560.002
At most 10.19914.98429.7970.781
At most 20.0914.77015.4940.832
At most 30.0080.3703.8410.542
Statistical Outcomes of Max-Eigenvalue
Hypo-No. of CE(s)Eig-ValueM-Eigen
Statistic
C-Values at 0.05Prob.
None *0.62545.17027.5840.000
At most 10.19910.21321.1310.724
At most 20.0914.40014.2640.814
At most 30.0080.3703.8410.542
* Reveals the hypothesis denial at the level of 0.05 levels.
Table 4. Fiftieth (0.50) quantile regression estimates of Equation (1).
VariablesCoefficientsS-Errort-StatisticProb.
CCPS−0.4890.106−4.6010.000
CCBK−0.5400.305−1.7730.083
TOCC0.9550.2144.4530.000
C5.5221.9762.7930.007
Pseudo R20.429M-dependent var3.439
Adj- R20.401S.D. dependent var0.558
SE of regression0.896Objective6.109
Qua-dependent var1.543Restr. Objective6.632
Sparsity1.140Quasi-LR statistic2.901
Prob(Quasi-LR stat)0.000
Table 5. Consequences of estimated quantile process.
VariablesQuantileCoefficientsS-Errort-StatisticProb.
CCPS
(Coal Energy Consumption in Power Sector)
(0.1–0.9)−0.8210.411−1.9950.052
−0.1840.100−1.8310.073
−0.5960.202−2.9490.005
−0.8610.347−2.4800.017
−0.4170.197−2.1160.040
−0.1420.004−34.8040.000
−0.3920.106−3.6890.000
−0.1470.076−1.9390.058
−0.1280.009−14.0100.000
CCBK (Coal Energy Consumption in Brick Kilns Sector)(0.1–0.9)−0.6110.201−3.0430.003
0.3410.1861.8330.073
0.8560.5111.6730.101
0.6540.2712.4140.020
−0.1630.005−31.4250.000
−0.4950.169−2.9240.005
−0.8850.336−2.6300.011
−0.8680.154−5.6260.000
−0.7230.212−3.4080.001
TOCC (Total Coal Energy Consumption)(0.1–0.9)0.5920.2472.3940.021
−0.6230.367−1.6960.096
−0.7980.343−2.3230.024
−0.5760.248−2.3200.025
0.6550.2942.2280.031
0.5570.2662.0900.042
0.1430.0463.0960.003
0.5330.1563.4150.001
0.5930.2042.9020.005
C (Constant)(0.1–0.9)0.3780.1692.2350.030
5.1282.0992.4420.018
2.0471.1111.8430.072
1.6380.4623.5430.001
2.0220.7662.6370.011
2.5580.8882.8790.006
3.2450.9913.2710.002
3.0291.9801.5290.133
3.2670.6225.2530.000
Table 6. Consequences of symmetric quantile test.
Symmetric Quantiles Test
Test SummaryChi-Sq. StatisticChi-Sq. d.f.Prob.
Wald Test14.520160.560
QuantilesVariablesRestr. ValueS-ErrorProb.
0.1, 0.9CCPS−0.2910.1950.137
CCBK−1.4081.0810.192
TOCC0.7490.7010.285
C5.74504.3100.182
0.2, 0.8CCPS−0.1570.1640.336
CCBK0.2220.7000.750
TOCC−0.2610.4900.594
C0.9573.1890.763
0.3, 0.7CCPS−0.1310.1270.302
CCBK0.1090.5720.847
TOCC−0.2500.3900.521
C1.6432.6360.533
0.4, 0.6CCPS−0.0710.0880.418
CCBK0.3210.4050.427
TOCC−0.1990.2750.470
C−0.7511.7960.675
Table 7. Consequences of slope equality test.
Test SummaryChi-Sq. StatisticChi-Sq. d.f.Prob.
Wald Test21.971240.581
QuantilesVariableRestr. ValueStd. ErrorProb.
[0.1, 0.2]CCPS−0.1060.0840.208
CCBK−1.3720.7620.071
TOCC0.7460.4460.094
[0.2, 0.3]CCPS0.0640.0640.319
CCBK0.0320.3410.923
TOCC−0.0920.2320.689
[0.3, 0.4]CCPS−0.0770.0670.252
CCBK0.0420.3390.901
TOCC−0.0720.2260.749
[0.4, 0.5]CCPS−0.0740.0640.244
CCBK0.3260.3160.302
TOCC−0.2210.2110.293
[0.5, 0.6]CCPS−0.0020.0580.962
CCBK0.0040.2560.985
TOCC−0.0220.1760.897
[0.6, 0.7]CCPS−0.0170.0660.791
CCBK0.2530.2880.378
TOCC−0.0210.1970.915
[0.7, 0.8]CCPS0.0900.0880.310
CCBK−0.0800.3230.804
TOCC−0.0810.2410.734
[0.8, 0.9]CCPS0.0270.1050.796
CCBK0.2580.3660.480
TOCC−0.2640.2960.371
Table 8. Outcomes of FMOLS and DOLS.
Fully Modified Least Squares (FMOLS)
VariablesCoefficientsS-Errort-StatisticProb.
CCPS−0.6070.211−2.8760.006
CCBK−0.9690.257−3.7700.000
TOCC0.8070.2852.8280.007
C3.9731.2323.2240.002
R20.296M-Dependent var1.743
Adj-R20.able 8254S.D-dependent var0.566
S.E. of regression0.498S-S resid10.157
Long-run variance0.156
Dynamic Least Squares (DOLS)
VariablesCoefficientsS-errort-StatisticProb.
CCPS−0.5380.137−3.9050.000
CCBK−0.3560.103−3.4470.001
TOCC0.2980.1002.9660.004
C1.2220.2464.9530.000
R20.575M-Dependent var1.559
Adj-R20.428S.D-dependent var0.582
S.E. of regression0.383S-S resid3.806
Long-run variance0.402
Publisher’s Note: MDPI stays neutral with regard to jurisdictional claims in published maps and institutional affiliations.

