Article

Factors Influencing Mathematics Achievement of University Students of Social Sciences

1
Faculty of Organizational Sciences, University of Maribor, SI-4000 Kranj, Slovenia
2
Faculty of Natural Sciences and Mathematics, University of Maribor, SI-2000 Maribor, Slovenia
3
Institute of Mathematics, Physics and Mechanics, SI-1000 Ljubljana, Slovenia
*
Author to whom correspondence should be addressed.
Mathematics 2020, 8(12), 2134; https://doi.org/10.3390/math8122134
Submission received: 29 October 2020 / Revised: 23 November 2020 / Accepted: 25 November 2020 / Published: 1 December 2020
(This article belongs to the Special Issue Active Methodologies for the Promotion of Mathematical Learning)

Abstract

:
The paper aims to investigate the main factors influencing the mathematics achievement of social sciences university students in Slovenia. A conceptual model was derived where three categories of variables were taken into account: attitude towards mathematics and math anxiety, engagement in learning activities, and attitude towards involving technology in learning mathematics. Data were collected for seven consecutive academic years and analysed using Structural Equation Modelling (SEM). The results showed a very high coefficient of determination for mathematics achievement (0.801), indicating that variables “Perceived Level of Math Anxiety”, “Self-Engagement in Mathematics Course at University”, and “Perceived Usefulness of Technology in Learning Mathematics”, together, explain 80.1% of the total variance. Based on our findings, we can conclude that teaching in secondary school is a crucial determinant for success in mathematics at university. It is essential to identify the best methods for secondary school math teachers which will help them give future students better entry-level knowledge for universities. These methods will, hopefully, also improve the level of mathematics self-confidence, as well as lower the level of math anxiety, which all considerably affect the performance of students in university mathematics.

1. Introduction

Mathematical skills have long been recognised as essential not only for academic success but also for efficient functioning in everyday life [1]. By studying mathematics, we train accuracy, consistency, and mental discipline, which are essential skills needed for effective and responsible problem solving and decision making in everyday life. Due to the global awareness of the importance of mathematical knowledge on the one hand, and the concern expressed for many years at various levels of education about underachievement in mathematics [2], the performance of students in mathematics from primary school to higher education is still a topic of concern [3].
After reviewing publicly available databases, we found that the majority of studies on mathematical performance and achievement are focused on either primary or secondary education or both (see, e.g., [4,5,6,7,8,9,10,11,12,13,14,15,16,17,18,19]). Studies focusing on higher education (i.e., tertiary or post-secondary education), which is the subject of our research, are less represented (see Section 2.2).
Knowledge of mathematics has often been cited as crucial for several disciplines in higher education, including technical fields, engineering, economics, and finance, as well as agriculture, pharmaceuticals, and health sciences [20,21,22]. Since mathematical knowledge offers widespread application, social sciences university programs around the world require their students to take at least one mathematics course. Their students gain essential mathematical knowledge and develop the analytical and computational skills they need in their field of specialisation. Unfortunately, mathematics in university courses has often been identified as a significant obstacle for students and as one of the main reasons for dropping out of university [22]. This problem is particularly pronounced in non-scientific university programs, where the failure rate in mathematics can easily exceed 30 percent [23]. Since poor performance in mathematics indirectly affects the overall academic performance of students, there is an urgent need to investigate the factors that have contributed to poor performance in mathematics in higher education.
This study aims to develop a conceptual model to analyse the factors that influence the mathematical performance of university students of social sciences. The background knowledge of secondary mathematics, the attitude towards learning mathematics with technology, the perceived level of math anxiety, and the self-engagement and motivation during the mathematics course were taken into account. In our effort to investigate the relationships between the model components, we applied the Structural Equation Modelling (SEM). The results were then presented and discussed.
The rest of the paper is structured as follows. First, the results of a relevant literature review are outlined. The research model and the proposed hypotheses are developed. Furthermore, the methodology of our empirical study is explained. The results are presented and discussed. Finally, the conclusions are outlined based on research implications, the limitations of the study, and future research recommendations.

2. Review of Related Literature

2.1. Factors that Influence Mathematics Performance

To determine the predictors of mathematics achievement among various groups of individuals, a large body of studies have been conducted over the past several decades. Since education is a complex process with many variables interacting in a way that affects how much learning takes place [24], the authors express the diverse and complex nature of factors associated with mathematics performance. To provide a comprehensive and consistent insight, some authors try to classify the factors into various categories with related properties.
Papanastasiou [24] distinguishes between internal and external factors influencing mathematics performance. Internal factors are those related to the test (exam) material, while external factors refer to the environment which surrounds the individual as well as to his unique persona (e.g., socio-economic level and educational background of the family, the school climate, the language background, and students’ attitudes toward mathematics).
Patterson et al. [4] express that factors associated with mathematics achievement range from the dynamics of individual cognitive processes to the social and environmental factors that affect a particular student.
Furthermore, Enu, Agyman, and Nkum [25] ascertained that the successfulness of learning mathematics is contingent on a myriad of factors: students’ factors (entry behaviour, motivation, and attitude), socio-economic factors (education of parents and their economic status), and school-based factors (availability and usage of learning materials, school type, and teacher characteristics).
A comprehensive and systematic literature review on influential factors found to be responsible for success or failure in mathematics is provided by Kushwaha [26]. The author divided the factors under three general heads as follows:
  • Psychological variables: attitude towards mathematics, intelligence, math anxiety, self-concept, study habits, mathematical aptitude, numerical ability, achievement motivation, cognitive style, self-esteem, interest in mathematics, test anxiety, reading ability, problem-solving ability, mathematical creativity, educational and occupational aspiration, personal adjustment, locus of control, emotional stability, and confidence in math.
  • Social variables: socio-economic status, school environment, home environment, parents’ education, parental involvement, parents’ occupation, parents’ income, social status, social relations, type of school, teacher’s expectation, and social maturity.
  • Biographical and instructional variables: gender, locality, methods of instructions, caste, birth order, teacher effectiveness, and home tutoring.
In many studies on mathematics achievement, the psychological, social, biographical, and instructional variables were studied simultaneously, where the authors have focused on a limited number of factors or themes with the aim of demonstrating their role in the complex process of mathematics education. Kushwaha [26] found out that the most preferential factors of the investigation in the category of psychological variables are intelligence, attitude towards mathematics, self-concept, numerical ability, and math anxiety. Among social variables, the factors which were considered very widely are socio-economic status, parental involvement, and parents’ education, while among biographical variables, the most frequently considered factor is gender.

2.2. Investigation of Mathematics Performance at the Tertiary Level of Education

Due to specific characteristics of the target population, we believe that research results relating to different levels of education (primary, secondary, and tertiary) cannot always be directly compared. Therefore, we have limited our attention to studies related to the tertiary level of education, as this is the subject of our research.
Concerns regarding the problem of unsatisfactory mathematics performance have been reported internationally. Most of these studies are related to developing countries, such as Malaysia [2,3,23,27,28,29,30], Iran [31], Nigeria [32], Ghana [25], and the Philippines [33,34]. Studies relating to the field of Australia are also quite common [20,21,35,36,37,38]. The territory of the USA and Canada seems to be somewhat less represented [39,40], while studies dealing with mathematics achievement in European higher education are very rare. In this regard, we found a few papers from the following countries: the UK [41], Finland [42], Spain [43], Ireland [44], Germany [22], and Sweden [45]. In our opinion, the origin of the study is an important factor that should be considered when comparing the results. Namely, specificities of a particular national education system, as well as cultural differences between different parts of the world, can lead to significant differences in conclusions.
The majority of the studies addressed mathematics performance in relation to certain selected factors. As one of the most influential sources and predictors of underachievement in mathematics at the tertiary level of education, the authors consider the insufficient level of mathematical background from secondary education (see, e.g., [2,20,21,36,37,38,39,40,42,44]).
Furthermore, many authors note that math anxiety also plays an important role in mathematics achievement (see, e.g., [3,23,27,32,33,34,43,45]).
Among other influencing factors, the following are also exposed: attitudes toward mathematics and/or self-confidence with regard to mathematics (see, e.g., [25,27,40,43]), mathematical self-efficacy and student engagement [41], academic self-beliefs [42], learning motivation (see, e.g., [22,25]), learning strategies and/or availability of teaching resources (see, e.g., [22,25]), importance of mathematics [23], teaching style ([31,33]), parent’s profile [33], mathematics class size (see, e.g., [2]), gender (see, e.g., [2,28,32]), and age [32].
In our opinion, the study discipline is also a parameter that should not be neglected when selecting potential influencing factors of mathematical performance. Namely, factors that are relevant for technical, engineering, and other science-oriented studies are not necessarily relevant for students of social sciences and humanities or similar courses of study. In our experience, the first group of students expresses a much higher positive attitude towards mathematics than the second. This is also consistent with the results of Núñez Peña, Suárez-Pellicioni, and Cabré [43], which showed that the students who received good/excellent grades in mathematics were mainly from scientific and technological itineraries, while those who failed had mainly studied the humanistic and social syllabuses.

2.3. Methodology Adopted for Studying the Phenomenon of Mathematics Achievement

A detailed review of the related literature revealed that many researchers used descriptive research methodology. To collect the required data, they used suitable tools (standardised, well-known from the literature, or self-developed). Beside descriptive analyses, collected data have been mostly subjected to independent samples t-test (see, e.g., [25]), analysis of variance (see, e.g., [21,31,37,43]), correlation techniques (see, e.g., [22,27,28,33,45]), or to regression (linear, multiple) analyses (see e.g., [2,3,32,34]). Studies which applied factor analysis (see, e.g., [23,30]), principal component analysis (see, e.g., [36]), discriminant analysis (see, e.g., [2,44]), or mixed-effects models [40] are relatively rare.
Undoubtedly, the results of descriptive research would provide a solid basis for selecting the most effective variables and formulating a hypothesis accordingly [26]. However, the influencing factors are often interdependent variables. Therefore, more sophisticated techniques are needed to study the relationships between them. Definitively, one of them is Structural Equation Modelling (SEM), which enables analysis of relationships between latent and observed variables simultaneously [46]. In an in-depth review of the related literature on mathematics performance, we found only three applications of SEM. Two of them, [8,12], refer to secondary education level in a specific geographical area (Turkey, the city of Konya and its surroundings). The only application of SEM for the analysis of mathematical achievement in higher education was found in [42], where SEM was used to examine the relationships between prior knowledge, academic self-beliefs, and previous study success in predicting the achievement of university students participating in an obligatory mathematics course within a mathematics program.
The literature review allows us to conclude the following:
  • Studies investigating the factors influencing the mathematical performance of social science students are very rare. With regard to the European education environment, only two studies were found, where both were applied to psychology students [43,45].
  • Advanced statistical methods are not used very often. Among all studies that refer to mathematical achievement at the tertiary level of education, we found the only application of SEM in [42]. The results of this study are worthwhile but cannot be directly applied to our case because of the incomparable study discipline (mathematics study program).
These statements provided the fundamental starting points for our research.

3. Research Model Development

It is well established in the literature that mathematical performance is influenced by numerous factors, including psychological, social, biographical, educational, and other factors, which are often not independent of each other and can influence each other. Furthermore, some of the influencing factors are very complex, so it is necessary to divide them into sub-variables and find out how each sub-variable is related to mathematical success [26].
Based on the findings in the literature and the results of our preliminary studies [47], we assume that students’ performances in mathematics are influenced by at least the following dimensions: their attitude towards mathematics (including mathematics anxiety), their engagement in learning activities (including background knowledge), and their attitude towards integrating technology into mathematics education.

3.1. Attitude towards Mathematics and Math Anxiety

Much research has been conducted to examine students’ attitudes towards mathematics, and most authors agree that it plays a vital role in the process of teaching and learning mathematics [30]. Results show that a positive attitude towards mathematics has a significant impact on effective student engagement and participation and will increase students’ success in mathematics (Khoo and Ainley (2005), as cited in [30]). Furthermore, valuing the importance of mathematics was also claimed to have a positive effect on students’ mathematics performances [23]. A positive attitude is also related to students’ self-confidence, which refers to their belief in their cognitive capacity to learn or perform actions to achieve intended results [42]. We believe that those who have confidence in their ability to perform well also expect success in a particular task.
On the contrary, it has been identified that fear of mathematics or mathematics anxiety, educational issues, and values and expectations towards mathematics can be treated as causes of low mathematics achievements among students [23]. Mathematics anxiety (also math anxiety) can be defined as a person’s negative affective reaction to situations involving numbers and mathematical calculations in both academic and daily-life situations [48]. Math anxiety, being considered to have an attitudinal component, is also considered to be one dimension of attitude to mathematics and is considered as one of the severe problems that affects mathematics education (see, e.g., [48,49,50,51,52,53,54]).
The majority of the studies that examine the influence of math anxiety on mathematics performance in higher education report a significant relationship between math anxiety, mathematical thinking, and attitudes towards mathematics. Students with a higher level of math anxiety tended to score lower in their mathematical thinking, their attitudes to mathematics, and, consequently, their performance, and vice versa (see, e.g., [3,27,33,34,43]).
Similar to other types of anxiety, math anxiety is a complex set of multidimensional aspects in the form of cognition, affective, somatic, and behavioural reactions [55]. Due to its complexity, there is no unique and transparent measure of math anxiety. Several researchers have argued that a mathematics anxiety instrument should be bi-dimensional and concise, contrary to the unidimensional multiple-item instruments used in the past (Mahmood and Khatoon (2011), as cited in [56]). A systematic and chronological literature review of available instruments is provided by Zakariya [56]. One of the most extensively used mathematics anxiety instruments is the Mathematics Anxiety Rating Scale—MARS [57]—and its revised version, the Revised Mathematics Anxiety Rating Scale—RMARS [58].

3.2. Engagement in Learning Activities

Linnenbrink and Pintrich [59] divide student engagement in the classroom into three distinct components: behavioural engagement, cognitive engagement, and motivational engagement. Behavioural engagement is observable behaviour seen in the classroom that relates to the efforts students are putting into mathematical tasks and students’ relations to each other and to the teacher in terms of their willingness to seek help, attendance at the classes, etc. Cognitive engagement recognises that a student appearing to work on a mathematics problem is not necessarily indicative of the student fully engaging mental faculties in trying to complete it. Motivational engagement is the personal interest that the student has in the subject, the utility that the student feels the subject brings, and, finally, the general importance of the subject to longer-term goals or desires. All three components of engagement are likely correlated. That is, if students are cognitively and motivationally engaged, they are likely to be behaviourally engaged. The literature suggests (and is supported by empirical evidence) that all three components of students’ engagement are related to outcome measures of learning and achievement (Pajares and Miller (1994), as cited in [41,59]).
However, many authors emphasised the importance of an appropriate mathematical background from secondary school and its influence on success in mathematics at the tertiary level. Studies conducted in various parts of the world documented prior mathematical attainment to be a significant predictor of performance and progress in higher mathematics education [44]. Similarly, a weak mathematical background on entering higher education is reported as one of the fundamental reasons for and predictors of poor student performance [44].
The background knowledge of secondary mathematics is usually measured by achievement in the secondary school leaving qualification. A significant positive correlation has been revealed between students’ grades of the secondary school leaving qualification and their performance in mathematics at the university level (see, e.g., [2,37,40]).
Furthermore, some studies report positive and facilitative effects of prior knowledge on learning (Dochy, Segers, and Buehl (1999), as cited in [42]). The authors revealed that students who were able to operate at a higher cognitive level at the beginning of the course, by applying their knowledge and by solving problems, were more likely to perform better than the students whose prior knowledge consisted mainly of facts and a surface-level understanding of the issue. Moreover, inaccurate prior knowledge and misconceptions within a specific domain can make it difficult for students to understand or learn new information.

3.3. Attitudes towards Involving Technology in Learning Mathematics

Computer-based technologies are now commonplace in the classroom, and the integration of these media into mathematics teaching and learning is supported by government policies in most developed countries [60]. The use of technology for learning mathematics is one of the main issues for leading professionals involved in mathematics education at different levels of education (e.g., ERME—European Society for Research in Mathematics Education; NCTM—National Council of Teachers of Mathematics). A review of recent CERME (Congress of the European Society for Research in Mathematics Education) research is presented in [61]. At the same time, Li and Ma [62] provide a systematic literature review and a comprehensive meta-analysis of the existing empirical evidence on the impact of computer technology on mathematics education.
The literature reports many positive effects of integrating technology into mathematics education. It enables educators to create powerful collaborative learning experiences that support problem solving and flexible thinking. Therefore, the use of technology is seen as a useful tool for promoting mathematics learning [62]. Furthermore, Attard and Holmes [63] recently noted that teachers use technological tools to enhance their awareness of students’ individual learning needs and to promote student-centred pedagogies, leading to greater student engagement with mathematics. On the other hand, the results of [64] suggest that the use of educational technologies generally has a positive effect on mathematics achievement in comparison to traditional methods, where the most remarkable effect has been experienced with the application of computer-assisted instructions. Barkatsas, Kasimatis, and Gialamas [65] reported positive attitudes among students towards learning mathematics with computers, even if they are not confident in using computers or express negative attitudes towards mathematics. They experienced the benefits of technology in learning mathematics, and they aim to improve mathematics performance via the use of technology.
Additionally, Al-Qahtani and Higgins [66] examined the impact of e-learning, blended learning, and classroom learning on students’ achievement to determine the optimal use of technology in teaching. They confirmed a statistically significant difference between the three methods in terms of students’ performance, favouring the blended learning method. The use of new and different technologies in studying a subject can increase students’ enthusiasm and provide them with additional skills. Similarly, the analyses of Lin, Tseng, and Chiang [67] showed that the blended learning experience benefited the students in the experimental group, as it had a positive effect not only on learning outcomes but also on their attitude towards studying mathematics in a blended environment. Moreover, web-based learning systems and electronic materials allow users to repeat exercises and to learn simultaneously. This learning model helps to overcome time and space constraints in the classroom [60]. However, today’s use of ICT coupled with the global crisis being experienced of COVID-19 makes e-learning not only a possible but also a necessary teaching method [68].

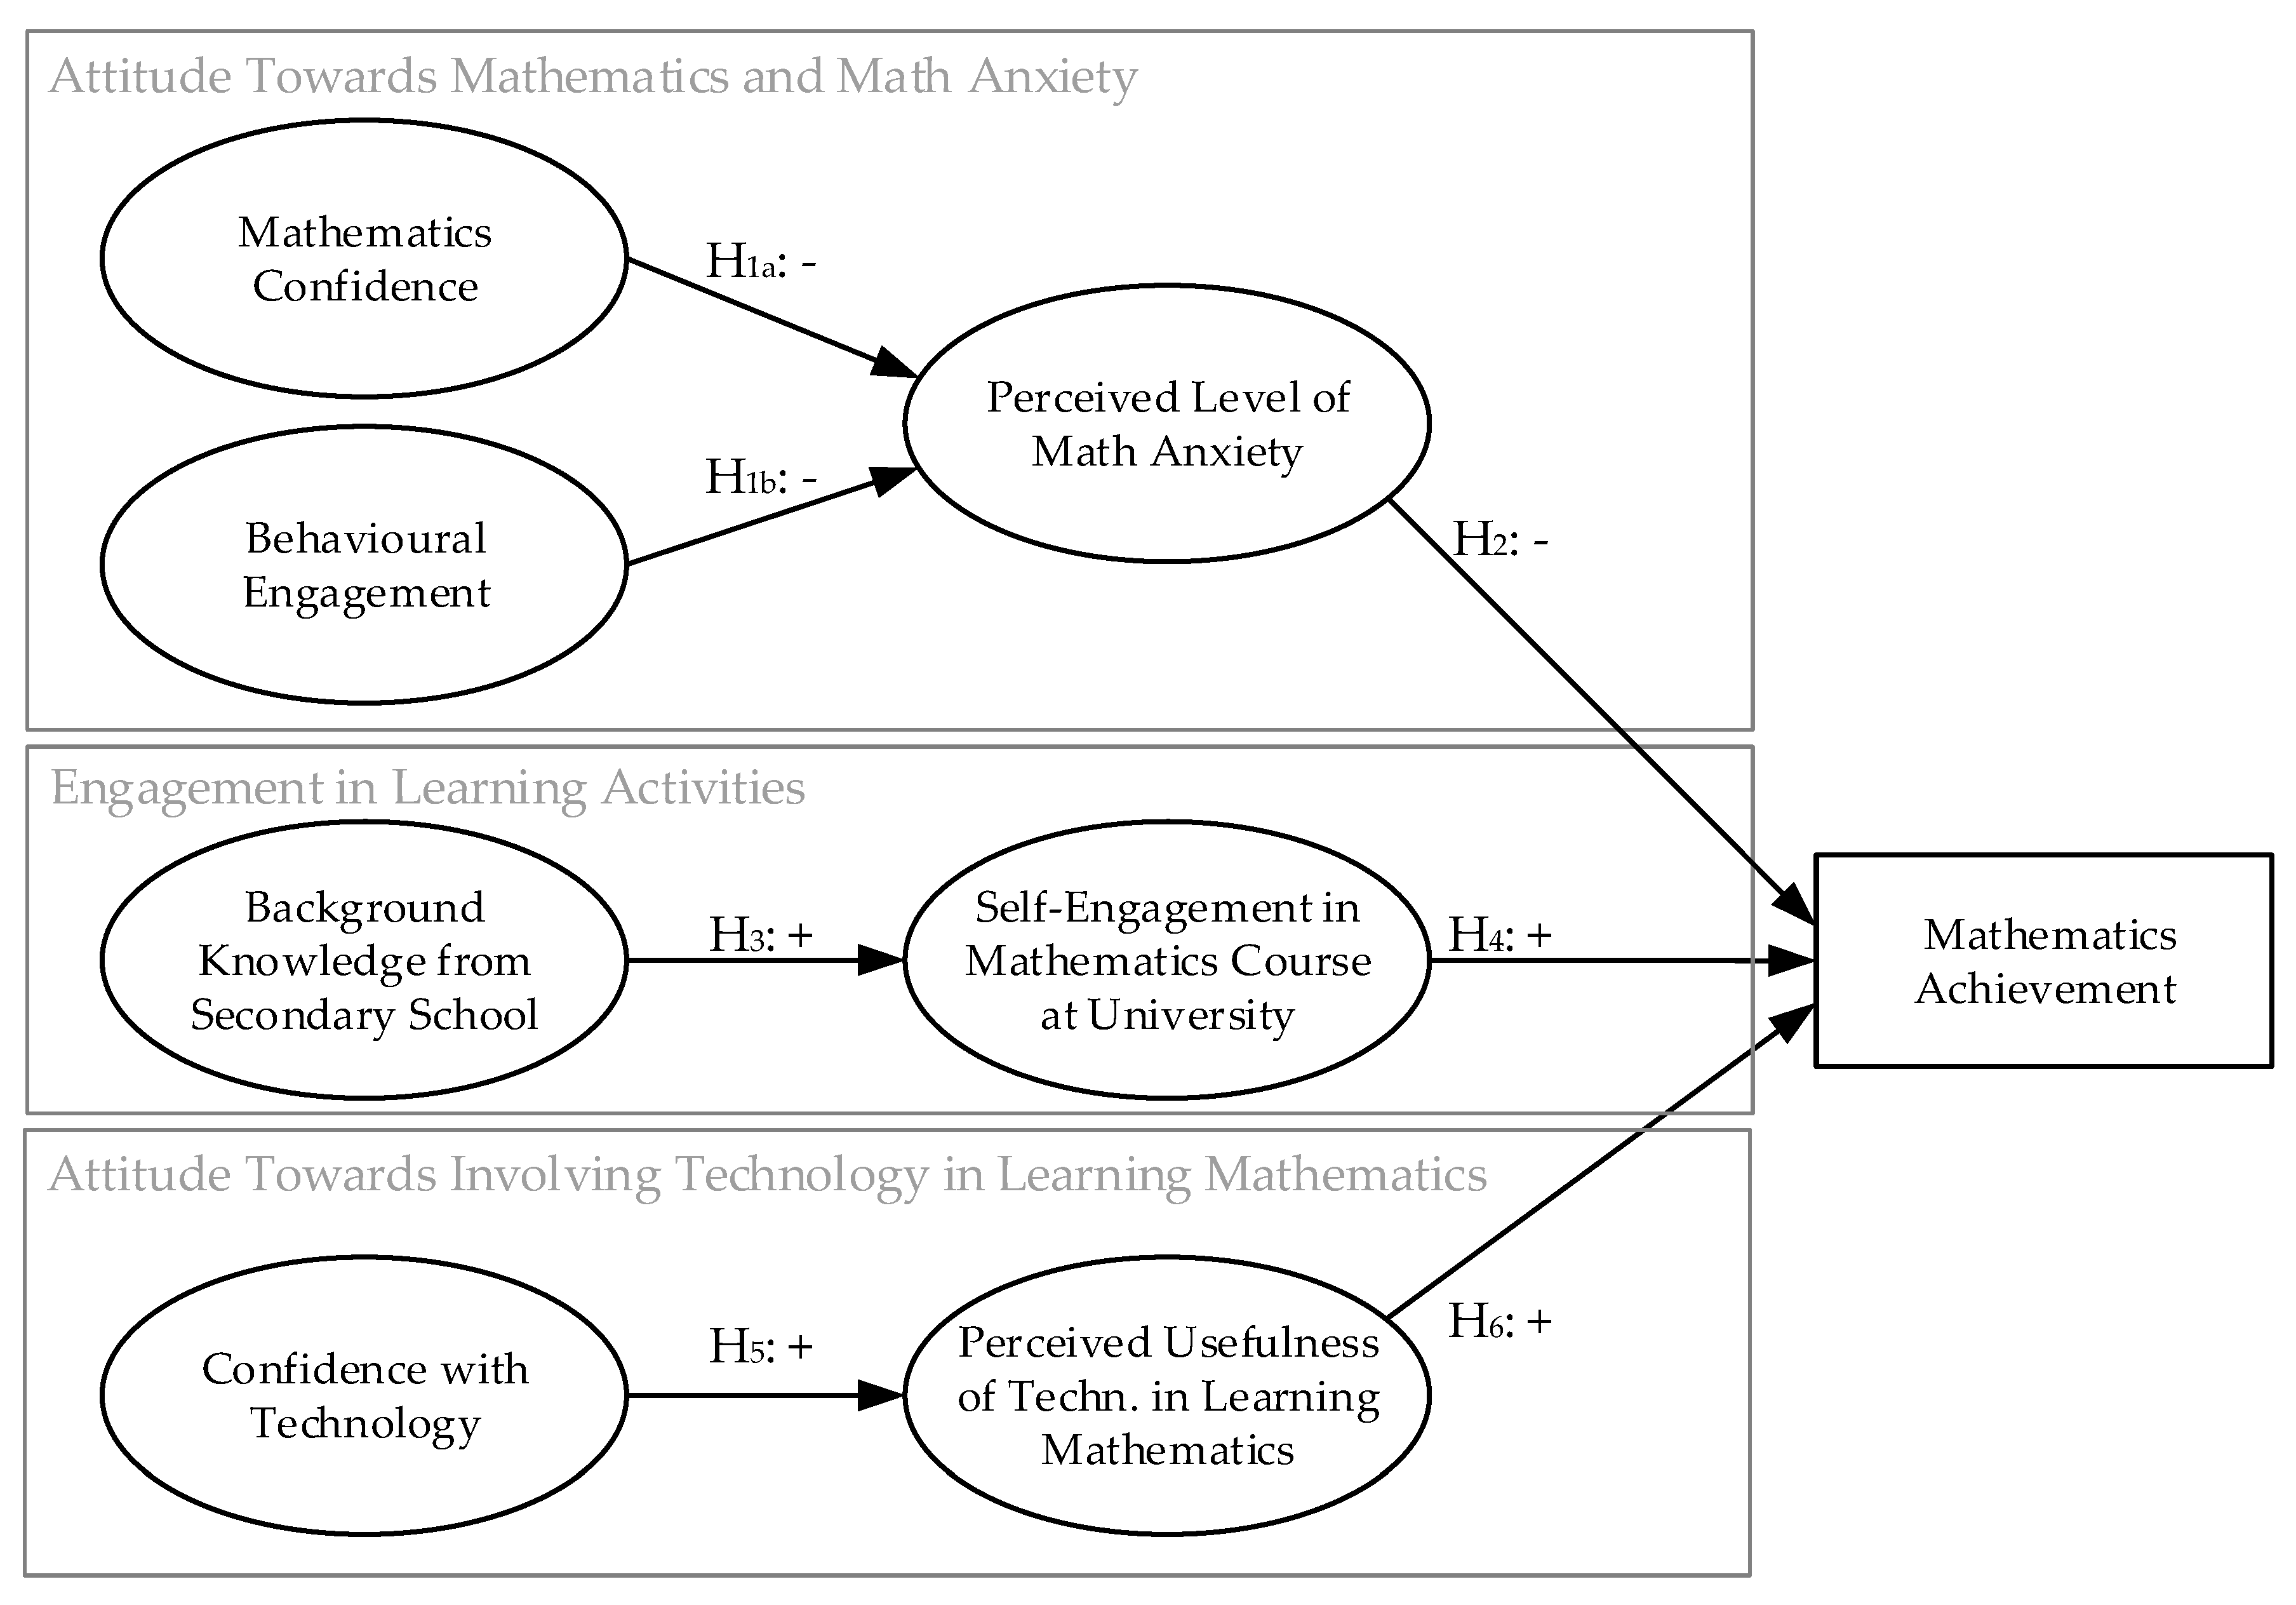
3.4. Conceptual Model and Hypotheses

Arising from the discussion in the previous subsections, we present our conceptual model in Figure 1, and summarise the propose d hypotheses as follows:
H1a: 
Mathematics confidence negatively affects perceived level of math anxiety.
H1b: 
Behavioural engagement negatively affects perceived level of math anxiety.
H2: 
Perceived level of math anxiety negatively affects achievement in mathematics.
H3: 
Background knowledge from secondary school positively affects self-engagement and motivation to fulfil obligations during a mathematics course at university.
H4: 
Self-engagement in a mathematics course at university positively affects achievement in mathematics.
H5: 
Confidence with technology positively affects perceived usefulness of technology in learning mathematics.
H6: 
Perceived usefulness of technology in learning mathematics positively affects achievement in mathematics.

4. Materials and Methods

4.1. Measurement Instruments and Data Collection

For our research, a three-part questionnaire was prepared. The first part served to collect students’ socio-demographic data (gender, age, year of study, and study course) and data on students’ background knowledge in mathematics from secondary school. The second part was designed to measure the level of math anxiety as perceived by students. In the last part, a scale for monitoring students’ attitudes towards mathematics, technology, and towards involving technology in learning mathematics was used. In addition, we provide data on students’ engagement in the university mathematics course and mathematics achievements, which were added to the database.

4.1.1. Measuring Students’ Background Knowledge from Secondary School

Three variables were used to measure students’ Background Knowledge from Secondary School (BKSS):
  • Grade in mathematics in the final year of secondary school—Grades in Slovenia range between 1 (insufficient) and 5 (excellent), and 2 (sufficient) is the lowest passing grade.
  • Grade in mathematics at Matura (i.e., final national school-leaving exam)—There are two types of school-leaving exam in Slovenia: the Matura and the Vocational Matura. The Matura is the Slovene equivalent of the SAT (Scholastic Assessment Test) in the US, enabling candidates with completed general upper secondary education to enrol in all tertiary education programs, i.e., vocational colleges, colleges, and university courses. The Vocational Matura is a national examination for candidates with technical education, enabling them to enrol only in a vocational college. Vocational Matura candidates (among other specified subjects) choose between mathematics and a foreign language, while the Matura requires both. Students’ grades can range from 1 to 8, where a grade above 5 can only be achieved by those who choose to take the Matura at a higher level of difficulty.
  • Final grade in high school—Overall grade for the last year of secondary school ranging from 1 to 5.

4.1.2. Measuring Students’ Level of Math Anxiety

To explore the estimate of the Perceived Level of Math Anxiety (PLMA) among students, we used the reduced version of the Math Anxiety Rating Scale—RMARS [58]—which has been demonstrated to be highly reliable [54]. Baloğlu and Zelhart [69] employed an exploratory factor analysis on a proposed 25-item questionnaire to explore the relationships between items and to identify the underlying factors. Three factors were identified, and five items were omitted from the scale. Therefore, a simplified version of the scale of 20 items was used in our research. This scale evaluates 20 situations which may cause math anxiety, divided into three dimensions:
  • Mathematics Test Anxiety (MTA), which includes 10 items reflecting apprehension about taking a test in mathematics or about receiving the results of mathematics tests;
  • Numerical Task Anxiety (NTA), which includes 5 items reflecting anxiety about executing numerical operations;
  • Mathematics Course Anxiety (MCA), which includes 5 items reflecting anxiety about taking a mathematics course [43,69].
Students were asked to indicate their level of anxiety associated with each item on a 5-point Likert-type scale from 1 (“no anxiety”) to 5 (“high anxiety”).

4.1.3. Measuring Students’ Attitude towards Mathematics, Technology, and Involving Technology in Learning Mathematics

A scale for assessing students’ attitudes towards mathematics, technology, and the learning of mathematics with technology was adjusted from [70]. We used four out of the five constructs identified by the factor analysis for the Mathematics and Technology Attitudes Scale—MTAS—in [70]:
  • Mathematics Confidence (MC), which includes 4 items referring to students’ perception of their ability to attain good results and their assurance that they can handle difficulties in mathematics;
  • Confidence with Technology (CT), which includes 4 items reflecting students’ extent of confidence when working with computers and other commonly available technology;
  • Perceived Usefulness of Technology in Learning Mathematics (PUTLM), which includes 4 items reflecting on the extent to which students consider computers to be relevant in learning mathematics and whether they can contribute to achievements in mathematics;
  • Behaviour Engagement (BE), which includes 4 items reflecting students’ behaviour during mathematics lectures and their involvement in learning assignments.
Students were asked to indicate their level of agreement with each of 16 statements on a 5-point Likert-type scale from 1 (“I do not agree at all”) to 5 (“I agree completely”).

4.1.4. Measuring Students’ Self-Engagement and Achievement in Mathematics Course at University

The Self-Engagement of students in a Mathematics Course at University (SEMCU) was measured by two variables:
  • Additional points for solving mathematical problems—During the course, students were able to voluntarily select problems that were solved individually at home and later presented to the class during tutorials. The texts of mathematical problems were published in advance. At each tutorial, each student could present the solution to one problem. For the correct solution, the student received one point. Each student was able to collect up to 13 additional points in this way;
  • eActivities, which include points earned by activities (e-lessons and quizzes) in Moodle—A quarter of the course and both the lectures and tutorials, were organised as e-lessons in the virtual environment Moodle. Moreover, additional quizzes were prepared to test students’ progress after each completed chapter. Students were required to solve eActivities in order to take the mid-term exams, but there was no minimum requirement. In our data, we used the average percentage of points (variable labelled eActivities) on a scale from 0 to 100%, obtained from e-lessons as a marker of the degree of self-engagement in learning activities in the mathematics course.
Mathematics Achievement (MA) was measured with the percentage of points achieved in the final exam. There are two ways to obtain a final grade in the university mathematics course. Either the student collects at least 50% of the points in three written mid-term exams or the student passes a final written exam (by achieving at least 50% of the points). Additional points, as described in the previous paragraph, are added to the student’s percentage of points obtained in the exam or mid-term exams if they have achieved more than half of the points. In this way, their final grade in the mathematics course can be increased by one grade or, in rare cases, by two grades. The dataset, therefore, contains the value of the variable MA as the percentage of achieved points, regardless of the form of the exam (final or mid-term).

4.2. Data Collection

Data were collected for seven consecutive academic years (from 2013–2014 to 2019–2020) at the beginning of the mathematics course at the Faculty of Organizational Sciences, University of Maribor, Slovenia. All 1st level students were invited to participate in the research. Participation in this research was voluntary. The online questionnaire was distributed to the students via the e-learning environment Moodle. At the end of each academic year, we supplemented the data with the assessment of students’ self-engagement and final achievement at the mathematics course. After that, the data were anonymised.
All subjects gave their informed consent for inclusion before they participated in the study. The study was conducted in accordance with the Declaration of Helsinki, and the protocol was approved by the Ethics Committee for Research in Organizational Sciences (514-3/2020/3/902-DJ).

4.3. Statistical Methods

Data were analysed using the two-stage approach to the structural equation modelling (SEM) approach (see, e.g., [71,72,73]). Analyses were performed using R-package lavaan [74,75,76] and e1071 [77] for assessing univariate normality.
The standard estimation method in SEM, maximum likelihood, assumes multivariate normality. Tests designed to detect violations of multivariate normality, including Mardia’s test, have limited usefulness, since small deviations from normality in large samples could be denoted as significant [73]. Therefore, multivariate normality was assessed by examining univariate frequency distributions, including histograms, skewness, and kurtosis, and values for skewness and kurtosis between −2 and +2 are considered acceptable in order to prove normal univariate distribution [78].
The first step of SEM involves validation of the measurement model. A confirmatory factor analysis (CFA) was used to validate the measurement instrument in order to determine how well the measured items reflect the theoretical latent variables. A construct validity was investigated in order to determine how well a set of measured items actually reflects the corresponding theoretical latent variable. To assess construct validity, convergent validity and discriminant validity were examined. As suggested in [79,80], convergent validity was examined by:
  • Estimates of standardised factor loadings, which should exceed 0.5 (or even 0.7).
  • Composite reliability (CR) for each latent variable, which should exceed 0.7.
  • Average variance extracted (AVE) for each latent variable, which should exceed 0.5.
In the second step of the data analysis, SEM was used to test the structural relationships among the latent variables. The results of SEM are presented with the values of the standardised path coefficient β together with its z-values and denoted the significance level. For each of the endogenous latent variables, a coefficient of determination (R2) was also calculated, which shows the percentage of the explained variance by the set of variable predictors.

5. Results

5.1. Sample Characteristics

In total, 347 students collaborated in the study. Among them, 45.8% were men, while 54.2% were women. The average age of participants was 21.2 years (with a standard deviation of 1.74 years), ranging from 18 to 32 years.

5.2. Descriptive Statistics

Background Knowledge from Secondary School.
We analysed the respondents’ graduation grades from secondary school. The results showed that 9.5% of the respondents completed secondary school with a grade 2 (sufficient), more than half (50.7%) of them achieved a grade 3 (good), 32.9% a grade 4 (very good), and 6.9% a grade 5 (excellent).
In addition, we checked their grades in a mathematics course in the last (fourth) year of secondary school. It turned out that 26.2% of the respondents achieved a grade 2 (sufficient), 41.2% a grade 3 (good), 25.6% a grade 4 (very good), and 6.9% a grade 5 (excellent). The average grade in mathematics in the last year of secondary school was 3.1, with a standard deviation of 0.88.
Finally, we examined the mathematics achievement at the secondary school leaving exam Matura. Only 83.6% of the respondents took mathematics at the Matura or Vocational Matura. Among them, 26.2% received a grade 2 (sufficient), 35.5% a grade 3 (good), 30.7% a grade 4 (very good), and 7.5% a grade 5 or higher (excellent). The average grade in mathematics at the Matura examinations was 3.2, with a standard deviation of 0.92.
The highest absolute values of skewness for three variables describing background knowledge were 0.35 and 0.72 for skewness and kurtosis, respectively, indicating fairly normally distributed variables [78].

5.2.1. Attitude towards Mathematics and Math Anxiety

Descriptive statistics for items related to students’ attitude towards mathematics and math anxiety are presented in Table 1. First, eight statements related to students’ attitude towards mathematics (represented by constructs MC and BE, which were adjusted from MTAS) are listed. On average, the students agreed most with the statement “I am confident that I can overcome difficulties in math problems” (M = 3.95) and least with the statement “I am confident in my skills at mathematics” (M = 3.19). The lowest anxiety was assessed for RMARS items from the NTA construct, where the lowest average value belongs to the statement “Being given a set of subtraction problems to solve” (M = 1.54). Respondents perceived the highest level of anxiety when “Being given a ‘pop’ quiz in a math class” (M = 3.80). Values of skewness were in the range from −0.81 to 1.55 and values of kurtosis ranged from −0.91 to 1.70, indicating a normal univariate distributions [78].

5.2.2. Attitude towards Involving Technology in Learning Mathematics

Table 2 presents descriptive statistics for eight statements related to students’ attitude towards involving technology in learning mathematics (represented by the constructs CT and PUTLM from MTAS). On average, the lowest agreement was expressed with the statement “It is more fun to learn mathematics if we are using a computer” (M = 3.20), while the highest average value belongs to the statement “I can use DVDs, MP3s, and mobile phones well” (M = 4.27). The highest absolute values of skewness and kurtosis were 0.93 and 0.91, respectively, and were considered acceptable in order to demonstrate a normal univariate distributions [78].

5.2.3. Self-Engagement and Achievement in Mathematics Course at University

More than a quarter of the respondents (28.5%) did not take the opportunity of additional points, while a quarter of the respondents received eight additional points or more. The overall average number of additional points earned was 4.6, with a standard deviation of 4.25. If we consider only those who solved at least one problem given additionally, the average value of additional points is 6.4 (SD = 3.70). The values of skewness and kurtosis were 0.55 and −0.95, respectively. In the left panel of Figure 2, the histogram and boxplot of additional points earned (without zeroes) are presented.
The respondents collected between 25 and 99.2 points from eActivities (e-lessons and quizzes in Moodle), with an average of 73.9 and a standard deviation of 11.83 points. Half of the respondents earned, on average, between 65.7 and 82.6 points (middle panel in Figure 2). The values of skewness and kurtosis were −0.94 and 0.92, respectively.
Mathematics achievement is measured as the percentage of points in the final examination and can range from 0 to 113 points (with additional points). Five respondents received zero points, while the highest score was 109.7 points. The average score was 66.4, with a standard deviation of 22.86 points. A quarter of the respondents received 58.0 points or less, while the quarter of the most successful respondents received at least 82.7 points (right panel in Figure 2). The values of skewness and kurtosis were 0.55 and −0.95, respectively.

5.3. Construct Validity of the Measurement Model

CFA was used to evaluate the measurement model. Construct validity was examined through evaluation of convergent validity and discriminant validity. First, the standardised factor loadings were examined. Five measured items were sequentially omitted from the model due to factor loadings bellow 0.5: MTA8: λ = 0.287; MCA1: λ = 0.428; BE1: λ = 0.469; BE2: λ = 0.432; and NTA1: λ = 0.494.
The unstandardised and standardised factor loadings of the final measurement model, together with corresponding z-values for each measured item, are presented in Table 3. It can be seen that all standardised factor loadings exceed a threshold of 0.5 for convergent validity, while 78% of values exceed even the threshold of 0.7.
The values of CR and AVE for all latent variables of the final measurement model are presented in Table 4. The CR values of each latent variable easily fulfil the criterion CR > 0.7, except for SEMCU being equal to 0.601. AVE values for all nine latent variables are above the desired threshold of 0.5. According to the obtained results, the convergent validity for the set of latent variables and corresponding items in the measurement model can be confirmed. Therefore, all measured items included in the final model are significantly related to the corresponding latent variable.
To assess the discriminant validity of the measurement model, the square root of the AVE of each latent variable is compared to the correlations between the latent variables. The correlations among the latent variables are given in the right panel of Table 4, while on the diagonal, the values of the square root of AVE are presented. The values of the square root of AVE for the corresponding latent variables are all greater than the inter-variable correlations. This indicates that the discriminant validity can be determined for all latent variables.
The overall fit of the measurement model was assessed based on a set of commonly used fit indices. Since χ2 statistics itself is sensitive to the sample size, the ratio of χ2 to the degrees of freedom (df) was used. An obtained ratio lower than 3 (χ2/df = 2.27, χ2 = 1294.9, df = 570) indicates an acceptable fit [81]. The value of the comparative fit index (CFI) is above 0.9 (CFI = 0.908) and, hence, according to [80], indicates an adequate model fit. The root mean square error of approximation (RMSEA) of our measurement model is equal to 0.06, and the upper bound of RMSEA 90% confidence interval (0.061, 0.065) is below 0.08, as suggested by [82].

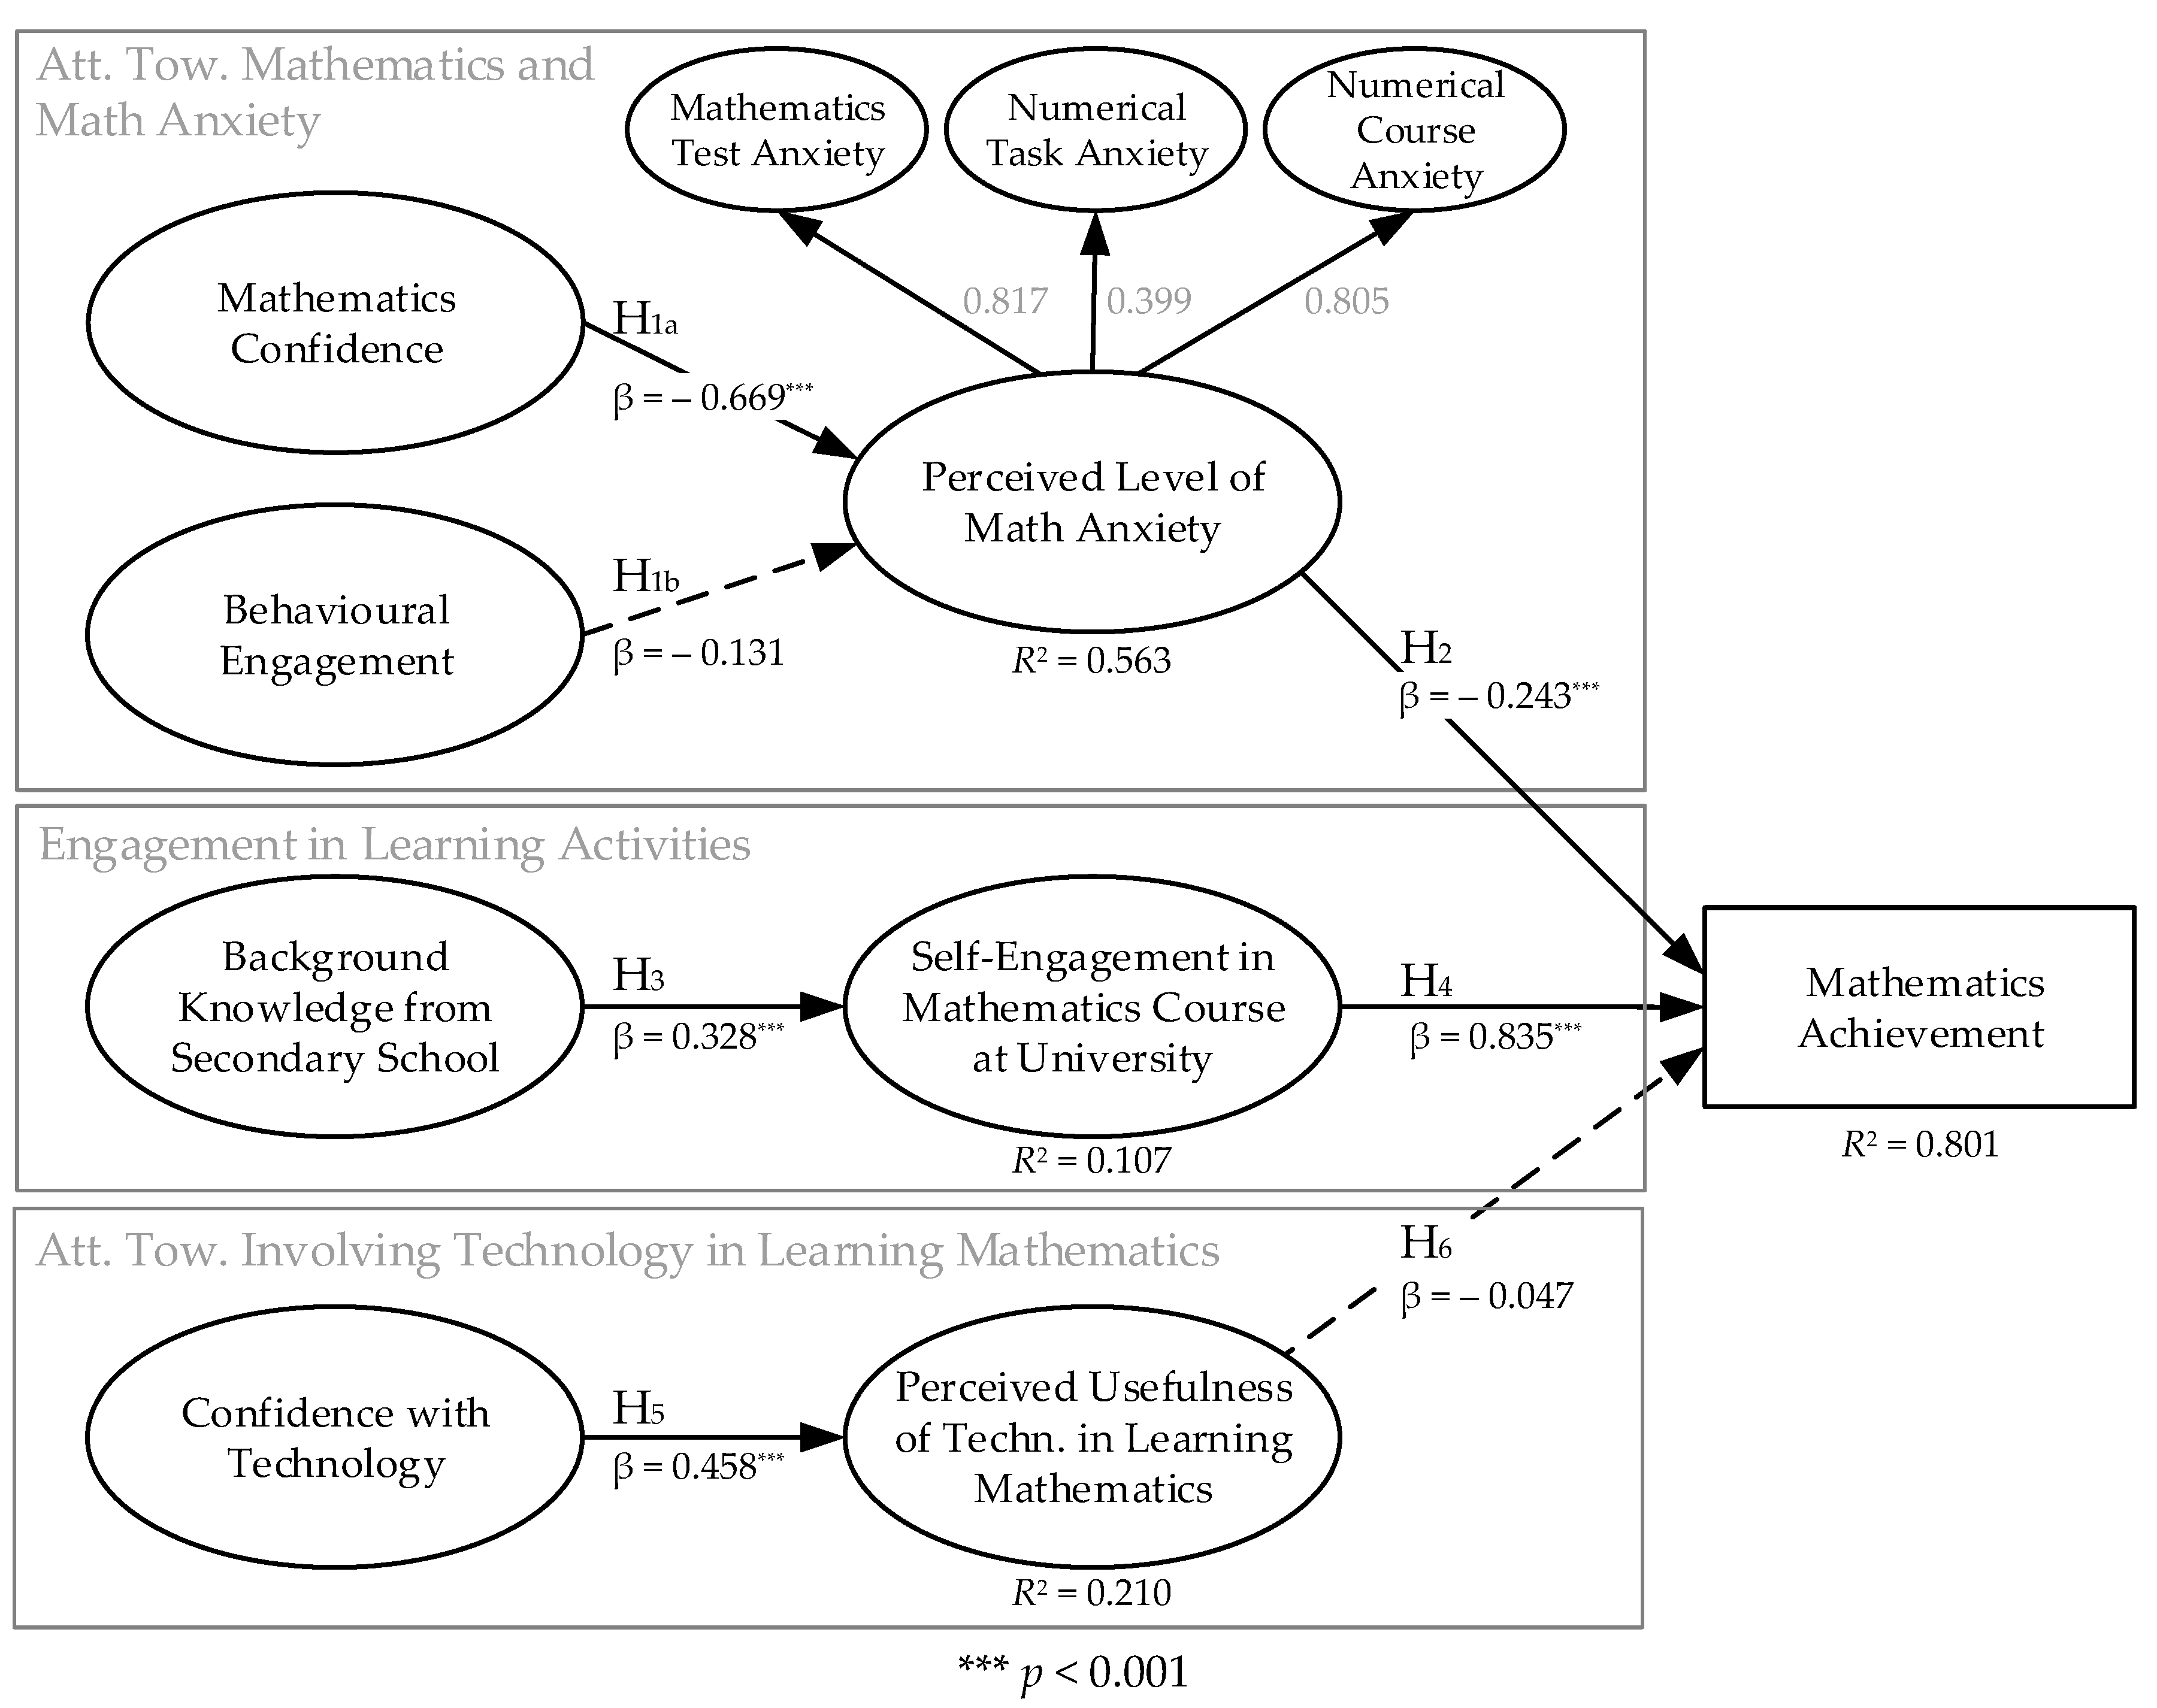
5.4. Evaluation of the Structural Model and Hypotheses Testing

SEM was used to test the predicted relationships (as shown in Figure 1) among the constructs of our model.
First, the goodness of fit of the structural equation model was evaluated. The results show that the model has a good fit according to the following indices: χ2/df = 2.37 (χ2 = 1458.0, df = 614), CFI = 0.897, and RMSEA = 0.063 with its 90% confidence interval (0.059, 0.067).
Second, the structural paths were evaluated. The results are presented in Table 5 and Figure 3. The values of the standardised path coefficient β and corresponding z-values are listed. Each path coefficient β is interpreted in terms of magnitude and statistical significance. For each endogenous latent variable, the coefficient of determination (R2) was calculated. The results are shown in Figure 3. For the second-ordered factor PLMA, the loadings to the three first-ordered factors are written in grey in Figure 3.
Based on the values of the standardised path coefficients and corresponding z-values, each of the proposed research hypotheses in Section 3.4 is either supported or rejected. A summary of the hypotheses testing is given in Table 5, which shows that 5 out of 7 hypotheses were supported. The predictive capability of the proposed model is satisfactory because all values of R2 are higher than 0.1 (suggested by Falk and Miller (1992), as cited in [83]), while the coefficient of determination R2 for Mathematics Achievement is extremely high since it equals 0.801.
The results confirmed that hypothesis H1a could be supported at a 0.1% significance level (H1a: β = −0.669, z = −6.667), while hypothesis H1b could not be supported (H1b: β = −0.131, z = −1.824) at a 5% significance level. The hypotheses from H2 to H5 were all supported at a significance level of 0.1% (H2: β = - 0.243, z = −5.307; H3: β = 0.328, z = 3.781; H4: β = −0.131, z = −1.824; H5: β = −0.131, z = −1.824). Furthermore, the hypothesis H6 could not be supported at a 5% significance level (H6: β = −0.047, z = −1.189). Finally, we found out that PLMA, SEMCU, and PUTLM, together, explain 80.1% of the total variance in MA.

6. Discussion and Conclusions

In this study, relationships among factors influencing social sciences students’ mathematics achievements were examined using Structural Equation Modelling (SEM). The factors considered in the study were divided into three categories:
  • Attitude towards mathematics and math anxiety;
  • Engagement in learning activities;
  • Attitude towards involving technology in learning mathematics.
The first category included three main variables: mathematics confidence, behavioural engagement, and perceived level of math anxiety. Since negative attitudes toward mathematics and the negative influence of math anxiety are often identified in the literature as important predictors of underachievement in mathematics, we assumed that both mathematics confidence and behavioural engagement negatively affect the perceived level of math anxiety, which also negatively affects the mathematics achievement. Our assumptions have only been partially confirmed. The results showed a strong negative influence of mathematics confidence on the perceived level of math anxiety (H1a), while the influence of behavioural engagement does not seem to be significant (H1b). It was also confirmed that the perceived level of math anxiety has a negative effect on mathematics achievement (H2), meaning that a higher level of math anxiety leads to poorer performance in the mathematics exam. This result is consistent with the findings of many authors (see, e.g., [3,27,34,43]). Of the three dimensions of math anxiety considered in our study, the highest factor loading was determined for mathematics test anxiety and numerical task anxiety.
We can presume that finding ways to enhance mathematics confidence and to reduce math anxiety can significantly improve the students’ performance in mathematics, leading to better mathematics exam score. It would, therefore, make sense to focus our further research to this area. The literature suggests several methods and best practices (see, e.g., [54,84]). In our opinion, upgrading the traditional teacher-centred teaching methods with newer, advanced teaching methods (e.g., problem-solving and discovery learning) can strengthen students’ self-confidence in mathematics (see, e.g., [85,86]). According to our experience, E-lessons and quizzes in the online classroom are also well received among the students. Such activities can be used as a trigger to achieve more intensive self-engagement of students during the mathematics course and, consequently, lead to their better achievement in mathematics (proved with H4 in our study). We also think that it is necessary to provide creative learning environments (see, e.g., [87,88]) that will enable the students to experience success in mathematics, support their self-confidence, and develop positive attitudes towards mathematics. Moreover, [45] suggests taking more help from other students, group assignments, study groups, and buddy systems as very beneficial methods for students with high math anxiety. In our opinion, math anxiety can also be reduced by increasing the value of mathematics learning. Lecturers should try to introduce carefully designed activities into the learning process and prepare real-world problems. According to our experiences, such real-world problems are interesting for students and motivate them to understand better the results obtained. This approach is especially important when dealing with students from non-technical or science-oriented disciplines. Namely, some previous research confirmed that math anxiety is more pronounced for students of social sciences and humanities than for students of physical sciences, engineering, and math [49].
Regarding the second category, two variables were taken into account: background knowledge from secondary school and self-engagement in a mathematics course at university. It was confirmed that background knowledge from secondary school positively affects students’ engagement in the university mathematics course (H3). Furthermore, a positive and high-level relationship was found between self-engagement in learning activities at the university and the final achievement in mathematics (H4). These results support previous studies which indicate that incoming skills measured by grades in high school mathematics are among the most significant predictors of students’ success in mathematics and science courses [2,22,37,40,44]. Hence, in order to improve mathematics performance at a higher education level, more attention must be given to the students in secondary school, especially those with weak mathematics results [3].
The third category refers to the students’ attitude toward involving technology in learning mathematics. Many authors claimed that educational technologies provide greater opportunities for creating new learning experiences that engage students and generally positively affect mathematics achievement [35,64]. For learning and doing mathematics, technology in the form of mathematics analysis tools can assist students’ problem solving, support exploration of mathematical concepts, provide dynamically linked representations of ideas, and can encourage general metacognitive abilities, such as planning and checking [70]. However, a positive association between the perceived usefulness of technology in learning mathematics and mathematics achievement was not confirmed in this study (H6), although this variable was confirmed to be positively influenced by the confidence with technology (H5). In our case, the e-learning component accounted only for 25% of the subject’s total scope. Hence, we estimate that this percentage was too low to influence the students’ achievements in mathematics significantly. Since the value of the H6 path coefficient is very low, we assume that a more intensive integration of technology into the pedagogical process could lead to different results.
Summary results showed a very high coefficient of determination for mathematics achievement (0.801), indicating that the variables “Perceived Level of Math Anxiety”, “Self-Engagement in Mathematics Course at University”, and “Perceived Usefulness of Technology in Learning Mathematics”, together, explain 80.1% of the total variance of “Mathematics Achievement”. These results prove that the variables considered in the model are relevant for our study.
If we summarise our findings, we can conclude that mathematics achievements of university students of social sciences depend on the following factors: math anxiety, mathematics confidence, students’ engagement in a mathematics course, and background knowledge from secondary school. This finding, therefore, opens up guidelines for our further research. In our opinion, a great responsibility for improvements lies on university teachers, who must strive to enable students to progress in these segments. However, many studies emphasise the role of secondary school mathematics (see, e.g., [20,37]), which also proved to be important in our study. We agree with the author of [40], who found that teaching in secondary school is a key determinant for the success of university students in mathematics. We believe that secondary school teachers can play an important role in building students’ mathematics self-confidence. In addition, their role in preventing and reducing the level of math anxiety among their students is also essential [43]. Therefore, it is very important to identify the best ways in which secondary school math teachers can help students to achieve better incoming skills and, consequently, higher performance at university. One suggestion given in the literature is to train high school teachers to advocate skilfully for the achievement of students by employing practical mathematics learning activities and by developing an appropriate curriculum and educational programs that are focused on how to engage students in solving mathematics problems [40]. Studies in the future may be emphasised in terms of reducing mathematics anxiety, especially emotional factors, from the early stage at primary or secondary school as a possible preventive measure to reduce the level of the severe mathematical anxiety level. Thus, the finding is hoped to provide some useful information to those involved in improving the mathematics performance in higher-level institutions [3].
However, we agree with Awaludin et al. [23], who believe that all mathematics educators, irrespective of the education level, should play a role in raising students’ awareness about the importance of mathematics in everyday life, their majors, its applications for other courses in their field of expertise, and also future careers. Consequently, this can contribute to better mathematical literacy in the general population, which has received growing attention in the last few decades [89].
In conclusion, it is clear from both the literature review and the results of our study that the factors that contribute to students’ mathematics performance are very complex. Therefore, mathematics performance continues to be an important area of research to support the planning of effective educational programs in mathematics that meet the needs of diverse students and a well-prepared workforce.
Finally, some limitations of our study have to be acknowledged. The first limitation is the population under consideration. The sample cohort was drawn from a single faculty of a single Slovenian university. Consequently, the findings may have limited generalisability to other contexts, nationally and internationally. Replication of the study with a different sample would enable examination of the generalisability of the findings.
The measurement instruments taken from the literature [58,70] were translated from English into Slovenian at the beginning of our research (see Appendix A). It is, therefore, possible that the meaning of a particular questionnaire item was somewhat "blurred" during translation. However, since all respondents answered the same questionnaire, we believe that this fact does not directly affect the results themselves. Nevertheless, a considerable amount of attention is required when we compare our results with the results of research conducted in English (or other) language areas.
Furthermore, the measurement instrument RMARS, which was used to examine math anxiety among the students, is mainly focused on mathematical activities based on numbers and calculations. Therefore, we have not included other areas of mathematics that are not directly related to numbers in our study. In future research, it would be worthwhile to investigate the extent to which such activities generate anxiety to the students.
We are also aware that we have excluded, from our model, some important variables (e.g., achievement motivation and teacher effectiveness) and potential relationships (e.g., background knowledge from secondary school to the perceived level of math anxiety) which may have influenced our results. Further research should address these issues.

Author Contributions

Conceptualization, A.B. and A.Ž.; methodology, A.Ž. and J.J.; data curation, G.R. and A.Ž.; formal analysis, A.Ž., J.J. and G.R.; writing—original draft preparation, A.B., J.J, and A.Ž.; writing—review and editing, A.B., J.J., G.R. and A.Ž. All authors have read and agreed to the published version of the manuscript.

Funding

This research received no external funding.

Acknowledgments

The authors acknowledge the financial support from the Slovenian Research Agency (research core funding No. P5-0018).

Conflicts of Interest

The authors declare no conflict of interest. The funders had no role in the design of the study; in the collection, analyses, or interpretation of data; in the writing of the manuscript, or in the decision to publish the results.

Appendix A

Table A1. Slovenian Translation of the Measurement Instruments.
Original StatementSlovenian Translation
Adopted from Mathematics and Technology Attitudes Scale—
MTAS [70]
Indicate the extent of your agreement with each statement, on a five-point scale from “strongly disagree” (1) to “strongly agree” (5).
Na 5-stopenjski lestvici od “sploh se ne strinjam” (1) do “popolnoma se strinjam” (5), označite, v kolikšni meri se strinjate s posamezno trditvijo.
Math.
Conf.
I have a mathematical mind.Znam logično razmišljati.
I can get good results in mathematics.Dosežem lahko dober rezultat pri matematiki.
I know I can handle difficulties in mathematics.Vem, da lahko premagam težave pri matematiki.
I am confident with mathematics.Samozavesten sem glede matematike.
Behav.
Engag.
I concentrate hard in mathematics.Močno sem osredotočen na matematiko.
I try to answer questions the teacher asks.Poskušam odgovoriti na vprašanja, ki jih pri matematiki zastavi učitelj.
If I make mistakes, I work until I have corrected them.Če pri matematiki napravim napako, bom delal, dokler je ne odpravim.
If I cannot do a problem, I keep trying different ideas.Če pri matematiki ne znam rešiti problema, poskušam z novimi idejami.
Conf.
with
Techn.
I am good at using computers.Dober sem pri uporabi računalnikov.
I am good at using things like VCRs, DVDs, MP3s and mobile phones.Dober sem pri uporabi DVD-jev, MP3-jev in mobilnih telefonov.
I can fix a lot of computer problems.Odpraviti znam večino težav, povezanih z računalniki.
I can master any computer program needed for school.Obvladam vse programe, ki jih potrebujemo za študij.
Perc.
Usef. of
Techn. in
Learn.
Math.
I like using computers for mathematics.Pri učenju matematike rad uporabljam računalnik.
Using computers in mathematics is worth the extra effort.Uporaba računalnika pri učenju matematike je vredna dodatnega truda.
Mathematics is more interesting when using computers.Učenje matematike je bolj zanimivo, če uporabljam računalnik.
Computers help me learn mathematics better.Računalnik mi pomaga, da se matematiko bolje naučim
Adopted from Revised Mathematics Anxiety Rating Scale—
RMARS [58]
Indicate your level of anxiety in the following situations. There are no right or wrong answers. Do not spend too much time on any one statement but give the answer (on a five-point scale) which seems to describe how you generally feel:
“Not at all” (1), “A little” (2), “A fair amount” (3), “Much” (4), “Very much” (5).
Ocenite stopnjo nelagodja, ki ga občutite v spodaj navedenih situacijah. Upoštevajte, da ni pravilnih ali napačnih odgovorov. Pri izjavah se ne zadržujte predolgo, ampak na 5-stopenjski lestvici od “nelagodja sploh ne občutim“ (1) do “počutim se skrajno nelagodno“ (5), preprosto označite odgovor, ki najbolje opisuje vaše počutje v opisani situaciji.
Math.
Test
Anx.
Studying for a math test.Učim se za izpit iz matematike.
Taking the math section of the college entrance exam.Pišem maturo iz matematike.
Taking an exam (quiz) in a math course.Pišem kolokvij pri matematiki.
Taking an exam (final) in a math course.Opravljam izpit pri matematiki.
Thinking about an upcoming math test one week before.Razmišljam o matematičnem izpitu, ki bo čez en teden.
Thinking about an upcoming math test one day before.Razmišljam o matematičnem izpitu, ki bo naslednji dan.
Thinking about an upcoming math test one hour before.Razmišljam o matematičnem izpitu, ki bo čez eno uro.
Realising you have to take a certain number of math classes to fulfil requirements.Ugotovim, da bo za izpolnitev zahtevanih pogojev pri matematiki potrebno prisostvovati določenemu številu matematičnih predavanj.
Receiving your final math grade in the mail.Izvem rezultate o končni oceni pri matematiki.
Being given a “pop” quiz in a math class.Dobim nenapovedani test pri matematiki.
Num.
Task
Anx.
Reading a cash register receipt after your purchase.Preverjam pravilnost računa po opravljenem nakupu.
Being given a set of numerical problems involving addition to solve on paper.V reševanje sem dobil nalogo, kjer se zahteva seštevanje števil.
Being given a set of subtraction problems to solve.V reševanje sem dobil nalogo, kjer se zahteva odštevanje števil.
Being given a set of multiplication problems to solve.V reševanje sem dobil nalogo, kjer se zahteva množenje števil.
Being given a set of division problems to solve.V reševanje sem dobil nalogo, kjer se zahteva deljenje števil.
Math.
Course
Anx.
Buying a math textbook.Kupujem matematični učbenik.
Watching a teacher work on an algebraic equation on the blackboard.Gledam profesorja, ki rešuje enačbe na tablo.
Signing up for a math course.Prijavljam se na izbirni predmet, ki vsebuje veliko matematičnih vsebin.
Listening to another student explain a mathematical formula.Poslušam sošolca, ki razlaga matematično formulo.
Walking into a math class.Vstopam v matematično učilnico.

References

  1. Carey, E.; Hill, F.; Devine, A.; Szűcs, D. The Modified Abbreviated Math Anxiety Scale: A Valid and Reliable Instrument for Use with Children. Front. Psychol. 2017, 8. [Google Scholar] [CrossRef] [PubMed] [Green Version]
  2. Eng, T.H.; Li, V.L.; Julaihi, N.H. The Relationships Between Students’ Underachievement in Mathematics Courses and Influencing Factors. Procedia Soc. Behav. Sci. 2010, 8, 134–141. [Google Scholar] [CrossRef] [Green Version]
  3. Wahid, S.N.S.; Yusof, Y.; Razak, M.R. Math anxiety among students in higher education level. Procedia Soc. Behav. Sci. 2014, 123, 232–237. [Google Scholar] [CrossRef] [Green Version]
  4. Patterson, M.; Perry, E.; Decker, C.; Eckert, R.; Klaus, S.; Wendling, L.; Papanastasiou, E. Factors associated with high school mathematics performance in the United States. Stud. Educ. Eval. 2003, 29, 91–108. [Google Scholar] [CrossRef]
  5. Ramírez, M. Attitudes toward mathematics and academic performance among Chilean 8th grades. Estud. Pedagógicos Valdivia 2005, 31. [Google Scholar] [CrossRef]
  6. Maree, K.; Aldous, C.; Hattingh, A.; Swanepoel, A.; Linde, M.V. Predictors of learner performance in mathematics and science according to a large-scale study in Mpumalanga. S. Afr. J. Educ. 2006, 26, 229–252. [Google Scholar] [CrossRef]
  7. Prakitipong, N.; Nakamura, S. Analysis of mathematics performance of grade five students in Thailand using Newman procedure. J. Int. Coop. Educ. 2006, 9, 111–122. [Google Scholar]
  8. Yavuz, M. Factors that Affect Mathematics-Science (MS) Scores in the Secondary Education Institutional Exam: An Application of Structural Equation Modeling. Educ. Sci. Theory Pract. 2009, 9, 1557–1572. [Google Scholar]
  9. Demir, I.; Kilic, S.; Depren, O. Factors Affecting Turkish Students’ Achievement in Mathematics. Online Submiss. 2009, 6, 47–53. [Google Scholar]
  10. Lye, C.; Ng, L.; Hassan, M.D.; Goh, W.; Law, C.; Ismail, N. Predicting Pre-university Student’s Mathematics Achievement. Procedia Soc. Behav. Sci. 2010, 8, 299–306. [Google Scholar] [CrossRef] [Green Version]
  11. Taniguchi, K.; Ohashi, K.; Hirakawa, Y. Analysis of Student’s Mathematical Achievement in Grades 3 and 6 in Uganda: Factors Affecting Test Scores and Curriculum Performance. Procedia Soc. Behav. Sci. 2013, 93, 2058–2062. [Google Scholar] [CrossRef] [Green Version]
  12. Yurt, E.; Sünbül, A.M. A Structural Equation Model Explaining 8th Grade Students’ Mathematics Achievements. Educ. Sci. Theory Pract. 2014, 14, 1642–1652. [Google Scholar] [CrossRef]
  13. Tosto, M.G.; Asbury, K.; Mazzocco, M.M.M.; Petrill, S.A.; Kovas, Y. From classroom environment to mathematics achievement: The mediating role of self-perceived ability and subject interest. Learn. Individ. Differ. 2016, 50, 260–269. [Google Scholar] [CrossRef] [Green Version]
  14. Pipere, A.; Mierina, I. Exploring non-cognitive predictors of mathematics achievement among 9th grade students. Learn. Individ. Differ. 2017, 59, 65–77. [Google Scholar] [CrossRef]
  15. Andamon, J.C.; Tan, D.A. Conceptual Understanding, Attitude And Performance In Mathematics Of Grade 7 Students. Int. J. Sci. Technol. Res. 2018, 7, 96–105. [Google Scholar]
  16. Recber, S.; Isiksal, M.; Koc, Y. Investigating Self-Efficacy, Anxiety, Attitudes and Mathematics Achievement Regarding Gender and School Type. An. Psicol. Ann. Psychol. 2018, 34, 41–51. [Google Scholar] [CrossRef] [Green Version]
  17. Poorghorban, M.; Jabbari, S.; Chamandar, F. Mathematics Performance of the Primary School Students: Attention and Shifting. J. Educ. Learn. 2018, 7, 117–124. [Google Scholar] [CrossRef]
  18. Peteros, E.; Gamboa, A.; Etcuban, J.; Dinauanao, A.; Sitoy, R.; Arcadio, R. Factors Affecting Mathematics Performance of Junior High School Students. Int. Electron. J. Math. Educ. 2019, 15, 62–83. [Google Scholar] [CrossRef] [Green Version]
  19. Rodríguez, S.; Regueiro, B.; Piñeiro, I.; Valle, A.; Sánchez, B.; Vieites, T.; Rodríguez-Llorente, C. Success in Mathematics and Academic Wellbeing in Primary-School Students. Sustainability 2020, 12, 3796. [Google Scholar] [CrossRef]
  20. Nicholas, J.; Poladian, L.; Mack, J.; Wilson, R. Mathematics preparation for university: Entry, pathways and impact on performance in first year science and mathematics subjects. Int. J. Innov. Sci. Math. Educ. Former. CAL Laborate Int. 2015, 23, 37–51. [Google Scholar]
  21. Joyce, C.; Hine, G.; Anderton, R. The association between secondary mathematics and first year university performance in health sciences. Issues Educ. Res. 2017, 27, 770–783. [Google Scholar]
  22. Gradwohl, J.; Eichler, A. Predictors of Performance in Engineering Mathematics; INDRUM Network; University of Agder: Kristiansand, Norway, 2018. [Google Scholar]
  23. Awaludin, I.S.; Ab Razak, R.; Azliana Aridi, N.; Selamat, Z. Causes of Low Mathematics Achievements in a Private University. J. Comput. Sci. Comput. Math. 2015, 21–26. [Google Scholar] [CrossRef]
  24. Papanastasiou, C. Internal and external factors affecting achievement in mathematics: Some findings from TIMSS. Stud. Educ. Eval. 2000, 26, 1–7. [Google Scholar] [CrossRef]
  25. Enu, J.; Agyman, O.; Nkum, D. Factors influencing Students’ Mathematics Performance in some selected Colleges of Education in Ghana. Int. J. Educ. Learn. Dev. 2015, 3, 68–74. [Google Scholar]
  26. Kushwaha, S.S. Trend in Researches on Mathematics Achievement. IOSR J. Res. Method Educ. IOSRJRME 2014, 4, 53–62. [Google Scholar] [CrossRef]
  27. Kargar, M.; Tarmizi, R.A.; Bayat, S. Relationship between Mathematical Thinking, Mathematics Anxiety and Mathematics Attitudes among University Students. Procedia Soc. Behav. Sci. 2010, 8, 537–542. [Google Scholar] [CrossRef] [Green Version]
  28. Mohd, N.; Tengku Mahmood, T.F.P.; Mahmood, T.; Ismail, M.N. Factors that influence students in mathematics achievement. Int. J. Acad. Res. 2011, 3, 49–54. [Google Scholar]
  29. Al-Agili, M.Z.G.; Mamat, M.; Abdullah, L.; Maad, H.A. The Factors Influence Students’ Achievement in Mathematics: A Case for Libyan’s Students. World Appl. Sci. J. 2012, 17, 1224–1230. [Google Scholar]
  30. Atan, M.; Kasmin, F. Assessing Mathematics’ Attitude among Technical University Students. Int. J. Acad. Res. Bus. Soc. Sci. 2018, 7, 103–115. [Google Scholar] [CrossRef]
  31. Kazemi, F.; Ghoraishi, M. Comparison of Problem-Based Learning Approach and Traditional Teaching on Attitude, Misconceptions and Mathematics Performance of University Students. Procedia Soc. Behav. Sci. 2012, 46, 3852–3856. [Google Scholar] [CrossRef] [Green Version]
  32. Josiah, O.; Olubunmi Adejoke, E. Effect of Gender, Age and Mathematics Anxiety on College Students’ Achievement in Algebra. Am. J. Educ. Res. 2014, 2, 474–476. [Google Scholar] [CrossRef] [Green Version]
  33. Dagaylo-AN, M.B.; Tancinco, N.P. Mathematics anxiety and the academic performance of the freshmen college students of the naval state university. Int. J. Eng. Sci. Res. Technol. 2016, 5, 1125–1136. [Google Scholar] [CrossRef]
  34. Manalaysay, E.G. Gender Differences, Mathematics Anxiety, And First-Year College Students’ Mathematical Achievement. Int. J. Sci. Technol. Res. 2019, 8, 25–29. [Google Scholar]
  35. Crawford, K.; Gordon, S.; Nicholas, J.; Prosser, M. University mathematics students’ conceptions of mathematics. Stud. High. Educ. 1998, 23, 87–94. [Google Scholar] [CrossRef]
  36. Whannell, R.; Allen, B. First Year Mathematics at a regional university: Does it cater to student diversity? Int. J. First Year High. Educ. 2012, 3, 45–58. [Google Scholar] [CrossRef]
  37. Anderton, R.; Hine, G.; Joyce, C. Secondary school mathematics and science matters: Academic performance for secondary students transitioning into university allied health and science courses. Int. J. Innov. Sci. Math. Educ. 2017, 25, 34–47. [Google Scholar]
  38. McMillan, J.; Edwards, D. Performance in First Year Mathematics and Science Subjects in Australian Universities: Does Senior Secondary Mathematics Background Matter? Final Report; Australian Council of Deans of Science and Australian Council for Educational Research: Camberwell and Canberra, Australia, 2019. [Google Scholar]
  39. Stepp, S.L. Evaluating High School Mathematics Performance Measures and Student Attributes for Predicting Remedial Mathematics Success and Student Retention in College. Ph.D. Thesis, Marshall University, Huntington, WV, USA, 2016. [Google Scholar]
  40. Khedhiri, S. The determinants of mathematics and statistics achievement in higher education. Mod. Appl. Sci. 2016, 10, 60–69. [Google Scholar] [CrossRef]
  41. Warwick, J. Mathematical self-efficacy and student engagement in the mathematics classroom. MSOR Connect. 2008, 8, 31–37. [Google Scholar] [CrossRef]
  42. Hailikari, T.; Nevgi, A.; Komulainen, E. Academic self-beliefs and prior knowledge as predictors of student achievement in Mathematics: A structural model. Educ. Psychol. 2008, 28, 59–71. [Google Scholar] [CrossRef]
  43. Núñez-Peña, M.; Suarez Pellicioni, M.; Bono, R. Math anxiety effects on student success on higher education. Int. J. Educ. Res. 2013, 58, 36–42. [Google Scholar] [CrossRef] [Green Version]
  44. Faulkner, F.; Hannigan, A.; Fitzmaurice, O. The role of prior mathematical experience in predicting mathematics performance in higher education. Int. J. Math. Educ. Sci. Technol. 2014, 45, 648–667. [Google Scholar] [CrossRef] [Green Version]
  45. Bjälkebring, P. Math Anxiety at the University: What Forms of Teaching and Learning Statistics in Higher Education Can Help Students with Math Anxiety? Front. Educ. 2019, 4. [Google Scholar] [CrossRef]
  46. Teo, T. Factors influencing teachers’ intention to use technology: Model development and test. Comput. Educ. 2011, 57, 2432–2440. [Google Scholar] [CrossRef]
  47. Žnidaršič, A.; Jerebic, J. Vpliv matematičnega predznanja, odnosa do matematike, in ostalih dejavnikov na uspešnost na uspešnost pri izpitu iz matematike. In Proceedings of the 37nd International Conference on Organizational Science Development Ekosistem Organizacij v Dobi Digitalizacije; Univerzitetna založba Univerze Maribor: Maribor, Slovenia, 2018; pp. 1259–1273. [Google Scholar]
  48. Ashcraft, M.H.; Moore, A.M. Mathematics Anxiety and the Affective Drop in Performance. J. Psychoeduc. Assess. 2009, 27, 197–205. [Google Scholar] [CrossRef] [Green Version]
  49. Sheffield, D.; Hunt, T. How Does Anxiety Influence Maths Performance and What Can We do About It? MSOR Connect. 2007, 6, 19–23. [Google Scholar] [CrossRef] [Green Version]
  50. Furner, J.M.; Gonzalez-DeHass, A. How do Students’ Mastery and Performance Goals Relate to Math Anxiety? Eurasia J. Math. Sci. Technol. Educ. 2011, 7, 227–242. [Google Scholar] [CrossRef]
  51. Galla, B.M.; Wood, J.J. Emotional self-efficacy moderates anxiety-related impairments in math performance in elementary school-age youth. Personal. Individ. Differ. 2012, 52, 118–122. [Google Scholar] [CrossRef]
  52. Jansen, B.R.J.; Louwerse, J.; Straatemeier, M.; Van der Ven, S.H.G.; Klinkenberg, S.; Van der Maas, H.L.J. The influence of experiencing success in math on math anxiety, perceived math competence, and math performance. Learn. Individ. Differ. 2013, 24, 190–197. [Google Scholar] [CrossRef]
  53. Johnston-Wilder, S.; Brindley, J.; Dent, P. A Survey of Mathematics Anxiety and Mathematical Resilience among Existing Apprentices; Gatsby Charitable Foundation: London, UK, 2014. [Google Scholar]
  54. Dowker, A.; Sarkar, A.; Looi, C.Y. Mathematics Anxiety: What Have We Learned in 60 Years? Front. Psychol. 2016, 7, 1–16. [Google Scholar] [CrossRef] [Green Version]
  55. Azizah, L.N.; Mahmudi, A.; Retnawati, H. Profile of students’ mathematics anxiety. In Proceedings of the Journal of Physics: Conference Series; IOP Publishing: Yogyakarta, Indonesia, 2019; Volume 1320, p. 012105. [Google Scholar]
  56. Zakariya, Y.F. Development of mathematics anxiety scale: Factor analysis as a determinant of subcategories. J. Pedagog. Res. 2018, 2, 135–144. [Google Scholar]
  57. Richardson, F.C.; Suinn, R.M. The mathematics anxiety rating scale: Psychometric data. J. Couns. Psychol. 1972, 19, 551–554. [Google Scholar] [CrossRef]
  58. Alexander, L.; Martray, C. The Development of an Abbreviated Version of the Mathematics Anxiety Rating Scale. Meas. Eval. Couns. Dev. 1989, 22, 143–150. [Google Scholar] [CrossRef]
  59. Linnenbrink, E.A.; Pintrich, P.R. The role of self-efficacy beliefs in student engagement and learning in the classroom. Read. Writ. Q. 2003, 19, 119–137. [Google Scholar] [CrossRef]
  60. Alday, R.B.; Panaligan, A.B. Reducing math anxiety of ccs students through e-learning in analytic geometry. Educ. Res. Int. 2013, 2, 76–90. [Google Scholar]
  61. Donevska-Todorova, A.; Trgalova, J. Learning mathematics with technology. A review of recent CERME research. In Proceedings of the CERME 10, Dublin, Ireland, 1–5 February 2017. [Google Scholar]
  62. Li, Q.; Ma, X. A Meta-analysis of the Effects of Computer Technology on School Students’ Mathematics Learning. Educ. Psychol. Rev. 2010, 22, 215–243. [Google Scholar] [CrossRef]
  63. Attard, C.; Holmes, K. “It gives you that sense of hope”: An exploration of technology use to mediate student engagement with mathematics. Heliyon 2020, 6, e02945. [Google Scholar] [CrossRef] [PubMed]
  64. Cheung, A.C.K.; Slavin, R.E. The effectiveness of educational technology applications for enhancing mathematics achievement in K-12 classrooms: A meta-analysis. Educ. Res. Rev. 2013, 9, 88–113. [Google Scholar] [CrossRef]
  65. Barkatsas, A.; Kasimatis, K.; Gialamas, V. Learning secondary mathematics with technology: Exploring the complex interrelationship between students’ attitudes, engagement, gender and achievement. Comput. Educ. 2009, 52, 562–570. [Google Scholar] [CrossRef]
  66. Al-Qahtani, A.A.Y.; Higgins, S.E. Effects of traditional, blended and e-learning on students’ achievement in higher education. J. Comput. Assist. Learn. 2013, 29, 220–234. [Google Scholar] [CrossRef] [Green Version]
  67. Lin, Y.; Tseng, C.; Chiang, P. The Effect of Blended Learning in Mathematics Course. EURASIA J. Math. Sci. Technol. Educ. 2016, 13, 741–770. [Google Scholar] [CrossRef]
  68. Moreno-Guerrero, A.; Aznar-Díaz, I.; Cáceres-Reche, P.; Alonso-García, S. E-Learning in the Teaching of Mathematics: An Educational Experience in Adult High School. Mathematics 2020, 8, 840. [Google Scholar] [CrossRef]
  69. Baloğlu, M.; Zelhart, P.F. Psychometric properties of the revised mathematics anxiety rating scale. Psychol. Rec. 2007, 57, 593–611. [Google Scholar] [CrossRef]
  70. Pierce, R.; Stacey, K.; Barkatsas, A. A scale for monitoring students’ attitudes to learning mathematics with technology. Comput. Educ. 2007, 48, 285–300. [Google Scholar] [CrossRef] [Green Version]
  71. Kline, R.B. Convergence of Structural Equation Modeling and Multilevel Modeling. In The SAGE Handbook of Innovation in Social Research Methods; Sage Publications: Thousand Oaks, CA, USA, 2011; pp. 562–589. [Google Scholar]
  72. Schumacker, R.E.; Lomax, R.G. A Beginner’s Guide to Structural Equation Modeling, 3rd ed.; Taylor Francis Group: New York, NY, USA, 2010. [Google Scholar]
  73. Kline, R.B. Principles and Practice of Structural Equation Modeling; Guilford Publications: New York, NY, USA, 2016. [Google Scholar]
  74. Rosseel, Y. Lavaan: An R package for structural equation modeling and more. Version 0.5–12 (BETA). J. Stat. Softw. 2012, 48, 1–36. [Google Scholar] [CrossRef] [Green Version]
  75. Rosseel, Y. The Lavaan Tutorial. Available online: http://lavaan.ugent.be/tutorial/tutorial.pdf (accessed on 25 August 2020).
  76. Rosseel, Y.; Jorgensen, T.D.; Rockwood, N. Package ‘lavaan’, Version 0.6-7. CRAN—The Comprehensive R Archive Network. 2020. Available online: https://cran.r-project.org/web/packages/lavaan/lavaan.pdf (accessed on 25 August 2020).
  77. Meyer, D.; Dimitriadou, E.; Hornik, K.; Weingessel, A.; Leisch, F. e1071: Misc Functions of the Department of Statistics, Probability Theory Group (Formerly: E1071), TU Wien. CRAN—The Comprehensive R Archive Network. 2020. Available online: https://cran.r-project.org/web/packages/e1071/e1071.pdf (accessed on 25 August 2020).
  78. George, D.; Mallery, P. IBM SPSS Statistics 26 Step by Step: A Simple Guide and Reference; Routledge: Abingdon-on-Thames, UK, 2019. [Google Scholar]
  79. Fornell, C.; Larcker, D.F. Evaluating structural equation models with unobservable variables and measurement error. J. Mark. Res. 1981, 18, 39–50. [Google Scholar] [CrossRef]
  80. Koufteros, X.A. Testing a model of pull production: A paradigm for manufacturing research using structural equation modeling. J. Oper. Manag. 1999, 17, 467–488. [Google Scholar] [CrossRef]
  81. Teo, T.; Zhou, M. Explaining the intention to use technology among university students: a structural equation modeling approach. J. Comput. High. Educ. 2014, 26, 124–142. [Google Scholar] [CrossRef]
  82. MacCallum, R.C.; Browne, M.W.; Sugawara, H.M. Power analysis and determination of sample size for covariance structure modeling. Psychol. Methods 1996, 1, 130–149. [Google Scholar] [CrossRef]
  83. Escobar-Rodriguez, T.; Monge-Lozano, P. The acceptance of Moodle technology by business administration students. Comput. Educ. 2012, 58, 1085–1093. [Google Scholar] [CrossRef]
  84. Manal, Y.; Almala, A.; Elbedour, S.; Woodson, K.; Reed, G. Math Anxiety Trends Issues and Challenges. J. Psychol. Clin. Psychiatry 2018, 9, 63–73. [Google Scholar]
  85. Lessani, A.; Yun, A.S.M.; Bakar, K.B.A. Comparison of new mathematics teaching methods with traditional method. People Int. J. Soc. Sci. 2017, 3, 1285–1297. [Google Scholar] [CrossRef]
  86. Voskoglou, M. Comparing teaching methods of mathematics at university level. Educ. Sci. 2019, 9, 204. [Google Scholar] [CrossRef] [Green Version]
  87. Davies, D.; Jindal-Snape, D.; Collier, C.; Digby, R.; Hay, P.; Howe, A. Creative learning environments in education—A systematic literature review. Think. Ski. Creat. 2013, 8, 80–91. [Google Scholar] [CrossRef] [Green Version]
  88. Kim, D.-J.; Bae, S.-C.; Choi, S.-H.; Kim, H.-J.; Lim, W. Creative Character Education in Mathematics for Prospective Teachers. Sustainability 2019, 11, 1730. [Google Scholar] [CrossRef] [Green Version]
  89. Lestari, N.D.S.; Juniati, D.; Suwarsono, S. Integrating mathematical literacy toward mathematics teaching: The pedagogical content knowledge (PCK) of prospective math teacher in designing the learning task. IOP Conf. Ser. Earth Environ. Sci. 2019, 243. [Google Scholar] [CrossRef]
Figure 1. Conceptual model of relationships among the factors influencing social sciences students’ mathematics achievement.
Mathematics 08 02134 g001
Figure 2. Boxplots (with an average denoted by an asterisk) and histograms for additional points (left), points from eActivities (middle), and mathematics achievement (right).
Mathematics 08 02134 g002
Figure 3. Structural Equation Modelling (SEM) model of relationships among the factors influencing social sciences students’ mathematics achievement.
Mathematics 08 02134 g003
Table 1. Descriptive statistics for items related to students’ attitude towards mathematics and math anxiety.
Questionnaire ItemMSDSkewnessKurtosis
Mathematics
Confidence
(MC)
I have a mathematical mind. (MC1)3.910.817−0.5640.477
I can get good results in mathematics. (MC2)3.720.899−0.4840.301
I know I can handle difficulties in mathematics. (MC3)3.950.812−0.366−0.453
I am confident with mathematics. (MC4)3.191.064−0.197−0.304
Behavioural
Engagement
(BE)
I concentrate hard in mathematics. (BE1)3.480.844−0.2310.224
I try to answer questions the teacher asks. (BE2)3.480.938−0.341−0.004
If I make mistakes, I work until I have corrected them. (BE3)3.560.930−0.119−0.553
If I cannot do a problem, I keep trying different ideas. (BE4)3.520.944−0.272−0.254
Mathematics
Test
Anxiety
(MTA)
Studying for a math test. (MTA1)3.131.244−0.030−0.910
Taking the math section of the college entrance exam. (MTA2)2.701.1190.195−0.682
Taking an exam (quiz) in a math course. (MTA3)2.881.1300.174−0.637
Taking an exam (final) in a math course. (MTA4)3.371.144−0.320−0.636
Thinking about an upcoming math test one week before. (MTA5)2.821.2370.137−0.906
Thinking about an upcoming math test one day before. (MTA6)3.361.229−0.288−0.848
Thinking about an upcoming math test one hour before. (MAT7)3.621.270−0.483−0.901
Realising you have to take a certain number of math classes to fulfil requirements. (MTA8)2.181.2260.770−0.396
Receiving your final math grade in the mail. (MTA9)2.911.2060.059−0.804
Being given a “pop” quiz in a math class. (MAT10)3.801.283−0.805−0.451
Numerical
Task
Anxiety
(NTA)
Reading a cash register receipt after your purchase. (NTA1)2.041.1220.834−0.162
Being given a set of numerical problems involving addition to solve on paper. (NTA2)1.560.8961.5531.696
Being given a set of subtraction problems to solve. (NTA3)1.540.8641.5211.584
Being given a set of multiplication problems to solve. (NTA4)1.590.8741.3581.059
Being given a set of division problems to solve. (NTA5)1.710.9531.2630.988
Mathematics
Course
Anxiety
(MCA)
Buying a math textbook. (MCA1)1.951.2061.0550.051
Watching a teacher work on an algebraic equation on the blackboard. (MCA2)1.851.0491.0790.433
Signing up for a math course. (MCA3)2.531.2000.413−0.596
Listening to another student explain a mathematical formula. (MCA4)2.071.1060.654−0.606
Walking into a math class. (MCA5)1.821.0971.3100.976
Table 2. Descriptive statistics for the items related to students’ attitude towards involving technology in learning mathematics.
Questionnaire ItemMSDSkewnessKurtosis
Confidence
with
Technology
(CT)
I am good at using computers. (CT1)3.920.952−0.606−0.173
I am good at using things like VCRs, DVDs, MP3s, and mobile phones. (CT2)4.270.798−0.9320.541
I can fix a lot of computer problems. (CT3)3.501.126−0.290−0.720
I can master any computer program needed for school. (CT4)3.600.993−0.207−0.483
Perceived
Usefulness of
Technology in
Learning
Mathematics
(PUTLM)
I like using computers for mathematics. (PUTLM1)3.501.141−0.426−0.453
Using computers in mathematics is worth the extra effort. (PUTLM2)3.291.117−0.212−0.568
Mathematics is more interesting when using computers. (PUTLM3)3.201.226−0.059−0.910
Computers help me learn mathematics better. (PUTLM4)3.251.218−0.187−0.819
Table 3. Parameter estimates, error terms, and z-values for the measurement model.
Latent VariableItemUnst. Factor LoadingError Termz-ValueStand. Factor Loading
Mathematics
Confidence
(MC)
MC11.000-a-a0.572
MC21.5310.14510.5890.796
MC31.2860.12710.1290.740
MC41.9950.17911.1580.876
Behavioural Engagement (BE)BE31.000-a-a0.718
BE41.2180.1299.4120.862
Mathematics
Test
Anxiety
(MTA)
MTA11.000-a-a0.735
MTA20.9710.06514.8300.793
MTA30.9980.06615.2280.807
MTA41.0260.06615.5150.820
MTA50.9590.07512.8480.708
MTA61.1210.07315.3080.834
MTA71.0600.07614.0390.763
MTA90.8080.07211.2170.612
MTA100.8170.07710.5750.582
Numerical
Task
Anxiety
(NTA)
NTA21.000-a-a0.926
NTA30.9800.03033.0700.941
NTA40.9950.03032.9180.944
NTA50.9860.04024.6650.858
Mathematics
Course
Anxiety
(MCA)
MCA11.000-a-a0.688
MCA21.2250.10611.5030.737
MCA31.2200.09512.8780.796
MCA41.1450.09312.3180.754
Perceived Level of Mathematics Anxiety (PLMA)MTA1.000-a-a0.809
NTA0.4640.0805.7910.414
MCA0.7980.0958.4280.817
Background
Knowledge from Secondary
School
(BKSS)
Grade in Mathematics in the Final Year1.000-a-a0.809
Grade in Mathematics at Matura0.4640.0805.7910.414
Final Grade in High School0.7980.0958.4280.817
Self-Engagement in Math. Course at Univ. (SEMCU)eActivities1.000-a-a0.949
Additional points0.6790.0828.2670.618
Confidence with
Technology
(CT)
CT11.000-a-a0.882
CT20.6630.04414.9030.698
CT31.1670.06119.1790.870
CT40.7960.05813.6790.673
Perceived Usefulness of Technology in
Learning Mathematics (PUTLM)
PUTLM11.000-a-a0.854
PUTLM20.9210.05018.3740.803
PUTLM31.1300.05121.9670.898
PUTLM41.1290.05022.4660.903
-a Indicates a parameter fixed at 1 in the original solution. Fit indices: χ2 = 1294.9, df = 570, χ2/df = 2.27, comparative fit index (CFI) = 0.908, root mean square error of approximation (RMSEA) = 0.061, 90% confidence interval for RMSEA = (0.061, 0.065).
Table 4. Composite reliability (CR), average variance extracted (AVE), square root of AVE (on the diagonal), and correlations among the latent variables.
Correlations among Latent Variables
ConstructCRAVEMCBEMTANTAMCABKSSSEMCUCTPUTLM
MC0.8500.6000.775 a
BE0.7720.6320.5640.795 a
MTA0.9150.548−0.589−0.4080.740 a
NTA0.9540.838−0.301−0.2090.3350.915 a
MCA0.8330.556−0.594−0.4120.6610.3380.746 a
BKSS0.7760.5540.4000.347−0.299−0.153−0.3020.744 a
SEMCU0.6010.5000.6340.400−0.500−0.256−0.5050.3210.707 a
CT0.8710.6380.2360.167−0.171−0.087−0.1720.0820.2600.798 a
PUTLM0.9240.7540.2530.269−0.080−0.041−0.081−0.0040.2410.4520.868 a
a—the square root of AVE.
Table 5. Summary of hypotheses testing for the structural model.
HypothesisPathExpected SignStandardised Path Coefficientz-ValueHypothesis
Supported?
H1aMC → PLMA-−0.669−6.6673 **Yes
H1bBE → PLMA-−0.131−1.824No
H2PLMA → MA-−0.243−5.307 ***Yes
H3BKSS → SEMCU+0.3283.781 ***Yes
H4SEMCU → MA+0.8359.118 ***Yes
H5CT → PUTLM+0.4587.924 ***Yes
H6PUTLM → MA+−0.047−1.189No
** p < 0.01; *** p < 0.001.
Publisher’s Note: MDPI stays neutral with regard to jurisdictional claims in published maps and institutional affiliations.

