Article

Sustainable Supplier Selection and Order Allocation Using an Integrated ROG-Based Type-2 Fuzzy Decision-Making Approach

by
Mehdi Keshavarz-Ghorabaee
Department of Management, Faculty of Humanities (Azadshahr Branch), Gonbad Kavous University, Gonbad Kavous 49717-99151, Iran
Mathematics 2023, 11(9), 2014; https://doi.org/10.3390/math11092014
Submission received: 29 March 2023 / Revised: 20 April 2023 / Accepted: 21 April 2023 / Published: 24 April 2023

Abstract

:
The sustainable Supplier Evaluation and Selection and Order Allocation (SSOA) problem has received significant attention in supply chain management due to its potential to enhance a company’s performance, improve customer satisfaction, and reduce costs. In this study, an integrated methodology is proposed to address the SSOA problem. The methodology combines multiple techniques to handle the uncertainties associated with supplier evaluation, including a new ranking method based on the concept of Radius of Gyration (ROG) for interval type-2 fuzzy sets. The methodology also incorporates both subjective weights obtained using the Simple Multi-Attribute Rating Technique (SMART) and expert preferences, and objective weights calculated using the Method based on the Removal Effects of Criteria (MEREC) method to determine the weights of evaluation criteria. Some criteria for sustainable development are used to evaluate supplier performance, resulting in type-2 fuzzy sets, which are evaluated using the Weighted Aggregated Sum Product Assessment (WASPAS) method. The ROG-based ranking method is employed to calculate the relative scores of suppliers. Finally, a multi-objective decision-making (MODM) mathematical model is presented to identify suitable suppliers and allocate their order quantities. The methodology is demonstrated in a sustainable SSOA problem and is shown to be efficient and effective, as the ROG-based ranking method allows for more accurate supplier performance evaluation, and the use of the criteria highlights the importance of sustainability in supplier selection and order allocation. The methodology’s practicality is further supported by the analysis conducted in this study, which demonstrates the methodology’s ability to handle the uncertainties associated with supplier evaluation and selection. The proposed methodology offers a comprehensive approach to the SSOA problem that can effectively handle the uncertainties in supplier evaluation and selection and promote sustainable practices in supply chain management.
MSC:
90B50; 90C70; 91B06; 03B52

1. Introduction

Sustainable supplier selection and order allocation (SSOA) has become increasingly important for companies to achieve sustainable development and maintain their competitiveness in the global market. The supply chain is a crucial aspect of a company’s operations, and suppliers play a critical role in the sustainability of the supply chain. Therefore, evaluating and selecting sustainable suppliers has become a critical strategic decision for companies [1,2]. Sustainable suppliers are those who are committed to environmentally friendly, socially responsible, and economically viable practices in their operations. By evaluating and selecting such suppliers, organizations can ensure that their suppliers’ performance aligns with their own sustainability goals in these three dimensions. Consumers and stakeholders are becoming increasingly conscious of the environmental, social, and economic impacts of the products and services they use. Partnering with sustainable suppliers can enhance an organization’s reputation as a socially responsible and environmentally conscious business while contributing to the economic development of the community in which they operate. By engaging with suppliers who promote ethical and fair labor practices, organizations can support social sustainability and help ensure the well-being of workers throughout the supply chain. For example, if a supplier uses unsustainable practices or materials that are subject to regulatory scrutiny, the organization may face legal or reputational risks, so collaboration with sustainable suppliers can help mitigate these risks and ensure continuity in the supply chain [3,4].
Sustainability issues in the supply chain have gained increasing attention in recent years due to the increasing awareness of the negative impact of business operations on the environment and society. Sustainable SSOA aims to identify and assess suppliers based on their sustainability performance, including environmental, social, and economic aspects. Evaluating suppliers based on sustainability criteria enables companies to reduce risks associated with supply chain disruptions and ensure a reliable supply of goods and services. It also helps companies meet their sustainability goals and enhance their reputation and brand image [5,6]. Order allocation is another critical aspect of the SSOA problem, which involves determining the most efficient and effective way of allocating orders among chosen suppliers. Companies need to consider both sustainability and efficiency factors when allocating orders to suppliers. Allocating orders to sustainable suppliers enables companies to reduce their environmental impact and promote social responsibility while ensuring the quality and reliability of goods and services. The SSOA problem is complex, and companies face numerous challenges when evaluating and selecting sustainable suppliers and allocating orders. The problem of sustainability in supply chains is further compounded by various types of complexity and uncertainty. Static complexity could emerge from the consideration of multi-echelon and multi-tier supply chains, where there are numerous nodes and interdependent processes that need to be taken into account. Dynamic complexity may also come into play when considering a supply chain in a multi-period context, where demand, supply, and other factors constantly change over time. In addition to these, there may be technological complexity related to the use of advanced manufacturing processes and digital technologies, as well as social complexity related to dealing with diverse stakeholders and communities [7,8,9]. All of these types of complexity can increase the uncertainty associated with sustainability issues, making it challenging for organizations to manage their supply chains effectively and achieve their sustainability goals. Therefore, companies need to develop effective models and methods to address the SSOA problem. The development of advanced mathematical models and decision-making tools has facilitated the evaluation and selection of sustainable suppliers and order allocation, considering multiple criteria and uncertainty [10,11].
Multi-criteria decision-making (MCDM) approaches can help organizations to define criteria, weight criteria, evaluate suppliers, generate alternatives, and make decisions about which sustainable suppliers to select for supply chain management (SCM) [12,13]. By using these approaches, organizations can make informed and objective decisions that promote environmental sustainability, social responsibility, and overall business success MCDM methods are flexible and adaptable to different contexts and situations. They can be used to evaluate suppliers in different industries, regions, and supply chain contexts, and can be customized to suit the specific needs and requirements of an organization [14,15].
The uncertainty of information is a common challenge in the SSOA problems. There are several methods that can be used to handle uncertainty and improve the accuracy and reliability of the evaluation and selection process [16]. In the context of sustainable supply chain management, the reliability of decisions refers to the degree to which the decisions made by a company in evaluating and selecting sustainable suppliers can be trusted to be accurate, consistent, and unbiased over time. It is important for companies to make reliable decisions in sustainable supply chain management because these decisions have significant impacts on the environment, society, and the economy. The reliability of decisions is closely linked to the quality of the data and information used to make those decisions. If the data used to evaluate and select suppliers are uncertain or imprecise, the resulting decisions will also be unreliable [17,18,19]. Uncertain information refers to information that is incomplete or unpredictable, where there is a lack of clarity about the outcome or the likelihood of different scenarios. Imprecise information, on the other hand, refers to information that is not precise or exact, where there is a degree of ambiguity or vagueness in the data. Fuzzy logic can be used to deal with uncertain and imprecise information [20,21]. It allows for a more flexible approach to decision-making, where criteria and weights are assigned based on linguistic variables [22]. Fuzzy MCDM is important for the evaluation and selection of sustainable suppliers for SCM because it can help to handle uncertainty and imprecision in the evaluation process [23]. Decision-makers may have different opinions and preferences regarding the importance of different criteria, and the criteria themselves may be vague and imprecise. Fuzzy MCDM allows decision-makers to represent criteria and weights in linguistic variables, which can be more intuitive and meaningful than numerical values. It also allows decision-makers to incorporate qualitative information, such as sustainability practices and social responsibility, into the evaluation process. This is important because sustainability performance may not be easily quantifiable, and qualitative information may be critical in evaluating suppliers’ sustainability practices. Evaluating and selecting sustainable suppliers typically involves multiple criteria. These criteria may have different levels of importance and may be interdependent [24,25]. Fuzzy MCDM can handle this by allowing decision-makers to evaluate and rank suppliers based on multiple criteria simultaneously. Fuzzy MCDM can also be used to identify the most critical criteria and their relative weights, which can help decision-makers to prioritize the criteria and suppliers based on their importance. This process is very important in the SSOA problem [26,27].
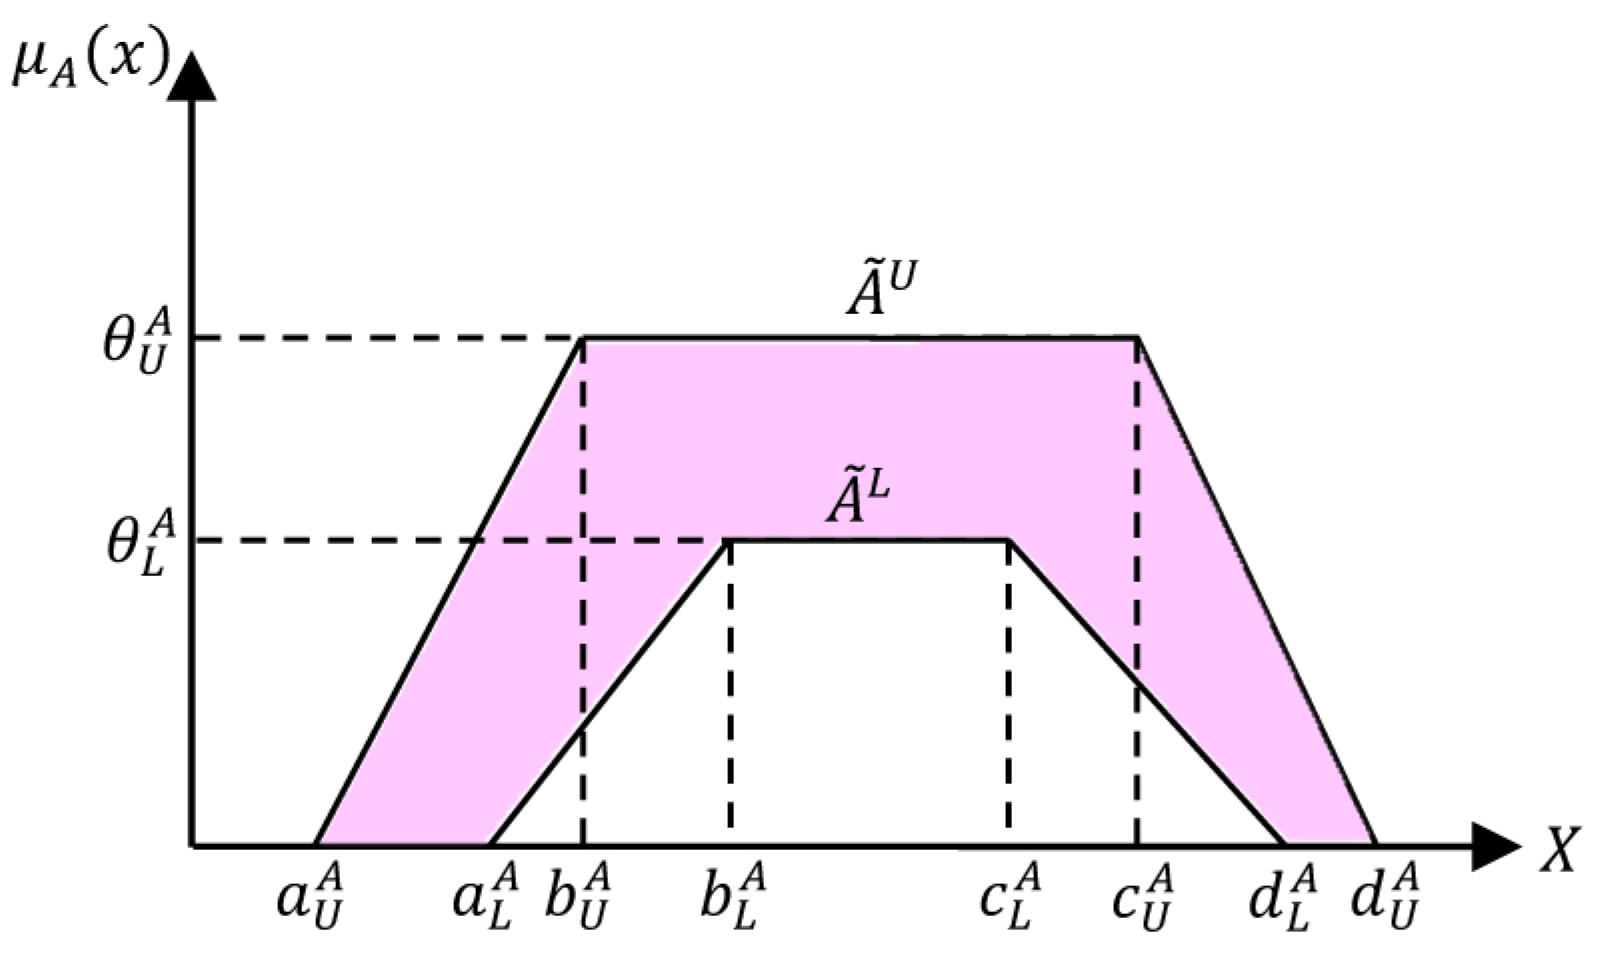
In fuzzy logic, a type-2 fuzzy set is an extension of the traditional type-1 fuzzy set that allows for more uncertainty and ambiguity in the definition of the set [28]. Type-2 fuzzy sets can be more useful in situations where there is a lot of uncertainty or imprecision in the definition of a concept or in the data being used to represent that concept [29]. However, they can also be more computationally intensive to work with and require more complex algorithms and techniques for inference and decision-making. Type-2 fuzzy sets are well-suited for problems involving uncertainty due to imprecise or incomplete data, or when there are multiple sources of uncertainty that need to be modeled. Type-1 fuzzy sets, on the other hand, are often used when the data are well-defined and there is little uncertainty [30]. By developing type-2 fuzzy sets for linguistic variables, we can capture the uncertainty and imprecision in the evaluation process. This can lead to more accurate evaluations of supplier performance, which can help in making better-informed supplier selection decisions in the supply chain [31,32,33]. Type-2 fuzzy sets have been applied to several real-world problems in different fields [34,35,36].
This study proposes a methodology to address the sustainable SSOA problem by integrating multiple techniques. First, a new ranking method based on the concept of Radius of Gyration (ROG) is introduced for interval type-2 fuzzy sets to handle the uncertainty in supplier evaluation. To determine the weights of evaluation criteria, both subjective weights obtained using the Simple Multi-Attribute Rating Technique (SMART) and expert preferences, and objective weights calculated using the Method based on the Removal Effects of Criteria (MEREC) method are combined [37,38]. Then, using sustainability criteria, a type-2 fuzzy decision-matrix, combined weights, and the Weighted Aggregated Sum Product Assessment (WASPAS) method [39], supplier performance is evaluated as type-2 fuzzy sets. The ROG-based ranking method is employed to calculate the relative scores of suppliers. Finally, a multi-objective decision-making (MODM) mathematical model is presented to identify suitable suppliers and allocate their order quantities. The application of the proposed methodology is demonstrated in a sustainable SSOA problem, highlighting the methodology’s effectiveness and applicability. The analysis conducted in this study demonstrates the practicality and efficiency of the proposed approach. By integrating multiple methodologies, this methodology can effectively handle the uncertainty in supplier evaluation and selection. Additionally, the use of the ROG-based ranking method allows for more accurate supplier performance evaluation, resulting in better supplier selection decisions. The proposed approach also takes into account sustainability criteria, emphasizing the importance of sustainability in supplier selection and order allocation.
The remainder of the paper is structured as follows. Section 2 provides an extensive literature review, discussing some of the recent studies pertaining to the SSOA problem. Section 3 outlines the proposed methodology, which encompasses the ROG-based ranking method, a step-by-step procedure for evaluating suppliers, and an approach to solving the MODM model of the sustainable SSOA problem. The results and discussion concerning the proposed methodology are presented in Section 4, where an example of the sustainable SSOA problem is illustrated, along with a sensitivity analysis. Finally, Section 5 presents the concluding remarks, summarizing the key findings of the study and highlighting future research directions.

2. Literature Review

The SSOA is an essential problem for many organizations as they directly impact the quality of the end product and the overall efficiency of the supply chain. Selecting the right suppliers and allocating orders optimally can help organizations reduce costs, increase profits, and maintain a competitive edge in the market. Over the years, several studies have been conducted on the SSOA problem, with a focus on different aspects such as sustainability, risk, and uncertainty. In this section, some of the recent studies on this topic, highlighting their contributions, are reviewed.
Esmaeili-Najafabadi et al. [40] enhanced the process of SSOA within a centralized supply chain, by devising a mixed integer nonlinear programming (MINLP) mathematical model that incorporates two precautionary measures aimed at mitigating disruption risks. The investigation revealed that as the likelihood of disruptions increases, the variables that influence decisions regarding SSOA undergo alterations.
Moheb-Alizadeh and Handfield [41] proposed a sustainable supplier management tool by simultaneously tackling the challenges of sustainable SSOA. These issues have received limited attention in the literature. They developed an MODM model that is comprehensive, considering multiple periods, products, and transportation modes, as well as discount and shortage conditions. They select the preferred solution based on the data envelopment analysis (DEA) super efficiency score of all purchasing firms. The proposed approach was applied to a real-world case study in the automotive industry.
Hosseini et al. [42] developed an efficient solution for managing supply chain disruptions by developing a resilient SSOA approach. The researchers proposed a graphical model to obtain the likelihood of disruption scenarios for the supplier selection problem and a stochastic MODM model to help with decision-making on when and how to use both reactive and proactive strategies in SSOA.
Kellner and Utz [43] devised a decision support approach that helps purchasing managers build mid-term supplier portfolios while weighing purchasing costs, supplier sustainability and overall supply risk trade-offs. To achieve this, the researchers developed an MODM model that prioritized supplier sustainability, selected the suppliers with the lowest costs, and reduced supply risk. They used the ε-constraint method to deal with the MODM model.
Duan et al. [44] presented an integrated model for green SSOA that can aid companies in cutting costs, enhancing their green performance, and gaining a competitive edge by combining the alternative queuing method (AQM), linguistic Z-numbers, and an MODM model. The study employed the step-weight assessment ratio analysis technique to determine the weights of criteria, and an extended AQM to rank the given suppliers while establishing an MODM model to find the optimal order quantity for the selected suppliers based on their scores.
Mohammed et al. [45] developed a hybrid approach based on MCDM and MODM techniques for sustainable SSOA. The authors put forward an integrated approach based on the fuzzy analytic hierarchy process (AHP) and fuzzy Technique for Order Preference by Similarity to Ideal Solution (TOPSIS) to evaluate and rank suppliers based on three sets of criteria and created an MODM model for selecting suppliers and determining optimal order quantities.
Safaeian et al. [46] proposed an MODM model for SSOA that takes into account incremental discounts in a fuzzy environment. The researchers utilized the Zimmermann fuzzy approach to transform the MODM model into a single objective format, which was then solved using Genetic Algorithm and Non-dominated Sorting GA (NSGA). Finally, the methodology’s effectiveness and performance were evaluated and discussed.
Alegoz and Yapicioglu [47] developed a hybrid approach for SSOA that takes both qualitative and quantitative criteria into account. The goal was to identify appropriate suppliers and make optimal order allocations. To achieve this, the researchers used trapezoidal type-2 fuzzy AHP, fuzzy TOPSIS and goal programming. The study also compared the use of MCDM methods regarding their effectiveness.
The purpose of the study made by Mari et al. [48] was to establish resilient criteria for SSOA in an uncertain environment, aiming to mitigate low probability disruption risks that can have a high impact and enhance supply chain resilience. To accomplish this aim, the study proposed a possibilistic fuzzy MODM model and an interactive fuzzy optimization methodology to help organizations balance resilience and cost in their supply chains.
Laosirihongthong et al. [49] introduced a comprehensive approach for assessing suppliers based on sustainability indicators, as well as allocating purchase orders among the top-ranked suppliers. To achieve this goal, the researchers used a mixed-methods approach and utilized the fuzzy AHP to rank suppliers. Furthermore, the study devised a cost-minimization method for allocating purchase orders. The findings of the study demonstrated that both economic and environmental factors are essential considerations.
Feng and Gong [50] proposed an integrated approach for green SSOA in the automobile manufacturing industry using MODM and the linguistic entropy weight method (LEWM). The LEWM was used to analyze the performance and select qualified green suppliers on each evaluation criterion. The order allocation model aimed to minimize carbon emission and total cost and maximize supply value. The study found that the proposed framework could effectively deal with green SSOA for automobile manufacturers.
Khoshfetrat et al. [51] established an MODM model for a sustainable SSOA problem in the automotive industry that considers various criteria in a fuzzy environment. To achieve this goal, the study combined the evaluation process of suppliers, which used the AHP method, with the process of order allocation to determine the ideal quantity needs to be purchased from each supplier in each period. Furthermore, the study provided a sensitivity analysis to analyze the best suppliers and their allocated orders.
Jia et al. [52] The study addressed the issue of uncertain factors, such as emissions, supply capacity, per-unit cost, demand, and minimum order quality, whose probability distributions were imprecise, by estimating their distributions. The study proposed a robust MODM model for sustainable SSOA, which optimized four conflicting objectives while considering the sustainability dimensions. The proposed model effectively balanced multiple objectives and solved the sustainable SSOA problem by structuring ambiguous distribution sets.
Wong [53] studied the complicated issue of selecting eco-friendly suppliers. To address this problem, the study created a fuzzy goal programming model that considered various factors such as suppliers’ dynamic risk, importance functions, and green market segmentation. The effect of different ratios of environmentally conscious consumers was studied and a solution was proposed to incorporate market incentives and result in mutually beneficial outcomes for the environment and the economy.
The aim of the research carried out by You et al. [54] was to create a unique framework for SSOA that could benefit organizations in accomplishing sustainable development goals. To deal with the uncertainty involved in evaluating the sustainable performance of suppliers, the researchers employed Double Hierarchy Hesitant Linguistic Term Sets (DHHLTSs). They proposed an extended approach to select efficient and sustainable suppliers and established a linear MODM model to apportion rational order quantities among the selected suppliers, taking quantity discounts into account.
Rezaei et al. [55] proposed an integrated approach for SSOA in lean manufacturing companies by utilizing both MODM and MCDM techniques. The study was conducted in four phases. Firstly, relevant leanness criteria were identified from previous research. Secondly, the AHP method was employed to evaluate these criteria for supplier selection. Next, a fuzzy AHP method was used to choose suppliers based on the lean supplier selection criteria. Finally, an MODM mathematical model was developed to determine the optimal allocation of orders.
Kaviani et al. [56] developed a new approach that combined fuzzy multi-objective optimization and intuitionistic fuzzy AHP to tackle the SSOA problem. They started by using intuitionistic fuzzy AHP to establish the key criteria weights for evaluating suppliers and then utilized a fuzzy MODM mathematical model to determine the optimal order quantity for each supplier. The authors concluded that their innovative decision-making tool could handle decision-makers’ uncertainty and had demonstrated practical usefulness.
Rezaei et al. [57] addressed the issue of risk and uncertainty in SSOA for closed-loop supply chain (CLSC) networks and reverse logistics. They proposed a two-stage model based on stochastic programming that uses a conditional value-at-risk (CVaR) risk measurement tool to assess both risk-averse and risk-neutral scenarios. The goal of the study was to explore how changes in key problem parameters affect a company’s sourcing strategies. The researchers recommended that firms consider purchasing from spot markets and backup suppliers to mitigate uncertainties.
Wang et al. [58] devised a model based on the analytic network process (ANP) and integer programming that leverages MCDM techniques to optimize the SSOA problem. The researchers aimed to evaluate how different emission trading schemes (ETS) scenarios could affect a company’s overall cost structure and the creation of a low-carbon supply chain, taking into account the carbon competitiveness of suppliers by factoring in the carbon embedded in raw materials and carbon emission trading schemes.
Çalık [59] developed a framework for managing the sustainable SSOA problem in the agricultural machinery industry in Turkey. To achieve this, an MODM mathematical model was developed, which included sustainability dimensions. The weight of the criteria was determined using an approach based on the AHP method and interval type-2 fuzzy sets. The proposed approach offered an integrated model that considered the integration of quantitative and qualitative evaluation criteria, taking into account varying preferences.
Khalili Nasr et al. [60] proposed a two-stage model to deal with the SSOA problem in CLSCs that could minimize waste. In the first stage, a fuzzy Best-Worst Method (BWM) was used to evaluate suppliers based on various criteria. In the second stage, a linear MODM model was used to design a CLSC network incorporating vehicle scheduling, inventory-location-routing, and quantity discounts. To solve the MODM model a fuzzy goal programming approach was proposed.
Kaur and Prakash Singh [61] presented a multi-stage hybrid model for the SSOA problem that would account for risks and disruptions arising from positive and negative events, such as natural/man-made disasters and Industry 4.0, and optimize the distribution of orders to suppliers over multiple periods in a manner that would minimize costs as well as the disruption risk. The proposed model involved supplier segmentation and evaluation using the DEA, fuzzy AHP, and TOPSIS. Moreover, the risk related to each supplier was assessed using the model.
Islam et al. [62] developed a new two-stage approach to handle SSOA problems with uncertain demand. The study introduced a Relational Regressor Chain method for demand forecasting in the first stage. In the second stage, suitable suppliers and order quantities from each supplier were determined based on the forecasted demand and an MODM model. To obtain efficient solutions ε-constraint and weighted-sum methods were employed. The outcomes indicated the efficiency of the proposed method over the other methods in terms of forecasting accuracy.
Rezaei et al. [63] devised an effective framework for SSOA in a centralized supply chain while considering collaboration between the supplier and buyer and the strategies for risk reduction. The study employed MINLP models and risk reduction strategies such as protected suppliers, emergency stock, reserving additional capacity, backup suppliers, and geographical separation. It also employed the risk priority number constraint and Failure Mode and Effects Analysis (FMEA) technique to account for suppliers’ reliability.
Firouzi and Jadidi [64] proposed a fuzzy MODM model for the SSOA problem that could manage the uncertainties brought about by disasters in Japan. The researchers acknowledged that such catastrophes could have unfavorable effects on businesses and markets, resulting in increased demand for certain goods or a reduction in the suppliers’ ability to provide them in the appropriate quantity, quality, and time. To effectively consider decision makers’ preferences, the study used a weighted additive function to solve the MODM model with parameters defined by fuzzy sets.
Li et al. [65] presented an inclusive mathematical model to assist in SSOA while considering both qualitative and quantitative factors in the risk management of supply chains. The study noted the emerging trend of environmental considerations in this field and highlighted the importance of dynamic SSOA. The presented model included the preliminary selection of suppliers based on the risk value assessed through quantitative and qualitative methods. This was followed by developing an MODM model for dynamic SSOA.
Yousefi et al. [66] developed a two-stage hybrid approach that could be utilized to select efficient suppliers, allocate orders, and determine prices in a coordinated supply chain. The first stage of the proposed model employed the DEA technique and an MODM mathematical model to evaluate suppliers and minimize costs simultaneously. The second stage of the proposed approach utilized the order quantity specified in the first stage, the bargaining game, the Nash equilibrium concept, and a quadratic programming model to determine the price.
Beiki et al. [67] introduced a new approach to tackle the SSOA problem by combining an MODM model with the language entropy weight method. The authors emphasized the need to improve the collaboration between potential suppliers and supply chain practitioners to achieve sustainable development goals. An MODM model based on three objectives was developed, aiming to maximize procurement value while minimizing total cost and carbon emissions. The language entropy weight method was utilized in the study to evaluate suppliers based on their sustainability performance.
Esmaeili-Najafabadi et al. [68] proposed a multi-objective model for integrated SSOA in a centralized supply chain based on a risk-averse decision-maker and the risks of disruption. Two types of risks including local disruption risks and regional disruption risks were considered in the study. Risk-averse and risk-neutral and models were developed, and the decision maker’s behavior was analyzed using two risk assessment tools, value-at-risk (VaR) and CVaR. The model was solved using the particle swarm optimization (PSO) algorithm.
Mohammed et al. [69] aimed to put forward a new technique for SSOA that takes into account green and resilience aspects by devising an integrated framework. The proposed framework was based on calculating importance weights using the AHP method, assessing suppliers using the TOPSIS method, and applying an MODM mathematical model with the ε-constraint method to solve the problem. The purpose of the study was to support companies in augmenting their supply chain resilience while fulfilling their environmental responsibilities.
Hosseini et al. [70] developed a solution methodology for the SSOA challenges under uncertainty. An integration of the evidential reasoning and BWM was used to propose an approach for the evaluation of suppliers based on sustainability dimensions. Stochastic programming and dynamic programming were utilized to solve the MODM model, and its results were compared with some other techniques. The effect of uncertainties in suppliers’ availability, quantity discounts, and demand was examined through a sensitivity analysis.
Ali et al. [71] devised a comprehensive method for SSOA in a sustainable supply chain under uncertainty. The study utilized a fuzzy AHP approach to compute the criteria weights and a fuzzy TOPSIS technique to assess the performance of suppliers and ascertain their final ranks. Then an MODM model based on goal programming was used for allocating the optimum order quantity to the selected suppliers. The results of the study and analyses indicated that the suggested model was able to deal with uncertainties associated with the SSOA problem.
Goodarzi et al. [72] aimed to develop a model that integrated a decision-making approach to evaluate green suppliers and allocate optimal orders while accounting for uncertainty. The fuzzy Delphi method was employed to refine supplier evaluation criteria and use green and resilient indexes were for the prioritization of suppliers. The gray Correlation method and TOPSIS were utilized to analyze the results.
Liaqait et al. [73] proposed a decision-support framework based on the integration of fuzzy MCDM techniques, demand forecasting, and MODM mathematical models. The focus of the research was on a multi-modal transportation network to demonstrate the effect of transportation on travel time, the supply chain’s total cost, and environmental impact. The findings of the proposed model showed that the multi-modal transportation network had a substantial impact on the supply chain’s travel time, total cost, and environmental impact.
The study of Gai et al. [74] aimed to present an integrated two-stage MCDM approach that incorporated both quantitative and qualitative analyses for dealing with the challenges of SSOA in green supply chain management. In the first stage, the evaluation of green suppliers was made using linguistic Z-Numbers and the MULTIMOORA (Multi-Objective Optimization on the basis of a Ratio Analysis plus the full Multiplicative form) method. In the second stage, an MODM mathematical model was employed to determine the number of orders allocated to the preferred suppliers.
Aouadni and Euchi [75] developed a hybrid solution methodology for SSOA based on the best-worst method and TOPSIS technique in the first phase to find a robust ranking of suppliers and to use the Linear Programming approach in the second phase to determine the weight of the objective function. The study applied the methodology to a real case of the Tunisian Electric Society, and the experimental results showed that the proposed model provided effective gains concerning solution quality.
The purpose of the study made by Galankashi et al. [76] was to tackle the problem of merging agile manufacturing with purchasing and supplier selection. The authors reviewed past research thoroughly and utilized the AHP method to finalize the criteria for choosing agile suppliers. They utilized the criteria to evaluate suppliers using a fuzzy AHP and established an MODM model based on multiple periods for allocating orders. A sensitivity analysis was conducted to provide more practical and comprehensible results.
Liu et al. [77] put forward a linear MODM model to help manage supply chains through the efficient selection of suppliers and allocation of orders. The study introduced a modified BWM method to assess and prioritize suppliers. The authors used fuzzy variables to find the amount of raw material order quantities. The goal programming method was employed to solve the MODM model that included four objective functions. The study illustrated that the proposed model yielded lower costs and better criteria in comparison to other models.
The purpose of the study carried out by Bai et al. [78] was to address the neglect of net-zero emissions and carbon neutrality in the SSOA problems of supply chain management. They introduced an MODM mathematical model that can assess various procurement policies and provide practical and theoretical insights. A case of an energy trading platform was used for the implementation and assessment of the model. The results indicated the importance of purchasing fossil fuels or attaining net zero through carbon emissions sequestration and carbon offsets.
Ahmad et al. [79] developed an approach to deal with the SSOA problem in a two-echelon make-to-order supply chain. The focus of the study was on determining the acceptable tolerances for the members of a supply chain to the minimization of the variability in total costs. The authors employed an MINLP model, and the robustness of the solutions was improved by incorporating the Taguchi Method of Tolerance Design (TMTD). They tested their model and showed the effectiveness of it.
The studies reviewed here highlight the importance of considering uncertainty in handling SSOA. Table 1 presents a summary of the reviewed studies, taking into account the uncertainty associated with SSOA can lead to more robust decisions in supply chain management. The studies also reveal that SSOA is a complex process that requires the integration of various criteria, including economic, social, and environmental considerations. Additionally, the studies demonstrate the need to address the challenges of sustainable SSOA, which has received limited attention in prior literature. Therefore, the current study focused on developing a new methodology to deal with sustainable SSOA problems under uncertainty.

3. Methodology

In this section, a new decision-making approach is presented based on interval type-2 fuzzy sets, ROG of fuzzy sets, SMART, MEREC and WASPAS. Then a model is described to deal with the SSOA problem. The preliminaries and different components of the decision-making approach are delineated in the following subsections.

3.1. Interval Type-2 Fuzzy Sets

Interval type-2 fuzzy sets are a type of fuzzy set that allows for a more precise representation of uncertainty in data. While traditional fuzzy sets assign each element a membership value between 0 and 1, IT2FS assign each element a membership function that is itself a fuzzy set. This allows for a more nuanced representation of uncertainty, as the membership function can vary within a given interval. IT2FS can also be used to construct fuzzy preference relations, which provide a way to model the preferences of decision-makers. This can be useful in group decision-making scenarios, where there may be multiple decision-makers with different preferences. The use of IT2FS in constructing these relations can help to improve the efficiency of the decision-making process. Furthermore, IT2FS can be used to rank alternatives and criteria weights, which can be useful in determining the most appropriate course of action [80,81].
The study uses a trapezoidal form of IT2FSs that is defined by a two-level membership function denoted by μ F ( x ) . This function includes an Upper Membership Function (UMF) and a Lower Membership Function (LMF) that form the Footprint of Uncertainty (FOU) for an interval type-2 fuzzy set. The trapezoidal IT2FS is formed by UMF and LMF, which have trapezoidal shapes. The trapezoidal membership function has commonly been used in fuzzy sets and fuzzy logic systems. It has a simple shape that is easy to understand and interpret. The trapezoidal membership function is more flexible than the triangular membership function, as they allow for a wider range of uncertainty to be represented. This type of membership function is more precise, as they do not assume a normal distribution for the uncertainty. The trapezoidal membership function can represent both symmetric and asymmetric uncertainty, making them a more versatile choice for many applications. Moreover, it can be easily combined with other types using standard fuzzy set operations, such as union and intersection. It can also be easily converted to crisp numbers, which makes it more useful in practical applications. This type of membership function can be used in a wide range of applications, including control systems, decision-making, and data analysis, making it a popular choice for many researchers and practitioners in the field of fuzzy logic. Figure 1 depicts a trapezoidal IT2FS.
The mathematical expression for defining this trapezoidal IT2FS is as follows [82,83].
A ˜ ˜ = ( A ˜ i |   i { L , U } ) = ( a i A , b i A , c i A , d i A ; θ i A |   i { L , U } )
Assuming B ˜ ˜ is another trapezoidal IT2FS with the same definition and k is a definite number, we can define some fundamental mathematical operations of trapezoidal IT2FSs as follows.
Addition:
A ˜ ˜ B ˜ ˜ = ( a i A + a i B , b i A + b i B , c i A + c i B , d i A + d i B ; min ( θ i A , θ i B ) |   i { L , U } )
A ˜ ˜ k = ( a i A + k , b i A + k , c i A + k , d i A + k ; θ i A |   i { L , U } )
Subtraction:
A ˜ ˜ B ˜ ˜ = ( a i A d i B , b i A c i B , c i A b i B , d i A a i B ; min ( θ i A , θ i B ) |   i { L , U } )
A ˜ ˜ k = ( a i A k , b i A k , c i A k , d i A k ; θ i A |   i { L , U } )
Multiplication:  
A ˜ ˜ B ˜ ˜ = ( m i n   I 1 , m i n   I 2 , m a x   I 2 , m a x   I 1 ; min ( θ i A , θ i B ) |   i { L , U } )
where I 1 = { a i A a i B , a i A d i B , d i A a i B , d i A d i B } and I 2 = { b i A b i B , b i A c i B , c i A b i B , c i A c i B } .
A ˜ ˜ k = { ( a i A k , b i A k , c i A k , d i A k ; θ i A |   i { L , U } )     i f   k 0 ( d i A k , c i A k , b i A k , a i A k ; θ i A |   i { L , U } )   i f   k < 0
Exponentiation:
A ˜ ˜ k = ( ( a i A ) k , ( b i A ) k , ( c i A ) k , ( d i A ) k ; θ i A |   i { L , U } )
Defuzzified crisp score: Γ
Γ ( A ˜ ˜ ) = 1 2 ( i { L , U } a i A + ( 1 + θ i A ) ( b i A + c i A ) + d i A 4 + 2 θ i A )

3.2. Comparative Ranking of Trapezoidal IT2FSs Based on ROG

The section puts forward a technique for comparative ranking of trapezoidal interval type-2 fuzzy sets. Several methods have been proposed for ranking fuzzy numbers. Lee and Li [84] developed a ranking approach to sort fuzzy numbers based on the fuzzy mean and spread of these numbers. However, the method becomes challenging to compare when fuzzy numbers have a high mean value with a high spread or a low mean value with a low spread. Cheng [85] proposed the coefficient of variance (CV index) to address this limitation, which ranks fuzzy numbers by their smaller CV index. Additionally, Cheng [85] proposed the distance-based method to rank fuzzy numbers. However, both the distance-based method and the CV index have limitations, with the distance method contradicting the CV index in some cases. Chu [86] proposed a ranking approach that uses the area between the centroid and the original point to address these limitations, but it fails to rank fuzzy numbers with the same centroid point. As an improvement over previous methods Deng et al. [87] proposed a ranking method that was free from the limitations of the mentioned methods. The technique of ranking proposed in this section is derived from the modified area method suggested by Deng et al. [87]. This method assesses the ranking of a fuzzy set by examining the area between the original point and the Radius of Gyration (ROG) point. Deng et al. [87] initially introduced this ranking technique for generalized trapezoidal fuzzy numbers, using the moment of inertia concerning the x and y axes.
This research utilizes the idea of ranking based on ROG and applies it to present a comparative ranking method for trapezoidal IT2FSs, which is a novel approach. Suppose we are working with a collection of n trapezoidal IT2FSs, which we will refer to as E ˜ ˜ 1 ,   E ˜ ˜ 2 ,…,   E ˜ ˜ n . Below are the steps that describe the ROG-based ranking method that is proposed for ranking trapezoidal IT2FSs.
Step 1. Compute the moment of inertia for the upper and lower membership functions of each set with respect to both the x and y axes ( I x and I y ), using the equations provided below.
I x i E k = I x 1 i E k + I x 2 i E k + I x 3 i E k ,       i { L , U } ,   k { 1 , 2 , , n }
I y i E k = I y 1 i E k + I y 2 i E k + I y 3 i E k ,       i { L , U } ,   k { 1 , 2 , , n }
where
I x 1 i E k = ( b i E k a i E k ) ( θ i E k ) 3 12 ,       i { L , U } ,   k { 1 , 2 , , n }
I x 2 i E k = ( c i E k b i E k ) ( θ i E k ) 3 3 ,       i { L , U } ,   k { 1 , 2 , , n }
I x 3 i E k = ( d i E k c i E k ) ( θ i E k ) 3 12 ,       i { L , U } , k { 1 , 2 , , n }
I y 1 i E k = ( b i E k a i E k ) 3 θ i E k 4 + ( b i E k a i E k ) ( a i E k ) 2 θ i E k 2 + 2 ( b i E k a i E k ) 2 a i E k θ i E k 3 ,       i { L , U } ,   k { 1 , 2 , , n }
I y 2 i E k = ( c i E k b i E k ) 3 θ i E k 3 + ( c i E k b i E k ) ( b i E k ) 2 θ i E k + ( c i E k b i E k ) 2 b i E k θ i E k ,       i { L , U } , k { 1 , 2 , , n }
I y 3 i E k = ( d i E k c i E k ) 3 θ i E k 12 + ( d i E k c i E k ) ( c i E k ) 2 θ i E k 2 + ( d i E k c i E k ) 2 c i E k θ i E k 3 ,       i { L , U } ,   k { 1 , 2 , , n }
Step 2. Use the following equations to compute the ROG point for the UMF and LMF of each trapezoidal IT2FS.
R x i E k = I x i E k ( ( ( c i E k b i E k ) + ( d i E k a i E k ) ) . θ i E k ) / 2 ,       i { L , U } ,   k { 1 , 2 , , n }
R y i E k = I y i E k ( ( ( c i E k b i E k ) + ( d i E k a i E k ) ) . θ i E k ) / 2 ,       i { L , U } ,   k { 1 , 2 , , n }
Step 3. Employ the following formula to compute interval areas based on both the obtained ROG point and the original point.
L R E k = m i n ( R x L E k R y L E k , R x U E k R y U E k ) ,       k { 1 , 2 , , n }
U R E k = m a x ( R x L E k R y L E k , R x U E k R y U E k ) ,       k { 1 , 2 , , n }
Step 4. Compute the degree of possibility for each pair of fuzzy sets in relation to one another using the following equation. Let E ˜ ˜ s and E ˜ ˜ m be two unequal trapezoidal IT2FSs.
P o s ( E ˜ ˜ s E ˜ ˜ m ) = { 1 i f         Δ N 0   a n d   Δ P 0 Δ P Δ P Δ N i f           Δ N 0   a n d   Δ P 0 0 i f         Δ N 0   a n d   Δ P 0
where Δ N = L R E s U R E m , Δ P = U R E s L R E m , and the degree of possibility for E ˜ ˜ s over E ˜ ˜ m is denoted by P o s ( E ˜ ˜ s E ˜ ˜ m ) .
Step 5. Compute the comparative ranking values for the trapezoidal IT2FSs using the following equation [30,88,89].
C R ( E ˜ ˜ k ) = 1 n ( n 1 ) ( l = 1 n P o s ( E ˜ ˜ k E ˜ ˜ l ) + n 2 1 ) ,       k { 1 , 2 , , n }

3.3. The Proposed MCDM Approach

This section presents a new method for multi-criteria decision-making when the experts’ judgments are expressed as trapezoidal interval type-2 fuzzy sets. The proposed method combines SMART, MEREC, and the ROG-based ranking technique to provide a comprehensive approach to decision-making. To use this approach, decision-makers must first define the problem and provide subjective assessments. SMART provides subjective weights for the criteria, MEREC determines the objective weights, and WASPAS is used for the fuzzy evaluation of the suppliers. The SMART method has several advantages that make it a popular approach to multi-criteria decision-making. It is a straightforward and easy-to-understand approach to decision-making. It requires minimal training and can be applied by individuals with different levels of expertise. The SMART method is a flexible approach that can be applied in a wide range of decision-making contexts. It allows decision-makers to incorporate both qualitative and quantitative criteria. Moreover, it is a relatively quick approach to decision-making that can help decision-makers save time and resources. In the MEREC method, the determination of objective weights takes a unique approach compared to other objective weighting methods. Instead of using variations in criteria to calculate weights, this method utilizes the removal effects of criteria on the performances of alternatives as a measure for weighting. Such a perspective is new and distinct from other approaches to determining objective criteria weights. The MEREC method provides insights into the relative importance of each criterion to the decision. In addition, the efficiency of the WASPAS method for the evaluation process has been demonstrated through numerous studies, making it an effective MCDM method [90]. The subjective weights and objective weights are combined to provide more realistic decisions. The ROG-based technique is used to calculate ranking values for the suppliers based on their aggregated WASPAS measures. The following steps represent the procedure of determination of relative scores of suppliers using the proposed MCDM approach.
Step 1. Form a team of decision-makers (DMs). This step involves assigning a group of experts who will carry out the decision-making process. Typically, these experts are chosen from senior-level executives or other positions of high responsibility within an organization. Let us assume that there is a group of q decision-makers ( D 1 to D q ).
Step 2. Collect information about the potential suppliers and evaluation criteria. Gather data on the issue and extract the options that require assessment as well as the standards that can account for various aspects of the choices. Suppose that there are n alternatives ( A 1 to A n ) and m criteria ( C 1 to C m ) involved in the MCDM problem.
Step 3. Gather the preliminary evaluations of the criteria from each decision-maker. Ask each member of the decision-making group to provide their initial evaluations of the criteria. Different techniques, such as linguistic variables or the Likert scale can be employed to gather their opinions. As per the proposed approach’s framework, a scale ranging from 0 to 100 is utilized for evaluations, with 0 denoting the least important and 100 the most important criteria.
Step 4. Obtain the initial evaluations of the alternatives’ performances on each criterion from all experts. To capture the uncertainty of the evaluation process, linguistic variables are employed in this stage to gather the opinions of the decision-makers. The primary benefit of linguistic variables is their ability to be converted into trapezoidal IT2FSs. The range of linguistic variables encompasses “Very Poor” (VP) to “Very Good” (VG), and the full list of these variables is presented in Table 2 [82]. Let x ˜ ˜ i j k indicate the evaluation of j th criterion for i th alternative based on the perspective of k th decision-maker.
Step 5. Calculate the subjective weight of each criterion using the SMART technique. Use the evaluations obtained from the experts in Step 3 for this step. Let I P j k denote the importance or points assigned by the k th decision-maker to the j th criterion. Then, apply the following equation to determine the subjective weight of each criterion ( w j s ) [37].
w j s = k I P j k k j I P j k
Step 6. Create an interval type-2 fuzzy decision-matrix by combining the alternatives’ performances. Utilize Table 2, apply arithmetic operations of IT2FSs, and use the initial evaluations gathered in Step 4 to consolidate the alternatives’ performances and turn them into trapezoidal interval type-2 fuzzy numbers. It is worth noting that this type of fuzzy set is an effective method for capturing decision-making information uncertainty. The results of this phase are the elements of the interval type-2 fuzzy decision-matrix ( x ˜ ˜ i j ). These elements are calculated as follows.
x ˜ ˜ i j = 1 q q k = 1 x ˜ ˜ i j k
Step 7. Defuzzify the decision-matrix and calculate the objective weights of criteria using the MEREC method [38]. In order to calculate the objective criteria weights ( w j o ) using MEREC, the defuzzified decision-matrix needs to be obtained first. The elements of the crisp matrix ( x i j d ) can be computed based on the results of Step 6 and Equation (9) as follows.
x i j d = Γ ( x ˜ ˜ i j )
Step 8. Combine the subjective and objective criteria weights to obtain more realistic weights for the criteria. By fusing the subjective criteria weights obtained using SMART in Step 5 with the objective weights determined by MEREC in Step 7, the combined weights of criteria ( w j c ) can be computed using the following formula with a combination parameter ω .
w j c = ω w j s + ( 1 ω ) w j o
Step 9. Normalize the interval type-2 fuzzy decision-matrix. The WASPAS method typically utilizes a linear normalization approach, but given the utilization of trapezoidal IT2FSs, we need to adapt the normalization approach in this stage. The beneficial criteria are represented by B C while N C is used to represent non-beneficial criteria. Utilize the subsequent equations to normalize the interval type-2 fuzzy decision-matrix. Keep in mind that the calculations use Equations (2) to (9).
x ˜ ˜ i j n = { x ˜ ˜ i j 1 m a x i   x i j d                         i f   j B C 1 ( x ˜ ˜ i j 1 m a x i   x i j d )         i f   j N C
Step 10. Determine the WSM ( Q ˜ ˜ i S ) and WPM ( Q ˜ ˜ i P ) measures of the WASPAS method by applying the following equations. As a result of using trapezoidal IT2FSs, this step differs slightly from the classic WASPAS method and has been modified for more efficient handling.
Q ˜ ˜ i S = m Σ j = 1 ( x ˜ ˜ i j n w j c )
Q ˜ ˜ i P = m Π j = 1 ( ( 1 x ˜ ˜ i j n ) w j c )
Step 11. Calculate the composite WASPAS measure. Utilizing the normalized WSM and WPM measures and the combination parameter γ , the composite WASPAS measure is computed in this step.
Q ˜ ˜ i = ( Q ˜ ˜ i S N γ ) ( Q ˜ ˜ i P N ( 1 γ ) )
where
Q ˜ ˜ i S N = Q ˜ ˜ i S 1 m a x l   Γ ( Q ˜ ˜ l S )
Q ˜ ˜ i P N = Q ˜ ˜ i P 1 m a x l   Γ ( Q ˜ ˜ l P )
Step 12. Determine the ranking values of the composite WASPAS measures. This step employs Equations (10) to (23) (the proposed ROG-based ranking technique) to determine ranking values ( S i ) for the composite WASPAS measurements of the alternatives (suppliers). These ranking values will be utilized as relative scores for suppliers in the evaluation and order allocation model.
S i = C R ( Q ˜ ˜ i )

3.4. A Mathematical Model for the SSOA Problem

In this sub-section, a multi-objective mathematical model is presented for the supplier selection and order allocation problem. The model is based on the minimization of the total purchasing cost and total distance, and the maximization of the total scores of the selected suppliers. The aim of this model is to select the most suitable supplier for some production centers and determine the number of orders for the selected suppliers. Notations of the model are represented in Table 3.
Using the fuzzy multi-objective programming approach [91], the SSOA problem considered in this study is defined as follows.
M a x   λ
Z 1 = i j c i j o x i j o
Z 2 = i j d i j x i j o
Z 3 = i j S i x i j o
λ 1 Z 1 Z 1 m i n Z 1 m a x Z 1 m i n
λ 1 Z 2 Z 2 m i n Z 2 m a x Z 2 m i n
λ 1 + Z 3 Z 3 m a x Z 3 m a x Z 3 m i n
j x i j o y i O i m i n           i
j x i j o y i C P i           i
i x i j o = D E M j           j
i y i K m i n
x i j o 0   and   y i { 0 , 1 }
To obtain the minimum and maximum values of Z 1 , Z 2 and Z 3 , the model needs to be solved separately by considering the related objective functions and constraints (35h) to (35l). By defining the objective functions in Equations (35b) to (35d) and maximizing λ through the constraints in (35e) to (35g), these functions can achieve values that approach their ideal states. The relative score of the i th supplier in Equation (35d) is determined using the MCDM approach presented in the previous subsection. The minimum order allocated to selected suppliers is defined by constraint (35h), while constraint (35i) requires that the order quantity of the selected suppliers does not exceed their maximum supply capacity. The purpose of constraint (35j) is to ensure that the selected suppliers’ order quantity satisfies the minimum demand requirement of each production center. To have a more reliable procurement process, it is common to select multiple suppliers for a production center. Therefore, constraint (35k) sets a minimum number of suppliers that must be selected. Constraint (35l) shows the type of variables.
The procedure for using the methodology is presented in Figure 2.

4. Results and Discussion

In this section, firstly the proposed methodology is applied to deal with a sustainable SSOA problem. Then the results are discussed through a sensitivity analysis.

4.1. The Application of the Methodology in Sustainable SSOA

The proposed methodology was used to deal with an example of the SSOA problem in a company. The company operates in the food industry with more than 200 employees in Golestan, Iran. It has two production centers ( P C 1 and P C 2 ) and needs to purchase raw materials from some potential suppliers. The company’s management team is highly qualified and has extensive experience in the industry. They must decide which suppliers to purchase from and determine the quantity of raw materials to order. The company has implemented various measures to reduce waste, use renewable energy sources, and optimize its logistics operations. It has a strong commitment to sustainability and is actively involved in various initiatives to reduce its carbon footprint. The following is the description of using different steps of the proposed MCDM approach and using the mathematical model in selecting suppliers and allocating orders to them.
Step 1. In this step, a group of experts was formed. This group consists of two experts from the procurement department ( D 1 and D 2 ), two experts from the operations department ( D 3 and D 4 ), two experts from the finance department ( D 5 and D 6 ), one expert from the marketing department ( D 7 ), and one expert from the research and development (R&D) department ( D 8 ). The experts have a good knowledge of fuzzy sets, decision-making techniques and supply chain management practices and principles. Table 4 presents some details about the experts.
By bringing together decision-makers from these different departments, the company can ensure that all relevant factors are considered and that the selected suppliers meet the company’s requirements and standards. Each department brings its unique expertise and perspective to the decision-making process, resulting in a well-informed and comprehensive decision.
Step 2. The potential suppliers and evaluation criteria should be identified in this step. The decision-making group has identified eight potential suppliers ( S u p 1 to S u p 8 ) which can be seen in Figure 3. These alternatives need to be evaluated with respect to sustainability criteria. According to the literature, the decision-making group agreed on fifteen criteria within three dimensions of sustainability [92,93,94,95]. The criteria and their descriptions are presented in Table 5.
Steps 3 to 5. In these steps, the experts expressed their evaluations on each criterion based on a scale ranging from 0 to 100, then they were asked to evaluate each supplier with respect to the criteria using linguistic variables. The data from these steps are presented in Table 6 and Table 7. It should be noted that the experts’ evaluations of the suppliers are partially provided in Table 7 due to limitations in space. The detailed data can be found in Reference [96], named Evaluation Data. According to the evaluations of the experts on each criterion, the subjective criteria weights can be determined using the SMART method and Equation (24). The subjective weights are shown in the last column of Table 6.
Step 6. The interval type-2 fuzzy decision-matrix can be calculated based on Table 7 and Equation (25). According to the number of suppliers and criteria in this case, the matrix has 120 (8 × 15) elements which are defined as trapezoidal IT2FSs. Due to limitations in space, it is not possible to present all of the elements of the decision-matrix in this paper. The decision-matrix is partially provided in Table 8, and the detailed matrix can be found in Reference [96], named Decision Matrix.
Steps 7 and 8. According to the decision-matrix obtained in the previous step, the defuzzified decision matrix was calculated. Then the MEREC method was used and the objective weights of the criteria were determined. The defuzzified decision matrix and the objective criteria weights are represented in Table 9. Based on the objective weights of the criteria and the subjective weights obtained in the previous steps, the combined weights can be calculated. The last column of Table 9 shows the combined weights of the criteria. It should be noted that ω = 0.5 was considered for the combination parameter.
Steps 9 to 11. Based on the decision-matrix obtained in Step 6, and Equation (28), the normalized decision-matrix can be computed. Because of limitations in space, this matrix is not presented with details. The partial version of the normalized matrix is presented in Table 10, the detailed version can be found in Reference [96], named Normalized Decision Matrix.
Steps 10 and 11. According to the normalized decision-matrix and Equations (29) to (33), the values of WSM ( Q ˜ ˜ i S ), WPM ( Q ˜ ˜ i p ) and composite WASPAS measure ( Q ˜ ˜ i ) were computed. The computations were carried out with γ = 0.5. These values are shown in Table 11.
Step 12. Using the ROG-based method proposed for the comparative ranking of IT2FSs, the ranking values ( S i ) or relative scores for suppliers were determined in this step. These values in addition to the other parameters related to the considered company are presented in Table 12. Based on these parameters and Model (35) the SSOA problem was solved, and the quantity of the order from each supplier was obtained. The outcomes of solving the SSOA problem are shown in Table 13. It should be noted that the solver of LINGO 18 Software (Commercial Version) was used to handle the optimization problem.
The information presented in Table 13 suggests that for meeting the demand of Production Center 1, Suppliers 1, 2, and 5 are identified as suitable suppliers, while for Production Center 2, Suppliers 6 and 8 are considered as the optimal options. It is important to note that the selection of suppliers for each production center was not solely based on their relative scores or performance ratings. The proposed methodology also considered the order quantities that each supplier could provide to ensure that the total demand of each production center could be met.

4.2. Sensitivity Analysis

Performing a sensitivity analysis on the weights of criteria used for supplier selection and order allocation can provide valuable insights into the decision-making process and help companies to make more informed choices. It is essential to conduct such an analysis because the weights assigned to each criterion can significantly impact the relative scores of the suppliers. Since one of the objective functions of the mathematical model is related to the relative scores the changes in the weights can affect the quantity of orders allocated to suppliers. By conducting a sensitivity analysis, companies can test different weight combinations and observe the effect of each change on the final scores of suppliers and order allocation. This analysis can help companies understand the trade-offs between different criteria and make a more balanced decision. Additionally, performing a sensitivity analysis can help companies identify which criteria have the most significant impact on supplier selection and order allocation decisions. To make this analysis, a pattern of changing weights has been used in this study. The pattern of changing weights involves defining m sets, where m is the total number of criteria being considered. In each set, one criterion is assigned the highest weight, while another is assigned the lowest weight. The remaining criteria are assigned weights that lie between these two extremes. These weights are presented in Table 14 and graphically shown in Figure 4.
The weights provided in Table 14 were used instead of w j c in Equation (27) to see the changes in the relative scores of the suppliers. The variations in the relative scores of each supplier can be seen in Figure 5. Based on the data presented in Figure 5, it appears that the relative score of Supplier 5 remains consistently stable across all sets, suggesting a high degree of reliability in terms of meeting the defined criteria. Suppliers 1 and 6 also demonstrate a relatively stable score, albeit with some minor variations. Conversely, the scores of the remaining suppliers appear to vary considerably with changes in the criteria weights across the different sets. It is worth noting that a stable relative score can be interpreted as a higher degree of consistency in meeting the defined criteria, and therefore, may be indicative of a more reliable supplier. This pattern of changing weights allows companies to test the impact of assigning different levels of importance to each criterion and observe the resulting effect on supplier selection and order allocation.
The results presented in Figure 6 reveal the effects of changing the criteria weights on the resulting order quantities for two production centers. Specifically, the order quantity for Production Center 1 varies for Suppliers 1, 2, 4, and 5, while Supplier 1 consistently receives the highest order quantity allocation. For Production Center 2, the order quantity varies for Suppliers 5, 7, and 8, but a fixed quantity of orders is allocated to Supplier 6. These findings have important implications for supplier selection and order allocation decisions. Firstly, they highlight the importance of considering the relative scores of the suppliers when allocating orders, as Supplier 1 consistently receives the highest order quantity allocation for Production Center 1, indicating that it is the most reliable supplier for this production center. Similarly, Supplier 6 receives a fixed quantity of orders for Production Center 2, suggesting that it is the most reliable supplier for this production center. Furthermore, the analysis underscores the need to consider the effects of the criteria weights on the relative scores of the suppliers. The relative scores of Suppliers 1, 5, and 6 remain relatively stable across the different sets of criteria weights, indicating that they are more robust and reliable suppliers. In contrast, the relative scores of Suppliers 2, 3, 4, 7, and 8 vary significantly across the different sets of criteria weights, highlighting their sensitivity to changes in the criteria weights. Therefore, the results of the sensitivity analysis suggest that suppliers with more stable relative scores are generally more reliable, as they are less affected by changes in the criteria weights. Overall, the findings demonstrate the importance of conducting sensitivity analysis on the effects of criteria weights on supplier selection and order allocation decisions. This can help decision-makers identify the most reliable suppliers and allocate orders in a way that maximizes efficiency and sustainability criteria.

4.3. Comparative Analysis

The subsection in your paper presents a comprehensive comparison between the results of the proposed method and those of six other well-established methods, namely Simple Additive Weighting (SAW), Complex Proportional Assessment (COPRAS), TOPSIS, VIKOR (stands for “VIekriterijumsko KOmpromisno Rangiranje”), Evaluation Based on Distance from Average Solution (EDAS), and MULTIMOORA. This comparison aims to validate the accuracy and efficiency of the proposed method while identifying its strengths and weaknesses relative to other methods. To measure the strength of the relationship between the results, the study uses Spearman’s rank correlation coefficient ( ρ ), which is a robust measure of the correlation between the rankings obtained from the proposed method and the rankings from the other methods. Table 15 presents the ranking results of different methods and the correlation coefficient.
The results show that Supplier 6 has the first rank in the results of all methods except VIKOR, where it ranks second. Meanwhile, Supplier 1 has the second rank in the results of all methods except VIKOR, where it ranks first. Additionally, Supplier 5 ranks third in all of the six methods. Based on the interpretation of correlation values presented by Walters [97], the values of Spearman’s rank correlation coefficient demonstrate a very strong relationship between the results of the proposed method and those of the other methods. This confirms the validity of the results obtained from the proposed method and suggests that it is a reliable and effective tool for supplier selection.

5. Conclusions

The SSOA problem is a critical aspect of supply chain management. Efficient supplier selection and order allocation can significantly impact the overall sustainability of the supply chain. The SSOA problem becomes more complex when considering sustainability criteria, as these criteria are often uncertain and subjective. Therefore, the development of effective methodologies for sustainable SSOA is crucial for achieving sustainability goals in the supply chain. The proposed methodology in this study integrates multiple techniques to address the sustainable SSOA problem. The methodology utilizes a new ranking method based on the concept of Radius of Gyration for interval type-2 fuzzy sets, which can handle the uncertainty in supplier evaluation. To determine the weights of evaluation criteria, both subjective weights obtained using the SMART and expert preferences, and objective weights calculated using the MEREC method are combined. The proposed methodology also incorporates sustainability criteria and uses the WASPAS method to evaluate supplier performance as type-2 fuzzy sets. The ROG-based ranking method is then employed to calculate the relative scores of suppliers, and an MODM linear mathematical model is presented to identify suitable suppliers and allocate their order quantities. The proposed methodology was applied to a sustainable SSOA problem in Golestan, Iran. The results demonstrated that the proposed approach was effective in selecting suitable suppliers and allocating their order quantities based on sustainability criteria. The application of the proposed methodology resulted in the selection of five suitable suppliers and the allocation of orders among them. The sensitivity analysis also showed that the proposed methodology was robust and could handle changes in the weight of evaluation criteria. Future research can be conducted in various directions to further enhance the proposed methodology. To further improve the understanding of the advantages of a ROG-based approach, a comprehensive comparison with other ranking approaches could be conducted in future research. Other types of fuzzy sets and membership functions, such as symmetric IT2FSs, Fermatean fuzzy sets and Pythagorean fuzzy sets, can be explored to evaluate supplier performance. Additionally, other weighting methods, such as SWARA (Stepwise Weight Assessment Ratio Analysis) and SECA (Simultaneous Evaluation of Criteria and Alternatives), can be used to determine the weights of evaluation criteria. Furthermore, other MCDM methods, such as CoCoSo (Combined Compromise Solution) and MARCOS (Measurement of Alternatives and Ranking according to COmpromise Solution), can be investigated to compare their performance with the proposed approach. The proposed method can also be extended to a dynamic decision-making approach. This could involve setting up rules or algorithms to adjust the decision based on predefined criteria or using machine learning techniques to learn from past decisions and adjust the decision-making process accordingly. Overall, the proposed methodology provides a solid foundation for future research and can be further enhanced to tackle more complex sustainability challenges in the supply chain.

Funding

This research received no external funding.

Data Availability Statement

Not applicable.

Conflicts of Interest

The author declares no conflict of interest.

References

  1. Vahidi, F.; Torabi, S.A.; Ramezankhani, M.J. Sustainable supplier selection and order allocation under operational and disruption risks. J. Clean. Prod. 2018, 174, 1351–1365. [Google Scholar] [CrossRef]
  2. Ghadimi, P.; Ghassemi Toosi, F.; Heavey, C. A multi-agent systems approach for sustainable supplier selection and order allocation in a partnership supply chain. Eur. J. Oper. Res. 2018, 269, 286–301. [Google Scholar] [CrossRef]
  3. Ashby, A.; Leat, M.; Hudson-Smith, M. Making connections: A review of supply chain management and sustainability literature. Supply Chain. Manag. Int. J. 2012, 17, 497–516. [Google Scholar] [CrossRef]
  4. Giri, B.C.; Molla, M.U.; Biswas, P. Pythagorean fuzzy DEMATEL method for supplier selection in sustainable supply chain management. Expert Syst. Appl. 2022, 193, 116396. [Google Scholar] [CrossRef]
  5. Yadav, S.; Choi, T.-M.; Kumar, A.; Luthra, S.; Naz, F. A meta-analysis of sustainable supply chain practices and performance: The moderating roles of type of economy and innovation. Int. J. Oper. Prod. Manag. 2023, 43, 802–845. [Google Scholar] [CrossRef]
  6. Acerbi, F.; Rocca, R.; Fumagalli, L.; Taisch, M. Enhancing the cosmetics industry sustainability through a renewed sustainable supplier selection model. Prod. Manuf. Res. 2023, 11, 2161021. [Google Scholar] [CrossRef]
  7. Wilhelm, M.M.; Blome, C.; Bhakoo, V.; Paulraj, A. Sustainability in multi-tier supply chains: Understanding the double agency role of the first-tier supplier. J. Oper. Manag. 2016, 41, 42–60. [Google Scholar] [CrossRef]
  8. Manupati, V.K.; Schoenherr, T.; Ramkumar, M.; Wagner, S.M.; Pabba, S.K.; Inder Raj Singh, R. A blockchain-based approach for a multi-echelon sustainable supply chain. Int. J. Prod. Res. 2020, 58, 2222–2241. [Google Scholar] [CrossRef]
  9. Zeballos, L.J.; Méndez, C.A.; Barbosa-Povoa, A.P.; Novais, A.Q. Multi-period design and planning of closed-loop supply chains with uncertain supply and demand. Comput. Chem. Eng. 2014, 66, 151–164. [Google Scholar] [CrossRef]
  10. Rösner, T. Supplier selection and order allocation in purchasing and supply management: A systematic literature review. Int. J. Procure. Manag. 2022, 16, 31–74. [Google Scholar] [CrossRef]
  11. Gören, H.G. A decision framework for sustainable supplier selection and order allocation with lost sales. J. Clean. Prod. 2018, 183, 1156–1169. [Google Scholar] [CrossRef]
  12. Tronnebati, I.; El Yadari, M.; Jawab, F. A Review of Green Supplier Evaluation and Selection Issues Using MCDM, MP and AI Models. Sustainability 2022, 14, 16714. [Google Scholar] [CrossRef]
  13. Keshavarz-Ghorabaee, M.; Amiri, M.; Zavadskas, E.K.; Turskis, Z.; Antuchevičienė, J. Ranking of Bridge Design Alternatives: A TOPSIS-FADR Method. Balt. J. Road Bridge Eng. 2018, 13, 209–237. [Google Scholar] [CrossRef]
  14. Resende, C.H.L.; Geraldes, C.A.S.; Lima, F.R. Decision Models for Supplier Selection in Industry 4.0 Era: A Systematic Literature Review. Procedia Manuf. 2021, 55, 492–499. [Google Scholar] [CrossRef]
  15. Paul, A.; Shukla, N.; Paul, S.K.; Trianni, A. Sustainable Supply Chain Management and Multi-Criteria Decision-Making Methods: A Systematic Review. Sustainability 2021, 13, 7104. [Google Scholar] [CrossRef]
  16. Gupta, P.; Govindan, K.; Mehlawat, M.K.; Kumar, S. A weighted possibilistic programming approach for sustainable vendor selection and order allocation in fuzzy environment. Int. J. Adv. Manuf. Technol. 2016, 86, 1785–1804. [Google Scholar] [CrossRef]
  17. De Capua, C.; Morello, R.; Carbone, R. Measurement uncertainty in decision-making: How to take reliable decisions under uncertainty. Int. J. Meas. Technol. Instrum. Eng. 2011, 1, 40–52. [Google Scholar] [CrossRef]
  18. Chen, K.-S.; Chang, T.-C.; Huang, C.-C. Supplier Selection by Fuzzy Assessment and Testing for Process Quality under Consideration with Data Imprecision. Mathematics 2020, 8, 1420. [Google Scholar] [CrossRef]
  19. Xie, Y.; He, L.; Xiang, W.; Peng, Z.; Ming, X.; Goh, M. Prioritizing risk factors in sustainable supply chain using fuzzy Kano and interval-valued intuitionistic fuzzy QFD. Kybernetes 2022. [Google Scholar] [CrossRef]
  20. Smets, P. Imperfect Information: Imprecision and Uncertainty. In Uncertainty Management in Information Systems: From Needs to Solutions; Motro, A., Smets, P., Eds.; Springer: Boston, MA, USA, 1997; pp. 225–254. [Google Scholar] [CrossRef]
  21. Gonzalez, A.; Pons, O.; Vila, M.A. Dealing with uncertainty and imprecision by means of fuzzy numbers. Int. J. Approx. Reason. 1999, 21, 233–256. [Google Scholar] [CrossRef]
  22. Kaya, I.; Çolak, M.; Terzi, F. A comprehensive review of fuzzy multi criteria decision making methodologies for energy policy making. Energy Strategy Rev. 2019, 24, 207–228. [Google Scholar] [CrossRef]
  23. Farid, H.M.A.; Bouye, M.; Riaz, M.; Jamil, N. Fermatean Fuzzy CODAS Approach with Topology and Its Application to Sustainable Supplier Selection. Symmetry 2023, 15, 433. [Google Scholar] [CrossRef]
  24. Hailiang, Z.; Khokhar, M.; Islam, T.; Sharma, A. A model for green-resilient supplier selection: Fuzzy best–worst multi-criteria decision-making method and its applications. Environ. Sci. Pollut. Res. 2023, 30, 54035–54058. [Google Scholar] [CrossRef] [PubMed]
  25. Kaya, S.K. A novel two-phase group decision-making model for circular supplier selection under picture fuzzy environment. Environ. Sci. Pollut. Res. 2023, 30, 34135–34157. [Google Scholar] [CrossRef] [PubMed]
  26. Keshavarz Ghorabaee, M.; Amiri, M.; Zavadskas, E.K.; Antucheviciene, J. Supplier evaluation and selection in fuzzy environments: A review of MADM approaches. Econ. Res.-Ekon. Istraz. 2017, 30, 1073–1118. [Google Scholar] [CrossRef]
  27. Güneri, B.; Deveci, M. Evaluation of supplier selection in the defense industry using q-rung orthopair fuzzy set based EDAS approach. Expert Syst. Appl. 2023, 222, 119846. [Google Scholar] [CrossRef]
  28. Celik, E.; Gul, M. Hazard identification, risk assessment and control for dam construction safety using an integrated BWM and MARCOS approach under interval type-2 fuzzy sets environment. Autom. Constr. 2021, 127, 103699. [Google Scholar] [CrossRef]
  29. Liu, P.; Gao, H.; Ma, J. Novel green supplier selection method by combining quality function deployment with partitioned Bonferroni mean operator in interval type-2 fuzzy environment. Inf. Sci. 2019, 490, 292–316. [Google Scholar] [CrossRef]
  30. Keshavarz Ghorabaee, M.; Zavadskas, E.K.; Amiri, M.; Antucheviciene, J. Evaluation by an area-based method of ranking interval type-2 fuzzy sets (EAMRIT-2F) for multi-criteria group decision-making. Transform. Bus. Econ. 2016, 15, 76–95. [Google Scholar]
  31. Ecer, F. Multi-criteria decision making for green supplier selection using interval type-2 fuzzy AHP: A case study of a home appliance manufacturer. Oper. Res. 2022, 22, 199–233. [Google Scholar] [CrossRef]
  32. Yucesan, M.; Mete, S.; Serin, F.; Celik, E.; Gul, M. An Integrated Best-Worst and Interval Type-2 Fuzzy TOPSIS Methodology for Green Supplier Selection. Mathematics 2019, 7, 182. [Google Scholar] [CrossRef]
  33. Hoseini, S.A.; Hashemkhani Zolfani, S.; Skačkauskas, P.; Fallahpour, A.; Saberi, S. A Combined Interval Type-2 Fuzzy MCDM Framework for the Resilient Supplier Selection Problem. Mathematics 2022, 10, 44. [Google Scholar] [CrossRef]
  34. Boral, S.; Chaturvedi, S.K.; Howard, I.; Naikan, V.N.A.; McKee, K. An integrated interval type-2 fuzzy sets and multiplicative half quadratic programming-based MCDM framework for calculating aggregated risk ranking results of failure modes in FMECA. Process Saf. Environ. Prot. 2021, 150, 194–222. [Google Scholar] [CrossRef]
  35. Boral, S.; Chakraborty, S. Failure analysis of CNC machines due to human errors: An integrated IT2F-MCDM-based FMEA approach. Eng. Fail. Anal. 2021, 130, 105768. [Google Scholar] [CrossRef]
  36. Celik, E.; Gul, M.; Aydin, N.; Gumus, A.T.; Guneri, A.F. A comprehensive review of multi criteria decision making approaches based on interval type-2 fuzzy sets. Knowl. Based Syst. 2015, 85, 329–341. [Google Scholar] [CrossRef]
  37. Zardari, N.H.; Ahmed, K.; Shirazi, S.M.; Yusop, Z.B. Weighting Methods and their Effects on Multi-Criteria Decision Making Model Outcomes in Water Resources Management; Springer: New York, NY, USA, 2014. [Google Scholar]
  38. Keshavarz-Ghorabaee, M.; Amiri, M.; Zavadskas, E.K.; Turskis, Z.; Antucheviciene, J. Determination of Objective Weights Using a New Method Based on the Removal Effects of Criteria (MEREC). Symmetry 2021, 13, 525. [Google Scholar] [CrossRef]
  39. Zavadskas, E.K.; Turskis, Z.; Antucheviciene, J.; Zakarevicius, A. Optimization of weighted aggregated sum product assessment. Elektron. Ir. Elektrotechnika 2012, 122, 3–6. [Google Scholar] [CrossRef]
  40. Esmaeili-Najafabadi, E.; Fallah Nezhad, M.S.; Pourmohammadi, H.; Honarvar, M.; Vahdatzad, M.A. A joint supplier selection and order allocation model with disruption risks in centralized supply chain. Comput. Ind. Eng. 2019, 127, 734–748. [Google Scholar] [CrossRef]
  41. Moheb-Alizadeh, H.; Handfield, R. Sustainable supplier selection and order allocation: A novel multi-objective programming model with a hybrid solution approach. Comput. Ind. Eng. 2019, 129, 192–209. [Google Scholar] [CrossRef]
  42. Hosseini, S.; Morshedlou, N.; Ivanov, D.; Sarder, M.D.; Barker, K.; Khaled, A.A. Resilient supplier selection and optimal order allocation under disruption risks. Int. J. Prod. Econ. 2019, 213, 124–137. [Google Scholar] [CrossRef]
  43. Kellner, F.; Utz, S. Sustainability in supplier selection and order allocation: Combining integer variables with Markowitz portfolio theory. J. Clean. Prod. 2019, 214, 462–474. [Google Scholar] [CrossRef]
  44. Duan, C.-Y.; Liu, H.-C.; Zhang, L.-J.; Shi, H. An Extended Alternative Queuing Method with Linguistic Z-numbers and Its Application for Green Supplier Selection and Order Allocation. Int. J. Fuzzy Syst. 2019, 21, 2510–2523. [Google Scholar] [CrossRef]
  45. Mohammed, A.; Harris, I.; Govindan, K. A hybrid MCDM-FMOO approach for sustainable supplier selection and order allocation. Int. J. Prod. Econ. 2019, 217, 171–184. [Google Scholar] [CrossRef]
  46. Safaeian, M.; Fathollahi-Fard, A.M.; Tian, G.; Li, Z.; Ke, H. A multi-objective supplier selection and order allocation through incremental discount in a fuzzy environment. J. Intell. Fuzzy Syst. 2019, 37, 1435–1455. [Google Scholar] [CrossRef]
  47. Alegoz, M.; Yapicioglu, H. Supplier selection and order allocation decisions under quantity discount and fast service options. Sustain. Prod. Consum. 2019, 18, 179–189. [Google Scholar] [CrossRef]
  48. Mari, S.I.; Memon, M.S.; Ramzan, M.B.; Qureshi, S.M.; Iqbal, M.W. Interactive Fuzzy Multi Criteria Decision Making Approach for Supplier Selection and Order Allocation in a Resilient Supply Chain. Mathematics 2019, 7, 137. [Google Scholar] [CrossRef]
  49. Laosirihongthong, T.; Samaranayake, P.; Nagalingam, S. A holistic approach to supplier evaluation and order allocation towards sustainable procurement. Benchmarking Int. J. 2019, 26, 2543–2573. [Google Scholar] [CrossRef]
  50. Feng, J.; Gong, Z. Integrated linguistic entropy weight method and multi-objective programming model for supplier selection and order allocation in a circular economy: A case study. J. Clean. Prod. 2020, 277, 122597. [Google Scholar] [CrossRef]
  51. Khoshfetrat, S.; Rahiminezhad Galankashi, M.; Almasi, M. Sustainable supplier selection and order allocation: A fuzzy approach. Eng. Optim. 2020, 52, 1494–1507. [Google Scholar] [CrossRef]
  52. Jia, R.; Liu, Y.; Bai, X. Sustainable supplier selection and order allocation: Distributionally robust goal programming model and tractable approximation. Comput. Ind. Eng. 2020, 140, 106267. [Google Scholar] [CrossRef]
  53. Wong, J.-T. Dynamic procurement risk management with supplier portfolio selection and order allocation under green market segmentation. J. Clean. Prod. 2020, 253, 119835. [Google Scholar] [CrossRef]
  54. You, S.-Y.; Zhang, L.-J.; Xu, X.-G.; Liu, H.-C. A New Integrated Multi-Criteria Decision Making and Multi-Objective Programming Model for Sustainable Supplier Selection and Order Allocation. Symmetry 2020, 12, 302. [Google Scholar] [CrossRef]
  55. Rezaei, A.; Rahiminezhad Galankashi, M.; Mansoorzadeh, S.; Mokhatab Rafiei, F. Supplier Selection and Order Allocation with Lean Manufacturing Criteria: An Integrated MCDM and Bi-objective Modelling Approach. Eng. Manag. J. 2020, 32, 253–271. [Google Scholar] [CrossRef]
  56. Kaviani, M.A.; Peykam, A.; Khan, S.A.; Brahimi, N.; Niknam, R. A new weighted fuzzy programming model for supplier selection and order allocation in the food industry. J. Model. Manag. 2020, 15, 381–406. [Google Scholar] [CrossRef]
  57. Rezaei, S.; Ghalehkhondabi, I.; Rafiee, M.; Namdar Zanganeh, S. Supplier selection and order allocation in CLSC configuration with various supply strategies under disruption risk. OPSEARCH 2020, 57, 908–934. [Google Scholar] [CrossRef]
  58. Wang, C.; Yang, Q.; Dai, S. Supplier Selection and Order Allocation under a Carbon Emission Trading Scheme: A Case Study from China. Int. J. Environ. Res. Public Health 2020, 17, 111. [Google Scholar] [CrossRef] [PubMed]
  59. Çalık, A. A hybrid approach for selecting sustainable suppliers and determining order allocation based on interval type-2 fuzzy sets. J. Enterp. Inf. Manag. 2020, 33, 923–945. [Google Scholar] [CrossRef]
  60. Khalili Nasr, A.; Tavana, M.; Alavi, B.; Mina, H. A novel fuzzy multi-objective circular supplier selection and order allocation model for sustainable closed-loop supply chains. J. Clean. Prod. 2021, 287, 124994. [Google Scholar] [CrossRef]
  61. Kaur, H.; Prakash Singh, S. Multi-stage hybrid model for supplier selection and order allocation considering disruption risks and disruptive technologies. Int. J. Prod. Econ. 2021, 231, 107830. [Google Scholar] [CrossRef]
  62. Islam, S.; Amin, S.H.; Wardley, L.J. Machine learning and optimization models for supplier selection and order allocation planning. Int. J. Prod. Econ. 2021, 242, 108315. [Google Scholar] [CrossRef]
  63. Rezaei, A.; Aghsami, A.; Rabbani, M. Supplier selection and order allocation model with disruption and environmental risks in centralized supply chain. Int. J. Syst. Assur. Eng. Manag. 2021, 12, 1036–1072. [Google Scholar] [CrossRef]
  64. Firouzi, F.; Jadidi, O. Multi-objective model for supplier selection and order allocation problem with fuzzy parameters. Expert Syst. Appl. 2021, 180, 115129. [Google Scholar] [CrossRef]
  65. Li, F.; Wu, C.-H.; Zhou, L.; Xu, G.; Liu, Y.; Tsai, S.-B. A model integrating environmental concerns and supply risks for dynamic sustainable supplier selection and order allocation. Soft. Comput. 2021, 25, 535–549. [Google Scholar] [CrossRef]
  66. Yousefi, S.; Jahangoshai Rezaee, M.; Solimanpur, M. Supplier selection and order allocation using two-stage hybrid supply chain model and game-based order price. Oper. Res. 2021, 21, 553–588. [Google Scholar] [CrossRef]
  67. Beiki, H.; Mohammad Seyedhosseini, S.; Ponkratov, V.; Olegovna Zekiy, A.; Ivanov, S.A. Addressing a sustainable supplier selection and order allocation problem by an integrated approach: A case of automobile manufacturing. J. Ind. Prod. Eng. 2021, 38, 239–253. [Google Scholar] [CrossRef]
  68. Esmaeili-Najafabadi, E.; Azad, N.; Saber Fallah Nezhad, M. Risk-averse supplier selection and order allocation in the centralized supply chains under disruption risks. Expert Syst. Appl. 2021, 175, 114691. [Google Scholar] [CrossRef]
  69. Mohammed, A.; Harris, I.; Soroka, A.; Naim, M.; Ramjaun, T.; Yazdani, M. Gresilient supplier assessment and order allocation planning. Ann. Oper. Res. 2021, 296, 335–362. [Google Scholar] [CrossRef]
  70. Hosseini, Z.S.; Flapper, S.D.; Pirayesh, M. Sustainable supplier selection and order allocation under demand, supplier availability and supplier grading uncertainties. Comput. Ind. Eng. 2022, 165, 107811. [Google Scholar] [CrossRef]
  71. Ali, H.; Zhang, J.; Liu, S.; Shoaib, M. An integrated decision-making approach for global supplier selection and order allocation to create an environment-friendly supply chain. Kybernetes 2022. ahead-of-print. [Google Scholar] [CrossRef]
  72. Goodarzi, F.; Abdollahzadeh, V.; Zeinalnezhad, M. An integrated multi-criteria decision-making and multi-objective optimization framework for green supplier evaluation and optimal order allocation under uncertainty. Decis. Anal. J. 2022, 4, 100087. [Google Scholar] [CrossRef]
  73. Liaqait, R.A.; Warsi, S.S.; Agha, M.H.; Zahid, T.; Becker, T. A multi-criteria decision framework for sustainable supplier selection and order allocation using multi-objective optimization and fuzzy approach. Eng. Optim. 2022, 54, 928–948. [Google Scholar] [CrossRef]
  74. Gai, L.; Liu, H.-C.; Wang, Y.; Xing, Y. Green supplier selection and order allocation using linguistic Z-numbers MULTIMOORA method and bi-objective non-linear programming. Fuzzy Optim. Decis. Mak. 2022. [Google Scholar] [CrossRef]
  75. Aouadni, S.; Euchi, J. Using Integrated MMD-TOPSIS to Solve the Supplier Selection and Fair Order Allocation Problem: A Tunisian Case Study. Logistics 2022, 6, 8. [Google Scholar] [CrossRef]
  76. Galankashi, M.R.; Rezaei, A.; Keyvanpazhooh, M.; Rafiei, F.M. Assessment of suppliers and optimum order allocation in agile automotive manufacturing companies. Int. J. Ind. Syst. Eng. 2022, 42, 245–276. [Google Scholar] [CrossRef]
  77. Liu, P.; Hendalianpour, A.; Fakhrabadi, M.; Feylizadeh, M. Integrating IVFRN-BWM and Goal Programming to Allocate the Order Quantity Considering Discount for Green Supplier. Int. J. Fuzzy Syst. 2022, 24, 989–1011. [Google Scholar] [CrossRef]
  78. Bai, C.; Zhu, Q.; Sarkis, J. Supplier portfolio selection and order allocation under carbon neutrality: Introducing a “Cool”ing model. Comput. Ind. Eng. 2022, 170, 108335. [Google Scholar] [CrossRef]
  79. Ahmad, M.T.; Firouz, M.; Mondal, S. Robust supplier-selection and order-allocation in two-echelon supply networks: A parametric tolerance design approach. Comput. Ind. Eng. 2022, 171, 108394. [Google Scholar] [CrossRef]
  80. Chen, S.-M.; Lee, L.-W. Fuzzy multiple attributes group decision-making based on the interval type-2 TOPSIS method. Expert Syst. Appl. 2010, 37, 2790–2798. [Google Scholar] [CrossRef]
  81. Celik, E.; Bilisik, O.N.; Erdogan, M.; Gumus, A.T.; Baracli, H. An integrated novel interval type-2 fuzzy MCDM method to improve customer satisfaction in public transportation for Istanbul. Transp. Res. Part E Logist. Transp. Rev. 2013, 58, 28–51. [Google Scholar] [CrossRef]
  82. Keshavarz Ghorabaee, M.; Amiri, M.; Salehi Sadaghiani, J.; Zavadskas, E.K. Multi-criteria project selection using an extended VIKOR method with interval type-2 fuzzy sets. Int. J. Inf. Technol. Decis. Mak. 2015, 14, 993–1016. [Google Scholar] [CrossRef]
  83. Kahraman, C.; Öztayşi, B.; Uçal Sarı, İ.; Turanoğlu, E. Fuzzy analytic hierarchy process with interval type-2 fuzzy sets. Knowl. Based Syst. 2014, 59, 48–57. [Google Scholar] [CrossRef]
  84. Lee, E.S.; Li, R.J. Comparison of fuzzy numbers based on the probability measure of fuzzy events. Comput. Math. Appl. 1988, 15, 887–896. [Google Scholar] [CrossRef]
  85. Cheng, C.-H. A new approach for ranking fuzzy numbers by distance method. Fuzzy Sets Syst. 1998, 95, 307–317. [Google Scholar] [CrossRef]
  86. Chu, T.-C.; Tsao, C.-T. Ranking fuzzy numbers with an area between the centroid point and original point. Comput. Math. Appl. 2002, 43, 111–117. [Google Scholar] [CrossRef]
  87. Deng, Y.; Zhenfu, Z.; Qi, L. Ranking fuzzy numbers with an area method using radius of gyration. Comput. Math. Appl. 2006, 51, 1127–1136. [Google Scholar] [CrossRef]
  88. Xu, Z. Algorithm for priority of fuzzy complementary judgment matrix. J. Syst. Eng. 2001, 16, 311–314. [Google Scholar]
  89. Chen, S.-M.; Lee, L.-W. Fuzzy multiple attributes group decision-making based on the ranking values and the arithmetic operations of interval type-2 fuzzy sets. Expert Syst. Appl. 2010, 37, 824–833. [Google Scholar] [CrossRef]
  90. Mardani, A.; Nilashi, M.; Zakuan, N.; Loganathan, N.; Soheilirad, S.; Saman, M.Z.M.; Ibrahim, O. A systematic review and meta-Analysis of SWARA and WASPAS methods: Theory and applications with recent fuzzy developments. Appl. Soft. Comput. 2017, 57, 265–292. [Google Scholar] [CrossRef]
  91. Zimmermann, H.J. Fuzzy programming and linear programming with several objective functions. Fuzzy Sets Syst. 1978, 1, 45–55. [Google Scholar] [CrossRef]
  92. Schramm, V.B.; Cabral, L.P.B.; Schramm, F. Approaches for supporting sustainable supplier selection—A literature review. J. Clean. Prod. 2020, 273, 123089. [Google Scholar] [CrossRef]
  93. Zimmer, K.; Fröhling, M.; Schultmann, F. Sustainable supplier management—A review of models supporting sustainable supplier selection, monitoring and development. Int. J. Prod. Res. 2016, 54, 1412–1442. [Google Scholar] [CrossRef]
  94. Rashidi, K.; Noorizadeh, A.; Kannan, D.; Cullinane, K. Applying the triple bottom line in sustainable supplier selection: A meta-review of the state-of-the-art. J. Clean. Prod. 2020, 269, 122001. [Google Scholar] [CrossRef]
  95. Koberg, E.; Longoni, A. A systematic review of sustainable supply chain management in global supply chains. J. Clean. Prod. 2019, 207, 1084–1098. [Google Scholar] [CrossRef]
  96. Keshavarz-Ghorabaee, M. Supplementary data for “Sustainable supplier selection and order allocation using an integrated ROG-based type-2 fuzzy decision-making approach”. Figshare 2023. [Google Scholar] [CrossRef]
  97. Walters, S.J. Quality of Life Outcomes in Clinical Trials and Health-Care Evaluation: A Practical Guide to Analysis and Interpretation; Wiley: New York, NY, USA, 2009. [Google Scholar]
Figure 1. Trapezoidal IT2FS representation.
Mathematics 11 02014 g001
Figure 2. The framework of the methodology.
Mathematics 11 02014 g002
Figure 3. The geographical representation of the suppliers and production centers.
Mathematics 11 02014 g003
Figure 4. The pattern of changing criteria weights.
Mathematics 11 02014 g004
Figure 5. The effect of changing criteria weights on the relative scores of the suppliers.
Mathematics 11 02014 g005
Figure 6. The effect of changing criteria weights on the order quantity.
Mathematics 11 02014 g006
Table 1. Summary of the reviewed studies.
No.Author(s) and ReferenceYear of PublicationDescription of the Approach for SSOA
1Esmaeili-Najafabadi et al. [40]2019An MINLP model that incorporates two precautionary measures aimed at mitigating disruption risks
2Moheb-Alizadeh and Handfield [41]2019An MODM model considering multiple periods, products, and transportation modes
3Hosseini et al. [42]2019A graphical model to obtain the likelihood of disruption scenarios for SSOA
4Kellner and Utz [43]2019An MODM model for evaluation of supplier sustainability based on costs and supply risk.
5Duan et al. [44]2019An integrated model for SSOA by combining AQM, linguistic Z-numbers, and an MODM model
6Mohammed et al. [45]2019A hybrid approach based on AHP, fuzzy TOPSIS and an MODM model
7Safaeian et al. [46]2019An MODM model based on the Zimmermann fuzzy approach and NSGA
8Alegoz and Yapicioglu [47]2019A hybrid approach based on trapezoidal type-2 fuzzy AHP, fuzzy TOPSIS and goal programming
9Mari et al. [48]2019A possibilistic fuzzy MODM model and an interactive fuzzy optimization methodology
10Laosirihongthong et al. [49]2019An approach based on the fuzzy AHP and a cost-minimization model
11Feng and Gong [50]2020An integrated approach using MODM and the linguistic entropy weight method
12Khoshfetrat et al. [51]2020An integrated approach based on AHP and MODM model in a fuzzy environment
13Jia et al. [52]2020A robust MODM model based on four conflicting objectives
14Wong [53]2020A fuzzy goal programming model that considered various factors like suppliers’ dynamic risk
15You et al. [54]2020A framework that employed Double Hierarchy Hesitant Linguistic Term Sets
16Rezaei et al. [55]2020An integrated approach using the AHP method and MODM model
17Kaviani et al. [56]2020An approach that combined fuzzy multi-objective optimization and intuitionistic fuzzy AHP
18Rezaei et al. [57]2020A two-stage model based on stochastic programming that uses a conditional value-at-risk
19Wang et al. [58]2020A model based on ANP and integer programming
20Çalık [59]2020An approach based on the AHP method, interval type-2 fuzzy sets and MODM model
21Khalili Nasr et al. [60]2021A two-stage model based on a fuzzy BWM and a linear MODM model
22Kaur and Prakash Singh [61]2021An integrated approach based on DEA, fuzzy AHP, and TOPSIS
23Islam et al. [62]2021A new two-stage approach based on a Relational Regressor Chain, ε-constraint and weighted-sum methods
24Rezaei et al. [63]2021A framework based on MINLP models, risk reduction strategies and FMEA technique
25Firouzi and Jadidi [64]2021A fuzzy MODM model that could manage the uncertainties brought about by disasters
26Li et al. [65]2021An approach based on the risk value assessed and an MODM model
27Yousefi et al. [66]2021A two-stage hybrid approach that employed DEA and an MODM model
28Beiki et al. [67]2021A new approach by combining an MODM model with the language entropy weight method
29Esmaeili-Najafabadi et al. [68]2021A multi-objective approach based on VaR, CVaR, and PSO
30Mohammed et al. [69]2021An integrated approach based on AHP, TOPSIS, and the ε-constraint method
31Hosseini et al. [70]2022An approach based on the evidential reasoning, BWM, stochastic programming and dynamic programming
32Ali et al. [71]2022A hybrid approach using fuzzy AHP, fuzzy TOPSIS and an MODM model
33Goodarzi et al. [72]2022A framework based on fuzzy Delphi, Gray Correlation method, TOPSIS and MODM models
34Liaqait et al. [73]2022 Fuzzy MCDM techniques, demand forecasting, and MODM mathematical models
35Gai et al. [74]2022A two-stage approach that incorporated linguistic Z-Numbers, MULTIMOORA, and an MODM model
36Aouadni and Euchi [75]2022A hybrid methodology based on BWM, TOPSIS and bi-objective programming
37Galankashi et al. [76]2022An integrated approach based on a fuzzy AHP and an MODM model with multiple periods
38Liu et al. [77]2022An approach based on a modified BWM method and goal programming
39Bai et al. [78]2022An MODM mathematical model that can assess various procurement policies
40Ahmad et al. [79]2022An integrated approach based on an MINLP model and the Taguchi Method of Tolerance Design
Table 2. The linguistic variables and related fuzzy numbers.
Linguistic VariablesTrapezoidal IT2FSs
Very Poor (VP)((0, 0, 0, 1; 1), (0, 0, 0, 0.5; 0.9))
Poor (P)((0, 1, 1.5, 3; 1), (0.5, 1, 1.5, 2; 0.9))
Medium Poor (MP)((1, 3, 3.5, 5; 1), (2, 3, 3.5, 4; 0.9))
Fair (F)((3, 5, 5.5, 7; 1), (4, 5, 5.5, 6; 0.9))
Medium Good (MG)((5, 7, 7.5, 9; 1), (6, 7, 7.5, 8; 0.9))
Good (G)((7, 8.5, 9, 10; 1), (8, 8.5, 9, 9.5; 0.9))
Very Good (VG)((9, 10, 10, 10; 1), (9.5, 10, 10, 10; 0.9))
Table 3. Notations of the SSOA model.
Parameters/VariablesDescription
c i j o Unit purchasing cost of the i th supplier for j th production center
d i j Distance between i th supplier and j th production center
S i The relative score of i th supplier
O i m i n Minimum quantity to be ordered from i th supplier
C P i Supply capacity of i th supplier
D E M j Demand of j th production center
K m i n Minimum number of suppliers that need to be selected
x i j o Variable: order quantity of the i th supplier for j th production center
y i Binary variable: = 1 if i th supplier is selected; = 0 otherwise
Z 1 Total purchasing cost
Z 1 m i n Minimum value of Z 1
Z 1 m a x Maximum value of Z 1
Z 2 Total distance-based measure
Z 2 m i n Minimum value of Z 2
Z 2 m a x Maximum value of Z 2
Z 3 Total relative score of selected suppliers
Z 3 m i n Minimum value of Z 3
Z 3 m a x Maximum value of Z 3
Table 4. Information about experts.
ExpertDepartmentJob TitleYears of ExperienceGenderAcademic Degree
D 1 Procurement departmentPurchasing Director8MalePhD in Management
D 2 Procurement departmentSourcing Specialist6FemaleMA in Business Management
D 3 Operations departmentOperations Manager7MalePhD in Operations Research
D 4 Operations departmentSupply Chain Analyst2FemaleBA in Industrial Engineering
D 5 Finance departmentFinance manager8FemaleMA in Accounting & Finance
D 6 Finance departmentRisk analyst4MaleBA in Accounting & Finance
D 7 Marketing departmentChief marketing officer7MaleMA in Marketing
D 8 R&D departmentProject manager10MalePhD in Industrial Engineering
Table 5. The evaluation criteria and their descriptions.
DimensionCriteriaDescription
Environmental
sustainability
Climate change mitigation ( C 11 )This involves reducing greenhouse gas emissions and implementing measures to mitigate the effects of climate change, such as investing in renewable energy, improving energy efficiency, and adopting low-carbon transportation options.
Resource conservation ( C 12 )This involves reducing the consumption of non-renewable resources and conserving natural resources such as water, land, and forests. Companies can achieve this by implementing sustainable sourcing practices, using recycled materials, and minimizing waste.
Pollution prevention ( C 13 )This involves minimizing or eliminating the release of harmful substances into the environment, such as toxic chemicals or air pollutants. Companies can achieve this by implementing pollution prevention measures, such as using clean production processes, reducing emissions, and properly disposing of hazardous waste.
Biodiversity conservation ( C 14 )This involves protecting and conserving biodiversity and ecosystem services, such as pollination, soil fertility, and water quality. Companies can achieve this by using sustainable land management practices, protecting endangered species and habitats, and reducing deforestation.
Adoption of circular economy principles ( C 15 )This involves moving away from the traditional linear model of “take-make-dispose” and instead adopting a circular economy model where waste is minimized and resources are kept in use for as long as possible. This can be achieved by implementing recycling programs, designing products for reuse, and finding ways to extend the lifespan of products.
Social
sustainability
Labor standards ( C 21 )This involves ensuring fair wages, safe working conditions, and other labor standards throughout the supply chain. Companies can achieve this by implementing codes of conduct for suppliers, auditing their supply chains for compliance, and providing training and support to suppliers to help them meet these standards.
Human rights ( C 22 )This involves respecting and promoting human rights, including freedom from discrimination, the right to privacy, and the right to freedom of association. Companies can achieve this by implementing human rights policies, engaging with stakeholders to understand their concerns, and monitoring their supply chains to identify and address human rights abuses.
Community engagement ( C 23 )This involves engaging with local communities in a respectful and transparent manner, and taking their concerns into account in decision-making processes. Companies can achieve this by implementing community engagement strategies, conducting impact assessments to understand the potential impacts of their operations on local communities, and providing support to local communities to help build their capacity and improve their well-being.
Health and safety ( C 24 )This involves ensuring that the health and safety of workers and local communities are protected from harm. Companies can achieve this by implementing health and safety policies and procedures, providing training and support to workers and suppliers, and conducting risk assessments to identify and address potential health and safety hazards.
Diversity and inclusion ( C 25 )This involves promoting diversity and inclusion throughout the supply chain, including ensuring that women and other underrepresented groups have equal opportunities to participate in economic activities. Companies can achieve this by implementing diversity and inclusion policies and programs, providing training and support to suppliers, and monitoring their supply chains for compliance.
Economic
sustainability
Cost-efficiency ( C 31 )This involves reducing costs while maintaining or improving the quality of products and services. Companies can achieve this by implementing efficiency measures, such as improving production processes, reducing waste, and optimizing logistics and transportation.
Innovation ( C 32 )This involves developing and implementing new products, services, or business models that create value for the company and its stakeholders. Companies can achieve this by investing in research and development, collaborating with other organizations to share knowledge and expertise, and exploring new markets or opportunities.
Resilience ( C 33 )This involves building resilience into the supply chain to ensure that it can withstand disruptions, such as natural disasters, political instability, or economic downturns. Companies can achieve this by diversifying their suppliers, implementing risk management strategies, and maintaining adequate inventory levels.
Responsible investment ( C 34 )This involves investing in companies or projects that have a positive impact on the environment, society, or economy. Companies can achieve this by implementing responsible investment policies, conducting due diligence on potential investments, and engaging with stakeholders to understand their concerns.
Long-term perspective ( C 35 )This involves taking a long-term perspective when making business decisions, and considering the potential impacts of those decisions on future generations. Companies can achieve this by implementing sustainability strategies that consider the environmental, social, and economic impacts of their operations over the long term.
Table 6. The evaluations of the experts on each criterion.
D 1 D 2 D 3 D 4 D 5 D 6 D 7 D 8 Sum w j s
C 11 40354550303040403100.0665
C 12 40455040354030303100.0665
C 13 30404040454550303200.0687
C 14 20252520102030201700.0365
C 15 30203035402030202250.0483
C 21 40506030304045503450.0740
C 22 25202030352520252000.0429
C 23 30304040304030302700.0579
C 24 30404045354020252750.0590
C 25 15101015201010201100.0236
C 31 60706080807075705650.1212
C 32 40505040304045503450.0740
C 33 40305045355045453400.0730
C 34 50606050706070604800.1030
C 35 45505560454060403950.0848
Table 7. Experts’ evaluation of suppliers on each criterion.
C 11 C 12 C 13 C 14 C 15 C 21 C 22 C 23 C 24 C 25 C 31 C 32 C 33 C 34 C 35
D 1 S u p 1 VGGPMGPGMPMGVGFGGVGMGVG
S u p 2 MPMGFMPPMGPMPPMGGMGMPPVP
S u p 3 MPPMPPVPMGFVPMPPFFMPFF
S u p 4 PMGPFMGVPMPMPPFPMPMPFVP
S u p 5 MGPMPFMPMGMGFPMPMGPMGFF
S u p 6 GMPFMPFGGPGMGMGVGVGMGG
S u p 7 VPPPMGMPMPMPFVPMPVPFPFVP
S u p 8 MGPFMPFPMPVPMPPMGMGMPPP
D 2 S u p 1 MGGPMGMPVGMPMGMGFGGMGFMG
S u p 2 MPGMPPVPGMPPPFFMPPVPVP
S u p 3 PPMGFPFMPMPPPMGFVPMPF
S u p 4 VPGMPMPMPVPPFPFVPPFFP
S u p 5 FPFPMPMPMGMGFMPMGFFMGMP
S u p 6 GFMGFMGGMGMPGFVGVGGMGG
S u p 7 VPPPMPMPMPPMPVPMPVPFMPMPMP
S u p 8 GMPMPVPMPPMPPMPPMPFVPMPP
D 8 S u p 1 MGGPMGMPVGMPMGMGFGGMGFMG
S u p 2 MPGMPPVPGMPPPFFMPPVPVP
S u p 3 PPMGFPFMPMPPPMGFVPMPF
S u p 4 VPGMPMPMPVPPFPFVPPFFP
S u p 5 FPFPMPMPMGMGFMPMGFFMGMP
S u p 6 GFMGFMGGMGMPGFVGVGGMGG
S u p 7 VPPPMPMPMPPMPVPMPVPFMPMPMP
S u p 8 GMPMPVPMPPMPPMPPMPFVPMPP
Table 8. Interval type-2 fuzzy decision-matrix.
a U b U c U d U θ U a L b L c L d L θ L
x ˜ ˜ 1 , 11 6.257.948.319.3817.137.948.318.690.9
x ˜ ˜ 1 , 12 5.757.589.2516.757.588.50.9
x ˜ ˜ 1 , 13 1.252.753.254.75122.753.253.750.9
x ˜ ˜ 1 , 14 3.755.756.257.7514.755.756.256.750.9
x ˜ ˜ 1 , 15 0.381.51.883.2510.941.51.882.380.9
x ˜ ˜ 8 , 31 2.54.556.513.54.555.50.9
x ˜ ˜ 8 , 32 4.756.637.138.515.756.637.137.630.9
x ˜ ˜ 8 , 33 0.251.131.442.7510.691.131.441.940.9
x ˜ ˜ 8 , 34 1.53.253.755.2512.383.253.754.250.9
x ˜ ˜ 8 , 35 00.380.561.7510.190.380.561.060.9
Table 9. The defuzzified decision-matrix and the objective criteria weights.
S u p 1 S u p 2 S u p 3 S u p 4 S u p 5 S u p 6 S u p 7 S u p 8 w j o w j c
C 11 8.043.921.700.855.679.001.276.860.08110.0738
C 12 7.697.942.487.052.484.672.012.710.04180.0542
C 13 2.983.455.921.792.966.551.325.420.05560.0621
C 14 5.921.093.453.212.493.705.421.790.06080.0486
C 15 1.700.851.324.421.415.421.703.210.05440.0514
C 21 9.297.445.171.184.928.764.921.090.07950.0768
C 22 4.672.713.210.807.116.613.204.670.08830.0656
C 23 7.691.700.942.967.492.324.671.560.06600.0620
C 24 8.230.851.562.483.459.151.181.560.05960.0593
C 25 4.174.671.786.994.175.423.682.740.04820.0359
C 31 9.296.304.921.475.928.951.564.670.06450.0929
C 32 7.696.174.672.233.209.444.926.800.04960.0618
C 33 8.573.450.943.705.679.292.711.320.07480.0739
C 34 6.610.943.685.177.447.114.173.450.08940.0962
C 35 8.951.036.991.003.708.851.410.560.08620.0855
Table 10. The normalized decision matrix.
a U b U c U d U θ U a L b L c L d L θ L
x ˜ ˜ 1 , 11 n 0.690.880.921.0410.790.880.920.970.9
x ˜ ˜ 1 , 12 n 0.720.941.011.1710.850.941.011.070.9
x ˜ ˜ 1 , 13 n 0.190.420.50.7310.310.420.50.570.9
x ˜ ˜ 1 , 14 n 0.630.971.061.3110.80.971.061.140.9
x ˜ ˜ 1 , 15 n 0.070.280.350.610.170.280.350.440.9
x ˜ ˜ 8 , 31 n 0.270.480.540.710.380.480.540.590.9
x ˜ ˜ 8 , 32 n 0.50.70.760.910.610.70.760.810.9
x ˜ ˜ 8 , 33 n 0.030.120.150.310.070.120.150.210.9
x ˜ ˜ 8 , 34 n 0.20.440.50.7110.320.440.50.570.9
x ˜ ˜ 8 , 35 n 00.040.060.210.020.040.060.120.9
Table 11. Different measures of the WASPAS method.
a U b U c U d U θ U a L b L c L d L θ L
Q ˜ ˜ 1 S 0.630.830.891.0310.740.830.890.940.9
Q ˜ ˜ 2 S 0.220.390.450.6210.310.390.450.510.9
Q ˜ ˜ 3 S 0.210.40.460.6410.310.40.460.520.9
Q ˜ ˜ 4 S 0.170.340.40.5710.260.340.40.460.9
Q ˜ ˜ 5 S 0.350.570.630.8110.460.570.630.690.9
Q ˜ ˜ 6 S 0.670.870.931.0610.780.870.930.980.9
Q ˜ ˜ 7 S 0.160.350.40.5810.250.350.40.460.9
Q ˜ ˜ 8 S 0.210.390.440.6210.30.390.440.50.9
Q ˜ ˜ 1 P 1.611.821.872.0211.721.821.871.930.9
Q ˜ ˜ 2 P 1.211.371.421.5911.291.371.421.480.9
Q ˜ ˜ 3 P 1.21.391.441.6211.291.391.441.50.9
Q ˜ ˜ 4 P 1.161.321.371.5411.241.321.371.430.9
Q ˜ ˜ 5 P 1.331.551.611.811.441.551.611.680.9
Q ˜ ˜ 6 P 1.651.861.912.0611.761.861.911.970.9
Q ˜ ˜ 7 P 1.151.331.381.5611.241.331.381.440.9
Q ˜ ˜ 8 P 1.191.371.421.5911.281.371.421.480.9
Q ˜ ˜ 1 0.780.9511.1210.870.9511.040.9
Q ˜ ˜ 2 0.450.590.630.7710.520.590.630.680.9
Q ˜ ˜ 3 0.440.60.640.7910.520.60.640.690.9
Q ˜ ˜ 4 0.40.540.590.7310.480.540.590.640.9
Q ˜ ˜ 5 0.550.730.780.9310.640.730.780.840.9
Q ˜ ˜ 6 0.810.991.031.1510.910.991.031.070.9
Q ˜ ˜ 7 0.40.550.590.7410.470.550.590.640.9
Q ˜ ˜ 8 0.430.580.620.7710.510.580.620.680.9
Table 12. The parameters of the SSOA model.
Supplier S i O i m i n
(Tons)
C P i
(Tons)
c i 1 o
( × 10 5 IRR)
c i 2 o
( × 10 5 IRR)
d i 1
(Km)
d i 2
(Km)
S u p 1 0.1696500040,00020026045150
S u p 2 0.1155700025,00026027030120
S u p 3 0.1230450026,00025026035110
S u p 4 0.0717550026,0002602802080
S u p 5 0.1518400020,0002802604060
S u p 6 0.1875580035,0002902008020
S u p 7 0.0711390015,00028023010025
S u p 8 0.1097420025,00027024013035
D E M 1 = 50,000 D E M 2 = 40,000 K m i n = 2
Table 13. The results of solving the SSOA problem.
Supplier x i j o y i Objective Functions
P C 1 P C 2
S u p 1 34,079.1201 Z 1 m i n = 0.1865 × 10⁸ Z 1 = 0.1927956 × 10⁸
S u p 2 9705.48501 Z 1 m a x = 0.2541 × 10⁸
S u p 3 000 Z 2 m i n = 2,065,000 Z 2 = 2,948,341
S u p 4 000 Z 2 m a x = 0.1155 × 10⁸
S u p 5 6215.39601 Z 3 m i n = 8445.527 Z 3 = 14,956.37
S u p 6 035,0001 Z 3 m a x = 15,625
S u p 7 000 λ = 0.9069
S u p 8 050001
Table 14. The weights used for the sensitivity analysis.
C 11 C 12 C 13 C 14 C 15 C 21 C 22 C 23 C 24 C 25 C 31 C 32 C 33 C 34 C 35
Set 10.0080.0170.0250.0330.0420.0500.0580.0670.0750.0830.0920.1000.1080.1170.125
Set 20.0170.0250.0330.0420.0500.0580.0670.0750.0830.0920.1000.1080.1170.1250.008
Set 30.0250.0330.0420.0500.0580.0670.0750.0830.0920.1000.1080.1170.1250.0080.017
Set 40.0330.0420.0500.0580.0670.0750.0830.0920.1000.1080.1170.1250.0080.0170.025
Set 50.0420.0500.0580.0670.0750.0830.0920.1000.1080.1170.1250.0080.0170.0250.033
Set 60.0500.0580.0670.0750.0830.0920.1000.1080.1170.1250.0080.0170.0250.0330.042
Set 70.0580.0670.0750.0830.0920.1000.1080.1170.1250.0080.0170.0250.0330.0420.050
Set 80.0670.0750.0830.0920.1000.1080.1170.1250.0080.0170.0250.0330.0420.0500.058
Set 90.0750.0830.0920.1000.1080.1170.1250.0080.0170.0250.0330.0420.0500.0580.067
Set 100.0830.0920.1000.1080.1170.1250.0080.0170.0250.0330.0420.0500.0580.0670.075
Set 110.0920.1000.1080.1170.1250.0080.0170.0250.0330.0420.0500.0580.0670.0750.083
Set 120.1000.1080.1170.1250.0080.0170.0250.0330.0420.0500.0580.0670.0750.0830.092
Set 130.1080.1170.1250.0080.0170.0250.0330.0420.0500.0580.0670.0750.0830.0920.100
Set 140.1170.1250.0080.0170.0250.0330.0420.0500.0580.0670.0750.0830.0920.1000.108
Set 150.1250.0080.0170.0250.0330.0420.0500.0580.0670.0750.0830.0920.1000.1080.117
Table 15. The results of the comparison.
SupplierSAWCOPRASTOPSISVIKOREDASMULTIMOORAProposed Approach
S u p 1 2221222
S u p 2 5556555
S u p 3 4444444
S u p 4 7778877
S u p 5 3333333
S u p 6 1112111
S u p 7 8887788
S u p 8 6665666
ρ 1110.92909761
Disclaimer/Publisher’s Note: The statements, opinions and data contained in all publications are solely those of the individual author(s) and contributor(s) and not of MDPI and/or the editor(s). MDPI and/or the editor(s) disclaim responsibility for any injury to people or property resulting from any ideas, methods, instructions or products referred to in the content.

