1. Introduction
It is well known that underground space engineering, such as mining and tunnel transportation, is constantly extending deeper into the earth [
1,
2,
3]. However, with the deepening of underground engineering, the probability of engineering disasters also increases, especially that of rockbursts induced by high geo-stress [
1]. Rockbursts, which are sudden releases of energy and rock ruptures caused by external disturbances under conditions of high ground stress, have been called a geological “cancer”. They are a relatively common engineering geohazard during the excavation and construction of deeply buried underground structures and are characterized by high risk, suddenness, and unpredictability [
4,
5,
6,
7,
8]. For instance, a severe rockburst that happened on 28 November 2009 at the Jinping II hydropower facility in China caused seven fatalities, one major injury, and the destruction of a tunnel-boring machine [
9]. In November 2011, a catastrophic rockburst at the Qianqiu Mine in Henan Province killed 10 miners and injured 64 more [
10]. On 31 May 2015, a rockburst at the Neelum–Jhelum Hydropower Project in Pakistan resulted in the deaths of three workers and the destruction of a TBM [
11]. This type of disaster causes significant economic damage and casualties and poses a serious threat to the safety of construction personnel and equipment. In severe cases, it can even induce earthquakes. During construction, various techniques can be used to reduce the harm caused by rockbursts, such as improving the stress on the wall rock, improving the nature of the wall rock, and maintaining the integrity of the wall rock by using controlled blasting techniques, water spraying, water injection, enhanced support or advanced support, and other technical means [
12]. However, due to the uncertainty of rockbursts, the prediction of rockburst probability and intensity classification has been a worldwide problem in the field of rock engineering, with positive implications for practical construction [
13,
14,
15,
16].
Rockburst criteria can typically be classified into two categories: single-indicator empirical criteria and multi-factor empirical evaluation criteria [
1,
4,
17,
18]. The commonly used single-indicator criteria include Turchaninov’s criterion [
19], Russenes’ criterion [
20], Barton’s criterion [
21], Hoek’s criterion [
22], and the rock elastic energy index [
23], among others. However, these criteria usually only consider one or two influencing factors. Because the mechanism behind rockbursts is complex, multiple factors affect their occurrence. Therefore, these single-indicator criteria have limitations when predicting rockbursts [
1]. Recognizing these limitations, some scholars have attempted to use key factors that influence rockburst occurrence as evaluation indicators [
24]. Wang [
25] was the first to propose a multi-factor rockburst prediction model through the lens of fuzzy mathematical theory, which offers a new comprehensive approach for predicting rockbursts. Many scholars have since begun to combine multi-factor indicators and mathematical methods to develop suitable mathematical models or empirical evaluation systems for integrated rockburst prediction in some underground engineering projects. The multi-factor rockburst prediction models are mainly divided into uncertainty evaluation models and intelligent optimization evaluation models. In the field of rockburst prediction uncertainty evaluation, there are several models available, including the distance discrimination method [
26,
27], the cloud model [
28,
29], extenics [
30,
31], the rough set theory [
32], the efficacy coefficient method [
33,
34], set pair analysis [
18,
35], the attribute measure [
36], the ideal point method [
24,
37], TOPSIS [
38,
39], fuzzy set theory [
40,
41], etc. All of these models consider a combination of rockburst indicators and their non-linear relationships with rockburst risk. However, there are still challenges in terms of selecting appropriate model functions, handling multi-source data with multiple indicators and indicator weights, and the critical issue of determining the weights of rockburst correlation indicators and their influencing factors while avoiding subjective decision making [
1,
24]. Intelligent optimization algorithms are novel methods that have been proposed to solve complex optimization problems. They were inspired by the principles of biological evolution and some physical phenomena. Among the mainstream intelligent optimization algorithms are PSO [
16,
42,
43], BP neural networks [
44,
45], Bayesian networks [
46,
47], random forests [
48,
49], genetic algorithms [
50], support vector machines [
51], decision tree models [
52,
53], and so on. These algorithms have shown excellent performances in handling complex problems and exhibit high computational efficiency. However, the accuracy of their evaluation depends to some extent on the quality of the training sample. Moreover, they are also computationally expensive [
54].
Unascertained measurement is a method that can effectively deal with fuzzy and uncertain information [
55]. However, the traditional unascertained measurement approach uses a confidence criterion for calculations [
56,
57,
58,
59,
60,
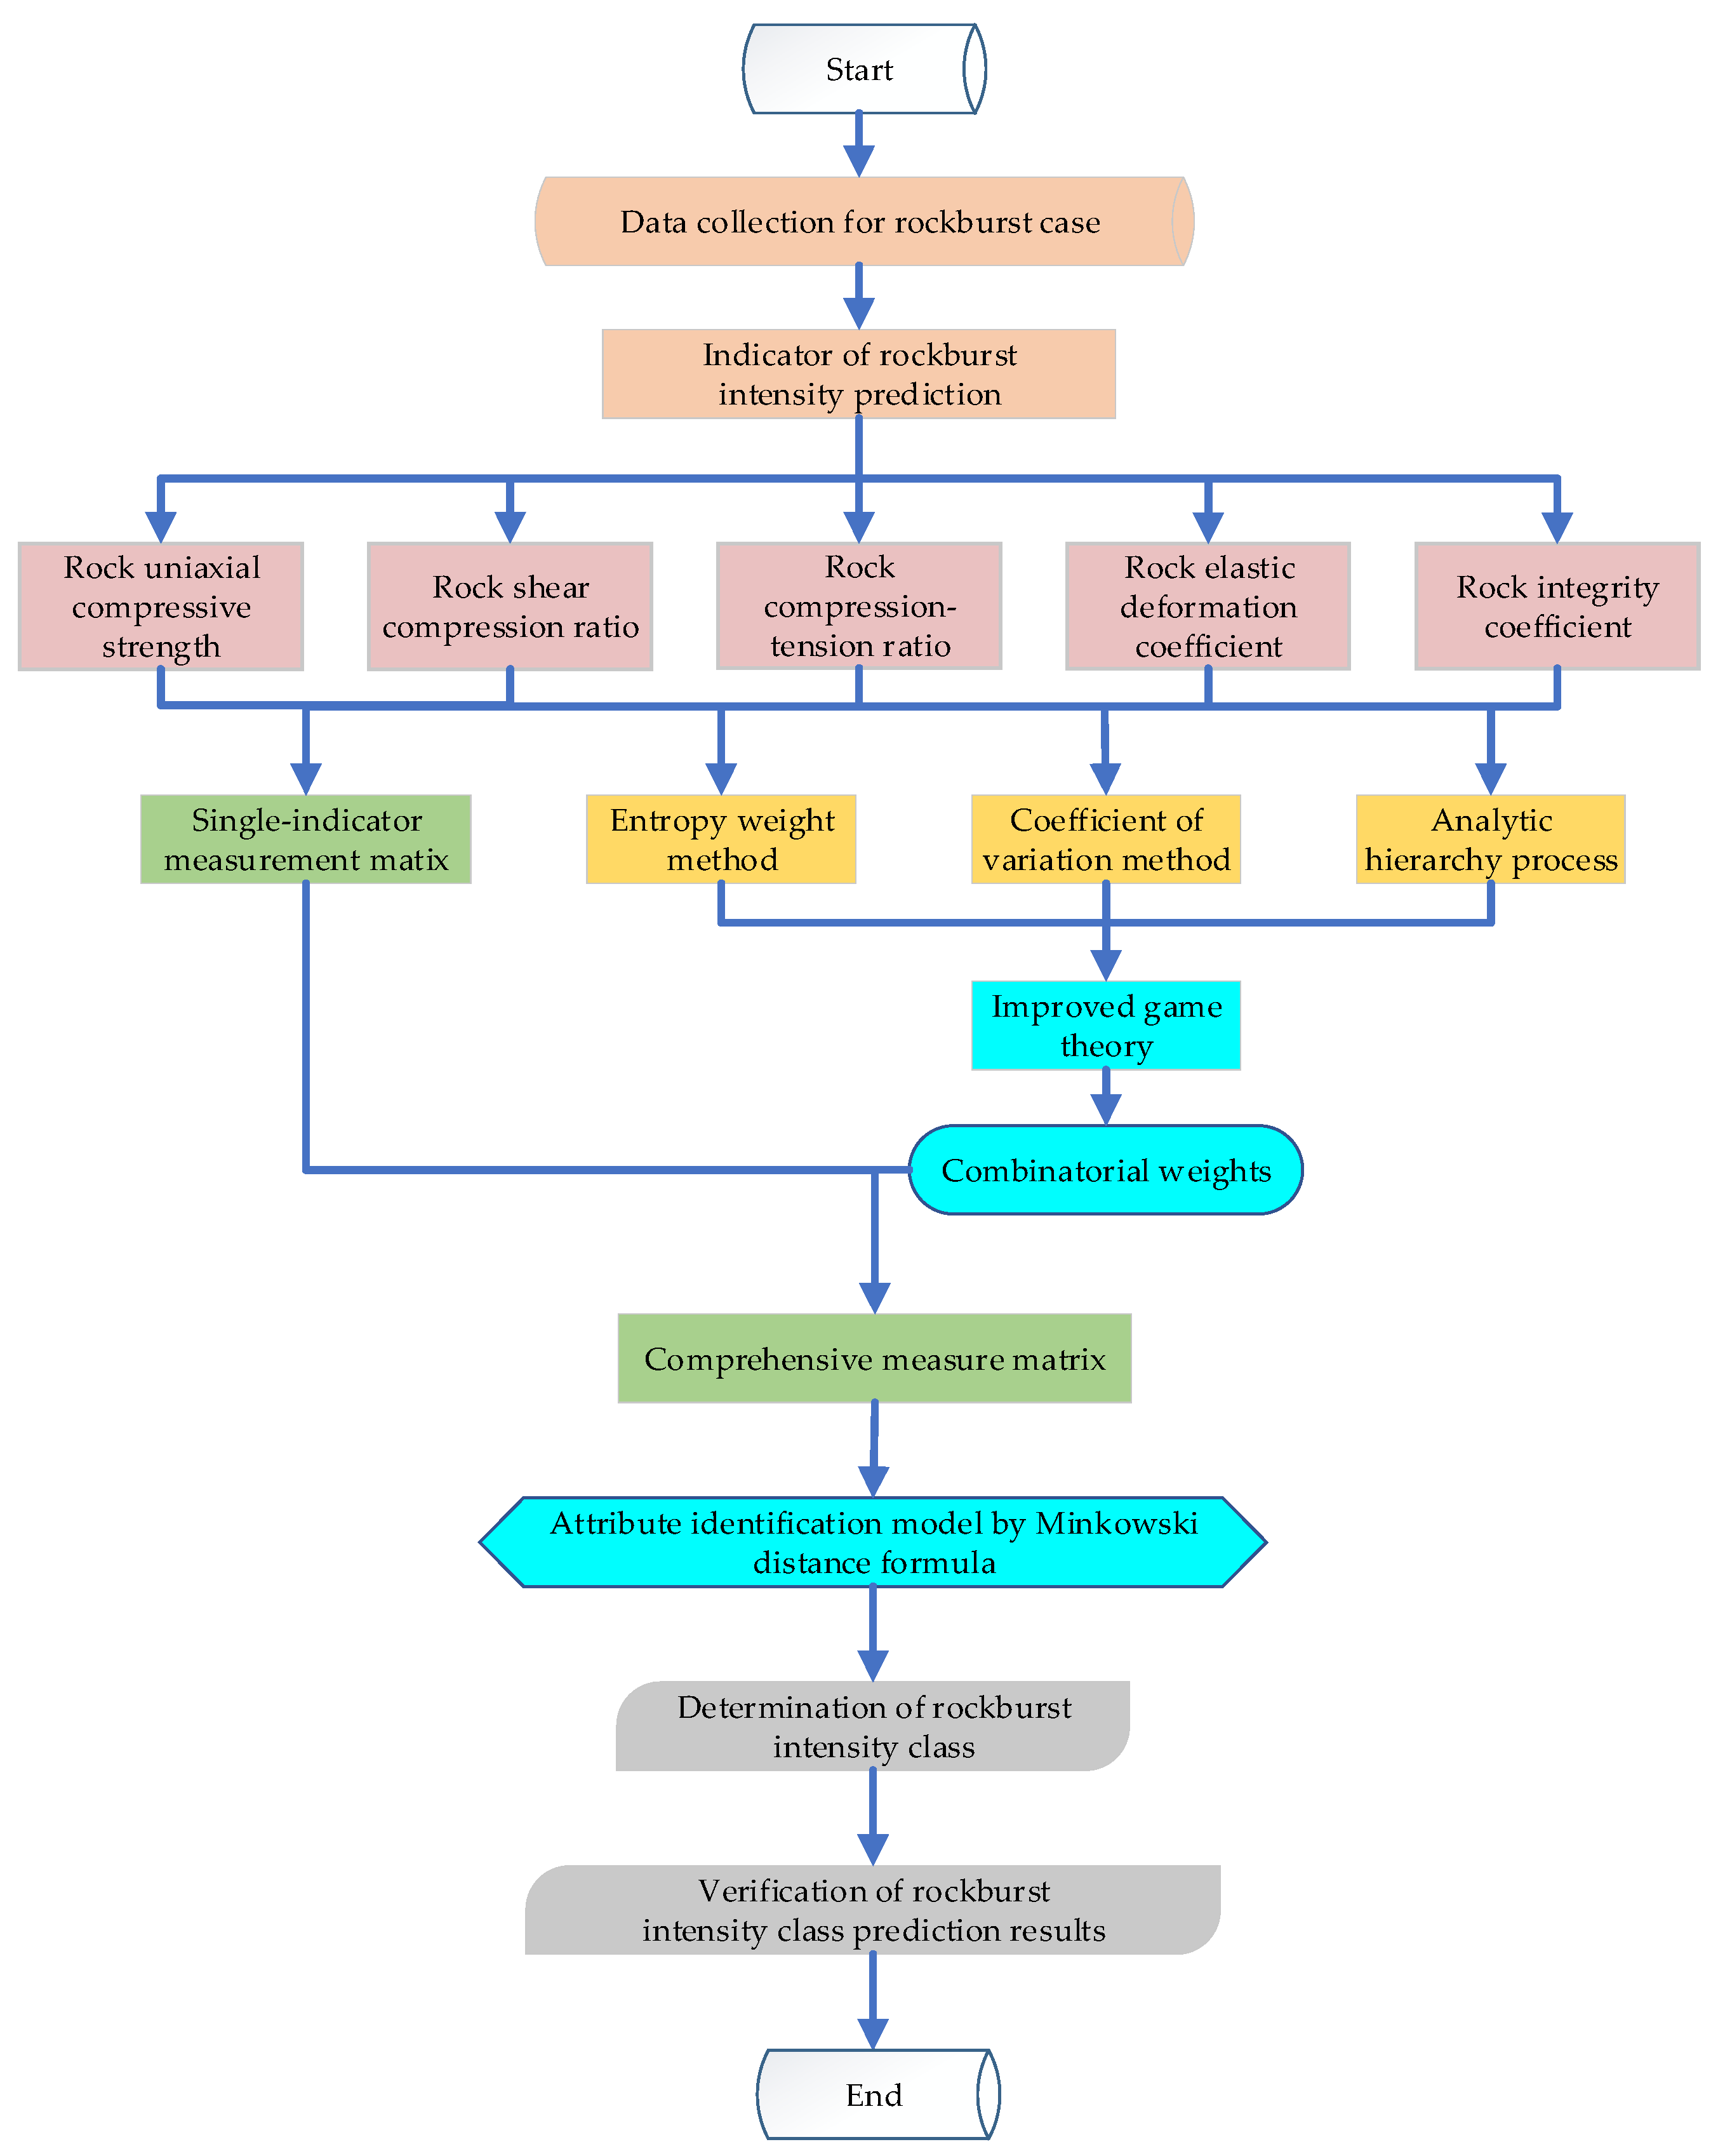
61], which introduces some subjectivity. To ensure the objectivity of discrimination results, the idea of distance discrimination can be introduced to optimize an attribute recognition model. Additionally, the game theory method resolves the contradiction between subjective and objective empowerment methods, ensuring the accuracy of quantitative analyses and the scientificity of qualitative analyses. To avoid the unreasonable phenomenon of negative values for combined weight coefficients that may arise from the traditional game theory calculation method, constraints were introduced to the existing formula, and an improved game theory weighting method was applied for the first time in the field of rockburst prediction. A flow chart of this paper is shown in
Figure 1.
3. Evaluation Method
3.1. Multi-Indicator Comprehensive Measurement
Unascertained measurement, a mathematical method for dealing with uncertain information, was first proposed by Professor Wang [
68]. Based on this study, Liu [
69] proposed a mathematical theory of unascertained measurement and first applied it to the evaluation problem. After years of unremitting research by many experts and scholars, its theoretical system has gradually matured and has been applied in many fields [
57,
70,
71].
There are samples of object to be evaluated, and for each evaluated object () there are k single evaluation index spaces, denoted as . Let be denoted as a t-dimensional vector (), where denotes the measurement of the evaluation object () with respect to the evaluation index (). For each subtest () with evaluation levels, assume that the evaluation space () has evaluation levels, denoted as . The tth evaluation class () is the class value of . Let class be “higher” or “lower” than class , denoted as . If is satisfied, then is called an ordered partition class of the evaluation class space ().
denotes the degree to which observation
belongs to the
tth assessment class (
), with
being satisfied as follows:
where Equation (19) is called non-negative boundedness, Equation (20) is called normalizability, Equation (21) is called additivity, and
satisfied by Equations (19)–(21) at the same time is called an unascertained measurement.
There are many ways to construct single-indicator measure functions, but linear measure functions are considered to be the simplest and most widespread in application [
58,
60].
The weighted comprehensive measure matrix (C) of multiple indicators can be calculated using Equations (18) and (22).
3.2. Improving the Attribute Recognition Model Using Distance Discrimination
The characteristics of things are divided into categories: . Correspondingly, the factors are also classified into categories. Then, the sample mean of each category is determined as the classification center of classification patterns (), so the unascertained measurements are , , ···, , respectively.
The distance discrimination method is used as the attribute identification criterion so that the distance (
) calculated using Minkowski’s distance formula is the distance from the comprehensive multi-indicator measure (
) to the classification class (
). The formula is shown below.
When
p = 1, the Minkowski distance formula is the Manhattan distance.
When
p = 2, the Minkowski distance formula is the Euclidean distance.
For convenience of calculation in engineering applications, this paper compares the magnitude of each unascertained measurement distance (
) by taking
p = 1, 2, 3, and 4, as shown in Equation (27):
If , it indicates that the sample (p) to be predicted is closest to class and thus could be classified into class .
4. Rockburst Intensity Class Prediction
From the study of most of the discrimination indicators of rockburst prediction [
25,
31,
36,
55], the five indicators of rock uniaxial compressive strength (
), the ratio of rock uniaxial compressive strength to tensile strength (
), the ratio of rock uniaxial compressive strength to tensile strength (
), rock elastic deformation indicator (
), and the rock integrity coefficient (
) contain the main information for predicting rockbursts. By classifying rocks, it is possible to gain more valuable insights into them [
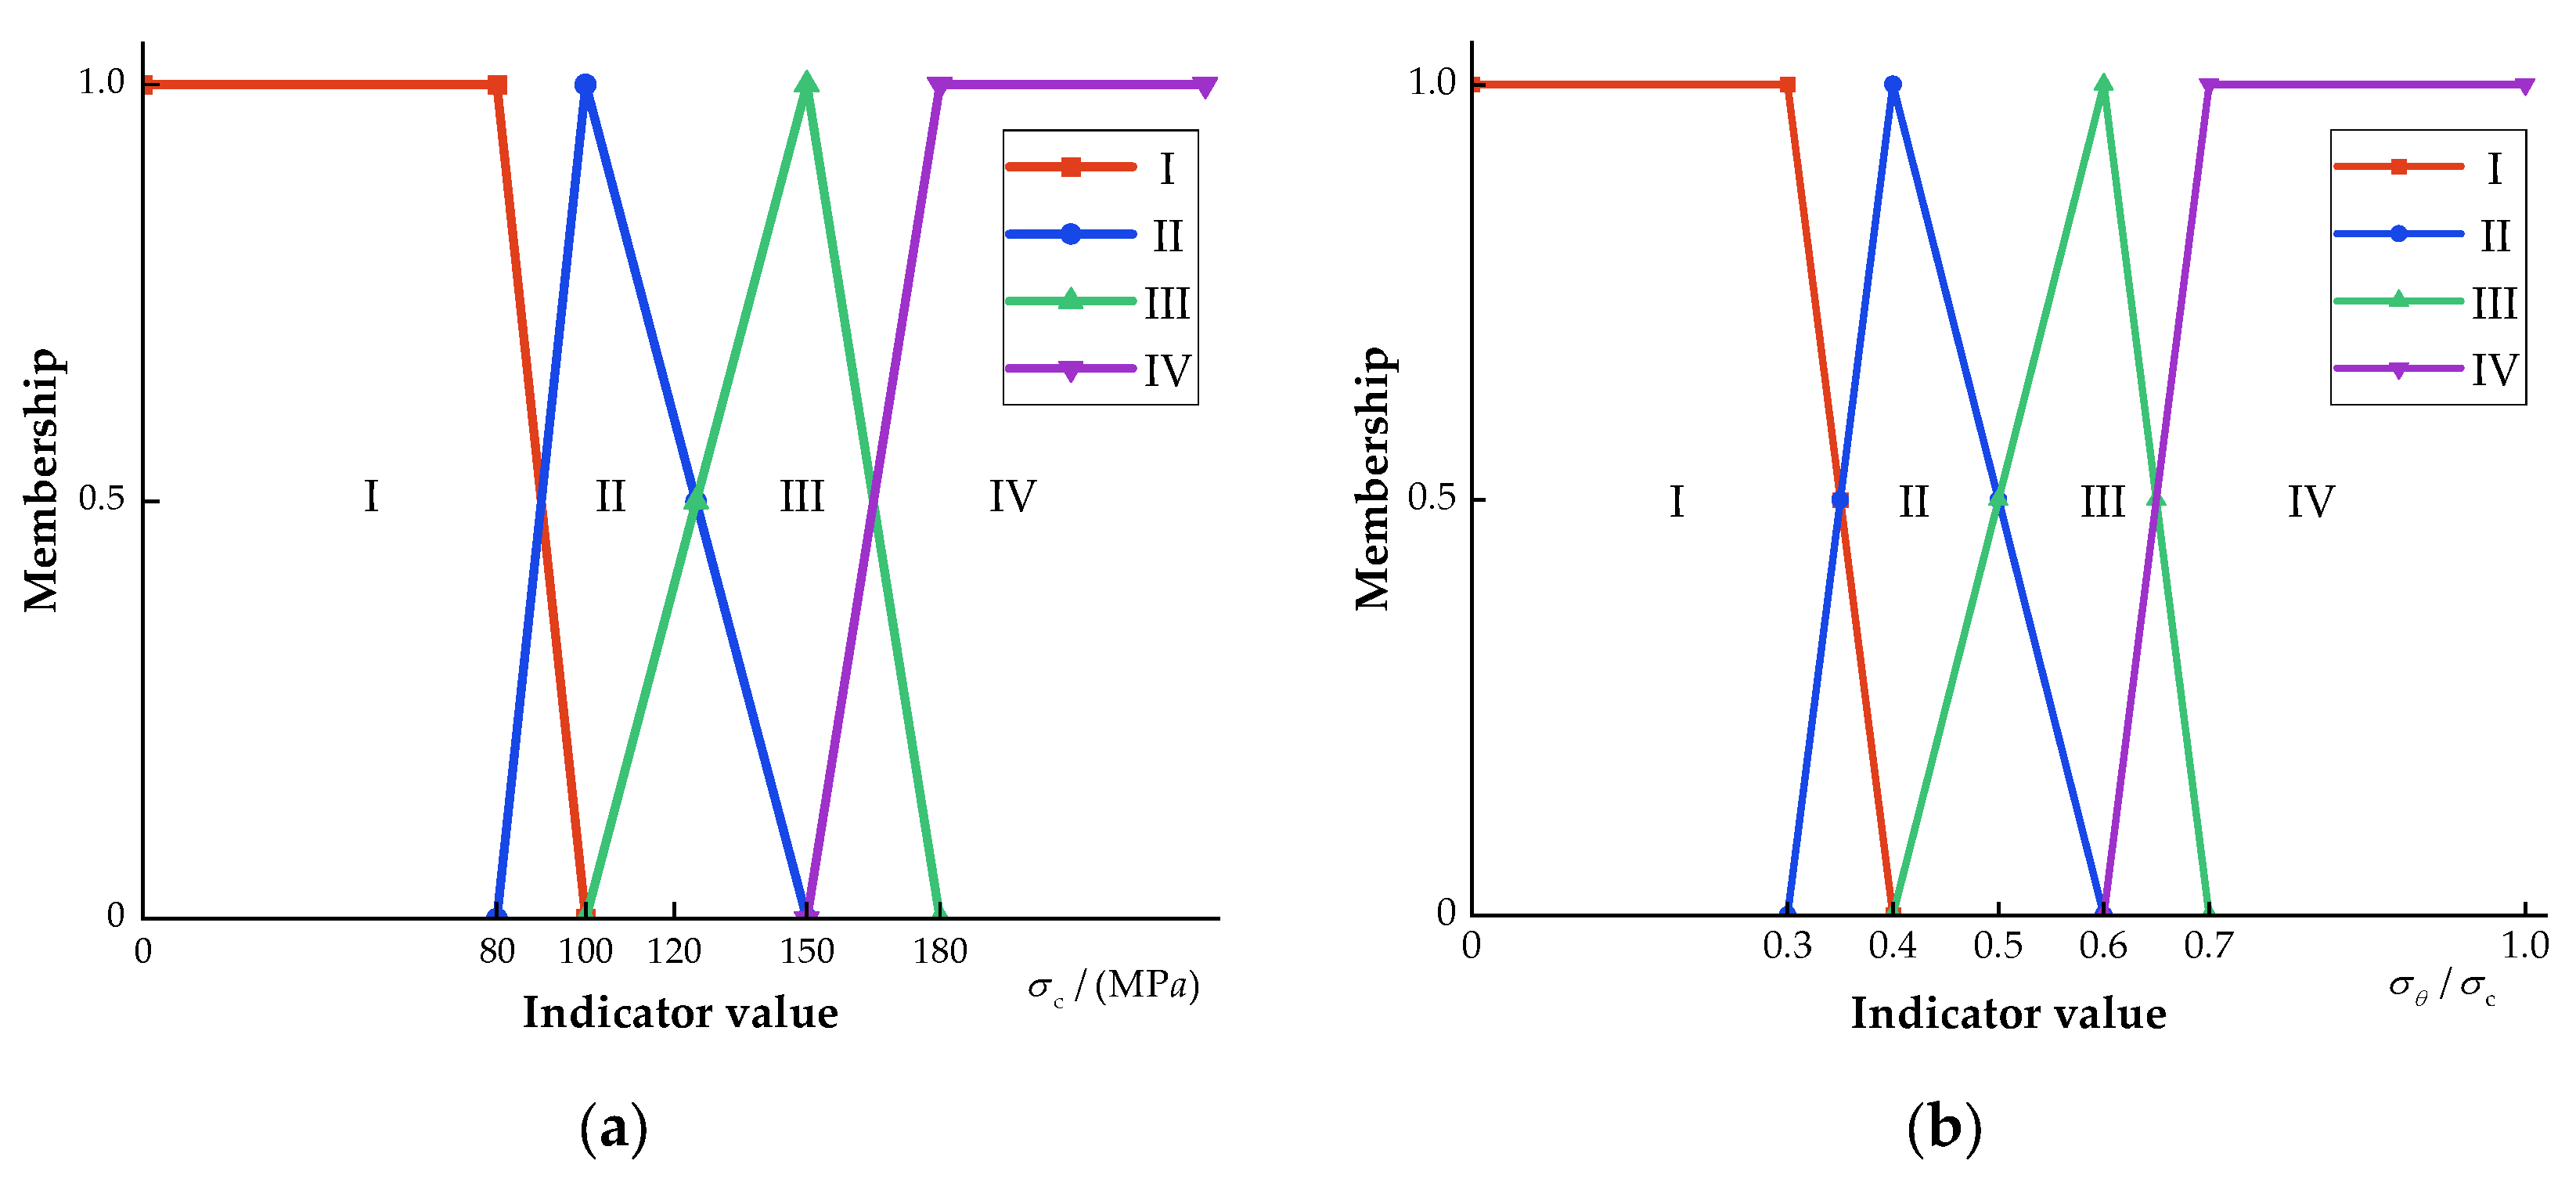
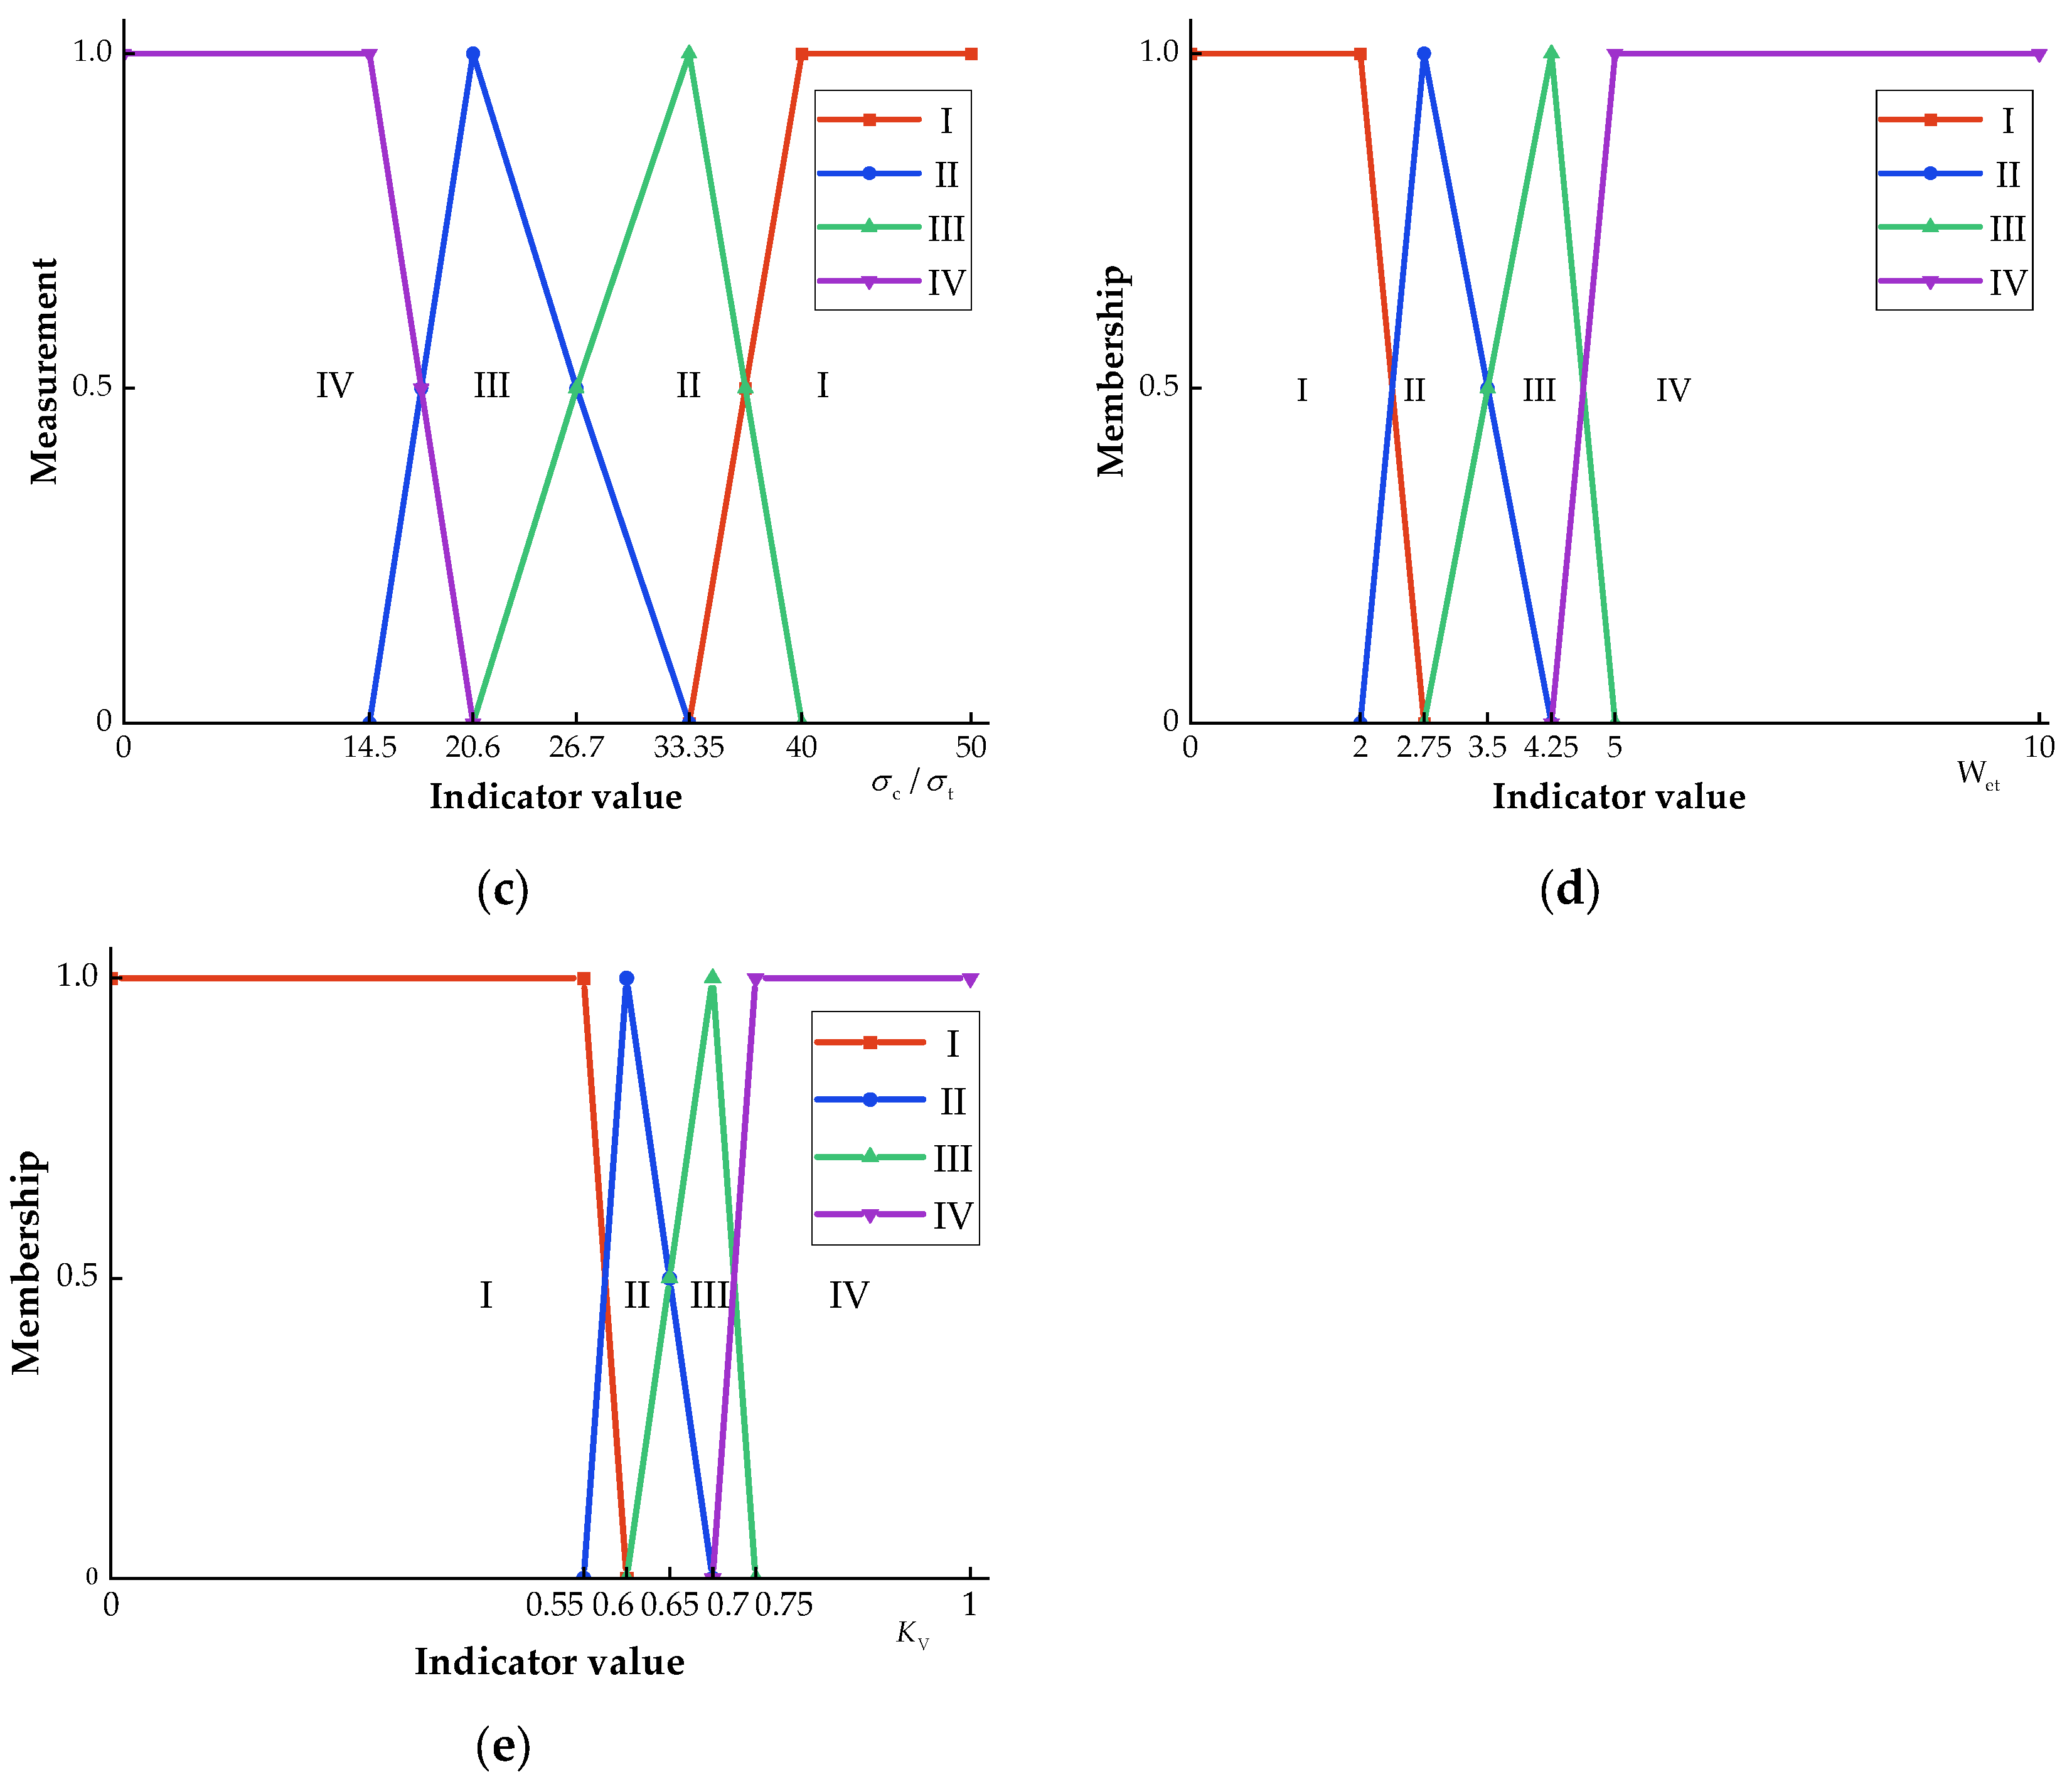
72]. Take {no rockburst, low rockburst, medium rockburst, heavy rockburst} = {I,II,III,IV}. Each evaluation indicator classification was established, as shown in
Table 2, and a single-indicator measurement chart is shown in
Figure 3.
To verify the reasonableness and validity of the improved rockburst intensity prediction model, 40 sets of typical rockburst example data from the literature [
25,
32,
36,
55,
73,
74,
75,
76] were counted, and detailed indicators of the measured values and actual rockburst classes are shown in
Table 3.
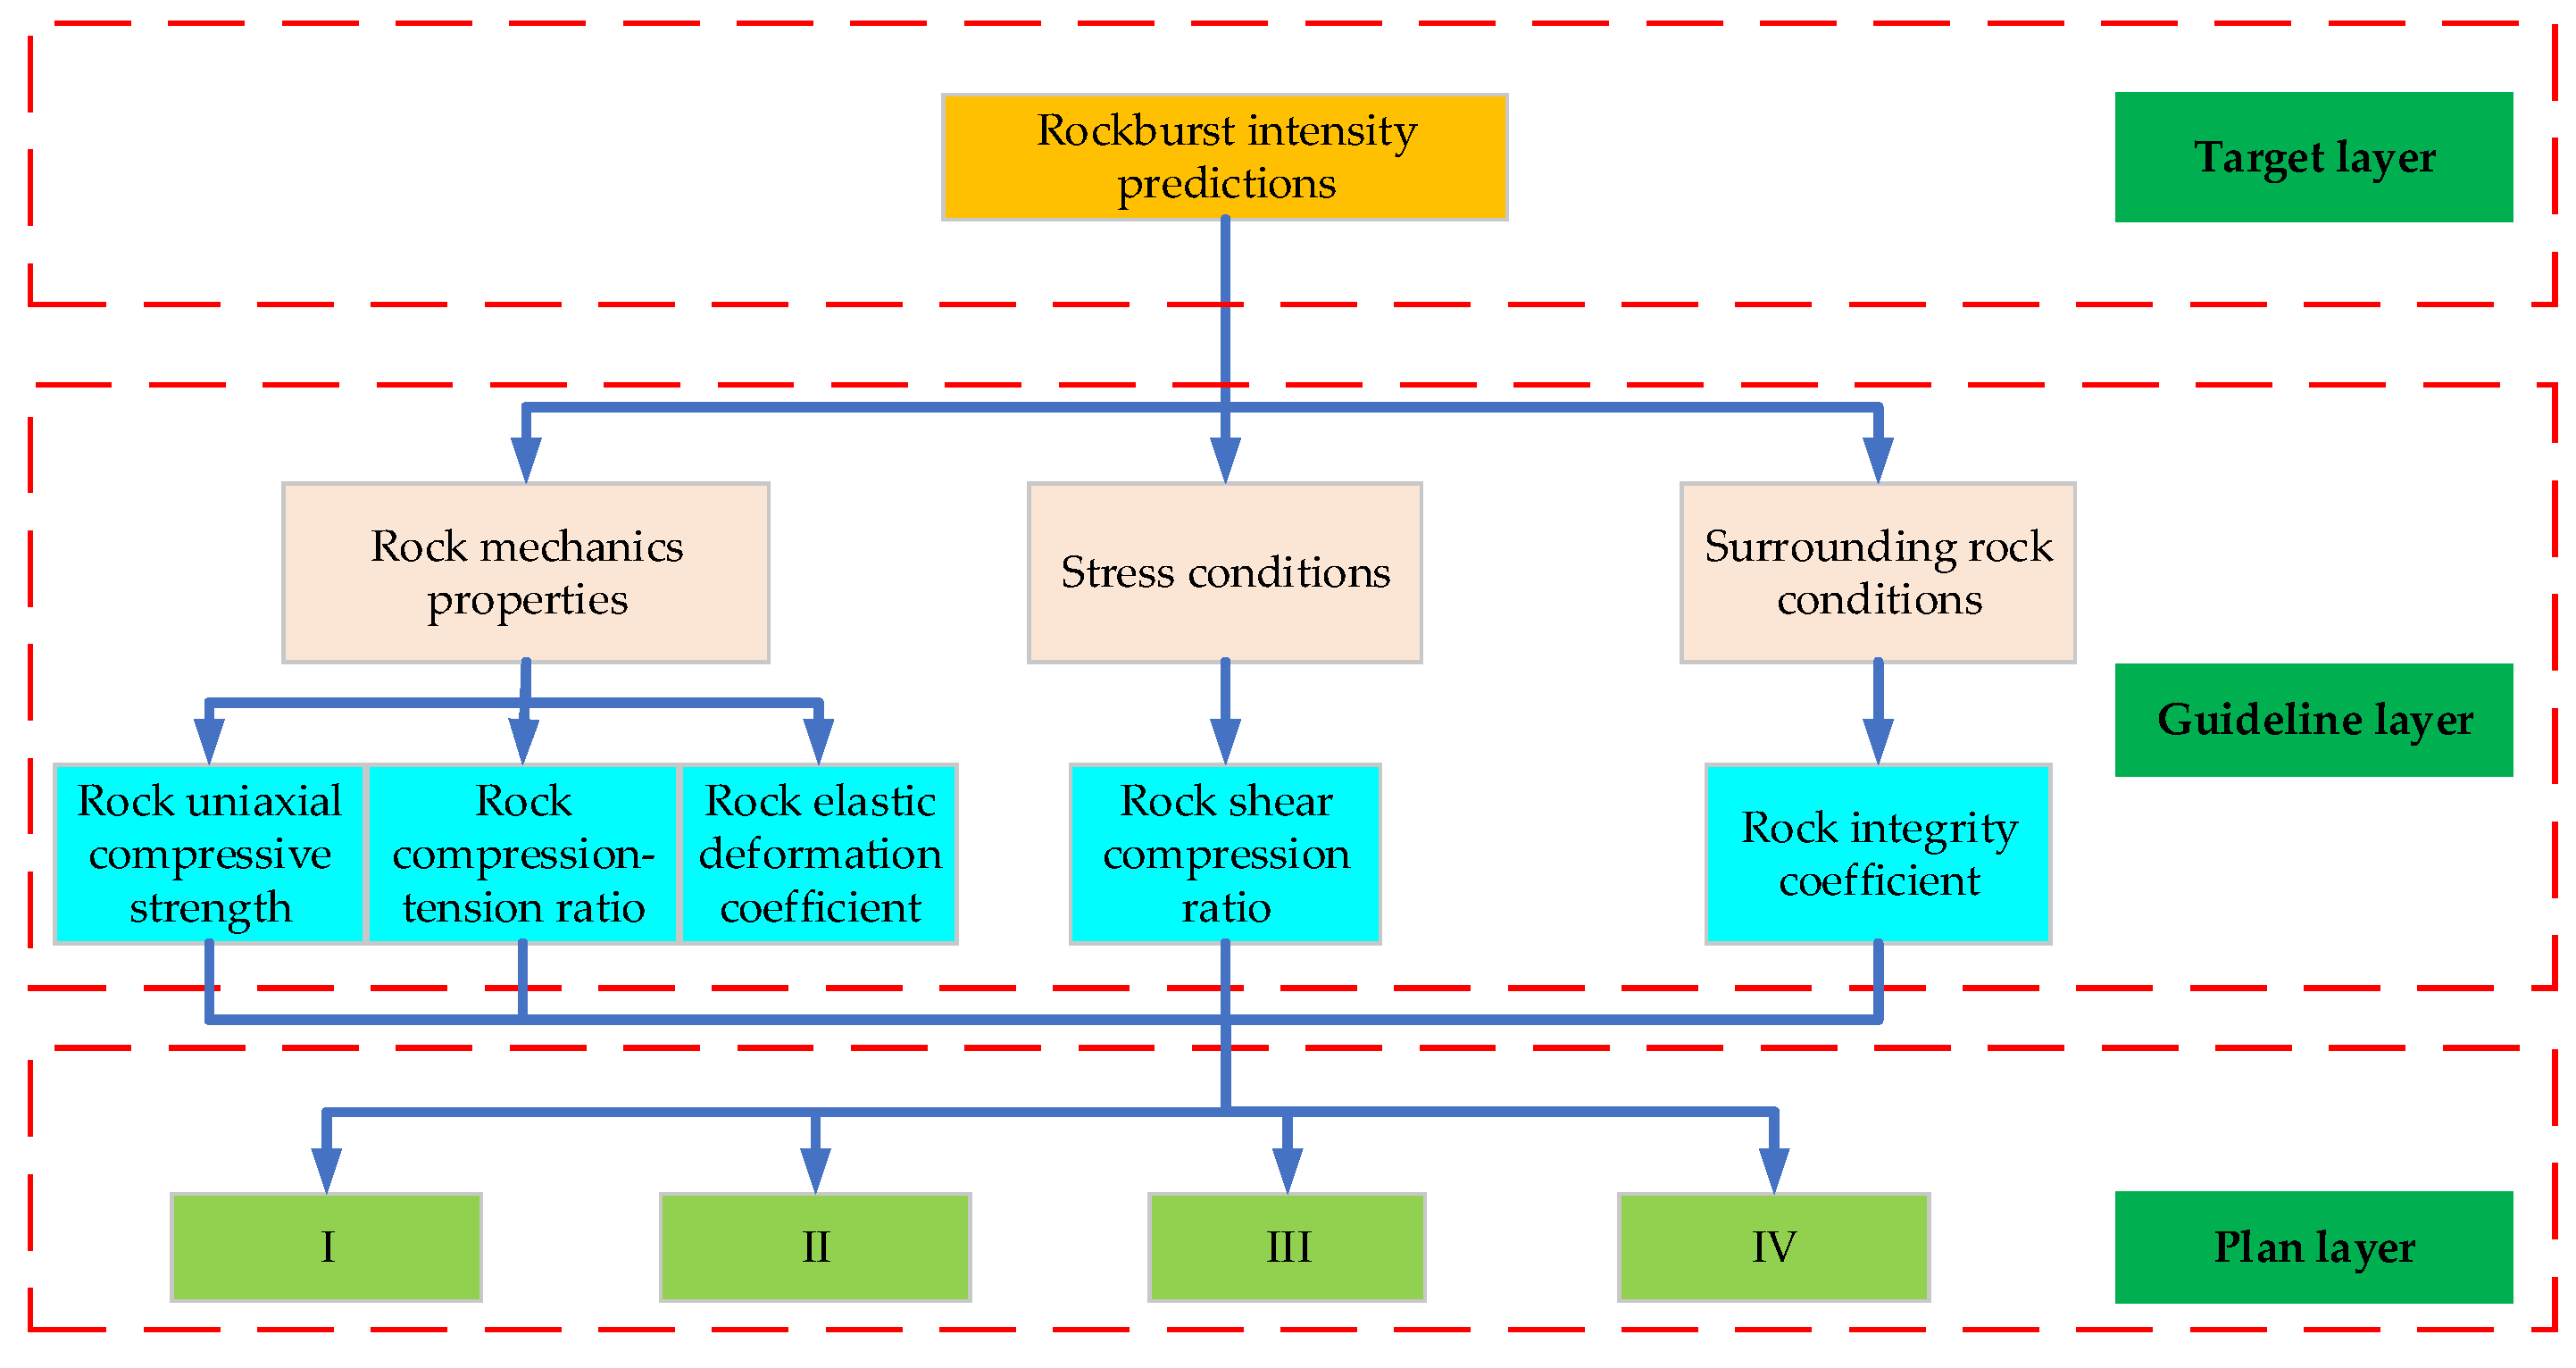
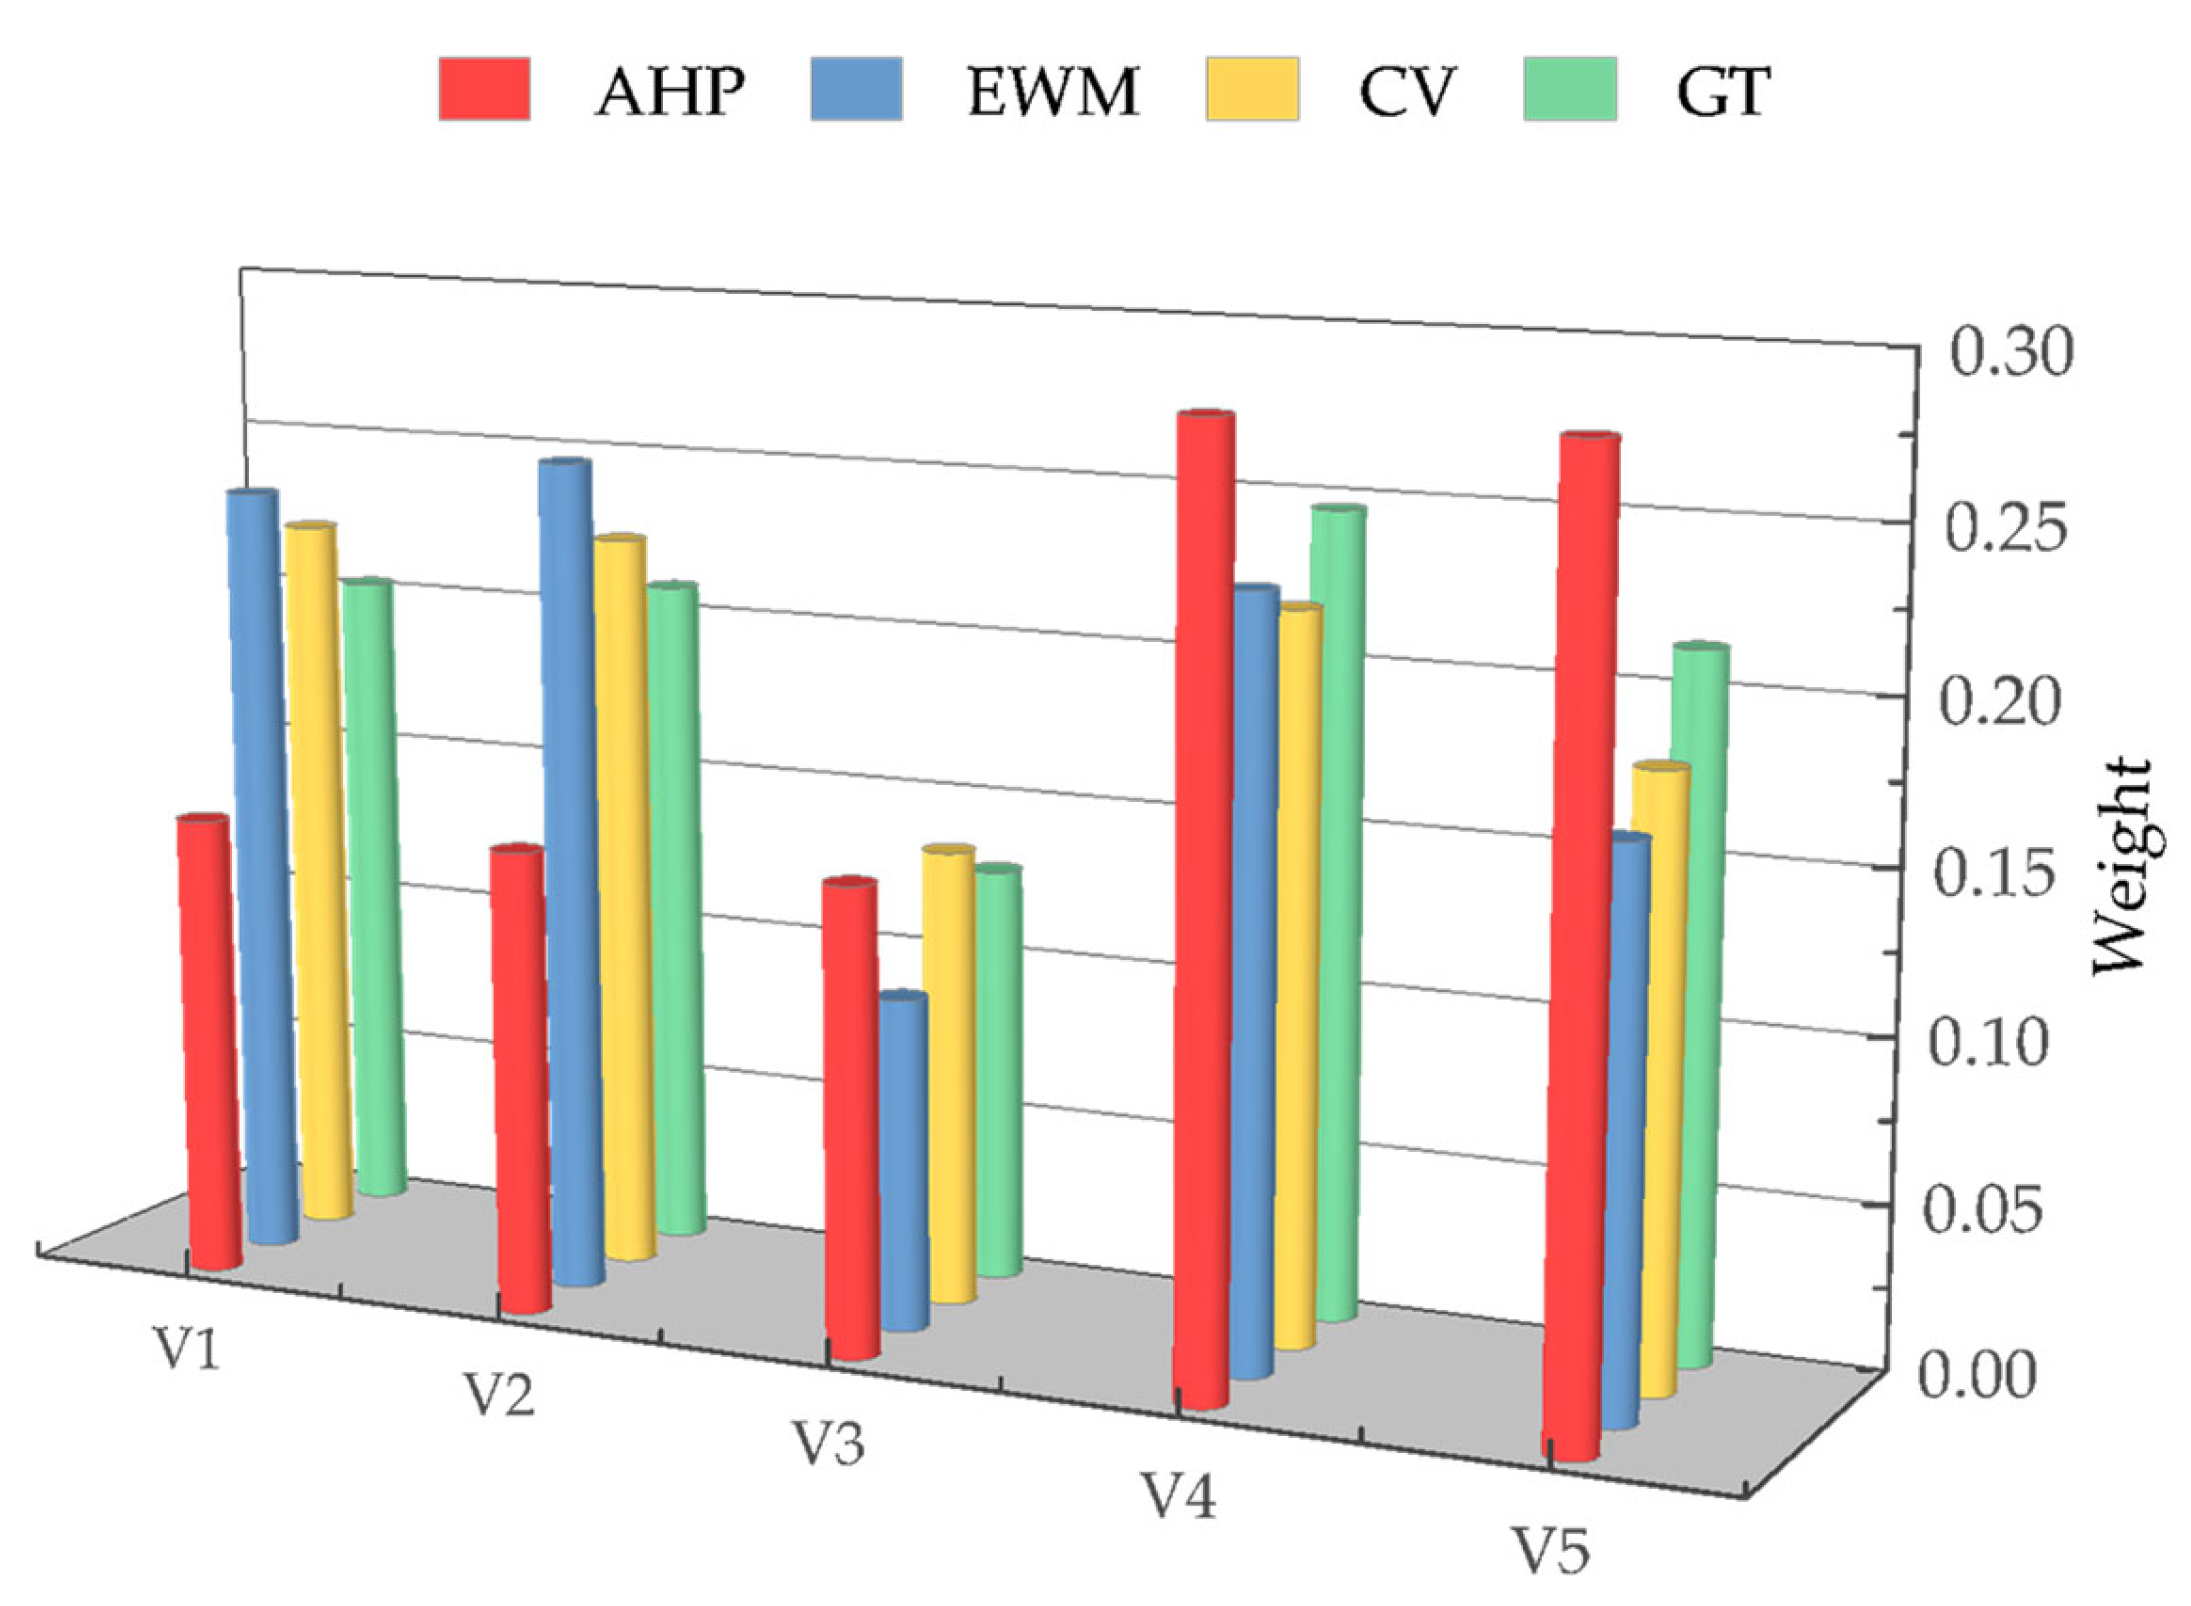
The weights
= [0.1429,0.1429,0.1429,0.2857,0.2857] were calculated according to the AHP evaluation method, the weights
= [0.2403,0.2560,0.1019,0.2323,0.1695] of the entropy weight method were calculated according to Equations (3)–(8), and the weights
= [0.2255,0.2283,0.1404,0.2220,0.1839] of the coefficient of variation method were calculated according to Equations (9) and (10). Then, the combination weights of each indicator were calculated using the improved game theory method (Equations (17) and (18)) to be Equation (28), as shown in
Table 4 and
Figure 4.
Sample 1 is used as an example in this paper, while the computational process of the remaining 39 groups of samples was the same as that of sample 1. Therefore, only the computational results are listed (see
Table 5), and the detailed computational process is not repeated.
According to Equations (19)–(21), the single-indicator measure matrix was:
According to Equations (23), (28), and (39), the comprehensive weight was:
According to Equation (25), when
p = 1, unascertained measurement distance L can be calculated:
The shortest distance
was determined:
According to Equation (26), when
p = 1, sample 1 could be calculated using the distance discriminant method to predict rockburst class III, which belongs to the medium rockburst classification.
The shortest distance
was determined:
When p = 2, sample 1 could be calculated using the distance discriminant method to predict rockburst class III, which belongs to the medium rockburst classification. Likewise, for p = 3 and 4, it was possible to calculate rockburst intensity class III according to the same method.
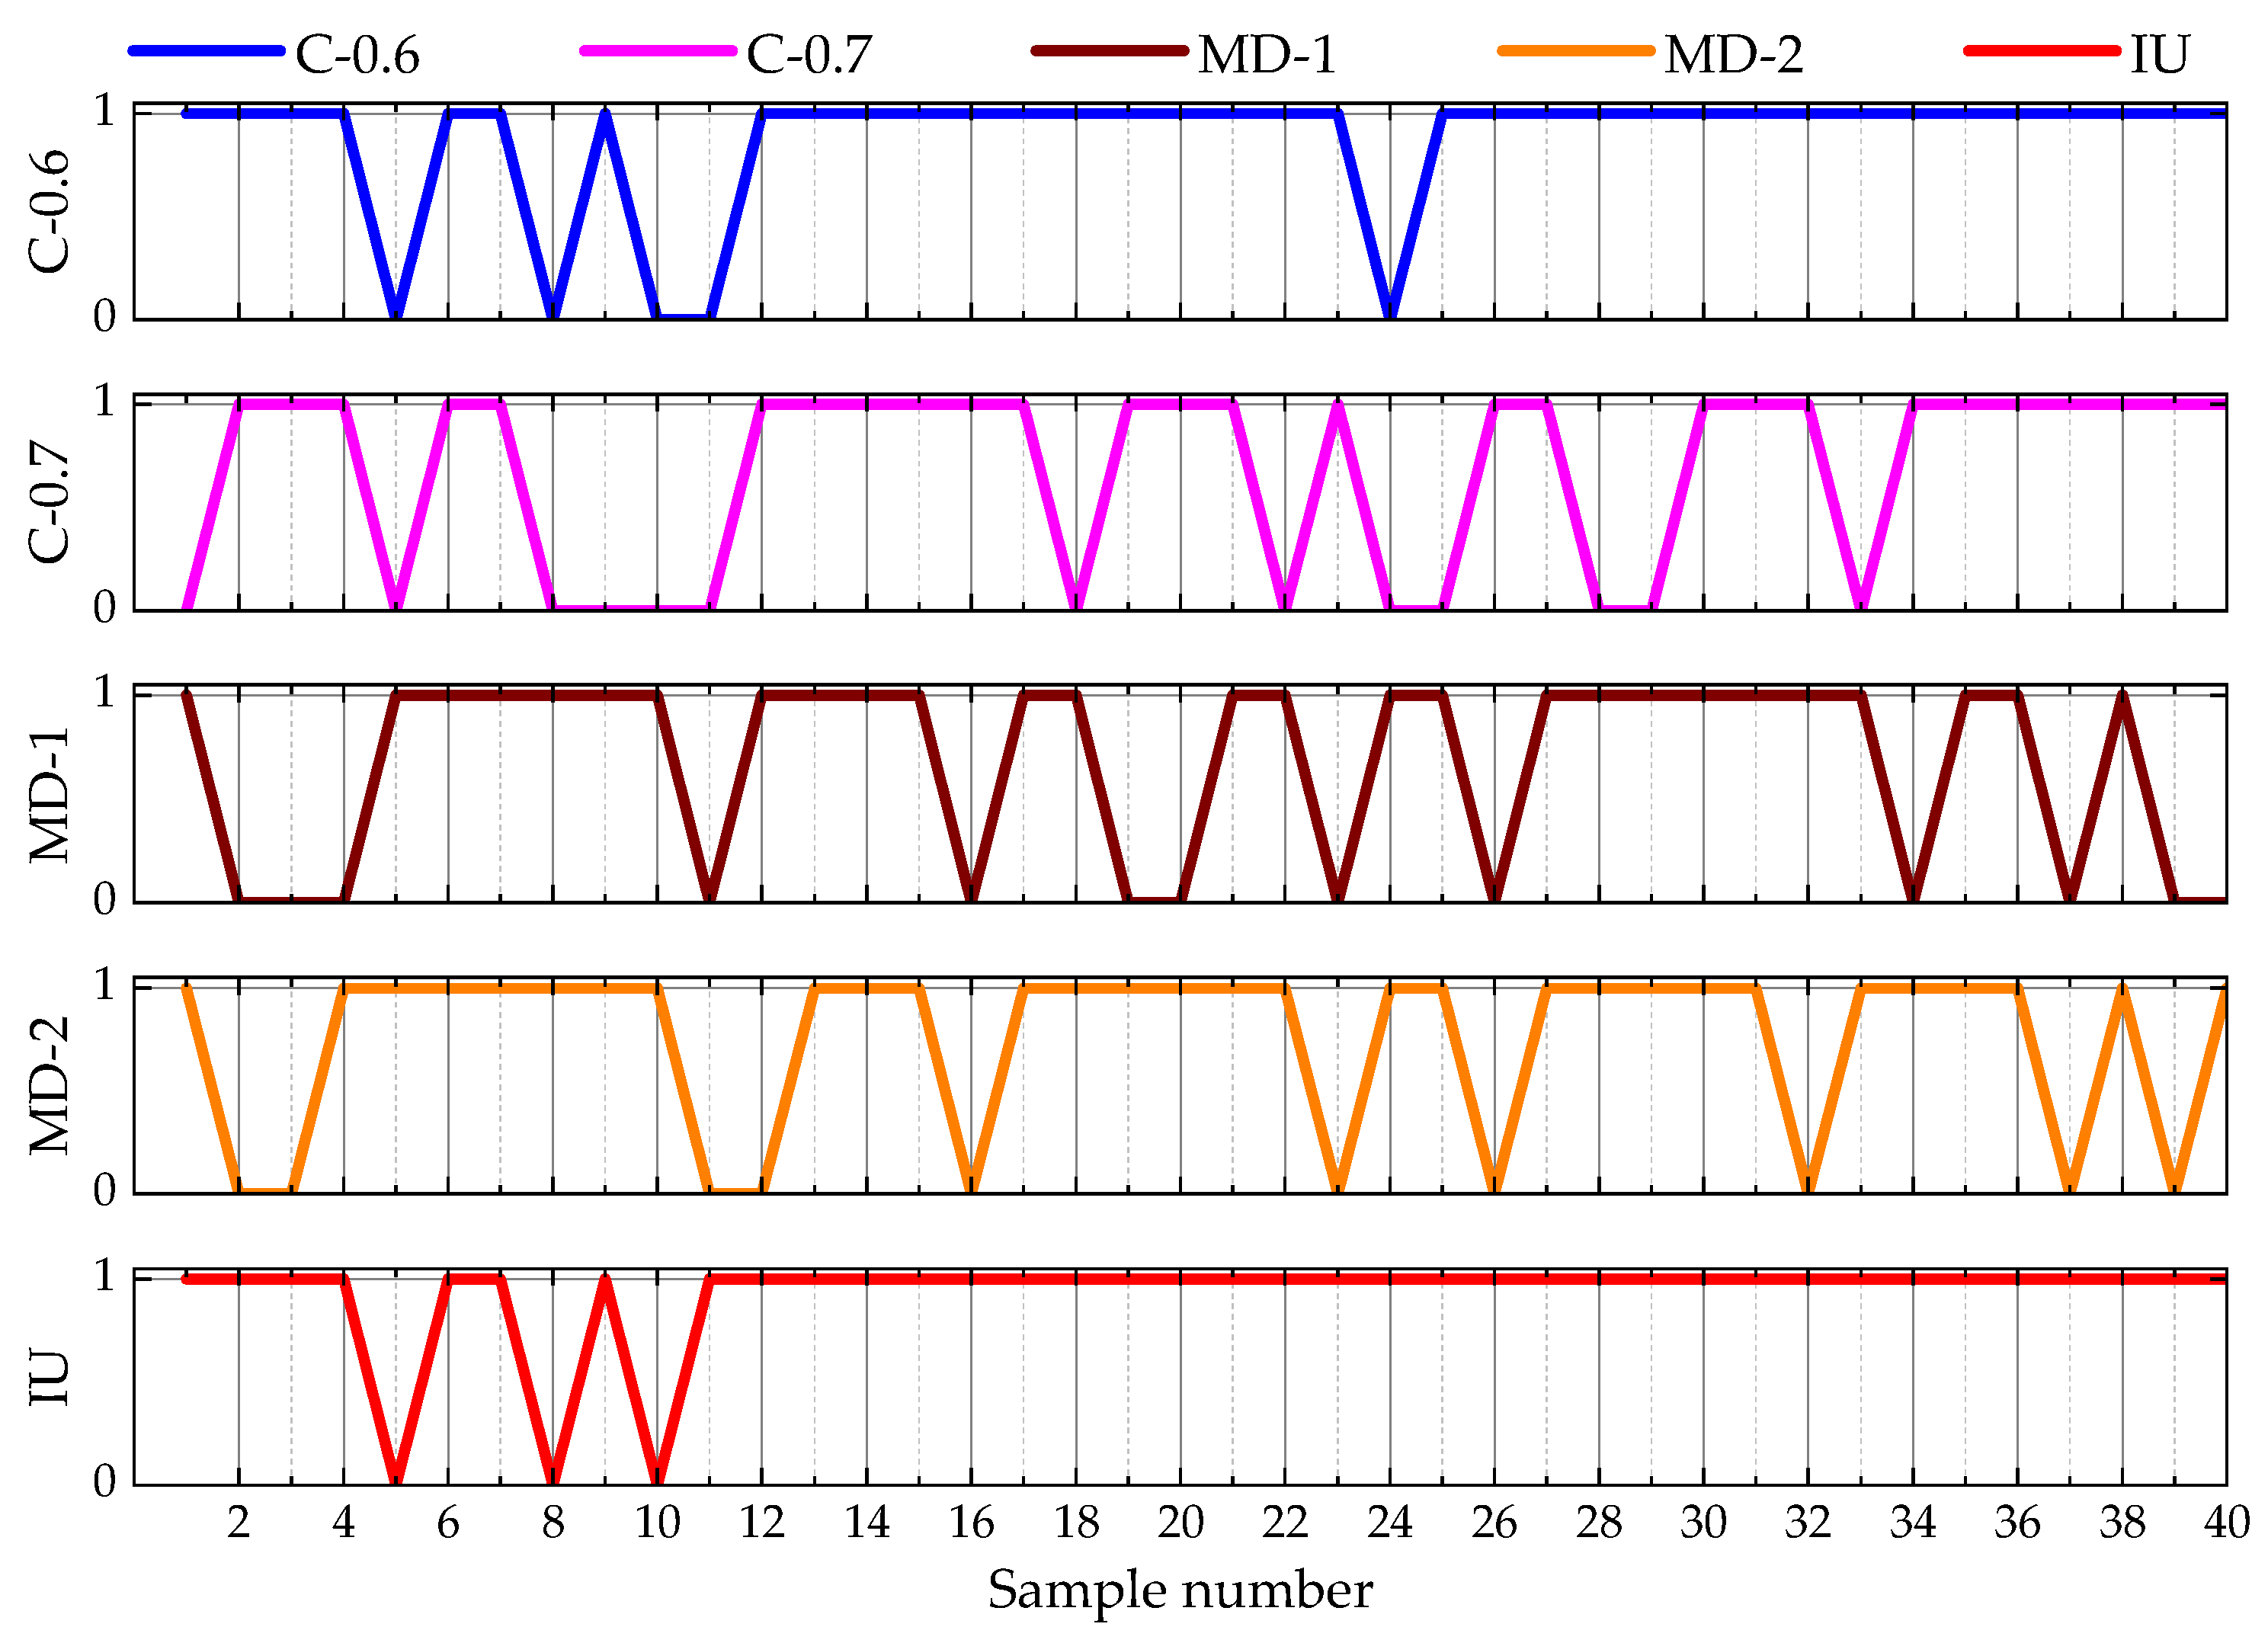
The credibility degree was set at 0.6 and 0.7 when calculated using the confidence criterion [
57,
60]. It was compared with the attribute identification model optimized using the Minkowski distance discrimination criterion. Then, the accurate judgments and misjudgments of the predicted rockburst intensity were calculated for each model (see
Table 5).
As shown in
Table 6 and
Figure 5, the accuracy of the prediction results using the improved unascertained measurement was 92.5%, and the prediction evaluation results were the same when
p = 1, 2, 3, and 4. Accordingly, on one hand, the accuracy values of the prediction results when calculated using the confidence criterion with the credibility degree set at 0.6 and 0.7 were 87.5% and 67.5%, respectively. On the other hand, the accuracy values calculated solely using the Manhattan distance and Euclidean distance methods were 67.5% and 75.0%, respectively. Compared to the other models, the improved unascertained measurement proposed in this paper had higher accuracy, with more accurately judged cases than the other models and a smaller number of misjudged cases. Therefore, it was demonstrated that the model is more accurate and reliable in practical engineering applications. Furthermore, the predicted rockburst results of the model were higher than the actual classes, even in the case of misjudgment, which means that the use of the model’s predictions to prevent the occurrence of rockburst hazards provides a greater assurance of safety.


