1. Introduction
The
funa is a prevalent concept in Chile; although it is not a term recognized by the “Real Academia Española” (RAE) (
http://www.rae.es, accessed on 3 April 2023), it is important for social network communities. The term is old for the Chilean community since
funa comes from Mapudungún (the language of the native people from the south of Chile), and it means “rotten”; however, it has a different meaning on social networks. According to Schmeisser [
1],
funa is defined as: “an action of denigration and repudiation towards someone who is considered to have incurred in an unjust or illegal action”; i.e., it is usually a story that exposes a person’s bad behavior in society. This bad behavior ranges from physical to psychological abuse, including delinquent behavior. Therefore, this exposure aims to achieve mass dissemination to punish the aggressor publicly and warn the community about the person. Despite its massive use in Chilean society, the actual dissemination of
funas among communities is unknown.
The
funa started to be used again in 2018 through the use of flyers and other physical content; however, its current propagation is mainly based on social networks. After Augusto Pinochet was arrested in 2018, the term was used to uncover those responsible for all the disappearances, executions, and torture under his dictatorship. People began to hand out flyers containing information on multiple military personnel accused of human rights violations to those walking in the streets [
1,
2,
3]. However, today the
funa has expanded to cover not only the violation of human rights but also any illegal or unfair situation. Furthermore, its method of diffusion has changed over time, with social networks becoming the primary means of dissemination. This could be explained by the speed of propagation to a mass audience with just a simple click.
According to the Digital 2020 report prepared by “
We are Social” in collaboration with “
Hootsuite”, social networks have become indispensable in the daily lives of people around the world. In 2021, social networks had over 4.5 billion users worldwide and around 15 million in Chile; 33% of the users were between 23 and 34 years old. As of June 2022, the most popular social network in Chile was Facebook, with 15.7 million users, followed by Instagram, TikTok, and Twitter, with 9.9, 6.5, and 2.2 million users, respectively. These networks are vital to people because they are considered the most immediate and interactive channels for information dissemination [
4]. In this paper, we focus on Twitter because it is a social network that caters to communities of users whose intentions are entertainment (relationship with friends) and the dissemination and search for information [
5].
Twitter has enabled the dissemination and search for information through various functionalities. For instance, if user
A follows user
B, user
A will have access, on their home page, to the content published by
B. In addition, Twitter is the originator of hashtags, a set of words preceded by a “hashtag” (#) used to join public discussions, categorize messages, or build communities around a topic of common interest [
6]. Likewise, Twitter ranks hashtags, making it possible to observe trends at any moment. Additionally, the retweet, which is the reposting of another person’s tweet, empowers the user to disseminate information of their choice, regardless of their relationship with the original content publisher [
7]. These functionalities demonstrate that Twitter enables the dissemination of information, making it a relevant social network to investigate, analyze, and observe the real reach of the
funas.
For the aforementioned reasons, Twitter has become an essential alternative for Chilean citizens. Among its uses, the dissemination of the “funa” has significantly impacted different groups and communities. These groups create and spread “funas” through hashtags, retweets, and comments, creating important trends at a national level. However, we do not know how fast the “funas” spread and how many people are reached through these tweets.
This paper analyzes the characteristics of the spread of “funas” on the Twitter social network over time. To this end, we collected data on six different Chilean trending topics, including three funas. For each trending topic, we generated the corresponding social network by creating a connection between two users (nodes) based on the dissemination of information. Finally, we analyzed the changes in these networks over time and compared their behaviors (social networks related to funas against others). The final results show that funas have a specific behavior and disseminate as quickly as a common tweet, but they spread thanks to several network users, generating a cohesive network.
The following section shows the related work. In
Section 3, we explain the methodology used for the extraction of the data, the generation of networks, and the different measures used for the analysis.
Section 4 and
Section 5 show the results and discussion, respectively. Finally, the conclusions are in
Section 6.
2. Related Work
The arrival and extensive development of the internet have changed many aspects of society, including the forms of interaction and communication [
8]. Previously, there were only official mass media outlets such as newspapers, television, and radio, where there was only unidirectional diffusion. After the emergence of the Internet in 2004, the first websites began to be created, where it became possible to receive feedback from the public (
https://www.oreilly.com/pub/a/web2/archive/what-is-web-20.html, accessed on 3 April 2023) [
9]. Subsequently, in 2005, social networks began to gain importance because they allowed for multi-directional interactions, i.e., many-to-many or one-to-many conversations [
10]. Therefore, today social networks are used for communication and interaction between different people without time or place limits, enabling asynchronous conversations without geographical barriers [
11].
Social networks are spaces for communication between people, represented through their users and their connections. In these communication network platforms, participants can: (1) provide content, consume content provided by another user, or content provided by the system; (2) establish connections to reach other users; and (3) consume, produce, or interact with users who generate content [
8]. Thus, user behavior makes it possible to obtain, disseminate, or produce information. Indeed, anyone can be a potential participant, as social networks are relatively easy to use, and there is no monetary cost to log in and be part of the online community. Even minority groups, which are usually overlooked, can use this tool to make their voices heard [
10].
One of the essential social networks is Twitter, a microblogging service founded in 2006. Twitter is a social network focused on providing a space and environment for interaction between people. This social network allows the sharing of messages of 280 characters among people, known as tweets. Additionally, these messages can be published publicly or privately (the tweet is restricted to a group of people), and people can subscribe (follow) other users, being aware of the tweets generated by that person. Twitter has two primary tools for information to flow through users: hashtags and retweets. The hashtag is a word preceded by a # used to mark the topics of a publication or index keywords, allowing other users to follow the conversation focused on that particular topic [
7,
11]. Retweeting shares the tweet of another user, attracting new people to a particular “thread” of conversation. The idea of disseminating a message is to reach new audiences [
11,
12].
The dissemination of information in a social network can be analyzed through graph theory. A graph consists of a set of nodes and edges, indicating the relationship between them. In the case of Twitter, the nodes correspond to the Twitter accounts, representing the social network users. At the same time, the interaction between users gives the relationship between the nodes through comments, retweets, or following, among other ways of connecting. Initially, these edges were represented through static graphs, considering nodes and edges that do not change over time. However, in real life, many of these graphs are dynamic. In other words, new nodes are added to the network, existing nodes can be removed, and the relationships between them can also change [
13].
According to Young [
14], there are multiple models that are able to analyze dissemination in social networks, including the contagion model, the social influence model, and the social learning model. The contagion model is based on infectious diseases, and the assumption that information can spread similarly [
15]. The social influence model assumes that information spreads through neighbors in a network. Thus, a group of people is assumed to believe the information when the number of users spreading the information exceeds a certain threshold [
16]. Unlike the first two models, the social learning model assumes that nodes are rational decision-makers who observe the outcomes of previous adopters among their neighbors and then decide whether or not to believe the information [
17].
In addition to the previous approaches, new models have been developed to analyze the dissemination of information. Woo et al. [
18] proposed a logistic growth model for disseminating violent topics through social media. The model assumes that the number of authors of a violent publication grows according to the number of people in the network, but with a specific limit. The number of authors is based on three characteristics: the current violent authors, the interactions between their followers and new users, and the decay of the influence of violent authors over time. Furthermore, Feng et al. [
19] assumed that users share or disseminate information according to their preferences and select different types of social relationships based on the preferred information. The model shows that users are active and have a preference for the propagation of information. Likewise, Wan et al. [
20] postulated a model based on the triangle closure principle and combines the factors of opportunity, social trust, and choice motivation. The first factor assumes that the opportunity to receive specific information can be measured by the similarity of interests between two users. The second factor determines a threshold of social trust, combining the influence of the users’ network and the contribution of the content. Finally, the third factor refers to recognizing users’ motivation to spread a message within a game. This factor determines that motivation is given by the choice of strategies to benefit oneself the most. It was found that by simultaneously considering the network structure and information content, users’ social trust can accelerate the dissemination of information in microblog social networks such as Twitter.
The theory of information diffusion has been put into practice in several studies. On the one hand, Kwak et al. [
7] concluded that once a message was retweeted, the tweet was almost instantly retweeted two, three, and four-node hops away from the source, indicating rapid information diffusion after the first retweet. This retweet implies that the tweet is retweeted by users up to three people apart from the user who made the post. Complementing this information, Lerman et al. [
21] analyzed Twitter using cascades (sequences of activation generated by a contagion process, in which the nodes cause the connected ones to be activated with a certain probability) and detected that the graph has multiple dendrites. The network is tree-shaped, where each node follows, on average, a previous user. Moreover, Gaito et al. [
22] studied the evolution of Renren (China’s largest online social network) and analyzed the temporal property of the explosion in link creation. The bursts were detected by measuring the acceleration of node degree growth. One of the observations was that when users first join the network, they create a relationship based on the preferential attachment mechanism (nodes with more edges obtain more edges in comparison to nodes with fewer edges [
23]); however, in subsequent bursts, they explore various network regions to create relationships. Next, Singer et al. [
24] studied the evolution of social networks and their content network on Twitter. A content network is defined as a network of user tweets where a user is linked to the tweets he or she has posted. It was found that the characteristics of a social network have a strong influence on the content network. For example, the number of followers of a user is highly influenced by his activity level (number of tweets he posts). Similarly, ten Thij et al. [
25] monitored Iran’s 2009 elections via Twitter. This study found that the graph tends to be wide but not very deep. This wide means that the people who retweet are followers of the user who made the original tweet, so the diffusion is mainly concentrated on direct users.
Another type of research related to the diffusion of information is the analysis of explosive topics, which correspond to topics that occur suddenly and for a short duration of time. Dong et al. [
26] analyzed the patterns of explosive topics on Twitter and found that information tends to spread from influential users to normal users, meaning that the dissemination of these types of topics tends to be wider than deep. Moreover, they found that the dissemination of multiple related explosive topics tends to spread among influential users, reaching more people than the dissemination of a single explosive topic. On the other hand, Hemsley et al. [
27] analyzed the importance of informative and emotional tweets and found that while informative posts are shared the most, emotional posts attract new users to the discussion. Finally, King and Wang [
28] studied the viralization of truthful and misleading publications on Twitter based on the tweets published during Hurricane Harvey. It was found that there is high dissemination of misleading publications or those with low lexical complexity. However, they concluded that real social news is more likely to go viral than news from these types of tweets.
Although the state-of-the-art shows continuous development in how information is disseminated in social networks through models that study graph dynamics, there is no characterization of “funa” behavior as understood by Schmeisser in [
1]. Therefore, this article will focus on them through four different metrics. Surprisingly, we can differentiate the trending topics on Twitter corresponding to “funas” from others.
3. Methodology
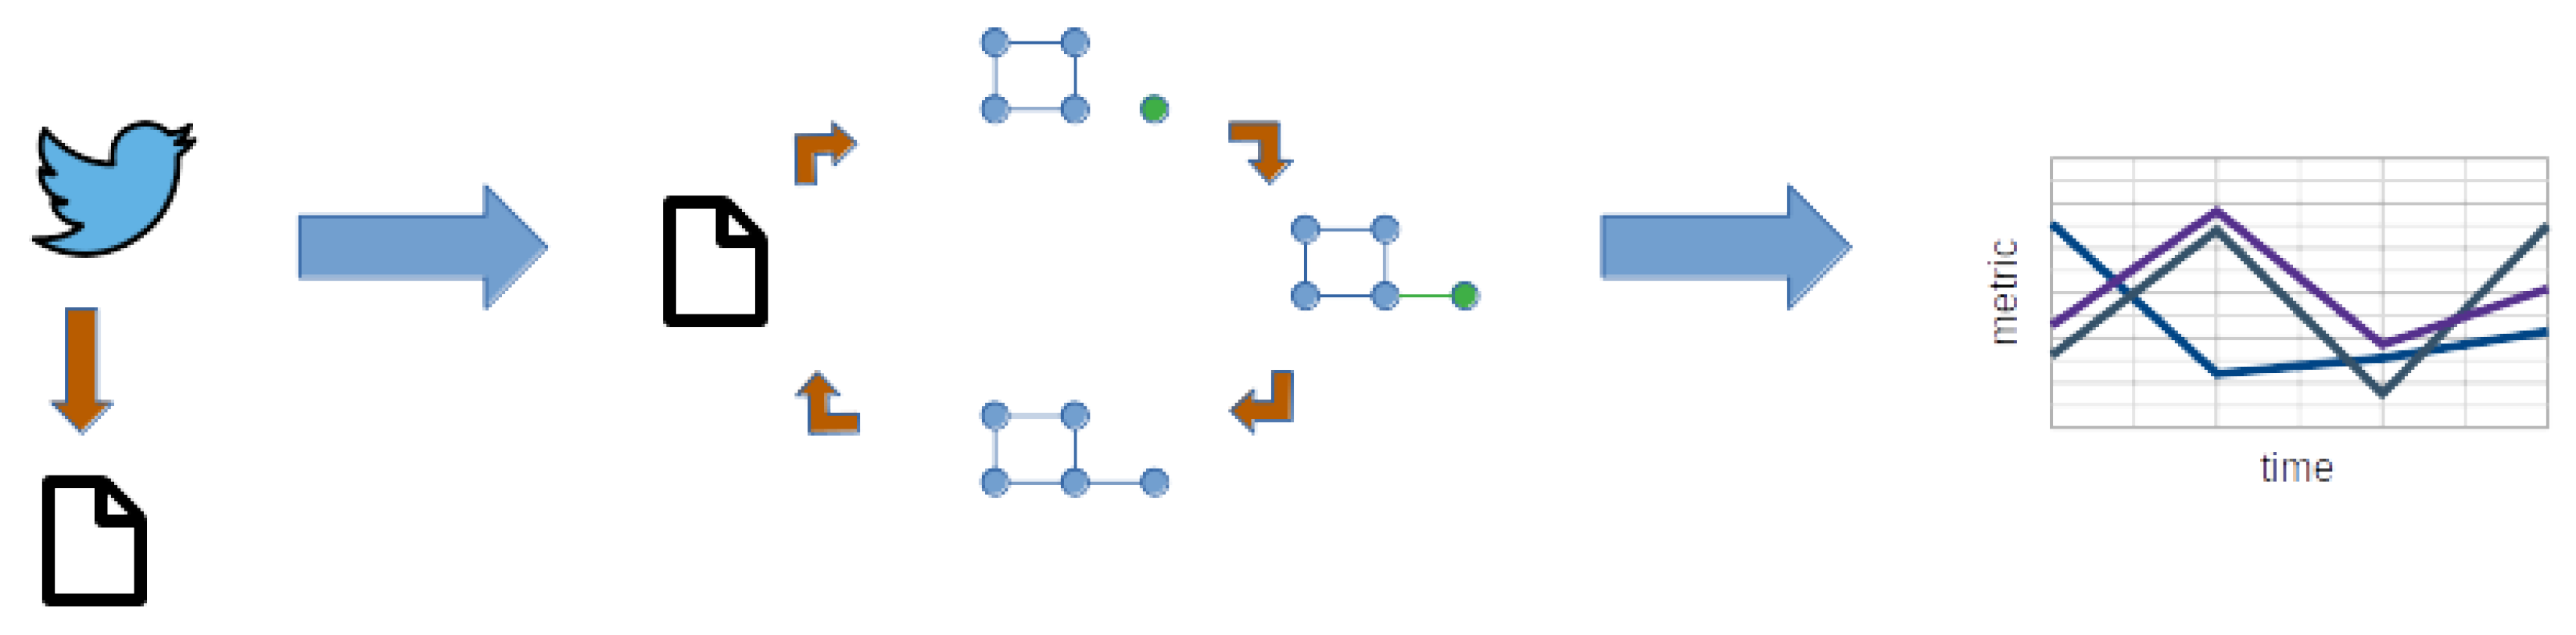
In this section, we explain the three-step methodology applied in this paper (extraction, generation, and analysis, as shown in
Figure 1). The extraction process corresponds to the collection of tweets through the Twitter API. The generation process creates the network structure over time. Finally, the analysis shows the metrics used in this paper to analyze the dissemination of “funa” and other types of tweets.
To analyze the dissemination of information, we made two assumptions. First, we assume that the people who produce and retweet a specific tweet observed the information. Second, we assume that the followers of a user could also observe this information. For this reason, we extracted tweets based on specific hashtags and the followers of the users who published this information.
The tweets were extracted using the Twitter API through the functions Filtered Stream v2 (to capture tweets with specific content, i.e., hashtags) and Friendship (to capture people who are followers of a specific user). Within these captured posts, there is different information, including the user identifier (corresponding to a unique user number), the content of the post, the type of post (indicating whether it is a tweet, retweet, quote, comment, etc.), and the date and time of the post.
Once the tweets and followers were extracted, we proceeded to create the network structure. The network structure aims to form a retweet graph that relates the users (nodes) according to the followers through time. Initially, we capture all retweets containing a specific hashtag or word defined by the user, such as “funa”. Then, we proceed to create the network through a timeline. We start by creating the first node of the network, corresponding to the user who published the original tweet (remember that other users retweet this tweet). We then add their followers (assuming they could observe the information) and all the retweets based on their time. When a new retweet is observed, we analyze if the user (node) already exists in the network. If the user already exists, we add their followers to the network and connect them (new connections between existing nodes are generated). Otherwise, if the user is not in the network, a new node is added and linked to the central node.
To compare the dissemination of funas information versus other topics, we analyze some network characteristics of the generated structure. We start by capturing all the information of the tweet and its retweets for a period of one week for a selected trending topic. Then, to generate the network, we begin with a single node (the node of the tweet) and add node by node (retweets) and edges, as described in the previous paragraph. To analyze the network over time, we calculated the following characteristics every time a new node and its corresponding edges were added to the network: degree distribution, hop plot, clustering coefficient, and betweenness centrality. To focus on the spread of funas through the network, we assumed undirected edges to analyze the mentioned characteristics.
Let be an undirected graph where is the set of vertices and is a subset of unordered pairs of edges, where implies an undirected edge between vertices and .
Let
be the degree of a vertex
, then
is the number of connections that node
has with other nodes. The
degree distribution is the fraction of nodes in a graph with a certain number of degrees, where
k varies between one and the maximum degree among all nodes [
29]. Therefore, if
, it implies that
of the nodes have a degree equal to
k. Given the graph
, corresponding to the graph
G at time
t, with a maximum degree
, the average degree distribution at time
t is given by:
This expression is the average of all the degrees of the graph at a given time t. Therefore, it is interesting to compare its variation over time, as the network grows when new information is captured.
The
hop plot is the number of nodes with a certain distance
h between them [
30]. A weighted average across all nodes will be considered to obtain a single value that can be visualized over time. Let
be the total number of possible paths between two nodes, and let
D be the diameter of the graph (i.e, the maximum number of nodes minus 2 of the longest shortest path between any two vertices [
31]). Then, given the graph
, corresponding to time
t, the average hop plot at time
t is given by:
Assuming a network with a large number of nodes, a low value of would imply that most of the nodes are connected among them, obtaining a low distance between any pair of nodes, or that all nodes are connected to the central node. On the other hand, a high value of could imply that the nodes are not highly connected.
The
clustering coefficient measures the probability that two nodes that share a neighbor are connected, i.e., a triangle is formed [
13]. Given the graph
, corresponding to time
t, the
clustering coefficient of node
at time
t is given by:
where
is the number of closed triangles for node
at time
t and
is the number of possible triangles that node
i can generate at time
t.
The
clustering coefficient of each node varies between 0.0 and 1.0, where 0.0 means that there is no triangle, i.e., there is little clustering between nodes. In the opposite case, a value of 1.0 implies that all of its neighbors are connected, showing, a cohesive network [
32].
For the network analysis, the
average clustering coefficient at time
t, which is the average of the calculated
clustering coefficients, will be used. Given the graph
, corresponding to the graph
G at time
t, with the current number of vertices
, the average clustering coefficient at time
t is given by:
A high value of the average clustering coefficient would imply that the network is highly clustered and interconnected among most nodes. In the case of information dissemination, it would indicate that people who retweet the publication are also users who follow each other. On the other hand, if a low value is obtained, it implies a low interconnection between the nodes.
The
betweenness centrality quantifies the number of times a node acts as a bridge in the shortest paths. It is worth mentioning that the shortest path is the path between two nodes with the least amount of hops, also called the geodesic distance, and implies that the node belongs to that shortest path [
29]. The
betweenness centrality for a node
is calculated as follows:
For each pair of nodes , with , we obtain the shortest paths between them.
For each pair of nodes , with , we determine the fraction of the shortest paths through node .
We add the fractions for each pair of nodes .
The value of betweenness centrality can vary from zero to the number of pairs of nodes being evaluated. In an information dissemination network, the node that has a high value is the user that has the most influence on the information. This influence implies that much of the information passes through that node. On the contrary, a low-value user implies that information dissemination is not centralized. Therefore, there is a greater dispersion of information.
For practical purposes, we will use the
average betweenness centrality at time
t on the set of nodes
(set of nodes at time
t), which can be expressed by:
A low value of would imply that there are many users with low influence, leading to a scenario where all the information is concentrated in the central tweet or where all users are strongly connected. A high value, on the other hand, would indicate that a limited number of users have a strong influence on the dissemination of information through the network, meaning that users are only sharing information with a restricted group of their contacts.
4. Analysis and Results
In this section, we analyze the dissemination of six different tweets, three of which correspond to funas and three to other Chilean trending topics, based on their network structures’ characteristics over time. We considered the distributions of the features described in the previous section as time (hours) progressed. We limited the analysis to these six tweets for two reasons. First, several funa tweets were eliminated from Twitter before reaching more than 500 users. Second, we wanted to have a similar comparison between trending topics and funas.
4.1. Tweet Trend, the Hairdresser of “La Roja”
The first tweet was written in the context of the Copa América Brazil 2021 when Chile’s adult national football team was competing. The Chilean team broke the sanitary bubble imposed due to the COVID-19 virus by inviting a Brazilian hairdresser to the hotel. As a result, the hashtag “SelecciónChilena” trended on Twitter (in Chile), and one of the most retweeted tweets was: “La esposa del portero siempre tuvo razón. #SelecciónChilena” (The names contained in this tweet were removed.) (The goalkeeper’s wife was always right). The tweet references the wife of a Chilean goalkeeper who said that several players were not serious about the national team. This tweet was published on 20 June 2021 at 14:07, generating around 500 retweets and approximately 1000 edges.
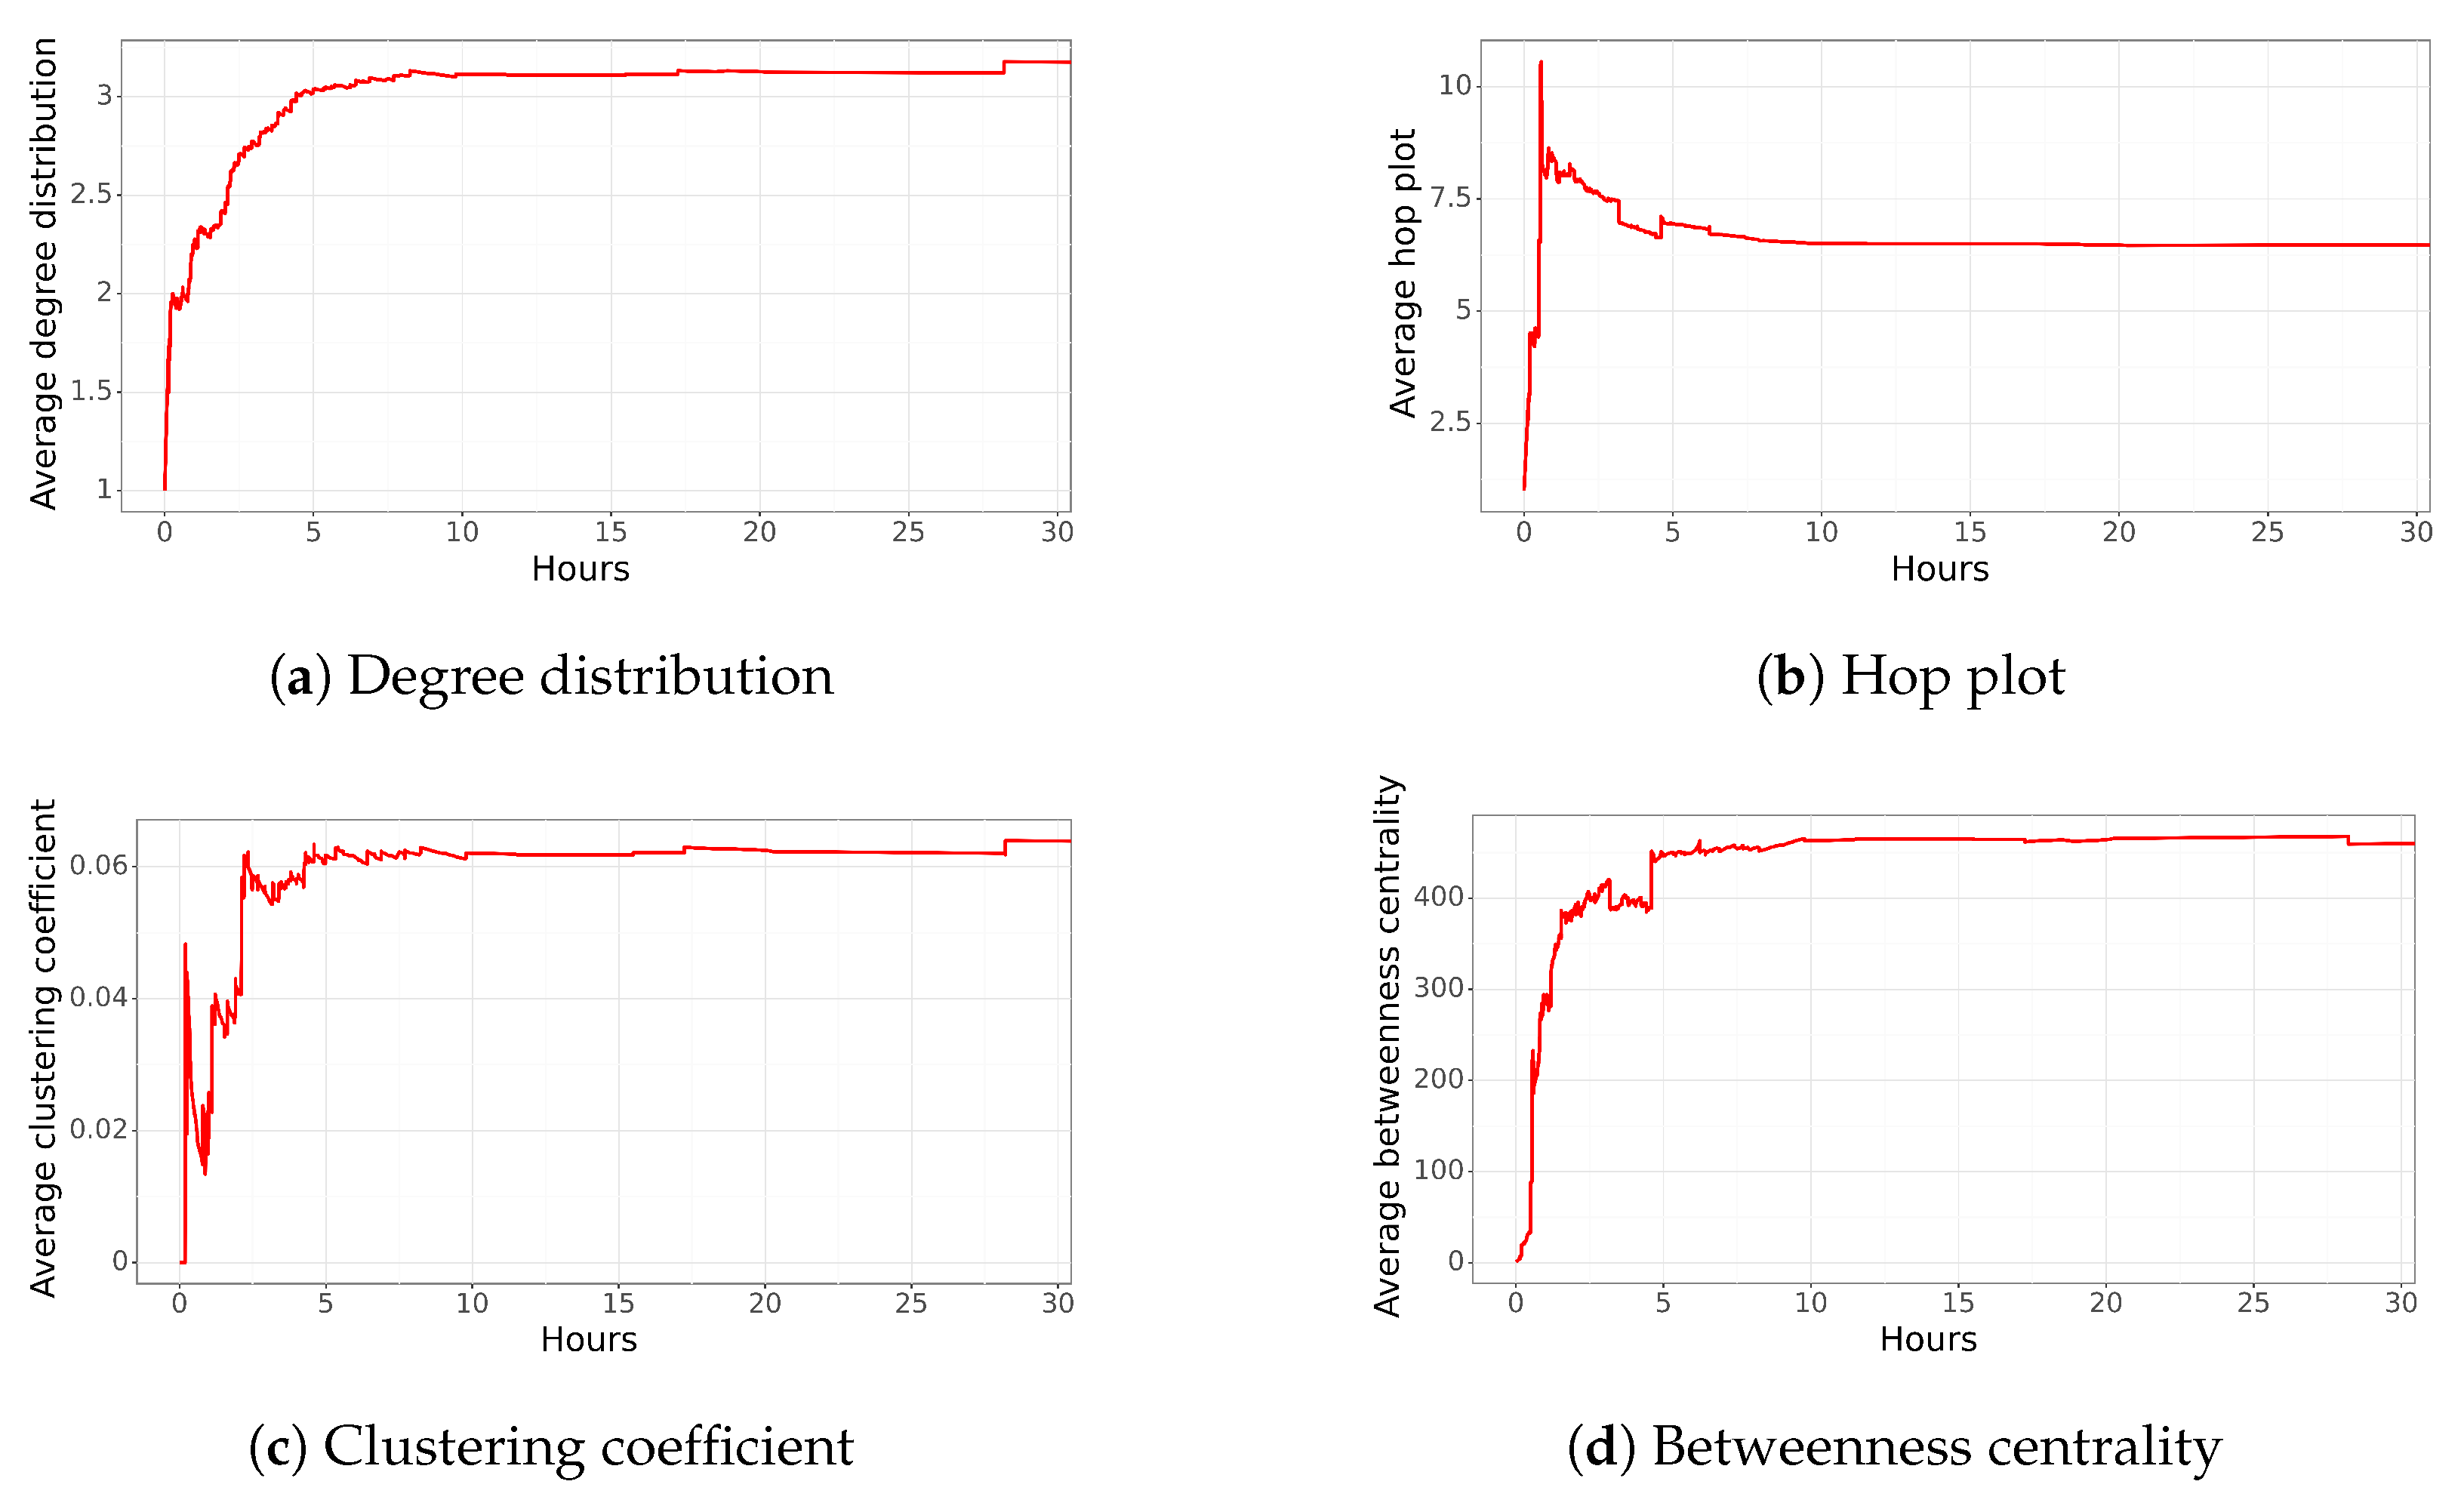
Figure 2 shows the average network characteristics over time. The top left plot shows degree distribution, the top right shows the hop plot, the bottom left shows the clustering coefficient, and the bottom right shows betweenness centrality. This type of figure will be shown for all of the tweets analyzed. However, as can be observed, in this case, we are showing only one day instead of the entire week because the network structure remains stable after a day.
In
Figure 2a, at the top-left, we can see that the
average degree distribution increases from 1 to 3 connections on average in 5 h and then remains relatively stable over time. Further analysis revealed that an edge was created on average every 36 s during the first 3 h. In the next two hours, new nodes were added that connected to multiple nodes, instead of a single node. Finally, new edges were added in the last few hours, without significantly altering the network structure.
The
Figure 2b shows the average hop plot as the network grows over time. At approximately 1 h and 25 min, the network reaches its maximum average distance of 10 nodes, reaching different groups of people that were not directly related to the central node. Then, at 5 h, it approaches the value of 6 average hops, at which it stabilizes for the remaining hours. It is worth noting that the property of the Small World model of
Watts and Strogatz (on average, people are connected through 6 hops) is fulfilled. The general behavior coincides with the analysis of the
average degree distribution, as users begin to relate to each other after the first few hours, resulting in a shorter distance.
The average clustering coefficient of the network is shown in
Figure 2c. The plot shows an almost continuous growth of the average clustering coefficient from 0% to 6% in the first 5 h. This implies that some interactions within the network generated some triangles, but most connections were not made among users that knew each other.
Finally, the average betweenness centrality is shown in
Figure 2d. A growth of
betweenness is observed within the first 2 h and 30 min (up to 200), which corresponds to the moment when new users relevant to the dissemination of information are added to the network. Then, it stabilizes at 450, reaching 800 edges after 5 h. In the following three hours, new users are informed only through relevant network nodes, stabilizing the network structure to a value close to 450.
In summary, the generated social network shows a very low average degree distribution with a low clustering coefficient, indicating that most of the users are not connected to each other. This is also supported by the values of the hop plot and betweenness centrality, which also indicate a network that is primarily connected through a few critical nodes rather than a highly connected network. It is also worth noting that the dissemination of the tweet lasted only a couple of hours. During the first two hours, most of the dissemination was related to the central node, but in the following hours, new significant nodes were used to spread the information. However, after a couple of hours, the tweet was not retweeted at the same pace as in the beginning. This could be due to the information losing its importance or no longer being relevant to disseminate further.
4.2. Tweet Network “Funa” to Former Captain of the Police
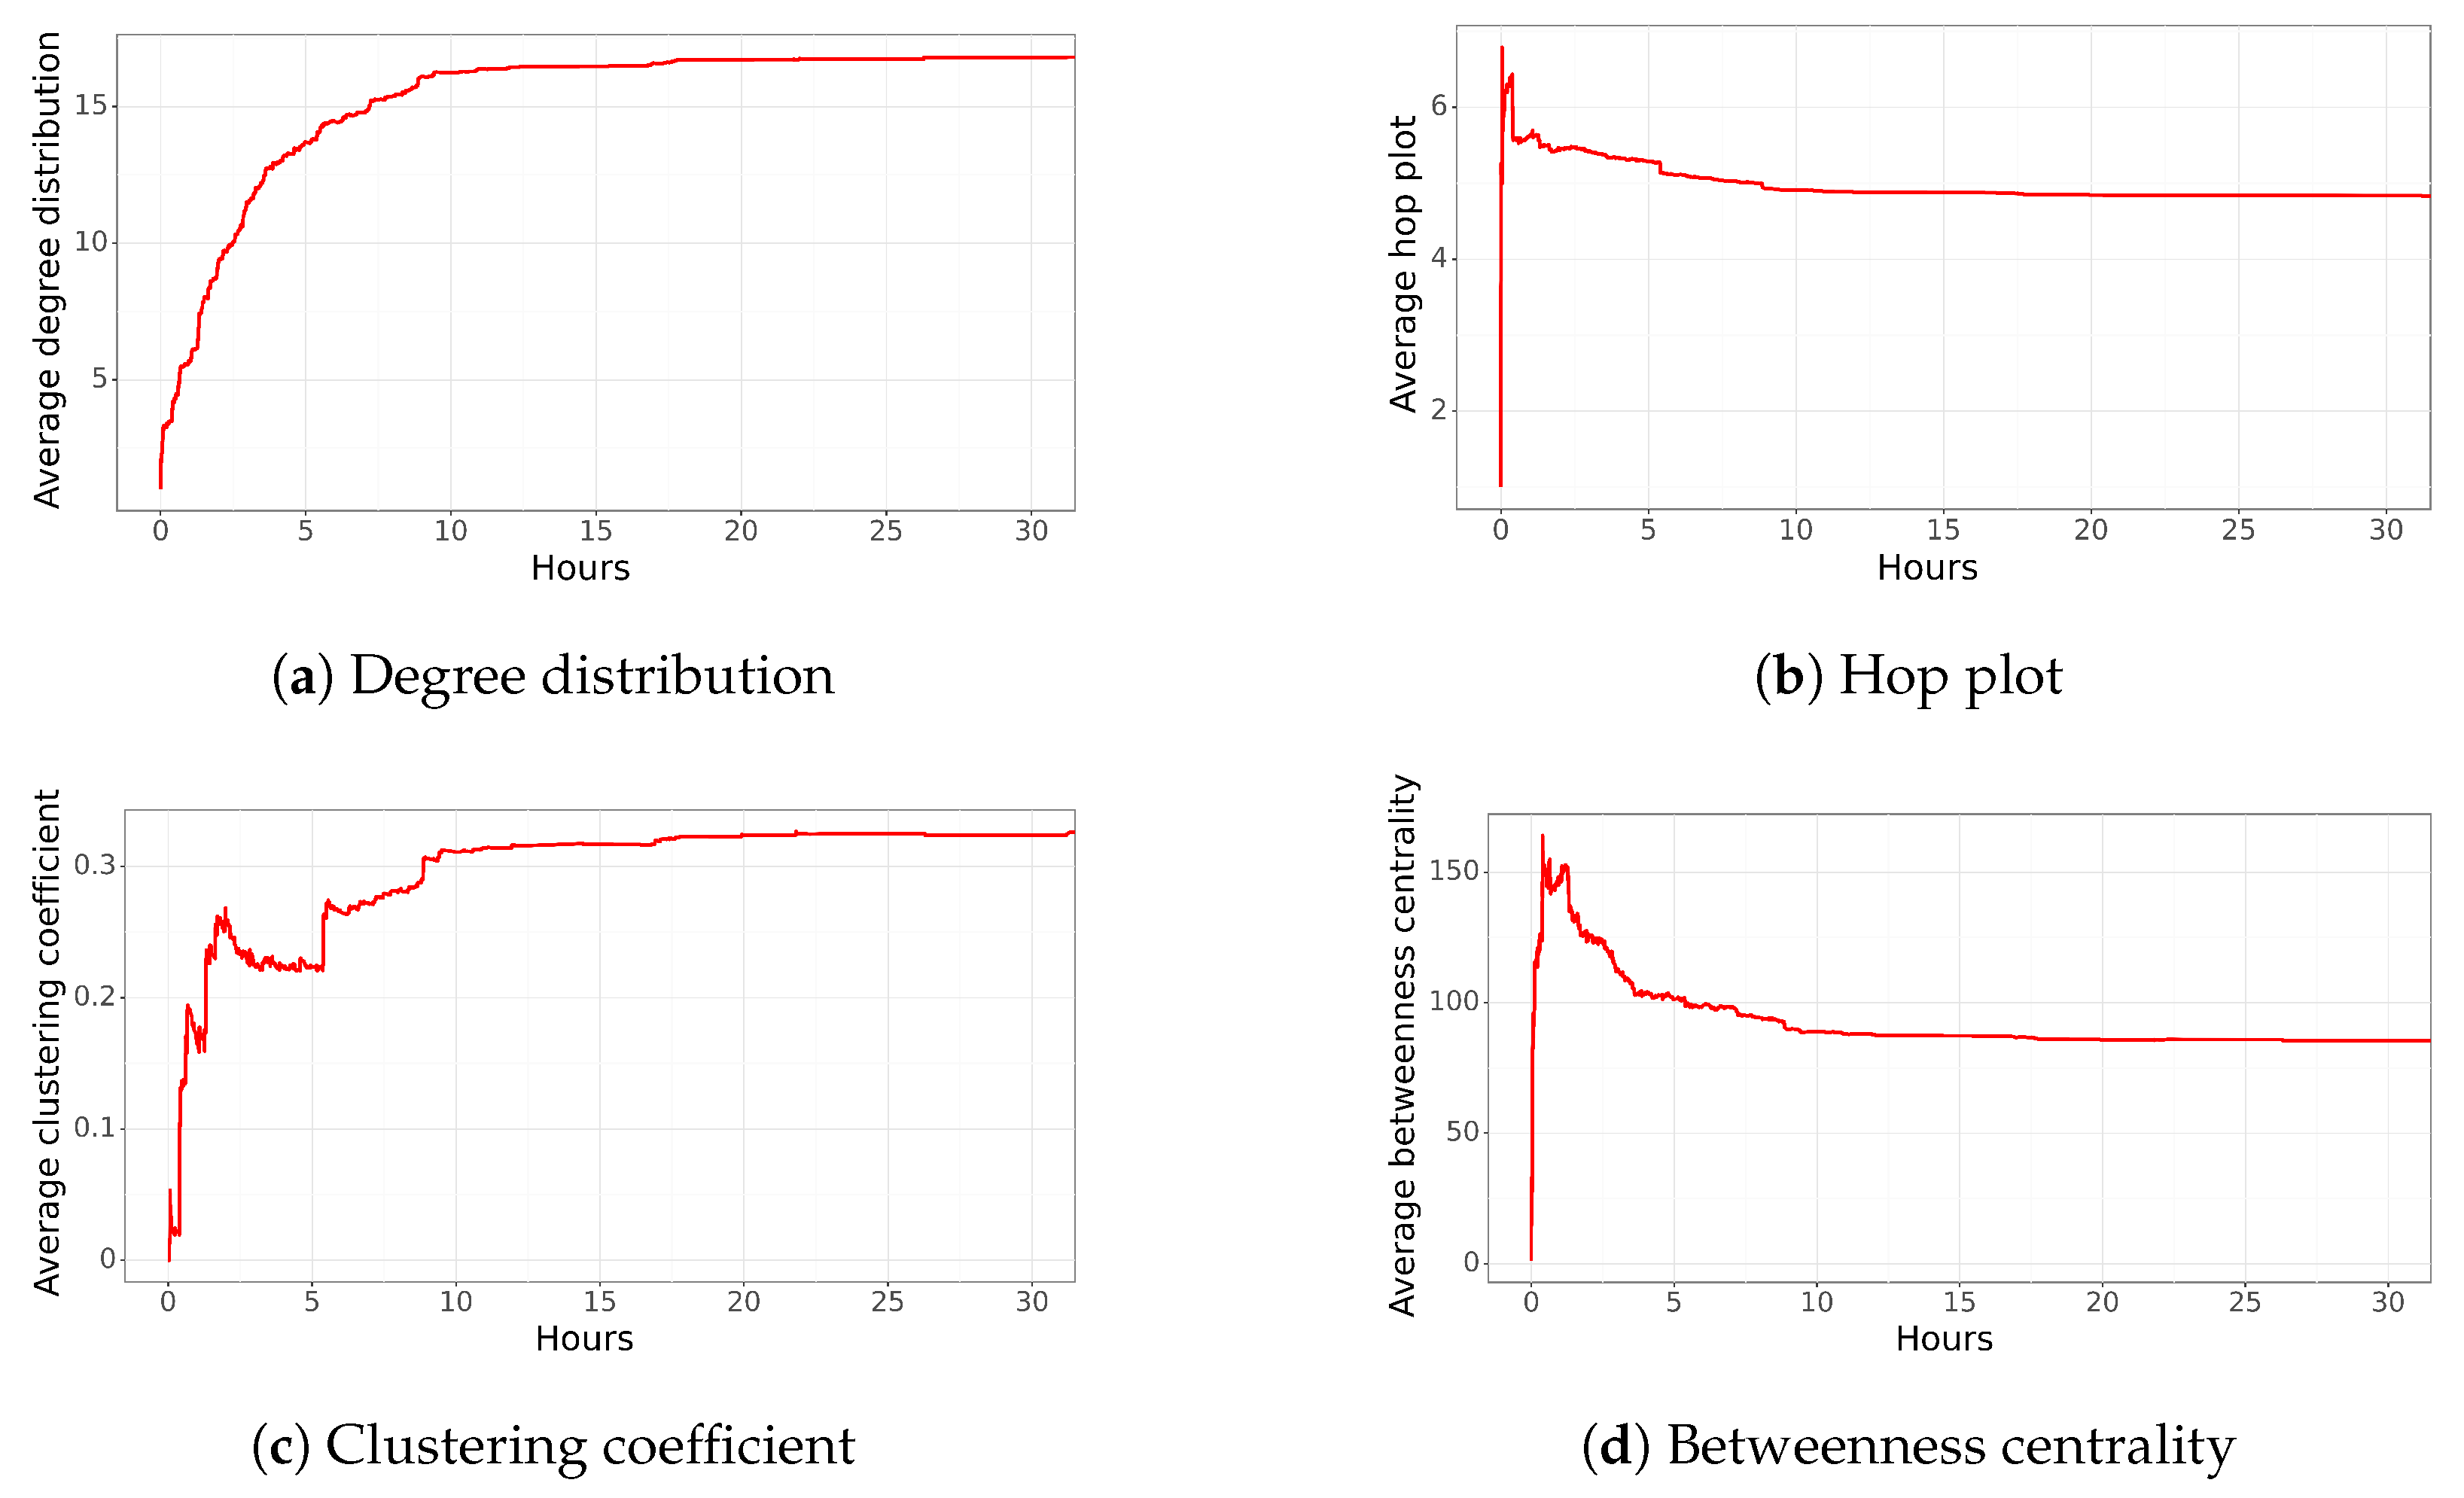
The funa to be analyzed concerns the former captain of the Chilean police force who has been charged with unlawful coercion causing serious injury against a citizen. In 2019, the woman lost her sight, taste, and sense of smell due to the impact of a tear gas canister thrown by the former captain of the police. The ex-commander’s uniform camera captured the incident, and multiple witnesses observed the situation. However, in July 2021, the court revoked his sentence and put him under house arrest. The tweet featured an image of the captain with the following words: “Se busca el capitán Mutilador. Si no hay justicia, hay funa” (The names contained in this tweet were removed.) (Mutilator captain wanted. Without justice, there is funa). This post was made on 2 August 2021, at 13:29, resulting in a funa network with 870 users and 12,682 edges, which stabilized after 2 days (even though it was retweeted after 4 and 5 days).
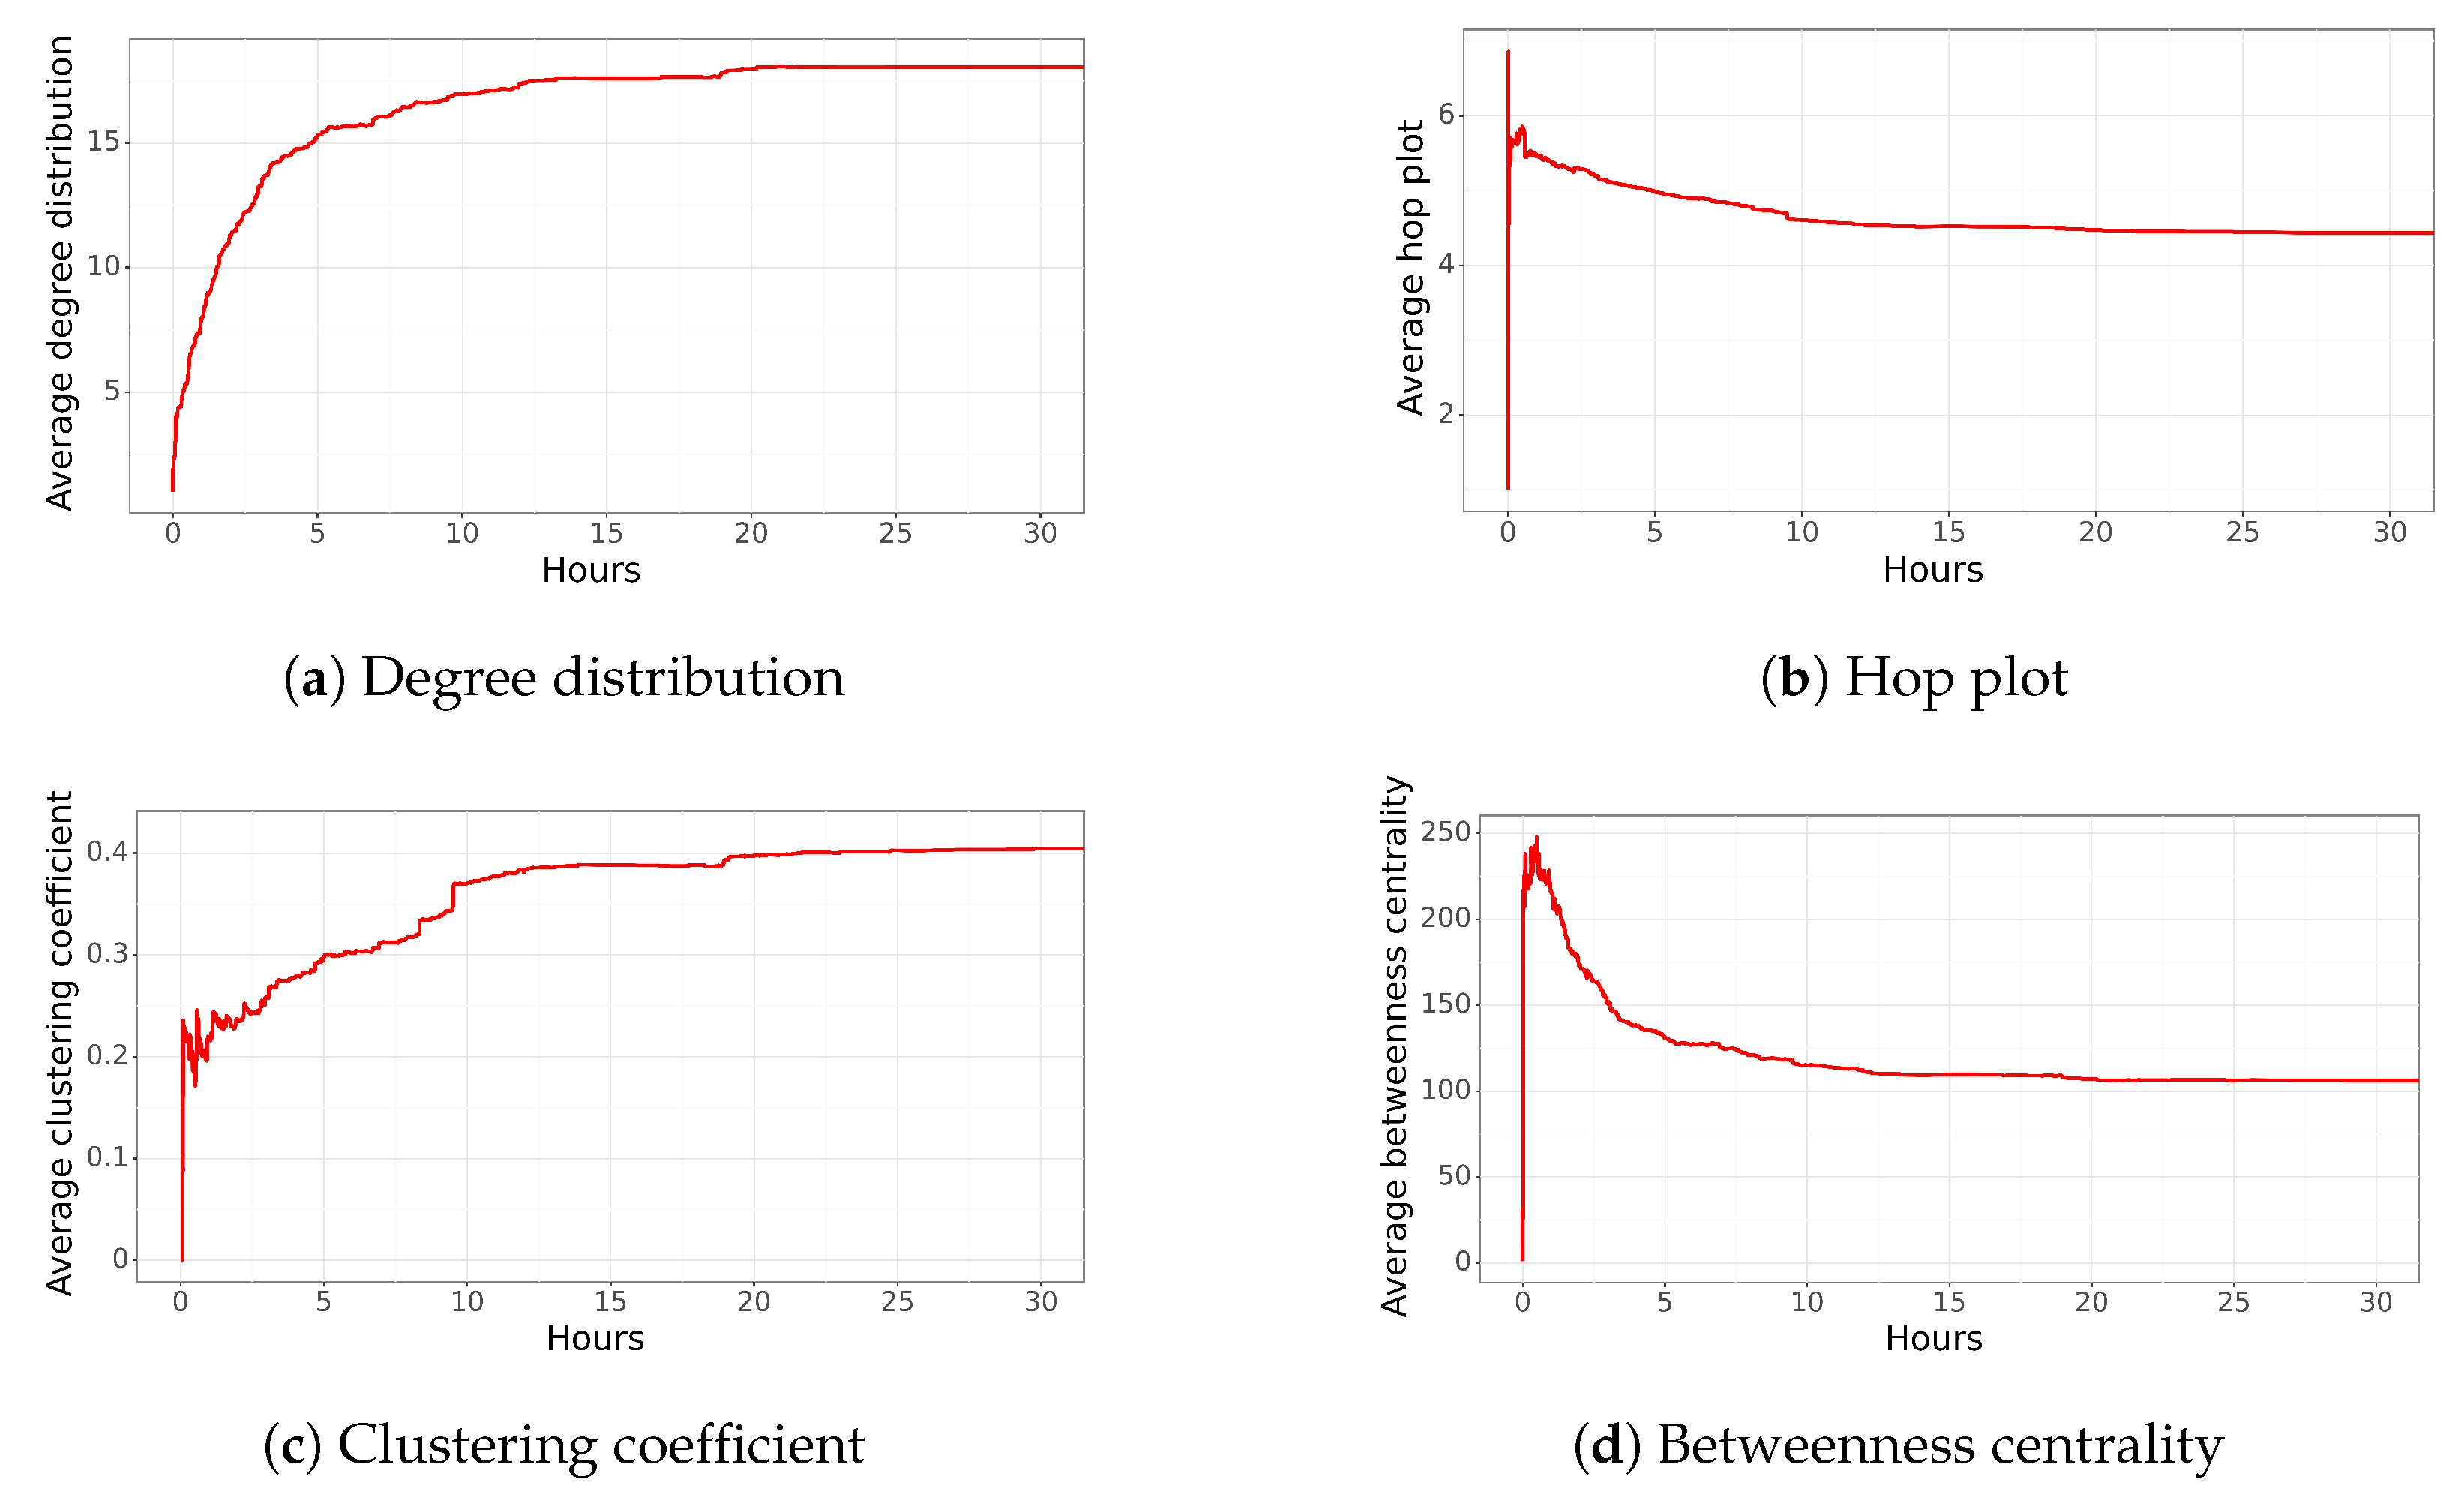
Figure 3a shows the average degree distribution of the generated network. The generated network has a very high average degree distribution compared to the previous tweet. One possible hypothesis for this significant value is that as the network grew in edges and users, the main nodes of the diffusion lost prominence. At the same time, the
funa spread among the users that were added over time. Therefore, it may be that the main users played an essential role in the beginning, disseminating information to different people in various groups, until a turning point, where nodes not only informed each other but also managed to disseminate the information within their group.
The average hop plot, shown in
Figure 3b, reached a maximum of 7 in less than an hour, and then decreased to around 4.5. The maximum hop plot was reached around the first hour, which suggests that this hour is crucial for extending the network, where different people from different groups spread the
funa. This could also be the moment when users were less connected among themselves, but it still behaves according to the property of the “Small World”. Then, the average hop plot decreases within the next 9 h until it reaches a value of 4.5, which coincides with the creation of 10,000 edges. This indicates that the network starts to be characterized by people finding out about the
funa through more than one friend, connecting groups of people within the network.
The clustering coefficient of the final network is also very high, even higher than the expected value in a social network (
Figure 3c). In the beginning, the network had almost zero cohesion, which implies that the first people to hear about the
funa did not know each other. Then, after a couple of hours, it increased to 25%, indicating a strong interconnection between the new users who retweeted the funa. Apparently, in this case, there was a tendency for users to disseminate the information when two or more people that they “knew” published the information. This behavior was the opposite of the previous tweet, where most users knew few people. Finally, after 10 h, we observed growth from 25% to 40% of the average clustering coefficient. This increase could be explained by new users who strongly connected to the existing groups. Finally, in the remaining hours, the average clustering coefficient gradually increased to approximately 41%. There was no significant change in the behavior described above during these hours. The flow of the
funa continued to increase through the people in the same group (increasing the interconnection between nodes and, therefore, the clustering coefficient); the dissemination was practically reduced.
Finally, the average betweenness centrality is shown in
Figure 3d. The value rapidly increases from 0 to 225 after 2 h, coinciding with the arrival of the main users who spread the
funa. Then, it drops to approximately 100 in the following hours. The change in behavior during these 4 h could be explained by the critical number of new users joining the network and, most importantly, the significant number of new edges created. These new edges were generated because most of the people were connected among themselves, which increases the clustering coefficient and decreases the betweenness centrality.
In summary, we can observe a highly dynamic network with multiple edges among all users. Although the characteristics of the first hour show several users disconnected from each other, in the following hours, many new edges connect several users. Therefore, several users influence the diffusion of the funa, and it is not just the main node, or a couple of nodes, disseminating the information. Finally, after 45 h, the network has several connections among nodes. People are, on average, just four hops apart, with high values of average degree distribution and clustering coefficient.
4.3. Interview Network Tendency
The next trending tweet is an excerpt from an interview with the former Chilean Minister of Defense or the Interior. The interviewee expresses support for one of the politicians involved in a corruption case (
https://www.eldesconcierto.cl/nacional/2021/08/04/video-monica-rincon-a-francisco-vidal-tras-su-defensa-a-penailillo-son-las-7-pasadas-las-12-es-la-hora-en-que-somos-tontos.html, accessed on 3 April 2023). Even with the important evidence against Rodrigo, the Internal Revenue Service did not pursue the complaint. Hence, the prosecutor’s office did not pursue the case against the politician. When the interviewer asked the minister about his support for the politician, he mentioned that Rodrigo was neither sentenced nor sued. The full tweet is as follows: “
La base de la impunidad (1–2). El ministro dice apoyar al político en su carrera senatorial xq no fue formalizado ni querellado y la entrevistadora le dice: “Sr ministro, son las 7, son pasadas las 12 la hora en que somos tontos”” (The names contained in this tweet were removed.) (The base of impunity, the minister support the politician in his senatorial career because he was neither sentenced nor sued, and the interviewer said: Mr. minister, it is 7, over 12 o’clock the time that we are a fool). This tweet was published on 3 August 2021 at 20:07. The resulting network had 1797 nodes and 42,438 relationships.
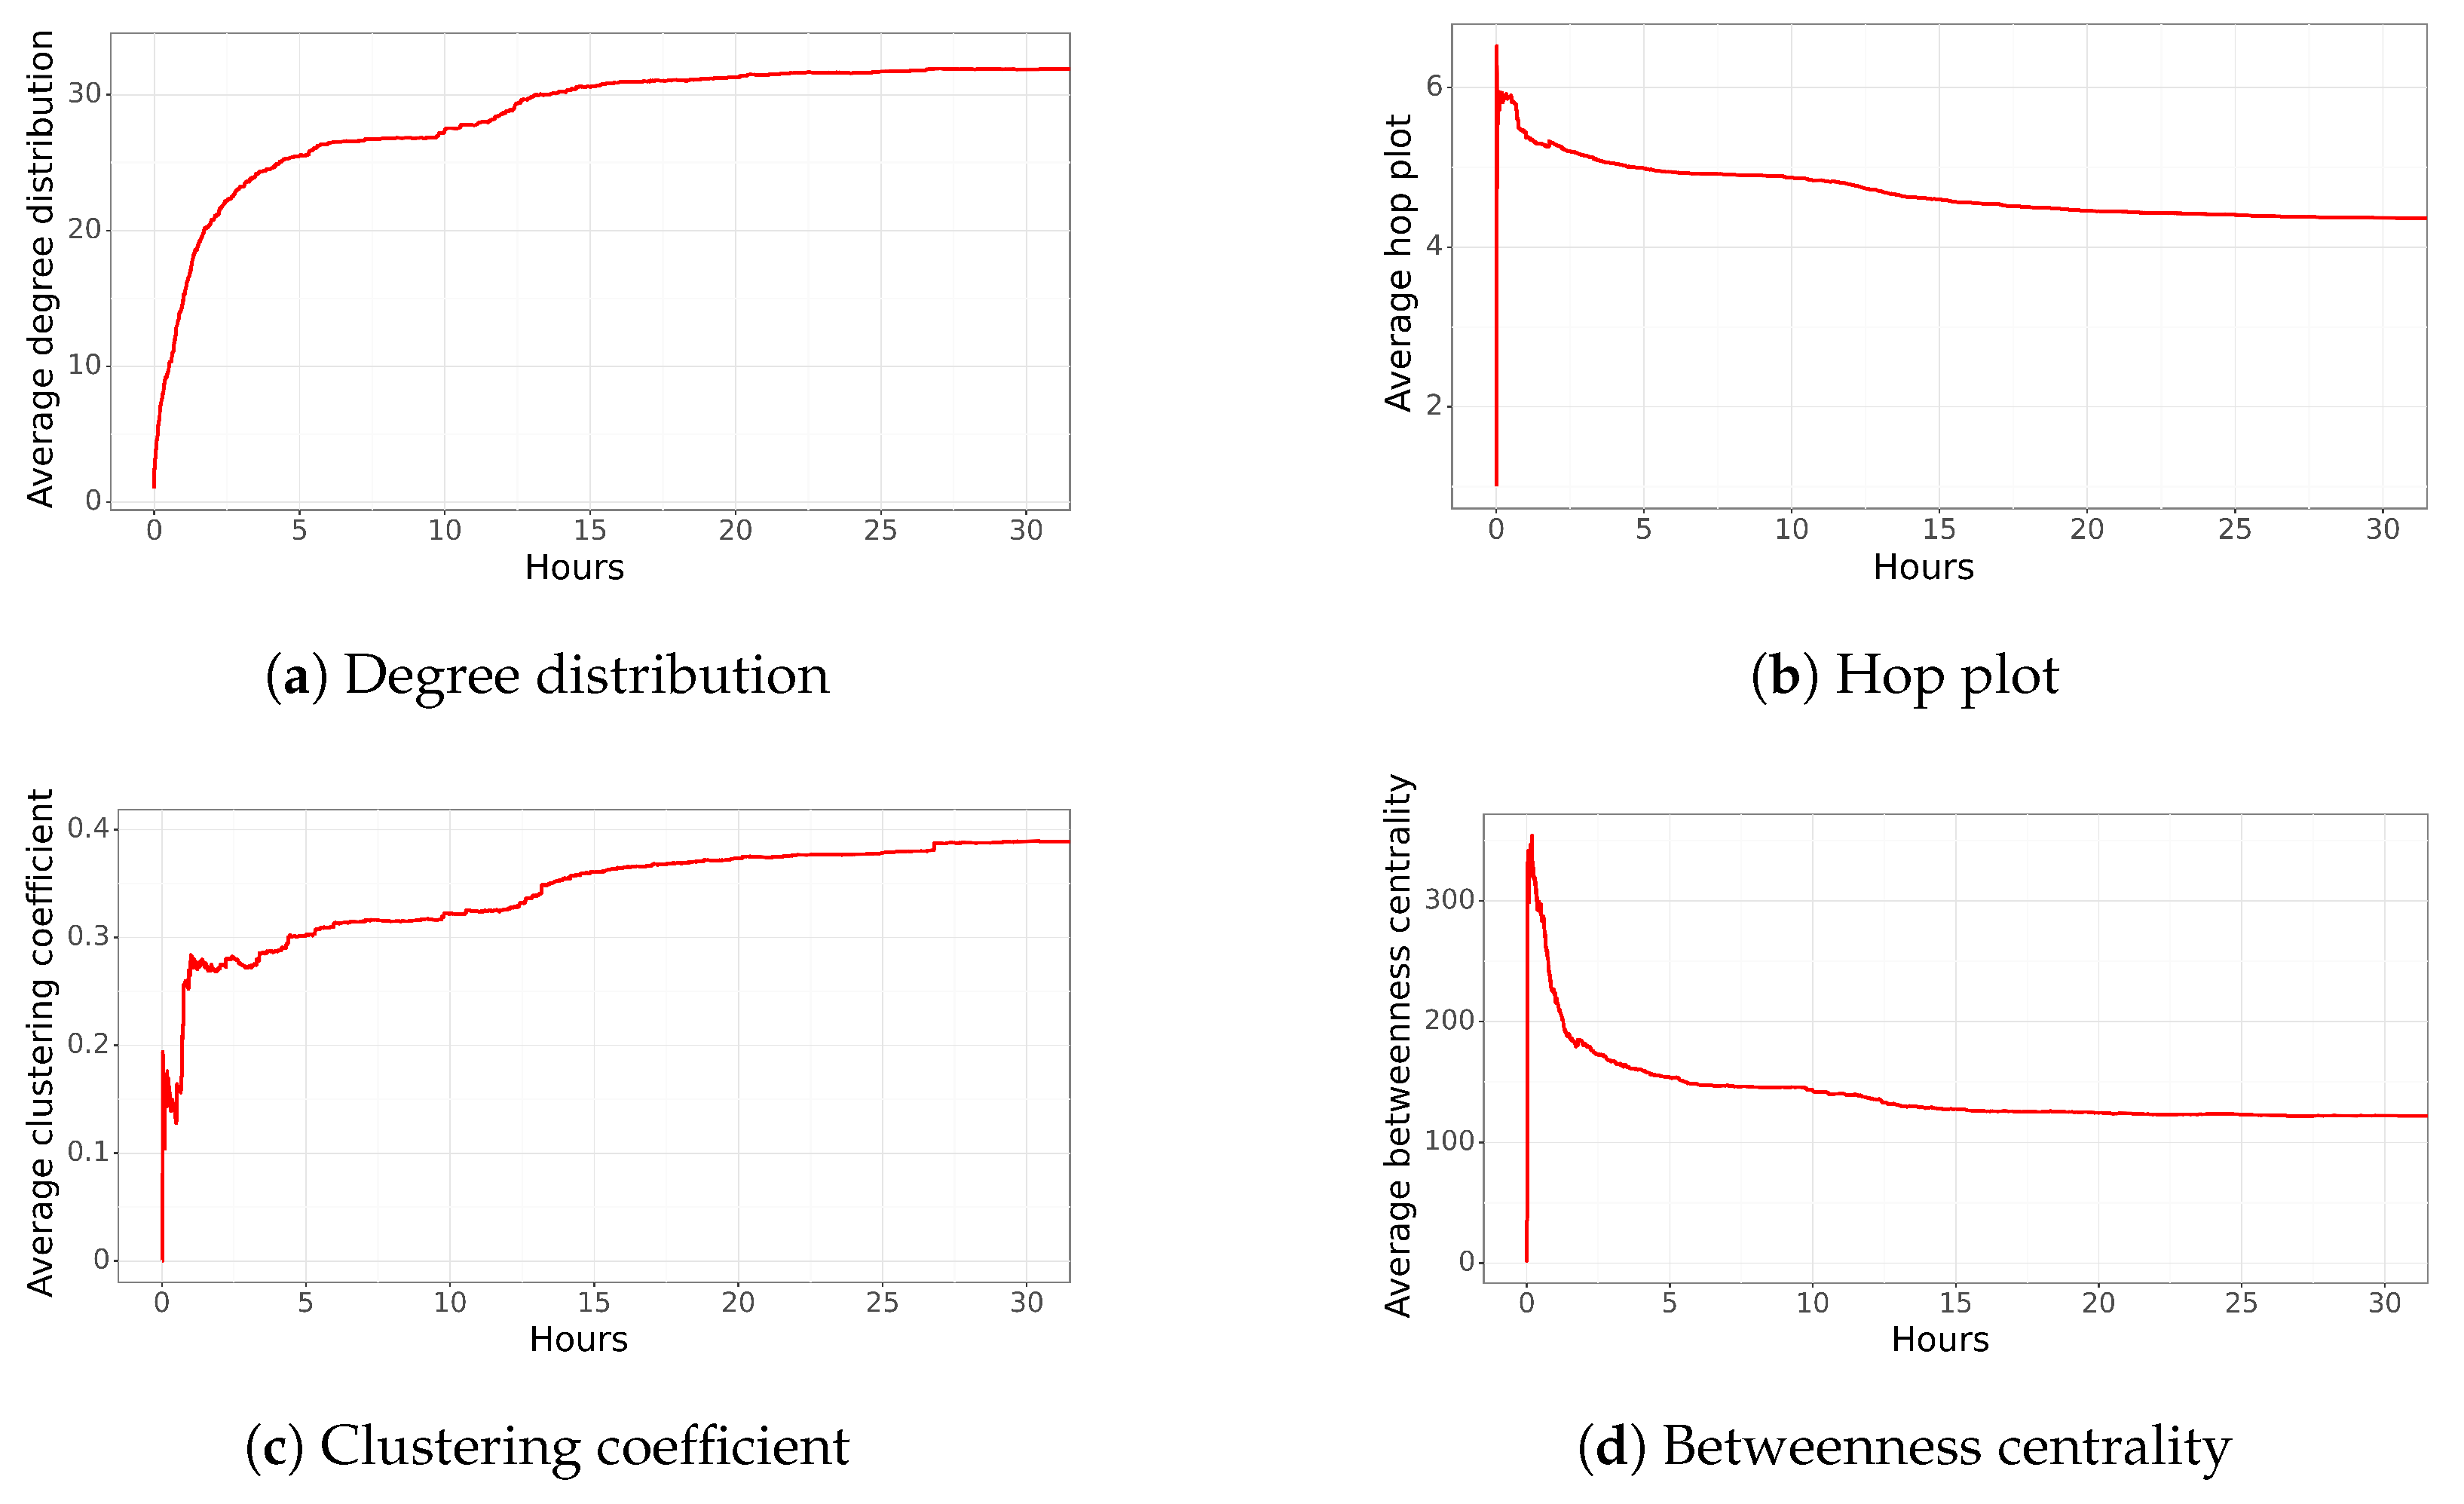
Figure 4 displays the network characteristics of the generated network over time for the first 30 h. It is noticeable that within 5 h, the average degree distribution increased to 25, indicating a large number of edges (
Figure 4a). Further analysis reveals that half of the network was already established, with a growth rate of 73.33 edges per minute. It is worth mentioning that the main node is responsible for most of the diffusion within the first hour. Then, for the next 5 h, the degree distribution remains around 26 edges. No more than 1000 edges were added to the network during this time. Finally, in the subsequent 2 h, the degree distribution rises to an average of 30 connections per user.
Regarding the hop plot (
Figure 4b), it reaches approximately 6.0 during the first hour (remembering that the diffusion was mainly made by the main node). Then, as new nodes began the diffusion process, the network became more cohesive, decreasing the hop plot to 4.6. Similar to the previous trend, during the first hours, this tweet follows the "Small World" property; however, the new edges make the network more cohesive.
The average clustering coefficient also supports the behavior previously described (
Figure 4c). In this case, the clustering coefficient increases to 0.20 in a few minutes, then decreases to 0.15, and increases again to a value close to 0.30 within the first hour. This value continues to increase, reaching a value close to 0.40. This means that once other nodes start to disseminate the information, new connections were made among multiple users.
The high average betweenness centrality in the first hours (
Figure 4d) indicates that all paths among users must pass through a few users. At this moment, the betweenness centrality reaches its highest point, close to 400. Then, once new nodes are added, it generates connections among multiple users, reducing the value of this measure to 150. This implies that multiple users make the diffusion.
In summary, we observe a highly dynamic network during the first few minutes, with multiple changes in its characteristics. Then, after an hour, most network characteristics start to become stabilized. Therefore, in the beginning, multiple users spread the information; but later, most new users are connecting the nodes among them. This produces a network with low average values of betweenness centrality and hop plot, but with a relatively high clustering coefficient.
4.4. Funa Network to Former Military
Edwin Dimter Bianchi is a former military officer convicted of human rights violations. In 2018, a former military officer was convicted of the murder and kidnapping of a Chilean singer–songwriter and a communist party militant; both crimes were committed in 1973. The sentence was for over 15 years of imprisonment (
https://www.t13.cl/noticia/nacional/victor-jara-muerte-47-investigacion-judicial-16-09-20, accessed on 3 April 2023). However, the serving of his sentence was suspended, as the former military officer resorted to different "instances" allowed by the state. The following tweet was published on 3 November 2021:
“Si no hay justicia, hay funa” (Without justice, there is funa) next to an image stating, “
Militar, asesino del músico” (The names contained in this tweet were removed). (Former military the killer of singer), and his personal information. The final network generated by this tweet had more than 594 users and 7779 relationships.
Figure 5 shows the network characteristics for the first 33 h (no important changes were observed after this time). The
Figure 5a shows that during the first hour, there was a very low degree distribution (around 1.0). This implies that one or several influential users spread the information. Then, at the end of the first hour, it increased to an average of four relationships. This number continued to increase, reaching 16 average connections after 10 h. The network becomes increasingly cohesive over time, which means that among the people who spread the information, each user is expected to be connected to a larger number of users. Finally, new users are expected to participate collaboratively by sharing information or obtaining information from different sources.
The average hop plot distribution (
Figure 5b) reaches a value of 7 in less than an hour, indicating that there is a long distance among users. However, it starts to decrease and obtains a value of 4.9 at 10 h. Then, the network starts to create important connections among users. This behavior is also observed through the average clustering coefficient (
Figure 5c) and average betweenness centrality (
Figure 5d).
The clustering coefficient of the network starts with a very low value close to 0.05 during the first 30 min. This type of network structure implies that there are almost no triangles, meaning that most of the users are not connected to each other. After 30 min, there is an important change in this characteristic, jumping to almost 0.15, and it starts to increase. This can be explained by the fact that new nodes are connecting to the existing nodes in the network. Even though we can observe erratic behavior, the clustering coefficient stabilizes after 10 h, reaching a value close to 0.30.
The betweenness centrality corroborates the previous description, reaching the highest value during the first few minutes, indicating that we are dealing with a sparse network where most nodes are not connected to each other. A few nodes are important (the peak of betweenness centrality) and vital to maintaining the network structure. However, after a couple of hours, new nodes start to disseminate the information, connecting the nodes among them, and generating a cohesive network (decreasing the betweenness centrality). This implies that users started to observe the information from multiple sources, not a single account.
In summary, the network structure is sparse during the first minutes, and it becomes cohesive after a couple of hours. This means that after a couple of hours, multiple users with a high influence start to spread the information. So, after 33 h, the network has several connections among nodes. People are, on average, just 5 hops apart, with an average degree distribution of 16 and a clustering coefficient close to 0.30.
4.5. Trending Tweet Network Politician
In September 2021, the decriminalization of abortion of up to 14 weeks was approved (
https://cnnespanol.cnn.com/2021/09/28/camara-de-diputados-de-chile-debate-despenalizacion-del-aborto-sin-causales-hasta-las-14-semanas-de-gestacion/, accessed on 3 April 2023), which was not supported by a politician who ran for president at the time. He tweeted the following:
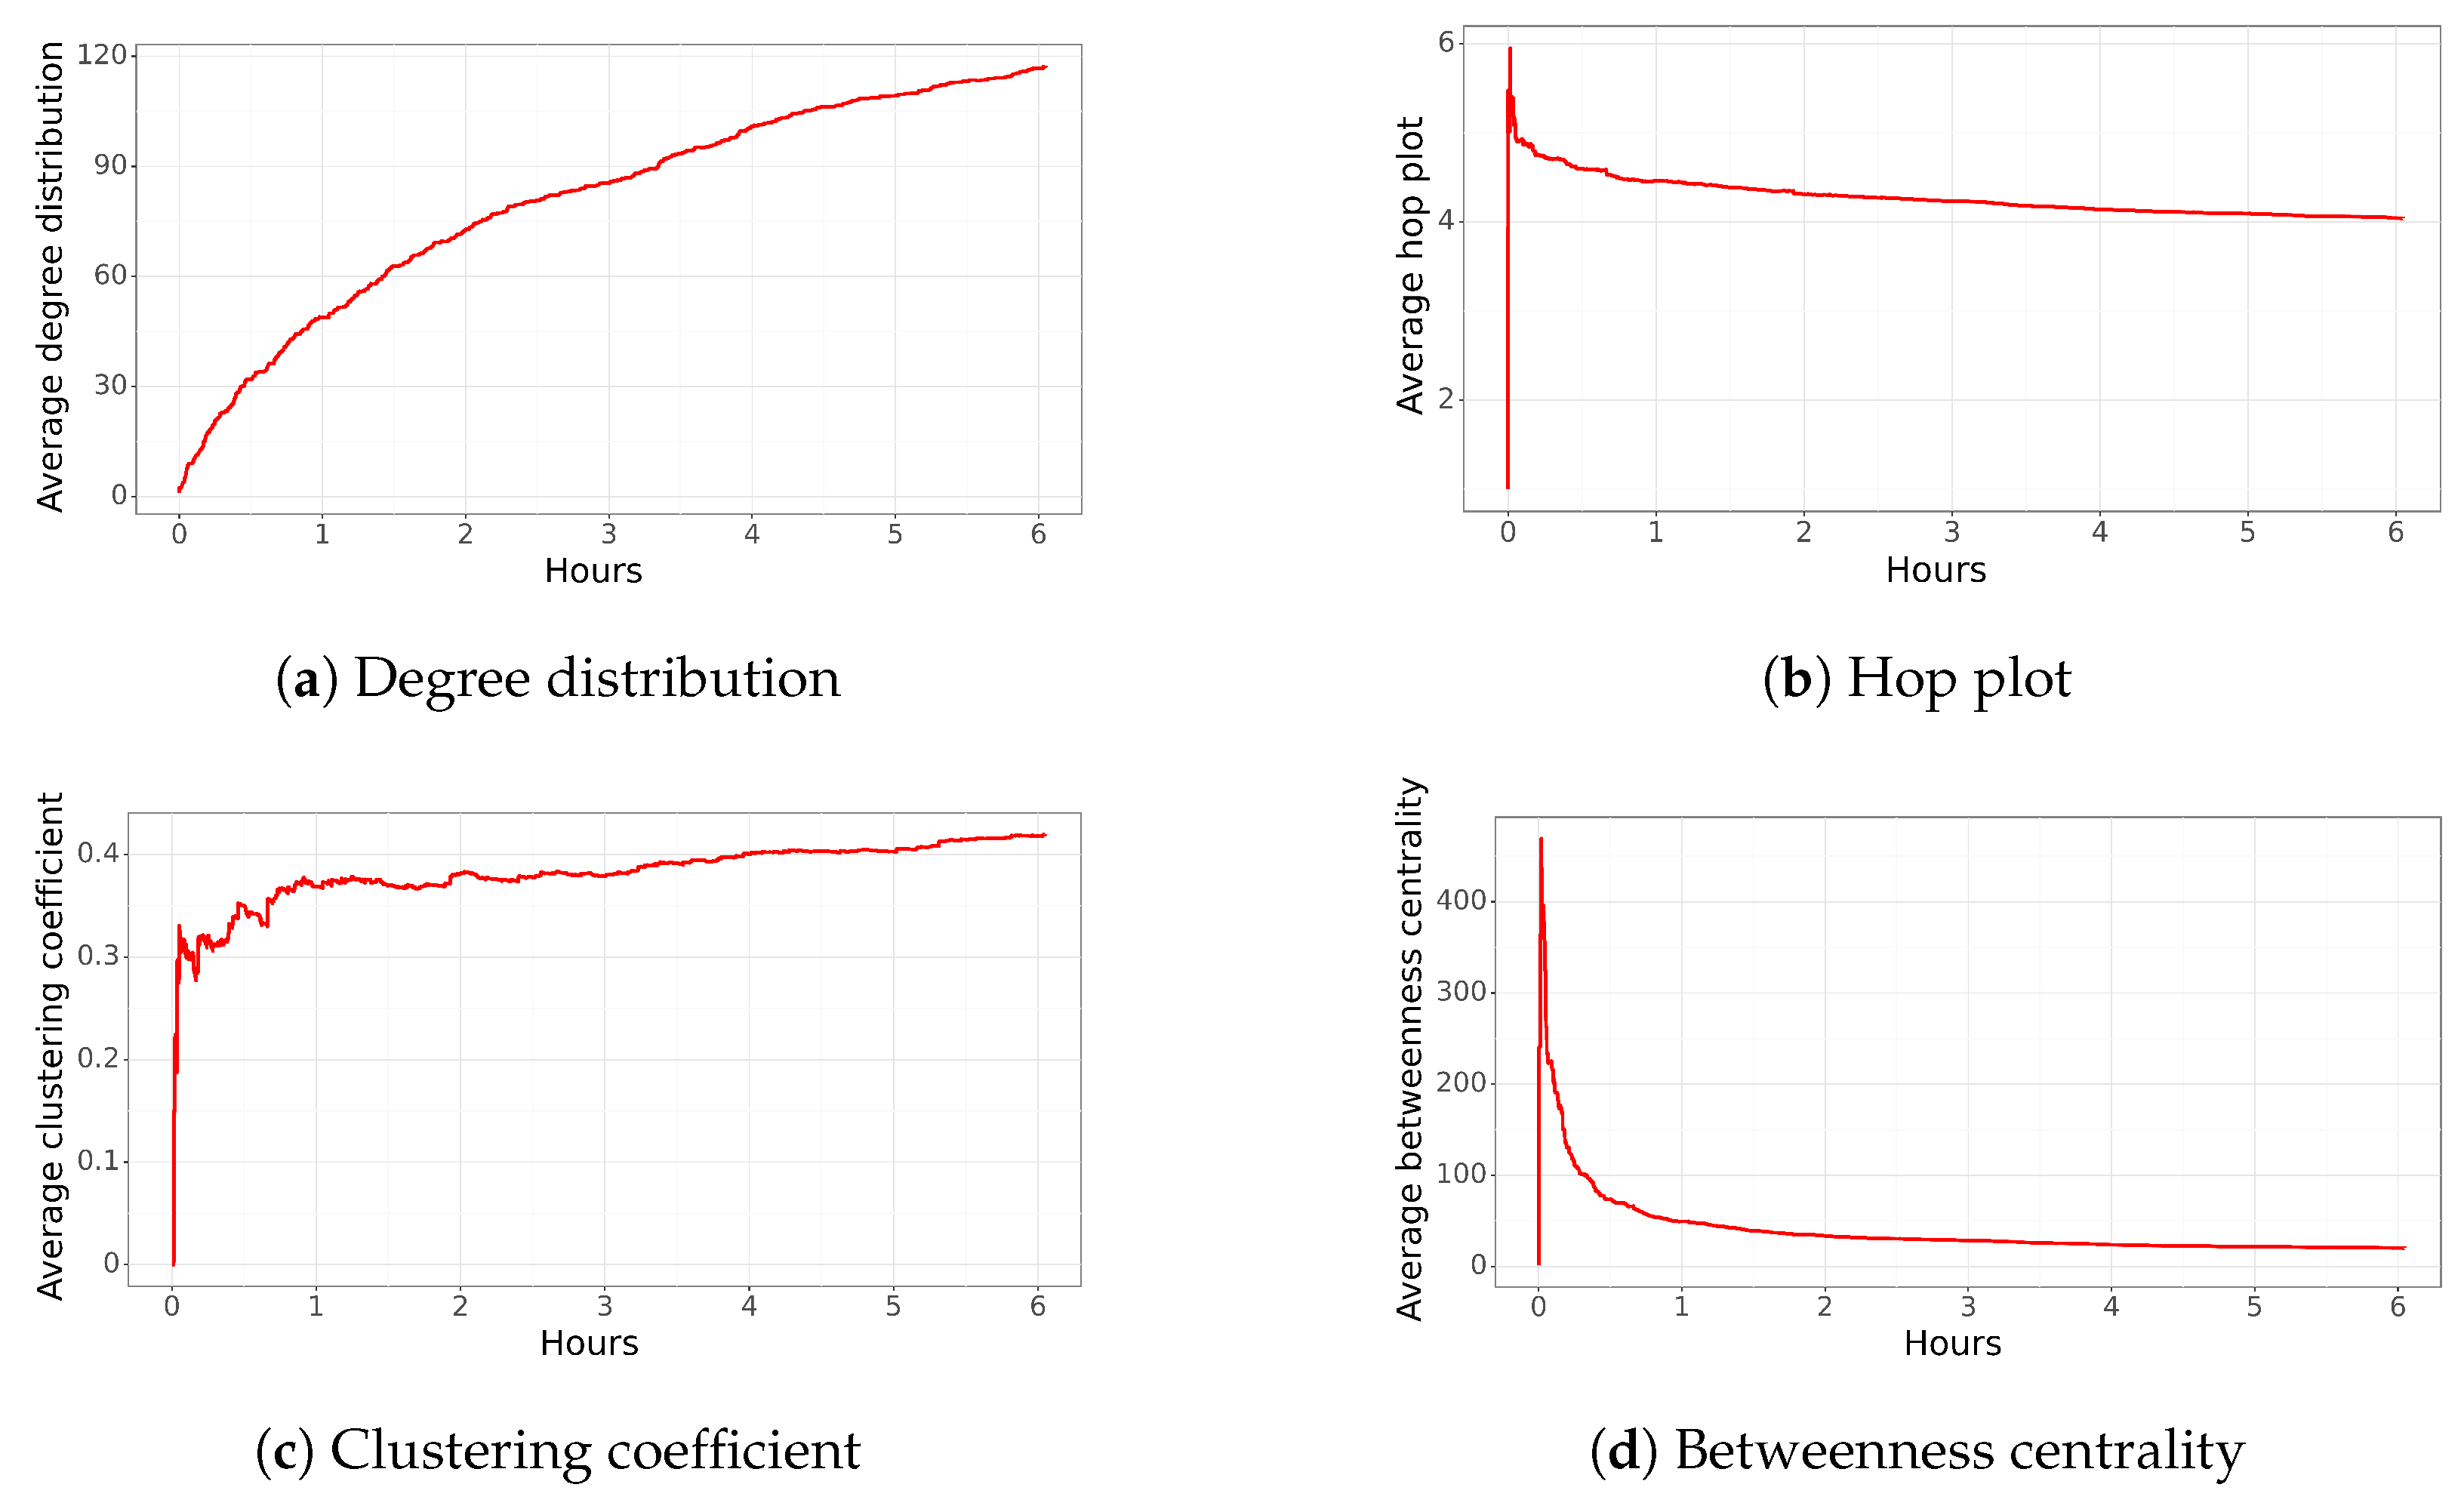
“Han pasado 24 horas y el presidente aún no dice nada por la aprobación de la Ley de Aborto en Chile.”(The names contained in this tweet were removed.) (There have been 24 h, and the president does not say anything about the approval of abortion). This implies that the current president should address the issue as they are from the same political coalition. This tweet was published on 29 September 2021 and was disseminated by 1363 users. Due to the complexity of the analysis, the study was stopped after six hours with 1173 users and 88,310 edges 88,310 edges.
Figure 6c shows the average degree distribution of the network. Within the first half hour, an average of 20 relationships per user is observed, and the network has more than 10,000 edges. It is noteworthy that compared to the other analyzed networks, a high value of “free distribution” is reached much faster. This could imply that influential users have significantly impacted the dissemination, and new users learn about it from the main users or new influencers. Alternatively, the network may coalesce so that most people can spread the information. The network continues to grow in relationships, reaching an average of 40 connections per user after one hour and 120 after six hours. The high value reached at the end stands out compared to the other networks analyzed. A value of 120 means that on average, each node is connected to 120 other nodes, implying that the information is received or propagated to 120 users. This value was not reached in the previous networks.
Compared to other tweets, the average hop plot stabilizes after a couple of minutes. As can be observed in
Figure 6b, the highest hop plot reaches a value close to 6, almost as soon as it is created, and it decreases to a value of 5 in less than 5 min. This behavior, and considering the high number of nodes, means that most of the nodes are connected among them. The hop plot continues to decrease to a value of 4.0 after six hours.
The clustering coefficient increases to 0.3 in less than 5 min (
Figure 6c). Considering the high number of edges and nodes, it means that the network has high cohesion, and most of the users are connected among them. Surprisingly, the value continues to increase, meaning that new nodes are also connected to most of the nodes of the network.
Regarding betweenness centrality, it is notable the low value of this characteristic for this network. As can be observed in
Figure 6d, the betweenness centrality reaches a value close to 450, and in approximately 10 min, it decreases to less than 100, reaching a value of 20 after a couple of hours. A value close to 20 means that almost all users are connected. That is, no more initial influential nodes continue to propagate information. Instead, all nodes now serve to propagate information, which has not been observed in the previous networks.
In summary, the network structure stabilizes after a couple of minutes, indicating that most of the nodes and connections are created almost instantly after the tweet was posted. It is noteworthy that the final network characteristics differ from previous tweets, specifically, the network has over 88,000 edges with just 1173 nodes, and several nodes are connected among them, resulting in an average clustering coefficient close to 0.4, a low average betweenness centrality, and a low average hop plot compared to the property of the “Small World”.
4.6. Tweet Network Funa to Front Line
The final analysis corresponds to a tweet against protesters who injured civilians and police during a march. At the beginning of October 2021, in Santiago, Chile, people used fireworks to attack the police, injuring several of them and causing the death of a protester (
https://www.emol.com/noticias/Nacional/2021/10/10/1035016/manifestaciones-plaza-baquedano-domingo.html, accessed on 3 April 2023). The tweet mentions the front line (the protesters at the front of the group), noting: “
El lanzamiento de fuegos artificiales hacia los carabineros era constante por parte de los violentistas. No era de extrañar que tarde o temprano ocurriría una tragedia. #PrimeralineaAsesina” (The fireworks were constantly thrown by violentists at the police. It was not weird that sooner or later a tragedy would happen). The network had 1635 users who spread the
funa, but due to the lengthy analysis of the characteristics of the
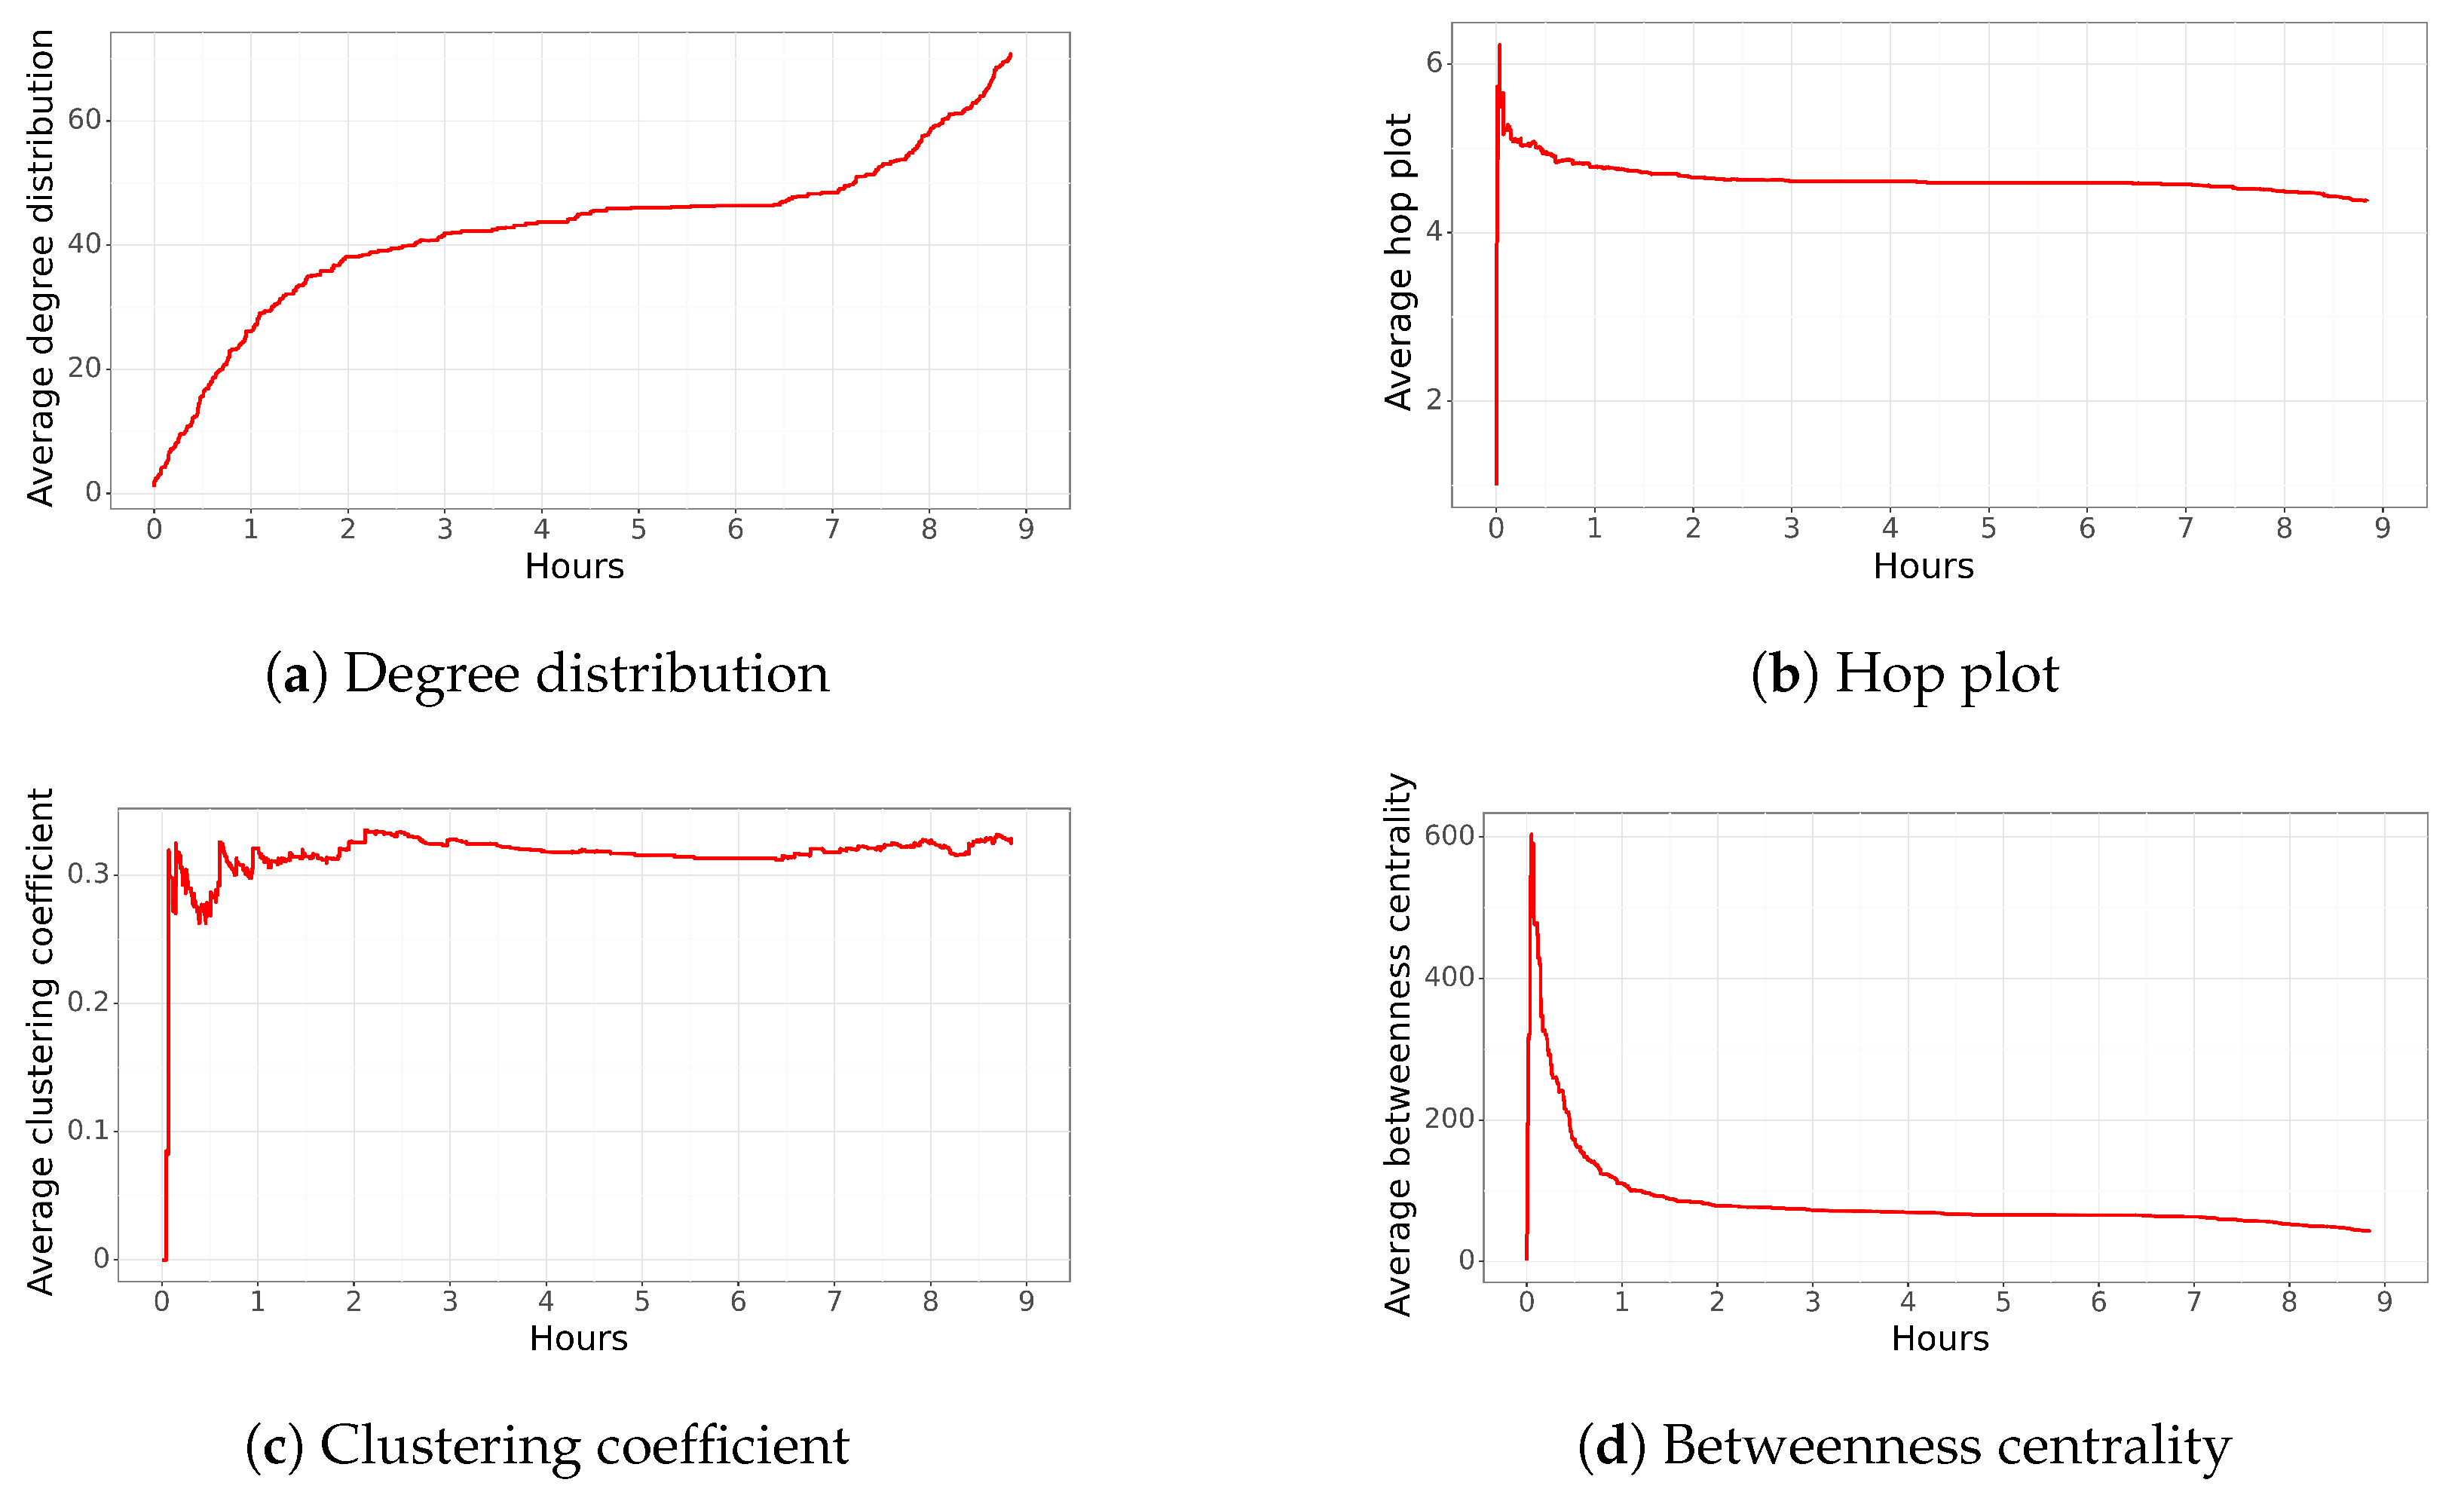
funa, 1394 people were analyzed. It is worth mentioning that around 55,000 relationships were formed.
Figure 7 shows the network characteristics over time. The average degree distribution of the network increased over time, reaching a value close to 40 (
Figure 7a). Then, it plateaued and started to increase again, reaching up to 70 after 9 h. Similar to the previous trends observed in social networks, it is rare to have a very strongly connected network where each user is related to, on average, 70 other people.
In the case of the hop plot, it reached its highest value after a couple of minutes, and then it decreased to a value close to 5.0 in less than an hour (
Figure 7b). Similar to the previous trend, the sudden change in the hop plot distribution calls our attention.
Regarding the clustering coefficient, it increased to 0.3 after a couple of minutes and stayed close to that value during the next hours (
Figure 7c). This behavior shows that the network, during the first few minutes, is created by several nodes that are very connected to each other, forming a cohesive network. However, as new nodes arrive, some of them are connected to most of the nodes, while other nodes are connected to a few nodes, leading to erratic changes in this network characteristic.
In the case of the betweenness centrality (
Figure 7d), it was at its highest value after a couple of minutes. Then, it decreased to less than 100 in approximately one hour. This behavior could be explained by the presence of a few highly important nodes at the beginning, most likely the main node. However, their importance is reduced after a couple of minutes when most of the nodes are connected among themselves, generating a highly cohesive network.
In summary, we observe a similar behavior to the previous network. Most of the network characteristics reach their peak in a few minutes. This implies that the dissemination of the information is realized in less than an hour, generating most of the network structure. However, it is uncommon to have such a strongly connected network where each user is related to, on average, 70 other people (degree distribution). The average hop plot and betweenness centrality are low, and the clustering coefficient obtains a value close to 0.3. All these characteristics indicate a very cohesive network where most users are connected. This could indicate the existence of several influential users spreading the funa; however, it is still unusual that almost all users are connected to each other.
5. Discussion
Six dissemination networks were analyzed through Twitter. After analyzing the respective networks and their average characteristics over time (degree distribution, hop plot, clustering coefficient, and betweenness centrality), we can group them into three categories: trending topic (the hairdresser of “La Roja”), funas (“funa” to former captain of the police, interview network tendency, and “funa” to former military), and anomalous (politician network and funa to front line). We further discuss these results by comparing their network characteristics in a single plot and comparing their final networks.
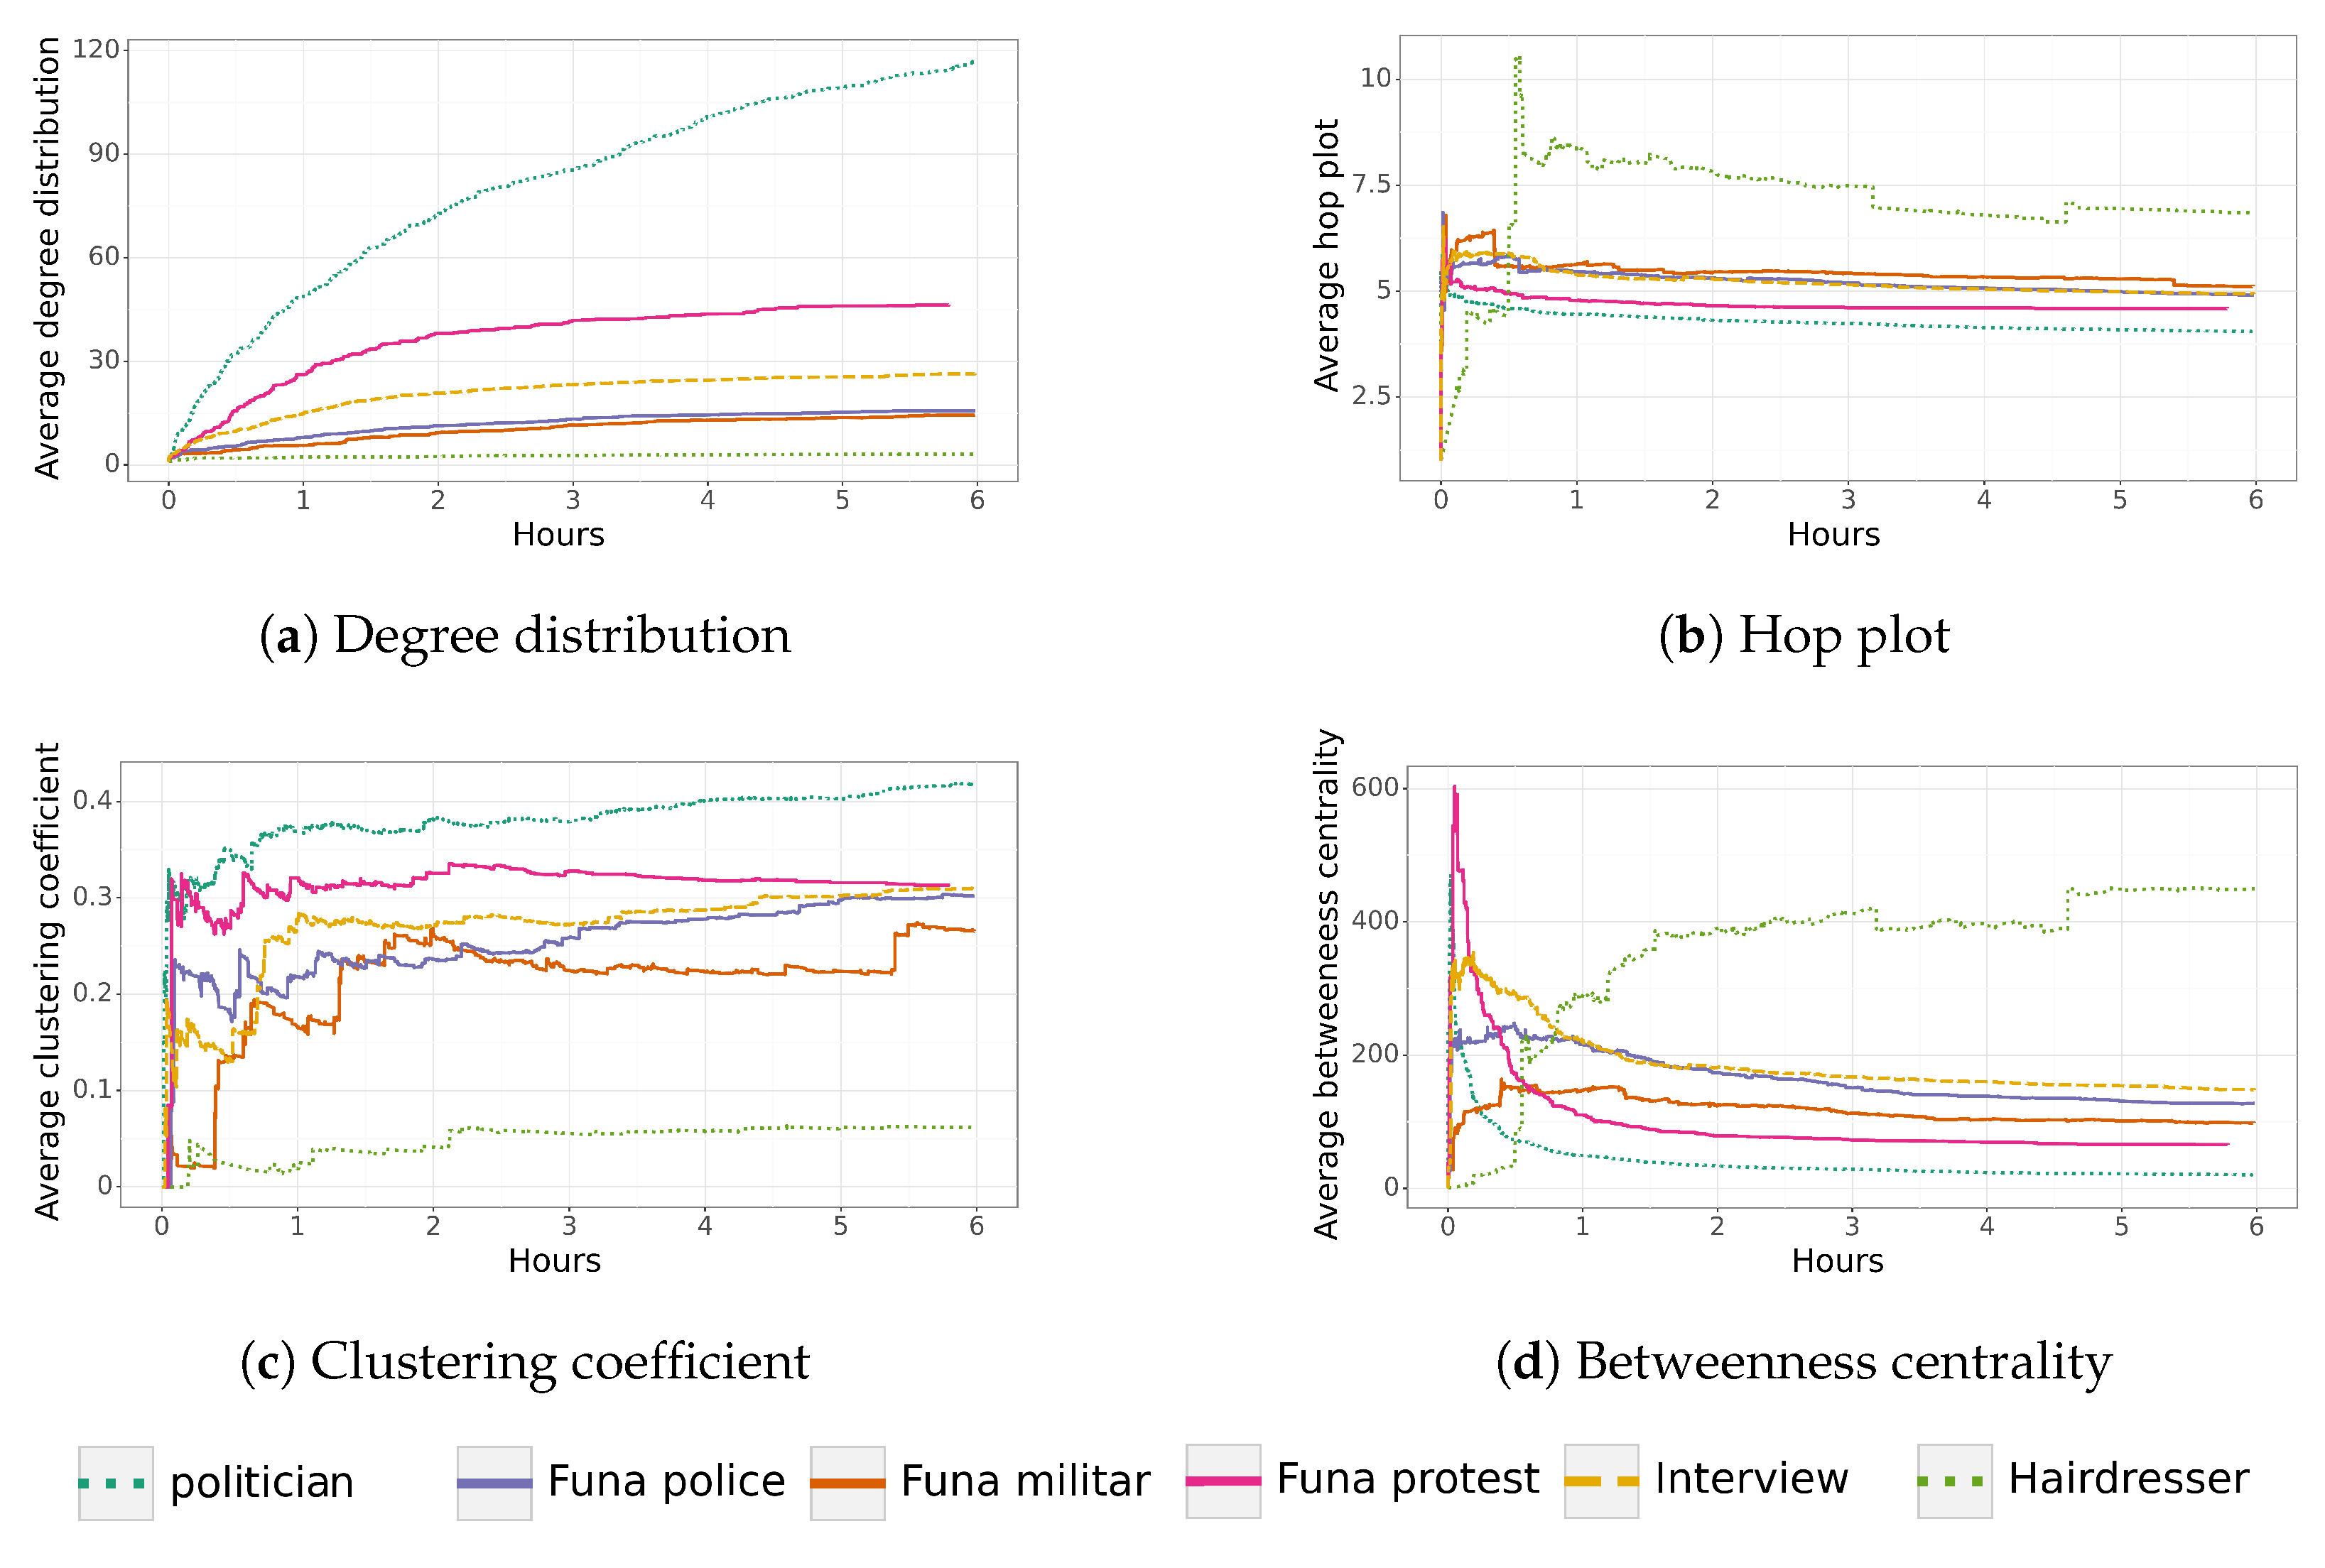
Figure 8 shows the network characteristics of all networks for their first six hours. We chose this period of time to compare all networks. Note that most of the network structure does not change after this period of time. This means that most retweets are made a couple of hours after the original tweet, and new nodes arriving several hours later do not have a significant impact on the network structure or the spread of information (given that only a few nodes are added).
As can be observed, the three tweets grouped as “funa” share similar characteristics. First, their average degree distribution increases slightly over time. Second, after reaching the properties of a small-world network, their hop plot decreases to a value close to 5.0. Third, the clustering coefficient tends to a value close to 0.3, starting with erratic behavior. This behavior can be explained by the addition of nodes that retweet news that is being shared by several people (increasing the clustering coefficient) and other people that are just connected to a few nodes (decreasing the clustering coefficient). Fourth, their betweenness centrality reaches a high point and decreases slowly over time. In contrast, the network characteristics of the hairdresser differ considerably from the other networks (lower degree distribution, higher hop plot, lower clustering coefficient, and higher betweenness centrality).
In the case of the last two networks, politician and funa protest, they were labeled as anomalous. After analyzing their characteristics, both networks were found to have an important number of nodes connected in just a few minutes, generating a higher degree of distribution and smaller betweenness centrality. Surprisingly, the betweenness centrality of these networks decreases considerably after just a few minutes, which is a completely different behavior compared to the other four networks. Moreover, their average hop plot distribution is smaller compared to the rest of the networks and has a higher average clustering coefficient.
The characterization of “funas” shows that differences become noticeable from hours 2–3 (
Figure 8), which are maintained or are exacerbated by hour 6. This characterization allows identifying “
funas” on Twitter faster and without necessarily having the word “
funa” in the Tweet. Since “
funas” are usually related to injustices, early detection could accelerate the reaction time to these injustices. For example, the information could reach the people or organizations involved more quickly, remedying the situation that originated the “
funa”. On the other hand, the “
funa” could also be related to fake news, so identifying it early would help disprove it.
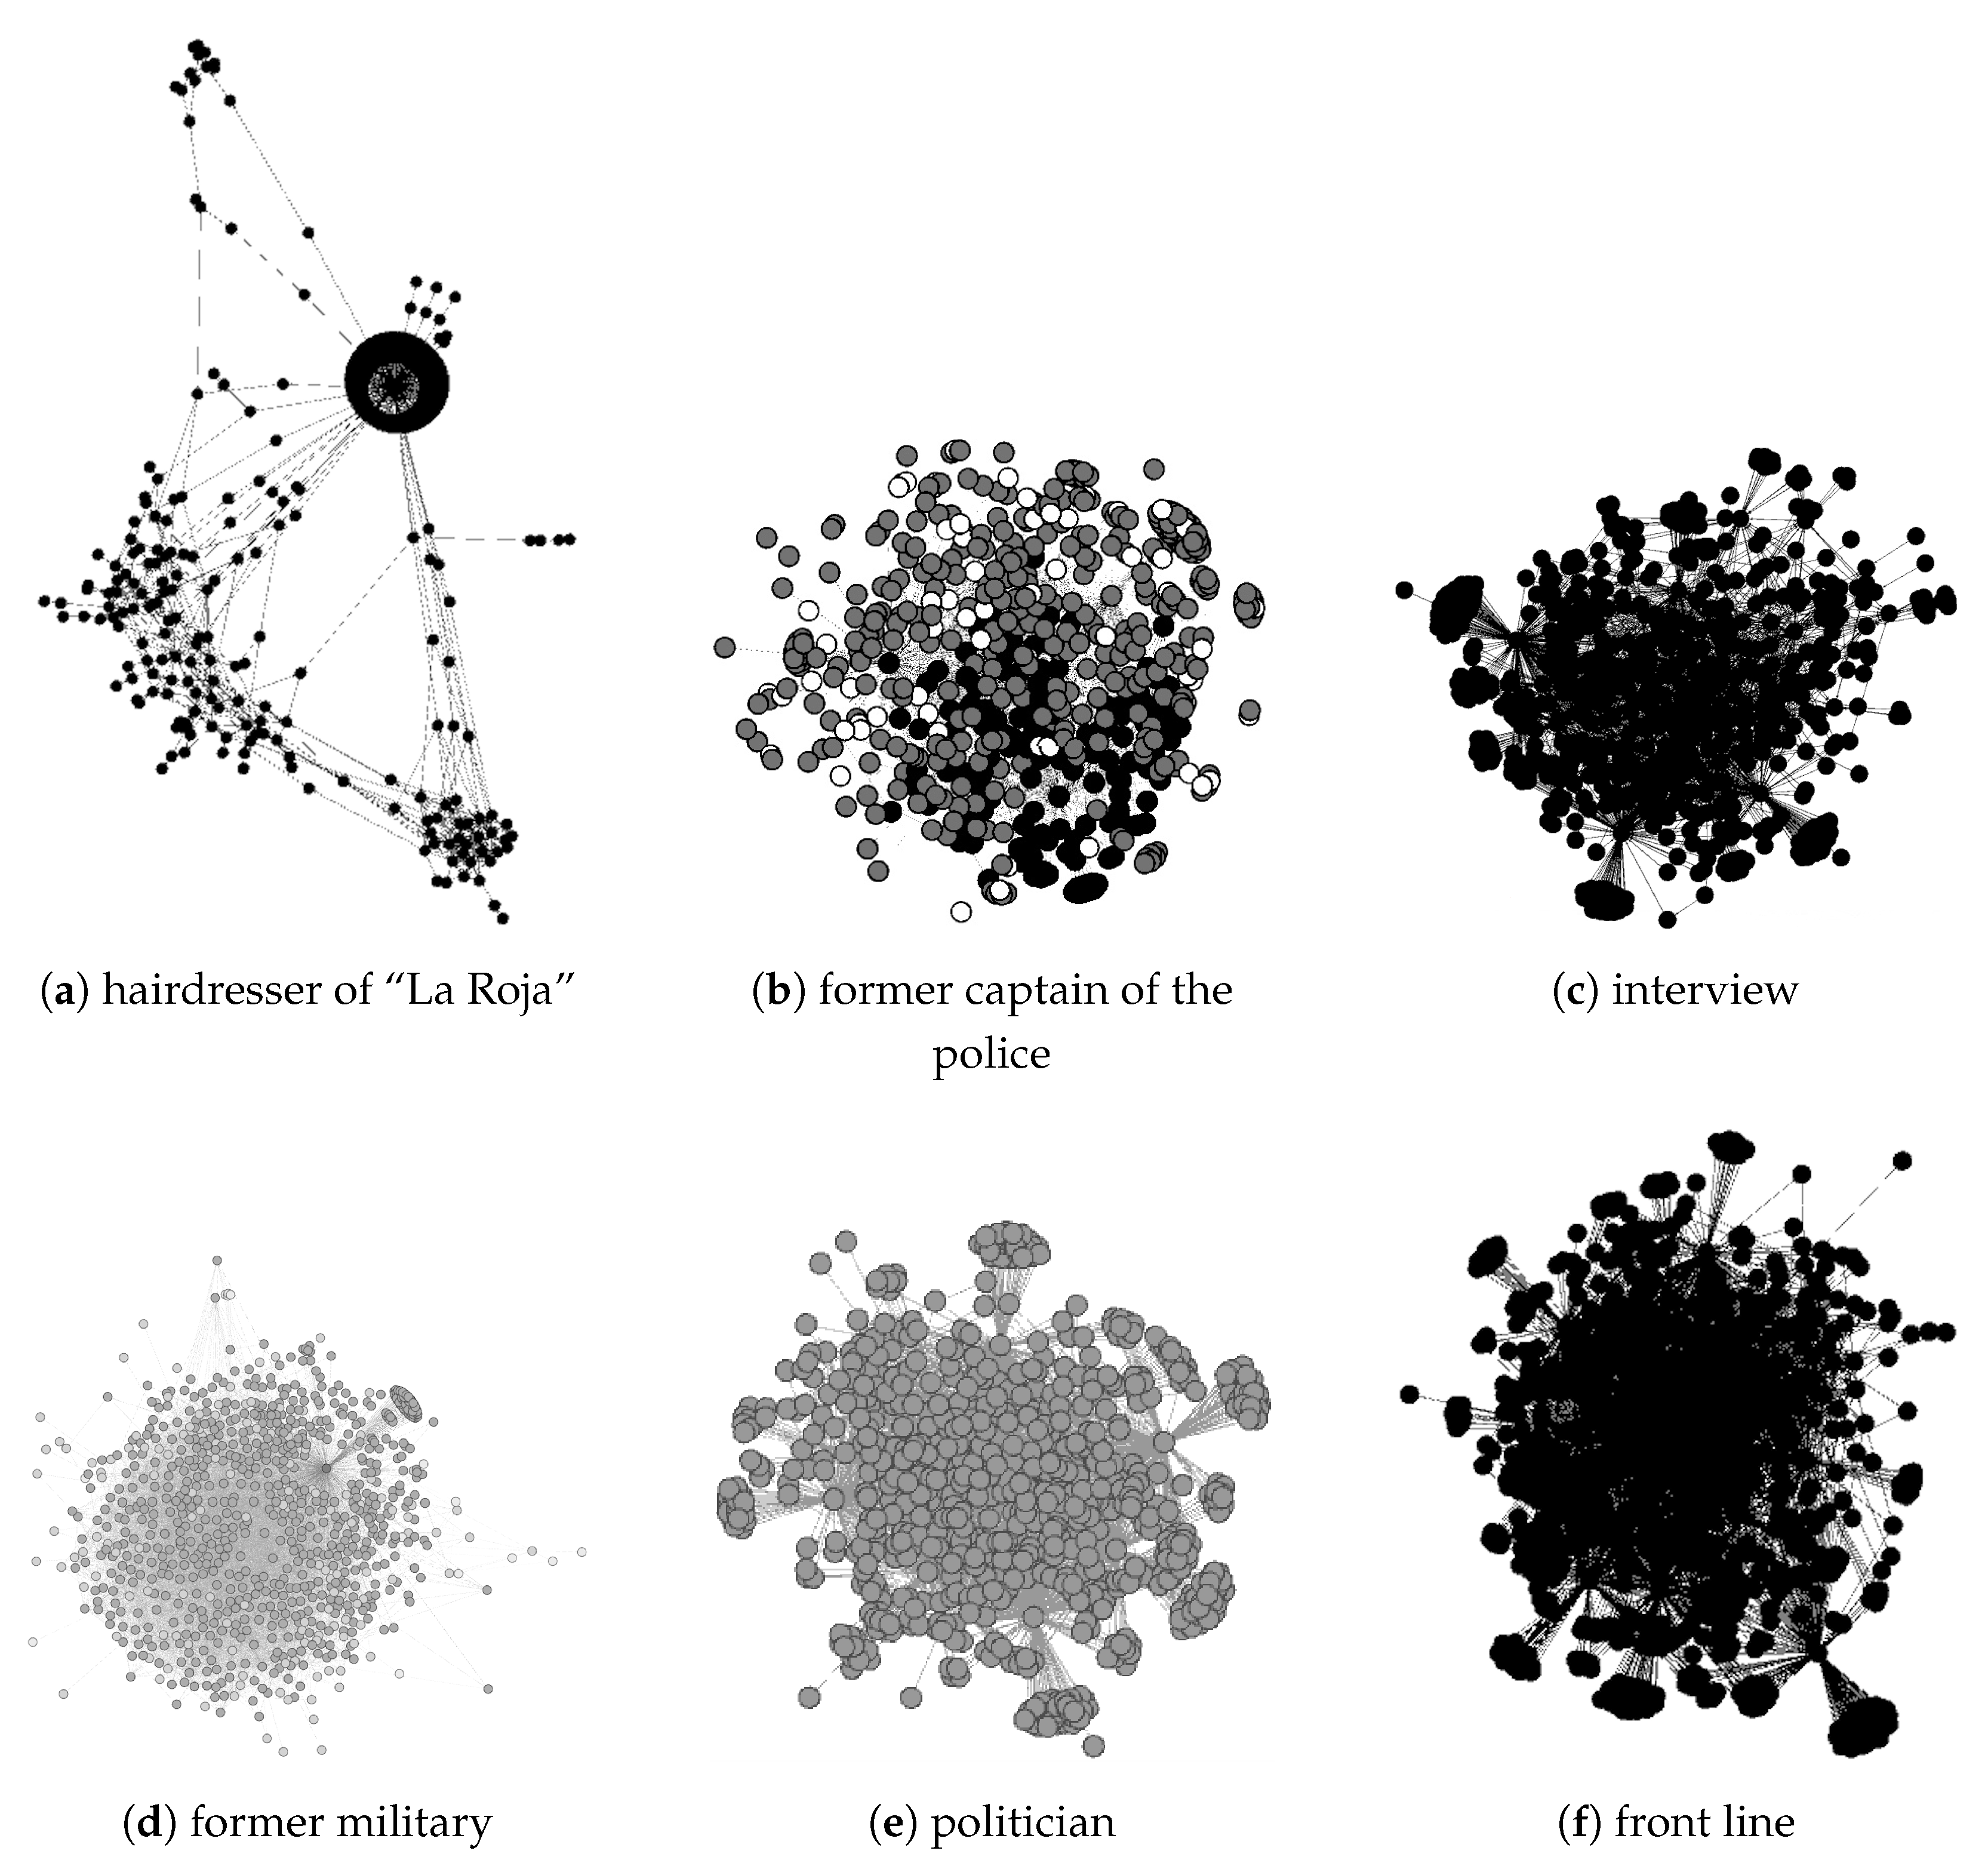
Finally,
Figure 9 shows the final six networks generated for the respective tweets. As we can observe, the hairdresser has multiple groups that spread the information separately (top-left plot). The “
funa” group, corresponding to the top-middle, top-right, and bottom-left plots, shows multiple interconnected node groups. Finally, the anomalous networks (bottom-middle and bottom-right plots) show many nodes connected among themselves and some small groups connected in the periphery of the network.
6. Conclusions
In this paper, we analyzed the characteristics of four networks over time for six tweets, three of which were related to funas and three to trending topics. The aim was to observe the spreading behavior of the funas and compare them to other trending topics. For this purpose, we applied a specific methodology, including data extraction, network structure generation, and network characteristics analysis.
The analysis shows that the majority of the network structure is created within the first few hours, indicating that the information spreads rapidly in the initial hours. Moreover, specific patterns were observed for the tweets related to “funa”. These tweets had multiple users generating cohesive groups of nodes interconnected through some nodes. Finally, two anomalous networks were characterized, where the network structure was generated within the first few minutes instead of hours. In these networks, most nodes were connected, creating a highly cohesive network. Further research is needed to determine if this behavior could be linked to another type of network, such as bots.
Finally, given the observed patterns of the tweets, we believe that a classification model for the type of tweets could be created. Currently, most of this classification is based on the text of the tweets. However, analyzing the network structure over time could complement this type of analysis and improve the classification of these types of tweets. This could help to reduce response times to injustices or even help in taking action against fake news.


