

Reinforcement Learning-Enabled Electric Vehicle Load Forecasting for Grid Energy Management

Abstract
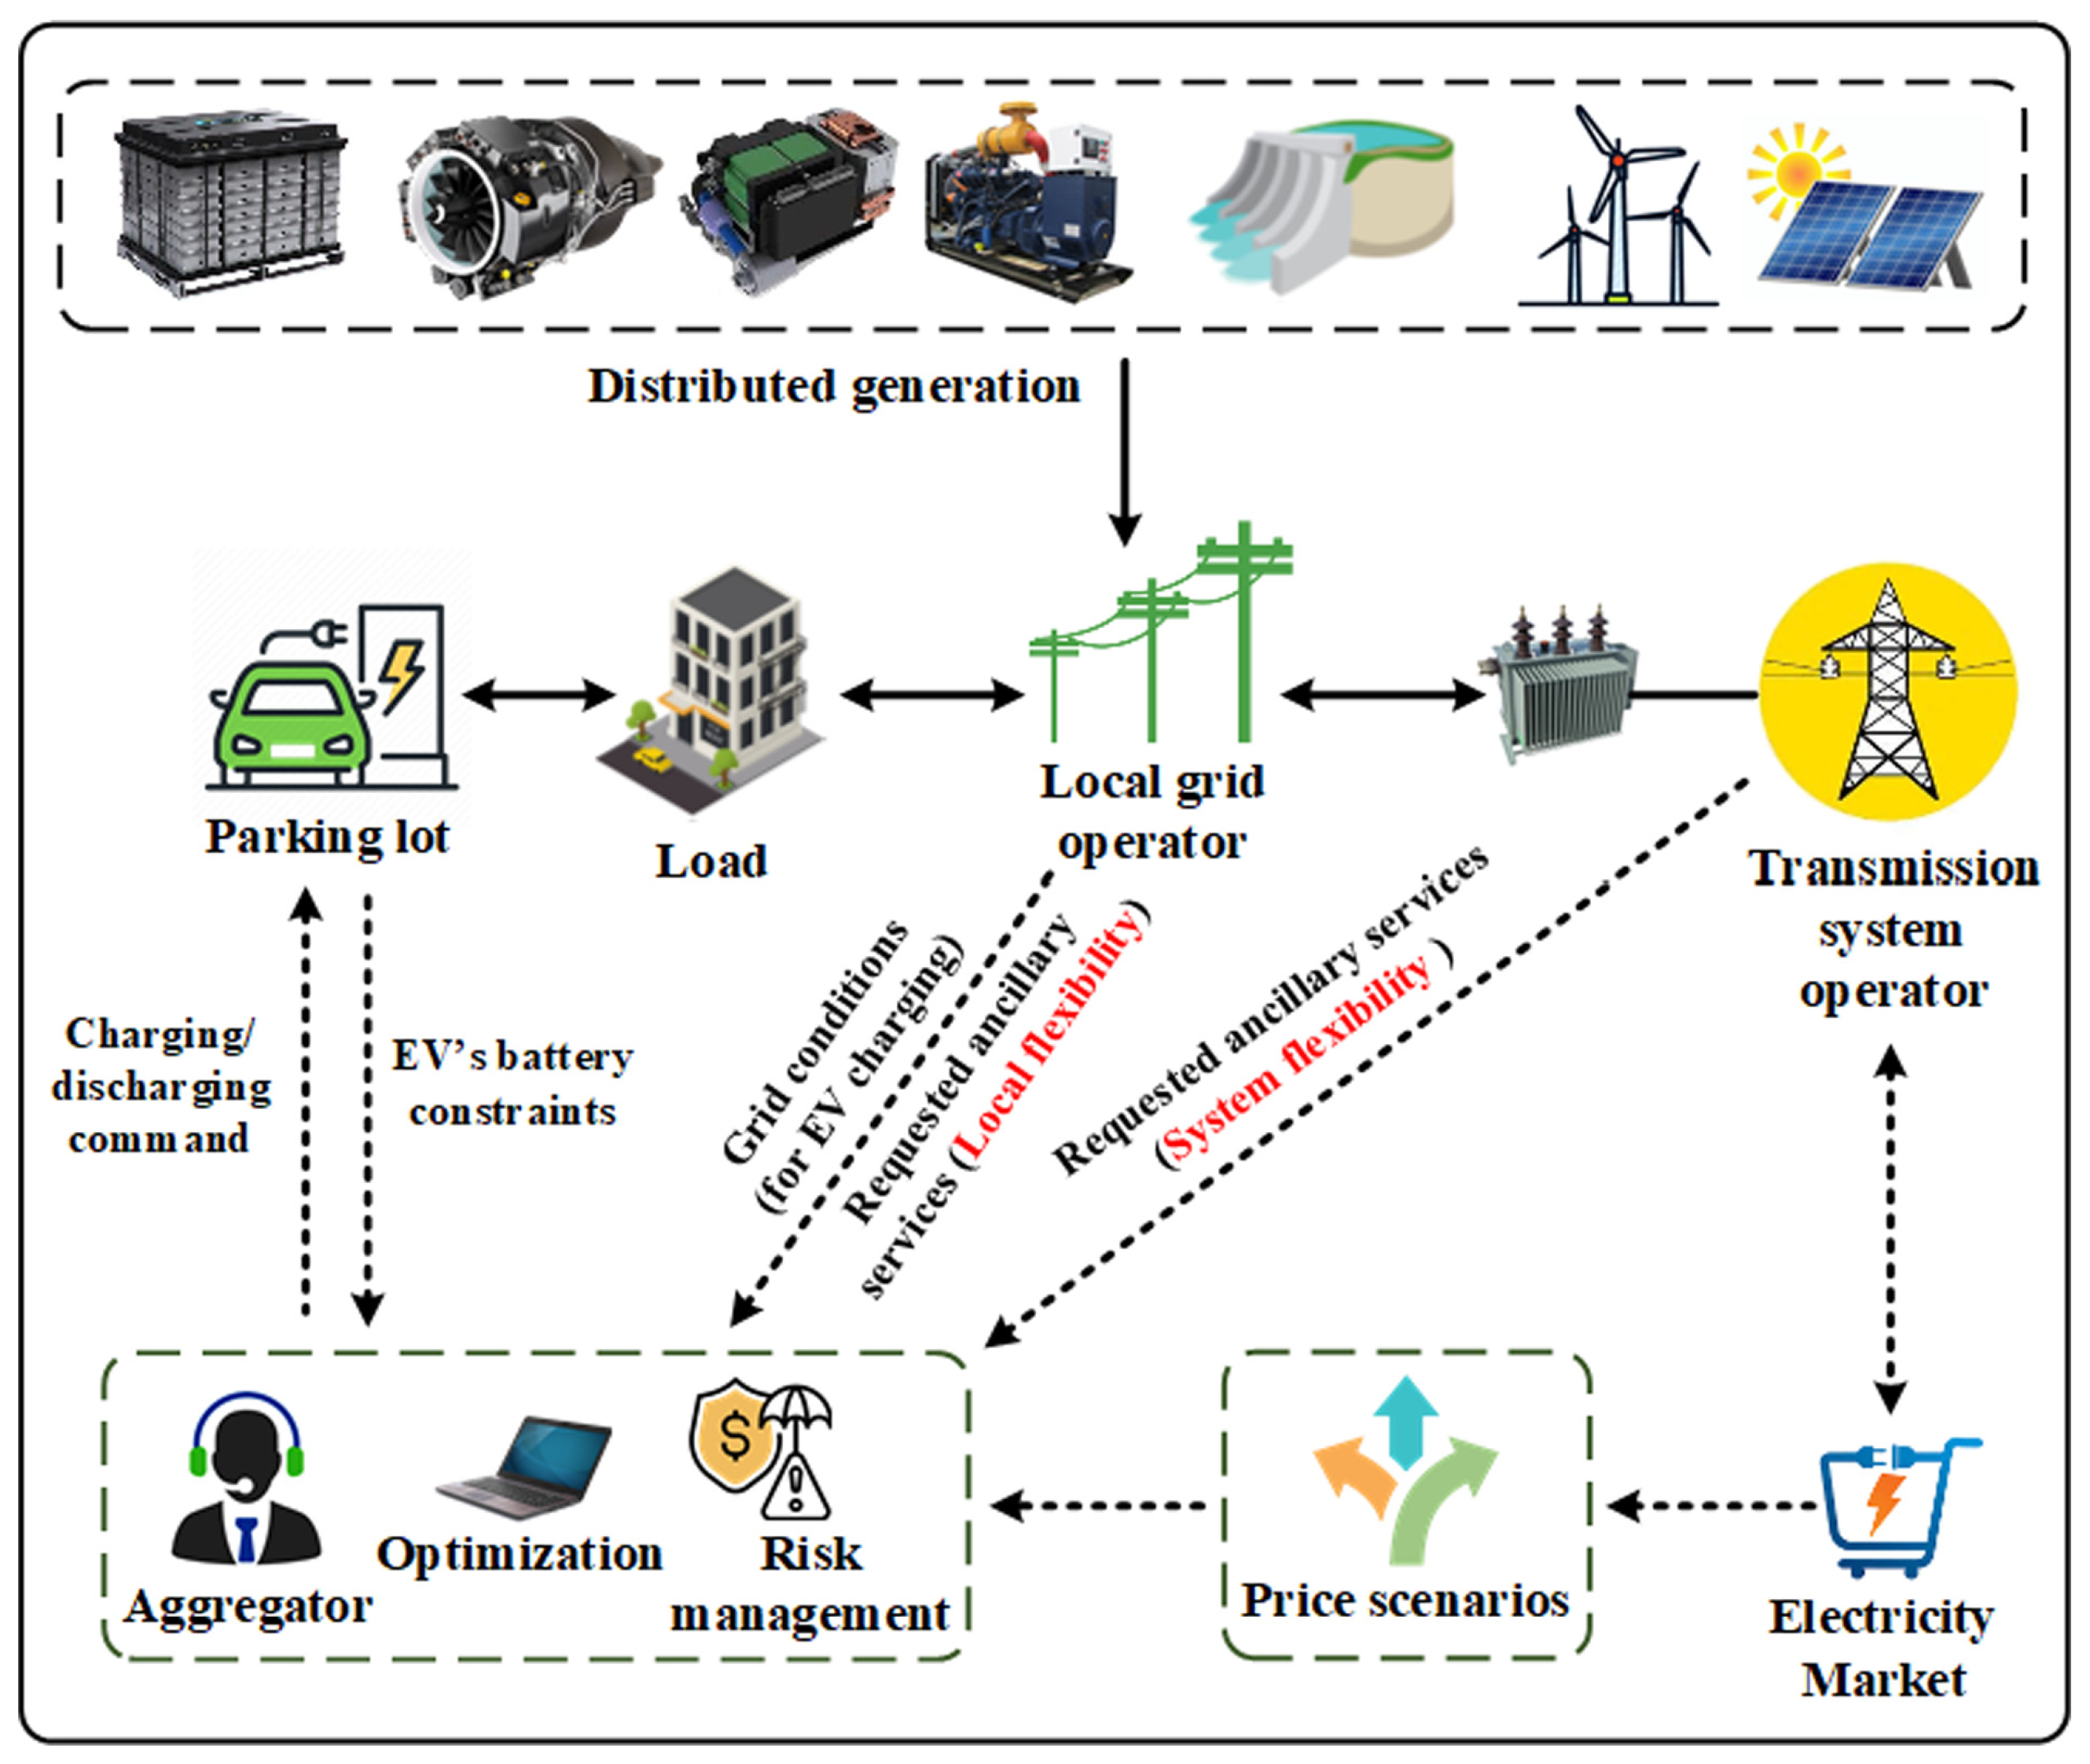
:1. Introduction
1.1. Literature Survey
1.2. Motivation and Problem Statement
1.3. Real Contribution
- A comprehensive investigation of load forecasting challenges for PHEV charging remains imperative through implementing RL, a potent tool for combining multiple ML models [6]. To address this matter, a new approach based on QL for forecasting load at EV charging stations has been introduced in this publication. QL has been frequently employed in problems with distinct states and actions. Our proposed QL model is suitable for the control task that demands ongoing response to the prevailing circumstances. The system comprises neural networks and deduces the differential for the state evolution of unknown epistemic uncertainty. This solution presents an opportunity to enhance the operational efficiency of PHEV charging, while also serving as a mechanism of reinforcement for energy dispatching within power grids.
- The recommended RL methodology for determining the optimal framework for PHEV load forecasting encompasses smart, cooperative, and non-cooperative scenarios. The developed QL approach exhibits superior efficiency, precision, and flexibility in PHEV load estimation when compared to traditional ANN and RNN models. Furthermore, incorporating modifications such as adjusting the epoch, hidden layer, and node quantities can significantly augment the accuracy of PHEV charging load predictions, as evidenced by empirical analyses.
1.4. Paper Organization
2. Technical Background
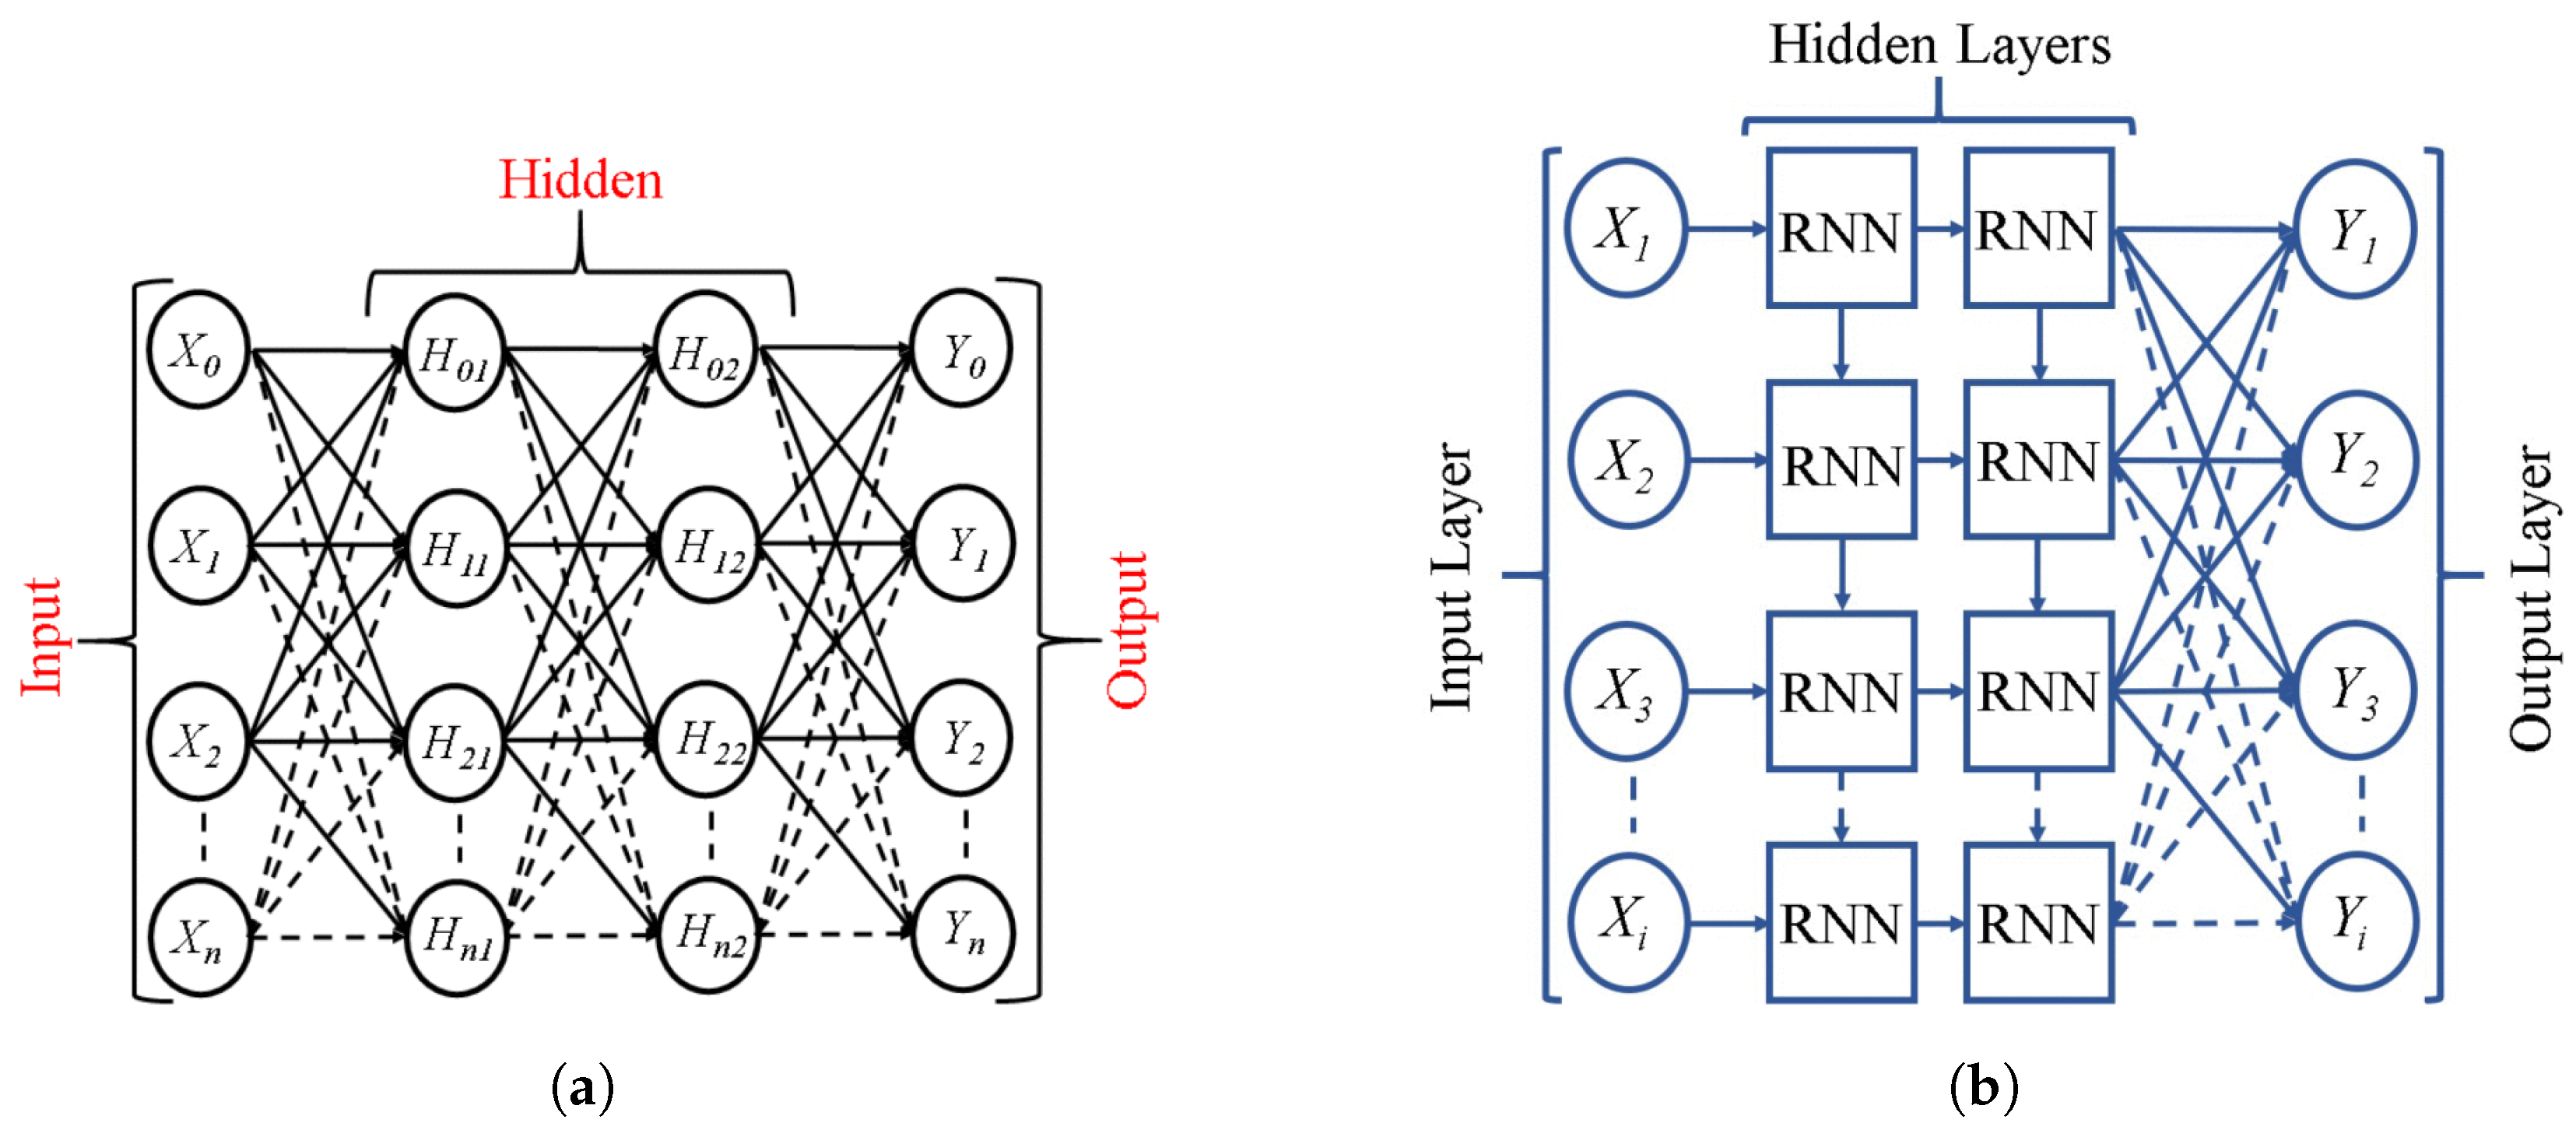
2.1. ANN
2.2. RNN
2.3. QL
3. Charging Behavior of PHEVs
3.1. Non-Cooperative PHEV Charging
3.2. Cooperative PHEV Charging
3.3. Smart PHEV Charging
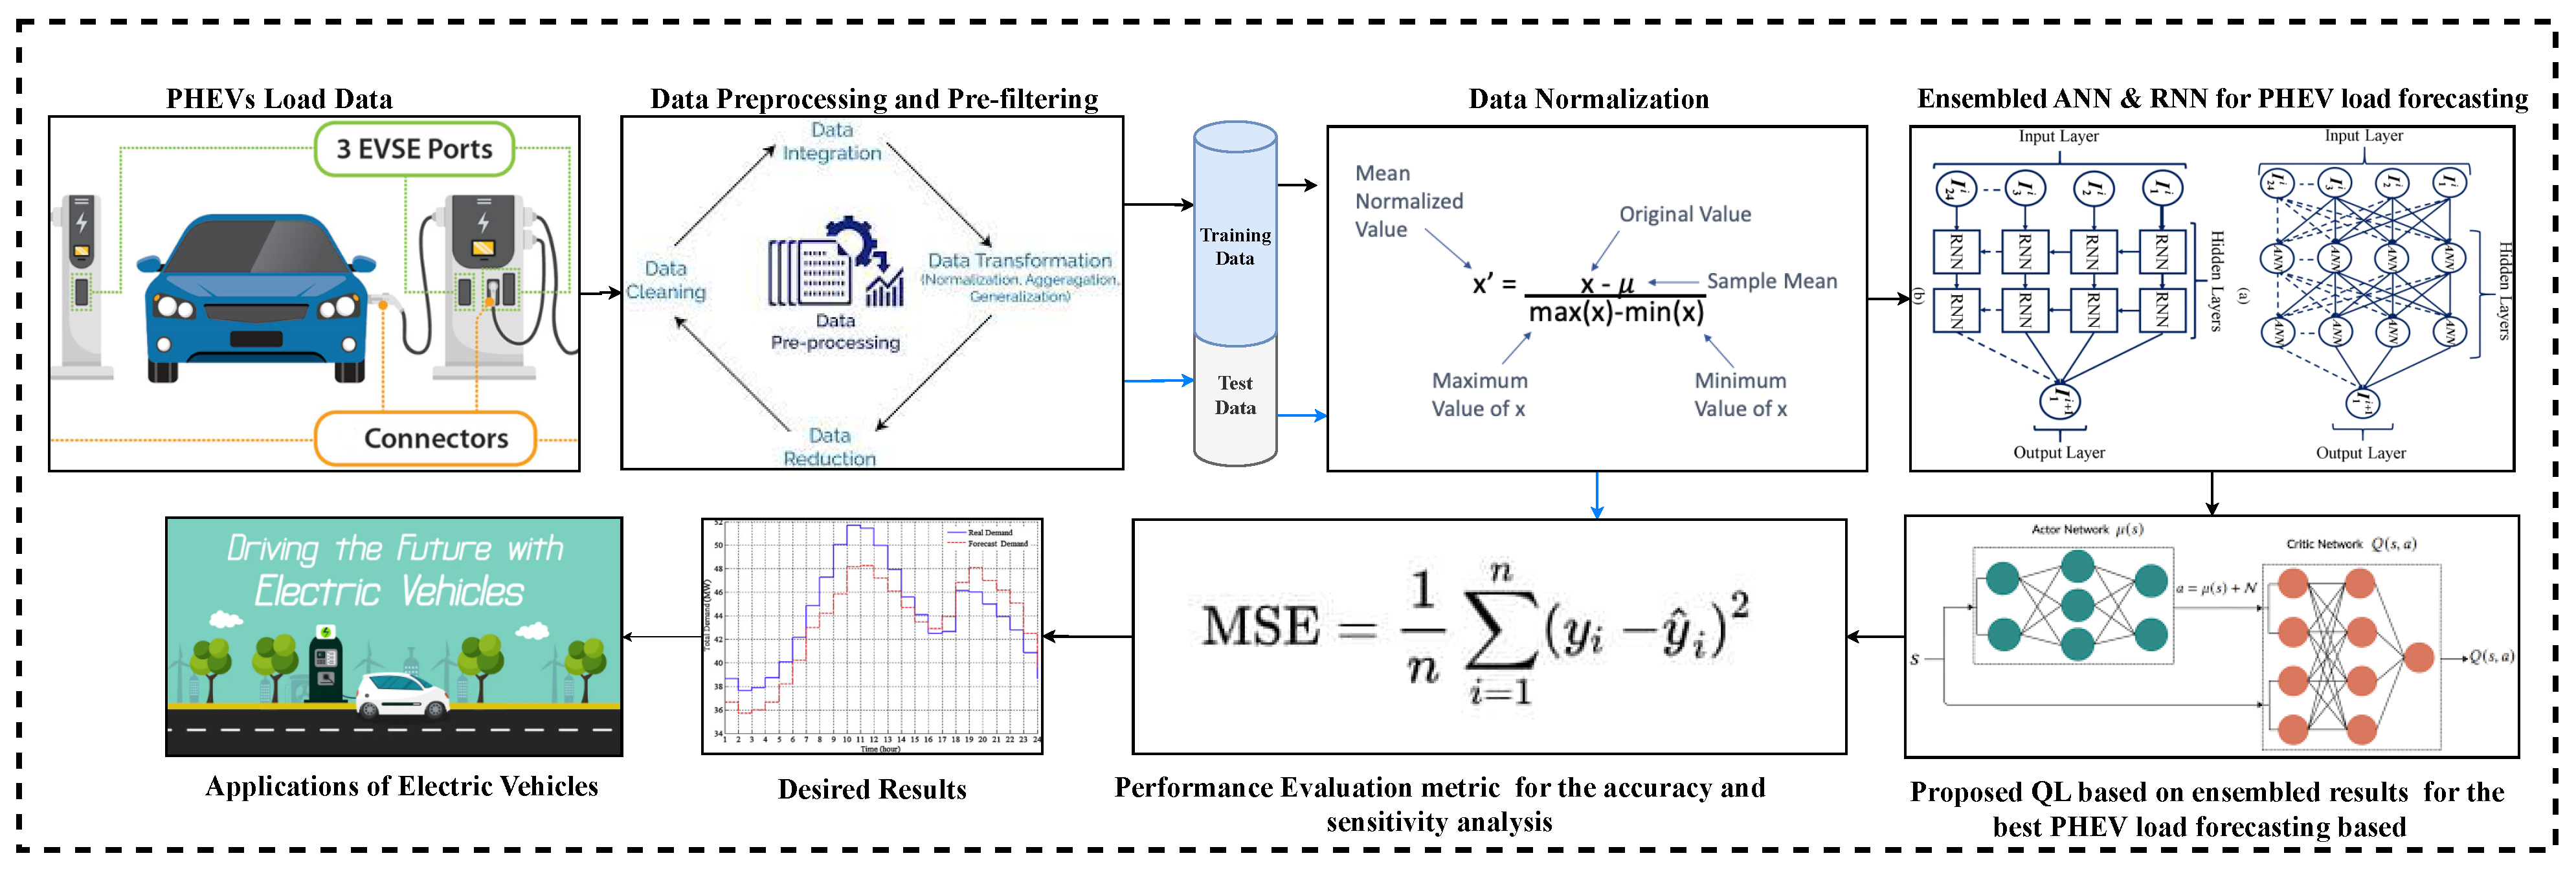
4. Proposed QL-Based PHEV Charging Load Forecasting Framework
4.1. Data Source
4.2. Preprocessing Module
4.3. QL-Based Forecasting Module
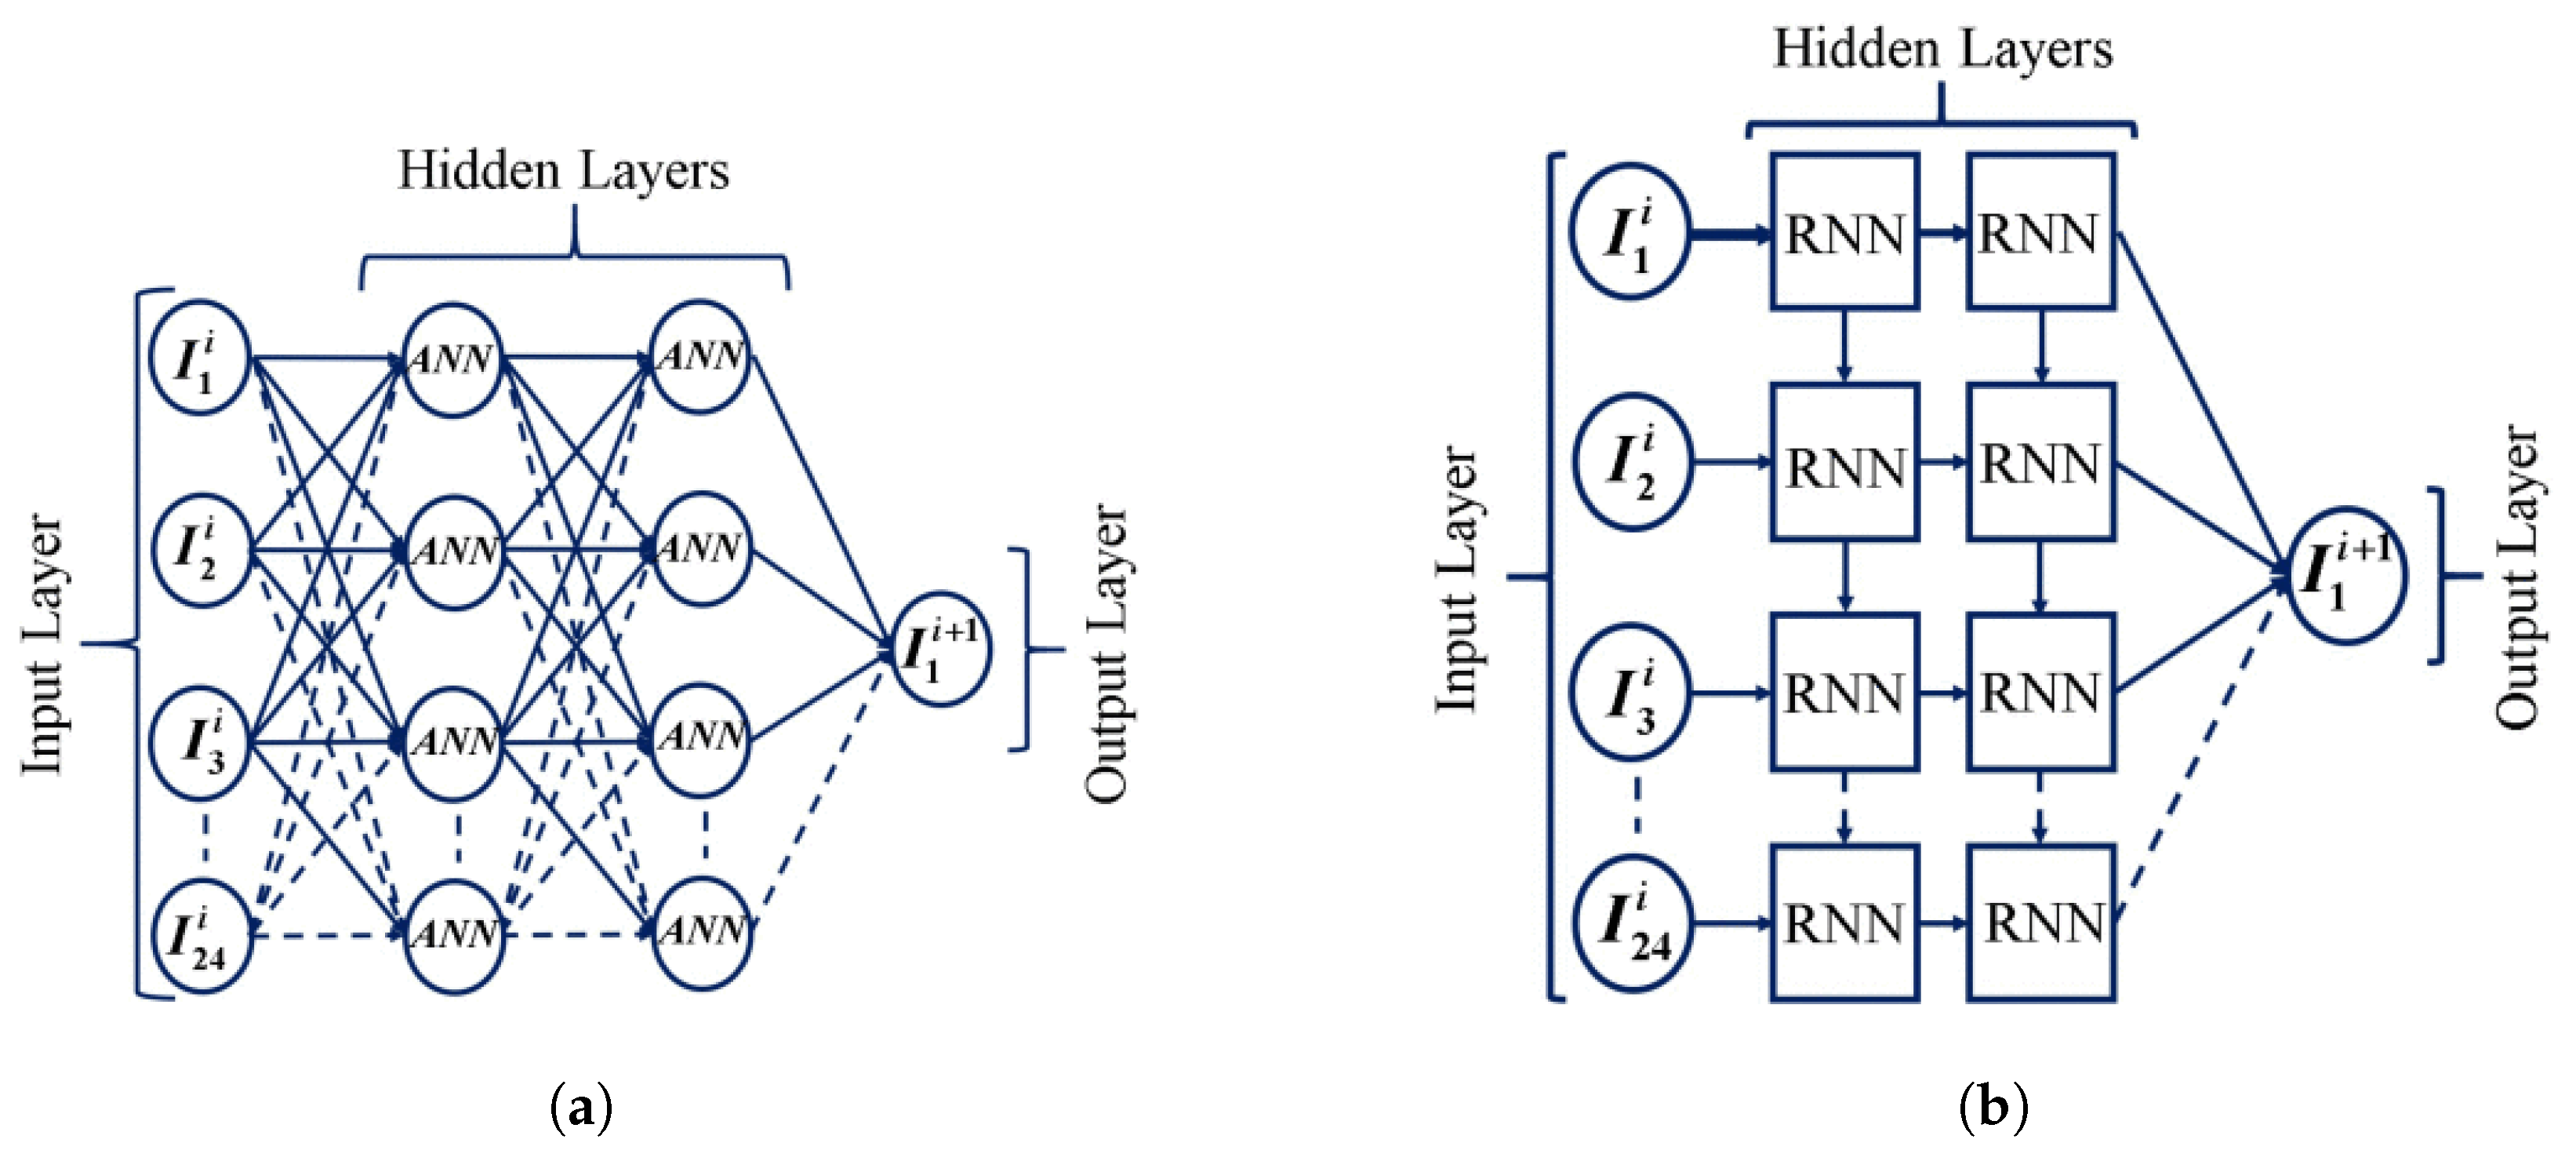
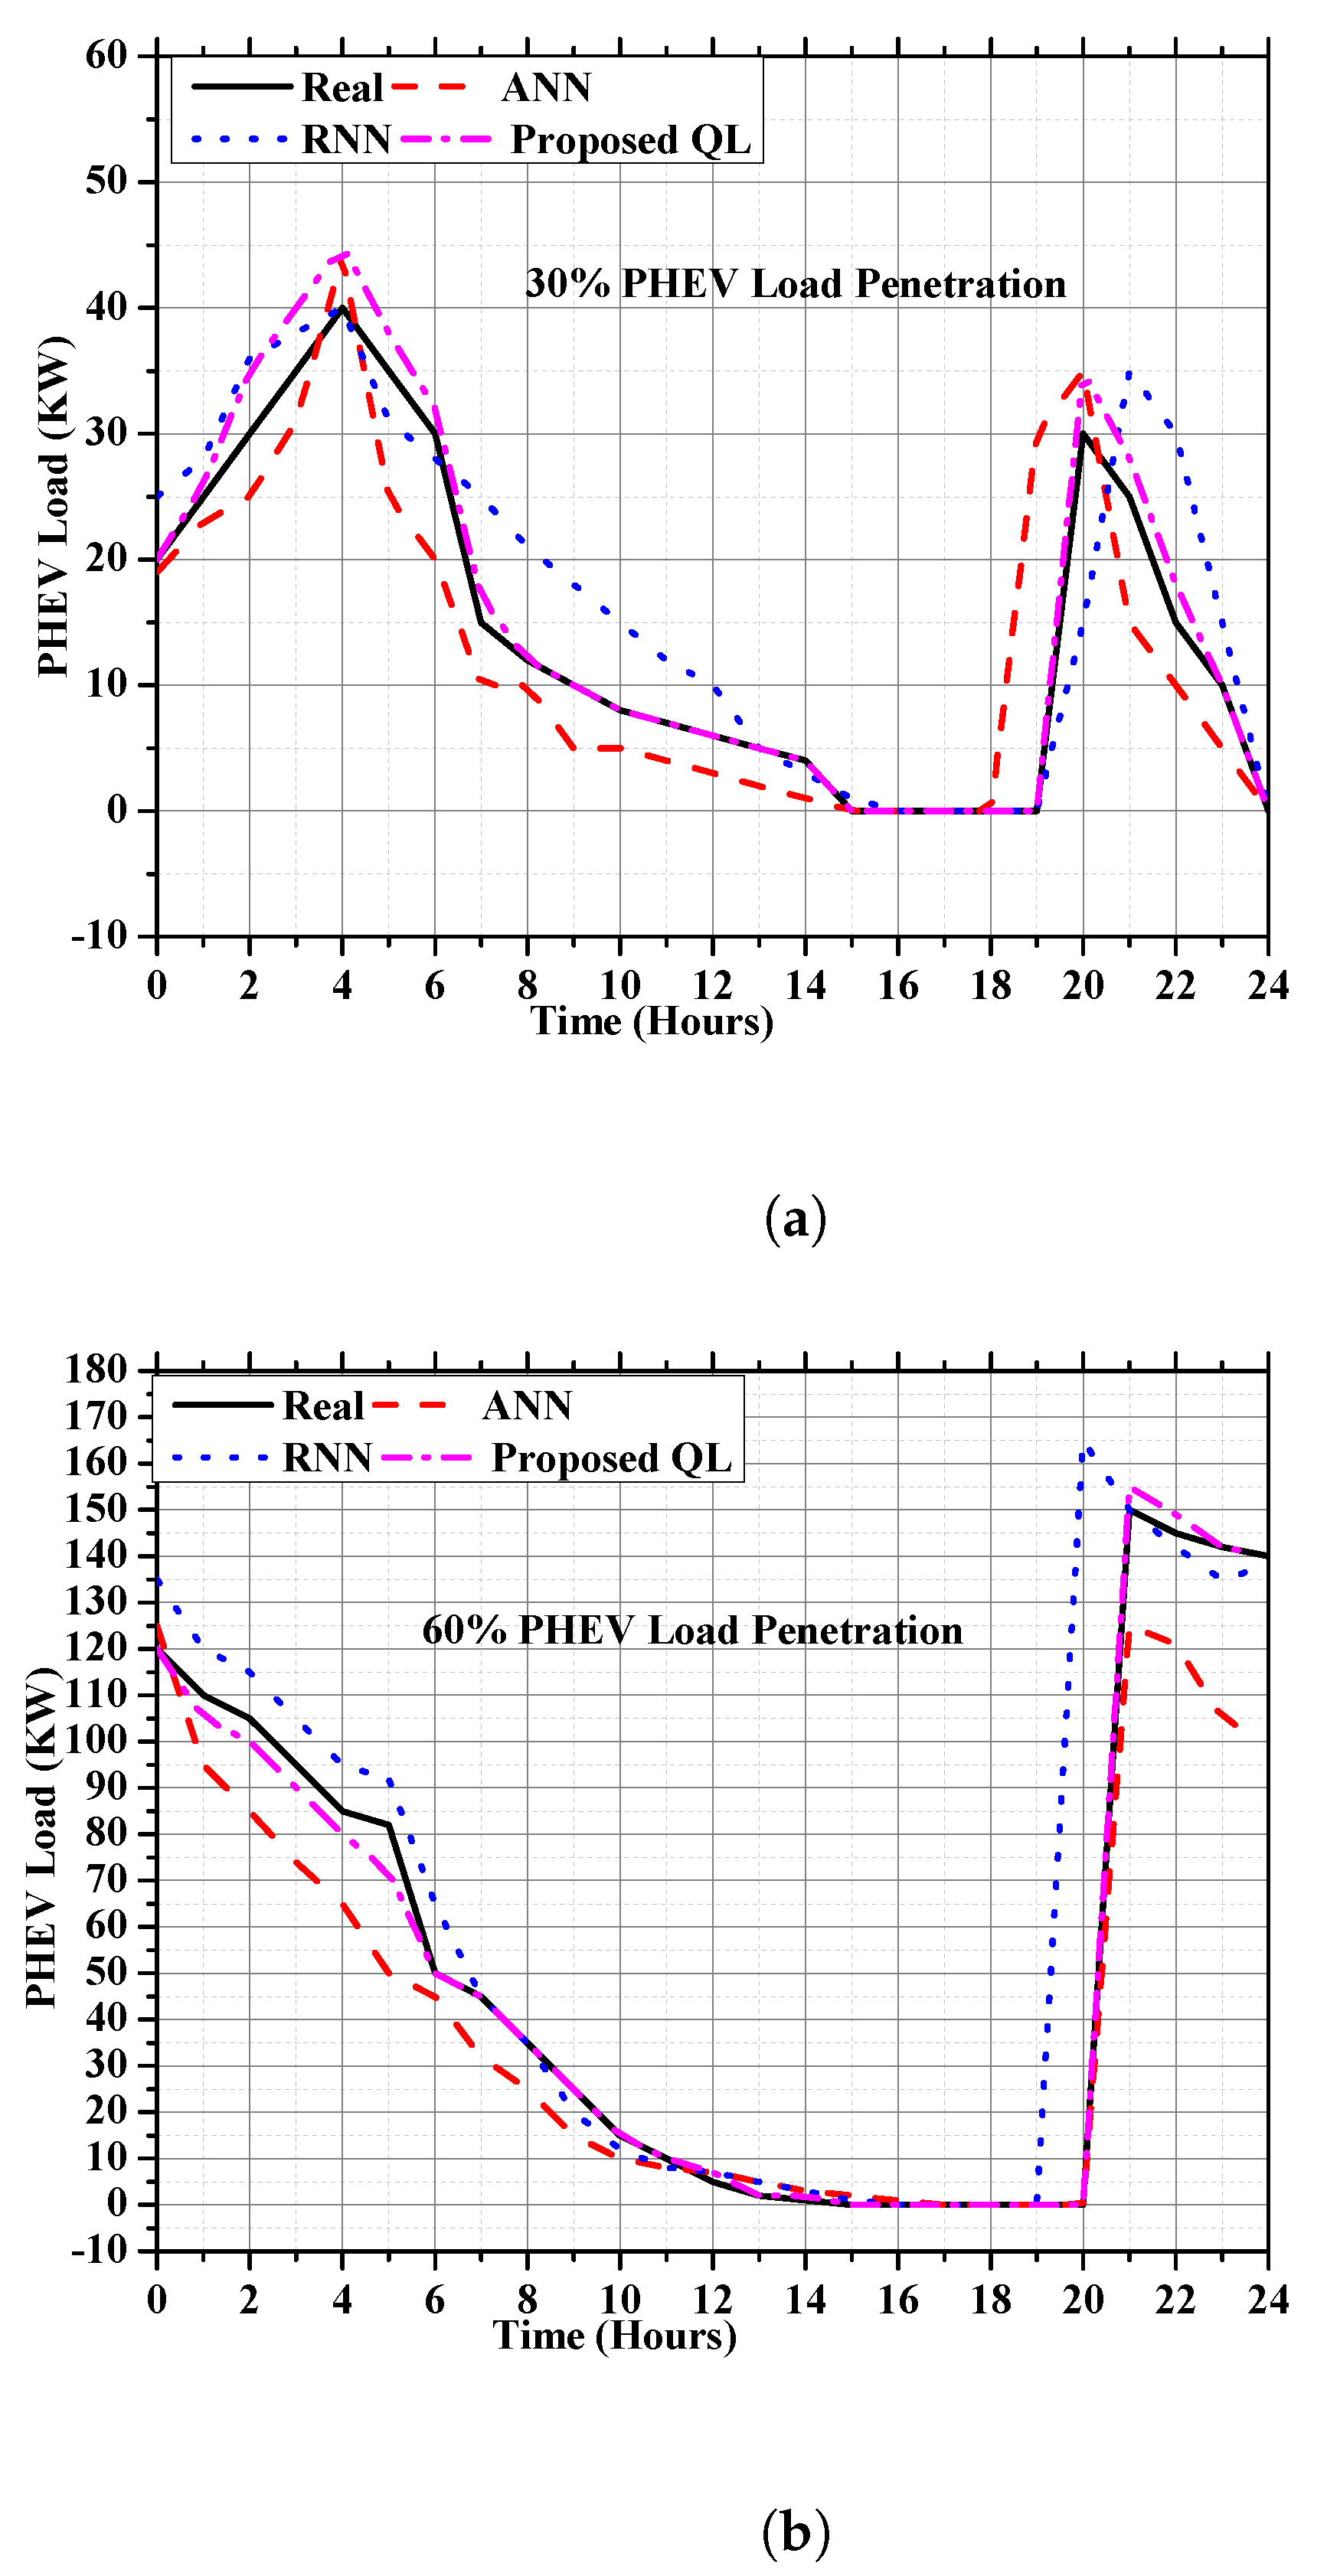
- When using the ANN technique to forecast the load on PHEVs, the input and output ANN units should be chosen appropriately. Due to the time series nature of PHEVS load data, the ANN unit utilized prior PHEV load data. The baseline 24-h PHEVs load data were helpful for more accurate one-hour-ahead load forecasting. The deployment of ANN and RNN for predicting one hour ahead is shown in Figure 4.
- The proposed QL method for the PHEVs load forecasting used the previous days’ ANN and RNN forecasting results. In hopes of identifying the best day-ahead PHEV load forecasting, the proposed QL approach chose the best course of action based on the output of ANN and RNN. The proposed QL model’s reward function is shown in Equation (14):where is the random number of the jth action. The proposed approach chose one of two possible courses of action for each time horizon ( for ANN and for RNN). The power forecast for the ANN or RNN method was . Additionally, contains the PHEV data for the tth period. The ANN and RNN predicted results were used in the devised method to predict the PHEV future load and compare it with actual data. Thus, 24 optimal actions were chosen in the proposed QL approach for the day ahead horizon. Therefore t can be any integer between 1 and 24 for the day ahead horizon. , , and were the optimal, ANN, and RNN PHEV load of the tth day, respectively. The values between 0 and 2 were used to improve the ability of the QL technique to find the best search locations. When the action was 1, the RNN technique chose the reward function. Alternatively, the reward function was determined from the results of the ANN method.
5. Evaluation Criteria
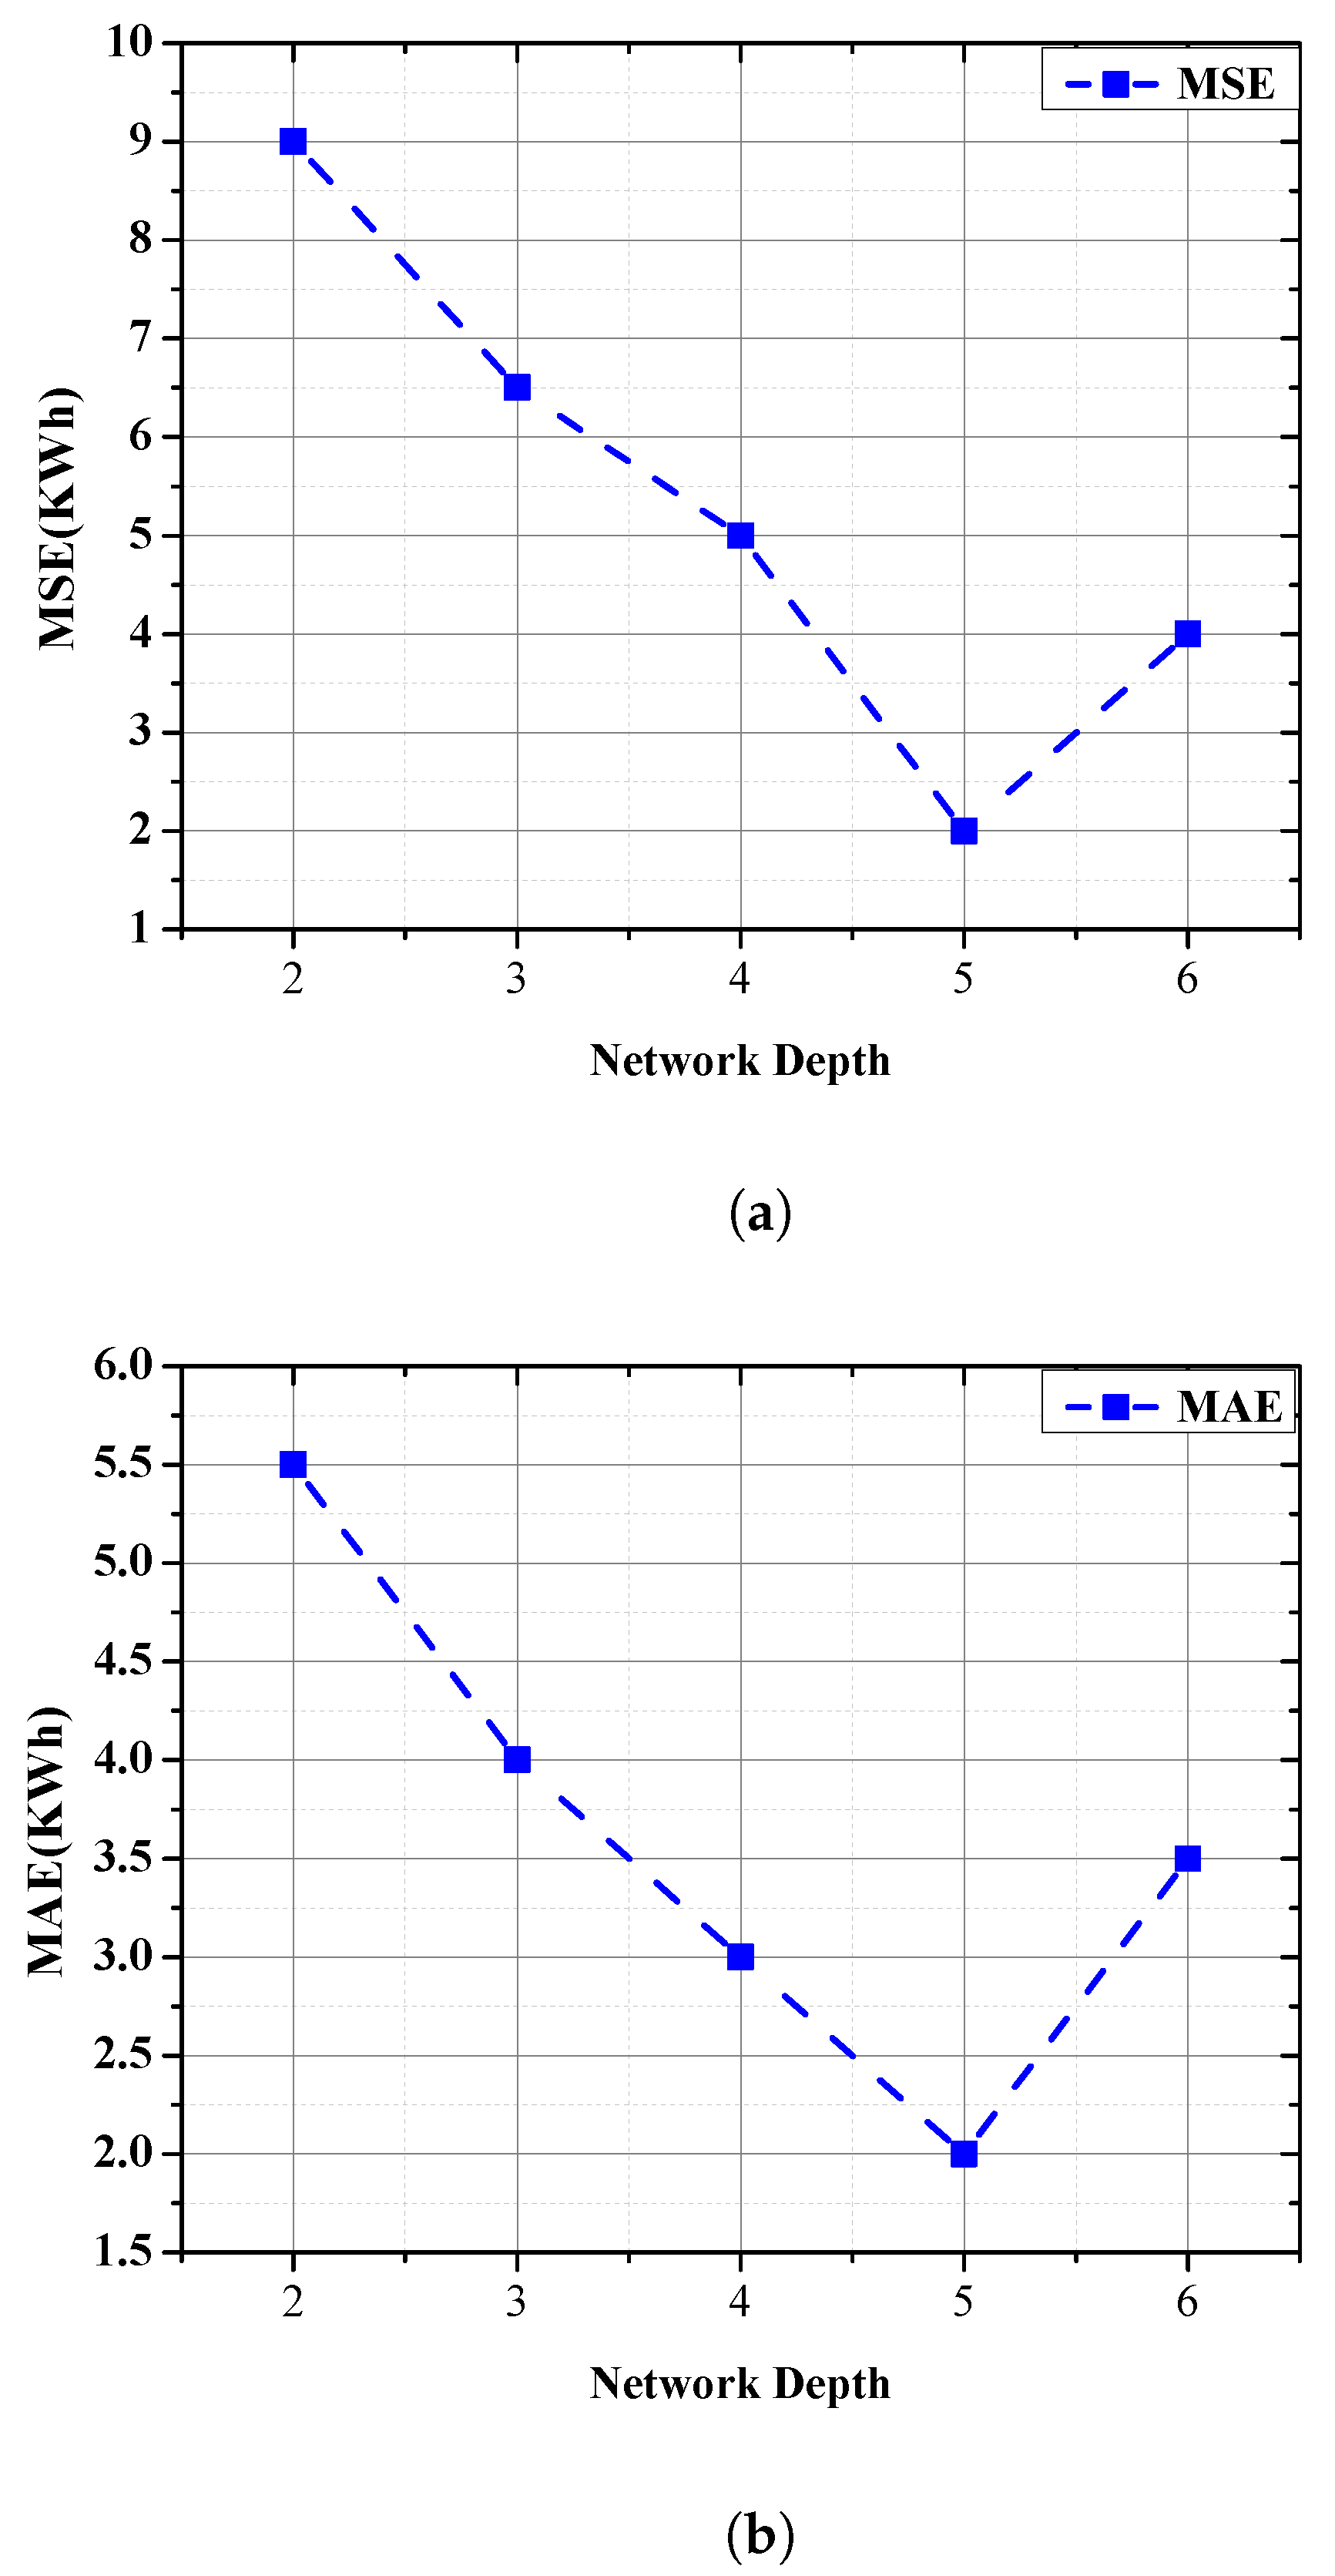
6. QL-Model Forecasting Performance with Different Network Depths
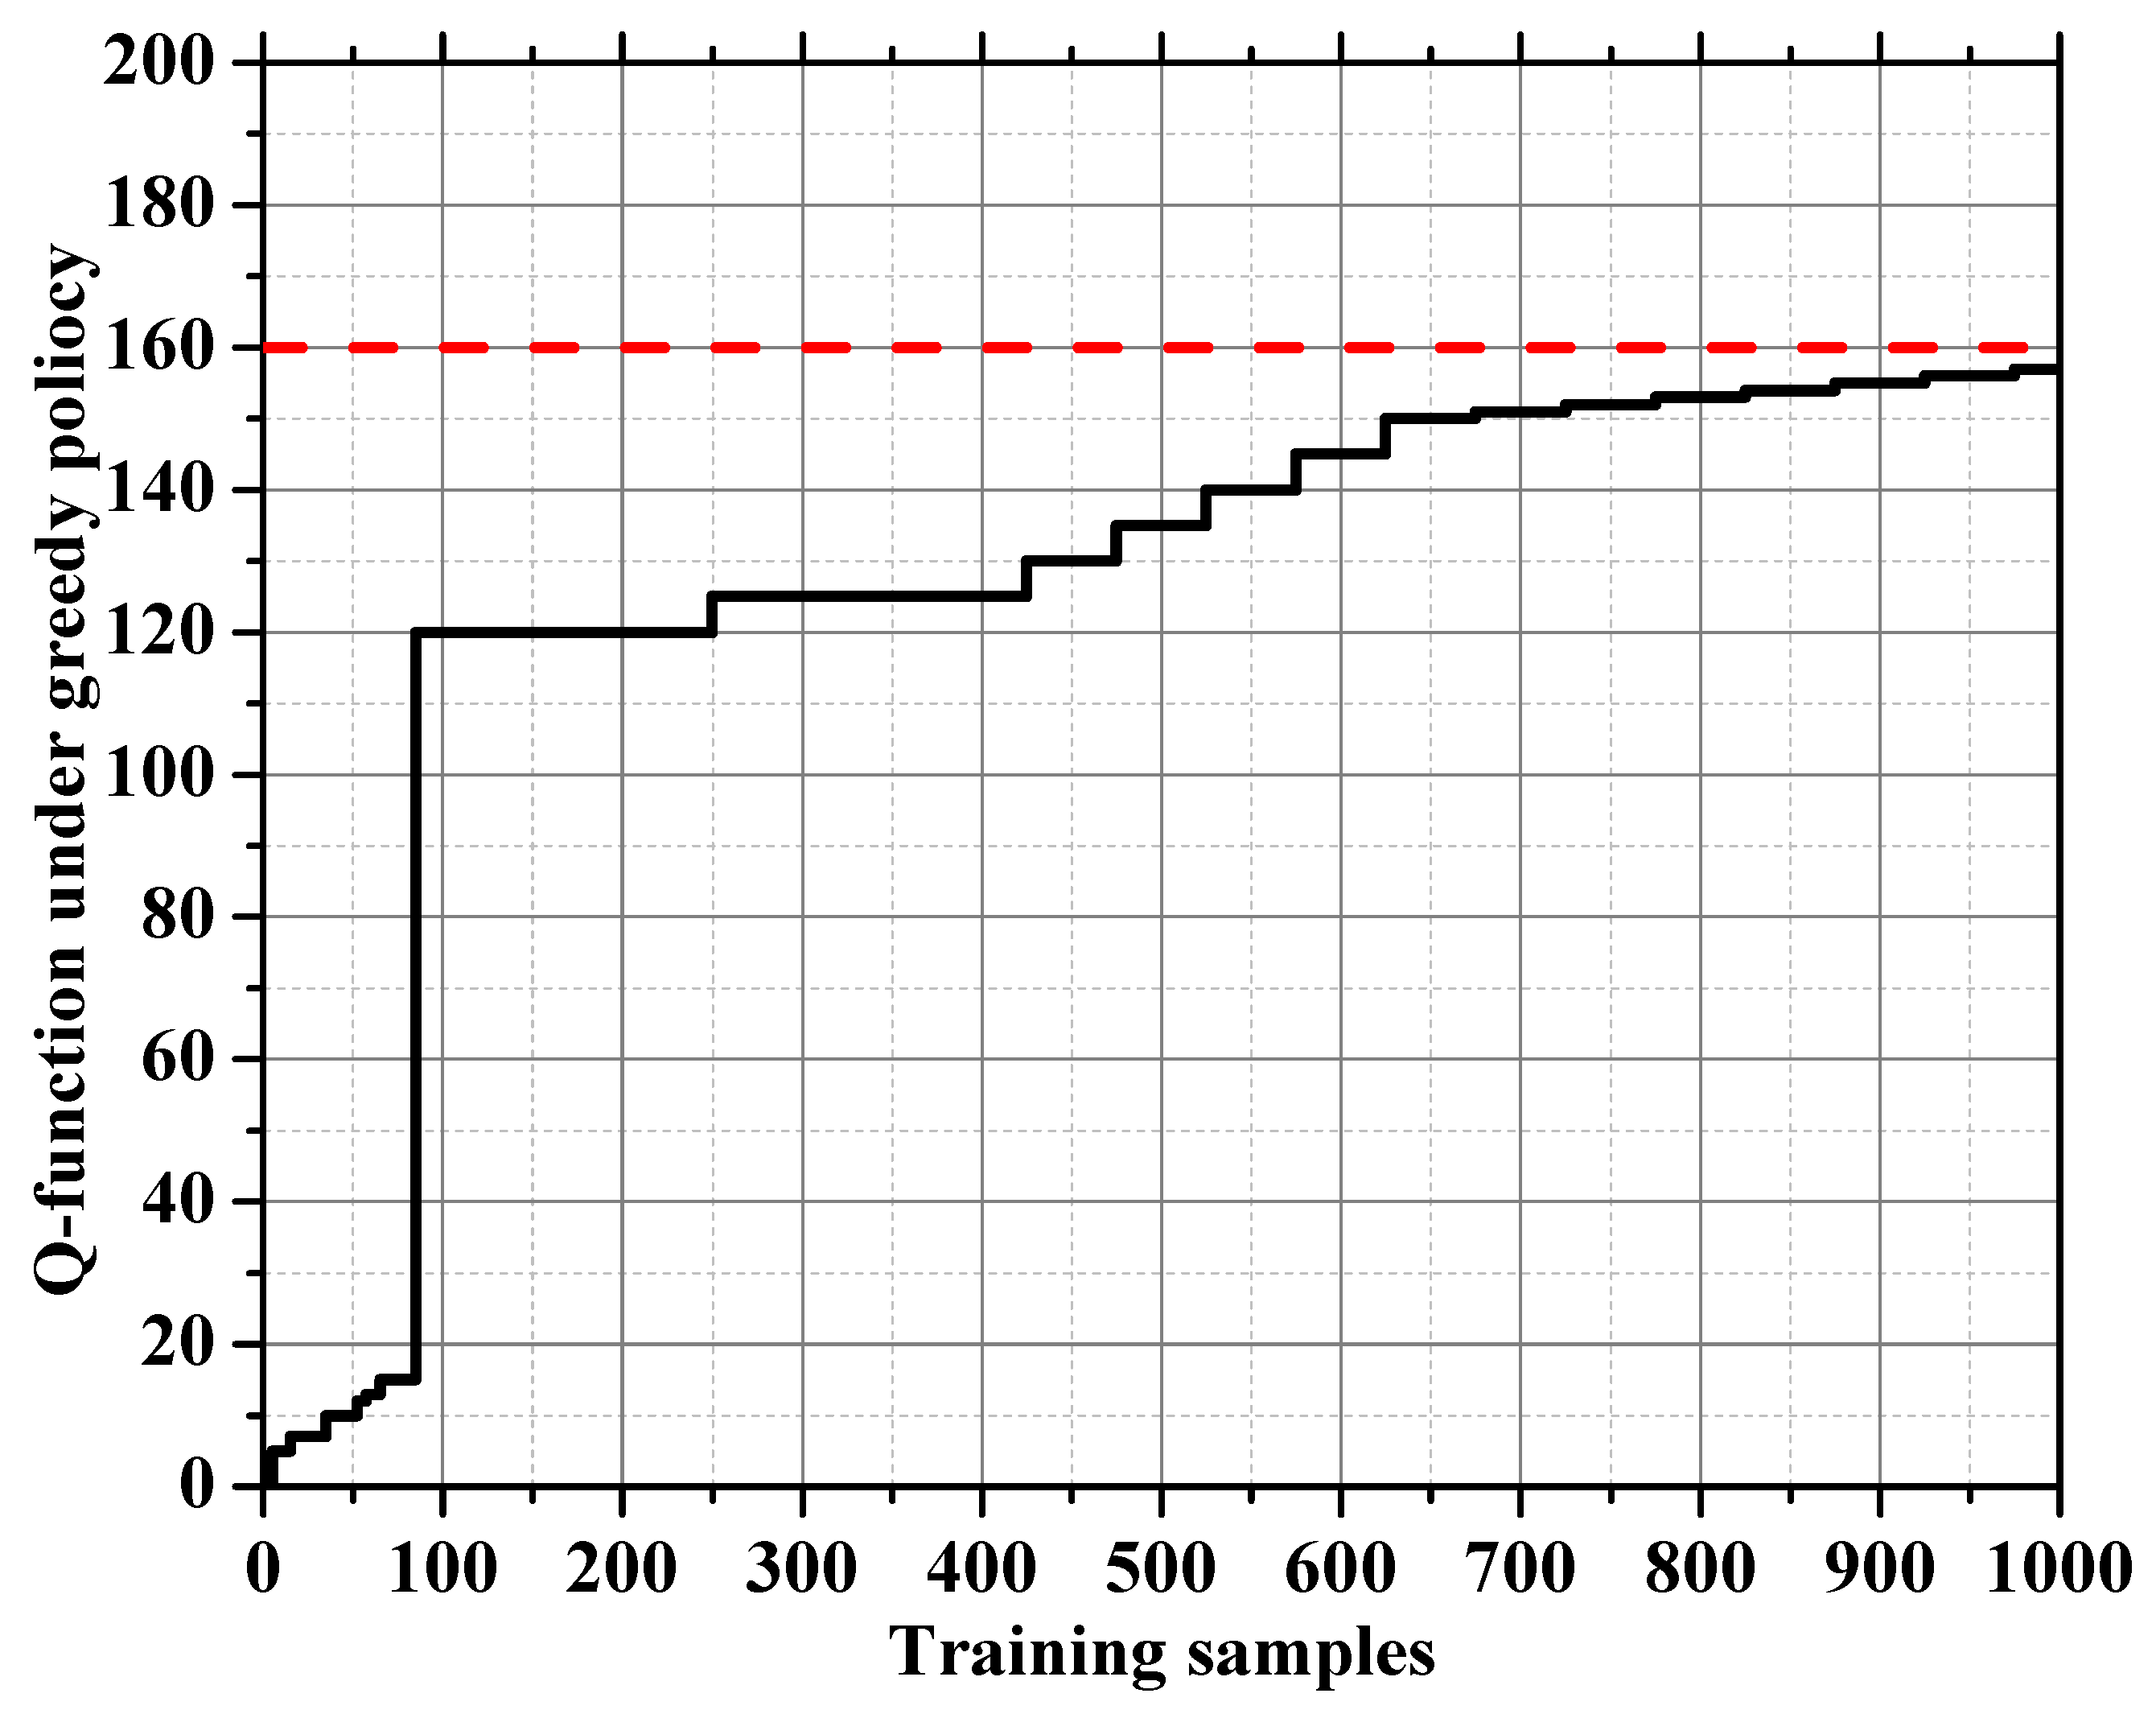
Convergence of the QL
7. Test Cases Simulations and Results
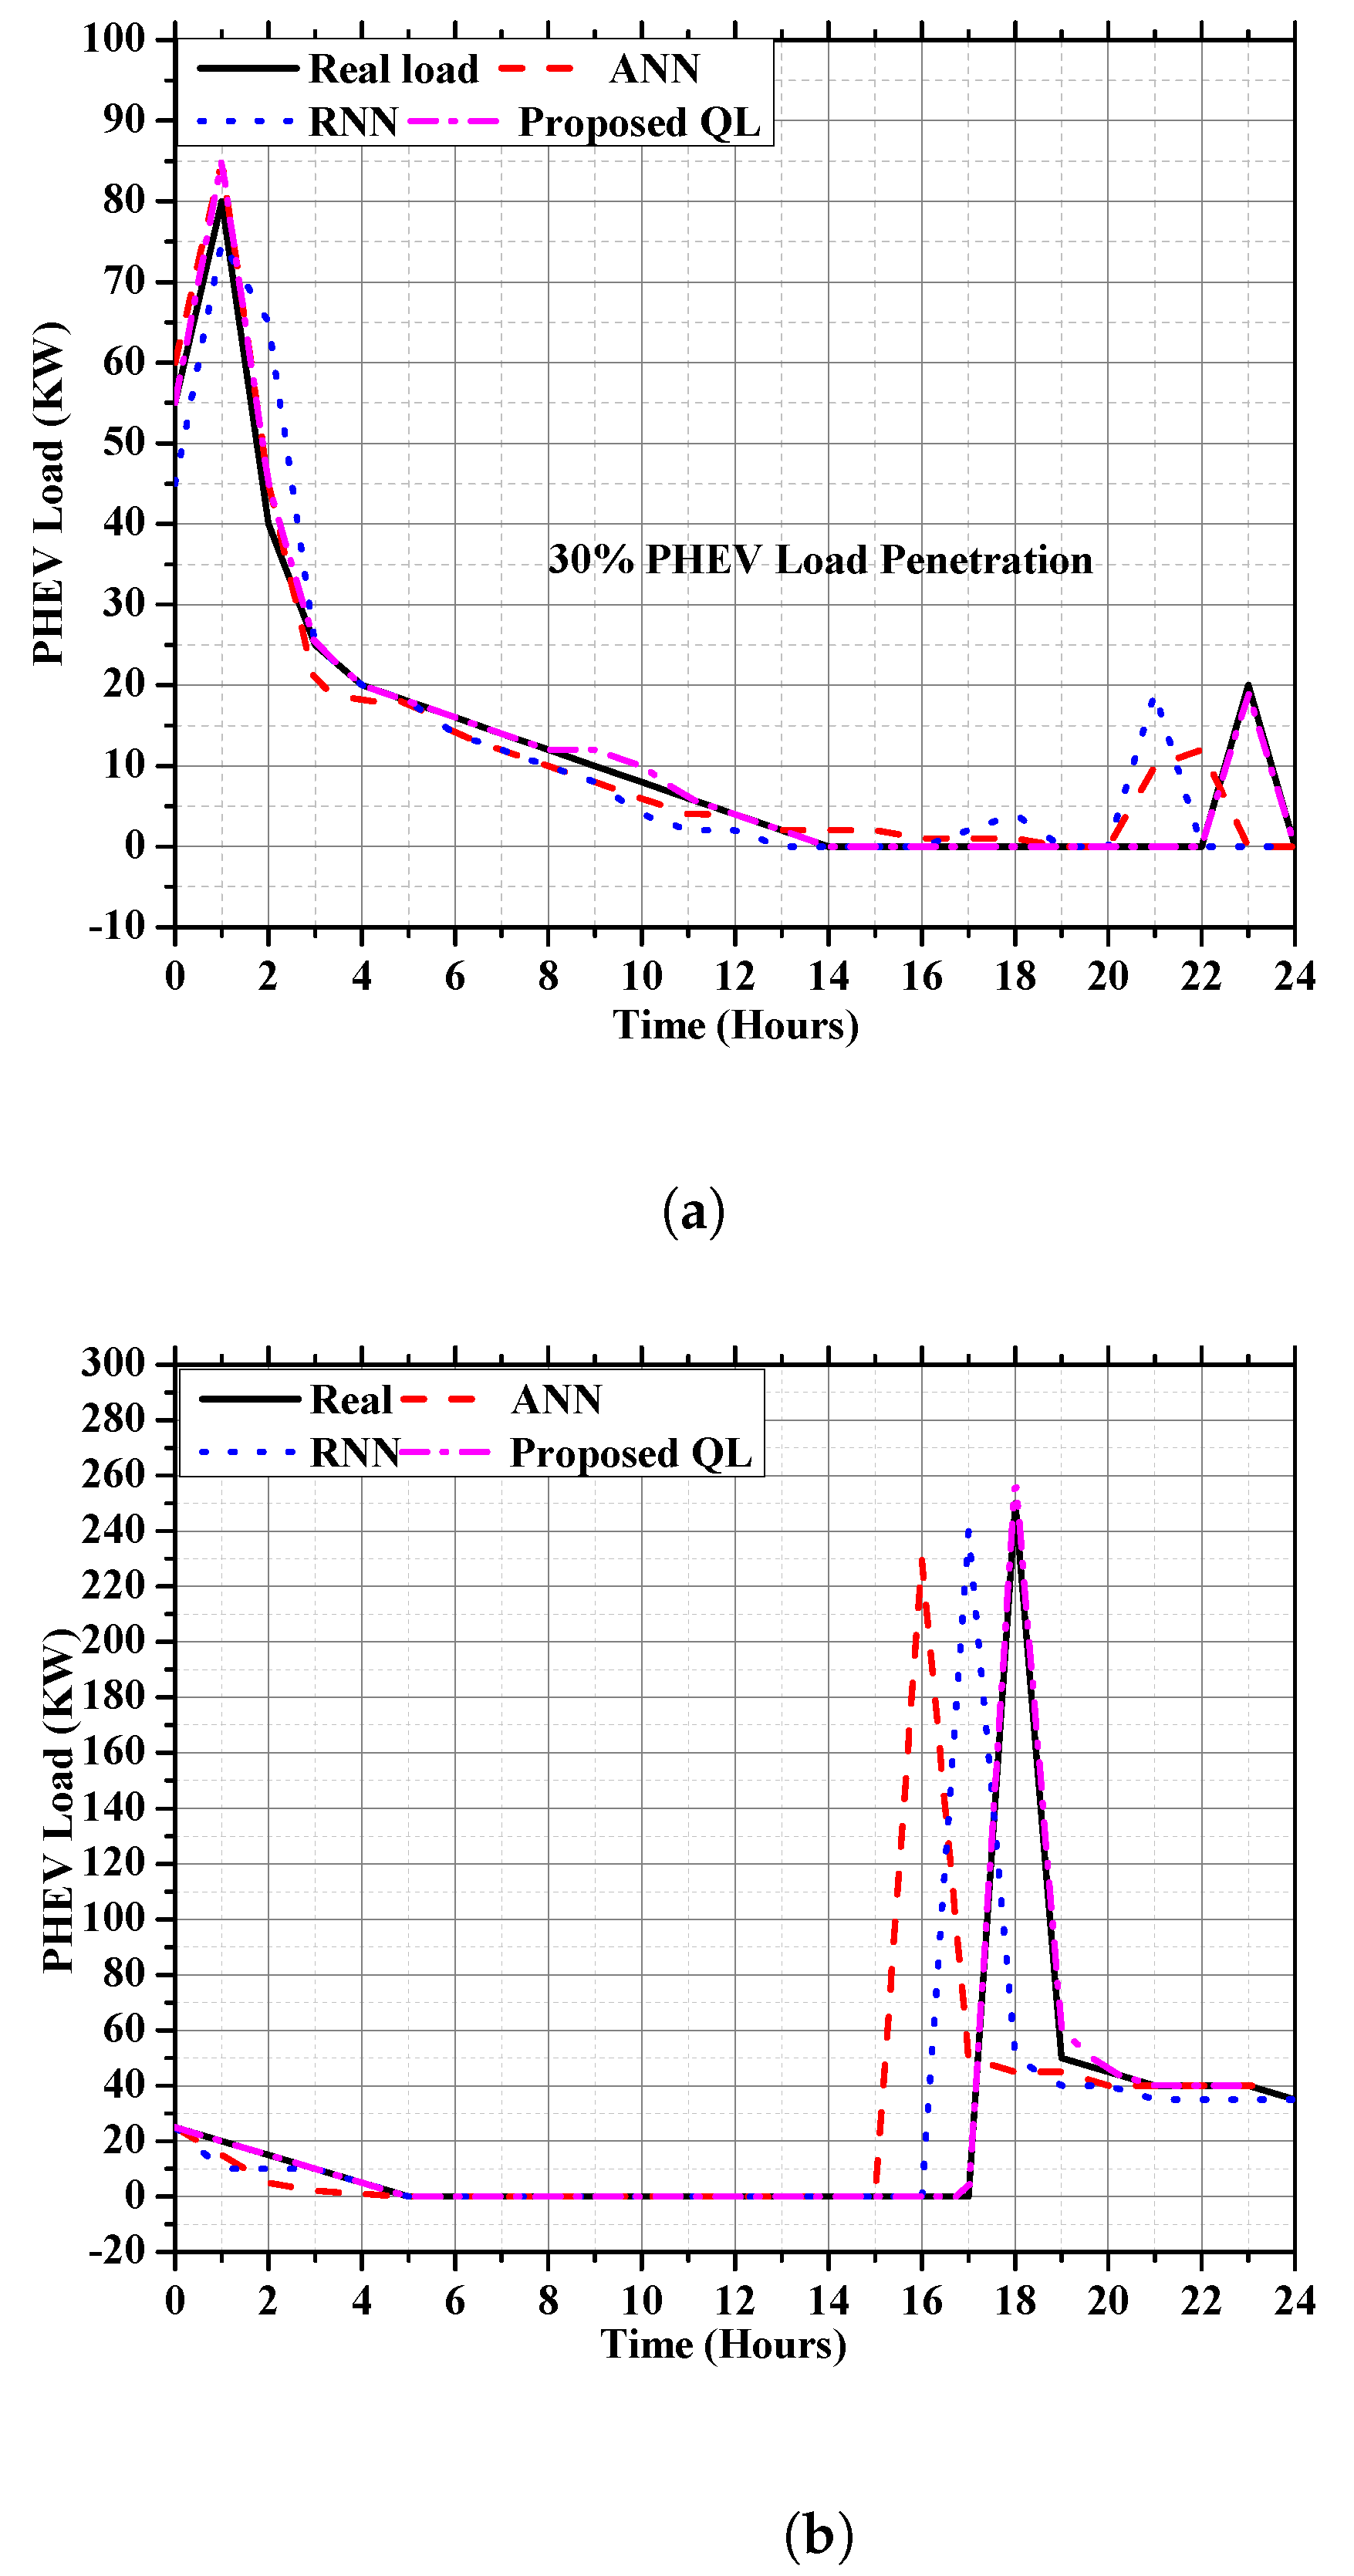
7.1. Load Forecasting of Non-Cooperative PHEVs Charging
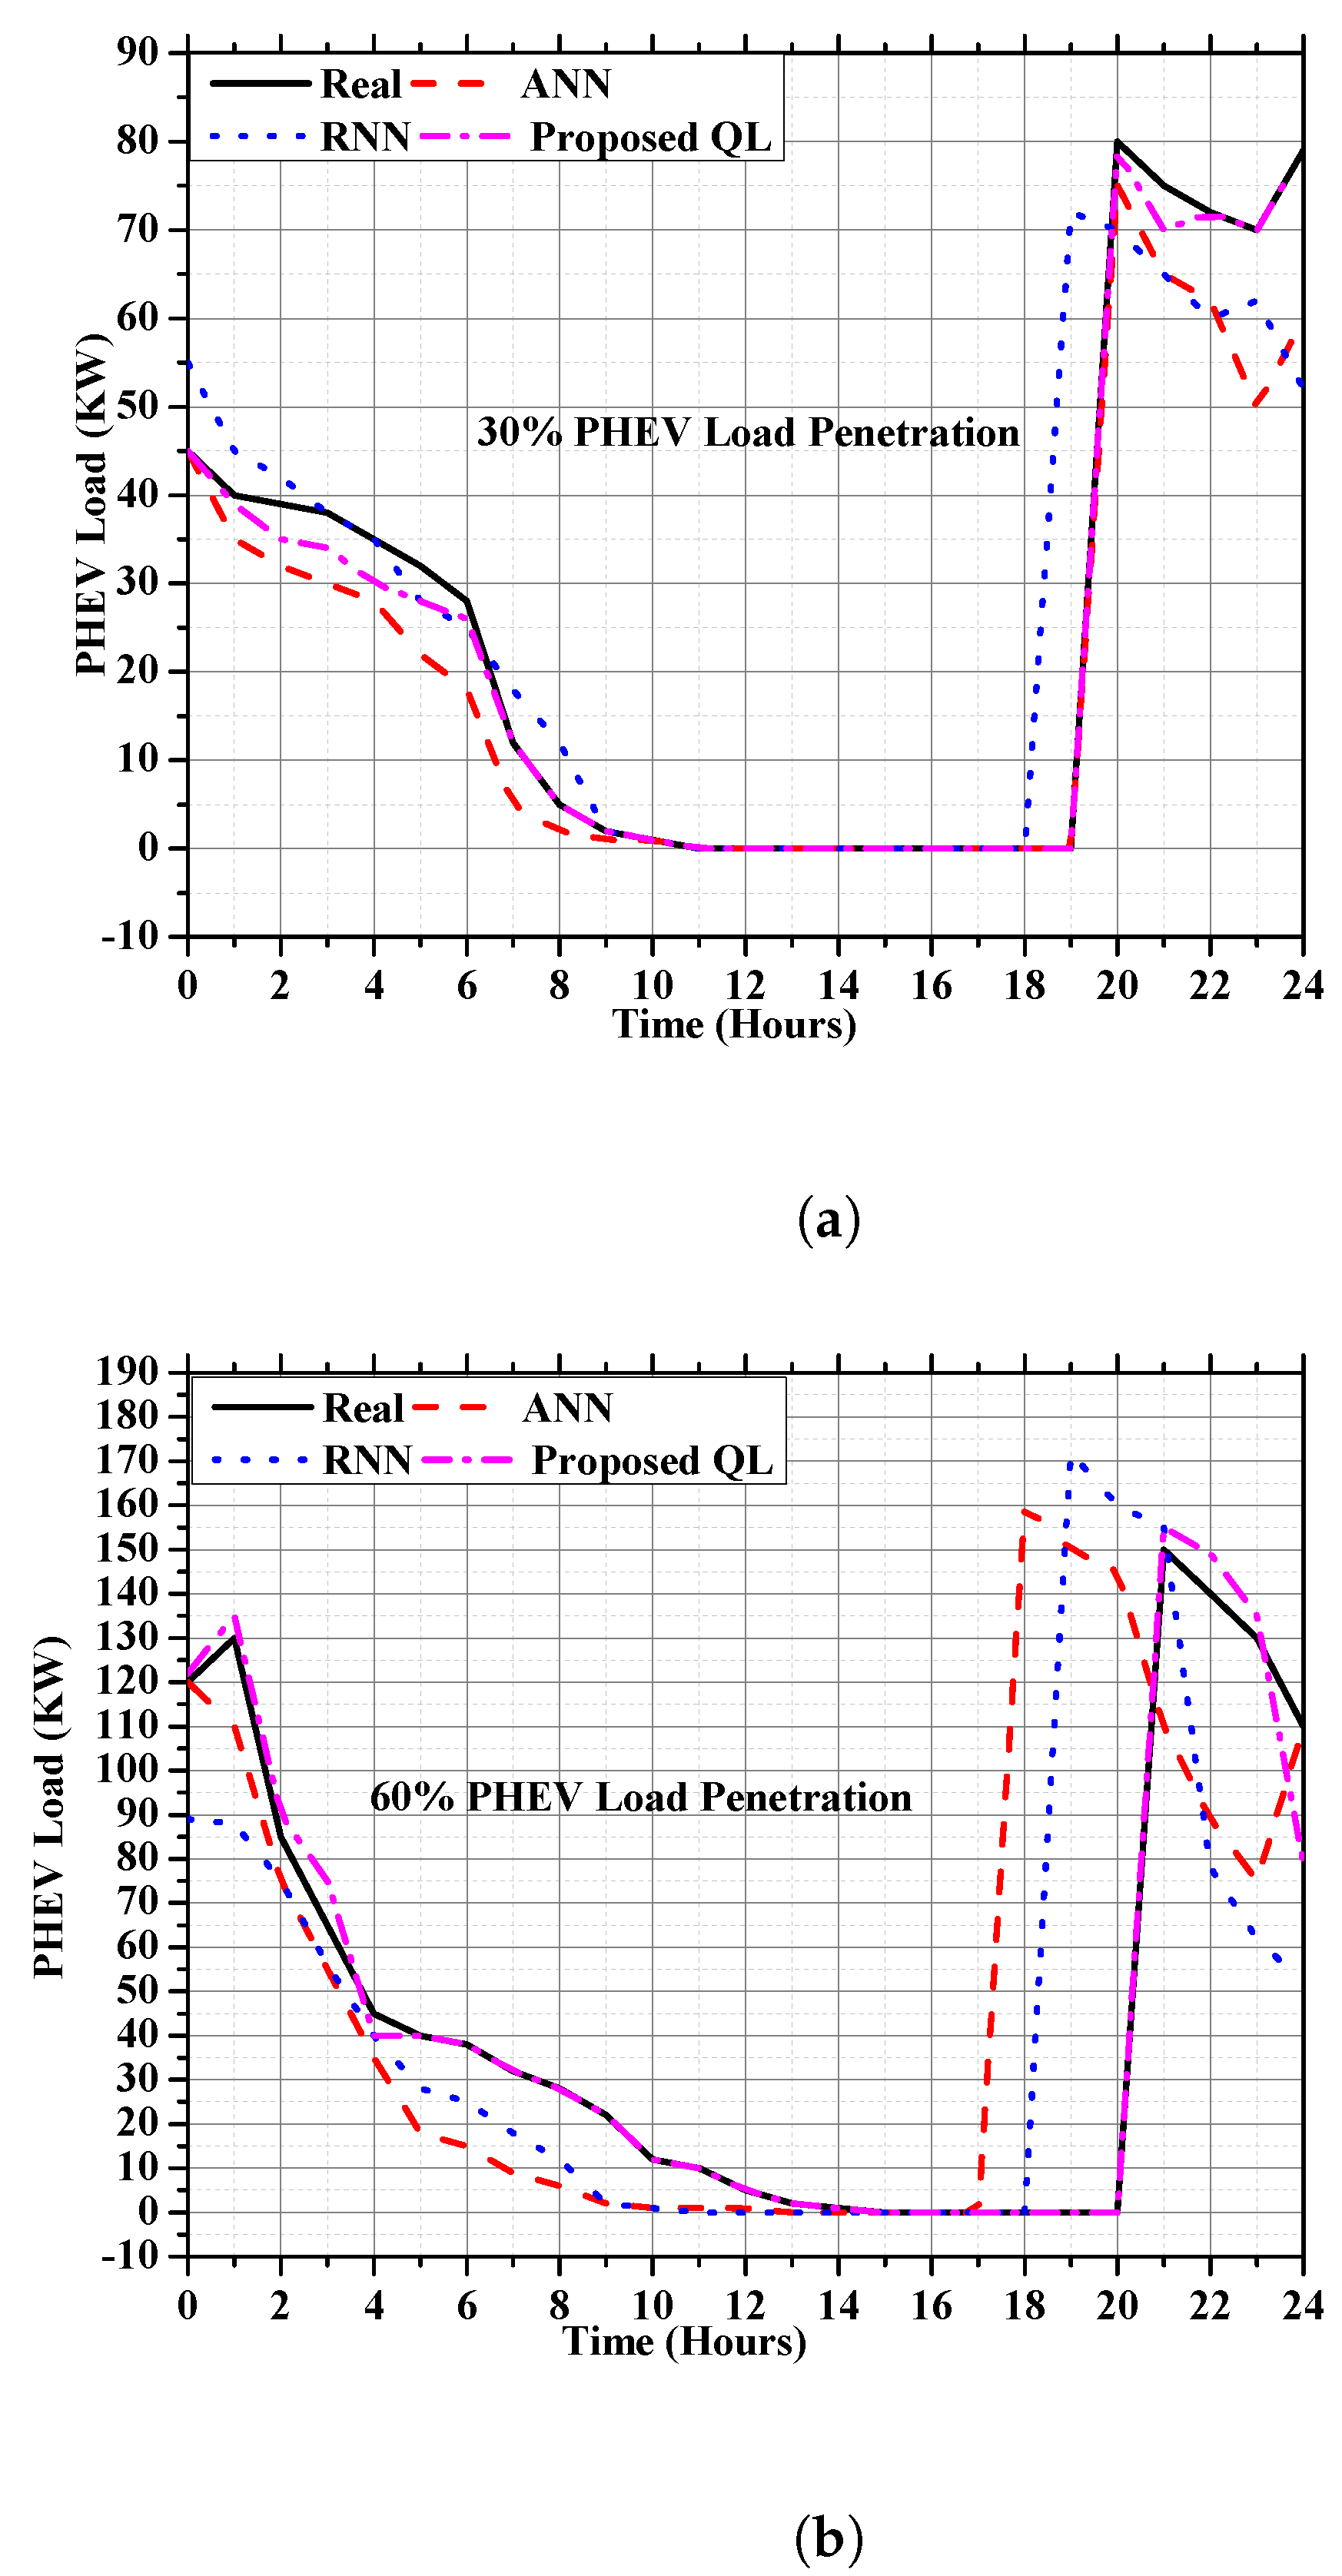
7.2. Load Forecasting of Cooperative PHEVs Charging
7.3. Load Forecasting of Smart PHEVs Charging
8. Sensitivity Analysis of Three Charging Techniques
9. Validation of Proposed QL
10. QL in Terms of Speed, Flexibility and Accuracy
10.1. Faster Speed
10.2. Improved Accuracy
10.3. Flexibility
11. Discussion
12. Conclusions
Author Contributions
Funding
Data Availability Statement
Conflicts of Interest
References
- Taherzadeh, E.; Javadi, S.; Dabbaghjamanesh, M. New optimal power management strategy for series plug-in hybrid electric vehicles. Int. J. Auto. Technol. 2018, 19, 1061–1069. [Google Scholar] [CrossRef]
- Moeini, A.; Zhao, H.; Wang, S. A current-reference-based selective harmonic current mitigation PWM technique to improve the performance of cascaded H-bridge multilevel active rectifiers. IEEE Trans. Ind. Electron. 2018, 65, 727–737. [Google Scholar] [CrossRef]
- Moeini, A.; Wang, S. The state of charge balancing techniques for electrical vehicle charging stations with cascaded H-bridge multilevel converters. In Proceedings of the 2018 IEEE Applied Power Electronics Conference and Exposition (APEC), San Antonio, TX, USA, 4–8 March 2018; pp. 637–644. [Google Scholar]
- Liu, Z.; Wen, F.; Ledwich, G. Optimal planning of electric-vehicle charging stations in distribution systems. IEEE Trans. Power Deliv. 2012, 28, 102–110. [Google Scholar] [CrossRef]
- Zheng, Y.; Dong, Z.Y.; Xu, Y.; Meng, K.; Zhao, J.H.; Qiu, J. Electric vehicle battery charging/swap stations in distribution systems: Comparison study and optimal planning. IEEE Trans. Power Syst. 2013, 29, 221–229. [Google Scholar] [CrossRef]
- Liu, T.; Hu, X.; Hu, W.; Zou, Y. A heuristic planning reinforcement learning-based energy management for power-split plug-in hybrid electric vehicles. IEEE Trans. Ind. Informat. 2019, 15, 6436–6445. [Google Scholar] [CrossRef]
- Chen, C.; Duan, S. Optimal integration of plug-in hybrid electric vehicles in microgrids. IEEE Trans. Ind. Informat. 2014, 10, 1917–1926. [Google Scholar] [CrossRef]
- Kang, J.; Yu, R.; Huang, X.; Maharjan, S.; Zhang, Y.; Hossain, E. Enabling localized peer-to-peer electricity trading among plug-in hybrid electric vehicles using consortium blockchains. IEEE Trans. Ind. Informat. 2017, 13, 3154–3164. [Google Scholar] [CrossRef]
- Xie, S.; Qi, S.; Lang, K. A data-driven power management strategy for plug-in hybrid electric vehicles including optimal battery depth of discharging. IEEE Trans. Ind. Informat. 2019, 16, 3387–3396. [Google Scholar] [CrossRef]
- Xing, Q.; Chen, Z.; Zhang, Z.; Huang, X.; Leng, Z.; Sun, K.; Chen, Y.; Wang, H. Charging demand forecasting model for electric vehicles based on online ride-hailing trip data. IEEE Access 2019, 7, 137390–137409. [Google Scholar] [CrossRef]
- Alizadeh, M.; Scaglione, A.; Davies, J.; Kurani, K.S. A scalable stochastic model for the electricity demand of electric and plug-in hybrid vehicles. IEEE Trans. Smart Grid. 2014, 5, 848–860. [Google Scholar] [CrossRef]
- Koyanagi, F.; Uriu, Y. A strategy of load leveling by charging and discharging time control of electric vehicles. IEEE Trans. Power Syst. 1998, 13, 1179–1184. [Google Scholar] [CrossRef]
- Ortega-Vazquez, M.A.; Bouffard, F.; Silva, V. Electric vehicle aggregator/system operator coordination for charging scheduling and services procurement. IEEE Trans. Power Syst. 2013, 28, 1806–1815. [Google Scholar] [CrossRef]
- Dai, Q.; Cai, T.; Duan, S.; Zhao, F. Stochastic modeling and forecasting of load demand for electric bus battery-swap station. IEEE Trans. Power Deliv. 2014, 29, 1909–1917. [Google Scholar] [CrossRef]
- Kisacikoglu, M.C.; Erden, F.; Erdogan, N. Distributed control of PEV charging based on energy demand forecast. IEEE Trans. Ind. Inform. 2018, 14, 332–341. [Google Scholar] [CrossRef] [Green Version]
- Gomez-Quiles, C.; Asencio-Cortes, G.; Gastalver-Rubio, A.; Martinez-Alvarez, F.; Troncoso, A.; Manresa, J.; Riquelme, J.C.; Riquelme-Santos, J.M. A novel ensemble method for electric vehicle power consumption forecasting: Application to the Spanish system. IEEE Access 2019, 7, 120840–120856. [Google Scholar] [CrossRef]
- Xydas, E.S.; Marmaras, C.E.; Cipcigan, L.M.; Hassan, A.S.; Jenkins, N. Electric vehicle load forecasting using data mining methods. In Proceedings of the IET Hybrid and Electric Vehicles Conference 2013 (HEVC 2013), London, UK, 6–7 November 2013; pp. 1–6. [Google Scholar]
- Nguyen, V.L.; Tran-Quoc, T.; Bacha, S.; Nguyen, B. Charging strategies to minimize the peak load for an electric vehicle fleet. In Proceedings of the IECON 2014-40th Annual Conference of the IEEE Industrial Electronics Society, Dallas, TX, USA, 29 October–1 November 2014; pp. 3522–3528. [Google Scholar] [CrossRef]
- Mal, S.; Chattopadhyay, A.; Yang, A.; Gadh, R. Electric vehicle smart charging and vehicle-to-grid operation. Int. J. Parallel Emergent Distrib. Syst. 2013, 28, 249–265. [Google Scholar] [CrossRef]
- Yilmaz, M.; Krein, P.T. Review of benefits and challenges of vehicle-to-grid technology. In Proceedings of the 2012 IEEE Energy Conversion Congress and Exposition (ECCE), Raleigh, NC, USA, 15–20 September 2012; pp. 3082–3089. [Google Scholar] [CrossRef]
- Oshnoei, A.; Kheradmandi, M.; Muyeen, S.M. Robust control scheme for distributed battery energy storage systems in load frequency control. IEEE Trans. Power Syst. 2020, 35, 4781–4791. [Google Scholar] [CrossRef]
- Ahmadi, A.; Tavakoli, A.; Jamborsalamati, P.; Rezaei, N.; Miveh, M.R.; Gandoman, F.H.; Heidari, A.; Nezhad, A.E. Power quality improvement in smart grids using electric vehicles: A review. IET Electr. Syst. Transp. 2019, 9, 53–64. [Google Scholar] [CrossRef]
- Weis, A.; Jaramillo, P.; Michalek, J. Estimating the potential of controlled plug-in hybrid electric vehicle charging to reduce operational and capacity expansion costs for electric power systems with high wind penetration. Appl. Energy 2014, 115, 190–204. [Google Scholar] [CrossRef]
- Zhang, J.; Yan, J.; Liu, Y.; Zhang, H.; Lv, G. Daily electric vehicle charging load profiles considering demographics of vehicle users. Appl. Energy 2020, 274, 115063. [Google Scholar] [CrossRef]
- Zhang, J.; Wang, Z.; Liu, P.; Zhang, Z. Energy consumption analysis and prediction of electric vehicles based on real-world driving data. Appl. Energy 2020, 275, 115408. [Google Scholar] [CrossRef]
- Mackenzie, J.; Roddick, J.F.; Zito, R. An evaluation of HTM and LSTM for short-term arterial traffic flow prediction. IEEE Trans. Intell. Transp. Syst. 2019, 20, 1847–1857. [Google Scholar] [CrossRef]
- Alquthami, T.; Zulfiqar, M.; Kamran, M.; Milyani, A.H.; Rasheed, M.B. A performance comparison of machine learning algorithms for load forecasting in smart grid. IEEE Access 2022, 10, 48419–48433. [Google Scholar] [CrossRef]
- Zulfiqar, M.; Kamran, M.; Rasheed, M.B.; Alquthami, T.; Milyani, A.H. A hybrid framework for short term load forecasting with a navel feature engineering and adaptive grasshopper optimization in smart grid. Appl. Energy 2023, 338, 120829. [Google Scholar] [CrossRef]
- Li, Q.; Wang, F.; Wang, J.; Li, W. LSTM-based SQL injection detection method for intelligent transportation system. IEEE Trans. Veh. Technol. 2019, 68, 4182–4191. [Google Scholar] [CrossRef]
- Schmidhuber, J. Deep learning in neural networks: An overview. Neural Netw. 2015, 61, 85–117. [Google Scholar] [CrossRef] [Green Version]
- Rostami, M.-A.; Kavousi-Fard, A.; Niknam, T. Expected cost minimization of smart grids with plug-in hybrid electric vehicles using optimal distribution feeder reconfiguration. IEEE Trans. Ind. Informat. 2015, 11, 388–397. [Google Scholar] [CrossRef]
- Qian, K.; Zhou, C.; Allan, M.; Yuan, Y. Modeling of load demand due to EV battery charging in distribution systems. IEEE Trans. Power Syst. 2010, 26, 802–810. [Google Scholar] [CrossRef]
- Li, G.; Zhang, X.-P. Modeling of plug-in hybrid electric vehicle charging demand in probabilistic power flow calculations. IEEE Trans. Smart Grid 2012, 3, 492–499. [Google Scholar] [CrossRef]
- Zurada, J.M. Introduction to Artificial Neural Systems; West Publishing Company: St. Paul, MN, USA, 1992; Volume 8. [Google Scholar]
- Hecht-Nielsen, R. Theory of the backpropagation neural network. In Neural Networks for Perception; Elsevier: Amsterdam, The Netherlands, 1992; pp. 65–93. [Google Scholar]
- Rummery, G.A.; Niranjan, M. On-Line Q-Learning Using Connectionist Systems; Department of Engineering, University of Cambridge: Cambridge, UK, 1994; Volume 37. [Google Scholar]
- Chollet, F. Keras. 2015. Available online: https://keras.io (accessed on 22 February 2023).
- Liu, D.; Zeng, P.; Cui, S.; Song, C. Deep Reinforcement Learning for Charging Scheduling of Electric Vehicles Considering Distribution Network Voltage Stability. Sensors 2023, 23, 1618. [Google Scholar] [CrossRef]
- Lee, Z.J.; Li, T.X.; Low, S.; Assoc Comp, M. ACN-Data: Analysis and Applications of an Open EV Charging Dataset. In Proceedings of the E-Energy’19: Proceedings of the 10th ACM International Conference on Future Energy Systems, Phoenix, AZ, USA, 25–28 June 2019; pp. 139–149. [Google Scholar]


| Charging Type | I/P Voltage | (KW) |
|---|---|---|
| Level-I (AC) | 120 | 1.42 |
| Level-II (AC) | 208–240 | 11.5 |
| Level-III (AC) | 208–240 | 97 |
| Level-III (DC) | 208–600 | 239 |
| Class | Market Share | (Min–Max) |
|---|---|---|
| Mini Vehicle | 0.2 | 8–12 |
| Mid Size Vehicle | 0.3 | 14–18 |
| Economy Vehicle | 0.3 | 10–14 |
| Light Truck | 0.3 | 19–23 |
| Field | Description |
|---|---|
| Time of connection | The plugs in time of users. |
| Accomplished charging time | The time of last non-zero charging rate. |
| Time of disconnection | The unplugs time of users. |
| kWh supply | Supplied energy measurement. |
| Session ID | Unique identity for the session. |
| Station ID | Unique identity of the EV Supply Equipment. |
| Layer of QL | CPU Time (s) |
|---|---|
| 2 | 499.48 |
| 3 | 798.21 |
| 4 | 1401.98 |
| 5 | 2001.73 |
| 6 | 2312.19 |
| Techniques | Charging Strategy | Penetration (%) | MSE (KW) | Epoch | MAPE (%) |
|---|---|---|---|---|---|
| ANN-1 (non-cop) | Non-cooperative | 30 | 4.2 | 3000 | 4.3371 |
| RNN-1 (non-cop) | 9.3 | 1000 | 2.9189 | ||
| QL-1 (non-cop) | 0.79 | 10,000 | 2.4741 | ||
| ANN-1 (Cop) | Cooperative | 30 | 7.06 | 3000 | 4.4901 |
| RNN-1 (Cop) | 9.12 | 500 | 3.0129 | ||
| QL-1 (Cop) | 6.21 | 10,000 | 2.7210 | ||
| ANN-1 (Smart) | Smart | 30 | 6.23 | 3000 | 4.3210 |
| RNN-1 (Smart) | 6.38 | 500 | 2.7112 | ||
| QL-1 (Smart) | 5.30 | 10,000 | 2.4214 | ||
| ANN-2 (non-cop) | Non-cooperative | 60 | 1.67 | 3000 | 5.2121 |
| RNN-2 (non-cop) | 25.63 | 500 | 3.1489 | ||
| QL-2 (non-cop) | 1.30 | 10,000 | 2.9741 | ||
| ANN-2 (Cop) | Cooperative | 60 | 9.54 | 3000 | 5.7371 |
| RNN-2 (Cop) | 9.67 | 500 | 4.2189 | ||
| QL-2 (Cop) | 9.37 | 10,000 | 3.1451 | ||
| ANN-2 (Smart) | Smart | 60 | 7.12 | 3000 | 5.9871 |
| RNN-2 (Smart) | 7.34 | 500 | 4.0189 | ||
| QL-2 (Smart) | 5.23 | 10,000 | 2.9741 | ||
| ANN-3 (non-cop) | Non-cooperative | 90 | 0.0031 | 1000 | 3.2171 |
| RNN-3 (non-cop) | 0.0019 | 1000 | 2.7189 | ||
| QL-3 (non-cop) | 0.0019 | 1000 | 2.2741 | ||
| ANN-3 (Cop) | Cooperative | 90 | 1.23 | 3000 | 3.3371 |
| RNN-3 (Cop) | 10.3 | 5000 | 2.8189 | ||
| QL-3 (Cop) | 0.889 | 10,000 | 2.1741 | ||
| ANN-3 (Smart) | Smart | 90 | 7.11 | 3000 | 3.6371 |
| RNN-3 (Smart) | 7.45 | 5000 | 2.7189 | ||
| QL-3 (Smart) | 4.45 | 10,000 | 2.0741 |
Disclaimer/Publisher’s Note: The statements, opinions and data contained in all publications are solely those of the individual author(s) and contributor(s) and not of MDPI and/or the editor(s). MDPI and/or the editor(s) disclaim responsibility for any injury to people or property resulting from any ideas, methods, instructions or products referred to in the content. |
© 2023 by the authors. Licensee MDPI, Basel, Switzerland. This article is an open access article distributed under the terms and conditions of the Creative Commons Attribution (CC BY) license (https://creativecommons.org/licenses/by/4.0/).
Share and Cite
Zulfiqar, M.; Alshammari, N.F.; Rasheed, M.B. Reinforcement Learning-Enabled Electric Vehicle Load Forecasting for Grid Energy Management. Mathematics 2023, 11, 1680. https://doi.org/10.3390/math11071680
Zulfiqar M, Alshammari NF, Rasheed MB. Reinforcement Learning-Enabled Electric Vehicle Load Forecasting for Grid Energy Management. Mathematics. 2023; 11(7):1680. https://doi.org/10.3390/math11071680
Chicago/Turabian StyleZulfiqar, M., Nahar F. Alshammari, and M. B. Rasheed. 2023. "Reinforcement Learning-Enabled Electric Vehicle Load Forecasting for Grid Energy Management" Mathematics 11, no. 7: 1680. https://doi.org/10.3390/math11071680